First measurement of elastic, inelastic and total cross ... · V. Berardi 4 a; b), M. Berretti2a,...
16
First measurement of elastic, inelastic and total cross-section at √ s = 13 TeV by TOTEM and overview of cross-section data at LHC energies G. Antchev a) , P. Aspell 9) , I. Atanassov a) , V. Avati 7,9) , J. Baechler 9) , C. Baldenegro Barrera 11) , V. Berardi 4a,4b) , M. Berretti 2a) , E. Bossini 6b) , U. Bottigli 6b) , M. Bozzo 5a,5b) , H. Burkhardt 9) , F. S. Cafagna 4a) , M. G. Catanesi 4a) , M. Csan´ ad 3a,b) , T.Cs¨org˝ o 3a,3b) , M. Deile 9) , F. De Leonardis 4c,4a) , A. D’Orazio 4c,4a) , M. Doubek 1c) , D. Druzhkin 9) , K. Eggert 10) , V. Eremin e) , F. Ferro 5a) , A. Fiergolski 9) , F. Garcia 2a) , V. Georgiev 1a) , S. Giani 9) , L. Grzanka 7,c) , J. Hammerbauer 1a) , J. Heino 2a) , P. Helander 2a,2b) , T. Isidori 11) , V. Ivanchenko 8) , M. Janda 1c) , A. Karev 9) , J. Kaˇ spar 6a,1b) , J. Kopal 9) , V. Kundr´ at 1b) , S. Lami 6a) , G. Latino 6b) , R. Lauhakangas 2a) , R. Linhart 1a) , C. Lindsey 11) , M. V. Lokaj´ ıˇ cek 1b) , L. Losurdo 6b) , M. Lo Vetere 5b,5a,+) , F. Lucas Rodr´ ıguez 9) , M. Macr´ ı 5a) , M. Malawski 7,c) , N. Minafra 11) , S. Minutoli 5a) , T. Naaranoja 2a,2b) , F. Nemes 9,3a) , H. Niewiadomski 10) ,T.Nov´ak 3b) , E. Oliveri 9) , F. Oljemark 2a,2b) , M. Oriunno f ) , K. ¨ Osterberg 2a,2b) , P. Palazzi 9) , V. Passaro 4c,4a) , Z. Peroutka 1a) , J. Proch´ azka 1b) , M. Quinto 4a,4b) , E. Radermacher 9) , E. Radicioni 4a) , F. Ravotti 9) , E. Robutti 5a) , C. Royon 11) , G. Ruggiero 9) , H. Saarikko 2a,2b) , A. Scribano 6a) , J. Siroky 1a) , J. Smajek 9) , W. Snoeys 9) , R. Stefanovitch 9) , J. Sziklai 3a) , C. Taylor 10) , E. Tcherniaev 8) , N. Turini 6b) , V. Vacek 1c) , J. Welti 2a,2b) , J. Williams 11) , P. Wyszkowski 7) , J. Zich 1a) and K. Zielinski 7) 1a University of West Bohemia, Pilsen, Czech Republic. 1b Institute of Physics of the Academy of Sciences of the Czech Republic, Prague, Czech Republic. 1c Czech Technical University, Prague, Czech Republic. 2a Helsinki Institute of Physics, University of Helsinki, Helsinki, Finland. 2b Department of Physics, University of Helsinki, Helsinki, Finland. 3a Wigner Research Centre for Physics, RMKI, Budapest, Hungary. 3b EKUKRC,Gy¨ongy¨os,Hungary. 4a INFN Sezione di Bari, Bari, Italy. 4b Dipartimento Interateneo di Fisica di Bari, Bari, Italy. 4c Dipartimento di Ingegneria Elettrica e dell’Informazione - Politecnico di Bari, Bari, Italy. 5a INFN Sezione di Genova, Genova, Italy. 5b Universit` a degli Studi di Genova, Italy. 6a INFN Sezione di Pisa, Pisa, Italy. 6b Universit` a degli Studi di Siena and Gruppo Collegato INFN di Siena, Siena, Italy. 7 AGH University of Science and Technology, Krakow, Poland. 8 Tomsk State University, Tomsk, Russia. 9 CERN, Geneva, Switzerland. 10 Case Western Reserve University, Dept. of Physics, Cleveland, OH, USA. 11 The University of Kansas, Lawrence, USA. February 1, 2018 1 arXiv:1712.06153v2 [hep-ex] 31 Jan 2018
Transcript of First measurement of elastic, inelastic and total cross ... · V. Berardi 4 a; b), M. Berretti2a,...
First measurement of elastic, inelastic and total cross-section at√s = 13 TeV by TOTEM and overview of cross-section data at
LHC energies
G. Antcheva), P. Aspell9), I. Atanassova), V. Avati7,9), J. Baechler9),C. Baldenegro Barrera11), V. Berardi4a,4b), M. Berretti2a), E. Bossini6b), U. Bottigli6b),M. Bozzo5a,5b), H. Burkhardt9), F. S. Cafagna4a), M. G. Catanesi4a), M. Csanad3a,b),T. Csorgo3a,3b), M. Deile9), F. De Leonardis4c,4a), A. D’Orazio4c,4a), M. Doubek1c),
D. Druzhkin9), K. Eggert10), V. Eremine), F. Ferro5a), A. Fiergolski9), F. Garcia2a),V. Georgiev1a), S. Giani9), L. Grzanka7,c), J. Hammerbauer1a), J. Heino2a),
P. Helander2a,2b), T. Isidori11), V. Ivanchenko8), M. Janda1c), A. Karev9), J. Kaspar6a,1b),J. Kopal9), V. Kundrat1b), S. Lami6a), G. Latino6b), R. Lauhakangas2a), R. Linhart1a),
C. Lindsey11), M. V. Lokajıcek1b), L. Losurdo6b), M. Lo Vetere5b,5a,+),F. Lucas Rodrıguez9), M. Macrı5a), M. Malawski7,c), N. Minafra11), S. Minutoli5a),T. Naaranoja2a,2b), F. Nemes9,3a), H. Niewiadomski10), T. Novak3b), E. Oliveri9),F. Oljemark2a,2b), M. Oriunnof), K. Osterberg2a,2b), P. Palazzi9), V. Passaro4c,4a),
Z. Peroutka1a), J. Prochazka1b), M. Quinto4a,4b), E. Radermacher9), E. Radicioni4a),F. Ravotti9), E. Robutti5a), C. Royon11), G. Ruggiero9), H. Saarikko2a,2b), A. Scribano6a),
J. Siroky1a), J. Smajek9), W. Snoeys9), R. Stefanovitch9), J. Sziklai3a), C. Taylor10),E. Tcherniaev8), N. Turini6b), V. Vacek1c), J. Welti2a,2b), J. Williams11),
P. Wyszkowski7), J. Zich1a) and K. Zielinski7)
1aUniversity of West Bohemia, Pilsen, Czech Republic.1bInstitute of Physics of the Academy of Sciences of the Czech Republic, Prague, Czech Republic.
1cCzech Technical University, Prague, Czech Republic.2aHelsinki Institute of Physics, University of Helsinki, Helsinki, Finland.
2bDepartment of Physics, University of Helsinki, Helsinki, Finland.3aWigner Research Centre for Physics, RMKI, Budapest, Hungary.
3bEKU KRC, Gyongyos, Hungary.4aINFN Sezione di Bari, Bari, Italy.
4bDipartimento Interateneo di Fisica di Bari, Bari, Italy.4cDipartimento di Ingegneria Elettrica e dell’Informazione - Politecnico di Bari, Bari, Italy.
5aINFN Sezione di Genova, Genova, Italy.5bUniversita degli Studi di Genova, Italy.
6aINFN Sezione di Pisa, Pisa, Italy.6bUniversita degli Studi di Siena and Gruppo Collegato INFN di Siena, Siena, Italy.
7AGH University of Science and Technology, Krakow, Poland.8Tomsk State University, Tomsk, Russia.
9CERN, Geneva, Switzerland.10Case Western Reserve University, Dept. of Physics, Cleveland, OH, USA.
11The University of Kansas, Lawrence, USA.
February 1, 2018
1
arX
iv:1
712.
0615
3v2
[he
p-ex
] 3
1 Ja
n 20
18

Abstract
The TOTEM collaboration has measured the proton-proton total cross section at√s =
13 TeV with a luminosity-independent method. Using dedicated β∗ = 90 m beam optics,the Roman Pots were inserted very close to the beam. The inelastic scattering rate hasbeen measured by the T1 and T2 telescopes during the same LHC fill. After applying theoptical theorem the total proton-proton cross section is σtot = (110.6 ± 3.4) mb, well inagreement with the extrapolation from lower energies. This method also allows one to derivethe luminosity-independent elastic and inelastic cross sections: σel = (31.0 ± 1.7) mb andσinel = (79.5 ± 1.8) mb.
a INRNE-BAS, Institute for Nuclear Research and Nuclear Energy, Bulgarian Academy of Sciences, Sofia, Bulgaria.b Department of Atomic Physics, ELTE University, Budapest, Hungary.c Institute of Nuclear Physics, Polish Academy of Science, Krakow, Poland.d Warsaw University of Technology, Warsaw, Poland.e Ioffe Physical - Technical Institute of Russian Academy of Sciences, St. Petersburg, Russian Federation.f SLAC National Accelerator Laboratory, Stanford CA, USA.+ Deceased.
2

1 Introduction
This paper presents the first measurement of the total proton-proton cross section at a centerof mass energy
√s = 13 TeV; the measurement is luminosity independent.
The TOTEM collaboration has already measured the total proton-proton cross section at√s = 2.76 TeV, 7 TeV and 8 TeV, and has demonstrated the reliability of the luminosity-
independent method by comparing several approaches to determine the total cross sections [1–6]. The method requires the simultaneous measurements of the inelastic and elastic rates, aswell as the extrapolation of the latter in the invisible region down to vanishing four-momentumtransfer squared t = 0.
The TOTEM experimental setup consists of two inelastic telescopes T1 and T2 to detectcharged particles coming from inelastic pp collisions and the Roman Pot detectors (RP) todetect elastically scattered protons at very small angles. The inelastic telescopes are placedsymmetrically on both sides of Interaction Point 5 (IP5): the T1 telescope is based on cathodestrip chambers (CSCs) placed at ±9 m and covers the pseudorapidity range 3.1 ≤ |η| ≤ 4.7; theT2 telescope is based on gas electron multiplier (GEM) chambers placed at ±13.5 m and coversthe pseudorapidity range 5.3 ≤ |η| ≤ 6.5. The pseudorapidity coverage of the two telescopes at√s = 13 TeV allows the detection of about 92 % of the inelastic events, including events with
diffractive mass down to 4.6 GeV. As the fraction of events with all final state particles beyondthe instrumented region has to be estimated using phenomenological models, the excellentacceptance in TOTEM minimizes the dependence on such models and thus provides smalluncertainty on the inelastic rate measurement.
The Roman Pot (RP) units used for the present measurement are located on both sides ofthe IP at distances of ±213 m (near) and ±220 m (far) from IP5. A unit consists of 3 RPs,two approaching the outgoing beam vertically and one horizontally. The horizontal RP overlapswith the two verticals and allows for a precise relative alignment of the detectors within the unit.The 7 m long lever arm between the near and the far RP units has the important advantagethat the local track angles in the x and y-projections perpendicular to the beam direction canbe reconstructed with a precision of 2 µrad. A complete description of the TOTEM detector isgiven in [7, 8].
Each RP is equipped with a stack of 10 silicon strip detectors designed with the specificobjective of reducing the insensitive area at the edge facing the beam to only a few tens ofmicrometers. The 512 strips with 66 µm pitch of each detector are oriented at an angle of +45◦
(five planes) and -45◦ (five planes) with respect to the detector edge facing the beam [9].
2 Data taking and analysis
The analysis is performed on two data samples (DS1 and DS2) recorded in 2015 during aspecial LHC fill with β∗ = 90 m optics. This special optics configuration is described in detailin [3, 10–12].
The RP detectors were placed as close as 5 times the transverse beam size (σbeam) fromthe outgoing beams. The collected events have been triggered by the T2 telescope in eitherarm (inelastic trigger), by the RP detectors in a double-arm coincidence (elastic trigger), andby random bunch crossings (zero-bias sample used for calibration). In DS2 there are no zero-bias data recorded, and the closest run with zero-bias data is used for calibration; the timedependence of the zero-bias trigger rate is taken into account with a scale factor measured onthe physics data of DS2 itself and the closest run.
3

2.1 Elastic analysis
2.1.1 Reconstruction of kinematics
The horizontal and vertical scattering angles of the proton at IP5 (θ∗x, θ∗y) are reconstructed in
a given arm by inverting the proton transport equations [12]
θ∗x =1
dLxds
(θx −
dvxds
x∗), θ∗y =
y
Ly, (1)
where s denotes the distance from the interaction point, y is the vertical coordinate of theproton’s trajectory, θx is its horizontal angle at the detector, and x∗ is the horizontal vertexcoordinate reconstructed as
x∗ =Lx,far · xnear − Lx,near · xfar
d, (2)
where d = (vx,near · Lx,far − vx,far · Lx,near). The scattering angles obtained for the two arms areaveraged and the four-momentum transfer squared is calculated
t = −p2θ∗2 , (3)
where p is the LHC beam momentum and the scattering angle θ∗ =√θ∗x
2 + θ∗y2.
The coefficients Lx, Ly and vx of Eq. (1) and Eq. (2) are optical functions of the LHC beamdetermined by the accelerator magnets. The β∗ = 90 m optics is designed with a large verticaleffective length Ly ≈ 263 m at the RPs placed at 220 m from IP5. Since the horizontal effectivelength Lx is close to zero at the RPs, its derivative dLx/ds ≈ −0.6 is used instead. The differentreconstruction formula in the vertical and horizontal plane in Eq. (1) is also motivated by theirdifferent sensitivity to LHC magnet and beam perturbations.
2.1.2 RP alignment and beam optics
After applying the usual TOTEM alignment methods the residual misalignment is about 10 µmin the horizontal coordinate and about 150 µm in the vertical [2, 13]. When propagated to thereconstructed scattering angles, this leads to uncertainties of about 3.4 µrad (horizontal angle)and 0.6 µrad (vertical angle). The beam divergence uncertainty has been convoluted with thevertical alignment for the error propagation.
The nominal optics has been updated from LHC magnet and current databases and cal-ibrated using the observed elastic candidates. The uncertainties of the optical functions areestimated with a Monte Carlo program applying the optics calibration procedure on a sophis-ticated simulation of the LHC beam and its perturbations. The obtained uncertainty is about1.2 h for dLx/ds and 2.1 h for Ly [11, 12].
The statistical uncertainty of the scattering angles, obtained from the data, is 1.9±0.1 µradvertically (mainly due to the beam divergence) and 4.9±0.1 µrad horizontally (due to the beamdivergence and sensor pitch).
2.1.3 Event selection
The analysis is similar to the procedure performed for the measurement of the elastic crosssection at several other LHC energies: 2.76 TeV, 7 TeV and 8 TeV [1–6]. The measurementof the elastic rate is based on the selection of events with the following topology in the RPdetector system: a reconstructed track in the near and far vertical detectors on each side of theIP such that the elastic signature is satisfied in one of the two diagonals: left bottom and righttop (Diag. 1) or left top and right bottom (Diag. 2).
4

* [rad]x,leftθ-0.2 -0.15 -0.1 -0.05 0 0.05 0.1 0.15 0.2
-310×
* [r
ad]
x,ri
ght
θ
-0.2
-0.15
-0.1
-0.05
0
0.05
0.1
0.15
0.2-310×
1
10
210
310
Figure 1: (color) Analysis cut in the horizontal scattering angle θ∗x. The blue and black dashedlines represent the mean and the 4σ cuts, respectively.
Besides, the elastic event selection requires the collinearity of the outgoing protons in thetwo arms, the suppression of the diffractive events and the equality of the horizontal vertexposition x∗ reconstructed from the left and right arms.
θx,left* - θx,right* [rad]0.15− 0.1− 0.05− 0 0.05 0.1 0.15
3−10×
Eve
nts
1
10
210
310
410
Before cuts
* collinearity cutyθ
+ y-spectr. left
+ y-spectr. right
+ x* cut
* cutxθ+
Gaussian fit after x* cut
resolution≡rad µ = 5 σ* cutxθbefore
Figure 2: (color) The distribution of the horizontal scattering angle difference reconstructedfrom the left and the right arm. The distribution is shown before any analysis cut (black solidline) and after each analysis cut.
Figure 1 shows the horizontal collinearity cut imposing momentum conservation in thehorizontal plane with 1 h uncertainty. The cuts are applied at the 4σ level, and they areoptimized for purity (background contamination in the selected sample less than 0.1 %) andfor efficiency (uncertainty of true elastic event selection 0.5 %). Figure 2 shows the progressive
5

selection of elastic events after each analysis cut.
2.1.4 Geometrical and beam divergence correction, unfolding
The acceptance of elastically scattered protons is limited by the RP silicon detector edge and bythe LHC magnet apertures. The proton acceptance correction is calculated taking into accountthe azimuthal symmetry of elastic scattering, experimentally verified on the data
A(θ∗) =2π
∆φ∗(θ∗), (4)
where ∆φ∗ is the visible azimuthal angle range, defined by the acceptance cuts. The t-range ofthe analysis is constrained to |t|min = 1.2 · 10−2 GeV2 and |t|max = 0.2 GeV2, a region wherethe acceptance correction factor A(θ∗) is below six in order to limit the systematic error on thefinal cross section.
Close to the acceptance edges the assumed azimuthal symmetry has to be corrected due tothe beam divergence. This additional acceptance loss is modelled with a Gaussian distribution,with experimentally determined parameters, and taken into account as a function of the verticalscattering angle D(θ∗y).
The unfolding of resolution effects is estimated with a Monte Carlo simulation whose pa-rameters are obtained from the data, see Section 2.1.2. The angular spread of the beam isdetermined with an uncertainty 0.1 µrad by comparing the scattering angles reconstructedfrom the left and right arm, therefore the unfolding correction factor U(θ∗) can be calculatedwith a precision better than 0.1 %. The event-by-event correction factor due to acceptancecorrections and resolution unfolding is
C(θ∗, θ∗y) = A(θ∗)D(θ∗y)U(θ∗) , (5)
see Table 1.
2.1.5 Inefficiency corrections
The proton reconstruction efficiency of the RP detectors is evaluated directly from the data.The strip detectors are not able to resolve multiple tracks, which is the main source of detectorinefficiency. The additional tracks can be caused by interactions of the protons with the sensorsor the surrounding material or by the pileup with non-signal protons.
The inefficiencies corrections are calculated for different categories: “uncorrelated” (I3/4)when one RP out of four along a diagonal has no reconstructed track; this inefficiency includesthe loss of the track due to nuclear interaction, shower or pile-up with beam halo and is calcu-lated as a function of θ∗y per RP [13]. The inefficiency is called “correlated” (I2/4) when both RPof one arm have no reconstructed tracks. The case when two RPs have no reconstructed trackin two different arms (I2/4 diff.) is derived with a probability formula from the “uncorrelated”inefficiency. The numerical values of these corrections are listed in Table 2.
The total correction factor per event is
f(θ∗, θ∗y) =1
ηdηtr·C(θ∗, θ∗y)
1− I · 1
∆t, (6)
where the track reconstruction inefficiencies are summed I = I3/4(θ∗y) + I2/4 + I2/4 diff sincethey are mutually exclusive, ∆t is the bin width and ηd, ηtr are the DAQ and trigger efficiency,respectively. The observed Nel,obs and the fully corrected elastic rate Nel is summarized for thetwo data sets in Table 4, together with their optical point dNel/dt|t=0 .
6

Table 1: The t-dependent analysis uncertainties and corrections to the differential elastic rateand to the optical point for both diagonals.
|t|min |t|max
Alignment uncertainty ±1.3 % ±3.4 %Optics uncertainty ±1h ±1h
A(θ∗) 5.96± 3× 10⁻² 1.03± 1× 10⁻²
D(θ∗y) 2.31± 2× 10⁻² 1.00± 1× 10⁻³
U(θ∗) 1.002± 5× 10⁻⁵ 1.04± 8× 10⁻⁴
Table 2: Corrections to the differential and total elastic rate for the different datasets anddiagonals. The “uncorrelated” inefficiency correction (I3/4) is θ∗y dependent, in the table itseffect on the elastic rate is provided.
Correction [%] DS1 DS2Diag. 1 Diag. 2 Diag. 1 Diag. 2
I3/4 25.86 ± 0.2 22.04 ± 0.2 20.34 ± 0.1 21.37 ± 0.1I2/4 19.91 ± 0.2 16.16 ± 0.2 16.09 ± 0.2 17.11 ± 0.2I2/4 diff. 2.38 ± 0.05 1.61 ± 0.04 1.33 ± 0.02 1.5 ± 0.02ηd 80.93 ± 0.01 99.95 ± 0.01ηtr 99.9 ± 0.1 99.9 ± 0.1
2.2 Analysis of inelastic scattering
The analysis procedure is similar to the ones for the inelastic event rate measurements at 2.76,7 and 8 TeV [1, 5, 6, 14] and starts from the number of T2 triggered events as the observedinelastic rate. The events are classified according to their topology: events with tracks in T2 inboth hemispheres (“2h”), dominated by non-diffractive minimum bias and double diffraction,and events with tracks in one hemisphere only (“1h”), dominated by single diffraction. Due tothe non-operational half-arm of T2 on the negative side, for the 1h category each of the threehalf-arms are treated separately in the analysis to avoid biases and then the two half-arms onthe positive side are combined.
To evaluate the total inelastic rate, several corrections have to be applied. First, to obtainthe T2 visible inelastic rate (NT2vis), the observed rate is corrected for beam gas background,trigger, reconstruction efficiency and the effect of pileup. Next, the rate corresponding tothe events with at least one final state particle in |η| < 6.5 (N|η|<6.5) is derived by assessingtopologies which can cause an undetected event in T2. These are events detected only by T1,central diffractive events with all final state particles outside the T2 acceptance and eventswith a local rapidity gap covering T2. Finally, to estimate the total inelastic rate (Ninel), thecontribution of low mass diffraction with only final state particles at |η| > 6.5 is evaluated. Thecorrections leading to the total inelastic rate measurement are described below and quantifiedin Table 3 together with their systematic uncertainties, summing up to 3.7 %. The observedNinel,obs and fully corrected inelastic rate Ninel is shown in Table 4.
2.2.1 Beam gas background
The beam gas background is estimated from events triggered with T2 on the non-collidingbunches and affects only the 1h category. The intensity difference between the colliding andnon-colliding bunches is taken into account. Conservatively, half the size of the correction tothe overall inelastic rate is taken as systematic uncertainty.
7

Table 3: Corrections and systematic uncertainties of the inelastic rate measurement. The secondcolumn shows the size of the correction, the third column the systematic uncertainty related tothe source.
Source Correction Uncertainty Effect on
Beam gas -0.4 % 0.2 % all ratesTrigger efficiency 1.2 % 0.6 % all rates
Pile up 3.6 % 0.4 % all ratesT2 event reconstruction 0.9 (1.6) % 0.45 (0.8) % Ninel, N|η|<6.5 (NT2vis)
T1 only 1.7 % 0.4 % Ninel, N|η|<6.5
Central diffraction 0.5 % 0.35 % Ninel, N|η|<6.5
Local rapidity gap covering T2 0 % 0.4 % Ninel, N|η|<6.5
Low mass diffraction seen -0.6 % 0.3 % Ninel, N|η|<6.5
Low mass diffraction 7.1 % 3.55 % Ninel
2.2.2 Trigger efficiency
The trigger efficiency is determined from zero bias triggered events, separately for the differentevent topologies and integrated over all T2 track multiplicities. The systematic uncertainty isevaluated as the variation required on the 1h trigger efficiency to give compatible fractions forleft and right arm (after correcting for the non-operational half arm of T2).
2.2.3 Pileup
The pileup correction factor is determined from the zero bias triggered events. The probabilityto have a bunch crossing with tracks in T2 is about 0.07 from which the probability of havingmore than two inelastic collisions with tracks in T2 in the same bunch crossing is derived.The systematic uncertainty is assessed from the variation of the probability, within the samedataset, to have a bunch crossing with tracks in T2 and the uncertainty due to the T2 eventreconstruction efficiency.
2.2.4 T2 event reconstruction
The T2 event reconstruction inefficiency is estimated using Monte Carlo (MC) generators(PYTHIA8-4C [15], QGSJET-II-04 [16]) tuned with data to reproduce the measured fractionof 1h events, 0.195 ± 0.010. The systematic uncertainty is taken to be half of the correctionthat in these runs are mostly due to events with tracks only in the non-operational T2 half-armwith some additional events due to only neutral particles within the T2 acceptance. A largefraction of the events missed due to T2 reconstruction inefficiency are recuperated with the T1detector reducing the correction sizably for Ninel and N|η|<6.5.
2.2.5 T1 only
The T1-only correction takes into account events with no reconstructed particles in T2 buttracks reconstructed in T1. The systematic uncertainty is equal to the precision to which thiscorrection can be calculated from the zero-bias sample.
2.2.6 Central diffraction
The central diffraction correction, based on the PHOJET and MBR event generators [17, 18],takes into account events with all final state particles outside the T1/T2 pseudorapidity accep-tance. Both generators are underestimating the low mass resonance contribution. Therefore,the total central diffractive contribution is assumed to be twice the generator estimates. Since
8

Table 4: The observed elastic Nel,obs and inelastic rate Ninel,obs, the fully corrected elastic Nel
and inelastic rate Ninel and the optical point dNel/dt|t=0 of the two data sets (errors wherequoted are statistical and systematic).
Data set Unit DS1 DS2
Nel,obs 105729 216825Ninel,obs 773000 1488343Nel 4.273 · 105 ± 0.5 %± 2.3 % 6.660 · 105 ± 0.5 %± 2.3 %
dNel/dt|t=0 [GeV−2] 8.674 · 106 ± 0.4 %± 1.6 % 1.356 · 107 ± 0.4 %± 1.6 %Ninel 1.097 · 106 ± 0.1 %± 3.7 % 1.708 · 106 ± 0.1 %± 3.7 %
the uncertainties of the central diffractive cross-section and the low mass resonance contribu-tion are large, the systematic uncertainty is assumed to be equal to the largest difference of thecorrection with and without low mass resonance contribution.
2.2.7 Local rapidity gap covering T2
The correction due to local rapidity gap over T2 considers single diffraction events with a rapid-ity gap of the diffractive system extending over the entire T2 η-range and with no tracks in T1.It is estimated from data, measuring the probability of having a single diffractive-like topologywith a gap covering T1 and transferring it to the T2 region correcting for the different condi-tions (average charged multiplicity, pT threshold, gap size and surrounding material) betweenT1 and T2. As a cross-check the correction is also estimated from MC generators (PYTHIA8-4C, QGSJETII-04). The two estimates differ sizably and therefore only a systematic uncertaintyequal to the largest estimate is applied, without making any correction.
2.2.8 Low mass diffraction
The T2 acceptance edge at |η| = 6.5 corresponds to a diffractive mass of about 4.6 GeV (at 50 %efficiency). The low mass diffraction correction, i.e. the contribution of events with all finalstate particles at |η| > 6.5, is estimated with QGSJET-II-03 [19] after correcting the fractionof 1h events in the MC to the one of the data. At 7 TeV, the estimated correction using thisprocedure was consistent with the value estimated from data [14]. To account for the largeuncertainty of the low mass diffraction contribution and to cover also other predictions [15, 20],the systematic uncertainty is taken to be half of this correction.
3 Cross sections
3.1 Differential elastic rate and extrapolation to t = 0
After unfolding and including all systematic uncertainties, the differential elastic rate dNel/dtis described with an exponential and fitted in the |t|min and |t|max range, see Figure 3. Thenormalized χ2/ndf = 50.8/36 = 1.4 is representative of the known deviations from a pureexponential [13].
The stability of the fit has been verified by varying the lower |t| bound. The observedsystematic effect on the slope and on the intercept at t = 0 is negligible compared to the othersystematic uncertainties listed in Table 1. Assuming that the exponential parametrization holdsalso for |t| < |t|min, the value dNel/dt|t=0 can be used to determine the total cross section usingEq. (7). The measurements performed at very high β∗ optics will allow the exploration of the|t| region below the present |t|min to probe the Coulomb-nuclear interference or any other neweffect.
9

]2-t [GeV0.00 0.05 0.10 0.15 0.20 0.25 0.30 0.35 0.40
]-2
dN/d
t [G
eV
410
510
610
710-2 0.05 GeV± = 20.36 expB
-2 = 1.3558e+07 GeVt=0dN/dt
= 666023elN
= 1.70759e+06inelN
]2-t [GeV0.2 0.3 0.4 0.5 0.6 0.7 0.8 0.9 1
]-2
dN/d
t [G
eV
210
310
410
510
Figure 3: Differential elastic rate dNel/dt at√s = 13 TeV (full physics corrections included) of
dataset DS2 with the exponential fit between |t|min and |t|max. The right panel shows the datain the dip region.
3.2 The total cross section
The measurements of the total inelastic rate Ninel and of the total nuclear elastic rate Nel (withits extrapolation to t = 0, dNel/dt|t=0) are combined via the optical theorem to obtain the totalcross section in a luminosity independent way
σtot =16π(~c)2
1 + ρ2· dNel/dt|t=0
Nel +Ninel, (7)
where the parameter ρ is the ratio of the real to the imaginary part of the forward nuclearelastic amplitude.
The total cross section measurements of the DS1 and DS2 data sets have been averagedaccording to their raw inelastic rate Ninel,obs, which yields
σtot = (110.6± 3.4) mb , (8)
when ρ = 0.1 is assumed. The choice of ρ = 0.1 in the present analysis is motivated by theresults published in [21].
From the measured (and fully corrected) ratio ofNel toNinel the luminosity- and ρ-independentratios
σel
σinel= 0.390± 0.017,
σel
σtot= 0.281± 0.009 , (9)
The luminosity independent elastic and inelastic cross sections are derived by combining theirratio and sum
σel = (31.0± 1.7) mb, σinel = (79.5± 1.8) mb . (10)
The measured physics quantities are also calculated for ρ = 0.14 and the values are summarizedin Table 5.
Figure 4 is the compilation of all the previous pp and pp total, elastic and inelastic measure-ments, together with a selected set of TOTEM measurements. Figure 5 shows a more detailedplot of the measurements in the range between 7 and 8 TeV with the TOTEM values for σtot
obtained with different methods.With the present measurement TOTEM has covered a range from
√s = 2.76 TeV to 13 TeV
obtaining a variation of total cross-section from (84.7± 3.3) mb to (110.6± 3.4) mb [1–6].The evolution of the elastic to total cross section ratio and the nuclear slope B as function
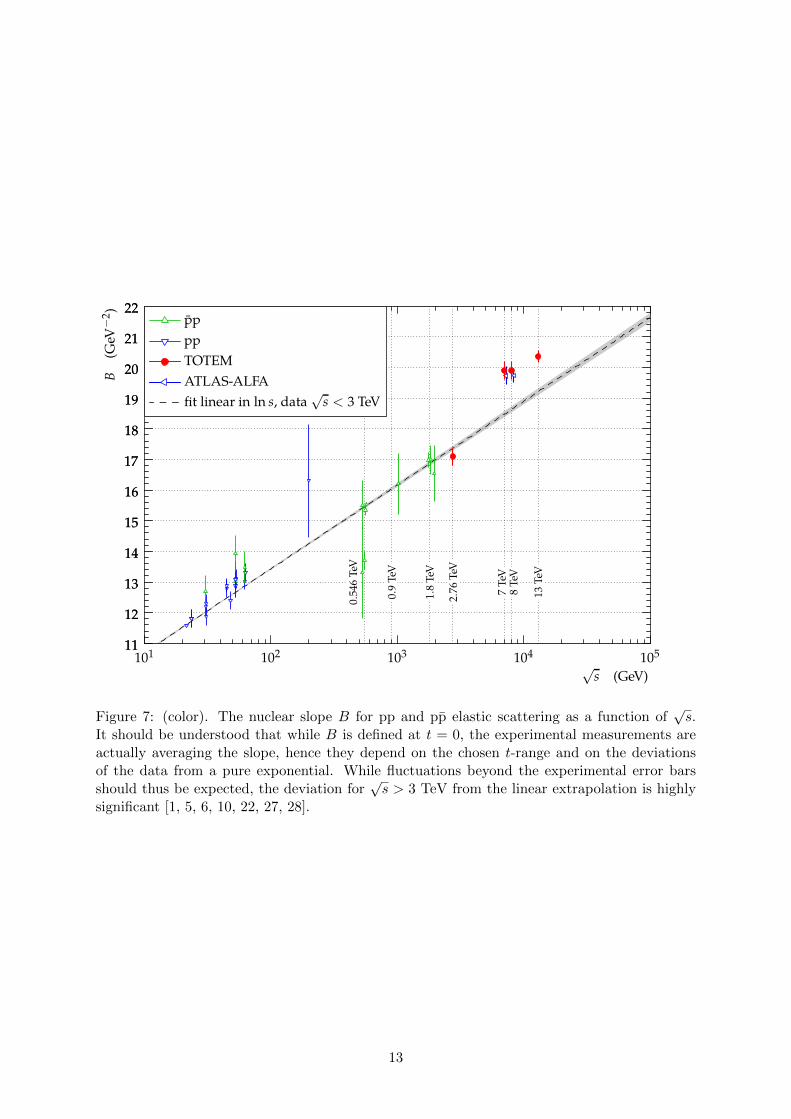
of√s are shown in Figures 6 and 7. The elastic to total cross section ratio increases with
√s is
seen from Figure 6. In particular, the deviation at LHC energies of the nuclear slope from thelow energy linear extrapolation is clearly visible in Figure 7.
10

0
10
20
30
40
50
60
70
80
90
100
110
120
130
140
σel
(gre
en),
σin
el(b
lue)
and
σto
t(r
ed)
(mb)
101 102 103 104 105√
s (GeV)
0.54
6Te
V
0.9
TeV
1.8
TeV
2.76
TeV
7Te
V8
TeV
13Te
V
σtot
σinel
σel
pp (PDG 2010)pp (PDG 2010)Auger (+ Glauber)ALICE
ATLAS, ATLAS-ALFACMSLHCbTOTEM
σtot fits by COMPETE(pre-LHC model RRPnfL2u)σel fit by TOTEM(11.84 − 1.617 ln s + 0.1359 ln2 s)
Figure 4: (color). Overview of elastic (σel), inelastic (σinel), total (σtot) cross section for ppand pp collisions as a function of
√s, including TOTEM measurements over the whole energy
range explored by the LHC [1, 2, 4–6, 10, 13, 22–31]. Uncertainty band on theoretical modelsand/or fits are as described in the legend. The continuous black lines (lower for pp, upper forpp) represent the best fits of the total cross section data by the COMPETE collaboration [32].The dashed line results from a fit of the elastic scattering data. The dash-dotted lines refer tothe inelastic cross section and are obtained as the difference between the continuous and dashedfits.
11

Figure 5: (color). Focus on the 7 - 8 TeV range showing the comparison of the pairs of TOTEMmeasurements which represent the broadest exploration of different methods, data sets, t-range(with or without Coulomb-nuclear interference) and descriptions of the nuclear slope with theATLAS-ALFA measurements [2, 4, 10, 13, 27, 28].
16
18
20
22
24
26
28
30
16
18
20
22
24
26
28
30
σel/
σto
t(%
)
101 102 103 104 105√
s (GeV)
0.54
6Te
V
0.9
TeV
1.8
TeV
2.76
TeV
7Te
V8
TeV
13Te
V
pp, PDGpp, PDGTOTEMATLAS-ALFAratio of σel fit by TOTEMand σtot fits by COMPETE(pre-LHC model RRPnfL2u)
Figure 6: (color). The elastic to total cross section ratio for pp and pp collisions as a functionof√s [1, 4–6, 22, 27, 28].
12
11
12
13
14
15
16
17
18
19
20
21
22
11
12
13
14
15
16
17
18
19
20
21
22
B(G
eV−
2 )
101 102 103 104 105√
s (GeV)
0.54
6Te
V
0.9
TeV
1.8
TeV
2.76
TeV
7Te
V8
TeV
13Te
V
ppppTOTEMATLAS-ALFAfit linear in ln s, data
√s < 3 TeV
Figure 7: (color). The nuclear slope B for pp and pp elastic scattering as a function of√s.
It should be understood that while B is defined at t = 0, the experimental measurements areactually averaging the slope, hence they depend on the chosen t-range and on the deviationsof the data from a pure exponential. While fluctuations beyond the experimental error barsshould thus be expected, the deviation for
√s > 3 TeV from the linear extrapolation is highly
significant [1, 5, 6, 10, 22, 27, 28].
13

Table 5: The nuclear slope B, the cross sections and their systematic and statistical uncertainty.The physics quantities are the weighted average of the DS1 and DS2 measurements.
Physics quantity Value Total uncertaintyρ = 0.14 ρ = 0.1
B [GeV−2] 20.36 5.3 · 10−2⊕ 0.18 = 0.19σtot [mb] 109.5 110.6 3.4σel [mb] 30.7 31.0 1.7σinel [mb] 78.8 79.5 1.8σel/σinel 0.390 0.017σel/σtot 0.281 0.009
Acknowledgments
We are grateful to the beam optics development team for the design and the successful commis-sioning of the high β∗ optics and to the LHC machine coordinators for scheduling the dedicatedfills.
This work was supported by the institutions listed on the front page and partially also byNSF (US), the Magnus Ehrnrooth Foundation (Finland), the Waldemar von Frenckell Foun-dation (Finland), the Academy of Finland, the Finnish Academy of Science and Letters (TheVilho Yrjo and Kalle Vaisala Fund), the OTKA NK 101438 and the EFOP-3.6.1-16-2016-00001grants (Hungary). Individuals have received support from Nylands nation vid Helsingfors uni-versitet (Finland), MSMT CR (the Czech Republic), the Janos Bolyai Research Scholarship ofthe Hungarian Academy of Sciences and the NKP-17-4 New National Excellence Program ofthe Hungarian Ministry of Human Capacities.
14

References
[1] G. Antchev et al. (TOTEM collaboration), Phys. Rev. Lett. 111 no. 1, (2013) 012001.
[2] G. Antchev et al. (TOTEM collaboration), Eur. Phys. J. C76 no. 12, (2016) 661.
[3] G. Antchev et al. (TOTEM collaboration), EPL 96 no. 2, (2011) 21002.
[4] G. Antchev et al. (TOTEM collaboration), EPL 101 no. 2, (2013) 21004.
[5] F. Nemes, PoS (DIS2017) 059 .
[6] G. Antchev et al. (TOTEM collaboration), to be published .
[7] G. Anelli et al. (TOTEM collaboration), JINST 3 (2008) S08007.
[8] G. Antchev et al. (TOTEM collaboration), TOTEM Upgrade Proposal (2013) .
[9] G. Ruggiero et al. Nucl. Instrum. Meth. A604 (2009) 242–245.
[10] G. Antchev et al. (TOTEM collaboration), EPL 101 no. 2, (2013) 21002.
[11] F. Nemes, Elastic scattering of protons at the TOTEM experiment at the LHC. PhDthesis, Eotvos U., 2015. Presented 15 Oct 2015.
[12] G. Antchev et al. (TOTEM collaboration), New J. Phys. 16 (2014) 103041.
[13] G. Antchev et al. (TOTEM collaboration), Nucl. Phys. B899 (2015) 527–546.
[14] G. Antchev et al. (TOTEM collaboration), EPL 101 no. 2, (2013) 21003.
[15] R. Corke and T. Sjostrand, JHEP 03 (2011) 032.
[16] S. Ostapchenko, EPJ Web Conf. 52 (2013) 02001.
[17] R. Engel, M. A. Braun, C. Pajares, and J. Ranft, Z. Phys. C74 (1997) 687–697.
[18] R. Ciesielski and K. Goulianos, PoS ICHEP2012 (2013) 301.
[19] S. Ostapchenko, Nucl. Phys. Proc. Suppl. 151 (2006) 143–146.
[20] V. A. Khoze, A. D. Martin, and M. G. Ryskin, Phys. Lett. B679 (2009) 56–59.
[21] G. Antchev et al. (TOTEM collaboration), no. CERN-EP-2017-335, (2017) .https://cds.cern.ch/record/2298154.
[22] K. Nakamura et al., J. Phys. G37 (2010) 075021.
[23] B. Abelev et al. (ALICE collaboration), Eur. Phys. J. C73 no. 6, (2013) 2456.
[24] G. Aad et al. (ATLAS collaboration), Nat. Commun. 2, 463 (2011) .
[25] CMS Collaboration, Report No. CMS-PAS-FWD-11-001 .
[26] P. Abreu et al. (Auger collaboration), Phys. Rev. Lett. 109 (2012) 062002.
[27] G. Aad et al. (ATLAS collaboration), Nucl. Phys. B889 (2014) 486–548.
[28] M. Aaboud et al. (ATLAS collaboration), Phys. Lett. B761 (2016) 158–178.
[29] R. Aaij et al. (LHCb collaboration), JHEP 02 (2015) 129.
15

[30] M. Aaboud et al. (ATLAS collaboration), Phys. Rev. Lett. 117 no. 18, (2016) 182002.
[31] CMS Collaboration, Report No. CMS-PAS-FSQ-15-005 (2016) .
[32] J. R. Cudell, V. V. Ezhela, P. Gauron, K. Kang, Yu. V. Kuyanov, S. B. Lugovsky,E. Martynov, B. Nicolescu, E. A. Razuvaev, and N. P. Tkachenko, Phys. Rev. Lett. 89(2002) 201801.
16