First edition 2010, this edition November 25, 2013 …pages.hmc.edu/evans/Ch10Futures.pdfChapter 10...
21
Chapter 10 - Futures Contracts written for Economics 104 Financial Economics by Prof Gary R. Evans First edition 2010, this edition November 25, 2013 ©Gary R. Evans This article, prepared for students in Economics 104, is meant to introduce students to the futures markets. Even an active retail investor is unlikely to ever make a trade directly in this market. The cash requirements are much more substantial than those required for stocks, ETPs, or mutual funds, the investments are heavy leveraged and hence very risky, and the contracts themselves are fairly complex. Although the popularity of futures trading is spreading among smaller investors, futures trading is primarily the domain of professionals. Nonetheless, it is still important for retail stock and ETP traders to know, at a minimum, what futures contracts actually are. Many of the markets in which retail traders transact have a futures market counterpart, such as stock index ETPs and stock index futures. Many yield-bearing financial assets have, directly or indirectly, a futures market counterpart, as do exchange rates. And prices between these traditional investment categories and futures market derivatives are linked, sometimes in very useful ways even for the small investor. For example, most active stock traders who are ready to trade at market open will have already surveyed morning futures contracts in the S&P 500 Index Futures long before the coffee gets cold. Equally important, many of the popular new ETPs that are traded routinely by retail investors hold their assets in the form of futures contracts, which implies that their NAVs and INAVs are going to be determined by the market behavior of the futures contracts that constitute those ETPs. In chapter 6 in this series entitled Exchange Traded Products many examples were given, including commodity ETPs like the United States Oil Fund (USO), leveraged funds like the Direxion 3X Financial Bull (FAS), and leveraged ETPs like the Rydex Inverse 2X S&P 500 (RSW). 1 Clearly if one is going to invest in ETPs secured by futures, then probably something should be known about how markets for those futures behave. So this chapter is intended to provide at least useful background information about futures. Here we will not (and in Economics 104 we will not) explore strategies for trading futures. We will leave that to a more advanced class. 1. What is a Futures Contract? We might as well get dryly technical right at the outset. Then we can use an example to help understand. A futures contract is between two parties with an intermediary involved, the futures exchange. The contract requires one of the parties to agree to make delivery of a commodity or financial asset and the other party to take or accept delivery of the same commodity or financial asset. To be more precise, a futures contract allows a trader to undertake a contract to either make (deliver) or take (accept) delivery of a commodity or some kind of financial asset (a) in the future on a known date, (b) under specified conditions, (c) effectively for a price contracted today. The party to the contract who is agreeing to take delivery of the commodity is long in the position, whereas the party who is agreeing to deliver the commodity is short in the position. A speculator will benefit when she is long if the price rises, short if the price falls. 1 These examples are all given in Chapter 6 Exchange Traded Products in this Economics 104 series. The reader may want to review that document to see what was said about these types of ETPs and why funds collateralized by futures contracts may have a much higher tracking error generally than other types of ETPs and are therefore less suitable as long-term investments by retail investors.
Transcript of First edition 2010, this edition November 25, 2013 …pages.hmc.edu/evans/Ch10Futures.pdfChapter 10...
Chapter 10 - Futures Contracts written for Economics 104 Financial Economics by Prof Gary R. Evans
First edition 2010, this edition November 25, 2013 ©Gary R. Evans
This article, prepared for students in Economics 104, is meant to introduce students to the futures markets.
Even an active retail investor is unlikely to ever make a trade directly in this market. The cash requirements are much more substantial than those required for stocks, ETPs, or mutual funds, the investments are heavy leveraged and hence very risky, and the contracts themselves are fairly complex. Although the popularity of futures trading is spreading among smaller investors, futures trading is primarily the domain of professionals.
Nonetheless, it is still important for retail stock and ETP traders to know, at a minimum, what futures contracts actually are. Many of the markets in which retail traders transact have a futures market counterpart, such as stock index ETPs and stock index futures. Many yield-bearing financial assets have, directly or indirectly, a futures market counterpart, as do exchange rates. And prices between these traditional investment categories and futures market derivatives are linked, sometimes in very useful ways even for the small investor. For example, most active stock traders who are ready to trade at market open will have already surveyed morning futures contracts in the S&P 500 Index Futures long before the coffee gets cold.
Equally important, many of the popular new ETPs that are traded routinely by retail investors hold their assets in the form of futures contracts, which implies that their NAVs and INAVs are going to be determined by the market behavior of the futures contracts that constitute those ETPs. In chapter 6 in this series entitled Exchange Traded Products many examples were given, including commodity ETPs like the United States Oil Fund (USO), leveraged funds like the Direxion 3X Financial Bull (FAS), and leveraged ETPs like the Rydex Inverse 2X S&P 500 (RSW).1 Clearly if one is going to invest in ETPs secured by futures, then probably something should be known about how markets for those futures behave.
So this chapter is intended to provide at least useful background information about futures. Here we will not (and in Economics 104 we will not) explore strategies for trading futures. We will leave that to a more advanced class.
1. What is a Futures Contract?
We might as well get dryly technical right at the outset. Then we can use an example to help understand.
A futures contract is between two parties with an intermediary involved, the futures exchange. The contract requires one of the parties to agree to make delivery of a commodity or financial asset and the other party to take or accept delivery of the same commodity or financial asset.
To be more precise, a futures contract allows a trader to undertake a contract to either make (deliver) or take (accept) delivery of a commodity or some kind of financial asset (a) in the future on a known date, (b) under specified conditions, (c) effectively for a price contracted today.
The party to the contract who is agreeing to take delivery of the commodity is long in the position, whereas the party who is agreeing to deliver the commodity is short in the position. A speculator will benefit when she is long if the price rises, short if the price falls.
1 These examples are all given in Chapter 6 Exchange Traded Products in this Economics 104 series. The reader may want to review that document to see what was said about these types of ETPs and why funds collateralized by futures contracts may have a much higher tracking error generally than other types of ETPs and are therefore less suitable as long-term investments by retail investors.

2 Processing a flow of limit order that end up as bids and asks, as they do in stock and options exchanges, market makers on the futures exchange will match long orders with short orders, either with outside traders or with their own trades.
For example, on November 5, 2010, you could have agreed to pay $87.18 per barrel (42 gallons) for 1,000 barrels of light sweet crude oil (with 0.42% sulfur or less) at an agreed time during the month of December to a facility in Cushing Oklahoma. This futures contract was traded at the New York Mercantile Exchange (NYMEX), part of the CME Group and one of the many futures exchanges in the United States. In this example it the notional value2 of the contract, equal to the current futures price times the size of the contract, is $87,180, although as will be seen, this amount of cash is not
required to be long or short in this contract.
Figure 1 shows the price history of this contract in early November 2010.3 As can be seen, this contract had been volatile.
When this contract was current, NYMEX also had crude oil contracts for the months of January 2011 through December 2019 monthly, although few trades are made for months that are more than six months out.
On the same day that the December 2010 contract closed at $87.18, the December 2011 light sweet crude contract closed at $91.04.
The near-term contract for crude oil, which is the closest in time and next to expire, is often cited in the financial news as indicative of the price of oil and energy prices in general. When a news broadcaster announces "Crude prices today rose by $2.00 to $87," she is typically referring to the near-term NYMEX futures contract in light sweet crude oil. This is an
example of a benchmark futures contract.
Figure 2, taken from a lecture, shows that there are futures contracts in every kind of commodity and financial assets imaginable (the list shown is not exhaustive), and even some in events, like temperature, rainfall snowfall, and hurricanes at named locations.
Before discussing the exchanges we should review a couple of terms. Obviously from the context above a futures price refers to the price
2 The notional value is the nominal face value of a financial asset. The notional value of most conventional financial assets , like stocks, is the actual market value of the asset. But in a derivative like a futures contract, because the notional value implies a future price that has not been realized and because the derivative is leveraged, the cash commitment required for this contract is not the same as the notional value. As we will see, the cash required for this contract is a fraction of the notional value. 3 The expression "electronic" that can be seen in the chart title refers to the fact that this is computerized, automated market, as opposed to the traditional commodity "open-outcry" trading pit where humans used hand signals to make trades. Like all other markets, futures markets, through mergers, have become automated markets.

3 today of a specified futures contract, like the example of $ 87.18 for the December 2010 light sweet crude contract. The term spot price refers to the cash price of the same commodity or financial asset presently. The spot price at Henry Hub (Cushing, Oklahoma) for light sweet crude on November 5, 2010 was $86.49 per barrel, 65 cents less than the December futures price. This means that actual oil traded that day at Henry Hub for $86.49. Futures prices for different months of the same commodity will almost never be the same and of course none of them will be the same price as the spot price. If market traders expect prices to rise in the future, then the near-term futures price will be higher than the spot price and the more distant the future, typically the higher the price.
When looking at trading statistics, the term volume means the number of futures contracts traded over any specified interval of time, and the term open interest refers to the number of contracts that are active, which implies that they have both a long and short position. To offset a contract refers to a trade that reverses the original trade made by a trader, effectively canceling the contract after a monetary settlement has been made. In other words, if a trader opens a trade by taking a short position in one crude oil contract, the same trader will normally exit this position by later taking a long position in the same contract rather than actually make a crude oil delivery. The second transaction is the offset.
Only a tiny fraction of futures contracts survive until delivery. For reasons that will be explained later, most are offset. This implies that we would expect open interest over the life of any futures contract to grow as older contracts expire and this contract approaches the status of being the near-term contract, then as this contract approaches expiration open interest will decline because of offset.
It should be obvious at this point how a trader would profit by being long or short in this crude oil futures contract.
If the trader goes long in the December 2010 crude oil contract on November 5 at $87.18, which implies that he has the right to take delivery of 1,000 barrels of oil at that price at some time in December, then he will benefit if the spot price of crude oil rises above the price of $87.18 and stays above that price until he either offsets his contract or actually takes delivery of the oil. Why? If the spot price of oil is $92.00 for example, he has the right to buy 1,000 barrels of oil for $87,180 and then resell it on the spot market for $92,000, earning a profit of $4,820 (minus fees) per contract.
By extension, if a trader goes short in the December 2010 crude oil contract, she will benefit if the spot price of crude oil falls below the price of $87.18 and stays below that price until she either offsets her contract or actually makes delivery of the oil.
In summary, for futures contracts, when long you want the price to rise, when short, you want the price to fall.
Finally, unlike stocks, being long in a futures contract is not regarded as "normal" and short regarded as atypical or the domain of only exotic speculators. Any investor, including a small retail investor, is as likely to be short as long. It just depends upon whether the trader thinks the future price of the commodity or financial asset in question is going to go up or down.
2. The Futures Exchanges
Prior to the turn of the century (2000) there were multiple large competing futures exchanges in the United States and none that had truly global markets. Among the largest were New York Mercantile Exchange (NYMEX), the Chicago Board of Trade (CBOT), and the Chicago Mercantile Exchange (CME) and the New York Board of Trade (NYBOT). Through the process of merger and consolidation these smaller independent exchanges were blended and enlarged and made global and, far more important, generally converted, at least in part, to fully automated electronic exchanges. The latter was made necessary by the competitive thrust of the newer and larger European and Asian exchanges into fully electronic trade. In 2007 the NYMEX, the CBOT, and the CME were merged into the CME Group [NYSE: CME], which consists of two groups, Globex, an electronic trading arm, and an open out-cry trading group. This huge global futures exchange trades almost every commodity imaginable, including all of those listed in Figure 2. The global InterContinentalExchange [NYSE: ICE], which bought NYBOT in 2007, competes with the CME Group and emphasizes electronic trades. ICE trades energy futures through the U.K.-regulated London market, and its commodity, foreign exchange, and index futures through a U.S.-regulated market, ICE Futures US.

4
NASDAQ OMX, the modern extension of the older NASDAQ stock market has also entered the competition with their NASDAQ OMX FuturesExchange, built in part by acquiring the old Philadelphia Exchange. OMX offers relatively few types of contracts when compared to CME Group and ICE, but they do offer smaller contracts more accessible to smaller traders. There are still two old regional commodity exchanges in the United States, the Kansas City Board of Trade and the Minneapolis Grain Exchange, both of which trade only wheat contracts. Formerly exchanges sold seats allowing members to trade on the exchange floor, called the pit and to bid and ask using a complicated system of hand signals and verbal orders in an open outcry system. This system is similar to that used on the NYSE. Figure 3 shows a scene from traditional NYMEX
pit trading. Electronic trading is rapidly replacing open outcry. ICE is purely electronic. Trades are cleared through a clearinghouse that matches buy and sell orders. The clearing member is a market maker who assures that all trades are matched, or matches it himself.
As the futures exchanges move to electronic trades, brokerages just as relentlessly move in the direction of online trading, just as they have for stocks and ETPs. Some of the established online traders like ETrade are expanding their security coverage to include futures and foreign exchange (FOREX). There are also a number of dedicated futures online trading sites like OpenECry (a play on the term "open outcry"). Their interfaces are as convenient and easy to use as a stock brokerage site. Figure 4 shows a Depth of Market (DOM) order entry interface. The interface shown is the futures equivalent to Level II for stocks, with the scrolling bid queue on the left and the ask queue on the right . As can be seen there are buttons that allow the trader to place buy (long) or sell (short) market orders on the bottom. Limit orders can be made on a different interface screen. There is one major difference though between futures trading accounts and stock accounts. For reasons that will be explained below, the minimum amount of cash to open an account and the size of the trades are very
much larger than the equivalent in an online stock brokerage account. A typical minimum to open a futures trading account seems to be around $5,000, but it is inadvisable to open a futures trading account with less than $25,000.

5
3. Initial Margins, Maintenance Margins, and Daily Settlement When priced at $87.18 per barrel, the notional value of the December 2010 light sweet crude oil futures contract is $87,180. To trade this contract, though, you don't need anywhere near $87,180. For one thing, if you are long in the contract you are not actually buying the oil. Instead your are effectively promising to buy the oil for this price upon delivery in December. If you do not offset the contract by then and take delivery, at that point you would have to come up with $87,180. Meanwhile, to have the right to go long or short in a single 1,000 barrel light sweet crude oil futures contract, you have to post a cash performance bond that is typically called an initial margin in your futures account at your broker. As of late November 2010, the initial margin for the light sweet crude futures contract being used as an example was $5,063 per contract for a retail trader.4 Additionally, when holding a long or short position in a futures contract, for reasons that will be explained below, the cash in a trader's margin account will rise and fall. That gives rise to a second requirement - when holding a long or short position in a futures contract, the amount of cash in the trader's cash account cannot fall below a maintenance margin, which for the oil contract being used in this example, was $3,750 per contract. If the cash balance falls below this amount, the broker immediately issues a margin call, which requires the trader to post more cash in the account. If the trader is unwilling or unable to do that, the position will automatically be offset and the trader will no longer be in the contract. In summary, for the right to go long or short in the December 2010 light sweet crude oil futures contract, a trader must have a minimum of $5,063 per contract, the initial margin, in his account, and to maintain his position, his cash account balance must not be allowed to fall below the maintenance margin, $3,750 per contract. Of course most traders will keep a cash balance far greater than required by either of these margins. It would not be very wise to trade the oil futures contract used in our example without at least $10,000 or $15,000 per contract in cash. It should be understood that when a trader has an active futures account, possibly trading in many futures contracts, she will have only one cash account that is used to cover all margin requirements for all contracts in play. Again, a smart trader will have enough cash in the account to cover many margin calls, so the need to raise more cash would be rare except in the most extreme circumstances. This cash account at the brokerage is the only asset owned by the futures trader, which makes futures very different from stocks, bonds and options. If you use some cash from a brokerage account to buy 100 shares of Intel, then after that transaction you clearly own 100 shares of Intel, and those 100 shares are an asset which can be sold. Also the cash used to buy the stock is gone. The same is true of Intel call options. Although in many ways similar to options, futures contracts are not an asset that you buy or sell. You do not really own anything if you are long or short in a futures contract, instead you have a right to trade under stipulated conditions at some date in the future. When you go long or short in a futures contract, you do not pay with cash. The amount of cash in the account is initially unaffected by the transaction. This may seem confusing, especially when comparing futures to options, but the difference between futures and options becomes much more clear once we discuss the procedure of daily settlement, which is peculiar to futures and makes them very different than options. As stated above, the trader is required to maintain a cash margin account and, given his trades, meet the initial and maintenance margin minimums. The balance of this account is adjusted daily in the process know as daily settlement. If the trader is long in a futures contract and if during that day the price of the commodity or financial asset represented by the future rises, then cash is added to the cash account during day-end settlement. In our example, if the price of crude oil rises during the trading day,
4 There are two tiers of margin requirements for futures contracts, one typically referred to as the non-member or speculative margin, and the other typically referred to as the member or hedging margin. The latter applies to member of the exchange. In this document, we will just refer to the non-member margin, which would be the margin required on any retail futures trader.
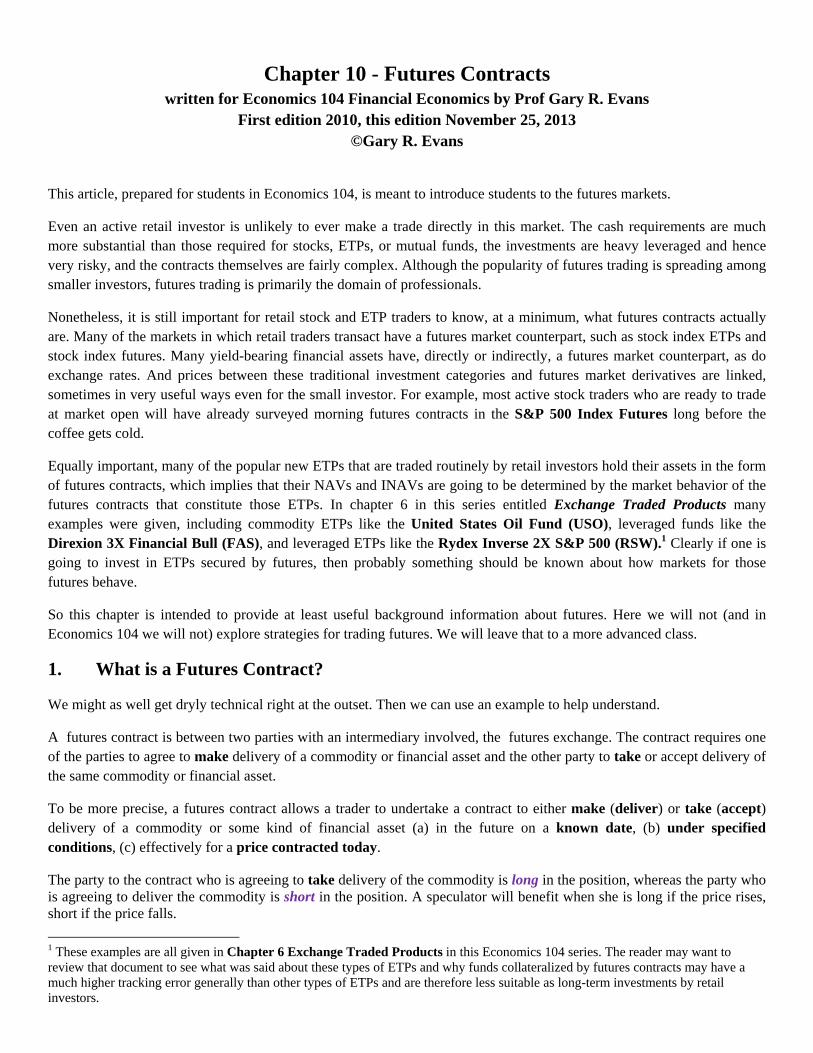
6 then at the end of the trading day during settlement, cash is added to our margin account. If we are short in the contract and the price rises, cash is deducted from our margin account. The amount of cash added to a long position and deducted from a short position in the crude oil contract will be equal to the full gain or loss of notional value of the futures contract for that day.
This is best explained by example. Figure 5 shows how the cash margin account would be adjusted each day for six days if the trader was long in one contract and the price of crude oil were to change as shown. Using our example from above, the trader starts with a single contract having a notional value of $87,180 and $5,063 in the cash account to cover the initial margin. Note that the buyer did not "pay for" the futures contract in this example. If on the first day of trade the price at the end of the day for the December light sweet crude contract rises to
$87.34 as shown, then the notional value of the contract has risen from $87,180 to $87,340, a gain of $160. This $160 is added to the margin account, raising its balance from $5,063 to $5,223. That is settlement for that day. As you review each day's price change going down the price column, you can see that this arithmetic is consistently applied: on days when the price rises, the increase in the notional value is added to the margin account and on days when the price declines, the decrease is subtracted. In Figure 5 the price begins to fall on the second day, reducing the margin account until on day four, the margin account falls below the maintenance margin (yellow) and a margin call is issued (ignored in this example). In the final two days the price of crude rises above the initial futures price and the margin account finally shows a slight capital gain. It should be easy to see that the counter-party trader, who is short in this account, will suffer a capital gain or loss that is the exact opposite of the example in Figure 5. The signs of the values in the Gain column will be reversed. This implies that on net that the cash that is gained in the long trade is lost in the short trade and vice-versa. It is important to understand that settlement is the only change that is made to the account when trading in futures. Once in a futures contract, then settlement takes place daily. If and when the contract is offset, settlement stops and the trade is over. Effectively the trader has not really bought or sold anything.
4. How Settlement Affects Delivery The unusual convention of daily settlement is easier to understand and more justifiable when we see how it affects delivery.
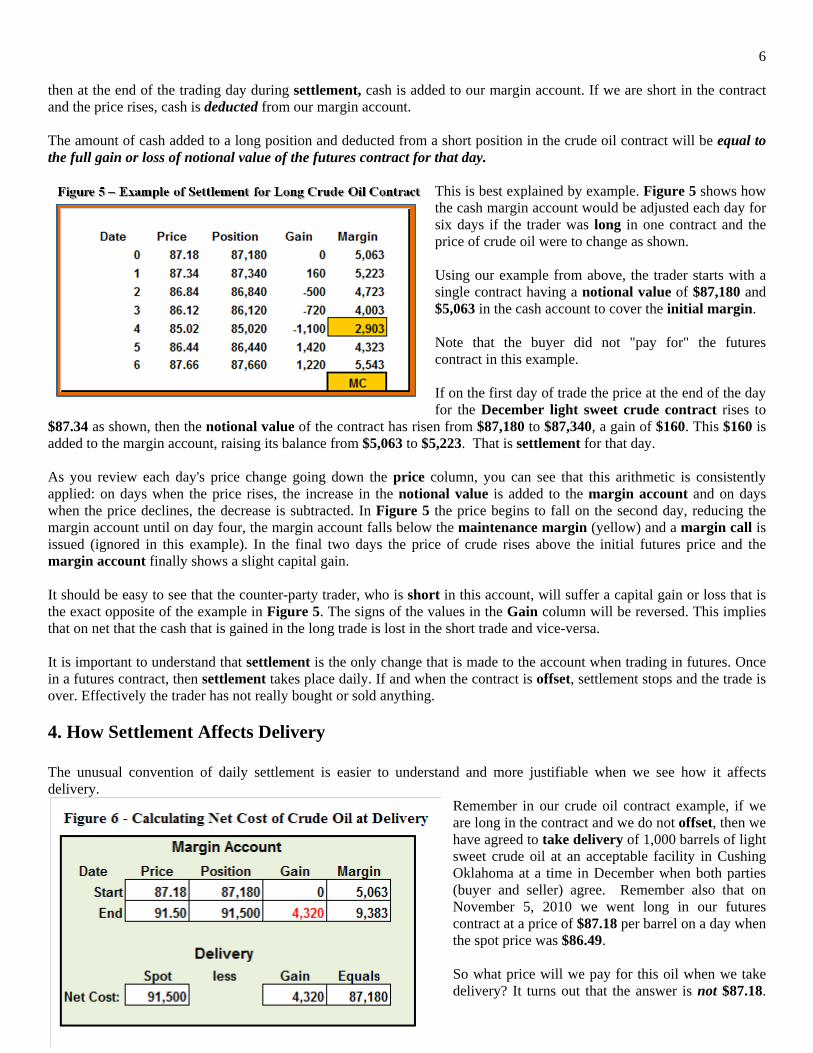
Remember in our crude oil contract example, if we are long in the contract and we do not offset, then we have agreed to take delivery of 1,000 barrels of light sweet crude oil at an acceptable facility in Cushing Oklahoma at a time in December when both parties (buyer and seller) agree. Remember also that on November 5, 2010 we went long in our futures contract at a price of $87.18 per barrel on a day when the spot price was $86.49. So what price will we pay for this oil when we take delivery? It turns out that the answer is not $87.18.

7 In fact when we take delivery we will pay the spot price for that day, just like anyone else taking delivery that day. Let's suppose for the sake of example that the spot price on the delivery commitment date is $91.50. If we take delivery then we will be paying $91,500 for our 1,000 barrels of crude oil. But effectively we will have only paid $87,180, or $87.18 per barrel. Look at Figure 6 to see why. The top half of the chart shows what happened to the margin account between the start of the contract and the end of the contract, using the same method that was used in Figure 5. The margin account started with $5,063 and because the futures price converged to the spot price on the final day of the contract because it must, and because that spot price turned out to be $91.50, because of settlement the margin account balance has risen to $9,383, a capital gain in the margin account of $4,320. When you subtract that amount from the spot delivery cost, shown at the bottom of Figure 6, the net cost equals $87,180, or $87.18 per barrel. It should be obvious that if the price of crude oil had fallen relative to $87.18, then the spot price paid at delivery would be lower than $87.18, but the capital loss in the margin account would adjust the net cost to, of course, $87.18 per barrel. So again, it is through the process of settlement in the margin account that the futures price when the contract is initiated becomes effectively the price to be paid at delivery. It should also be remembered that a growing number of contracts do not allow physical settlement, only cash settlement. For example, the ICE West Texas Intermediate (WTI) Light Sweet Crude Oil futures contract is very similar in structure to the oil futures contract from the CME Group used above in our examples with one notable exception - settlement is cash only. Generally this means that the contract is automatically offset in the last trading day and the trader is therefore left with capital gains or losses in the margin account exactly as would have been the case had he voluntarily settled on the last trading day.
5. Other Interesting Futures Contracts
Figure 7 shows a sample of some of the other contracts that are traded by the CME Group.5 The minimum information needed to trade a contracts includes (1) the contract size, (2) the unit in which it is traded, (3) the initial and maintenance margin, (4) the last day of trade for contract that you are trading, and (5) any delivery conditions (not shown). A recent trade price or value will, when multiplied times the size of the contract, give some indication of the notional value of a
5 More current prices and margin values will be provided in the lectures that accompany this chapter.
8 single contract. Finally, the degree to which these contracts are leveraged at the maximum is determined by dividing the notional value by the initial margin. The true leverage of any futures account is equal to the total notional value of all futures positions in the account, long or short divided by the amount of cash in the account, and number that will always be well above the maximum implied values shown in Figure 7. True leverage = Notional value of futures contracts in the account / Cash in the account Sugar: The first contract shown, Number 11 Sugar, was in the news in 2010, so it is selected as a representative agricultural commodity future. As shown in Figure 7, the size of a single sugar contract is 112,000 pounds which, when priced at a little above $ 0.25 per pound, gives the contract a notional value of about $ 30,000. Given the initial margin of $ 2,750, this contract is leveraged about 11 to 1 at the maximum.
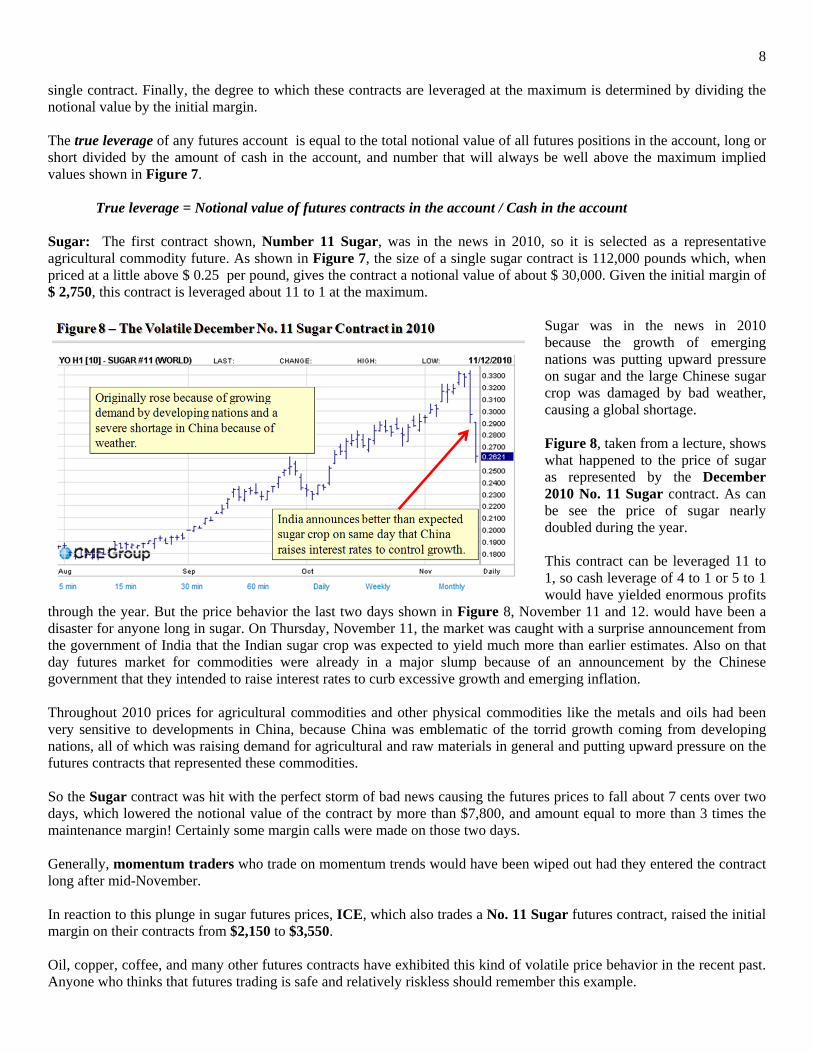
Sugar was in the news in 2010 because the growth of emerging nations was putting upward pressure on sugar and the large Chinese sugar crop was damaged by bad weather, causing a global shortage. Figure 8, taken from a lecture, shows what happened to the price of sugar as represented by the December 2010 No. 11 Sugar contract. As can be see the price of sugar nearly doubled during the year. This contract can be leveraged 11 to 1, so cash leverage of 4 to 1 or 5 to 1 would have yielded enormous profits
through the year. But the price behavior the last two days shown in Figure 8, November 11 and 12. would have been a disaster for anyone long in sugar. On Thursday, November 11, the market was caught with a surprise announcement from the government of India that the Indian sugar crop was expected to yield much more than earlier estimates. Also on that day futures market for commodities were already in a major slump because of an announcement by the Chinese government that they intended to raise interest rates to curb excessive growth and emerging inflation. Throughout 2010 prices for agricultural commodities and other physical commodities like the metals and oils had been very sensitive to developments in China, because China was emblematic of the torrid growth coming from developing nations, all of which was raising demand for agricultural and raw materials in general and putting upward pressure on the futures contracts that represented these commodities. So the Sugar contract was hit with the perfect storm of bad news causing the futures prices to fall about 7 cents over two days, which lowered the notional value of the contract by more than $7,800, and amount equal to more than 3 times the maintenance margin! Certainly some margin calls were made on those two days. Generally, momentum traders who trade on momentum trends would have been wiped out had they entered the contract long after mid-November. In reaction to this plunge in sugar futures prices, ICE, which also trades a No. 11 Sugar futures contract, raised the initial margin on their contracts from $2,150 to $3,550. Oil, copper, coffee, and many other futures contracts have exhibited this kind of volatile price behavior in the recent past. Anyone who thinks that futures trading is safe and relatively riskless should remember this example.
9 Stock Index Futures: The two contracts below the Sugar contract in Figure 7 are examples of futures contracts that track stock indexes. The S&P 500 futures contract has a price equal to 250 times the value of the S&P 500 index at any given moment. Basically as the index rises and falls throughout the day, if long in one contract, a rise in the S&P 500 Index of one point causes a margin gain of exactly $250, a decline of one point produces a loss of the same size. The S&P 500 futures contracts are some of the most heavily traded of all futures contracts. They are used to hedge or speculate against actual portfolio positions in the 500 stocks that make up the index. The price of this contract (and similar contracts for other indexes like the Dow Jones Industrial Average) are monitored carefully every morning by serious equity traders because they offer a reasonably accurate indication of whether the market is going to open up or down, and to some extent by how much. But as can be seen in Figure 7 the notional value and margin requirements for this contract are huge, which makes them unsuitable for trade by smaller retail traders. For that reason, the exchange offers smaller contracts typically called e-Mini or e-Micro contracts with a much smaller contract size and margins. The e-Mini S&P 500 futures contract provides a good example. The contract size is only 50 times the index compared to 250 times for the large contract. Hence the initial margin is only $5,625, much more manageable for the small retail trader with a smaller balance in the cash account. Every one dollar move in the e-Mini S&P 500 futures contract adds or subtracts $50 from the cash account. Just like index ETPs like SPY, the S&P 500 tracking stock, if you know what the index is doing, you know what your index futures position is doing. Exchange Rates: The exchange rates of all major currencies in the world relative to the U.S. Dollar are represented in the futures markets, as well as many of these non-dollar currencies relative to each other (such as the Euro and the Yen), which are called currency crosses in the quotations. Figure 7 shows two such contracts, the large, traditional EUR/USD contract of 125,000 Euros priced as the Dollar Price of the Euro (the example means that at that time one Euro cost $1.3669). 6 A one-penny move in this exchange rate would add or subtract $125 from the margin account. Figure 7 also shows the much-smaller e-Micro EUR/USD, which is only one-tenth the size of the parent contract and has a seemingly tiny initial margin of $432, perfectly suitable for the small retail trader. These contracts are leveraged hugely because supposedly exchange rates move across a much narrower trading range than commodity prices like oil, although substantial exchange rate volatility has been seen in recent years. Nonetheless, the e-Micro exchange rate contracts are a good entry point for the beginning futures trader who is working with a small amount of cash.7 Interest Rates: The final example in Figure 7 shows an example of an interest rate contract, in this case the contract for the 5-Year U.S. Treasury Note. These contracts trade off the price of the U.S. Treasury Note rather than the yield. Because interest rates and the prices of bonds and notes move inversely,8 his implies that you would go long in this contract if you thought that interest rates were going to fall.9
6 In futures and in FOREX trading quotations and transactions are made two or three decimal places past cents because these trades are for such huge contracts. 7 Maybe - exchange rates are very volatile in their narrower trading range and this market is hard to trade successfully. Even though initial margins are less than $500, it is probably not wise to open a trading account even for these with less than $5,000. But that is still a lot more attractive than the $4,000+ required for the big contract. Your teacher believes that these micro contracts were created to compete with the very popular direct FOREX trade, which is described elsewhere in the class. 8 This relationship is explained mathematically in the Economics 104 Chapter 9 entitled Bond and Note Valuation and Related Interest Rate Formulas. No one should trade interest rate futures unless thoroughly familiar with the relationship between the prices of yield-bearing financial assets and their yields. 9 There are interest rate futures contracts that trade off the yield of the asset. Two examples include the 1-month Eurodollar and the 30-day Federal Funds rate contracts,

10 The contract size is the equivalent of buying a 5-year U.S. Treasury Note worth $100,000 at maturity. Since most notes and bonds are issued with a par value of 100 and are redeemed for the same value, this kind of asset will trade at a premium (above 100) if interest rates on equivalent securities have fallen since it was issued and at discount (below 100) if they have risen. The near-term 5-year U.S. Treasury Note used as the example in Figure 7, priced at 120'030 (these notes and bonds are quoted in 32nds, so this quote is equivalent to 120.09375) is trading at a very large premium for a note of such a short maturity. The premium of more than 20% is close to a historical record for a futures contract representing a 5-year note because interest rates in late 2010, targeted by the Federal Reserve System in their quantitative easing monetary policy, designed to stimulate a moribund economy, was pushing spot interest rates on U.S. Treasury securities to record lows. If interest rates were to rise to normal historical levels, the price of this contract would come tumbling down.10
6. Supply, Demand, Inventory and Prices Economic theory tends to claim that spot prices determine futures prices, in the sense that the spot price sets the floor for a futures price, and then futures prices are higher or lower than spot prices because of sundry expectations of such events as weather (agricultural commodities), discoveries and pace of production (mined and drilled commodities), changes in government policy (interest rates and exchange rates), and fluctuations in demand for whatever reason (all commodities).
The theory that the direction of influence goes from spot prices to futures prices began to be challenged after the January 2009 NYMEX light sweet crude oil futures contract and similar contracts soared from about $60 per barrel in January 2007 to the highest price ever recorded for oil, about $145 in the summer of 2008. The price performance of this contract is shown in Figure 9, taken from a lecture. Other commodities like wheat suffered similar increases and volatility. After those events market critics began to suggest that because of the huge amounts of money now wagered in speculation, we have reached the point where futures prices are leading spot prices.11 Complicating this debate is the role played
by ETPs that are either directly collateralized by huge inventories of commodities, like the SPDR Gold Shares (GLD) ETP, which holds an inventory of more than 1,000 metric tonnes of gold, or by futures contracts, such as the United States Oil Fund (USO), which holds crude oil futures contracts with a notional value exceeding $1.5 billion. The growth in popularity of these ETPs add to the underlying demand in the commodities they represent and in the futures associated with those commodities. The most elementary theories in economics are going to suggest that elementary supply and demand for any commodity in question will determine spot prices and expectations of the same are likely to influence if not determine futures prices as well. But so what? For most commodities you cannot measure levels of production or demand - especially demand - without a long time lag. Although commodity traders survey everything from USDA crop reports to mining surveys to the copious production estimates of the United States Energy Information Administration to determine production levels with
10 Of course the contract used in the example is close to expiration. On the same date a December 2011 5-Year U.S. Treasury Note futures contract was priced at 116'302, still quite high. 11 And the jury is still out on this issue. It seems to your teacher that there are times, indeed, where speculation does cause futures to lead spot, and 2008 was one of those times, but most of the time the traditional theory holds.

11 some degree of reliability, estimating demand on the consumption side, especially for global commodities, can be very unreliable. Fortunately for storable commodities like natural gas, oil, wheat and other grains, and many metals to name only a few, relative fluctuations in supply and demand are readily indicated by changes in inventory. Generally, if inventories are growing beyond expected levels, then supply exceeds demand and unless corrected, prices are more likely to drop. On the other hand if inventories are shrinking that implies demand exceeds supply which may put upward pressure on prices.
This is illustrated in Figure 10, which uses a hypothetical drop in the demand for crude oil as an example. This market starts at equilibrium at point a, where the blue supply and demand curves intersect, yielding an equilibrium price P1 and level of production and use at Q1. Then suppose the demand for oil drops to the level represented by demand curve D2. This means that eventually the new equilibrium point will drop to point c, resulting in a lower price and a lower level of production. But in a competitive market there will be a time delay in this reaction because there is no easy way to be aware immediately of the drop in demand. So for a short period of time the price remains at
P1, which causes demand to drop to Q2. Because supply is still running at level Q1, then there is an increase in inventory represented as the distance between S1 at P1 and D2 at P1, the difference between a and b. Only when this growth in inventory becomes publicized does the market react by adjusting price downward. Putting the reasoning in reverse, commodity traders watch inventories very carefully and when there is an unexpected increase or decrease in inventories, the price reaction in the futures market will be immediate and possibly severe.
However inventory estimates are sometimes much harder to do than is suggested in the example above. For many commodities inventories are seasonal and fluctuate throughout the year or over other time periods. This implies of course that inventories for many commodities are always building up or drawing down, so any evaluation of anomalies has to be judged relative to normal or historical levels for the time of the year or period in question. Figure 11 shows a good example of this, working12 natural gas inventories in the United States for 2008. As can be seen, inventories
12 Natural gas is stored mostly underground under pressure. The term "working" refers to that amount of gas that can be withdrawn without dropping pressure below adequate levels.

12 ranged from a low of about 1,250 billion cubic feet around March 2008 to a high of about 3,500 billion cubic feet in November of the same year. This was normal. This is because production throughout the year is steady but demand is seasonal. The heaviest use of natural gas is during the winter for heating so inventories are drawn down heavily. Even though many power plants producing electricity for summer heating are now fired by natural gas, the demand in summer is still much lower than gas used for heating in winter, so after March inventories begin their build through the summer until late fall. Clearly estimating supply and demand, even when traders have reliable indicators of inventory, involves a lot of guesswork and error. For that reason these leveraged markets are extremely sensitive to any news that directly or indirectly indicate that supplies may tighten up or demand might surge or atrophy. As was shown in the examples of sugar and oil above, can sudden price moves and severe volatility.
7. Speculating and Hedging with Futures Not much needs to be said about speculating with futures contracts. Generally if you think the price of the commodity or financial asset in question is going to rise, then you go long in the appropriate contract. If you think it is going to fall, you go short. The larger concern on speculation is (a) how much leverage do you build into your trades, (b) which month contract do you use, (c) what is the size of your trade? Secondary questions arise about whether you want to use stop orders or other conditional orders to protect your position when you are not watching the market. As stated earlier, the degree of leverage for your trading account in general at any moment will be the notional value of all of your positions short or long (in absolute value, obviously except in the same commodity, shorts do not cancel out longs) divided by the amount of cash in your margin account. Clearly in currencies and interest rate futures you can let that leverage get pretty high, but the higher the leverage, the more likely the margin calls on a bad day. I would advise a novice to never let account leverage get higher than 4 to 1 except for currencies and interest rates, perhaps 10 to 1 for currencies and 20 to 1 for interest rates. This implies also that the size of the trade is going to be determined by the size of the cash account. Whether buying a near-term or later contracts depends upon the strategy used. If trading because you expect some significant news soon, then the near-term contract might be advised. If developing a wait-and-see attitude (will we see inflation in the next year?) a more distant contract is advised. Sometimes distant contracts don't have adequate liquidity, as measured by volume and open interest. In the CME Group and ICE quotes volume and open interest of various maturities are very easy to compare. Also to be taken into consideration is the relative pricing of near-term versus distant contracts, which is discussed below in hedging. Hedging with futures seems like it would be simple. Just like speculating, if you would be harmed by an increase in a commodity price, then you would go long in the appropriate futures contract. Consider, for example, the case of a confectioner who might use 600,000 pounds of sugar each year, a little more than the equivalent of 5 futures contracts in No. 11 Sugar. The sugar prices shown earlier in Figure 8 could be ruinous to a competitive business with narrow margins that relies upon sugar. But suppose the confectioner's business will be profitable so long as the price of sugar stays below $ 0.22 per pound. As the futures price of sugar approached that level in mid-September (see Figure 8) the business could have hedged against further increases by going long in 5 December or January futures contracts (the date would presumably depend somewhat upon when the sugar was to be used). For reasons we now understand, the confectioner would probably not take delivery from the futures contract. Instead he would have offset near the end of the contract, bought sugar at spot, but partly with the gain he would have made in his margin account, which would be considerable. His net cost would be about $ 0.22 per pound. However with an initial margin of $ 2,750 then the minimum cash performance bond that he would have to post would equal $ 13,750 (see Figure 7) and to play it safe, the business might want to post $ 25,000 or more. And if it is a large

13 business justifying that kind of cash outlay to executives or directors who are ignorant of how futures work can be a problem. That problem would be compounded if the price of sugar went down, causing the cash in the margin account to be lost. The trader knows this is perfectly justified - after all, when you hedge at $0.22 you are not going to have to pay more than that for sugar, but neither will you pay less. The hedge merely takes an important but uncertain cost of a business transaction and fixes it at an acceptable rate, which in this case is $ 0.22 per pound. In effect a speculator has agreed to take your risk of rising prices. But explain that to a confused director. Let us suppose that you have plenty of cash for hedging and the problem with confused executives is mitigated, or better yet, you have smart executives. Even so, a good hedge may still not be possible. Suppose you are hedging against inflation, either inflation in your sector or general inflation for the economy as a whole. Let's use the case of oil as an example. So you fear either (a) economic expansion by emerging nations like China, India and many of the South American economies like Brazil and Argentina are going to exert inflationary pressures on all fossil fuels, including crude oil, or (b) the Federal Reserve Quantitative Easing Program initiated in 2010 is going to cause general inflation in the United States, including oil. Both of these concerns were prevalent to some degree in 2010. So wouldn't it make sense to go long in a whole chain of futures contracts to hedge against this inflation? Well, what if a large number of commodity traders have been thinking like you? If these expectations have been around for awhile, inflation will already be priced into the futures contracts and you have no hedge available. You can't hedge against rising prices if the futures contracts have already priced these expectations in.
Refer to Figure 12 (and ignore the terminology used there for the moment). This shows the full chain of NYMEX Crude Oil futures contracts in late 2008 from the January 2009 contract to the January 2010 contract. As can be seen, the price of the near-term contract is $ 43.15 per barrel, whereas the price one year away is $58.78, a 31% difference. Inflationary expectations in oil were already priced into this spread. In late 2008 you could have hedged against oil inflation only if you thought that the price would rise by more than 31%! (As it turns out, Figure 9 shows
us that this still would have been a good hedge, because that bottom contract priced at $58.78 was the one that would eventually rise to $ 145! But that is beside the point - this would have been a hard hedge to justify in 2008). The term carry cost refers to the full cost of storing a storable commodity for any period of time. This cost not only includes the direct cost of storage (which in the case of oil would be tank farms or unused oil tankers, which were used for storage in 2009), plus the cost of transportation and insurance. Carry cost is relevant in cases like this because with this kind of price spread a major trader could buy 10,000 barrels of oil at spot or accept physical delivery of the January 2009
14 contract at $43.15, store it, and at the same time short 10,000 barrels of January 2010 crude for $58.78, then deliver it for that price in January 2010. So long as carry costs are not more than $15.63 per barrel, and they wouldn't be, then a profit from this kind of arbitrage is guaranteed. It was thought that during this period in 2009, oil companies that had access to substantial storage in the form of unused idle supertankers were doing this. When the futures prices in any futures chain rise as each contract becomes more distant in time, such as the oil contract shown above in Figure 12, the chain is called a contango. So to summarize a major point in this section, when a futures contract chain is in contango, as the expression goes, it may be impossible to hedge against rising prices. When the futures prices in any futures chain fall as each contract becomes more distant in time, the chain is said to be in backwardation. This rare phenomenon tends to reflect deflationary expectations for the commodity in question. Generally, when prices are likely to go into contango, to hedge you have to be a little faster to figure it out than everyone else, or else you simply have to hedge all of the time. This final observation leads to a wise maxim:
As a commodity trader, you should hedge the most when it seems the least necessary.
It takes a real trader to follow rules like that.

15
Appendix A: Futures and Exchange Traded Products (ETPs) and Tracking Failures A.1 ETPs Secured with Futures Earlier in the semester when you were introduced to ETPs13we reviewed a classification of funds called delta funds, which typically try to track the daily change in the spot price of the asset being tracked. These ETPs hold futures contracts as assets. You were cautioned that because a daily error or bias is a common tracking error for these funds, they are typically inadvisable for long term investments. Now that you know about futures we can return to this subject. For an example we will use an ETP called the United States Gasoline Fund (UGA) offered by United States Commodity Funds. This fund's stated investment objective is as follows:14
The investment objective of UGA is for the daily changes in percentage terms of its units’ net asset value ("NAV") to reflect the daily changes in percentage terms of the spot price of gasoline, as measured by the daily changes in the price of the futures contract on unleaded gasoline (also known as reformulated gasoline blendstock for oxygen blending, or "RBOB") for delivery to the New York harbor, traded on the NYMEX that is the near month contract to expire, except when the near month contract is within two weeks of expiration, in which case it will be measured by the futures contract that is the next month contract to expire (the "Benchmark Futures Contract"), less UGA’s expenses.
This fund attempts to track the daily delta in the spot price (note that the target is not a futures price) of the same crude oil that we have used as an example throughout this document.
13 In Chapter 6 Exchange Traded Products. 14 Stated "Fund Objective and Key Features" of the United States Gasoline Fund of the funds featured at http://www.unitedstatescommodityfunds.com, as of November 18, 2013. Bold and italics are my emphasis.

16 Given how settlement works, which is to add or subtract the daily change in price, the delta, to the margin account, it is easy to see why futures are used as assets in these kinds of funds. Given that cash is the only asset of value in a futures trading account, this implies that the fund's NAV is going to be equal to the fund's cash balance divided by the number of ETP units outstanding. Figure 13, lists the assets of UGA on November 16, 2013. This relatively simple ETP holds a portfolio of 515 long near-term NYMEX (CMEGroup) futures contracts on New York RBOB gasoline. Given that each contract consists of 42,000 gallons (1,000 barrels - the same size as a crude oil contract) and the price at settlement was $2.6364 per gallon, each contract had a notional value of $110,728.80, so all 515 contracts had a combined notional value of $57,025,332 (referred to as Market Value in Figure 13). Note that the cash value of the account, which includes the U.S. Treasury Bills, equals $56,956,581.66. Note also that the Total Net Assets used to calculate the NAV, which in this case divides those assets by the one million outstanding shares, is nearly identical to the cash value of the account,15 and certainly does not equal the sum of cash plus the notional value of the futures contract. That is because the futures contract is not an asset. It is a contract that merely changes the cash value of the account every day at settlement. The only asset in a futures-based ETP is the cash in the account.
Initial margin on a single contract as of that date was $4,675 per contract (the maintenance margin was $4,250), only 4.2% of the notional value of the contract, which implies a maximum potential leverage of more than 23 to 1. But Figure 13 should make it clear that this ETP is not leveraged at all, because the cash value of the account is approximately equal to the notional value of the futures contract. When daily settlement takes place, the notional value of the futures contract and the cash value of the ETP rise or fall by exactly the same amount. This implies that the NAV of the ETP will rise or fall by the same percentage of the price per gallon of gasoline in the futures contract, hence no leverage. In summary, if an ETP is trying to match a price that is represented in a futures contract without leverage (1X long), this will be accomplished if the notional value of the futures contracts approximately equals the cash value (including other liquid assets like Treasury Bills) in the
same contract. This fund's NAV should be able to track the near-term futures prices with nearly 100% fidelity. This however does not imply that this fund will track the spot price of gasoline with 100% fidelity, because spot and futures prices are not the same and they don't even have exactly the same delta. It is for that reason that this fund's investment objective is actually a little misleading (as is typical for these delta funds secured with futures). It states that the objective is for the NAV "to reflect the daily changes in percentage terms of the spot price of gasoline" but then it adds "as measured by the daily changes in the price of the futures contract on unleaded gasoline."
15 Because there are small payable and receivable cash accounts not reflected in these aggregated numbers, the actual cash shown will never exactly equal total net assets in these releases.

17 This stated objectively is bizarrely contradictory, because the daily change in the percentage terms of the spot price of gasoline is not measured by the daily change in the price of a futures contract.16 Unfortunately the spot price and the price of a futures contract are not one and the same and the futures price does not necessarily match or perform the same as the spot price. There are even occasional directional differences (one goes up when the other goes down). Bias or error might arise if the percentage change in the near-term futures contract is not nearly equal to the percentage change in spot price, because the latter, not the former, is the tracking target. Nonetheless, Figure 14 - UGA tracks NY Harbor Gasoline with reasonable fidelity makes it clear that this ETP, which traded for the first time on February 28, 2008, has done a good job of tracking New York Harbor gasoline, nearly matching it perfectly from inception until around August 2012. After that a small tracking bias emerges because of the failure to accurately track a sharp plunge in gasoline prices during September and October 2012. But despite that glitch, most investors would be satisfied with the performance of UGA. It should be obvious from the example above that any 2X delta tracking ETP will try to hit their tracking target by holding cash equal to half of the notional value of the futures that they hold and any 3X delta tracking ETP will hold cash equal to one third of the notional value of their futures. Because these funds are more leveraged, they embody more risk, although even 3 to 1 leverage is pretty tame in the futures markets.
It should also be obvious that any inverse delta tracking ETP will differ from UGA by simply holding short positions rather than long positions, and a 2X inverse delta tracking ETP will be short and hold cash equal to half the notional value of their futures contracts. 16 No evidence is presented here but it is certainly available, and will be presented in future editions of this chapter. Simply glancing at data on the U.S. Energy Information Website for energy spot prices makes the distinction clear. Unfortunately getting historical futures data for comparisons requires an expensive subscription to a data service.

18 Figure 15 Asset Holdings of the DNO Short (inverse) Crude Oil Tracking Stock is an example of an inverse 1X unleveraged ETP. As can be seen the amount of cash and other liquid assets on hand are approximately equal to the notional value of the futures contracts held by DNO, at about $16 billion, which tells us the this ETP is not leveraged. But the negative values shown for quantity and market value indicate to us that the positions are short. This means that if the price of the oil futures contract rises by approximately 1%, then settlement will reduce the amount of cash in the account by 1%. Ideally, the NAV will also go down by 1%. (Note that here we are saying the tracking fidelity described is to the appropriate futures price of oil, in this case the Jan 14 contract, not the spot price of oil).
Figure 16 - The United States Short Oil Fund (DNO) tracking against its long USO counterpart shows exactly what we would expect when they hold nearly the same assets, except one long and the other short. They track as a near mirror image of each other. Of course this implies if one is biased in its tracking of its objective or of spot prices, the other will be biased as well. Figures 13 and 15 makes it very clear that delta ETP managers must roll over their entire portfolio of futures contracts every month if they are
collateralized with near-term futures, as most are. This will add to expenses and sometimes present the problem described below.
A.2 Contangos and the Possibility of Tracking Bias The presence of a contango in any futures market, such as the contango in oil that was shown in Figure 12, can introduce serious tracking bias into a delta tracking ETP. More importantly, if the commodity ETP was purchased as a specific hedge against inflation, the hedge may not work! A contango typically reflects the formation of inflationary expectation among market traders for either the commodity (oil) or the class of commodity (fuels), or for the economy as a whole (the consumer price index, including fuels). The traders have priced in those expectations in the futures chains. Consider the price of crude oil reflected in Figure 12, which begins at the price of $43.15 per barrel for the January 2009 contract, but rises to $58.78 for the January 2010 contract. Such pricing would not be possible unless there was a consensus among traders that the spot price of oil was going to rise over that year. The logic is pretty easy to figure out. Large traders who were short in that contract were obliged to deliver oil and if they though spot oil was going to be close to $60 per barrel within a year, they would never agree to deliver one year out at the current spot price of below $45. Futures prices are not a perfect indicator of expected future spot prices (or to be more general, not a perfect indicator of expected future inflation) but they are generally and directionally reliable. If futures prices one year out are 25% above spot prices, that is a pretty good indicator that the market in general believes that serious inflation is imminent. Suppose that the inflationary expectations is shared by you and other small retail traders. You know that an ETP like USO is more or less supposed to track the spot price of oil as it rises, even if one day at a time given that it is a delta tracker. So you buy USO in the hope if hedging against inflation. If the futures contract is already in contango because it already reflects inflationary expectations, you are out of luck. Your ETP will not even remotely track inflation – in fact the NAV may decline in value as the price of the commodity rises!
19
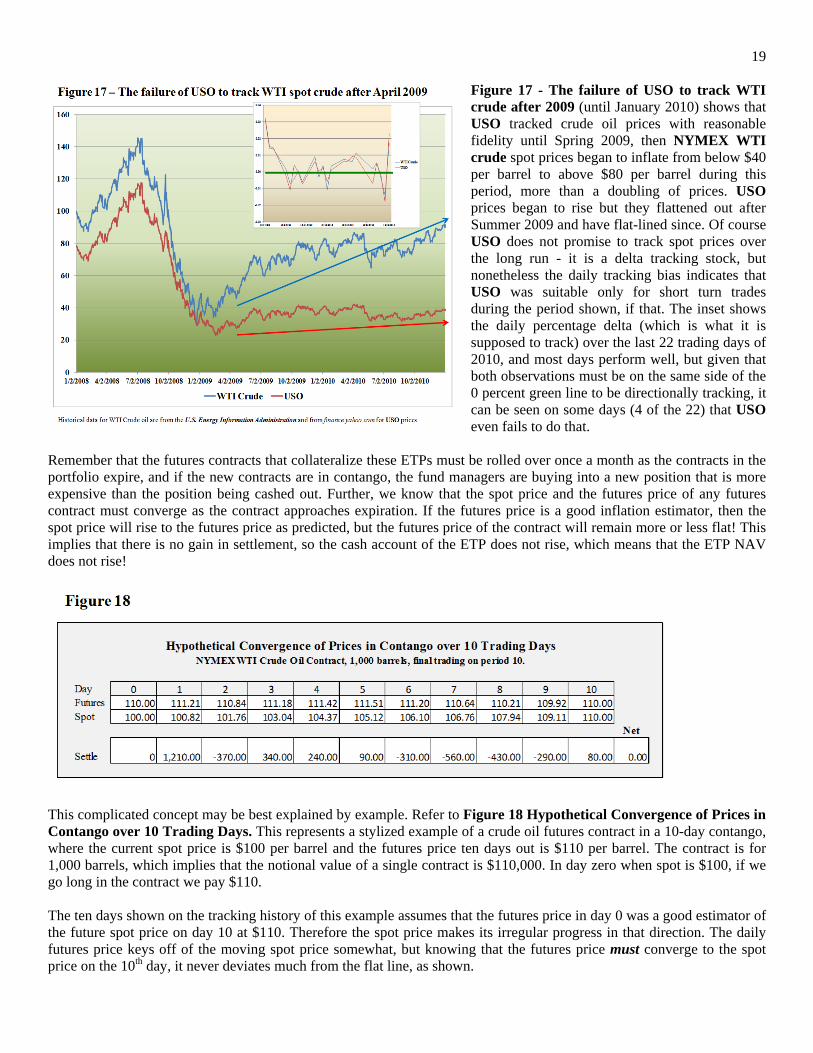
Figure 17 - The failure of USO to track WTI crude after 2009 (until January 2010) shows that USO tracked crude oil prices with reasonable fidelity until Spring 2009, then NYMEX WTI crude spot prices began to inflate from below $40 per barrel to above $80 per barrel during this period, more than a doubling of prices. USO prices began to rise but they flattened out after Summer 2009 and have flat-lined since. Of course USO does not promise to track spot prices over the long run - it is a delta tracking stock, but nonetheless the daily tracking bias indicates that USO was suitable only for short turn trades during the period shown, if that. The inset shows the daily percentage delta (which is what it is supposed to track) over the last 22 trading days of 2010, and most days perform well, but given that both observations must be on the same side of the 0 percent green line to be directionally tracking, it can be seen on some days (4 of the 22) that USO even fails to do that.
Remember that the futures contracts that collateralize these ETPs must be rolled over once a month as the contracts in the portfolio expire, and if the new contracts are in contango, the fund managers are buying into a new position that is more expensive than the position being cashed out. Further, we know that the spot price and the futures price of any futures contract must converge as the contract approaches expiration. If the futures price is a good inflation estimator, then the spot price will rise to the futures price as predicted, but the futures price of the contract will remain more or less flat! This implies that there is no gain in settlement, so the cash account of the ETP does not rise, which means that the ETP NAV does not rise!
This complicated concept may be best explained by example. Refer to Figure 18 Hypothetical Convergence of Prices in Contango over 10 Trading Days. This represents a stylized example of a crude oil futures contract in a 10-day contango, where the current spot price is $100 per barrel and the futures price ten days out is $110 per barrel. The contract is for 1,000 barrels, which implies that the notional value of a single contract is $110,000. In day zero when spot is $100, if we go long in the contract we pay $110. The ten days shown on the tracking history of this example assumes that the futures price in day 0 was a good estimator of the future spot price on day 10 at $110. Therefore the spot price makes its irregular progress in that direction. The daily futures price keys off of the moving spot price somewhat, but knowing that the futures price must converge to the spot price on the 10th day, it never deviates much from the flat line, as shown.

20 When the 10th day arrives, there is no net gain through settlement in the cash account. That should be obvious – the final futures price neither rose nor fell from what the ETP paid for it. If that logic is not convincing, the net change in daily settlement is shown for each of the 10 days, and as can be seen, the net change is zero. If settlement added no cash to the cash account, the ETP NAV, which is equal to total cash divided by the number of outstanding shares in the ETP, did not rise, so obviously the market-determined share price, which must roughly track the NAV, did not rise. The spot price of oil rose by 10% in 10 days and the NAV of the ETP that is supposed to track it did not rise by one penny! From this example it should be obvious that if the spot price rises, but by less than 10% (say by 8% to 108) the NAV will actually fall in value despite rising spot prices. Only if the futures price underestimates the inflation and the spot price rises above the original futures price (say to 112) will the NAV rise in value. We can conclude that during a contango, the manager of any delta ETP is faced with the same problem as a hedger - you cannot get a futures contract at any price that will meet your trading objective. Contangos are likely to emerge in an inflationary environment, and that would be the same time that uninformed traders might be most attracted to long delta commodity ETPs like USO. Alas, now we have some strong theoretical reasons to believe that these delta tracking stocks would work the least when they are most in demand.
A.3 ETNs secured with Swaps The curious reader may have wondered why when discussing 2X and 3X leveraged ETPs secured with futures that no examples were provided. There is a good reason for that. By 2013, almost none existed, at least not directly. Almost all such ETPs were ETNs, which you may remember, are not required to expose collateral in their public documents.
To understand what they are secured with, take a close look at the collateral daily holdings statement of the DOG Short Dow 30 1X inverse ETN represented in Figure 19.
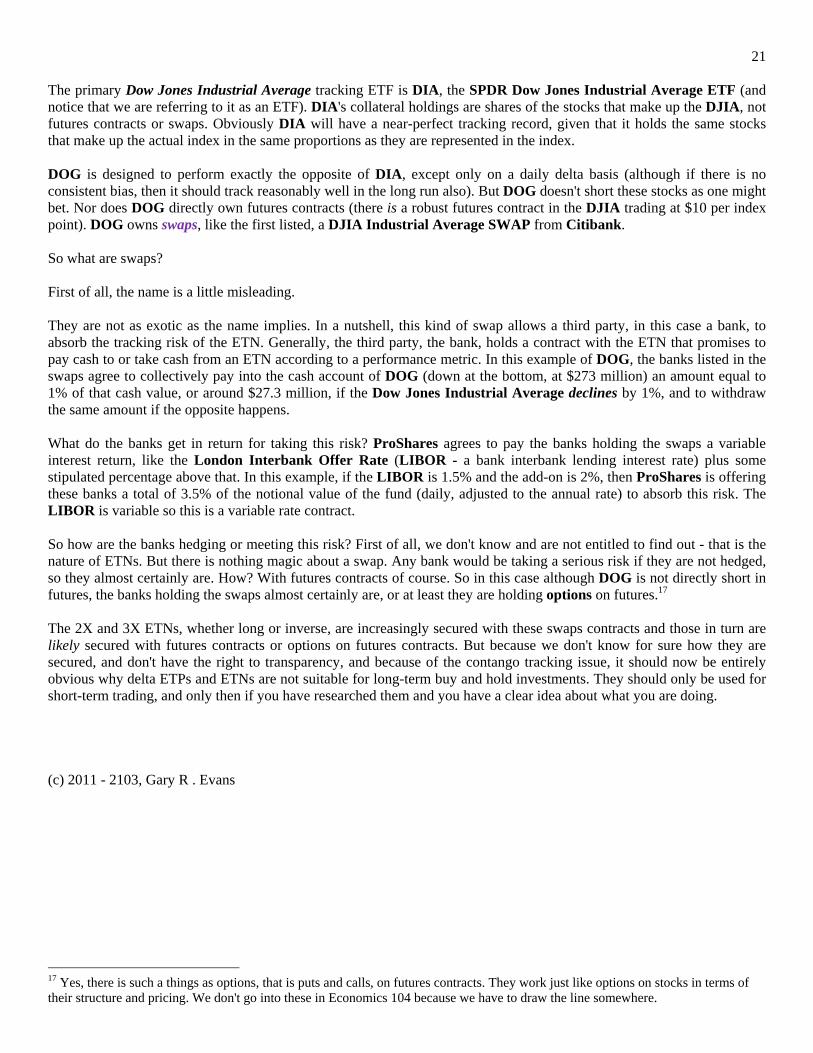
21 The primary Dow Jones Industrial Average tracking ETF is DIA, the SPDR Dow Jones Industrial Average ETF (and notice that we are referring to it as an ETF). DIA's collateral holdings are shares of the stocks that make up the DJIA, not futures contracts or swaps. Obviously DIA will have a near-perfect tracking record, given that it holds the same stocks that make up the actual index in the same proportions as they are represented in the index. DOG is designed to perform exactly the opposite of DIA, except only on a daily delta basis (although if there is no consistent bias, then it should track reasonably well in the long run also). But DOG doesn't short these stocks as one might bet. Nor does DOG directly own futures contracts (there is a robust futures contract in the DJIA trading at $10 per index point). DOG owns swaps, like the first listed, a DJIA Industrial Average SWAP from Citibank. So what are swaps? First of all, the name is a little misleading. They are not as exotic as the name implies. In a nutshell, this kind of swap allows a third party, in this case a bank, to absorb the tracking risk of the ETN. Generally, the third party, the bank, holds a contract with the ETN that promises to pay cash to or take cash from an ETN according to a performance metric. In this example of DOG, the banks listed in the swaps agree to collectively pay into the cash account of DOG (down at the bottom, at $273 million) an amount equal to 1% of that cash value, or around $27.3 million, if the Dow Jones Industrial Average declines by 1%, and to withdraw the same amount if the opposite happens. What do the banks get in return for taking this risk? ProShares agrees to pay the banks holding the swaps a variable interest return, like the London Interbank Offer Rate (LIBOR - a bank interbank lending interest rate) plus some stipulated percentage above that. In this example, if the LIBOR is 1.5% and the add-on is 2%, then ProShares is offering these banks a total of 3.5% of the notional value of the fund (daily, adjusted to the annual rate) to absorb this risk. The LIBOR is variable so this is a variable rate contract. So how are the banks hedging or meeting this risk? First of all, we don't know and are not entitled to find out - that is the nature of ETNs. But there is nothing magic about a swap. Any bank would be taking a serious risk if they are not hedged, so they almost certainly are. How? With futures contracts of course. So in this case although DOG is not directly short in futures, the banks holding the swaps almost certainly are, or at least they are holding options on futures.17 The 2X and 3X ETNs, whether long or inverse, are increasingly secured with these swaps contracts and those in turn are likely secured with futures contracts or options on futures contracts. But because we don't know for sure how they are secured, and don't have the right to transparency, and because of the contango tracking issue, it should now be entirely obvious why delta ETPs and ETNs are not suitable for long-term buy and hold investments. They should only be used for short-term trading, and only then if you have researched them and you have a clear idea about what you are doing. (c) 2011 - 2103, Gary R . Evans
17 Yes, there is such a things as options, that is puts and calls, on futures contracts. They work just like options on stocks in terms of their structure and pricing. We don't go into these in Economics 104 because we have to draw the line somewhere.