First & Second Avenues Month Complete Street Extension ...
24
Month Year First & Second Avenues Complete Street Extension Community Board 11 Commissioner Janette Sadik-Khan, New York City Department of Transportation December 6, 2011
Transcript of First & Second Avenues Month Complete Street Extension ...

MonthYear
First & Second Avenues Complete Street Extension
Community Board 11
Commissioner Janette Sadik-Khan, New York City Department of TransportationDecember 6, 2011

Agenda
2
• Trends: • US Census Bureau data
• Existing & Planned Conditions
• 2010-11 Implementation: • Recap of successful implementation
• Summary & Benefits

NYC Trends
3
U.S. Census Bureau*• East Harlem has one of
the highest rates of bicycle commuting in New York City
Percent of Workers Commuting by Bicycle*US Census Bureau 2008-2010
Source: *U.S. Census Bureau, American Community Survey, 2008-2010

4
1st Avenue

5
Existing Conditions: 1st Avenue
Bike Lane Frequently Violated by VehiclesBike Lane Frequently Violated by Vehicles
Wide Concrete Roadway,
Long Pedestrian Crossing Distances
Wide Concrete Roadway,
Long Pedestrian Crossing Distances
3 Travel Lanes1 Bus Lane1 Bike Lane
2 Parking Lanes
3 Travel Lanes1 Bus Lane1 Bike Lane
2 Parking Lanes
No Accommodations for Deliveries
No Accommodations for Deliveries
70 Feet70 Feet

First Avenue – Injury Summary 2006-2010Between E. 96th St to E. 125th St
Injury Summary
Source: Injuries: NYS Dept. of Transportation, Fatalities: NYC Dept. of Transportation
Total InjuriesAvg.
Injuries/ Year
Severity Percentile of
BoroCorridors
Pedestrian 127 25.4 75%
Bicyclist 25 5 N/A
Motor Vehicle Occupant 427 85.4 85%
Total 579 115.8 78%
• First Avenue ranks in the top 22% of severe injuries to all users, when compared to all corridors in Manhattan
6

First Avenue: Existing ConditionsE 96th Street to E 125th Street
Existing Conditions
• Three travel lanes
• Curbside parking lanes
• Buffered bike lane
• Offset (SBS) bus lane
7
Location of CountVehicle Volumes*
AM Peak PM Peak
E. 105th to E. 106th 1,465 (7:30a - 8:30a)
1,441(4:00p – 5:00p)
E. 124th to E. 125th 1,357(7:30a – 8:30a)
1,652(3:30p – 4:30p)
Cycling Volume**
E. 101st to E. 102nd 227
*Vehicle Volumes: Average of three consecutive weekdays (Monday-Thursday) taken the week of 4/4/11**Cycling Volumes: One mid-week day between 7:00am – 7:00pm on 5/11/2010
Vehicle & Cycling Counts

Design Treatments
• Mixing Zones – accommodate vehicle/bike turning conflict
• Pedestrian Islands – Shorten pedestrian crossings
• Total protection for cyclists mid-block
• No loss of loading zone space
Mixing Zone
Pedestrian Island
8

First Avenue: Typical DesignE 96th Street to E 125th Street
Protected Bicycle Path
Repurposed Parking SpaceParking Space
Equivalents
(12) Turn Lanes/ Mixing Zones 54
(35) Pedestrian Islands 19
Total Spaces Repurposed 73
Total Existing Parking Spaces (96th – 124th) 515
Percent of Spaces Repurposed 14%
• Swap existing bike lane with existing parking lane
• No reduction in travel lanes
• Mixing Zones9

Planned Roadway Configuration
10First Avenue at E. 6th Street
2nd Avenue

Existing Conditions: 2nd Avenue
Wide Roadway, Long Pedestrian Crossing Distances
Wide Roadway, Long Pedestrian Crossing Distances
No Safe Route for Cyclists Along 2nd Ave No Safe Route for
Cyclists Along 2nd Ave 4 Travel Lanes
1 Peak Period Bus Lane2 Parking Lanes
4 Travel Lanes1 Peak Period Bus Lane
2 Parking Lanes
60 Feet60 Feet

Second Avenue – Injury Summary 2006-2010Between E. 125th St to E. 96th St
Injury Summary
Source: Injuries: NYS Dept. of Transportation, Fatalities: NYC Dept. of Transportation
Total Injuries
Avg.Injuries/
Year
Severity Percentile
of BoroCorridors
Pedestrian 156* 31.2 89%
Bicyclist 38 7.6 N/A
Motor Vehicle Occupant 387 77.4 86%
Total 581 116.2 88%
• Second Avenue ranks in the top 12% of severe injuries to all users when compared to all corridors in Manhattan
13
* 2 Pedestrian Fatalities between 1/1/06 to 11/21/11

Second Avenue: Existing ConditionsE 125th Street to E 96th Street
Existing Conditions
• Four travel lanes
• Curbside parking lanes
• Curbside (SBS) bus lane
14
Location of CountVehicle Volumes*
AM Peak PM Peak
E. 107th to E. 106th 1,855 (7:30a - 8:30a)
1,652(5:00p – 6:00p)
E. 126th to E. 125th 1,671(8:30a – 9:30a)
1,767(4:45p – 5:45p)
Cycling Volume**
E. 101st to E. 102nd 606
*Vehicle Volumes: Average of three consecutive weekdays (Monday-Thursday) taken the week of 4/4/11**Cycling Volumes: One mid-week day between 7:00am – 7:00pm on 5/11/2010
Vehicle & Cycling Counts

Second Avenue: Typical DesignE 125th Street to E 96th Street
Protected Bicycle Path
• Reduction of travel lanes from 4 lanes to 3 lanes
• Mixing Zones
• Same approximate traffic volume as 1st Ave at 23rd St (1,735)
• Has same configuration• 3 travel lanes• bike path• curbside bus lane
Repurposed Parking SpaceParking Spaces
Equivalents
(12) Turn Lanes/ Mixing Zones 56
(31) Pedestrian Islands 13
Total Spaces Repurposed 69
Total Existing Parking Spaces (125th – 96th) 418
Percent of Spaces Repurposed 17% 15

Planned Roadway Configuration
16Second Avenue at St. Marks Place

Current/Proposed Travel Lane Comparison 1st and 2nd Avenues
Summary – Travel Lanes
Avenue & SegmentNumber of Travel Lanes
ChangeCurrent Proposed
1st Avenue: E. 96th to E. 124th 3 3 + 0
2nd Avenue: E. 125th to E. 100th 4 3 + -1
• First Avenue: No change in number of travel lanes
• Second Avenue: Reduction of one travel lane
17
3+ : 3 thru travel lanes with the addition of turn lanes

Current Peak Volumes1st Avenue
Summary – Volume/Lane Comparison
Avenue & Segment Number of Travel Lanes Volume*
1st Avenue: E. Houston to E. 34th 3 1,735 (3:15p – 4:15p)
• 2010 project similar to planned CB11 project, successful with similar peak vehicle volumes
18
Avenue & Segment Planned Numberof Travel Lanes Volume**
1st Avenue: E. 96th to E. 125th 3 1,652(3:30p – 4:30p)
2nd Avenue: E. 125th to E. 100th 3 1,855(7:30a – 8:30a)
CB11: Peak Hour Volume Compared to Proposed Number of Travel Lanes 1st and 2nd Avenues
Peak Hour Vehicle Volumes: Average of three consecutive weekdays (Monday-Thursday) taken the week of 4/4/11* Count taken between E. 22nd St and E. 23rd St, ** Count taken between E. 124th to E.125th St on First Ave, between E. 107th St and E. 106th St on Second Ave
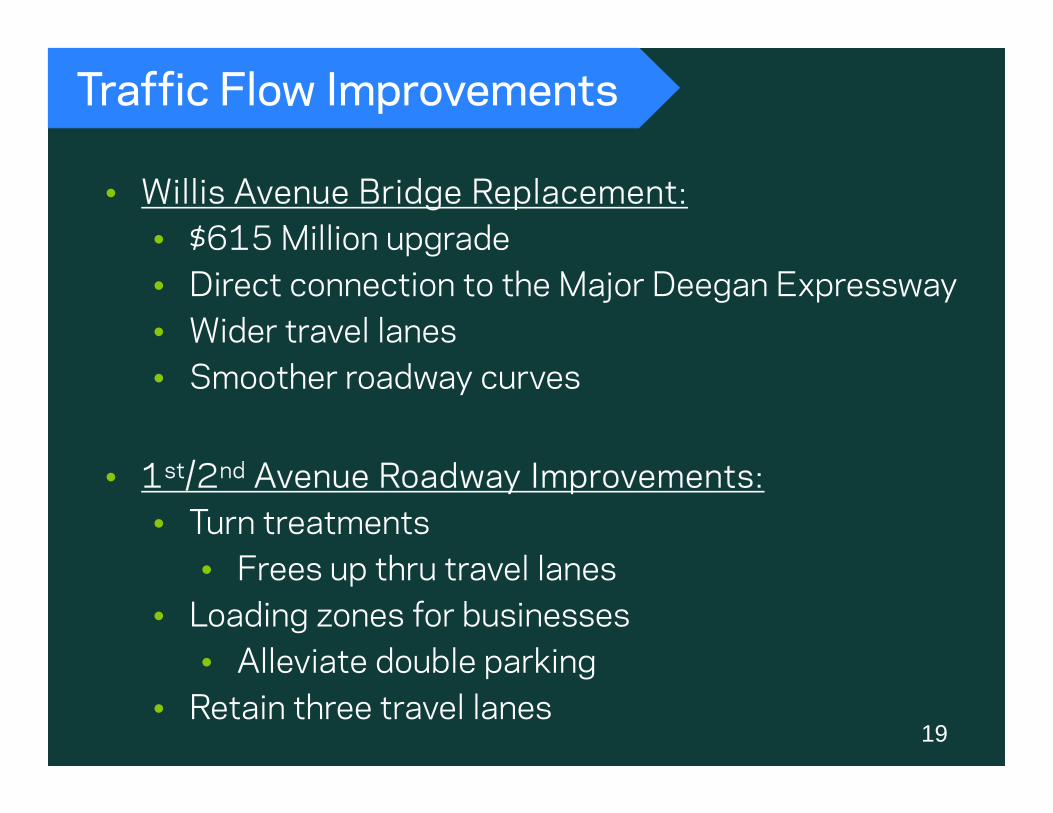
Traffic Flow Improvements
19
• Willis Avenue Bridge Replacement:• $615 Million upgrade• Direct connection to the Major Deegan Expressway• Wider travel lanes• Smoother roadway curves
• 1st/2nd Avenue Roadway Improvements:• Turn treatments
• Frees up thru travel lanes• Loading zones for businesses
• Alleviate double parking• Retain three travel lanes

Summary - Community Outreach
20
• Meetings:• CB11 Transportation Committee 2/2/10• CB11 Transportation Committee 6/9/10• CB11 Transportation Committee 9/6/2011• CB11 Full Board 9/20/11• Businesses 11/9/11• CB11 Transportation Committee 12/6/11
• Flyering• Before CB meetings• Before merchant meeting• Before Select Bus Service Open House
• Business Outreach• Walked through the design with business owners/reps on site• Ongoing community outreach to help mitigate issues and concerns
• Parking/Loading regulation changes• Discussion on metered parking

• Limits: 2010 - Houston St to E 34th St, 2011- E 34th St to E 57th St
• Significant expansion protected bicycle paths
• Installed over 45 pedestrian safety islands
2010 & 2011 Implementation
21
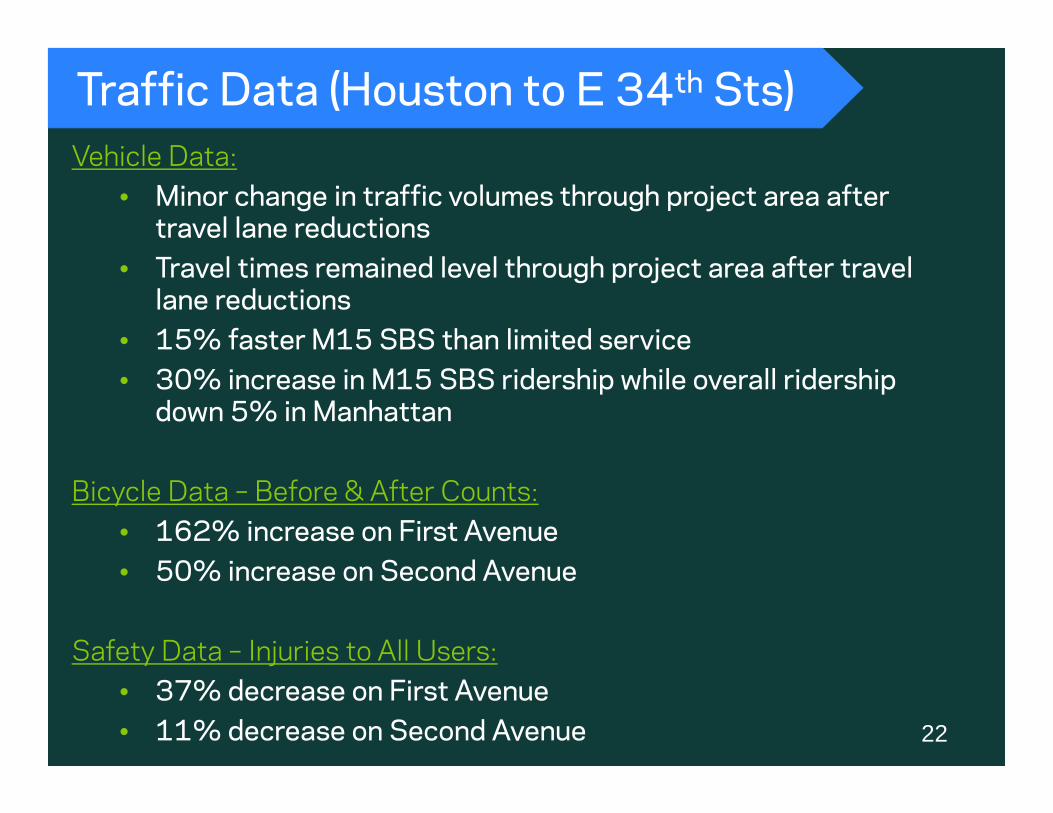
Traffic Data (Houston to E 34th Sts)
22
Vehicle Data:• Minor change in traffic volumes through project area after
travel lane reductions• Travel times remained level through project area after travel
lane reductions• 15% faster M15 SBS than limited service• 30% increase in M15 SBS ridership while overall ridership
down 5% in Manhattan
Bicycle Data – Before & After Counts:• 162% increase on First Avenue• 50% increase on Second Avenue
Safety Data – Injuries to All Users:• 37% decrease on First Avenue• 11% decrease on Second Avenue

Proposal Benefits
23
• Increased safety for all roadway users
• Shorter Pedestrian Crossings – Helps seniors and children
• Greener Streets – Planting beds on pedestrian islands provide more green space
• Convenient delivery zones for businesses
• Establishes Bike Paths – Alternative to bus/car, promotes healthy activity
24
nyc.gov/dot ThankYou
Columbus Ave Islands