FIRST 5 KERN ANNUAL REPORT - files.eric.ed.gov · Kern County, 41 programs are classified in three...
115
ANNUAL REPORT FISCAL YEAR 2015-2016 FIRST 5 KERN Submitted February 1, 2017 Report Prepared by: JIANJUN “JJ” WANG, PH.D. PRINCIPAL INVESTIGATOR
Transcript of FIRST 5 KERN ANNUAL REPORT - files.eric.ed.gov · Kern County, 41 programs are classified in three...

ANNUAL REPORTFISCAL YEAR 2015-2016
FIRST 5 KERN
Submitted February 1, 2017
Report Prepared by: JIANJUN “JJ” WANG, PH.D. PRINCIPAL INVESTIGATOR

Acknowledgements This report is built on support of many colleagues. In particular, the data export and
result confirmation were completed by the evaluation staff of First 5 Kern. An intern from California State University, Bakersfield (CSUB) assisted with the data cleaning. Program and Finance Officers of First 5 Kern clarified information about local service coverage,
budget allocation, and program expenditure. The Communications Officer provided confidentiality training to support the program data collection.
The result aggregation further relied on ongoing assistance of parents, service providers and other key stakeholders of the community during the data collection process. Quarterly reports were reviewed by the CSUB Institutional Review Board to ensure full compliance
of the data gathering to federal, state, and local laws or regulations. In completing the report development, I take this opportunity to thank the following professionals and organizations for their leadership and support:
• Commissioners Larry J. Rhoades (Chair), Al Sandrini (Chair), Dena Murphy
(Treasurer), Sam Aunai, Claudia Jonah (Secretary), Mike Maggard, Jennie Sill, Rick Robles (Vice Chair), William Walker, and Lucinda asson.
• Past Commissioner Zack Scrivner.
• First 5 Kern Technical Advisory Committee (TAC). • First 5 Kern Commission staff:
• Roland Maier, Executive Director
• Kathy Ives, Chief Finance Officer • Sharon Powell, Administrative Assistant • Anastasia Lester, Program Officer
• Paula De La Riva-Barrera, Program Officer • Wilknica Jefferson, Program Officer • Theresa Ortiz, Senior Research Analyst
• Diana Navarro, Research Associate • Crystal Gardner, Finance Specialist • Charlene McNama, Administrative Finance Specialist
• Patti Taylor, Senior Finance Officer • Jan St Pierre, Communications Officer.
• The CSUB Institutional Review Board led by Drs. Roseanna McCleary, Isabel
Sumaya, and Steve Suter. The TAC members are recognized in Appendix B of this report. The alternate commission
members are listed in Exhibit 1. While acknowledging their indispensable assistance, I conducted the data analyses and shall be fully responsible for any inaccuracies in this report.
Jianjun “JJ” Wang, Ph.D.
Professor of Research Design and Statistics
Principal Investigator
ii
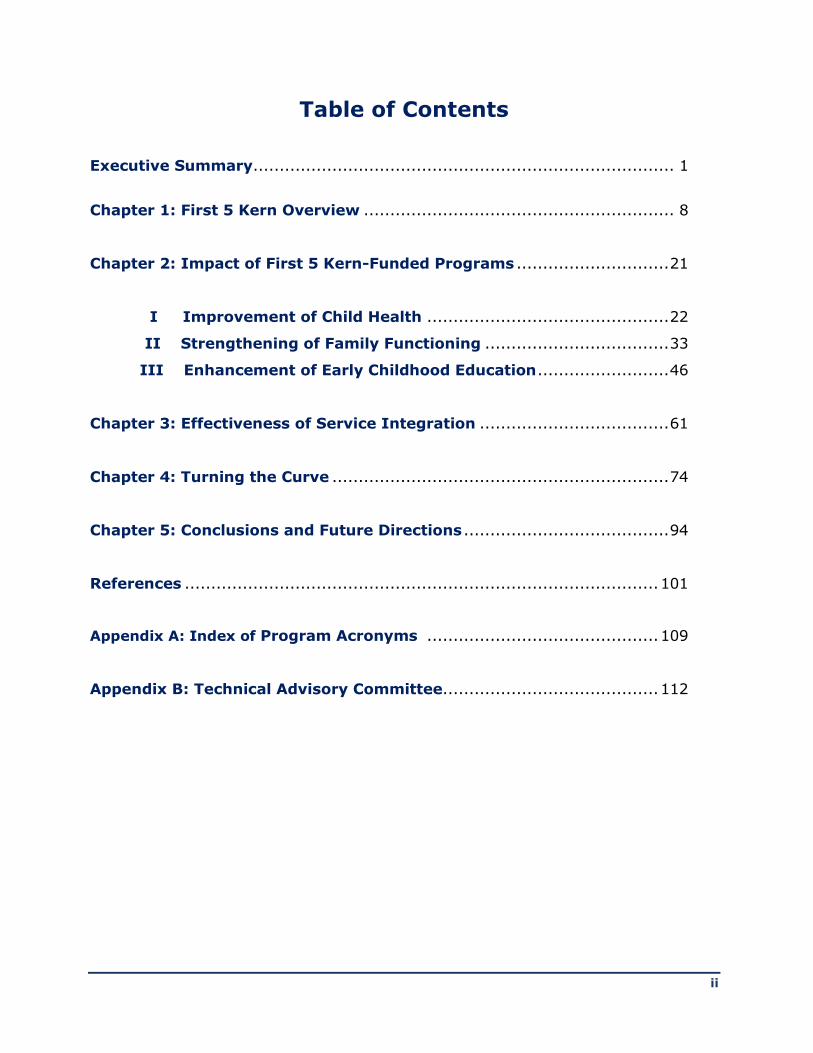
Table of Contents
Executive Summary ................................................................................ 1
Chapter 1: First 5 Kern Overview ........................................................... 8
Chapter 2: Impact of First 5 Kern-Funded Programs ............................. 21
I Improvement of Child Health .............................................. 22
II Strengthening of Family Functioning ................................... 33
III Enhancement of Early Childhood Education ......................... 46
Chapter 3: Effectiveness of Service Integration .................................... 61
Chapter 4: Turning the Curve ................................................................ 74
Chapter 5: Conclusions and Future Directions ....................................... 94
References .......................................................................................... 101
Appendix A: Index of Program Acronyms ............................................ 109
Appendix B: Technical Advisory Committee......................................... 112
1
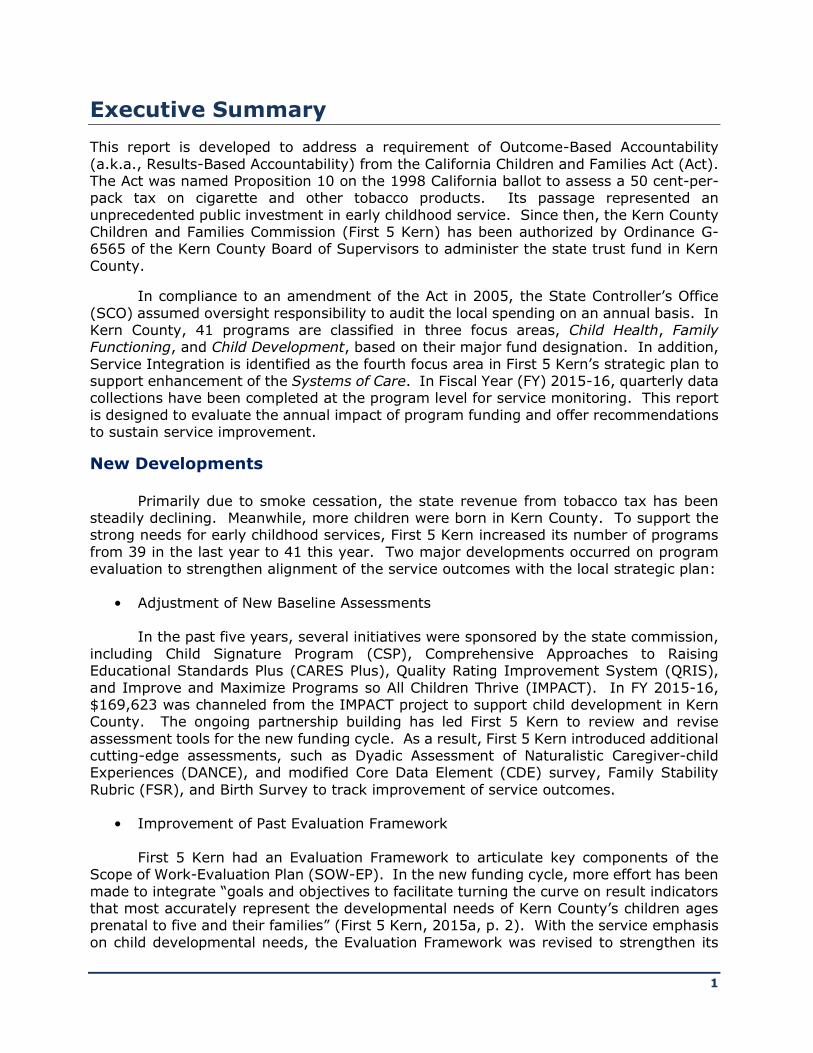
Executive Summary
This report is developed to address a requirement of Outcome-Based Accountability
(a.k.a., Results-Based Accountability) from the California Children and Families Act (Act). The Act was named Proposition 10 on the 1998 California ballot to assess a 50 cent-per-pack tax on cigarette and other tobacco products. Its passage represented an
unprecedented public investment in early childhood service. Since then, the Kern County Children and Families Commission (First 5 Kern) has been authorized by Ordinance G-6565 of the Kern County Board of Supervisors to administer the state trust fund in Kern
County.
In compliance to an amendment of the Act in 2005, the State Controller’s Office
(SCO) assumed oversight responsibility to audit the local spending on an annual basis. In Kern County, 41 programs are classified in three focus areas, Child Health, Family Functioning, and Child Development, based on their major fund designation. In addition,
Service Integration is identified as the fourth focus area in First 5 Kern’s strategic plan to support enhancement of the Systems of Care. In Fiscal Year (FY) 2015-16, quarterly data collections have been completed at the program level for service monitoring. This report
is designed to evaluate the annual impact of program funding and offer recommendations to sustain service improvement.
New Developments Primarily due to smoke cessation, the state revenue from tobacco tax has been steadily declining. Meanwhile, more children were born in Kern County. To support the strong needs for early childhood services, First 5 Kern increased its number of programs
from 39 in the last year to 41 this year. Two major developments occurred on program evaluation to strengthen alignment of the service outcomes with the local strategic plan:
• Adjustment of New Baseline Assessments In the past five years, several initiatives were sponsored by the state commission,
including Child Signature Program (CSP), Comprehensive Approaches to Raising Educational Standards Plus (CARES Plus), Quality Rating Improvement System (QRIS),
and Improve and Maximize Programs so All Children Thrive (IMPACT). In FY 2015-16, $169,623 was channeled from the IMPACT project to support child development in Kern County. The ongoing partnership building has led First 5 Kern to review and revise
assessment tools for the new funding cycle. As a result, First 5 Kern introduced additional cutting-edge assessments, such as Dyadic Assessment of Naturalistic Caregiver-child Experiences (DANCE), and modified Core Data Element (CDE) survey, Family Stability
Rubric (FSR), and Birth Survey to track improvement of service outcomes.
• Improvement of Past Evaluation Framework
First 5 Kern had an Evaluation Framework to articulate key components of the
Scope of Work-Evaluation Plan (SOW-EP). In the new funding cycle, more effort has been
made to integrate “goals and objectives to facilitate turning the curve on result indicators that most accurately represent the developmental needs of Kern County’s children ages prenatal to five and their families” (First 5 Kern, 2015a, p. 2). With the service emphasis
on child developmental needs, the Evaluation Framework was revised to strengthen its

FIRST 5 KERN ANNUAL REPORT FISCAL YEAR 2015-2016
2
focus on “thriving children and families” (Exhibit 2 of Chapter 1). This change also echoed state commission’s call for “Building on the Momentum Surrounding Early Childhood
Education” (First 5 California, 2015a, cover page).
In combination, First 5 Kern started this funding cycle with reconfiguration of the
assessment system at the program level and revision of the Evaluation Framework at the commission level. Built on the result tracking, common indicators are identified in this report to monitor improvement of service outcomes on the time dimension.
Progress Between Adjacent Years
In comparison to the last year, the positive impact in FY 2015-16 is revealed on 14
fronts across multiple programs:
1. Improvement of Family Conditions
Clients of First 5 Kern-funded programs reported whether their housing conditions were conducive to child growth. Twenty-four out of 275 families had a non-conducive setting upon their entry in nine programs. Within six
months, the number was reduced to seven.
2. Fulfilment of Childcare Needs
At program entry, 11 service providers identified 39 families with unmet
childcare needs. Within six months of program support for 305 families, the
number plunged to six.
3. Enhancement of Service Outreach
At the beginning of FY 2015-16, 88 families were identified for having unmet
transportation needs across 356 families in 12 programs. Within the first
six months, the number of families was reduced to 29.
4. Expansion of Healthcare Coverage
The rate of health insurance coverage increased from 96.7% in the last year
to 98.3% this year across 13 programs. The positive change impacted 1,347
families. Two programs demonstrated 100% coverage for 68 families.
5. Implementation of Well-Child Checkup
The percent of families having annual well-child checkup increased from
78.9% in the last year to 85.5% this year in 12 programs. This positive change impacted a total of 569 families.
6. Monitoring of Dental Care
Twenty-one programs tracked the number of families with child dental visits
in the last 12 months. The average rate climbed from 9.4% in the last year
FIRST 5 KERN ANNUAL REPORT FISCAL YEAR 2015-2016
3
to 51.8% this year. In FY 2015-16, there were 1,123 families served by these programs in Kern County.
7. Fulfillment of Immunization Requirements
The rate of children receiving all immunizations increased from 83.5% in the last year to 87.9% this year across 11 programs. The trend data included information from 1,465 families.
8. Improvement of Preschool Attendance
Ten programs showed an increase of regular preschool attendance from 17.9% in the last year to 24.2% this year. These service providers supported 1,329 families in FY 2015-16.
9. Enhancement of Reading Literacy
The number of children being read to twice or more times per week was tracked for 604 families in 14 programs. The rate increased from 58.9% in the last year to 70.2% this year.
10. Expansion of Prenatal Care
The percent of mothers receiving prenatal care was raised from 98.1% in
the last year to 99.3% this year across 12 programs that served 539
families. Eight of the programs reached 100% in FY 2015-16.
11. Reduction of Prenatal Smoking
The rate of prenatal smoking was reduced from 14.0% in the last year to
8.0% this year in 14 programs. The results were derived from the trend of
1,636 families that received early childhood services this year.
12. Increase of Full-Term Pregnancy
The percent of full-term pregnancy increased from 86.1% in the last year to
93.1% this year in 17 programs. A total of 1,769 families received services
from these programs in FY 2015-16.
13. Alleviation of Low-Birth Weight
The rate of low-birth weight decreased from 12.4% in the last year to 7.4%
this year in 16 programs that offered services to 909 families in Kern County.
14. Expansion of Breastfeeding
The percent of mothers engaging in breastfeeding increased from 66.5% in the last year to 71.8% this year across 14 programs that served 1,605 families.

FIRST 5 KERN ANNUAL REPORT FISCAL YEAR 2015-2016
4
In addition to the trend examination, First 5 Kern disseminated its evaluation findings in nationally referred publications. In Child Health, two articles have been peer-
reviewed and accepted for publication in Ambulatory Surgery, the official journal of the International Association for Ambulatory Surgery. Another article is in press in Evaluation and Program Planning, a premier journal on program evaluation. Its local evaluation
report was peer-reviewed and approved for dissemination by the Education Resources Information Center (ERIC) of the U.S. Department of Education (ERIC Reproduction Service No. 564008).
Summary of Evaluation Activities
Service outcome identifications depend on the evaluation mechanism. During FY 2015-16, evaluation activities of First 5 Kern were illustrated in nine fronts:
1. Produced presentations and/or reports for different stakeholders
The State Commission (First 5 Kern annual report to the state in Fall, 2015) Kern County Board of Supervisors (a televised presentation on 10/13/2015) The First 5 Kern Commission (an annual report presentation on 2/3/2016)
The local community (First 5 Kern Newsletter on March, 2016) California State University, Bakersfield Institutional Review Board (IRB)
(presented on 10/9/2015, 1/22/2016, 4/15/2016, & 6/8/2016).
2. Updated evaluation tools for the new funding cycle
The consent form was revised and updated in Fall 2015 and Winter 2016 following IRB guidance
The DANCE instrument was employed by the Nurse-Family Partnership (NFP)
program The CDE survey was revised for data gathering across 29 programs The FSR instrument was updated for tracking family conditions in 16
programs Child Assessment-Summer Bridge (CASB) was revised for 12 programs The Birth Survey was revised for information collection from 29 programs
New client surveys were implemented for Guardianship Caregiver and Domestic Violence Reduction projects.
3. Adjusted Emphases of the First 5 Kern Evaluation Framework
An evaluation framework from the last funding cycle included six components: strategic plan, system accountability, commission leadership, contractor support, evaluation design, and evaluator responsibility. While
these components were retained as core components, the new evaluation framework has allocated its center on “thriving children and families” to conform to results-based accountability.
4. Created a Cost-Benefit Analysis (CBA) proposal to identify funding priorities
A CBA proposal was reviewed and approved by the county commission to construct three deliverables: (a) A comprehensive CBA report, which
FIRST 5 KERN ANNUAL REPORT FISCAL YEAR 2015-2016
5
provides a detailed CBA of First 5 Kern programs; (b) A condensed CBA report, that summarizes the findings of the project for community
stakeholders; (c) A one-page foldable brochure, which highlights the accomplishments of First 5 Kern based on the CBA and represents a “sell sheet” at certain informational events.
5. Implemented a new data management system to track program service deliveries
Staff provided training to support data gathering and reporting in the Persimmony Data Solutions system.
6. Maintained a secured data portal on a Blackboard platform to share and archive evaluation data for result dissemination
A password-protected setting has been maintained in two Blackboard sessions for timely transfer of individually-identifiable data between internal and external evaluators.
7. Continued professional development in evaluation data analyses
The evaluation team recruited new tools, such as NodeXL, STATA, and HLM, for network and statistical data analyses
First 5 Kern renewed a software license for Office of Statewide Health Planning and Development (OSHPD) data access
Staff provided Ages and Stages Questionnaire–Third Edition (ASQ-3)
training to community members.
8. Collected common assessment data across multiple programs
ASQ-3 data were gathered from 20 programs for different age groups Adult-Adolescent Parenting Inventory-2 data were collected from six
programs CASB data were accumulated from 12 programs Desired Results Developmental Profile-2015 data were gathered from
Infants/Toddlers, Preschoolers, and children with disabilities Parenting Survey data were collected by six programs.
9. Gathered program-specific data in Child Health, Family Functioning, and Child Development
Eyberg Child Behavior Inventory (ECBI), Sutter-Eyberg Student Behavior Inventory-Revised (SESBIR), and Be Choosy, Be Healthy data were collected in Child Health
North Carolina Family Assessment Scale for General Services (NCFAS-G) data were gathered in Family Functioning
Ready-to-Start Scorecard data were obtained from Child Development.
FIRST 5 KERN ANNUAL REPORT FISCAL YEAR 2015-2016
6
Highlights of Evaluation Findings
Exemplary Programs for State Reporting
The state commission mandates three components for annual reporting: (1) Most Recent Compelling Service Outcome, (2) Benchmark/Baseline Data, and (3) Outcome Measurement Tool (First 5 California, 2015b). In examining the evaluation findings across
service providers, First 5 Kern identified three programs to illustrate exemplary local services in its annual report to the state:
In Improved Child Health, NFP was highlighted for supporting low-income, first-time mothers during prenatal and infant care periods. Nurse visits are scheduled in sequential steps: (1) weekly during the first month of enrollment, (2) every other week
until birth, (3) weekly during the first six weeks after delivery, (4) every other week until baby is 21 months, and (5) monthly during months 22-24. The regular home-visits addressed topics of newborn care, parenting skills, successful life with baby, referral
assistance, and healthy pregnancy. Seventy-three children in Bakersfield, Lamont, Ridgecrest, Rosamond, Shafter, and Wasco benefited from services in FY 2015-16. Communications occurred in both English and Spanish to ensure proper parental
engagement. As a result, the majority of children (71.88%) were born full-term. Over three quarters (75.01%) of the infants had a healthy birth weight.
In Improved Family Functioning, Guardianship Caregiver Project (GCP) assisted caregivers to prevent abuse or neglect of children ages 0-5 through establishment of guardianship protection. The comprehensive services included: (1) representation of
prospective caregivers in preparing and filing guardianship petitions; (2) responding to objections; (3) planning for mediations and guardianship hearings, and (4) completion of post-hearing letters and orders. In FY 2015-16, targets were set for GCP to serve 180
guardians and 200 children. GCP served 192 guardians and 258 children, exceeding its goals by 107% and 129%, respectfully. The compelling outcome of service expansion is
demonstrated by the clients’ increase in knowledge “about the duties, rights, and responsibilities of legal guardianship” from the GCP Client Survey.
In Improved Child Development, Ready to Start (R2S) offered a summer bridge program to enhance social confidence and academic preparation of four-year-old children in a five-week setting. The program addresses specific learning outcomes in object
counting, number recognition, shape identification, size arrangement, calendar planning, alphabet differentiation, color sorting and other supportive and social skills. In FY 2015-16, the R2S learning activities raised the level of total mastery percentage from 53.51%
to 85.84% across math, reading, and social skill domains for 532 preschoolers in four school districts. More importantly, the learning outcome was achieved in the first year of First 5 Kern’s new funding cycle with a decrease in program funding and an increase in
program cost.
Data Tracking on Result Improvement In FY 2015-16, pretest and posttest findings are tracked to evaluate benefits of
service deliveries across First 5 Kern-funded programs. In Child Health, Be Choosy, Be
Healthy (BCBH) data were collected from 56 parents in the Bakersfield Adult School-Healthy Literacy Program (HLP). Participants reported significant improvement of

FIRST 5 KERN ANNUAL REPORT FISCAL YEAR 2015-2016
7
program knowledge during a period before and after the HLP workshops. Meanwhile, Richardson Special Needs Collaborative (RSNC) continued its mechanism of result
triangulation from the previous year. Both SESBIR and ECBI data showed significant reduction of child behavior problems in RSNC.
In Family Functioning, 93 participants were tracked by three programs to assess the impact of court-mandated, parent education classes. The pretest and posttest results from Adult-Adolescent Parenting Inventory-2 (AAPI-2) data showed a significant change
of all five parent beliefs pertaining to child maltreatment. Differential Response (DR) collected data from 592 families using NCFAS-G. The results illustrated significant improvements in family environment, parental capabilities, family interactions, family
safety, child wellbeing, social/community life, self-sufficiency, and family health. Furthermore, GCP and Domestic Violence Reduction Project (DVRP) documented a trend pattern from client surveys. A total of 114 respondents “strongly agreed” or “agreed” that
children lived in a safe environment after the program delivery of legal support. In Child Development, Women's Shelter Network (WSN) tracked Ages and Stages
Questionnaire-Social Emotional (ASQ-SE) outcomes from screening emotional difficulties of children ages 6-60 months. The data indicated performance of 39 children significantly below their age-specific at-risk thresholds (ART). At the preschool level, 244 children
from three programs demonstrated significant improvements in important domains of Motor, Social Emotional, Communication, Self-Help, Scientific Inquiry, and Cognitive
development according to pretest and posttest results from Child Assessment-Summer Bridge. Meanwhile, 20 programs showed development of 1,464 children significantly above the corresponding age-specific thresholds in Communication, Gross Motor, Fine
Motor, Problem Solving, and Personal-Social domains of the ASQ-3 assessment. Altogether, three approaches were taken to conform to the Statewide Evaluation
Framework (First 5 California, 2005) on information triangulation: (1) descriptive data were gathered to identify one exemplary program in each focus area, (2) assessment data were aggregated from pretest and posttest settings to evaluate the program impacts on
multiple indicators, and (3) trend data are examined across service providers to configure a “road map” of program improvement on the time dimension. While professional guidance was derived from the strategic plan to enhance program effectiveness, the
ultimate focus of this report is placed on indicators of thriving children and their families in Kern County.
To streamline the result presentation, an overview of First 5 Kern’s vision, mission, and partnership building is presented in Chapter 1. Based on the program affiliation, service outcomes are examined across three focus areas of Child Health, Family
Functioning, and Child Development in Chapter 2. In Chapter 3, interview data were aggregated across programs to evaluate effectiveness of partnership building the fourth focus area, Systems of Care. To sustain program improvement, trend data have been
gathered on the time dimension from CDE surveys and FSR assessments to compare common indicators between adjacent years (Chapter 4). This report ends with a Conclusion and Future Directions chapter to highlight current exemplary practices, review
past recommendations, and adduce new recommendations to maintain the momentum of ongoing progress in this funding cycle (see Chapter 5).
FIRST 5 KERN ANNUAL REPORT FISCAL YEAR 2015-2016
8
Chapter 1: First 5 Kern Overview
After the passage of Proposition 10 in 1998, California voters rejected Proposition 86 in 2006 and Proposition 29 in 2012 for additional tobacco tax increase. The stillness was
interrupted in FY 2015-16 when the state legislature passed a bill to raise the minimum age of tobacco consumption from 18 to 21, making California the second state in the U.S. to implement this regulation. An early analysis indicated the impact of this policy on
reducing the state tax revenue (Bergal, 2015). Therefore, First 5 Kern encountered an unexpected challenge to sustain local services that were strategically planned for the next five years prior to this legislative action.
According to the state statute, “county commissions shall receive the portion of the total moneys available to all county commissions equal to the percentage of the number
of births recorded in the relevant county” (Proposition 10, p. 8). Across the state, “Birth rates have been declining nearly every year for the last 20 years” (Governor’s Budget Office, 2016, p. 139). However, Kern County is predicted to increase its child population
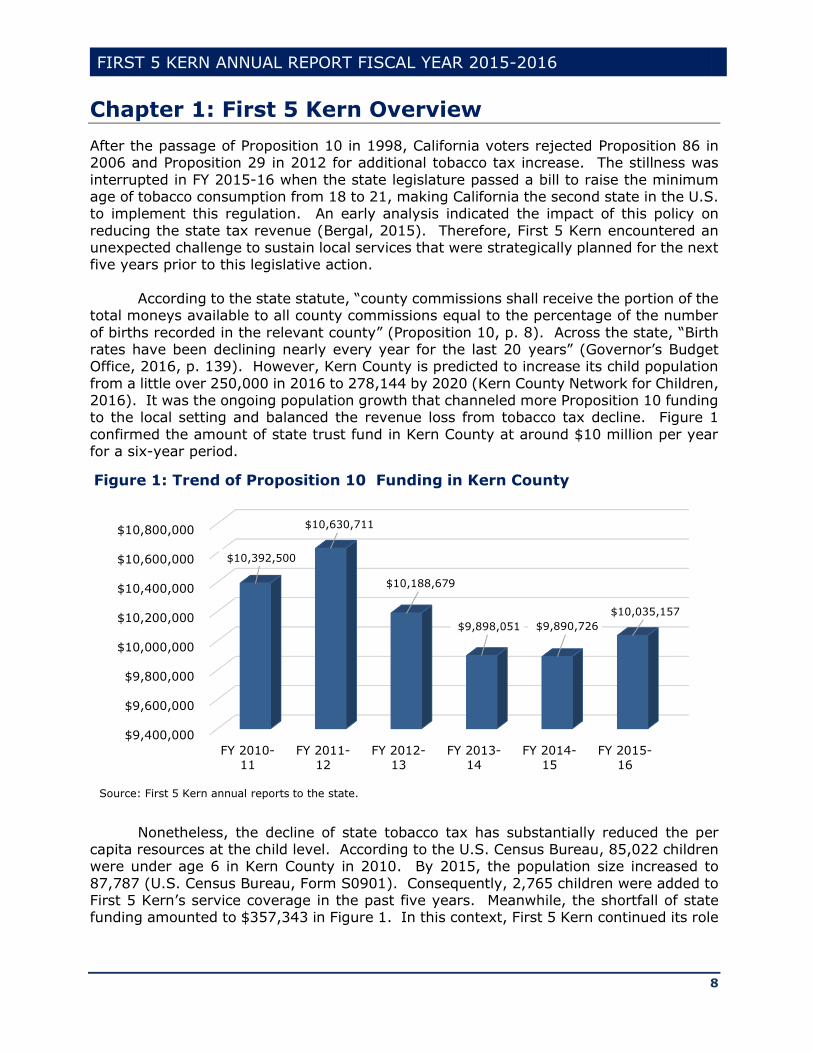
from a little over 250,000 in 2016 to 278,144 by 2020 (Kern County Network for Children, 2016). It was the ongoing population growth that channeled more Proposition 10 funding to the local setting and balanced the revenue loss from tobacco tax decline. Figure 1
confirmed the amount of state trust fund in Kern County at around $10 million per year for a six-year period.
Nonetheless, the decline of state tobacco tax has substantially reduced the per capita resources at the child level. According to the U.S. Census Bureau, 85,022 children were under age 6 in Kern County in 2010. By 2015, the population size increased to
87,787 (U.S. Census Bureau, Form S0901). Consequently, 2,765 children were added to First 5 Kern’s service coverage in the past five years. Meanwhile, the shortfall of state funding amounted to $357,343 in Figure 1. In this context, First 5 Kern continued its role
$9,400,000
$9,600,000
$9,800,000
$10,000,000
$10,200,000
$10,400,000
$10,600,000
$10,800,000
FY 2010-
11
FY 2011-
12
FY 2012-
13
FY 2013-
14
FY 2014-
15
FY 2015-
16
$10,392,500
$10,630,711
$10,188,679
$9,898,051 $9,890,726
$10,035,157
Figure 1: Trend of Proposition 10 Funding in Kern County
Source: First 5 Kern annual reports to the state.

FIRST 5 KERN ANNUAL REPORT FISCAL YEAR 2015-2016
9
of collaborating with local service providers to offer more programs with less resources in FY 2015-16.
It was stipulated in First 5 Kern’s Strategic Plan that “Integration of Services
ensures collaboration with other agencies, organizations and entities with similar goals
and objectives to enhance the overall efficiency of provider systems” (First 5 Kern, 2015a, p. 6). The broad-based partnership building was led by the County Commission that included elected officials, service providers, program administrators, community
volunteers, and First 5 Kern advocates (Exhibit 1). Appointments of the Commissioners followed the California Health and Safety Code (Section 130140), i.e., “The county commission shall be appointed by the board of supervisors and shall consist of at least
five but not more than nine members.”
Exhibit 1: First 5 Kern Commission Members
Commissioner Affiliation
Larry J. Rhoades (Chair) Retired Kern County Administrator
Al Sandrini (Chair) Retired School District Superintendent
Dena Murphy (Treasurer) Director, Kern County Human Service Department
Claudia Jonah, M.D (Secretary) Public Health Officer, Kern County Public Health Services
Sam Aunai Dean of Instruction, Porterville College
Mike Maggard*, 3rd District Supervisor, Kern County Board of Supervisors
Jennie Sill Children’s System of Health Officer, Kern County
Department of Public Health
Rick Robles (Vice Chair) Superintendent, Lamont School District
Zack Scrivner*, 2nd District Supervisor, Kern County Board of Supervisors
William Walker* Director, Department of Mental Health
Lucinda Wasson* Retired Kern County Nurse Director and Community
Advocate
Alternate Members
Jennie Sill* Administrator, Kern County Children’s System of Care
Michelle Curioso Director of Nursing, Kern County Public Health Services
David Couch, 3rd District Supervisor, Kern County Board of Supervisors
Antanette Reed* Assistant Director, Child Protective Services of Kern
County *Served part of the fiscal year.
Based on the Bylaws of First 5 Kern, Commissioners are assigned in five committees, Technical Advisory Committee (TAC), Executive Committee (EC), Budget and Finance Committee (BFC), and Personnel Committee (PC). More specifically, TAC has 18
representatives from the local community to advise on all matters relevant or useful to fulfillment of the Commission responsibilities. EC is composed of the Commission Chairperson, the Vice-Chairperson, the Secretary, and the Treasurer to act on any matters
pertaining to First 5 Kern operation. BFC is led by the Treasurer and three Commissioners to guide the Commission and the Executive Director on budgetary and financial planning. PC is supervised by the Commission Vice-Chairperson and three Commissioners to attend
all personnel matters, including employment, evaluation, compensation, and discipline of Commission employees. The EC, BFC, and PC memberships are publicized in the agenda of each Commission meeting. TAC members are recognized in Appendix B of this report.
FIRST 5 KERN ANNUAL REPORT FISCAL YEAR 2015-2016
10
Profile of Kern County Children
As the third largest county in California by land area, Kern County is scattered across valley, mountain, and desert areas. Although a model of Outcome-Based
Accountability was adopted by Proposition 10 to promote local creativity, it took more resources to deliver services in remote areas (Waller, 2005). As Robison-Frankhouser (2003) acknowledged,
In their efforts to deliver these programs to Kern County families, the KCCFC [First 5 Kern] faced geographical and demographic challenges within Kern County. The
challenge of mountain ranges that surround the valley region and also isolate the desert areas limited families’ access to needed services. Low-income and/or LEP [Limited English Proficiency] families often struggled to reach services that were
too far from their homes. Too often, they found themselves isolated from medical care and child-care services. (p. 6)
Although the fund allocation from Proposition 10 was based on the proportion of live births, it did not consider an extra cost to deliver services in hard-to-reach communities. Therefore, First 5 Kern has been more frugal than other county commissions to support
service outreach across a land area as large as the state of New Jersey. The vast land availability also offered extensive spaces for housing development.
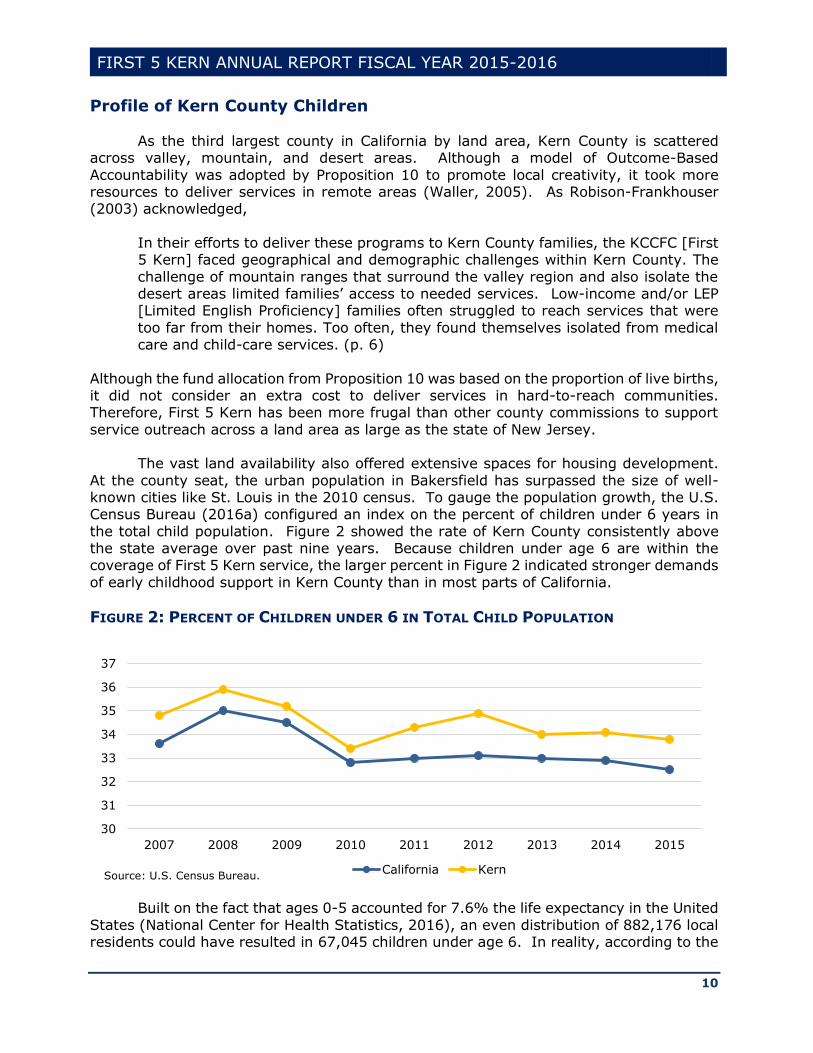
At the county seat, the urban population in Bakersfield has surpassed the size of well-known cities like St. Louis in the 2010 census. To gauge the population growth, the U.S. Census Bureau (2016a) configured an index on the percent of children under 6 years in
the total child population. Figure 2 showed the rate of Kern County consistently above the state average over past nine years. Because children under age 6 are within the coverage of First 5 Kern service, the larger percent in Figure 2 indicated stronger demands
of early childhood support in Kern County than in most parts of California.
FIGURE 2: PERCENT OF CHILDREN UNDER 6 IN TOTAL CHILD POPULATION
Built on the fact that ages 0-5 accounted for 7.6% the life expectancy in the United
States (National Center for Health Statistics, 2016), an even distribution of 882,176 local residents could have resulted in 67,045 children under age 6. In reality, according to the
30
31
32
33
34
35
36
37
2007 2008 2009 2010 2011 2012 2013 2014 2015
California KernSource: U.S. Census Bureau.
FIRST 5 KERN ANNUAL REPORT FISCAL YEAR 2015-2016
11
U.S. Census Bureau (2016b), the county population had 87,787 children eligible for First 5 Kern support in 2015, accounting for nearly 10% of the local population. Researchers
identified a high rate of minority newborns as a major factor behind the expansion of young child population in recent years (American Institutes for Research, 2012).
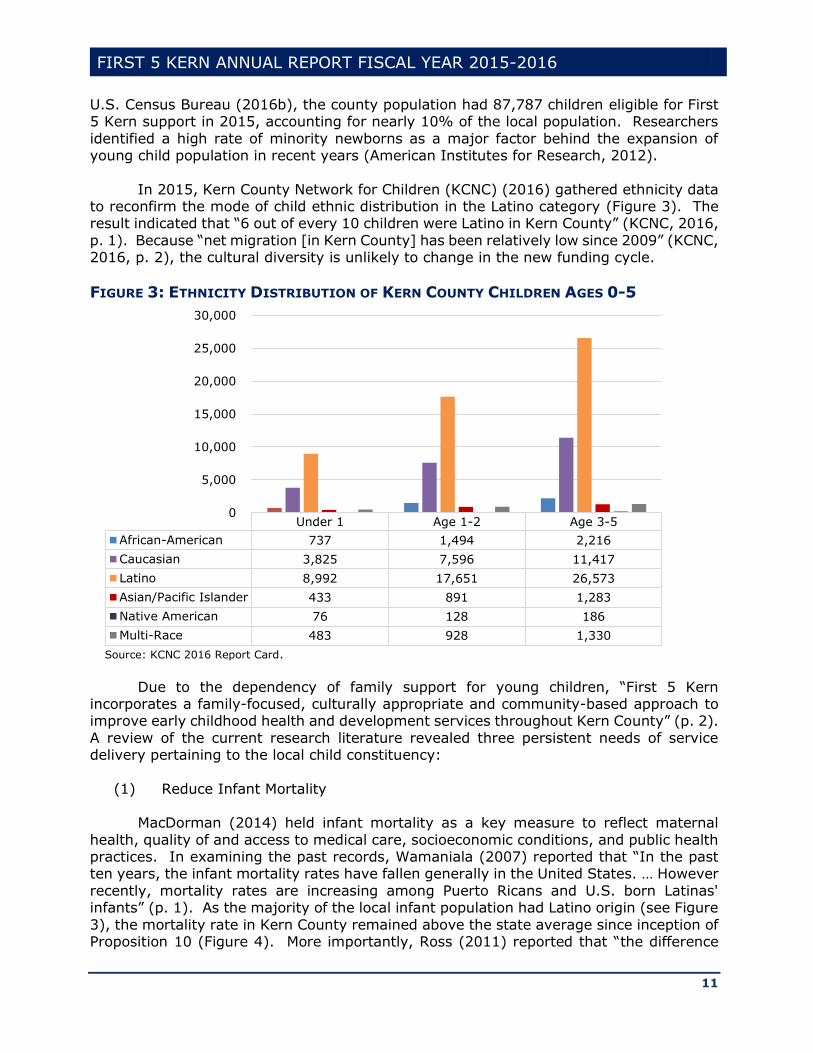
In 2015, Kern County Network for Children (KCNC) (2016) gathered ethnicity data to reconfirm the mode of child ethnic distribution in the Latino category (Figure 3). The result indicated that “6 out of every 10 children were Latino in Kern County” (KCNC, 2016,
p. 1). Because “net migration [in Kern County] has been relatively low since 2009” (KCNC, 2016, p. 2), the cultural diversity is unlikely to change in the new funding cycle.
FIGURE 3: ETHNICITY DISTRIBUTION OF KERN COUNTY CHILDREN AGES 0-5
Source: KCNC 2016 Report Card.
Due to the dependency of family support for young children, “First 5 Kern incorporates a family-focused, culturally appropriate and community-based approach to improve early childhood health and development services throughout Kern County” (p. 2).
A review of the current research literature revealed three persistent needs of service delivery pertaining to the local child constituency:
(1) Reduce Infant Mortality
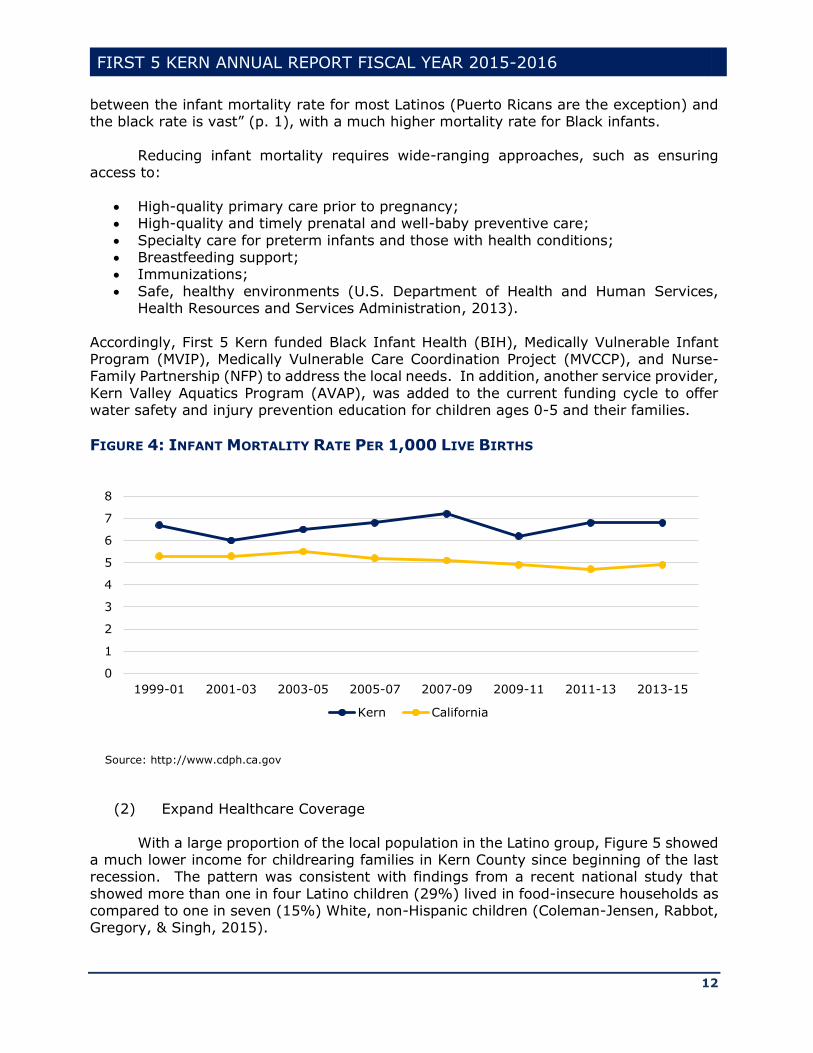
MacDorman (2014) held infant mortality as a key measure to reflect maternal
health, quality of and access to medical care, socioeconomic conditions, and public health practices. In examining the past records, Wamaniala (2007) reported that “In the past ten years, the infant mortality rates have fallen generally in the United States. … However
recently, mortality rates are increasing among Puerto Ricans and U.S. born Latinas' infants” (p. 1). As the majority of the local infant population had Latino origin (see Figure
3), the mortality rate in Kern County remained above the state average since inception of Proposition 10 (Figure 4). More importantly, Ross (2011) reported that “the difference
Under 1 Age 1-2 Age 3-5
African-American 737 1,494 2,216
Caucasian 3,825 7,596 11,417
Latino 8,992 17,651 26,573
Asian/Pacific Islander 433 891 1,283
Native American 76 128 186
Multi-Race 483 928 1,330
0
5,000
10,000
15,000
20,000
25,000
30,000
FIRST 5 KERN ANNUAL REPORT FISCAL YEAR 2015-2016
12
between the infant mortality rate for most Latinos (Puerto Ricans are the exception) and the black rate is vast” (p. 1), with a much higher mortality rate for Black infants.
Reducing infant mortality requires wide-ranging approaches, such as ensuring
access to:
High-quality primary care prior to pregnancy; High-quality and timely prenatal and well-baby preventive care;
Specialty care for preterm infants and those with health conditions; Breastfeeding support; Immunizations;
Safe, healthy environments (U.S. Department of Health and Human Services, Health Resources and Services Administration, 2013).
Accordingly, First 5 Kern funded Black Infant Health (BIH), Medically Vulnerable Infant Program (MVIP), Medically Vulnerable Care Coordination Project (MVCCP), and Nurse-Family Partnership (NFP) to address the local needs. In addition, another service provider,
Kern Valley Aquatics Program (AVAP), was added to the current funding cycle to offer water safety and injury prevention education for children ages 0-5 and their families.
FIGURE 4: INFANT MORTALITY RATE PER 1,000 LIVE BIRTHS
Source: http://www.cdph.ca.gov
(2) Expand Healthcare Coverage
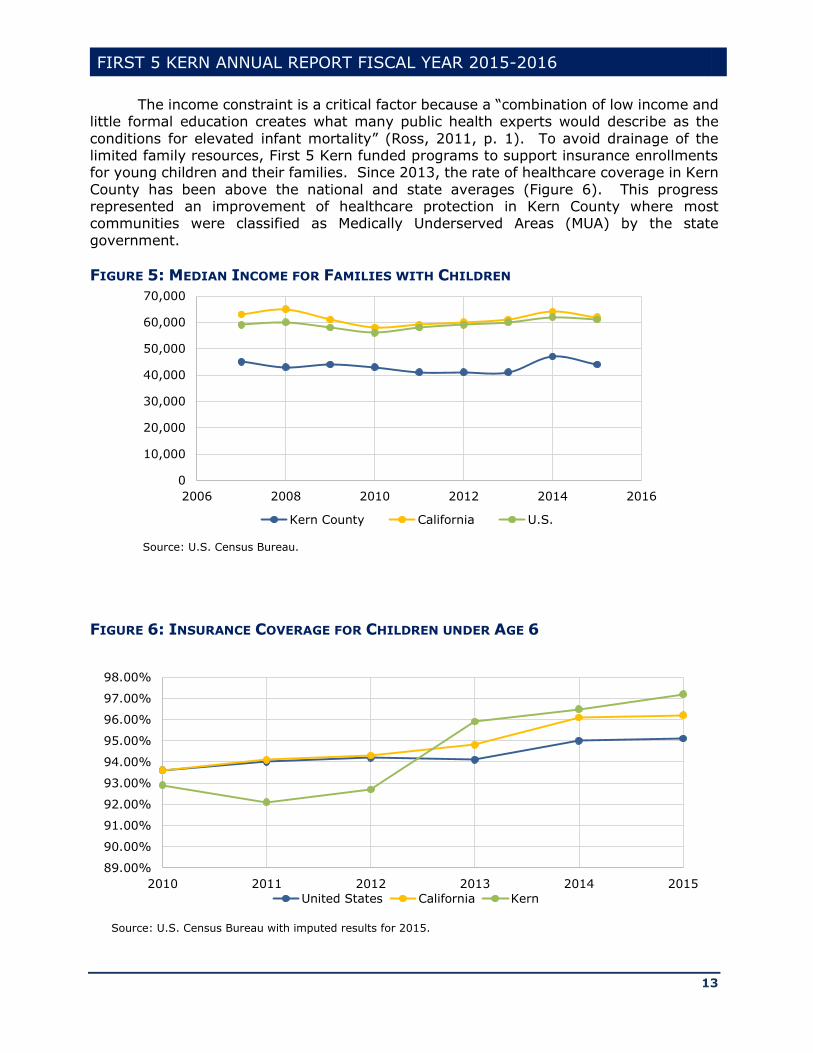
With a large proportion of the local population in the Latino group, Figure 5 showed a much lower income for childrearing families in Kern County since beginning of the last recession. The pattern was consistent with findings from a recent national study that
showed more than one in four Latino children (29%) lived in food-insecure households as compared to one in seven (15%) White, non-Hispanic children (Coleman-Jensen, Rabbot, Gregory, & Singh, 2015).
0
1
2
3
4
5
6
7
8
1999-01 2001-03 2003-05 2005-07 2007-09 2009-11 2011-13 2013-15
Kern California
FIRST 5 KERN ANNUAL REPORT FISCAL YEAR 2015-2016
13
The income constraint is a critical factor because a “combination of low income and little formal education creates what many public health experts would describe as the
conditions for elevated infant mortality” (Ross, 2011, p. 1). To avoid drainage of the limited family resources, First 5 Kern funded programs to support insurance enrollments for young children and their families. Since 2013, the rate of healthcare coverage in Kern
County has been above the national and state averages (Figure 6). This progress represented an improvement of healthcare protection in Kern County where most communities were classified as Medically Underserved Areas (MUA) by the state
government.
FIGURE 5: MEDIAN INCOME FOR FAMILIES WITH CHILDREN
FIGURE 6: INSURANCE COVERAGE FOR CHILDREN UNDER AGE 6
0
10,000
20,000
30,000
40,000
50,000
60,000
70,000
2006 2008 2010 2012 2014 2016
Kern County California U.S.
Source: U.S. Census Bureau.
89.00%
90.00%
91.00%
92.00%
93.00%
94.00%
95.00%
96.00%
97.00%
98.00%
2010 2011 2012 2013 2014 2015
United States California Kern
Source: U.S. Census Bureau with imputed results for 2015.
FIRST 5 KERN ANNUAL REPORT FISCAL YEAR 2015-2016
14
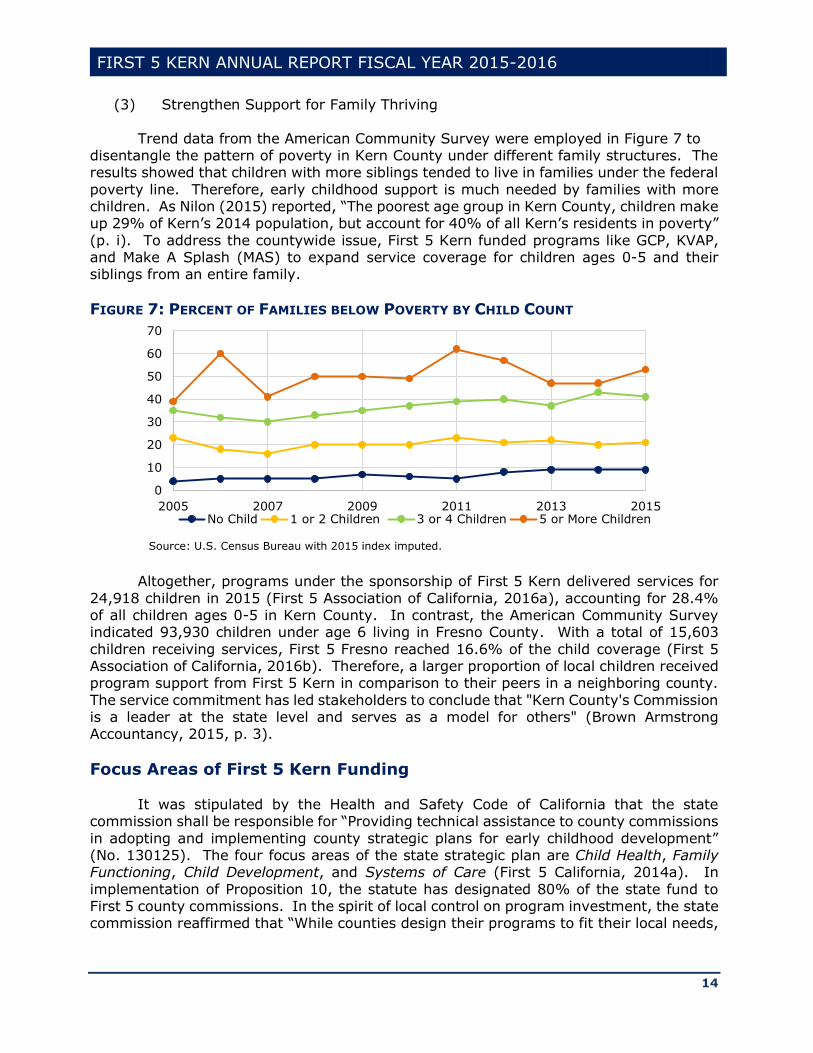
(3) Strengthen Support for Family Thriving
Trend data from the American Community Survey were employed in Figure 7 to disentangle the pattern of poverty in Kern County under different family structures. The results showed that children with more siblings tended to live in families under the federal
poverty line. Therefore, early childhood support is much needed by families with more children. As Nilon (2015) reported, “The poorest age group in Kern County, children make up 29% of Kern’s 2014 population, but account for 40% of all Kern’s residents in poverty”
(p. i). To address the countywide issue, First 5 Kern funded programs like GCP, KVAP, and Make A Splash (MAS) to expand service coverage for children ages 0-5 and their siblings from an entire family.
FIGURE 7: PERCENT OF FAMILIES BELOW POVERTY BY CHILD COUNT
Altogether, programs under the sponsorship of First 5 Kern delivered services for
24,918 children in 2015 (First 5 Association of California, 2016a), accounting for 28.4% of all children ages 0-5 in Kern County. In contrast, the American Community Survey indicated 93,930 children under age 6 living in Fresno County. With a total of 15,603
children receiving services, First 5 Fresno reached 16.6% of the child coverage (First 5 Association of California, 2016b). Therefore, a larger proportion of local children received program support from First 5 Kern in comparison to their peers in a neighboring county.
The service commitment has led stakeholders to conclude that "Kern County's Commission is a leader at the state level and serves as a model for others" (Brown Armstrong Accountancy, 2015, p. 3).
Focus Areas of First 5 Kern Funding
It was stipulated by the Health and Safety Code of California that the state
commission shall be responsible for “Providing technical assistance to county commissions
in adopting and implementing county strategic plans for early childhood development” (No. 130125). The four focus areas of the state strategic plan are Child Health, Family Functioning, Child Development, and Systems of Care (First 5 California, 2014a). In
implementation of Proposition 10, the statute has designated 80% of the state fund to First 5 county commissions. In the spirit of local control on program investment, the state commission reaffirmed that “While counties design their programs to fit their local needs,
0
10
20
30
40
50
60
70
2005 2007 2009 2011 2013 2015No Child 1 or 2 Children 3 or 4 Children 5 or More Children
Source: U.S. Census Bureau with 2015 index imputed.

FIRST 5 KERN ANNUAL REPORT FISCAL YEAR 2015-2016
15
they must provide services in each of the following four focus areas: Child Health, Child Development, Family Functioning, Systems of Care.”1
First 5 Kern correspondingly identified four focus areas in its new strategic plan for
Funding Cycle 2015-20. By design,
Three focus areas advance specific children’s issues of Health and Wellness, Parent Education and Support Services, and Early Childcare and Education. The fourth
focus area, Integration of Services, ensures collaboration with other agencies, organizations and entities with similar goals and objectives to enhance the overall efficiency of provider systems. (First 5 Kern, 2015b, p. 3).
Table 1 shows a clear match in the focus area designation between First 5 Kern and the State Commission.
Table 1: Focus Area Alignments at Local and State Levels
State Focus Area First 5 Kern Focus Area
I. Child Health Health and Wellness
II. Family Functioning Parent Education and Support Services
III. Child Development Early Childcare and Education
IV. Systems of Care Integration of Services
Vision Statement
At the state level, the vision of First 5 California is for all of the state’s children to receive the best possible start in life and thrive (First 5 California, 2015a). The local
context of “supportive, safe, and loving homes and neighborhoods” was included in First 5 Kern’s vision statement to support early childhood development:
All Kern County children will be born into and thrive in supportive, safe, loving homes and neighborhoods and will enter school healthy and ready to learn. (First 5 Kern, 2015a, p. 2)
Following Proposition 10, the vision statement is incorporated in the local strategic plan for annual review and update in this funding cycle. In its current form, the vision
statement is worded as “A broad, general statement of the desired future” according to the Guidelines for Implementing the California Children and Families Act (First 5 California, 2010, p. 28).
Mission Statement
The strategic planning process has led First 5 Kern to embrace the following mission statement:
To strengthen and support the children of Kern County prenatal to five and their families by empowering our providers through the integration of services with an
1First 5 California (2010). 2009-2010 Annual Report. Sacramento, CA: Author.
FIRST 5 KERN ANNUAL REPORT FISCAL YEAR 2015-2016
16
emphasis on health and wellness, parent education, and early childcare and education. (First 5 Kern, 2015a, p. 2)
In addition to the program accountability, the mission statement clarified service
recipients as “the children of Kern County prenatal to five and their families” to address
the population accountability. According to Friedman (2009), “RBA [Results-Based Accountability] makes a fundamental distinction between Population Accountability and Performance Accountability” (p. 2). While performance accountability is demonstrated by
program effectiveness, population accountability relies on partnership building (Friedman, 2011).
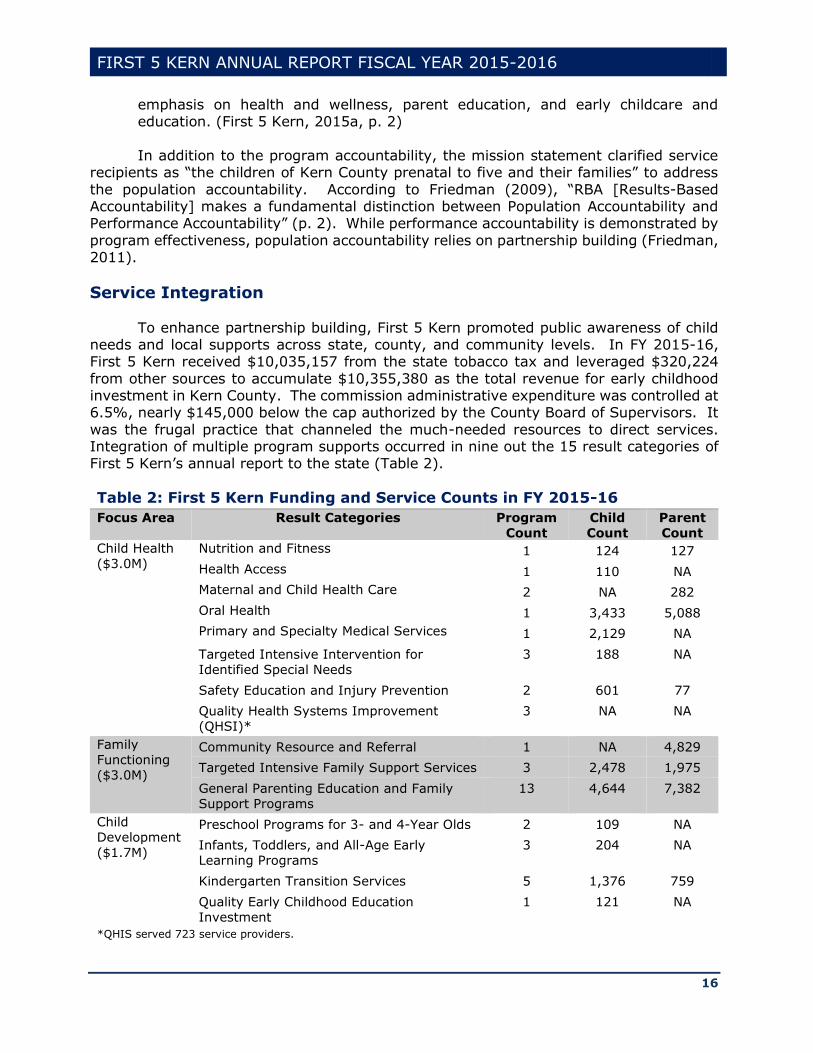
Service Integration
To enhance partnership building, First 5 Kern promoted public awareness of child needs and local supports across state, county, and community levels. In FY 2015-16, First 5 Kern received $10,035,157 from the state tobacco tax and leveraged $320,224
from other sources to accumulate $10,355,380 as the total revenue for early childhood investment in Kern County. The commission administrative expenditure was controlled at 6.5%, nearly $145,000 below the cap authorized by the County Board of Supervisors. It
was the frugal practice that channeled the much-needed resources to direct services. Integration of multiple program supports occurred in nine out the 15 result categories of First 5 Kern’s annual report to the state (Table 2).
Table 2: First 5 Kern Funding and Service Counts in FY 2015-16
Focus Area Result Categories Program
Count
Child
Count
Parent
Count
Child Health
($3.0M)
Nutrition and Fitness 1 124 127
Health Access 1 110 NA
Maternal and Child Health Care 2 NA 282
Oral Health 1 3,433 5,088
Primary and Specialty Medical Services 1 2,129 NA
Targeted Intensive Intervention for
Identified Special Needs
3 188 NA
Safety Education and Injury Prevention 2 601 77
Quality Health Systems Improvement
(QHSI)*
3 NA NA
Family
Functioning
($3.0M)
Community Resource and Referral 1 NA 4,829
Targeted Intensive Family Support Services 3 2,478 1,975
General Parenting Education and Family
Support Programs
13 4,644 7,382
Child
Development
($1.7M)
Preschool Programs for 3- and 4-Year Olds 2 109 NA
Infants, Toddlers, and All-Age Early
Learning Programs
3 204 NA
Kindergarten Transition Services 5 1,376 759
Quality Early Childhood Education Investment
1 121 NA
*QHIS served 723 service providers.

FIRST 5 KERN ANNUAL REPORT FISCAL YEAR 2015-2016
17
In administering the state trust fund, First 5 Kern adopted rigorous measures of quality control. As was noted by Brown Armstrong Accountancy (2015), "Contractors are
held to strict standards of financial and program compliance. The Commission also performs administrative site visits to monitor contract compliance with the requirements of their general agreement and to assist in program evaluation, sustainability, and
improvement" (p. 3). Despite cross-board reduction of program funding, more services were delivered in Targeted Intensive Family Support Services, Preschool Programs for 3- and 4-Year Olds, and Infants, Toddlers, & All-Age Early Learning Programs this year than
last year. To reciprocate the mutual partnership building, First 5 Kern made outreach efforts to serve as an active initiator and/or participant in 11 countywide undertakings (Table 3).
Table 3: First 5 Kern’s Leadership Roles in Local Communities
Initiator Participant
Community Health
Initiative – Outreach,
Enrollment, Retention and
Utilization Committee
School Readiness
Coordinators Meeting –
Facilitator
Bakersfield College Child Development Advisory Committee Early Childhood Council of Kern Meetings
Community Connection for Childcare Foundation Advisory Committee Meetings
Good Neighbor Festival Committee Greenfield Collaborative H.E.A.R.T.S Connection
Medically Vulnerable Care Coordination Committee Richardson Collaborative
Shafter Collaborative Southeast Neighborhood Collaborative South Valley Neighborhood Partnership Arvin/Lamont
Weedpatch Collaborative
Beyond the local setting, the commission staff took part in First 5 California Summit
in 2015 to expand network connections across sister counties. The Executive Director and the Communications Officer of First 5 Kern participated in the 2016 Capitol Advocacy Day
event to meet with legislators and advocate policy agenda for young children in Kern County. Table 4 lists 52 outreach services that are accomplished by First 5 Kern at the community, county, and state levels. As a result, the county commission has fulfilled its
role “as the ‘glue’ to bring services together and fill critical gaps that no other funding source is able to address” (First 5 Association of California, 2009, p. 7).
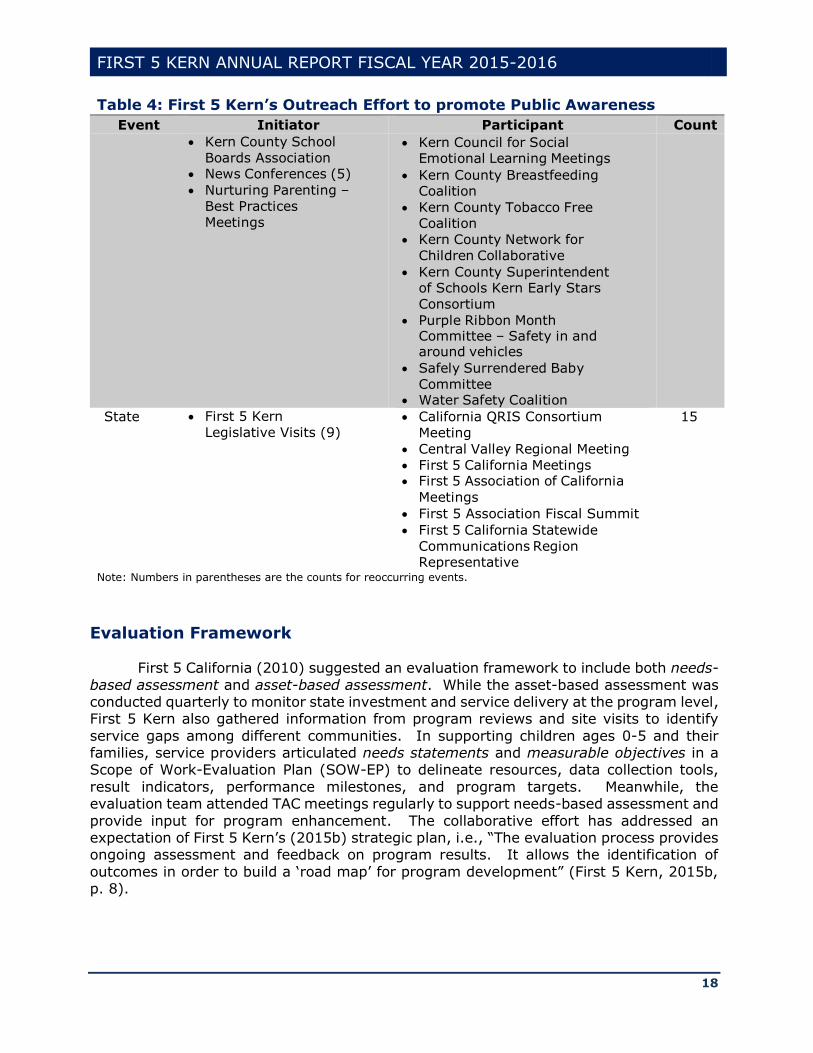
Table 4: First 5 Kern’s Outreach Effort to promote Public Awareness
Event Initiator Participant Count
Community First 5 Kern Newsletter First 5 Kern Strategic Plan
First 5 Kern Website
Rotary Groups
Community Fairs – Exhibit Booth (5)
Community Presentations (9)
18
County Chamber of Commerce Governmental Review
Council
Kern County Board of
Supervisors
Meetings
Community Health Initiative of Kern County – Outreach, Enrollment, Retention Utilization Committee
Health Net – Kern Community Advisory Committee
19
FIRST 5 KERN ANNUAL REPORT FISCAL YEAR 2015-2016
18
Table 4: First 5 Kern’s Outreach Effort to promote Public Awareness
Event Initiator Participant Count
Kern County School
Boards Association News Conferences (5)
Nurturing Parenting –
Best Practices
Meetings
Kern Council for Social Emotional Learning Meetings
Kern County Breastfeeding Coalition
Kern County Tobacco Free Coalition
Kern County Network for
Children Collaborative
Kern County Superintendent of Schools Kern Early Stars
Consortium
Purple Ribbon Month Committee – Safety in and around vehicles
Safely Surrendered Baby
Committee Water Safety Coalition
State First 5 Kern
Legislative Visits (9) California QRIS Consortium
Meeting
Central Valley Regional Meeting
First 5 California Meetings First 5 Association of California
Meetings
First 5 Association Fiscal Summit
First 5 California Statewide
Communications Region Representative
15
Note: Numbers in parentheses are the counts for reoccurring events.
Evaluation Framework
First 5 California (2010) suggested an evaluation framework to include both needs-
based assessment and asset-based assessment. While the asset-based assessment was conducted quarterly to monitor state investment and service delivery at the program level, First 5 Kern also gathered information from program reviews and site visits to identify
service gaps among different communities. In supporting children ages 0-5 and their families, service providers articulated needs statements and measurable objectives in a Scope of Work-Evaluation Plan (SOW-EP) to delineate resources, data collection tools,
result indicators, performance milestones, and program targets. Meanwhile, the evaluation team attended TAC meetings regularly to support needs-based assessment and
provide input for program enhancement. The collaborative effort has addressed an expectation of First 5 Kern’s (2015b) strategic plan, i.e., “The evaluation process provides ongoing assessment and feedback on program results. It allows the identification of
outcomes in order to build a ‘road map’ for program development” (First 5 Kern, 2015b, p. 8).
FIRST 5 KERN ANNUAL REPORT FISCAL YEAR 2015-2016
19
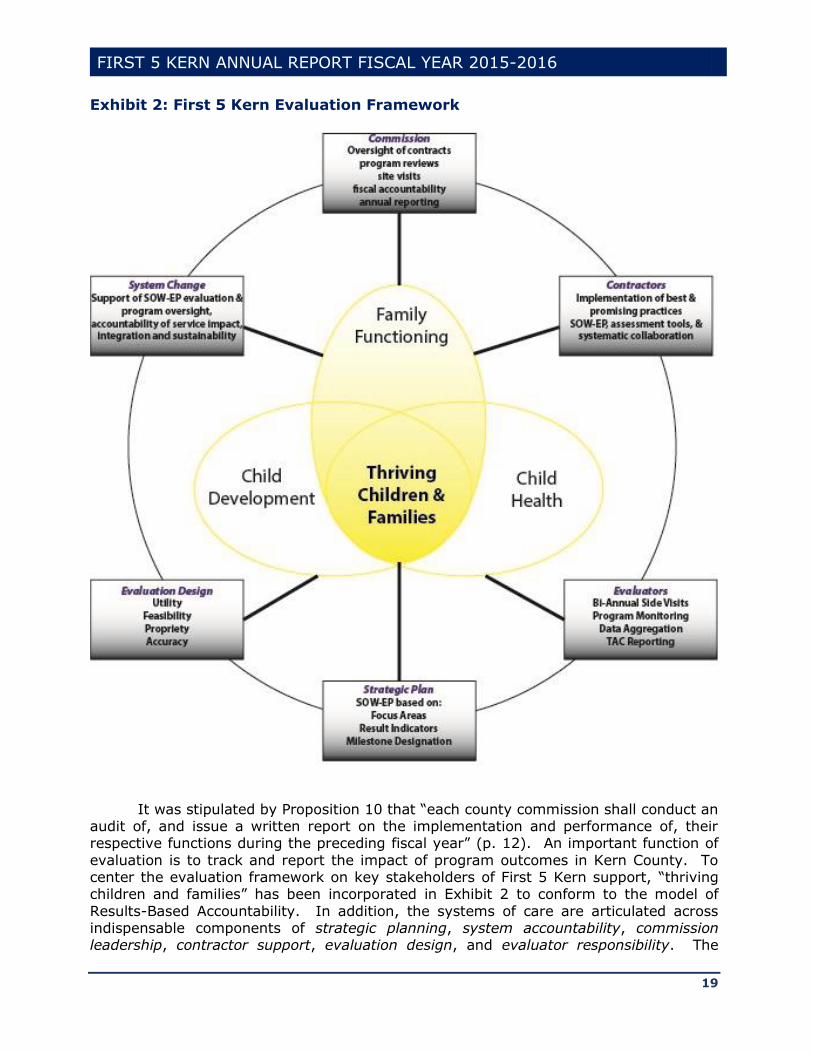
Exhibit 2: First 5 Kern Evaluation Framework
It was stipulated by Proposition 10 that “each county commission shall conduct an audit of, and issue a written report on the implementation and performance of, their respective functions during the preceding fiscal year” (p. 12). An important function of
evaluation is to track and report the impact of program outcomes in Kern County. To center the evaluation framework on key stakeholders of First 5 Kern support, “thriving children and families” has been incorporated in Exhibit 2 to conform to the model of
Results-Based Accountability. In addition, the systems of care are articulated across indispensable components of strategic planning, system accountability, commission leadership, contractor support, evaluation design, and evaluator responsibility. The

FIRST 5 KERN ANNUAL REPORT FISCAL YEAR 2015-2016
20
evaluation design and evaluator responsibility components are guided by an IRB panel of California State University, Bakersfield (CSUB) to ensure adequate, transparent, and
accurate data collection across 41 programs. The outcome tracking is particularly challenging for First 5 Kern because of higher mobility of local children in comparison to their peers across the state (Figure 8).
FIGURE 8: PERCENT OF CHILDREN MOVED WITHIN THE SAME COUNTY PRIOR TO AGE 5
In summary, First 5 Association of California (2009) pointed out, “To fully
appreciate the effect that First 5 has had, it is necessary to understand the many roles that are served by First 5 – roles that were not being addressed or not fulfilled sufficiently before First 5 was created” (p. 7). Prior to the passage of Proposition 10, no Strategic
Plan was developed for early childhood services in Kern County, nor did the service integration become a focus area to support children ages 0-5 and their families.
Guided by its vision and mission statements, First 5 Kern funded direct services in Child Health, Family Functioning, and Child Development, and sustained partnership building to enhance the local Systems of Care for children ages 0-5. The countywide
impact has been illustrated by the wellbeing of children and their families in the new evaluation framework to “facilitate the creation and implementation of an integrated, comprehensive, and collaborative system of information and services to enhance optimal
early childhood development” [Proposition 10, Section 5(a)].
0
5
10
15
20
25
30
2005 2006 2007 2008 2009 2010 2011 2012 2013 2014 2015
Kern CaliforniaSource: U.S. Census
FIRST 5 KERN ANNUAL REPORT FISCAL YEAR 2015-2016
21
Chapter 2: Impact of First 5 Kern-Funded Programs
Agriculture and petroleum extraction are two major sectors of the Kern County economy (Hamilton, Keough, Ratnatunga, & Wong, 2015). In recent years, the agricultural
production has been hampered by statewide droughts (Gearhart & Michieka, 2016). The latest oil price plunge also exacerbated Kern County financial conditions. Consequently, the local unemployment rate remained at 11.1% while “In California, the unemployment
rate went down to 5.4 from 5.8 percent” (Gearhart & Michieka, 2016, p. 4).
The issue of poverty inevitably impacted the wellbeing of children under five years
old. As LaVoice (2016) noted, “many new moms might not have people or resources in their life to help them through such an important time” (¶. 8). To amend the inadequate early childhood support, First 5 Kern funded 41 programs in focus areas of Child Health,
Family Functioning, and Child Development. In addition, “One result area, Improved Systems of Care, differs from the others; it consists of programs and initiatives that support program providers in the other three result areas” (First 5 California, 2015a, p.
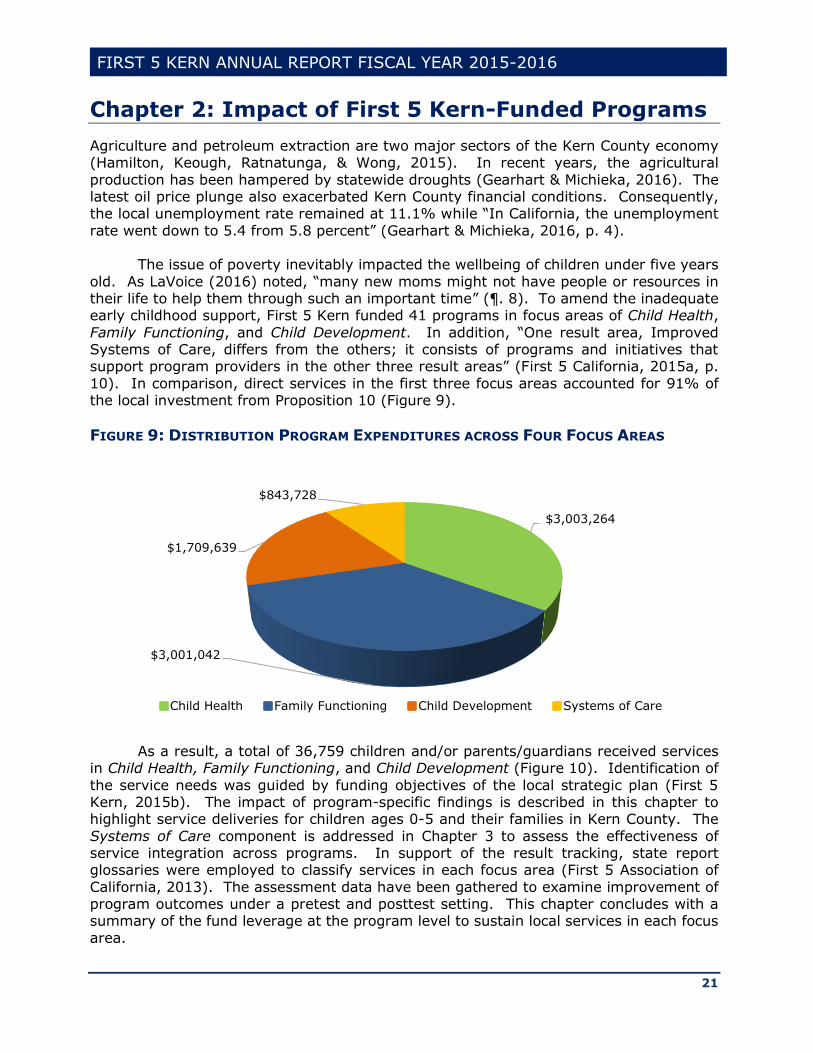
10). In comparison, direct services in the first three focus areas accounted for 91% of the local investment from Proposition 10 (Figure 9).
FIGURE 9: DISTRIBUTION PROGRAM EXPENDITURES ACROSS FOUR FOCUS AREAS
As a result, a total of 36,759 children and/or parents/guardians received services
in Child Health, Family Functioning, and Child Development (Figure 10). Identification of
the service needs was guided by funding objectives of the local strategic plan (First 5 Kern, 2015b). The impact of program-specific findings is described in this chapter to highlight service deliveries for children ages 0-5 and their families in Kern County. The
Systems of Care component is addressed in Chapter 3 to assess the effectiveness of service integration across programs. In support of the result tracking, state report glossaries were employed to classify services in each focus area (First 5 Association of
California, 2013). The assessment data have been gathered to examine improvement of program outcomes under a pretest and posttest setting. This chapter concludes with a summary of the fund leverage at the program level to sustain local services in each focus
area.
$3,003,264
$3,001,042
$1,709,639
$843,728
Child Health Family Functioning Child Development Systems of Care

FIRST 5 KERN ANNUAL REPORT FISCAL YEAR 2015-2016
22
FIGURE 10: COUNT OF SERVICE RECIPIENTS IN PROGRAM-AFFILIATED FOCUS AREAS
Improvement of Child Health
In First 5 Kern’s (2015b) strategic plan, a goal has been set to ensure that “All children will have an early start toward good health” (p. 6). With endorsement from First 5 Association of California (2013), statewide glossary definitions were employed to
standardize the description of Child Health outcomes in eight service domains: (1) Nutrition and Fitness, (2) Health Access, (3) Maternal and Child Health Care, (4) Oral Health, (5) Primary and Specialty Medical Services, (6) Targeted Intensive Intervention
for Identified Special Needs, (7) Safety Education and Injury Prevention, and (8) Quality Health Systems Improvement. Table 5 shows alignment between these service domains and six objectives of First 5 Kern’s (2015b) strategic plan in Child Health.
Table 5: Alignment Between Service Domains & Objectives of Child Health
Objective Service Domain
1. Children will be enrolled in existing health insurance programs. (2)
2. Pregnant women will be linked to early and continuous care. (3)
3. Children will be provided health, dental, mental health,
developmental and vision screenings and/or preventative services.
(4)
(5) (6)
4. Children with identified special needs will be referred to
appropriate services.
(8)
5. Children will develop early healthy habits through nutrition and/or fitness education.
(1)
6. Children and their parents/guardians will be provided with safety
education and/or injury prevention services.
(7)
In comparison, Gearhart (2016) reported, “Lamentably, Kern County often ranks as one of the poorest providers of healthcare in the country. … Not only is our population in ill health, but the county does not have the healthcare resources to alleviate these
12,882
21,308
4,267
Child Health Family Functioning Child Development
Source: 2015-16 Annual State Report from First 5 Kern.
FIRST 5 KERN ANNUAL REPORT FISCAL YEAR 2015-2016
23
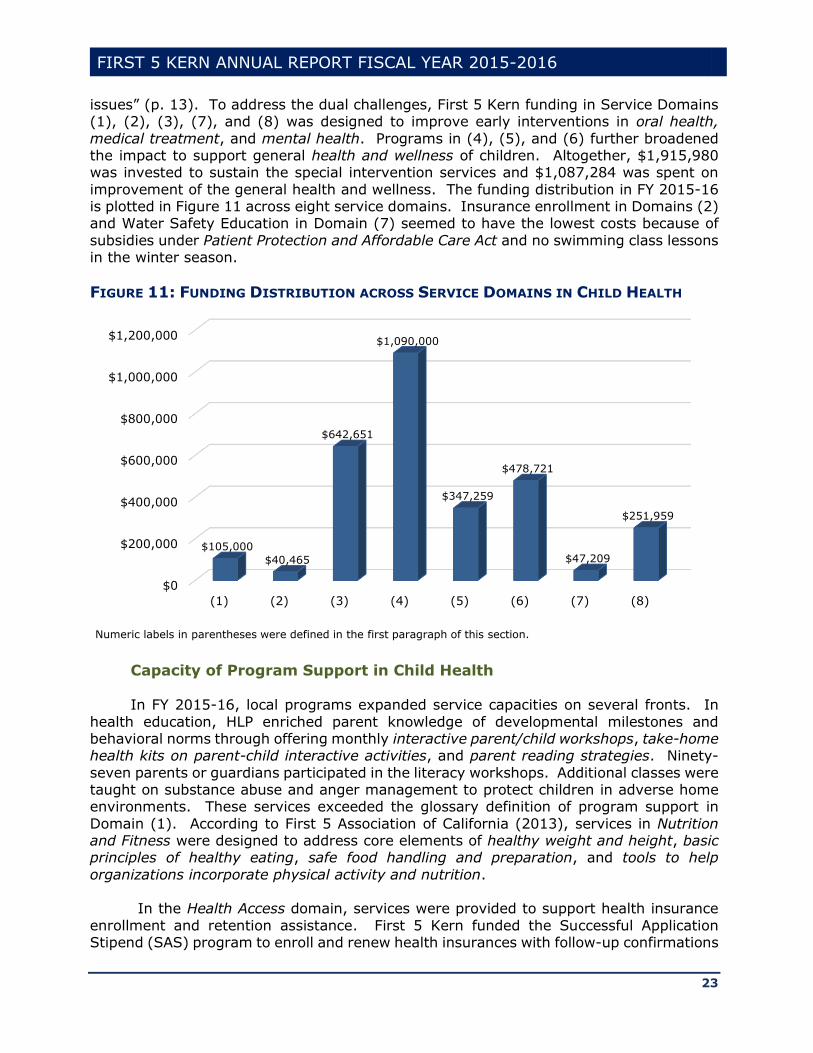
issues” (p. 13). To address the dual challenges, First 5 Kern funding in Service Domains (1), (2), (3), (7), and (8) was designed to improve early interventions in oral health,
medical treatment, and mental health. Programs in (4), (5), and (6) further broadened the impact to support general health and wellness of children. Altogether, $1,915,980 was invested to sustain the special intervention services and $1,087,284 was spent on
improvement of the general health and wellness. The funding distribution in FY 2015-16 is plotted in Figure 11 across eight service domains. Insurance enrollment in Domains (2) and Water Safety Education in Domain (7) seemed to have the lowest costs because of
subsidies under Patient Protection and Affordable Care Act and no swimming class lessons in the winter season.
FIGURE 11: FUNDING DISTRIBUTION ACROSS SERVICE DOMAINS IN CHILD HEALTH
Capacity of Program Support in Child Health
In FY 2015-16, local programs expanded service capacities on several fronts. In
health education, HLP enriched parent knowledge of developmental milestones and behavioral norms through offering monthly interactive parent/child workshops, take-home health kits on parent-child interactive activities, and parent reading strategies. Ninety-
seven parents or guardians participated in the literacy workshops. Additional classes were taught on substance abuse and anger management to protect children in adverse home environments. These services exceeded the glossary definition of program support in
Domain (1). According to First 5 Association of California (2013), services in Nutrition and Fitness were designed to address core elements of healthy weight and height, basic principles of healthy eating, safe food handling and preparation, and tools to help
organizations incorporate physical activity and nutrition. In the Health Access domain, services were provided to support health insurance
enrollment and retention assistance. First 5 Kern funded the Successful Application Stipend (SAS) program to enroll and renew health insurances with follow-up confirmations
$0
$200,000
$400,000
$600,000
$800,000
$1,000,000
$1,200,000
(1) (2) (3) (4) (5) (6) (7) (8)
$105,000
$40,465
$642,651
$1,090,000
$347,259
$478,721
$47,209
$251,959
Numeric labels in parentheses were defined in the first paragraph of this section.
FIRST 5 KERN ANNUAL REPORT FISCAL YEAR 2015-2016
24
on medical home establishment. In the recent research literature, “Theoretical and empirical studies of access to health care have emphasized the importance of having
health insurance and a regular source of care to ensure that children have access to health services” (Medi-Cal Managed Care Division, 2013, p. 61). The demand on health insurance coverage has been sustained by the local population growth. SAS, as an
enrollment service agency, further collaborated with the Community Health Initiative of Kern County (CHI KC) to support Certified Application Counselor trainings. CHI KC, NFP, and SAS also completed healthcare insurance applications and well-child checkups for 99
children.
In Maternal and Child Health Care, the statewide glossary definition stipulated
reports on health and wellbeing of women who were at a stage of raising children from prenatal to 2 years of age. Due to the risk factor considerations, special attention was given to the much-needed groups, i.e., first-time parents and/or African-American
mothers, to help them gain more knowledge about themselves, pregnancies, babies, and local resources. In particular, 10 prenatal and 10 post-partum sessions were offered by Black Infant Health (BIH) in culturally-supportive settings to reduce family stress and
strengthen parenting skills. A total of 76 mothers participated in the trainings on substance abuse and tobacco cessation.
In addition, NFP supported nurse visits for healthy child development. Ninety-eight home visits occurred this year and 62 mothers received information on breastfeeding
benefits. While NFP was recognized as an effective child health program through randomized trials across the nation (Heckman, 2014), BIH expanded its services across 13 counties and two cities in California to reduce infant mortality in communities where
over 90% of births were African-American children. In combination, the group-based education in BIH and home-based consultation in NFP contributed to the enhancement of maternal and infant care across Kern County.
The importance of Oral Health was reflected by the fact that California students
missed an approximate 874,000 school days a year due to dental problems (Pourat &
Nicholson, 2009). In addressing the local needs, Kern County Children's Dental Health Network (KCCDHN) incorporated mobile services to provide dental screening, cleaning, treatment, fluoride varnish, and parent education at 97 dental clinics. As a result, 4,287
children had dental screenings, 1,376 children received referrals to pediatric dentists, and 461 children were given dental homes. A six-month reminder was sent to families to continue the services after dental home establishment.
In Primary and Specialty Medical Services, it was reported that “Childhood vaccines
prevent 10.5 million diseases among all children born in the United States in a given year
and are a cost-effective preventive measure” (Medi-Cal Managed Care Division, 2013, p. 54). Prior to kindergarten entry, children received immunizations from the Children’s Mobile Immunization Program (CMIP). First 5 Kern funded the mobile unit to expand the
services in remote regions. The program established 153 immunization clinics that served 2,129 children ages 0-5. In collaboration with BIH and NFP, CMIP supported prenatal education for 136 mothers in various communities.
Due to warm weather in the summer season, an important aspect of Safety
Education and Injury Prevention hinged on child protection against the risk of drowning
around swimming pools, canals, lakes, and the Kern River. First 5 Kern funded KVAP and
FIRST 5 KERN ANNUAL REPORT FISCAL YEAR 2015-2016
25
MAS to provide swimming pool access to families with children ages 0-5. The safety education included First Aid classes, swim lessons, and water safety trainings on different devices in both remotely-located Weldon and densely-populated Bakersfield. A total of
601 children took swim lessons. Thirty-seven parents or guardians participated in the water safety training. KVAP also offered safety education to 65 children. MAS held seven workshops to inform parents or guardians of health and wellness services.
Furthermore, the American Academy of Pediatrics (2011) expanded its
recommendations from focusing only on sudden infant death syndrome to focusing on a
safe sleep environment that can reduce the risk of all sleep-related infant deaths. First 5 Kern donated $30,000 to Kern Medical Center’s safe sleeping program in June 2016. Price (2016) reported, “Since 2010, more than 100 Kern County babies have died because of
unsafe sleeping” (p. 1). Hence, the partnership building has addressed a critical issue of child protection in local communities.
To facilitate Targeted Intensive Intervention for Identified Special Needs, MVIP incorporated home-based case managements for medically vulnerable infants and their families. Meanwhile, special-need services from RSNC included case managements,
behavioral screenings, and referrals. A Family Resource Library was sponsored to disseminate information about children with special-needs. Special Start for Exceptional
Children (SSEC) expanded its support during non-traditional hours to accommodate additional needs of early childhood education, parent support, and childcare service. Therefore, First 5 Kern funding in Child Health has addressed the program outreach on
multiple dimensions, including the variation of medical and mental health conditions, infant and toddler services, bilingual supports, and hours of program operation.
In the glossary definition, Quality Health Systems Improvement encompassed service outreach, planning, management, and provider capacity building (First 5 Association of California, 2013). While SAS and CHI KC trained 49 service providers for
healthcare insurance applications, MAS offered seven workshops to inform parents or guardians of health and wellness support. MVCCP convened partners bi-weekly to discuss and maintain health system improvement for medically vulnerable children. As a result,
1,015 medical homes were established by six programs among which 77% were coordinated by MVCCP. A total of 901 children received special needs services from MVIP and MVCCP. Another 731 professionals attended trainings or other educational services
from five programs in Child Health (BIH, CHI KC, KCCDHN, MVCCP, & MVIP).
To broaden the network impact, First 5 Kern partnered with Kaiser Permanente,
Kern Family Health Care, and Health Net to fund an annual conference of healthcare professionals, social workers, case managers, parents, and childcare providers on November 5, 2015 that attracted 175 attendees. The effective service coordination since
2010 has earned MVCCP a recognition of Promising Practice by the Innovation Station of the Association of Maternal & Child Health Programs (AMCHP) in 2015. It was the third program in California that received this recognition.
In summary, young children are fragile and inexperienced in self-protection. Parent
education on hazard prevention, such as water and sleep safety, is particularly important
for maintaining health and wellness of infants, toddlers, and preschoolers. While the water
FIRST 5 KERN ANNUAL REPORT FISCAL YEAR 2015-2016
26
safety concerns were addressed by KVAP and MAS, services of CMIP, CHI KC, HLP, and SAS have expanded the local immunization coverage, family literacy, and healthcare
access. Oral, medical, and mental health services were provided by BIH, KCCDHN, MVIP, NFP, RSNC, and SSEC in traditionally underserved communities. The healthcare system further incorporated two programs (MVCCP & MVCCP KC) for case identification and
service coordination. The program capacities in each domain have surpassed the service definition in the statewide glossary (First 5 Association of Calfironia, 2013). In combination, a total of 14 programs collectively addressed all six objectives of Child Health
in First 5 Kern’s (2015b) Strategic Plan:
(1) Health insurance enrollments were assisted by SAS and CHI KC;
(2) Prenatal support was provided by BIH and NFP programs; (3) Medical, dental, and mental health services were delivered by CMIP, KCCDHN,
and RSNC;
(4) Special-needs services were supported by MVIP, SSEC, MVCCP, and MVCCP KC; (5) Early health education was offered by HLP for both children and parents; (6) Injury prevention and water safety were addressed by KVAP and MAS.
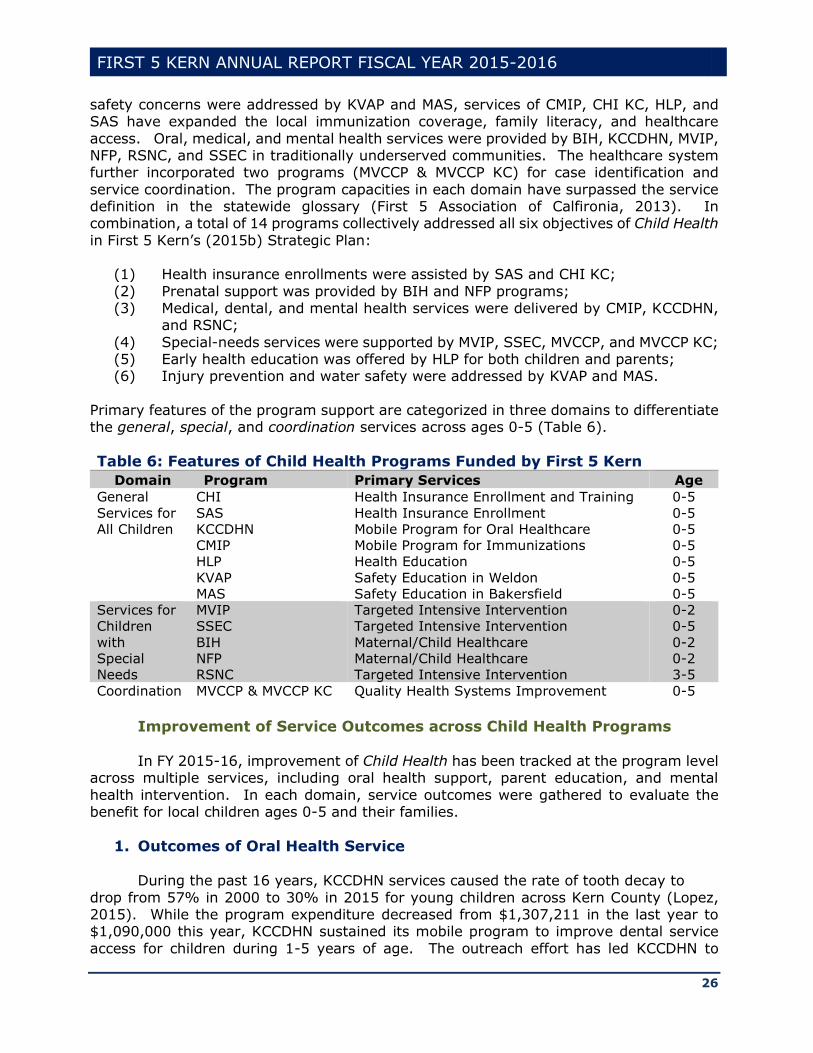
Primary features of the program support are categorized in three domains to differentiate the general, special, and coordination services across ages 0-5 (Table 6).
Table 6: Features of Child Health Programs Funded by First 5 Kern
Domain Program Primary Services Age
General
Services for
All Children
CHI
SAS
KCCDHN
CMIP
HLP
KVAP
MAS
Health Insurance Enrollment and Training
Health Insurance Enrollment
Mobile Program for Oral Healthcare
Mobile Program for Immunizations
Health Education
Safety Education in Weldon
Safety Education in Bakersfield
0-5
0-5
0-5
0-5
0-5
0-5
0-5
Services for
Children
with
Special
Needs
MVIP
SSEC
BIH
NFP
RSNC
Targeted Intensive Intervention
Targeted Intensive Intervention
Maternal/Child Healthcare
Maternal/Child Healthcare
Targeted Intensive Intervention
0-2
0-5
0-2
0-2
3-5
Coordination MVCCP & MVCCP KC Quality Health Systems Improvement 0-5
Improvement of Service Outcomes across Child Health Programs
In FY 2015-16, improvement of Child Health has been tracked at the program level across multiple services, including oral health support, parent education, and mental
health intervention. In each domain, service outcomes were gathered to evaluate the benefit for local children ages 0-5 and their families.
1. Outcomes of Oral Health Service
During the past 16 years, KCCDHN services caused the rate of tooth decay to
drop from 57% in 2000 to 30% in 2015 for young children across Kern County (Lopez, 2015). While the program expenditure decreased from $1,307,211 in the last year to $1,090,000 this year, KCCDHN sustained its mobile program to improve dental service
access for children during 1-5 years of age. The outreach effort has led KCCDHN to
FIRST 5 KERN ANNUAL REPORT FISCAL YEAR 2015-2016
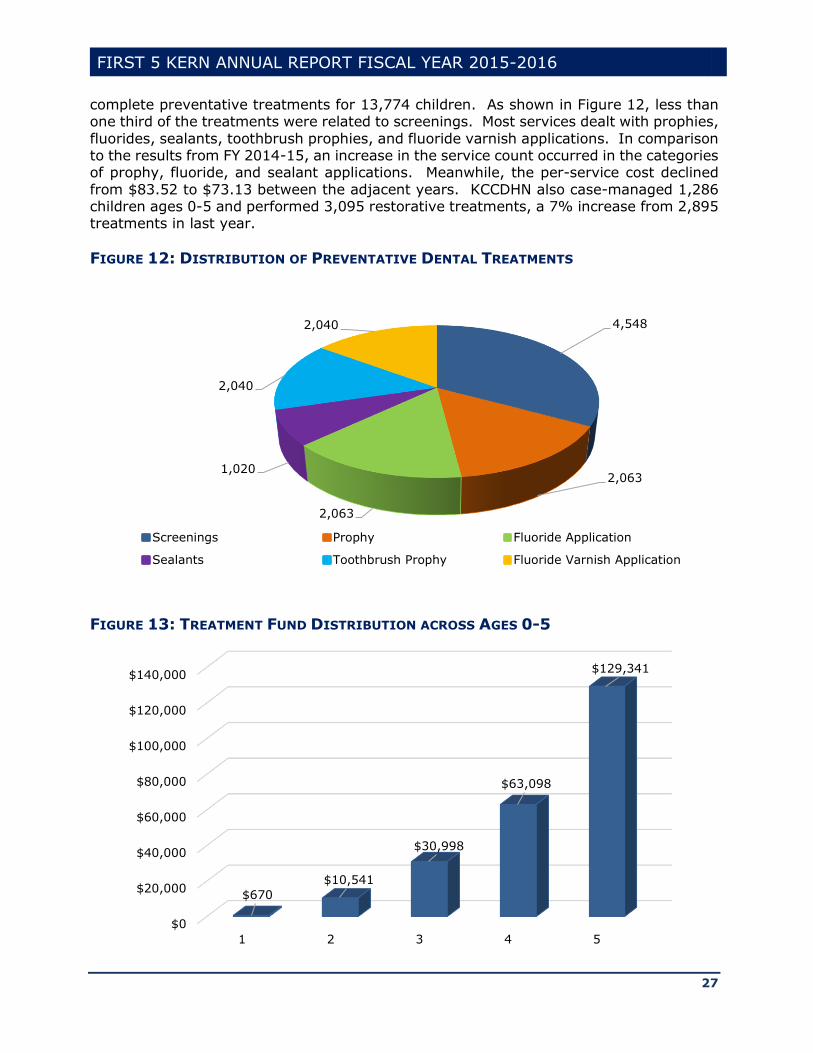
27
complete preventative treatments for 13,774 children. As shown in Figure 12, less than one third of the treatments were related to screenings. Most services dealt with prophies,
fluorides, sealants, toothbrush prophies, and fluoride varnish applications. In comparison to the results from FY 2014-15, an increase in the service count occurred in the categories of prophy, fluoride, and sealant applications. Meanwhile, the per-service cost declined
from $83.52 to $73.13 between the adjacent years. KCCDHN also case-managed 1,286 children ages 0-5 and performed 3,095 restorative treatments, a 7% increase from 2,895 treatments in last year.
FIGURE 12: DISTRIBUTION OF PREVENTATIVE DENTAL TREATMENTS
FIGURE 13: TREATMENT FUND DISTRIBUTION ACROSS AGES 0-5
4,548
2,063
2,063
1,020
2,040
2,040
Screenings Prophy Fluoride Application
Sealants Toothbrush Prophy Fluoride Varnish Application
$0
$20,000
$40,000
$60,000
$80,000
$100,000
$120,000
$140,000
1 2 3 4 5
$670
$10,541
$30,998
$63,098
$129,341
FIRST 5 KERN ANNUAL REPORT FISCAL YEAR 2015-2016
28
Accompanied with tooth growth, a steady increase of oral health spending occurred during the first five years (Figure 13). To assess the service effectiveness, KCCDHN
tracked plaque indices during initial and recheck visits for 342 children. The program impact was indicated by a drop of Average Plaque Index (API) from 57.64 in pretest to 35.18 in posttest. The improvement of oral health was statistically significant
[t(341)=22.46, p<.0001]. The effect size also reached 1.29, which was above the 0.80 threshold for a strong program impact (Cohen, 1988).
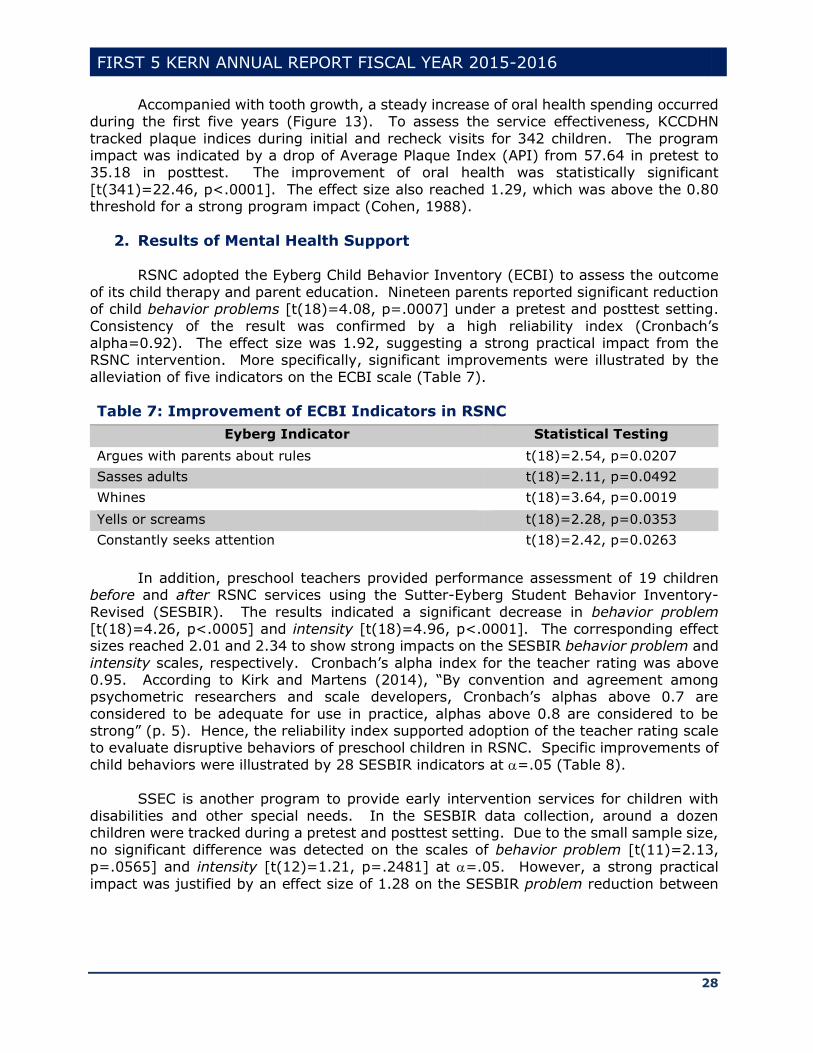
2. Results of Mental Health Support
RSNC adopted the Eyberg Child Behavior Inventory (ECBI) to assess the outcome
of its child therapy and parent education. Nineteen parents reported significant reduction of child behavior problems [t(18)=4.08, p=.0007] under a pretest and posttest setting.
Consistency of the result was confirmed by a high reliability index (Cronbach’s alpha=0.92). The effect size was 1.92, suggesting a strong practical impact from the RSNC intervention. More specifically, significant improvements were illustrated by the
alleviation of five indicators on the ECBI scale (Table 7).
Table 7: Improvement of ECBI Indicators in RSNC
Eyberg Indicator Statistical Testing
Argues with parents about rules t(18)=2.54, p=0.0207
Sasses adults t(18)=2.11, p=0.0492
Whines t(18)=3.64, p=0.0019
Yells or screams t(18)=2.28, p=0.0353
Constantly seeks attention t(18)=2.42, p=0.0263
In addition, preschool teachers provided performance assessment of 19 children
before and after RSNC services using the Sutter-Eyberg Student Behavior Inventory-
Revised (SESBIR). The results indicated a significant decrease in behavior problem [t(18)=4.26, p<.0005] and intensity [t(18)=4.96, p<.0001]. The corresponding effect sizes reached 2.01 and 2.34 to show strong impacts on the SESBIR behavior problem and
intensity scales, respectively. Cronbach’s alpha index for the teacher rating was above 0.95. According to Kirk and Martens (2014), “By convention and agreement among psychometric researchers and scale developers, Cronbach’s alphas above 0.7 are
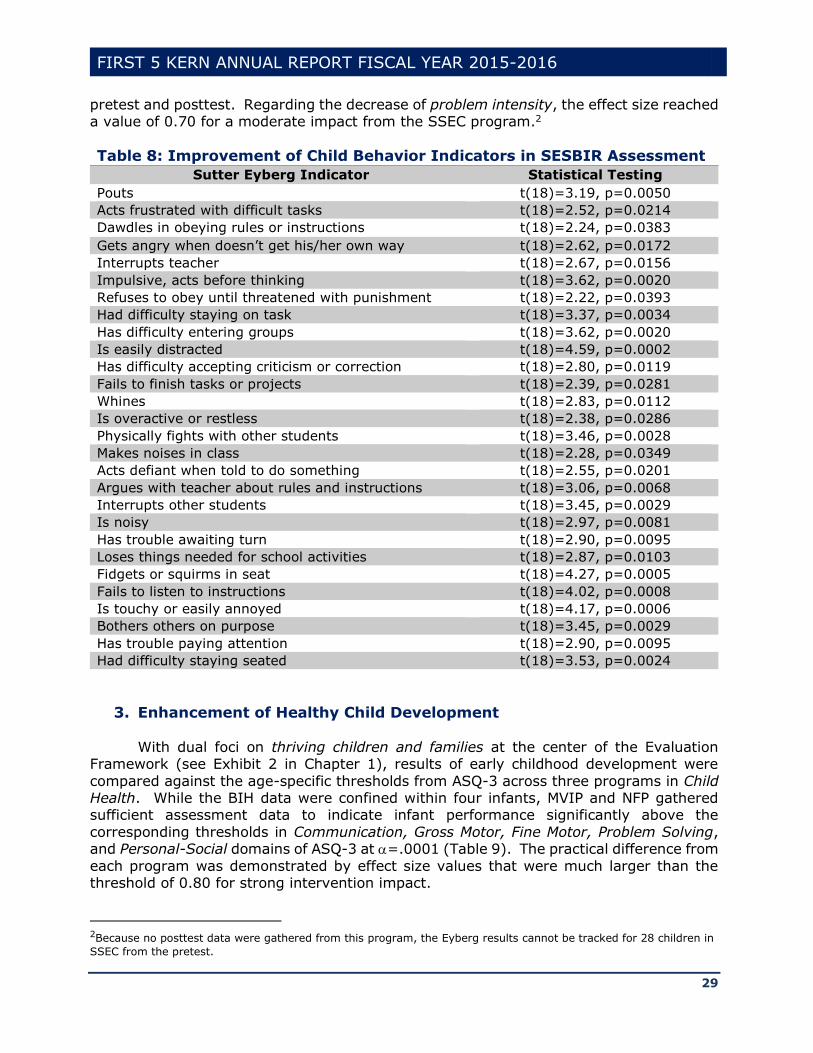
considered to be adequate for use in practice, alphas above 0.8 are considered to be strong” (p. 5). Hence, the reliability index supported adoption of the teacher rating scale to evaluate disruptive behaviors of preschool children in RSNC. Specific improvements of
child behaviors were illustrated by 28 SESBIR indicators at =.05 (Table 8).
SSEC is another program to provide early intervention services for children with
disabilities and other special needs. In the SESBIR data collection, around a dozen children were tracked during a pretest and posttest setting. Due to the small sample size, no significant difference was detected on the scales of behavior problem [t(11)=2.13,
p=.0565] and intensity [t(12)=1.21, p=.2481] at =.05. However, a strong practical
impact was justified by an effect size of 1.28 on the SESBIR problem reduction between
FIRST 5 KERN ANNUAL REPORT FISCAL YEAR 2015-2016
29
pretest and posttest. Regarding the decrease of problem intensity, the effect size reached a value of 0.70 for a moderate impact from the SSEC program.2
Table 8: Improvement of Child Behavior Indicators in SESBIR Assessment
Sutter Eyberg Indicator Statistical Testing
Pouts t(18)=3.19, p=0.0050
Acts frustrated with difficult tasks t(18)=2.52, p=0.0214
Dawdles in obeying rules or instructions t(18)=2.24, p=0.0383
Gets angry when doesn’t get his/her own way t(18)=2.62, p=0.0172
Interrupts teacher t(18)=2.67, p=0.0156
Impulsive, acts before thinking t(18)=3.62, p=0.0020
Refuses to obey until threatened with punishment t(18)=2.22, p=0.0393
Had difficulty staying on task t(18)=3.37, p=0.0034
Has difficulty entering groups t(18)=3.62, p=0.0020
Is easily distracted t(18)=4.59, p=0.0002
Has difficulty accepting criticism or correction t(18)=2.80, p=0.0119
Fails to finish tasks or projects t(18)=2.39, p=0.0281
Whines t(18)=2.83, p=0.0112
Is overactive or restless t(18)=2.38, p=0.0286
Physically fights with other students t(18)=3.46, p=0.0028
Makes noises in class t(18)=2.28, p=0.0349
Acts defiant when told to do something t(18)=2.55, p=0.0201
Argues with teacher about rules and instructions t(18)=3.06, p=0.0068
Interrupts other students t(18)=3.45, p=0.0029
Is noisy t(18)=2.97, p=0.0081
Has trouble awaiting turn t(18)=2.90, p=0.0095
Loses things needed for school activities t(18)=2.87, p=0.0103
Fidgets or squirms in seat t(18)=4.27, p=0.0005
Fails to listen to instructions t(18)=4.02, p=0.0008
Is touchy or easily annoyed t(18)=4.17, p=0.0006
Bothers others on purpose t(18)=3.45, p=0.0029
Has trouble paying attention t(18)=2.90, p=0.0095
Had difficulty staying seated t(18)=3.53, p=0.0024
3. Enhancement of Healthy Child Development With dual foci on thriving children and families at the center of the Evaluation
Framework (see Exhibit 2 in Chapter 1), results of early childhood development were
compared against the age-specific thresholds from ASQ-3 across three programs in Child Health. While the BIH data were confined within four infants, MVIP and NFP gathered sufficient assessment data to indicate infant performance significantly above the
corresponding thresholds in Communication, Gross Motor, Fine Motor, Problem Solving, and Personal-Social domains of ASQ-3 at =.0001 (Table 9). The practical difference from
each program was demonstrated by effect size values that were much larger than the threshold of 0.80 for strong intervention impact.
2Because no posttest data were gathered from this program, the Eyberg results cannot be tracked for 28 children in
SSEC from the pretest.
FIRST 5 KERN ANNUAL REPORT FISCAL YEAR 2015-2016
30
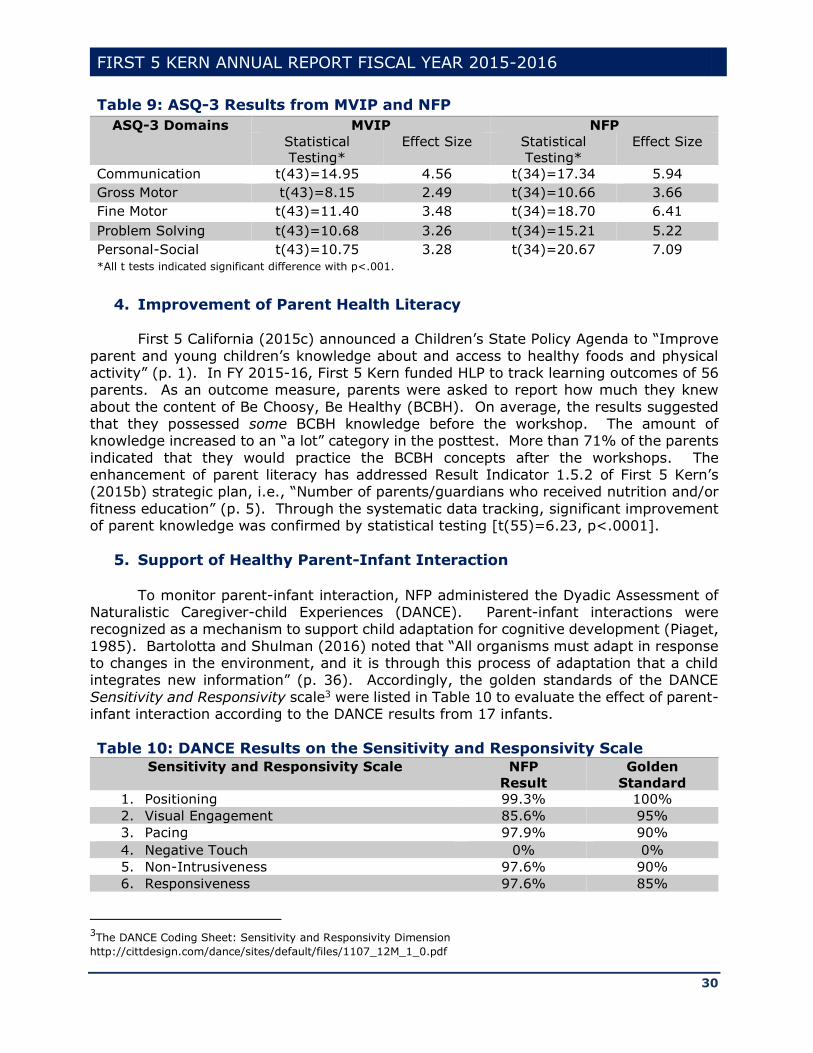
Table 9: ASQ-3 Results from MVIP and NFP
ASQ-3 Domains MVIP NFP
Statistical
Testing*
Effect Size Statistical
Testing*
Effect Size
Communication t(43)=14.95 4.56 t(34)=17.34 5.94
Gross Motor t(43)=8.15 2.49 t(34)=10.66 3.66
Fine Motor t(43)=11.40 3.48 t(34)=18.70 6.41
Problem Solving t(43)=10.68 3.26 t(34)=15.21 5.22
Personal-Social t(43)=10.75 3.28 t(34)=20.67 7.09
*All t tests indicated significant difference with p<.001.
4. Improvement of Parent Health Literacy
First 5 California (2015c) announced a Children’s State Policy Agenda to “Improve
parent and young children’s knowledge about and access to healthy foods and physical activity” (p. 1). In FY 2015-16, First 5 Kern funded HLP to track learning outcomes of 56 parents. As an outcome measure, parents were asked to report how much they knew
about the content of Be Choosy, Be Healthy (BCBH). On average, the results suggested that they possessed some BCBH knowledge before the workshop. The amount of knowledge increased to an “a lot” category in the posttest. More than 71% of the parents
indicated that they would practice the BCBH concepts after the workshops. The enhancement of parent literacy has addressed Result Indicator 1.5.2 of First 5 Kern’s (2015b) strategic plan, i.e., “Number of parents/guardians who received nutrition and/or
fitness education” (p. 5). Through the systematic data tracking, significant improvement of parent knowledge was confirmed by statistical testing [t(55)=6.23, p<.0001].
5. Support of Healthy Parent-Infant Interaction To monitor parent-infant interaction, NFP administered the Dyadic Assessment of
Naturalistic Caregiver-child Experiences (DANCE). Parent-infant interactions were recognized as a mechanism to support child adaptation for cognitive development (Piaget,
1985). Bartolotta and Shulman (2016) noted that “All organisms must adapt in response to changes in the environment, and it is through this process of adaptation that a child integrates new information” (p. 36). Accordingly, the golden standards of the DANCE
Sensitivity and Responsivity scale3 were listed in Table 10 to evaluate the effect of parent-infant interaction according to the DANCE results from 17 infants.
Table 10: DANCE Results on the Sensitivity and Responsivity Scale
Sensitivity and Responsivity Scale NFP
Result
Golden
Standard
1. Positioning 99.3% 100%
2. Visual Engagement 85.6% 95%
3. Pacing 97.9% 90%
4. Negative Touch 0% 0%
5. Non-Intrusiveness 97.6% 90%
6. Responsiveness 97.6% 85%
3The DANCE Coding Sheet: Sensitivity and Responsivity Dimension
http://cittdesign.com/dance/sites/default/files/1107_12M_1_0.pdf

FIRST 5 KERN ANNUAL REPORT FISCAL YEAR 2015-2016
31
Except for the category of Negative Touch, a higher percent in Table 10 indicated a more desirable result. DANCE results in Table 10 attained or surpassed the golden
standards in nearly all components of the Sensitivity and Responsivity scale. For the Visual Engagement part, the golden standard requires that “The caregiver’s visual engagement is usually directed toward the child and/or shared focus of interest”. Beyond
the cognitive aspect, the NSF results were near or above the golden standards on other DANCE measures4, including Expressed Positive Affect, Caregiver's Affect Complements Child's Affect, Verbal Quality, and Verbal Connectedness (Table 11). Hence, NFP has
demonstrated its balanced impact to support child development in both cognitive and emotional aspects.
Table 11: DANCE Results on Emotional Quality & Behavioral Regulation
Emotional Quality and Behavioral Regulation NFP Result Golden
Standard
1. Expressed Positive Affect 98.41% 100%
2. Caregiver's Affect Complements Child's Affect 98.82% 100%
3. Verbal Quality 98.75% 100%
4. Verbal Connectedness 92.50% 75%
6. Coordination of Infant Medical Services
To support the health system improvement, First 5 Kern served as a funder and fiduciary for a care coordination project. Other partner agencies included Health Net,
Kaiser Permanente, Kern Health Systems, and San Joaquin Community Hospital. A survey was conducted to gather data from 49 local stakeholders of MVCCP. Most respondents agreed or strongly agreed that the networking helped find solutions for difficult infant
cases (Figure 14). In comparison to the result from last annual report, the percent of positive responses increased from 72% in the last year to over 75% this year.
FIGURE 14: AGREEMENT ON MVCCP SUPPORT FOR FINDING CASE SOLUTIONS
Besides the benefit in infant healthcare, MVCCP was designed to save staff time by making medical information easily accessible for individual organizations. Between the
4http://www.cittdesign.com/dance/sites/default/files/Practice5_19M_1_0.pdf
1
10
17
20
Diagree Neutral Strongly Agree Agree
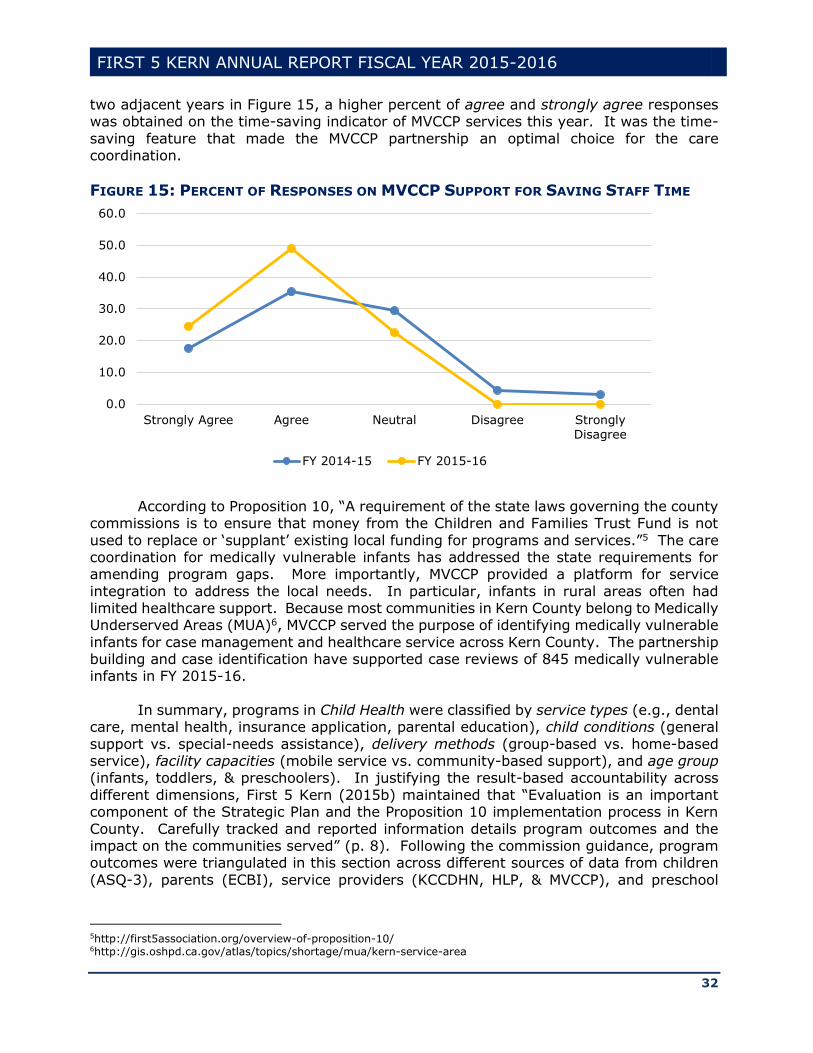
FIRST 5 KERN ANNUAL REPORT FISCAL YEAR 2015-2016
32
two adjacent years in Figure 15, a higher percent of agree and strongly agree responses was obtained on the time-saving indicator of MVCCP services this year. It was the time-
saving feature that made the MVCCP partnership an optimal choice for the care coordination.
FIGURE 15: PERCENT OF RESPONSES ON MVCCP SUPPORT FOR SAVING STAFF TIME
According to Proposition 10, “A requirement of the state laws governing the county
commissions is to ensure that money from the Children and Families Trust Fund is not
used to replace or ‘supplant’ existing local funding for programs and services.”5 The care coordination for medically vulnerable infants has addressed the state requirements for amending program gaps. More importantly, MVCCP provided a platform for service
integration to address the local needs. In particular, infants in rural areas often had limited healthcare support. Because most communities in Kern County belong to Medically Underserved Areas (MUA)6, MVCCP served the purpose of identifying medically vulnerable
infants for case management and healthcare service across Kern County. The partnership building and case identification have supported case reviews of 845 medically vulnerable infants in FY 2015-16.
In summary, programs in Child Health were classified by service types (e.g., dental
care, mental health, insurance application, parental education), child conditions (general
support vs. special-needs assistance), delivery methods (group-based vs. home-based service), facility capacities (mobile service vs. community-based support), and age group (infants, toddlers, & preschoolers). In justifying the result-based accountability across
different dimensions, First 5 Kern (2015b) maintained that “Evaluation is an important component of the Strategic Plan and the Proposition 10 implementation process in Kern
County. Carefully tracked and reported information details program outcomes and the impact on the communities served” (p. 8). Following the commission guidance, program outcomes were triangulated in this section across different sources of data from children
(ASQ-3), parents (ECBI), service providers (KCCDHN, HLP, & MVCCP), and preschool
5http://first5association.org/overview-of-proposition-10/ 6http://gis.oshpd.ca.gov/atlas/topics/shortage/mua/kern-service-area
0.0
10.0
20.0
30.0
40.0
50.0
60.0
Strongly Agree Agree Neutral Disagree StronglyDisagree
FY 2014-15 FY 2015-16

FIRST 5 KERN ANNUAL REPORT FISCAL YEAR 2015-2016
33
teachers (SESBIR). The service tracking and value-added assessment consistently indicated enhancement of service quality in Child Health across Kern County.
(II) Strengthening of Family Functioning
In Family Functioning, First 5 Kern (2015b) has strategically set a goal to ensure that “All parents/guardians and caregivers will be knowledgeable about [1] early childhood
development, [2] effective parenting and [3] community services” (p. 5). Based on the three-fold needs, three report domains were chosen from the statewide glossary definitions (see First 5 Association of California, 2013) for the local result reporting: (1)
Community Resource and Referral, (2) Targeted Intensive Family Support Services, and (3) General Parenting Education and Family Support Programs.
Domain (1) pertained to the availability of knowledge about community services. More specifically, referrals were provided by 2-1-1 Kern County to connect families to medical facilities, family resource centers, legal assistance programs, and other
community resources. Domain (2) consisted of intensive and/or clinical services in parent education, family functioning, and homeless shelter accommodation. In supporting early childhood development, Differential Responses (DR), DVRP, and GCP services were
designated to address child abuse, neglect, and other issues of family instability. Domain (3) contained family services by non-clinical staff of Family Resource Centers (FRC) to promote effective parenting. Thirteen center-based programs were grouped in this
domain to address topics of general parenting, court-mandated parent education, and case management services in different communities. In combination, Table 12 indicated an alignment between these service domains and the four objectives of Family Functioning
in First 5 Kern’s (2015b) strategic plan.
Table 12: Service Domain Alignment with Objectives of Family Functioning
Objective Service
Domain
1. Children and families will be provided with targeted and/or clinical family
support services.
(2)
2. Parents/guardians will be provided culturally-relevant parenting
education and supportive services. (3)
3. Parents/guardians will be provided with educational services to increase
family reading and/or literacy.
(3)
4. Parents/guardians and children will be provided social services (1)
In comparison, not all of the domains carried an equal weight in early childhood
support. “Of all the things that influence a child’s growth and development, the most critical is reliable, responsive, and sensitive parenting” (Bowman, Pratt, Rennekamp, & Sektnan, 2010, p. 2). Therefore, First 5 California (2015c) highlighted the need to
“Support sustainability of Family Resource Centers and other community hubs for integrated services for children and families” (p. 1). As Thompson and Uyeda (2004) observed,
Family resource centers have also emerged as a key platform for delivering family support services in an integrated fashion. They serve as “one-stop” community-
based hubs that are designed to improve access to integrated information and to
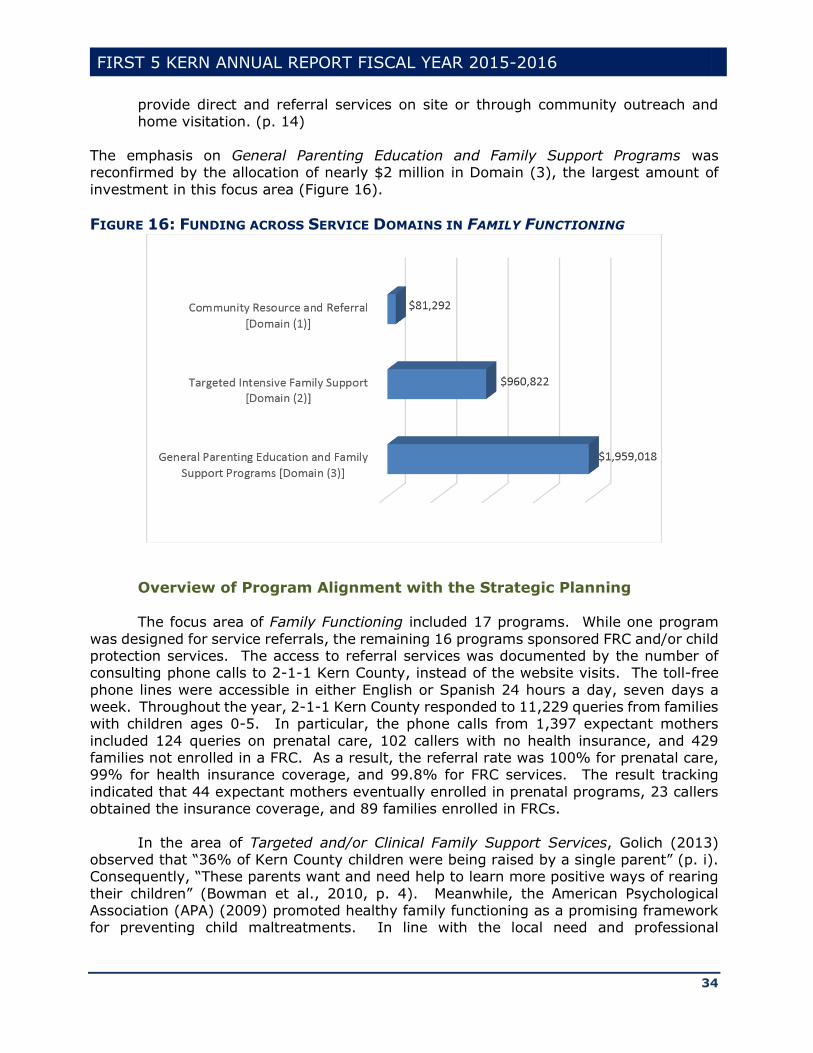
FIRST 5 KERN ANNUAL REPORT FISCAL YEAR 2015-2016
34
provide direct and referral services on site or through community outreach and home visitation. (p. 14)
The emphasis on General Parenting Education and Family Support Programs was reconfirmed by the allocation of nearly $2 million in Domain (3), the largest amount of
investment in this focus area (Figure 16).
FIGURE 16: FUNDING ACROSS SERVICE DOMAINS IN FAMILY FUNCTIONING
Overview of Program Alignment with the Strategic Planning The focus area of Family Functioning included 17 programs. While one program
was designed for service referrals, the remaining 16 programs sponsored FRC and/or child protection services. The access to referral services was documented by the number of consulting phone calls to 2-1-1 Kern County, instead of the website visits. The toll-free
phone lines were accessible in either English or Spanish 24 hours a day, seven days a week. Throughout the year, 2-1-1 Kern County responded to 11,229 queries from families with children ages 0-5. In particular, the phone calls from 1,397 expectant mothers
included 124 queries on prenatal care, 102 callers with no health insurance, and 429 families not enrolled in a FRC. As a result, the referral rate was 100% for prenatal care, 99% for health insurance coverage, and 99.8% for FRC services. The result tracking
indicated that 44 expectant mothers eventually enrolled in prenatal programs, 23 callers obtained the insurance coverage, and 89 families enrolled in FRCs.
In the area of Targeted and/or Clinical Family Support Services, Golich (2013) observed that “36% of Kern County children were being raised by a single parent” (p. i). Consequently, “These parents want and need help to learn more positive ways of rearing
their children” (Bowman et al., 2010, p. 4). Meanwhile, the American Psychological Association (APA) (2009) promoted healthy family functioning as a promising framework for preventing child maltreatments. In line with the local need and professional
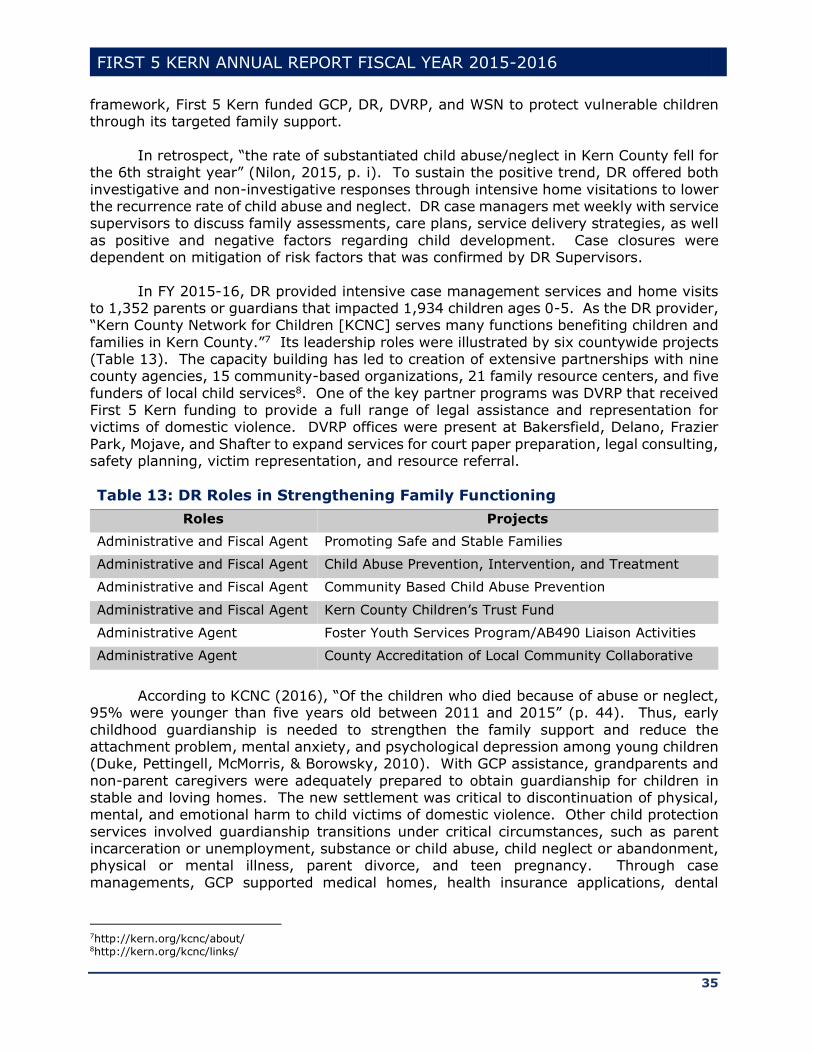
FIRST 5 KERN ANNUAL REPORT FISCAL YEAR 2015-2016
35
framework, First 5 Kern funded GCP, DR, DVRP, and WSN to protect vulnerable children through its targeted family support.
In retrospect, “the rate of substantiated child abuse/neglect in Kern County fell for
the 6th straight year” (Nilon, 2015, p. i). To sustain the positive trend, DR offered both
investigative and non-investigative responses through intensive home visitations to lower the recurrence rate of child abuse and neglect. DR case managers met weekly with service supervisors to discuss family assessments, care plans, service delivery strategies, as well
as positive and negative factors regarding child development. Case closures were dependent on mitigation of risk factors that was confirmed by DR Supervisors.
In FY 2015-16, DR provided intensive case management services and home visits to 1,352 parents or guardians that impacted 1,934 children ages 0-5. As the DR provider, “Kern County Network for Children [KCNC] serves many functions benefiting children and
families in Kern County.”7 Its leadership roles were illustrated by six countywide projects (Table 13). The capacity building has led to creation of extensive partnerships with nine county agencies, 15 community-based organizations, 21 family resource centers, and five
funders of local child services8. One of the key partner programs was DVRP that received First 5 Kern funding to provide a full range of legal assistance and representation for victims of domestic violence. DVRP offices were present at Bakersfield, Delano, Frazier
Park, Mojave, and Shafter to expand services for court paper preparation, legal consulting, safety planning, victim representation, and resource referral.
Table 13: DR Roles in Strengthening Family Functioning
Roles Projects
Administrative and Fiscal Agent Promoting Safe and Stable Families
Administrative and Fiscal Agent Child Abuse Prevention, Intervention, and Treatment
Administrative and Fiscal Agent Community Based Child Abuse Prevention
Administrative and Fiscal Agent Kern County Children’s Trust Fund
Administrative Agent Foster Youth Services Program/AB490 Liaison Activities
Administrative Agent County Accreditation of Local Community Collaborative
According to KCNC (2016), “Of the children who died because of abuse or neglect,
95% were younger than five years old between 2011 and 2015” (p. 44). Thus, early
childhood guardianship is needed to strengthen the family support and reduce the attachment problem, mental anxiety, and psychological depression among young children (Duke, Pettingell, McMorris, & Borowsky, 2010). With GCP assistance, grandparents and
non-parent caregivers were adequately prepared to obtain guardianship for children in stable and loving homes. The new settlement was critical to discontinuation of physical, mental, and emotional harm to child victims of domestic violence. Other child protection
services involved guardianship transitions under critical circumstances, such as parent incarceration or unemployment, substance or child abuse, child neglect or abandonment, physical or mental illness, parent divorce, and teen pregnancy. Through case
managements, GCP supported medical homes, health insurance applications, dental
7http://kern.org/kcnc/about/ 8http://kern.org/kcnc/links/
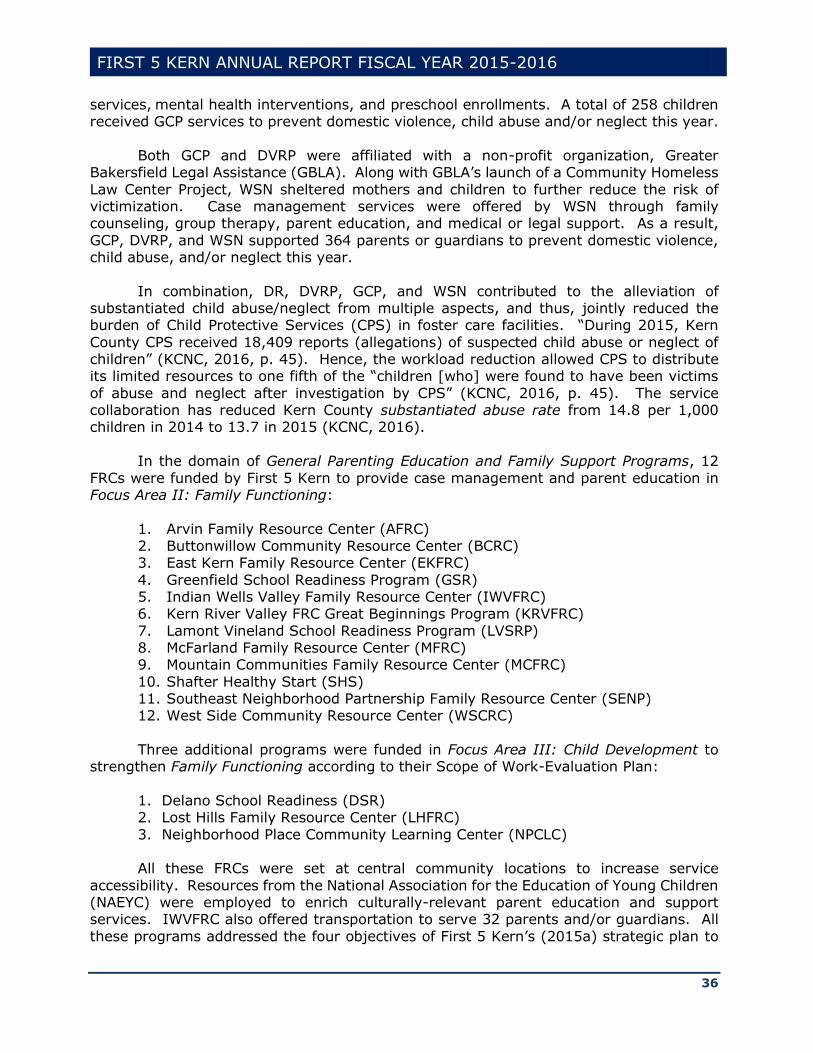
FIRST 5 KERN ANNUAL REPORT FISCAL YEAR 2015-2016
36
services, mental health interventions, and preschool enrollments. A total of 258 children received GCP services to prevent domestic violence, child abuse and/or neglect this year.
Both GCP and DVRP were affiliated with a non-profit organization, Greater
Bakersfield Legal Assistance (GBLA). Along with GBLA’s launch of a Community Homeless
Law Center Project, WSN sheltered mothers and children to further reduce the risk of victimization. Case management services were offered by WSN through family counseling, group therapy, parent education, and medical or legal support. As a result,
GCP, DVRP, and WSN supported 364 parents or guardians to prevent domestic violence, child abuse, and/or neglect this year.
In combination, DR, DVRP, GCP, and WSN contributed to the alleviation of substantiated child abuse/neglect from multiple aspects, and thus, jointly reduced the burden of Child Protective Services (CPS) in foster care facilities. “During 2015, Kern
County CPS received 18,409 reports (allegations) of suspected child abuse or neglect of children” (KCNC, 2016, p. 45). Hence, the workload reduction allowed CPS to distribute its limited resources to one fifth of the “children [who] were found to have been victims
of abuse and neglect after investigation by CPS” (KCNC, 2016, p. 45). The service collaboration has reduced Kern County substantiated abuse rate from 14.8 per 1,000 children in 2014 to 13.7 in 2015 (KCNC, 2016).
In the domain of General Parenting Education and Family Support Programs, 12
FRCs were funded by First 5 Kern to provide case management and parent education in Focus Area II: Family Functioning:
1. Arvin Family Resource Center (AFRC) 2. Buttonwillow Community Resource Center (BCRC) 3. East Kern Family Resource Center (EKFRC)
4. Greenfield School Readiness Program (GSR) 5. Indian Wells Valley Family Resource Center (IWVFRC) 6. Kern River Valley FRC Great Beginnings Program (KRVFRC)
7. Lamont Vineland School Readiness Program (LVSRP) 8. McFarland Family Resource Center (MFRC) 9. Mountain Communities Family Resource Center (MCFRC)
10. Shafter Healthy Start (SHS) 11. Southeast Neighborhood Partnership Family Resource Center (SENP) 12. West Side Community Resource Center (WSCRC)
Three additional programs were funded in Focus Area III: Child Development to
strengthen Family Functioning according to their Scope of Work-Evaluation Plan:
1. Delano School Readiness (DSR) 2. Lost Hills Family Resource Center (LHFRC)
3. Neighborhood Place Community Learning Center (NPCLC) All these FRCs were set at central community locations to increase service
accessibility. Resources from the National Association for the Education of Young Children (NAEYC) were employed to enrich culturally-relevant parent education and support services. IWVFRC also offered transportation to serve 32 parents and/or guardians. All
these programs addressed the four objectives of First 5 Kern’s (2015a) strategic plan to
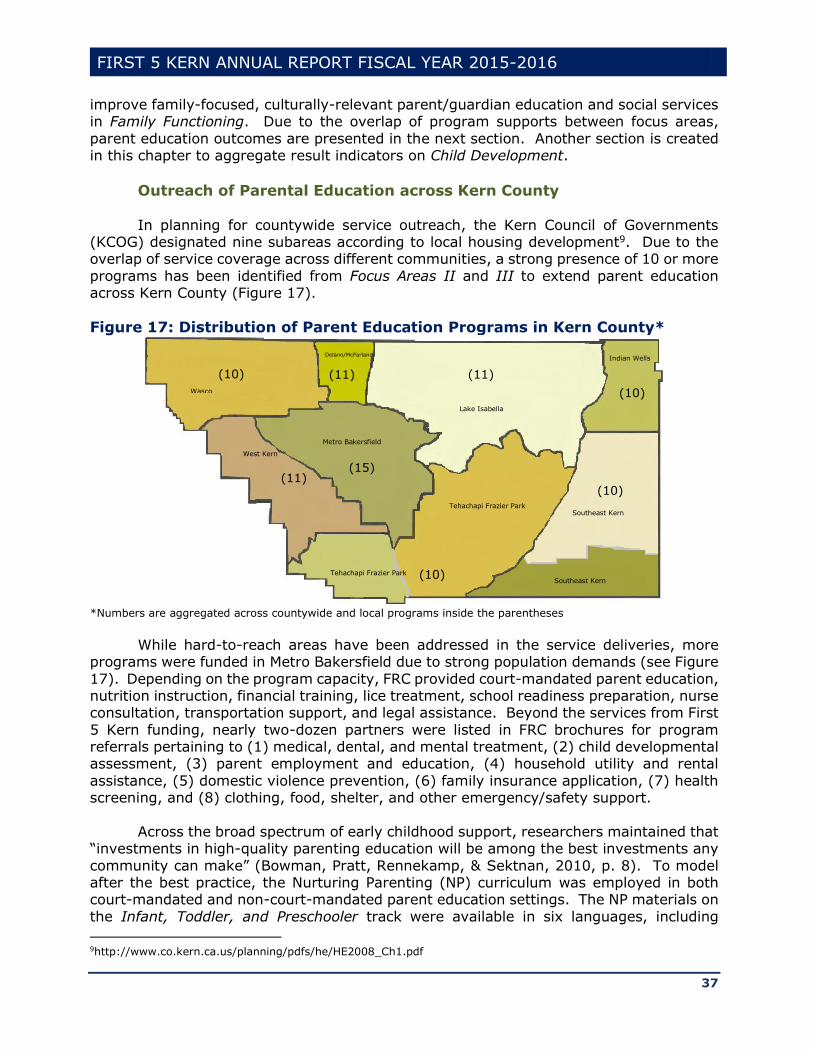
FIRST 5 KERN ANNUAL REPORT FISCAL YEAR 2015-2016
37
improve family-focused, culturally-relevant parent/guardian education and social services in Family Functioning. Due to the overlap of program supports between focus areas,
parent education outcomes are presented in the next section. Another section is created in this chapter to aggregate result indicators on Child Development.
Outreach of Parental Education across Kern County
In planning for countywide service outreach, the Kern Council of Governments (KCOG) designated nine subareas according to local housing development9. Due to the overlap of service coverage across different communities, a strong presence of 10 or more
programs has been identified from Focus Areas II and III to extend parent education across Kern County (Figure 17).
Figure 17: Distribution of Parent Education Programs in Kern County*
*Numbers are aggregated across countywide and local programs inside the parentheses
While hard-to-reach areas have been addressed in the service deliveries, more
programs were funded in Metro Bakersfield due to strong population demands (see Figure
17). Depending on the program capacity, FRC provided court-mandated parent education, nutrition instruction, financial training, lice treatment, school readiness preparation, nurse consultation, transportation support, and legal assistance. Beyond the services from First
5 Kern funding, nearly two-dozen partners were listed in FRC brochures for program referrals pertaining to (1) medical, dental, and mental treatment, (2) child developmental assessment, (3) parent employment and education, (4) household utility and rental
assistance, (5) domestic violence prevention, (6) family insurance application, (7) health screening, and (8) clothing, food, shelter, and other emergency/safety support.
Across the broad spectrum of early childhood support, researchers maintained that
“investments in high-quality parenting education will be among the best investments any
community can make” (Bowman, Pratt, Rennekamp, & Sektnan, 2010, p. 8). To model after the best practice, the Nurturing Parenting (NP) curriculum was employed in both court-mandated and non-court-mandated parent education settings. The NP materials on
the Infant, Toddler, and Preschooler track were available in six languages, including
9http://www.co.kern.ca.us/planning/pdfs/he/HE2008_Ch1.pdf
Wasco
(10)
Delano/McFarland
(11)
Lake Isabella
(11)
Indian Wells
(10)
(10)
Metro Bakersfield
(15)
Tehachapi Frazier Park
Tehachapi Frazier Park (10)
Southeast Kern
Southeast Kern
(11)
West Kern
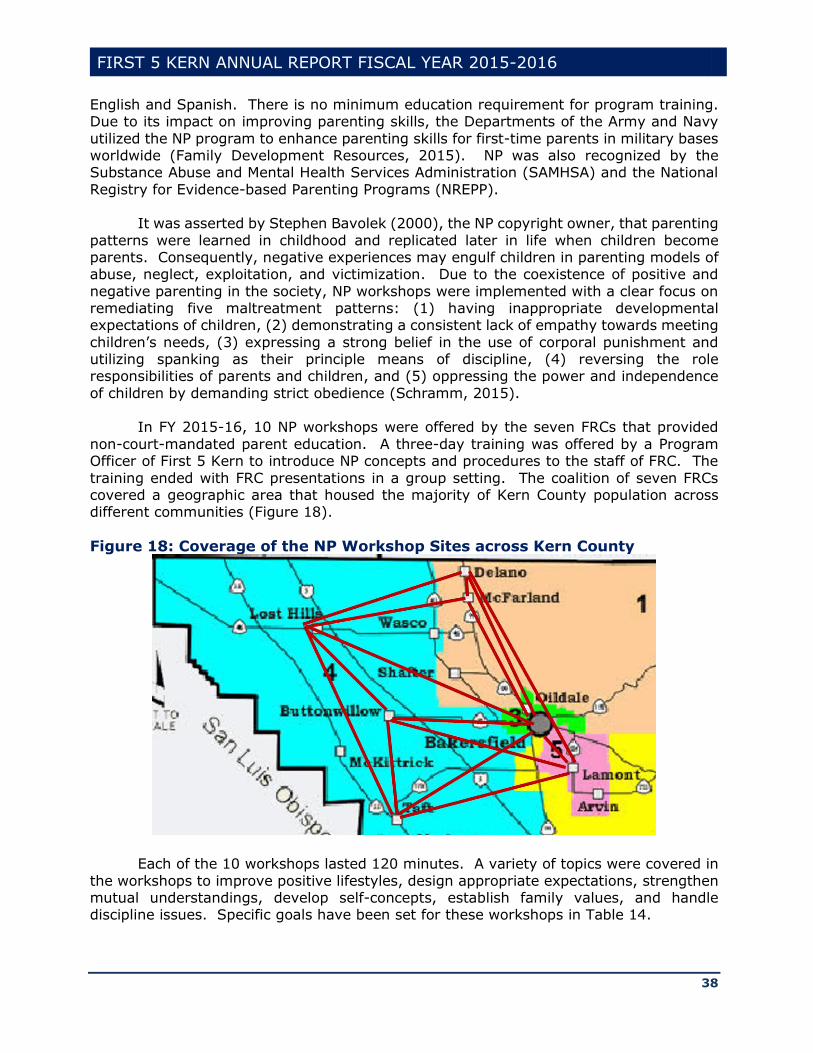
FIRST 5 KERN ANNUAL REPORT FISCAL YEAR 2015-2016
38
English and Spanish. There is no minimum education requirement for program training. Due to its impact on improving parenting skills, the Departments of the Army and Navy
utilized the NP program to enhance parenting skills for first-time parents in military bases worldwide (Family Development Resources, 2015). NP was also recognized by the Substance Abuse and Mental Health Services Administration (SAMHSA) and the National
Registry for Evidence-based Parenting Programs (NREPP). It was asserted by Stephen Bavolek (2000), the NP copyright owner, that parenting
patterns were learned in childhood and replicated later in life when children become parents. Consequently, negative experiences may engulf children in parenting models of abuse, neglect, exploitation, and victimization. Due to the coexistence of positive and
negative parenting in the society, NP workshops were implemented with a clear focus on remediating five maltreatment patterns: (1) having inappropriate developmental expectations of children, (2) demonstrating a consistent lack of empathy towards meeting
children’s needs, (3) expressing a strong belief in the use of corporal punishment and utilizing spanking as their principle means of discipline, (4) reversing the role responsibilities of parents and children, and (5) oppressing the power and independence
of children by demanding strict obedience (Schramm, 2015). In FY 2015-16, 10 NP workshops were offered by the seven FRCs that provided
non-court-mandated parent education. A three-day training was offered by a Program Officer of First 5 Kern to introduce NP concepts and procedures to the staff of FRC. The
training ended with FRC presentations in a group setting. The coalition of seven FRCs covered a geographic area that housed the majority of Kern County population across different communities (Figure 18).
Figure 18: Coverage of the NP Workshop Sites across Kern County
Each of the 10 workshops lasted 120 minutes. A variety of topics were covered in
the workshops to improve positive lifestyles, design appropriate expectations, strengthen mutual understandings, develop self-concepts, establish family values, and handle discipline issues. Specific goals have been set for these workshops in Table 14.
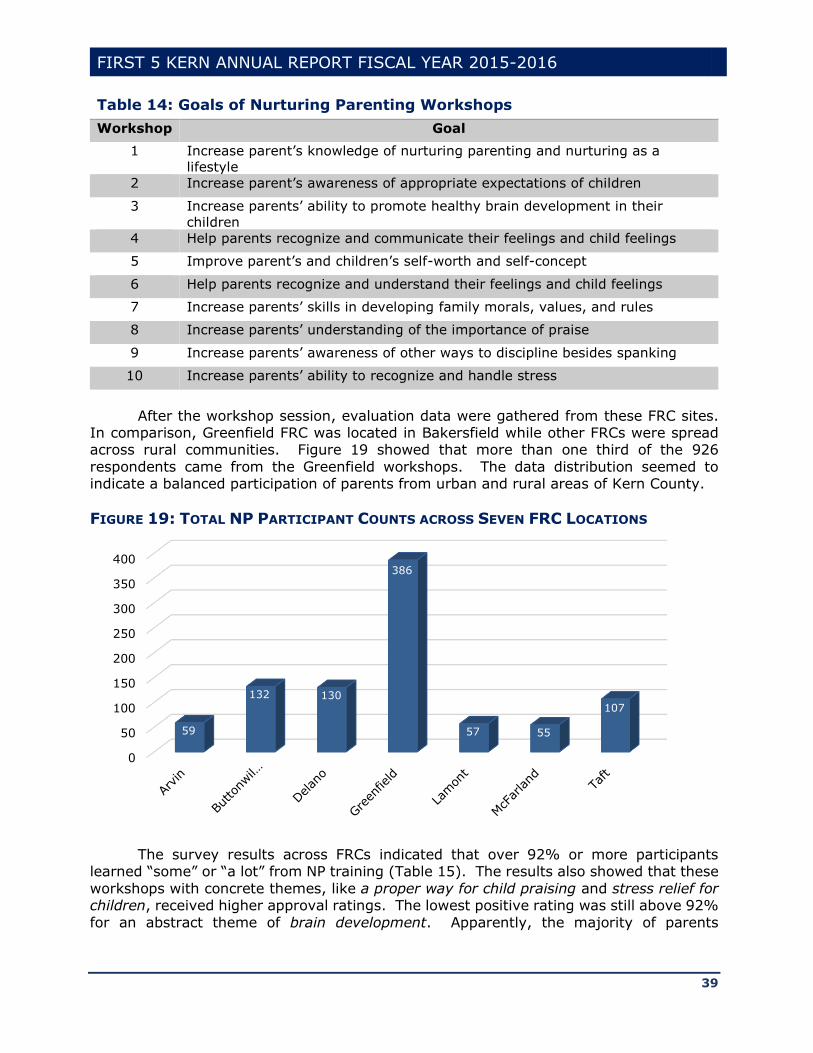
FIRST 5 KERN ANNUAL REPORT FISCAL YEAR 2015-2016
39
Table 14: Goals of Nurturing Parenting Workshops
Workshop Goal
1 Increase parent’s knowledge of nurturing parenting and nurturing as a
lifestyle
2 Increase parent’s awareness of appropriate expectations of children
3 Increase parents’ ability to promote healthy brain development in their
children
4 Help parents recognize and communicate their feelings and child feelings
5 Improve parent’s and children’s self-worth and self-concept
6 Help parents recognize and understand their feelings and child feelings
7 Increase parents’ skills in developing family morals, values, and rules
8 Increase parents’ understanding of the importance of praise
9 Increase parents’ awareness of other ways to discipline besides spanking
10 Increase parents’ ability to recognize and handle stress
After the workshop session, evaluation data were gathered from these FRC sites. In comparison, Greenfield FRC was located in Bakersfield while other FRCs were spread across rural communities. Figure 19 showed that more than one third of the 926
respondents came from the Greenfield workshops. The data distribution seemed to indicate a balanced participation of parents from urban and rural areas of Kern County.
FIGURE 19: TOTAL NP PARTICIPANT COUNTS ACROSS SEVEN FRC LOCATIONS
The survey results across FRCs indicated that over 92% or more participants learned “some” or “a lot” from NP training (Table 15). The results also showed that these
workshops with concrete themes, like a proper way for child praising and stress relief for children, received higher approval ratings. The lowest positive rating was still above 92%
for an abstract theme of brain development. Apparently, the majority of parents
0
50
100
150
200
250
300
350
400
59
132 130
386
57 55
107
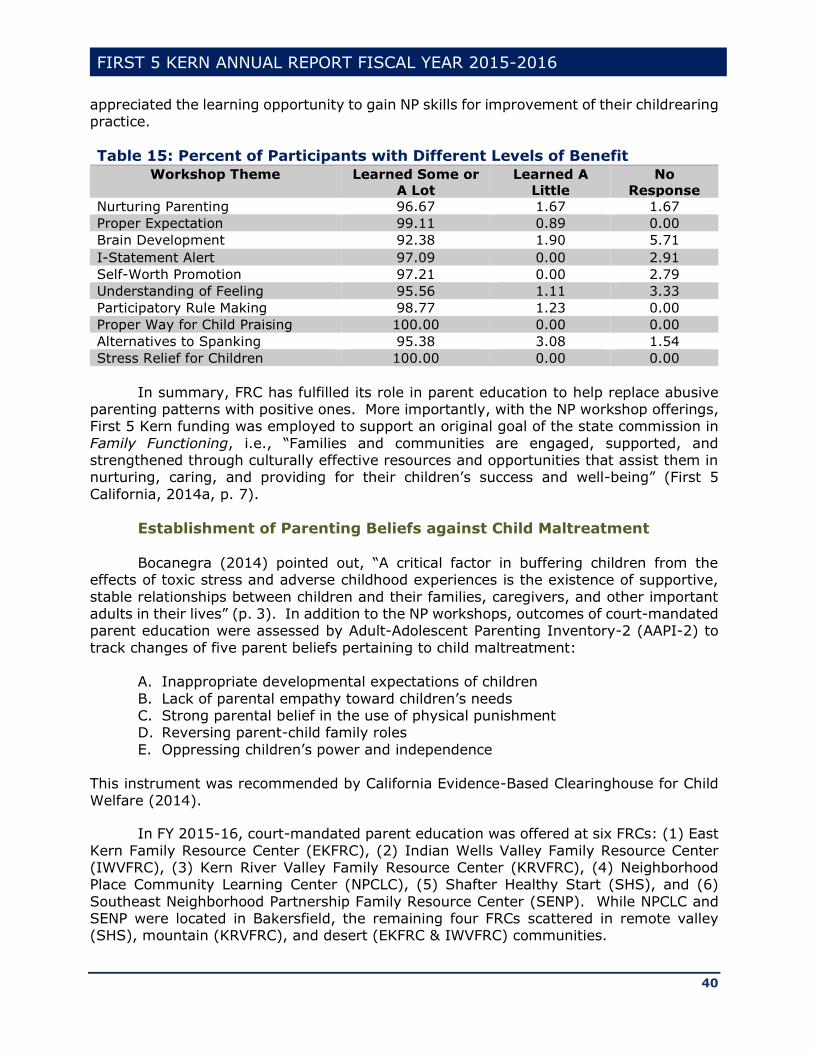
FIRST 5 KERN ANNUAL REPORT FISCAL YEAR 2015-2016
40
appreciated the learning opportunity to gain NP skills for improvement of their childrearing practice.
Table 15: Percent of Participants with Different Levels of Benefit
Workshop Theme Learned Some or
A Lot
Learned A
Little
No
Response
Nurturing Parenting 96.67 1.67 1.67
Proper Expectation 99.11 0.89 0.00
Brain Development 92.38 1.90 5.71
I-Statement Alert 97.09 0.00 2.91
Self-Worth Promotion 97.21 0.00 2.79
Understanding of Feeling 95.56 1.11 3.33
Participatory Rule Making 98.77 1.23 0.00
Proper Way for Child Praising 100.00 0.00 0.00
Alternatives to Spanking 95.38 3.08 1.54
Stress Relief for Children 100.00 0.00 0.00
In summary, FRC has fulfilled its role in parent education to help replace abusive parenting patterns with positive ones. More importantly, with the NP workshop offerings, First 5 Kern funding was employed to support an original goal of the state commission in
Family Functioning, i.e., “Families and communities are engaged, supported, and strengthened through culturally effective resources and opportunities that assist them in nurturing, caring, and providing for their children’s success and well-being” (First 5
California, 2014a, p. 7).
Establishment of Parenting Beliefs against Child Maltreatment
Bocanegra (2014) pointed out, “A critical factor in buffering children from the effects of toxic stress and adverse childhood experiences is the existence of supportive,
stable relationships between children and their families, caregivers, and other important adults in their lives” (p. 3). In addition to the NP workshops, outcomes of court-mandated parent education were assessed by Adult-Adolescent Parenting Inventory-2 (AAPI-2) to
track changes of five parent beliefs pertaining to child maltreatment: A. Inappropriate developmental expectations of children
B. Lack of parental empathy toward children’s needs C. Strong parental belief in the use of physical punishment D. Reversing parent-child family roles
E. Oppressing children’s power and independence
This instrument was recommended by California Evidence-Based Clearinghouse for Child
Welfare (2014).
In FY 2015-16, court-mandated parent education was offered at six FRCs: (1) East
Kern Family Resource Center (EKFRC), (2) Indian Wells Valley Family Resource Center (IWVFRC), (3) Kern River Valley Family Resource Center (KRVFRC), (4) Neighborhood Place Community Learning Center (NPCLC), (5) Shafter Healthy Start (SHS), and (6)
Southeast Neighborhood Partnership Family Resource Center (SENP). While NPCLC and SENP were located in Bakersfield, the remaining four FRCs scattered in remote valley (SHS), mountain (KRVFRC), and desert (EKFRC & IWVFRC) communities.

FIRST 5 KERN ANNUAL REPORT FISCAL YEAR 2015-2016
41
Depending on the program settings, the pretest and posttest data were collected in two ways. The SHS and SENP programs were cohort-based, and thus, the same
numbers of observations were monitored during the result tracking (Figure 20). Meanwhile, four other programs offered continuous services for parents across adjacent years. Therefore, pretest performances were retained from last year to facilitate the
record-matching with the posttest data this year. As a result, a total of 147 pairs of records were tracked in the AAPI data gathering across the six programs. The local population density was higher in SENP and NPCLC for its service coverage in Metro
Bakersfield. Thus, Figure 20 showed nearly half of the data tracking from these two programs, regardless of their focus area difference between Family Functioning (SENP) and Child Development (NPCLC). Through the local strategic planning, the focus area
identification was based on the primary fund allocation, which permitted the service overlap in parent education.
FIGURE 20: SIZES OF AAPI-2 DATA FOR THE RESULT TRACKING
Unlike other center-based services, court-mandated parent education abided by the legal requirement. It was the mandatory service that strengthened the consistency
of service outcomes. For instance, Table 16 showed significant improvement on parental empathy toward children’s need in all six programs at =.05 (see Construct B). Three
programs (IWVFRC, NPCLC, & SENP) that served over 63% of the parents also demonstrated significant improvement on all five AAPI-2 constructs (Table 16). In the
other AAPI-2 domains, at least four programs showed an effect size larger than 0.60, suggesting a moderate to strong program impact on parent beliefs.
In particular, the NP empathy definition was grounded on dual aspects of Gallo (1989), i.e., “the term empathy is used in at least two ways; to mean a predominantly cognitive response, understanding how another feels, or to mean an affective communion
with the other” (p.100). The large effect sizes in Table 16 suggested that all six programs had a strong impact on the enhancement of parental empathy toward children’s needs, regardless of the sample size variation from 12 to 45 (Figure 20). At ages 0-5, well-
rounded child development largely depended on the parental empathy (Rintoul, Thorne, Wallace, Mobley, Goldman-Fraser, & Luckey, 1998). In this regard, the court-mandated
0
20
40
60
80
100
120
140
EKFRC IWVFRC KRVFRC NPCLC SHS SENP
38
82
26
127
26 26
12
2216
45
26 26
Initial Participants Tracked Participants

FIRST 5 KERN ANNUAL REPORT FISCAL YEAR 2015-2016
42
parent education has unanimously improved parent understanding of child feeling and communication to reduce child maltreatment in both urban and rural communities.
Table 16: Impact of Court-Mandated Parent Education: AAPI-2 Findings
Construct Focus
Area
Program* Result
A. Expectations
of Children
II EKFRC t(11)=1.26, p=.2323; Effect Size=0.76
IWVFRC t(21)=10.57, p<.0001; Effect Size=4.61
KRVFRC t(15)=3.44, p=.0037; Effect Size=1.78
SENP t(25)=5.83, p<.0001; Effect Size=2.33
SHS t(25)=0.73, p=.4698; Effect Size=0.29
III NPCLC t(44)=12.07, p<.0001; Effect Size=3.64
B. Parental
Empathy
II EKFRC t(11)=2.96, p=.0129; Effect Size=1.78
IWVFRC t(21)=8.13, p<.0001; Effect Size=3.55
KRVFRC t(15)=4.78, p=.0002; Effect Size=2.47
SENP t(25)=13.29, p<.0001; Effect Size=5.32
SHS t(25)=5.15, p<.0001; Effect Size=2.06
III NPCLC t(44)=11.62, p<.0001; Effect Size=3.50
C. Physical
Punishment
II EKFRC t(11)=1.14, p=.2784; Effect Size=0.68
IWVFRC t(21)=7.42, p<.0001; Effect Size=3.24
KRVFRC t(15)=1.40, p=.1826; Effect Size=0.72
SENP t(25)=7.42, p<.0001; Effect Size=2.97
SHS t(25)=3.67, p=.0012; Effect Size=1.47
III NPCLC t(44)=8.25, p<.0001; Effect Size=2.57
D. Parent-Child
Roles
II EKFRC t(11)=-.95, p=.3627; Effect Size=0.57
IWVFRC t(21)=7.31, p<.0001; Effect Size=3.19
KRVFRC t(15)=1.76, p=.0980; Effect Size=0.91
SENP t(25)=5.48, p<.0001; Effect Size=2.19
SHS t(25)=0.81, p=.4282; Effect Size=0.32
III NPCLC t(44)=10.12, p<.0001; Effect Size=3.05
E. Child Power
and
Independence
II EKFRC t(11)=2.26, p=.0453; Effect Size=1.36
IWVFRC t(21)=7.48, p<.0001; Effect Size=3.26
KRVFRC t(15)=-.78, p=.4486; Effect Size=0.40
SENP t(25)=5.48, p<.0001; Effect Size=1.59
SHS t(25)=1.10, p=.2810; Effect Size=0.44
III NPCLC t(44)=7.26, p<.0001; Effect Size=2.19 *Program acronyms are listed in Appendix A.
Restoration of Family Functioning for Child Protection
In early childhood development, Kern County’s substantiated child abuse rate for
newborns under age 1 was more than twice of the rate across California. The corresponding gap was much smaller at ages 16-17 (Figure 21). According to KCNC (2016), “In 2015, 588 infants were the victims of child abuse in Kern County, a rate of
40.5 per 1,000 infants. This rate among infants was nearly three times higher than Kern’s overall rate of substantiated abuse and neglect” (p. 37). Hence, young children need more protective services in Kern County. At the beginning of this funding cycle, First 5
Kern funded four programs to support restoration of family functioning for early childhood protection. The result tracking is reported in this section to assess the program effectiveness.
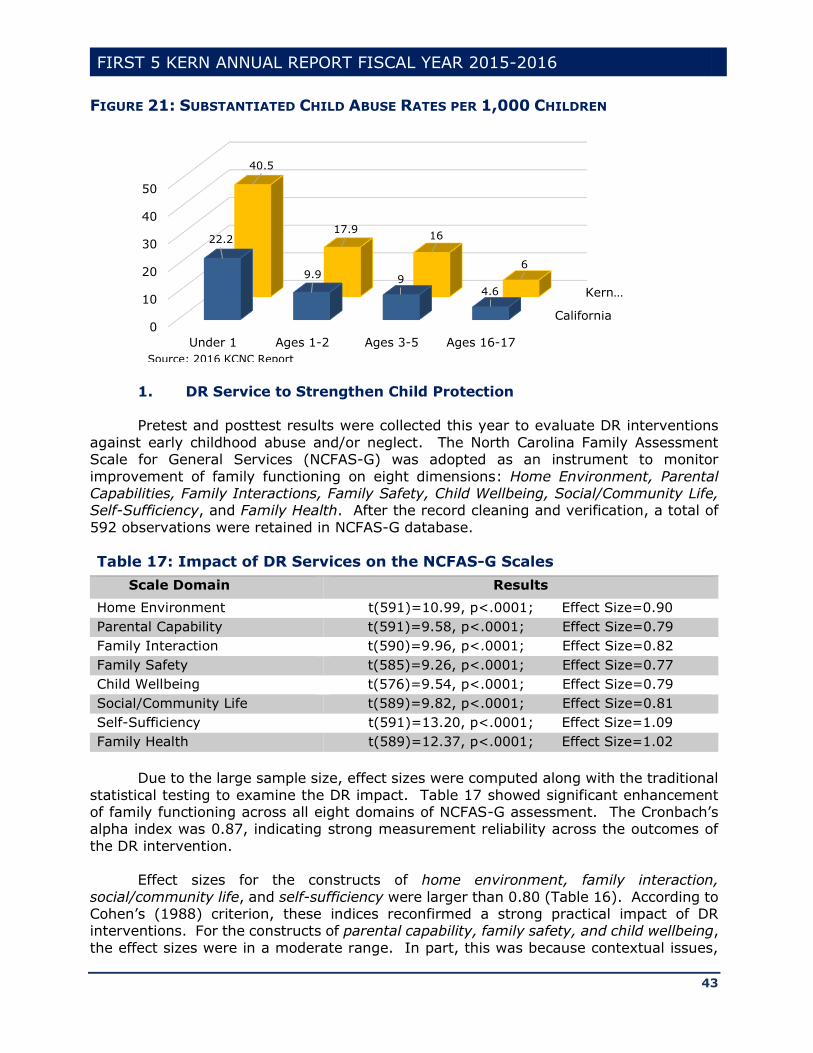
FIRST 5 KERN ANNUAL REPORT FISCAL YEAR 2015-2016
43
FIGURE 21: SUBSTANTIATED CHILD ABUSE RATES PER 1,000 CHILDREN
1. DR Service to Strengthen Child Protection
Pretest and posttest results were collected this year to evaluate DR interventions
against early childhood abuse and/or neglect. The North Carolina Family Assessment Scale for General Services (NCFAS-G) was adopted as an instrument to monitor
improvement of family functioning on eight dimensions: Home Environment, Parental Capabilities, Family Interactions, Family Safety, Child Wellbeing, Social/Community Life, Self-Sufficiency, and Family Health. After the record cleaning and verification, a total of
592 observations were retained in NCFAS-G database.
Table 17: Impact of DR Services on the NCFAS-G Scales
Scale Domain Results
Home Environment t(591)=10.99, p<.0001; Effect Size=0.90
Parental Capability t(591)=9.58, p<.0001; Effect Size=0.79
Family Interaction t(590)=9.96, p<.0001; Effect Size=0.82
Family Safety t(585)=9.26, p<.0001; Effect Size=0.77
Child Wellbeing t(576)=9.54, p<.0001; Effect Size=0.79
Social/Community Life t(589)=9.82, p<.0001; Effect Size=0.81
Self-Sufficiency t(591)=13.20, p<.0001; Effect Size=1.09
Family Health t(589)=12.37, p<.0001; Effect Size=1.02
Due to the large sample size, effect sizes were computed along with the traditional
statistical testing to examine the DR impact. Table 17 showed significant enhancement of family functioning across all eight domains of NCFAS-G assessment. The Cronbach’s alpha index was 0.87, indicating strong measurement reliability across the outcomes of
the DR intervention. Effect sizes for the constructs of home environment, family interaction,
social/community life, and self-sufficiency were larger than 0.80 (Table 16). According to Cohen’s (1988) criterion, these indices reconfirmed a strong practical impact of DR interventions. For the constructs of parental capability, family safety, and child wellbeing,
the effect sizes were in a moderate range. In part, this was because contextual issues,
California
Kern…
0
10
20
30
40
50
Under 1 Ages 1-2 Ages 3-5 Ages 16-17
22.2
9.9 94.6
40.5
17.916
6
Source: 2016 KCNC Report
FIRST 5 KERN ANNUAL REPORT FISCAL YEAR 2015-2016
44
such as poverty, were largely beyond the program control. As Nilon (2015) reported, “poverty can increase a child’s chance of experiencing abuse and neglect, particularly
when poverty is combined with other risk factors such as inadequate housing, lack of health care and transportation, social isolation, and parental depression and substance abuse” (p. i).
2. DVRP Support to Reduce Domestic Violence
Domestic violence is a devastating problem that directly undermines family functioning. While legal procedures were developed to serve adult victims, “increasing attention is now focused on the children who witness domestic violence” (Bragg, 2003, p.
5). DVRP is a countywide program that implemented a comprehensive protocol to provide a full range of legal assistance for child protection. Upon case identification, DVRP assigned a supervising attorney and two paralegals to examine the issue of child exposure
to domestic violence. Feasible plans were developed to protect children and other victims with substantiated abuse experiences. Weekly meetings were held to monitor case developments. The service also included interpretation support for clients in 21
languages.10
At end of the DVRP services, 33 victims of domestic violence responded to a
program survey to unanimously indicate their agreements on five items: (1) My sense of safety and peace of mind have been restored, (2) The child(ren) live in a safe environment,
(3) The child(ren) are no longer exposed to domestic violence, (4) I know my rights and protections as a victim of domestic violence, and (5) The child(ren) in the household are not subjected to abuse and/or neglect. Consistency of the positive responses were
confirmed by a high reliability index (Cronbach’s alpha=.98). Except for one uncertain answer, all respondents agreed or strongly agreed that “The child(ren) live in a stable environment”.
3. GCP Services for Child Protection
Issues of domestic violence often led to divorce (Pollet, 2011). “When a child cannot be returned home and adoption is not in the child’s best interests, then guardianship is considered to be a more permanent plan for a child” (KCNC, 2016, p. 50). GCP assisted
caregivers to prevent abuse or neglect of children ages 0-5 through establishment of guardianship protection. The wide-ranging services include (1) representation of prospective caregivers in preparing and filing guardianship petitions, (2) responding to
objections, (3) planning for mediations and guardianship hearings, and (4) completion of post-hearing letters and orders. In FY 2015-16, goals have been set for GCP to serve 180 guardians and 200 children. GCP surpassed these goals by serving 192 guardians and
258 children. For more than a decade, the rate of child abuse/neglect in Kern County has been
around 9.2% while the state rate was kept under 7%11. It was reported that “37% of Kern County children were being raised by a single parent and 7% by their grandparents” (KCNC, 2016, p. i). With GCP’s completion rates of 107% for guardians and 129% for
children, the compelling outcome of service expansion has addressed a persistent need in Kern County. Exit surveys were conducted in FY 2015-16 to contrast current (N=32) and
10http://gbla.org/about-gbla/history/ 11Kidsdata.org.
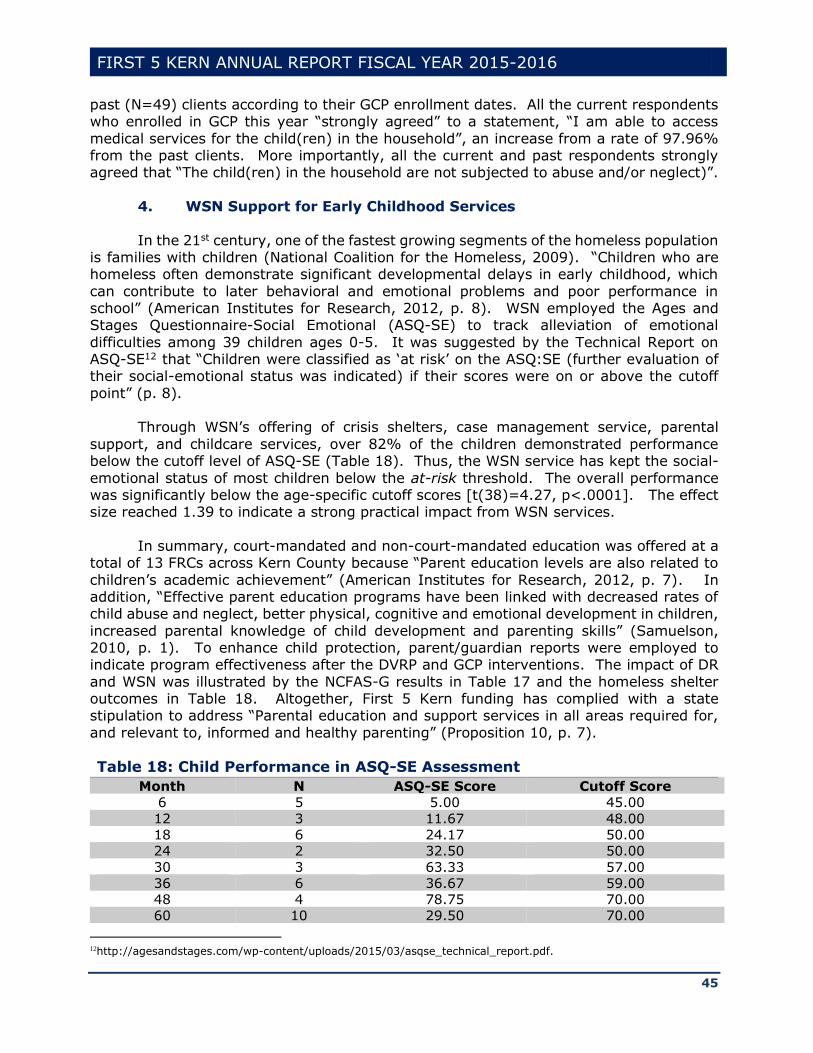
FIRST 5 KERN ANNUAL REPORT FISCAL YEAR 2015-2016
45
past (N=49) clients according to their GCP enrollment dates. All the current respondents who enrolled in GCP this year “strongly agreed” to a statement, “I am able to access
medical services for the child(ren) in the household”, an increase from a rate of 97.96% from the past clients. More importantly, all the current and past respondents strongly agreed that “The child(ren) in the household are not subjected to abuse and/or neglect)”.
4. WSN Support for Early Childhood Services
In the 21st century, one of the fastest growing segments of the homeless population is families with children (National Coalition for the Homeless, 2009). “Children who are homeless often demonstrate significant developmental delays in early childhood, which
can contribute to later behavioral and emotional problems and poor performance in school” (American Institutes for Research, 2012, p. 8). WSN employed the Ages and Stages Questionnaire-Social Emotional (ASQ-SE) to track alleviation of emotional
difficulties among 39 children ages 0-5. It was suggested by the Technical Report on ASQ-SE12 that “Children were classified as ‘at risk’ on the ASQ:SE (further evaluation of their social-emotional status was indicated) if their scores were on or above the cutoff
point” (p. 8). Through WSN’s offering of crisis shelters, case management service, parental
support, and childcare services, over 82% of the children demonstrated performance below the cutoff level of ASQ-SE (Table 18). Thus, the WSN service has kept the social-
emotional status of most children below the at-risk threshold. The overall performance was significantly below the age-specific cutoff scores [t(38)=4.27, p<.0001]. The effect size reached 1.39 to indicate a strong practical impact from WSN services.
In summary, court-mandated and non-court-mandated education was offered at a
total of 13 FRCs across Kern County because “Parent education levels are also related to
children’s academic achievement” (American Institutes for Research, 2012, p. 7). In addition, “Effective parent education programs have been linked with decreased rates of child abuse and neglect, better physical, cognitive and emotional development in children,
increased parental knowledge of child development and parenting skills” (Samuelson, 2010, p. 1). To enhance child protection, parent/guardian reports were employed to indicate program effectiveness after the DVRP and GCP interventions. The impact of DR
and WSN was illustrated by the NCFAS-G results in Table 17 and the homeless shelter outcomes in Table 18. Altogether, First 5 Kern funding has complied with a state stipulation to address “Parental education and support services in all areas required for,
and relevant to, informed and healthy parenting” (Proposition 10, p. 7).
Table 18: Child Performance in ASQ-SE Assessment
Month N ASQ-SE Score Cutoff Score
6 5 5.00 45.00
12 3 11.67 48.00
18 6 24.17 50.00
24 2 32.50 50.00
30 3 63.33 57.00
36 6 36.67 59.00
48 4 78.75 70.00
60 10 29.50 70.00
12http://agesandstages.com/wp-content/uploads/2015/03/asqse_technical_report.pdf.
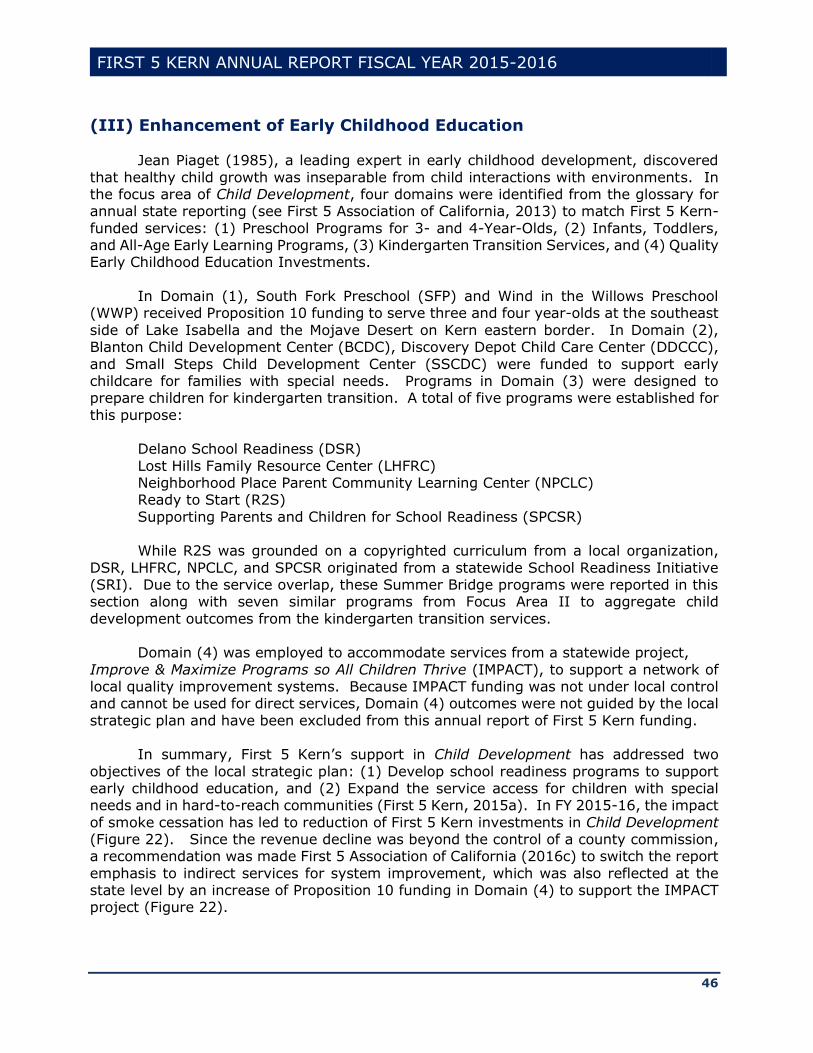
FIRST 5 KERN ANNUAL REPORT FISCAL YEAR 2015-2016
46
(III) Enhancement of Early Childhood Education
Jean Piaget (1985), a leading expert in early childhood development, discovered
that healthy child growth was inseparable from child interactions with environments. In the focus area of Child Development, four domains were identified from the glossary for annual state reporting (see First 5 Association of California, 2013) to match First 5 Kern-
funded services: (1) Preschool Programs for 3- and 4-Year-Olds, (2) Infants, Toddlers, and All-Age Early Learning Programs, (3) Kindergarten Transition Services, and (4) Quality Early Childhood Education Investments.
In Domain (1), South Fork Preschool (SFP) and Wind in the Willows Preschool
(WWP) received Proposition 10 funding to serve three and four year-olds at the southeast
side of Lake Isabella and the Mojave Desert on Kern eastern border. In Domain (2), Blanton Child Development Center (BCDC), Discovery Depot Child Care Center (DDCCC),
and Small Steps Child Development Center (SSCDC) were funded to support early childcare for families with special needs. Programs in Domain (3) were designed to prepare children for kindergarten transition. A total of five programs were established for
this purpose: Delano School Readiness (DSR)
Lost Hills Family Resource Center (LHFRC) Neighborhood Place Parent Community Learning Center (NPCLC) Ready to Start (R2S)
Supporting Parents and Children for School Readiness (SPCSR) While R2S was grounded on a copyrighted curriculum from a local organization,
DSR, LHFRC, NPCLC, and SPCSR originated from a statewide School Readiness Initiative (SRI). Due to the service overlap, these Summer Bridge programs were reported in this section along with seven similar programs from Focus Area II to aggregate child
development outcomes from the kindergarten transition services.
Domain (4) was employed to accommodate services from a statewide project,
Improve & Maximize Programs so All Children Thrive (IMPACT), to support a network of local quality improvement systems. Because IMPACT funding was not under local control and cannot be used for direct services, Domain (4) outcomes were not guided by the local
strategic plan and have been excluded from this annual report of First 5 Kern funding.
In summary, First 5 Kern’s support in Child Development has addressed two
objectives of the local strategic plan: (1) Develop school readiness programs to support early childhood education, and (2) Expand the service access for children with special needs and in hard-to-reach communities (First 5 Kern, 2015a). In FY 2015-16, the impact
of smoke cessation has led to reduction of First 5 Kern investments in Child Development (Figure 22). Since the revenue decline was beyond the control of a county commission, a recommendation was made First 5 Association of California (2016c) to switch the report
emphasis to indirect services for system improvement, which was also reflected at the state level by an increase of Proposition 10 funding in Domain (4) to support the IMPACT project (Figure 22).
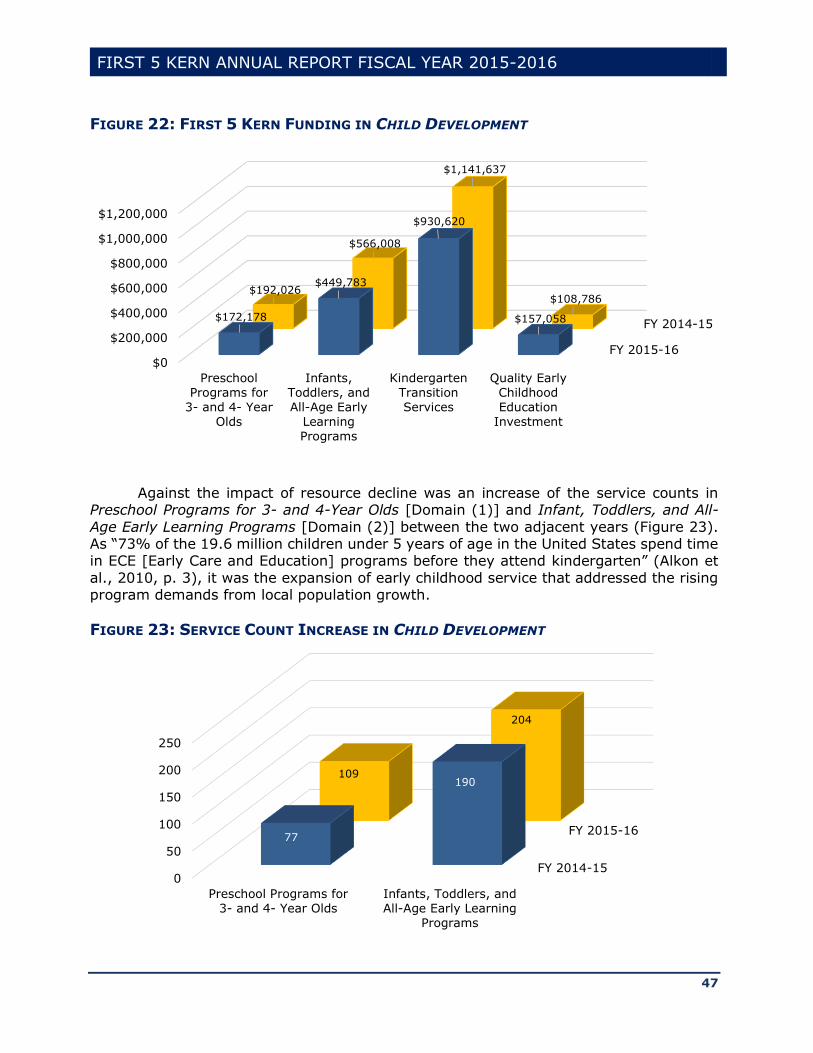
FIRST 5 KERN ANNUAL REPORT FISCAL YEAR 2015-2016
47
FIGURE 22: FIRST 5 KERN FUNDING IN CHILD DEVELOPMENT
Against the impact of resource decline was an increase of the service counts in Preschool Programs for 3- and 4-Year Olds [Domain (1)] and Infant, Toddlers, and All-
Age Early Learning Programs [Domain (2)] between the two adjacent years (Figure 23). As “73% of the 19.6 million children under 5 years of age in the United States spend time in ECE [Early Care and Education] programs before they attend kindergarten” (Alkon et
al., 2010, p. 3), it was the expansion of early childhood service that addressed the rising program demands from local population growth.
FIGURE 23: SERVICE COUNT INCREASE IN CHILD DEVELOPMENT
FY 2015-16
FY 2014-15
$0
$200,000
$400,000
$600,000
$800,000
$1,000,000
$1,200,000
Preschool
Programs for
3- and 4- Year
Olds
Infants,
Toddlers, and
All-Age Early
Learning
Programs
Kindergarten
Transition
Services
Quality Early
Childhood
Education
Investment
$172,178
$449,783
$930,620
$157,058
$192,026
$566,008
$1,141,637
$108,786
0
50
100
150
200
250
Preschool Programs for3- and 4- Year Olds
Infants, Toddlers, andAll-Age Early Learning
Programs
77
190109
204
FY 2015-16
FY 2014-15
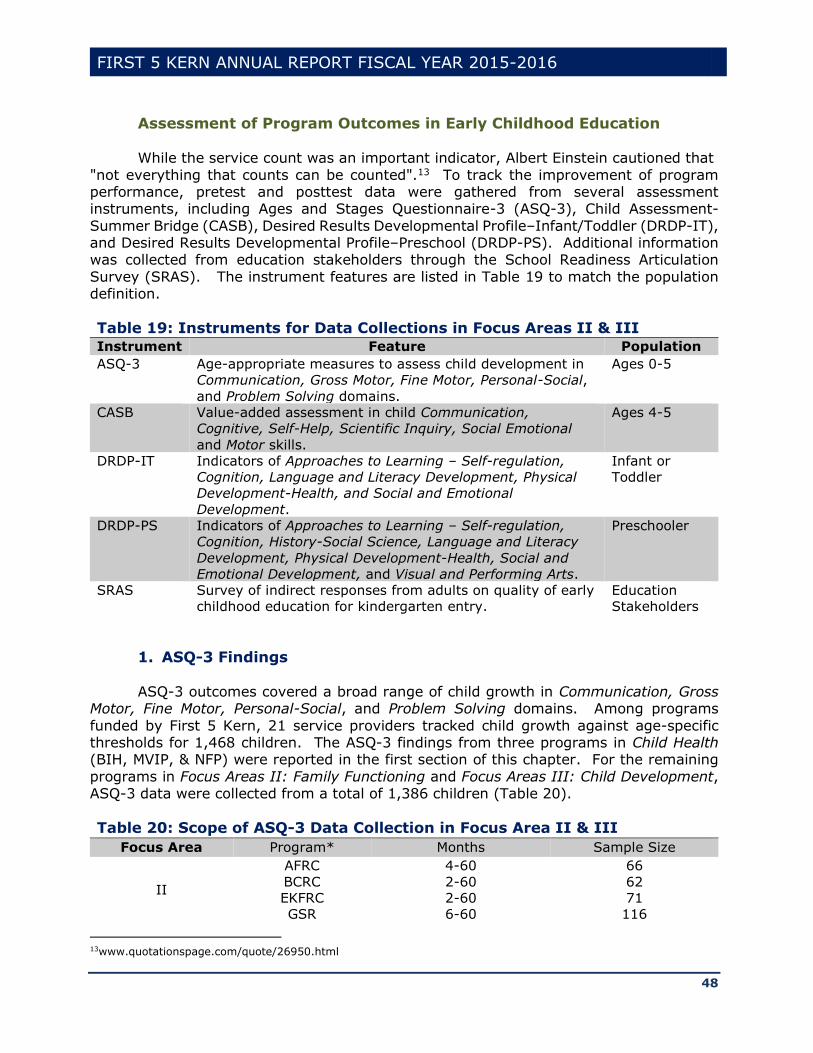
FIRST 5 KERN ANNUAL REPORT FISCAL YEAR 2015-2016
48
Assessment of Program Outcomes in Early Childhood Education While the service count was an important indicator, Albert Einstein cautioned that
"not everything that counts can be counted".13 To track the improvement of program performance, pretest and posttest data were gathered from several assessment instruments, including Ages and Stages Questionnaire-3 (ASQ-3), Child Assessment-
Summer Bridge (CASB), Desired Results Developmental Profile–Infant/Toddler (DRDP-IT), and Desired Results Developmental Profile–Preschool (DRDP-PS). Additional information was collected from education stakeholders through the School Readiness Articulation
Survey (SRAS). The instrument features are listed in Table 19 to match the population definition.
Table 19: Instruments for Data Collections in Focus Areas II & III
Instrument Feature Population
ASQ-3 Age-appropriate measures to assess child development in
Communication, Gross Motor, Fine Motor, Personal-Social,
and Problem Solving domains.
Ages 0-5
CASB Value-added assessment in child Communication,
Cognitive, Self-Help, Scientific Inquiry, Social Emotional
and Motor skills.
Ages 4-5
DRDP-IT Indicators of Approaches to Learning – Self-regulation,
Cognition, Language and Literacy Development, Physical
Development-Health, and Social and Emotional
Development.
Infant or
Toddler
DRDP-PS Indicators of Approaches to Learning – Self-regulation,
Cognition, History-Social Science, Language and Literacy
Development, Physical Development-Health, Social and
Emotional Development, and Visual and Performing Arts.
Preschooler
SRAS Survey of indirect responses from adults on quality of early
childhood education for kindergarten entry.
Education
Stakeholders
1. ASQ-3 Findings ASQ-3 outcomes covered a broad range of child growth in Communication, Gross
Motor, Fine Motor, Personal-Social, and Problem Solving domains. Among programs
funded by First 5 Kern, 21 service providers tracked child growth against age-specific thresholds for 1,468 children. The ASQ-3 findings from three programs in Child Health (BIH, MVIP, & NFP) were reported in the first section of this chapter. For the remaining
programs in Focus Areas II: Family Functioning and Focus Areas III: Child Development, ASQ-3 data were collected from a total of 1,386 children (Table 20).
Table 20: Scope of ASQ-3 Data Collection in Focus Area II & III
Focus Area Program* Months Sample Size
II
AFRC 4-60 66
BCRC 2-60 62
EKFRC 2-60 71
GSR 6-60 116
13www.quotationspage.com/quote/26950.html

FIRST 5 KERN ANNUAL REPORT FISCAL YEAR 2015-2016
49
Table 20: Scope of ASQ-3 Data Collection in Focus Area II & III
Focus Area Program* Months Sample Size
IWVFRC 2-60 52
KRVFRC 2-60 73
LVSRP 2-60 96
MCFRC 2-60 52
MFRC 36-60 65
SENP 2-60 80
SHS 48-60 53
WSCRC 6-60 60
WSN 2-60 45
III
BCDC 4-33 18
DSR 36-60 29
LHFRC 20-60 77
NPCLC 2-60 254
SPCSR 2-60 117 *Program acronyms are listed in Appendix A.
Table 21 showed 82% or more children surpassing ASQ-3 thresholds in
Communication (COM), Gross Motor (GM), Fine Motor (FM), Personal-Social (PerS), and
Problem Solving (ProS) domains. Multiple programs demonstrated a 100% passing rate against the corresponding thresholds in COM, PerS, and ProS domains.
Table 21: Percent of Children with Performance Above ASQ-3 Threshold
Focus Area Program* COM GM FM ProS PerS
II
AFRC 86 95 82 94 95
BCRC 100 94 94 95 98
EKFRC 97 90 94 99 94
GSR 94 95 89 95 96
IWVFRC 100 94 92 100 94
KRVFRC 88 82 82 92 82
LVSRP 83 84 67 82 78
MCFRC 100 90 92 96 98
MFRC 95 91 68 94 97
SENP 90 79 88 96 88
SHS 98 85 66 91 92
WSCRC 93 95 58 97 92
WSN 89 82 84 93 93
III BCDC 94 89 89 100 100
DSR 100 97 97 100 97
LHFRC 100 99 94 100 100
NPCLC 93 88 77 94 95
SPCSR 92 85 86 96 94 *Program acronyms are listed in Appendix A.
Besides the percent description, the ASQ-3 data were aggregated to track the gaps
between child performance and age-specific thresholds for further assessment of children
in each program. Statistical testing was conducted to examine significance of the findings. As shown in Table 22, the test statistics from single sample t tests were significant at =.0001.
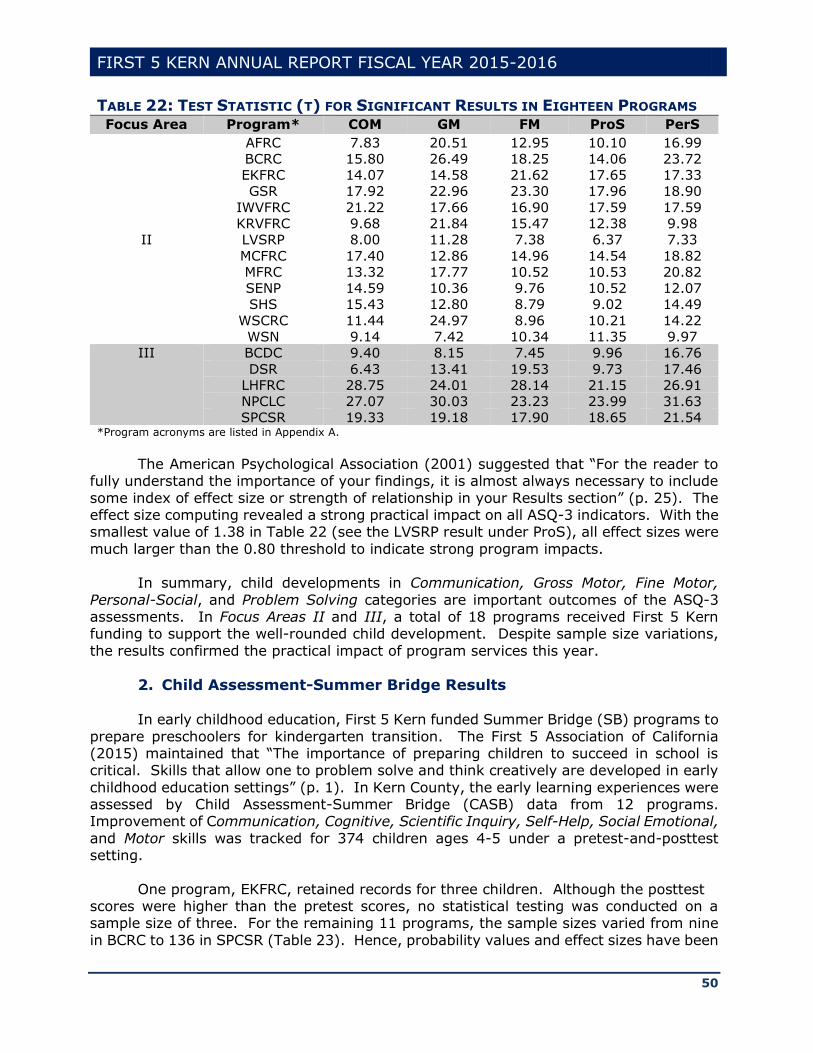
FIRST 5 KERN ANNUAL REPORT FISCAL YEAR 2015-2016
50
TABLE 22: TEST STATISTIC (T) FOR SIGNIFICANT RESULTS IN EIGHTEEN PROGRAMS Focus Area Program* COM GM FM ProS PerS
II
AFRC 7.83 20.51 12.95 10.10 16.99
BCRC 15.80 26.49 18.25 14.06 23.72
EKFRC 14.07 14.58 21.62 17.65 17.33
GSR 17.92 22.96 23.30 17.96 18.90
IWVFRC 21.22 17.66 16.90 17.59 17.59
KRVFRC 9.68 21.84 15.47 12.38 9.98
LVSRP 8.00 11.28 7.38 6.37 7.33
MCFRC 17.40 12.86 14.96 14.54 18.82
MFRC 13.32 17.77 10.52 10.53 20.82
SENP 14.59 10.36 9.76 10.52 12.07
SHS 15.43 12.80 8.79 9.02 14.49
WSCRC 11.44 24.97 8.96 10.21 14.22
WSN 9.14 7.42 10.34 11.35 9.97
III BCDC 9.40 8.15 7.45 9.96 16.76
DSR 6.43 13.41 19.53 9.73 17.46
LHFRC 28.75 24.01 28.14 21.15 26.91
NPCLC 27.07 30.03 23.23 23.99 31.63
SPCSR 19.33 19.18 17.90 18.65 21.54 *Program acronyms are listed in Appendix A.
The American Psychological Association (2001) suggested that “For the reader to
fully understand the importance of your findings, it is almost always necessary to include
some index of effect size or strength of relationship in your Results section” (p. 25). The effect size computing revealed a strong practical impact on all ASQ-3 indicators. With the smallest value of 1.38 in Table 22 (see the LVSRP result under ProS), all effect sizes were
much larger than the 0.80 threshold to indicate strong program impacts. In summary, child developments in Communication, Gross Motor, Fine Motor,
Personal-Social, and Problem Solving categories are important outcomes of the ASQ-3 assessments. In Focus Areas II and III, a total of 18 programs received First 5 Kern funding to support the well-rounded child development. Despite sample size variations,
the results confirmed the practical impact of program services this year.
2. Child Assessment-Summer Bridge Results In early childhood education, First 5 Kern funded Summer Bridge (SB) programs to
prepare preschoolers for kindergarten transition. The First 5 Association of California (2015) maintained that “The importance of preparing children to succeed in school is critical. Skills that allow one to problem solve and think creatively are developed in early
childhood education settings” (p. 1). In Kern County, the early learning experiences were assessed by Child Assessment-Summer Bridge (CASB) data from 12 programs. Improvement of Communication, Cognitive, Scientific Inquiry, Self-Help, Social Emotional,
and Motor skills was tracked for 374 children ages 4-5 under a pretest-and-posttest setting.
One program, EKFRC, retained records for three children. Although the posttest scores were higher than the pretest scores, no statistical testing was conducted on a sample size of three. For the remaining 11 programs, the sample sizes varied from nine
in BCRC to 136 in SPCSR (Table 23). Hence, probability values and effect sizes have been
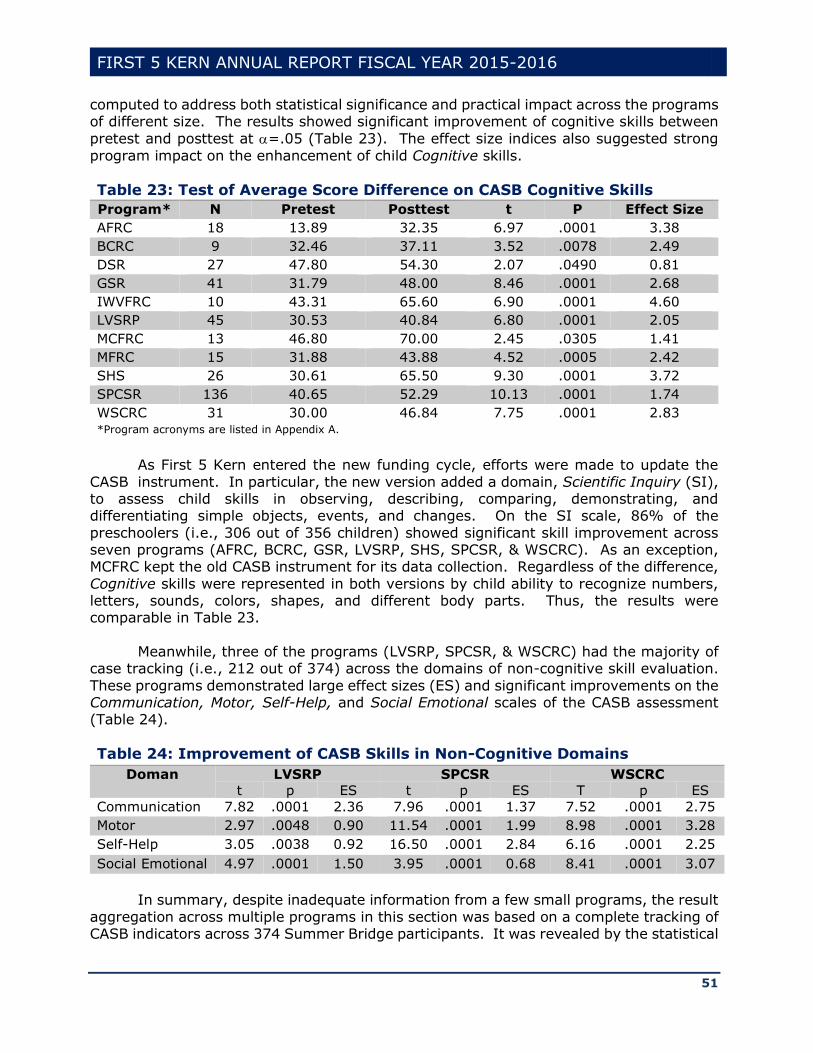
FIRST 5 KERN ANNUAL REPORT FISCAL YEAR 2015-2016
51
computed to address both statistical significance and practical impact across the programs of different size. The results showed significant improvement of cognitive skills between
pretest and posttest at =.05 (Table 23). The effect size indices also suggested strong
program impact on the enhancement of child Cognitive skills.
Table 23: Test of Average Score Difference on CASB Cognitive Skills
Program* N Pretest Posttest t P Effect Size
AFRC 18 13.89 32.35 6.97 .0001 3.38
BCRC 9 32.46 37.11 3.52 .0078 2.49
DSR 27 47.80 54.30 2.07 .0490 0.81
GSR 41 31.79 48.00 8.46 .0001 2.68
IWVFRC 10 43.31 65.60 6.90 .0001 4.60
LVSRP 45 30.53 40.84 6.80 .0001 2.05
MCFRC 13 46.80 70.00 2.45 .0305 1.41
MFRC 15 31.88 43.88 4.52 .0005 2.42
SHS 26 30.61 65.50 9.30 .0001 3.72
SPCSR 136 40.65 52.29 10.13 .0001 1.74
WSCRC 31 30.00 46.84 7.75 .0001 2.83 *Program acronyms are listed in Appendix A.
As First 5 Kern entered the new funding cycle, efforts were made to update the
CASB instrument. In particular, the new version added a domain, Scientific Inquiry (SI), to assess child skills in observing, describing, comparing, demonstrating, and differentiating simple objects, events, and changes. On the SI scale, 86% of the
preschoolers (i.e., 306 out of 356 children) showed significant skill improvement across seven programs (AFRC, BCRC, GSR, LVSRP, SHS, SPCSR, & WSCRC). As an exception, MCFRC kept the old CASB instrument for its data collection. Regardless of the difference,
Cognitive skills were represented in both versions by child ability to recognize numbers, letters, sounds, colors, shapes, and different body parts. Thus, the results were comparable in Table 23.
Meanwhile, three of the programs (LVSRP, SPCSR, & WSCRC) had the majority of
case tracking (i.e., 212 out of 374) across the domains of non-cognitive skill evaluation.
These programs demonstrated large effect sizes (ES) and significant improvements on the Communication, Motor, Self-Help, and Social Emotional scales of the CASB assessment (Table 24).
Table 24: Improvement of CASB Skills in Non-Cognitive Domains
Doman LVSRP SPCSR WSCRC
t p ES t p ES T p ES
Communication 7.82 .0001 2.36 7.96 .0001 1.37 7.52 .0001 2.75
Motor 2.97 .0048 0.90 11.54 .0001 1.99 8.98 .0001 3.28
Self-Help 3.05 .0038 0.92 16.50 .0001 2.84 6.16 .0001 2.25
Social Emotional 4.97 .0001 1.50 3.95 .0001 0.68 8.41 .0001 3.07
In summary, despite inadequate information from a few small programs, the result
aggregation across multiple programs in this section was based on a complete tracking of CASB indicators across 374 Summer Bridge participants. It was revealed by the statistical
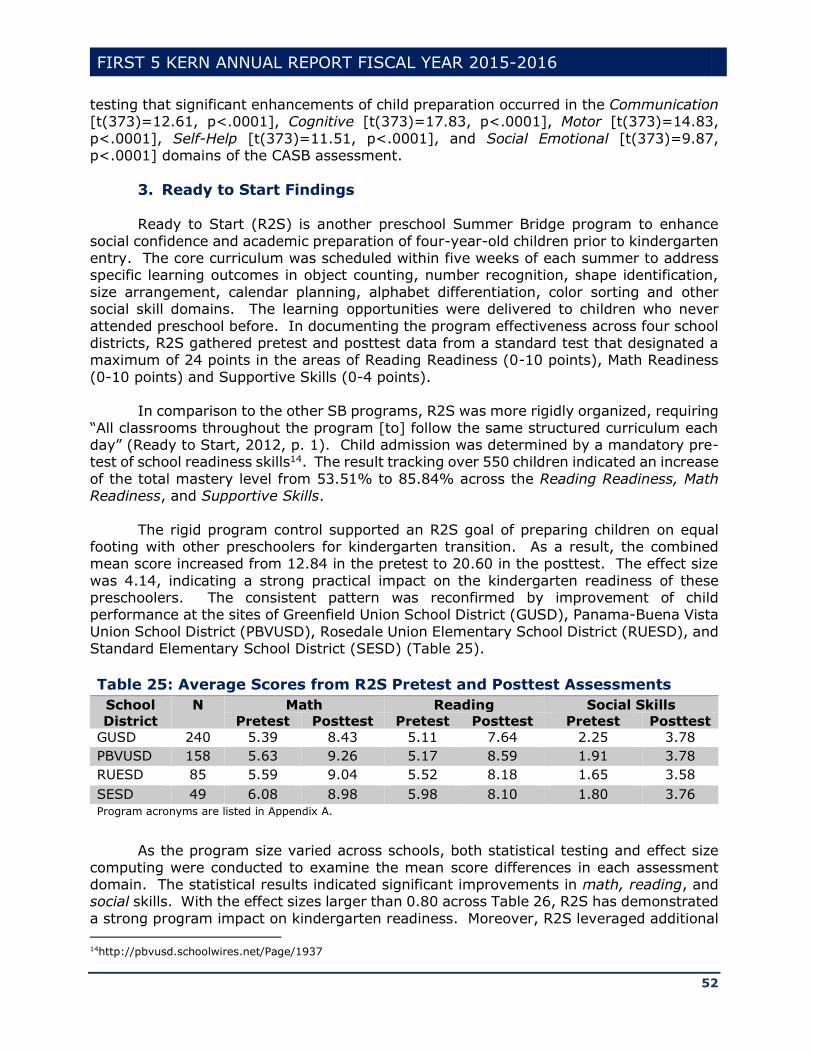
FIRST 5 KERN ANNUAL REPORT FISCAL YEAR 2015-2016
52
testing that significant enhancements of child preparation occurred in the Communication [t(373)=12.61, p<.0001], Cognitive [t(373)=17.83, p<.0001], Motor [t(373)=14.83,
p<.0001], Self-Help [t(373)=11.51, p<.0001], and Social Emotional [t(373)=9.87, p<.0001] domains of the CASB assessment.
3. Ready to Start Findings
Ready to Start (R2S) is another preschool Summer Bridge program to enhance
social confidence and academic preparation of four-year-old children prior to kindergarten entry. The core curriculum was scheduled within five weeks of each summer to address specific learning outcomes in object counting, number recognition, shape identification,
size arrangement, calendar planning, alphabet differentiation, color sorting and other social skill domains. The learning opportunities were delivered to children who never
attended preschool before. In documenting the program effectiveness across four school districts, R2S gathered pretest and posttest data from a standard test that designated a maximum of 24 points in the areas of Reading Readiness (0-10 points), Math Readiness
(0-10 points) and Supportive Skills (0-4 points). In comparison to the other SB programs, R2S was more rigidly organized, requiring
“All classrooms throughout the program [to] follow the same structured curriculum each day” (Ready to Start, 2012, p. 1). Child admission was determined by a mandatory pre-test of school readiness skills14. The result tracking over 550 children indicated an increase
of the total mastery level from 53.51% to 85.84% across the Reading Readiness, Math Readiness, and Supportive Skills.
The rigid program control supported an R2S goal of preparing children on equal footing with other preschoolers for kindergarten transition. As a result, the combined mean score increased from 12.84 in the pretest to 20.60 in the posttest. The effect size
was 4.14, indicating a strong practical impact on the kindergarten readiness of these preschoolers. The consistent pattern was reconfirmed by improvement of child performance at the sites of Greenfield Union School District (GUSD), Panama-Buena Vista
Union School District (PBVUSD), Rosedale Union Elementary School District (RUESD), and Standard Elementary School District (SESD) (Table 25).
Table 25: Average Scores from R2S Pretest and Posttest Assessments
School
District
N Math Reading Social Skills
Pretest Posttest Pretest Posttest Pretest Posttest
GUSD 240 5.39 8.43 5.11 7.64 2.25 3.78
PBVUSD 158 5.63 9.26 5.17 8.59 1.91 3.78
RUESD 85 5.59 9.04 5.52 8.18 1.65 3.58
SESD 49 6.08 8.98 5.98 8.10 1.80 3.76
Program acronyms are listed in Appendix A.
As the program size varied across schools, both statistical testing and effect size
computing were conducted to examine the mean score differences in each assessment domain. The statistical results indicated significant improvements in math, reading, and social skills. With the effect sizes larger than 0.80 across Table 26, R2S has demonstrated
a strong program impact on kindergarten readiness. Moreover, R2S leveraged additional 14http://pbvusd.schoolwires.net/Page/1937

FIRST 5 KERN ANNUAL REPORT FISCAL YEAR 2015-2016
53
funding from other sources to broaden the program impact in two new districts, i.e., Wasco Union Elementary School District and Maple Elementary School District.
Table 26: R2S t Test and Effect Size Results
School
District
df Math Reading Social Skills
t* Effect
Size
t* Effect
Size
t* Effect
Size
GUSD 239 23.00 2.98 21.75 2.81 16.83 2.18
PBVUSD 157 23.11 3.69 23.60 3.77 16.23 2.59
RUESD 84 17.19 3.75 15.76 3.44 10.49 2.29
SESD 48 11.46 3.31 11.71 3.38 8.75 2.53
*The t values were highly significant for p<.001.
4. Desired Results Developmental Profile-Infant/Toddler Indicators
In FY 2015-16, the former DRDP-Infant/Toddler (DRDP-IT) instrument was
replaced by the Desired Results Developmental Profile (2015) [DRDP (2015)]: A Developmental Continuum from Early Infancy to Kindergarten Entry. As a formative assessment instrument, the Infant/Toddler (IT) view was adopted as a new term in DRDP
(2015) to inform instruction and program development. To represent the full continuum of child development from early infancy to
kindergarten entry, the California Department of Education (2015) chose a universal design for DRDP revision. In both IT and Preschool (PS) views, child competencies were rated in four categories, Responding, Exploring, Building, and Integrating, to indicate if
children were able to (1) differentiate responses, (2) explore objects, (3) build relationships, and (4) combine strategies for problem solving. Depending on the IT performance at Earlier, Middle, or Later levels within these developmental categories, the
local DRDP data collection included five indicators in Approaches to Learning – Self-regulation (ATL-REG), six indicators on Cognition (COG), five indicators in Language and Literacy Development (LLD), eight indicators in Physical Development-Health (PDHLTH),
and five indicators in Social and Emotional Development (SED) (Table 27).
Table 27: Domain Coverage of DRDP (2015) Assessment-IT
Domain Knowledge and Skill Indicators
ALT-
REG
(1) Attention maintenance, (2) Self-comforting, (3) Imitation, (4) Curiosity and
initiative in learning, (5) Self-control of feelings and behavior.
COG (1) Spatial relationship, (2) Classification, (3) Number sense of quantity, (4)
Cause and effect, (5) Inquiry through observation and investigation, (6)
Knowledge of the natural world.
LLD (1) Understanding of language, (2) Responsiveness to language, (3)
Communication and use of language, (4) Reciprocal communication and
conversation, (5) Interest in literacy.
PDHLTH (1) Perceptual-motor skills and movement concepts, (2) Gross locomotor
movement skills, (3) Gross motor manipulative skills, (4) Fine motor
manipulative skills, (5) Safety, (6) Personal care routines: Hygiene, (7) Personal
care routines: Feeding, (8) Personal care routines: Dressing.
SED (1) Identity of self in relation to others, (2) Social and emotional understanding,
(3) Relationships and social interactions with familiar adults, (4) Relationships
and social interactions with peers, (5) Symbolic and sociodramatic play.
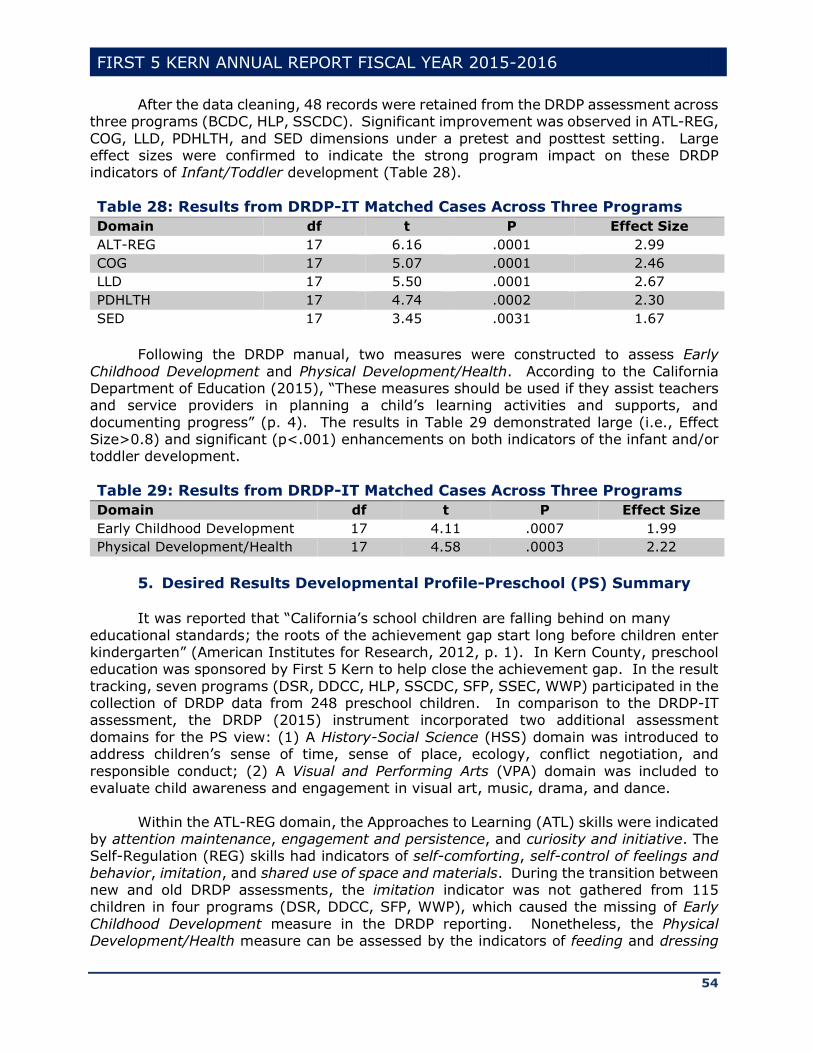
FIRST 5 KERN ANNUAL REPORT FISCAL YEAR 2015-2016
54
After the data cleaning, 48 records were retained from the DRDP assessment across three programs (BCDC, HLP, SSCDC). Significant improvement was observed in ATL-REG,
COG, LLD, PDHLTH, and SED dimensions under a pretest and posttest setting. Large effect sizes were confirmed to indicate the strong program impact on these DRDP indicators of Infant/Toddler development (Table 28).
Table 28: Results from DRDP-IT Matched Cases Across Three Programs
Domain df t P Effect Size
ALT-REG 17 6.16 .0001 2.99
COG 17 5.07 .0001 2.46
LLD 17 5.50 .0001 2.67
PDHLTH 17 4.74 .0002 2.30
SED 17 3.45 .0031 1.67
Following the DRDP manual, two measures were constructed to assess Early
Childhood Development and Physical Development/Health. According to the California Department of Education (2015), “These measures should be used if they assist teachers and service providers in planning a child’s learning activities and supports, and
documenting progress” (p. 4). The results in Table 29 demonstrated large (i.e., Effect Size>0.8) and significant (p<.001) enhancements on both indicators of the infant and/or toddler development.
Table 29: Results from DRDP-IT Matched Cases Across Three Programs
Domain df t P Effect Size
Early Childhood Development 17 4.11 .0007 1.99
Physical Development/Health 17 4.58 .0003 2.22
5. Desired Results Developmental Profile-Preschool (PS) Summary
It was reported that “California’s school children are falling behind on many
educational standards; the roots of the achievement gap start long before children enter kindergarten” (American Institutes for Research, 2012, p. 1). In Kern County, preschool education was sponsored by First 5 Kern to help close the achievement gap. In the result
tracking, seven programs (DSR, DDCC, HLP, SSCDC, SFP, SSEC, WWP) participated in the collection of DRDP data from 248 preschool children. In comparison to the DRDP-IT assessment, the DRDP (2015) instrument incorporated two additional assessment
domains for the PS view: (1) A History-Social Science (HSS) domain was introduced to address children’s sense of time, sense of place, ecology, conflict negotiation, and
responsible conduct; (2) A Visual and Performing Arts (VPA) domain was included to evaluate child awareness and engagement in visual art, music, drama, and dance.
Within the ATL-REG domain, the Approaches to Learning (ATL) skills were indicated by attention maintenance, engagement and persistence, and curiosity and initiative. The Self-Regulation (REG) skills had indicators of self-comforting, self-control of feelings and
behavior, imitation, and shared use of space and materials. During the transition between new and old DRDP assessments, the imitation indicator was not gathered from 115 children in four programs (DSR, DDCC, SFP, WWP), which caused the missing of Early
Childhood Development measure in the DRDP reporting. Nonetheless, the Physical Development/Health measure can be assessed by the indicators of feeding and dressing
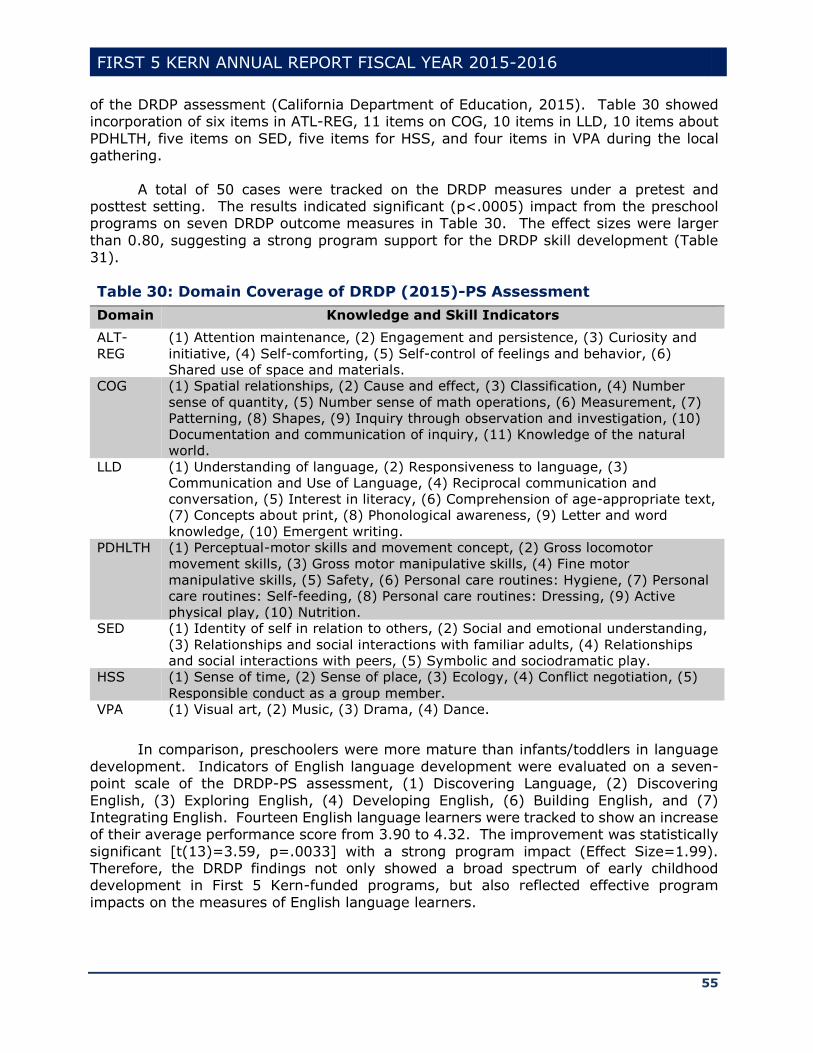
FIRST 5 KERN ANNUAL REPORT FISCAL YEAR 2015-2016
55
of the DRDP assessment (California Department of Education, 2015). Table 30 showed incorporation of six items in ATL-REG, 11 items on COG, 10 items in LLD, 10 items about
PDHLTH, five items on SED, five items for HSS, and four items in VPA during the local gathering.
A total of 50 cases were tracked on the DRDP measures under a pretest and posttest setting. The results indicated significant (p<.0005) impact from the preschool programs on seven DRDP outcome measures in Table 30. The effect sizes were larger
than 0.80, suggesting a strong program support for the DRDP skill development (Table 31).
Table 30: Domain Coverage of DRDP (2015)-PS Assessment
Domain Knowledge and Skill Indicators
ALT-
REG
(1) Attention maintenance, (2) Engagement and persistence, (3) Curiosity and
initiative, (4) Self-comforting, (5) Self-control of feelings and behavior, (6)
Shared use of space and materials.
COG (1) Spatial relationships, (2) Cause and effect, (3) Classification, (4) Number
sense of quantity, (5) Number sense of math operations, (6) Measurement, (7)
Patterning, (8) Shapes, (9) Inquiry through observation and investigation, (10)
Documentation and communication of inquiry, (11) Knowledge of the natural
world.
LLD (1) Understanding of language, (2) Responsiveness to language, (3)
Communication and Use of Language, (4) Reciprocal communication and
conversation, (5) Interest in literacy, (6) Comprehension of age-appropriate text,
(7) Concepts about print, (8) Phonological awareness, (9) Letter and word
knowledge, (10) Emergent writing.
PDHLTH (1) Perceptual-motor skills and movement concept, (2) Gross locomotor
movement skills, (3) Gross motor manipulative skills, (4) Fine motor
manipulative skills, (5) Safety, (6) Personal care routines: Hygiene, (7) Personal
care routines: Self-feeding, (8) Personal care routines: Dressing, (9) Active
physical play, (10) Nutrition.
SED (1) Identity of self in relation to others, (2) Social and emotional understanding,
(3) Relationships and social interactions with familiar adults, (4) Relationships
and social interactions with peers, (5) Symbolic and sociodramatic play.
HSS (1) Sense of time, (2) Sense of place, (3) Ecology, (4) Conflict negotiation, (5)
Responsible conduct as a group member.
VPA (1) Visual art, (2) Music, (3) Drama, (4) Dance.
In comparison, preschoolers were more mature than infants/toddlers in language
development. Indicators of English language development were evaluated on a seven-point scale of the DRDP-PS assessment, (1) Discovering Language, (2) Discovering
English, (3) Exploring English, (4) Developing English, (6) Building English, and (7) Integrating English. Fourteen English language learners were tracked to show an increase of their average performance score from 3.90 to 4.32. The improvement was statistically
significant [t(13)=3.59, p=.0033] with a strong program impact (Effect Size=1.99). Therefore, the DRDP findings not only showed a broad spectrum of early childhood development in First 5 Kern-funded programs, but also reflected effective program
impacts on the measures of English language learners.
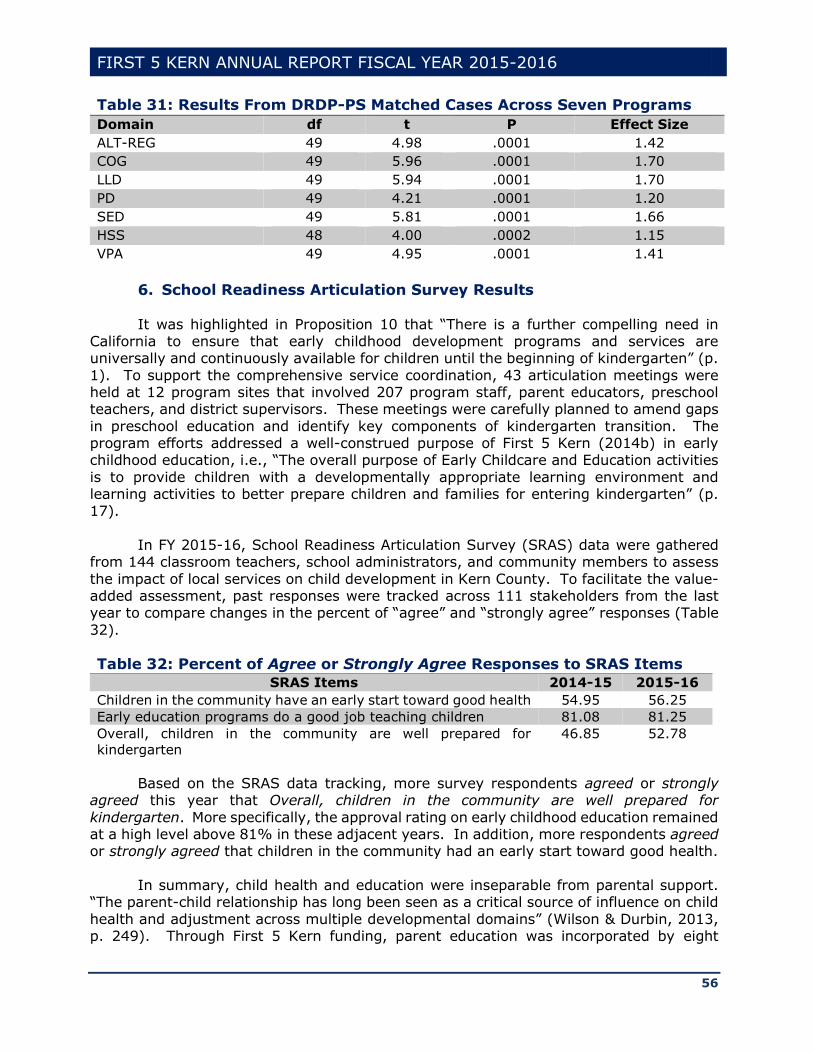
FIRST 5 KERN ANNUAL REPORT FISCAL YEAR 2015-2016
56
Table 31: Results From DRDP-PS Matched Cases Across Seven Programs
Domain df t P Effect Size
ALT-REG 49 4.98 .0001 1.42
COG 49 5.96 .0001 1.70
LLD 49 5.94 .0001 1.70
PD 49 4.21 .0001 1.20
SED 49 5.81 .0001 1.66
HSS 48 4.00 .0002 1.15
VPA 49 4.95 .0001 1.41
6. School Readiness Articulation Survey Results
It was highlighted in Proposition 10 that “There is a further compelling need in California to ensure that early childhood development programs and services are universally and continuously available for children until the beginning of kindergarten” (p.
1). To support the comprehensive service coordination, 43 articulation meetings were held at 12 program sites that involved 207 program staff, parent educators, preschool teachers, and district supervisors. These meetings were carefully planned to amend gaps
in preschool education and identify key components of kindergarten transition. The program efforts addressed a well-construed purpose of First 5 Kern (2014b) in early childhood education, i.e., “The overall purpose of Early Childcare and Education activities
is to provide children with a developmentally appropriate learning environment and learning activities to better prepare children and families for entering kindergarten” (p. 17).
In FY 2015-16, School Readiness Articulation Survey (SRAS) data were gathered
from 144 classroom teachers, school administrators, and community members to assess
the impact of local services on child development in Kern County. To facilitate the value-added assessment, past responses were tracked across 111 stakeholders from the last year to compare changes in the percent of “agree” and “strongly agree” responses (Table
32).
Table 32: Percent of Agree or Strongly Agree Responses to SRAS Items
SRAS Items 2014-15 2015-16
Children in the community have an early start toward good health 54.95 56.25
Early education programs do a good job teaching children 81.08 81.25
Overall, children in the community are well prepared for
kindergarten
46.85 52.78
Based on the SRAS data tracking, more survey respondents agreed or strongly
agreed this year that Overall, children in the community are well prepared for
kindergarten. More specifically, the approval rating on early childhood education remained at a high level above 81% in these adjacent years. In addition, more respondents agreed or strongly agreed that children in the community had an early start toward good health.
In summary, child health and education were inseparable from parental support.
“The parent-child relationship has long been seen as a critical source of influence on child
health and adjustment across multiple developmental domains” (Wilson & Durbin, 2013, p. 249). Through First 5 Kern funding, parent education was incorporated by eight
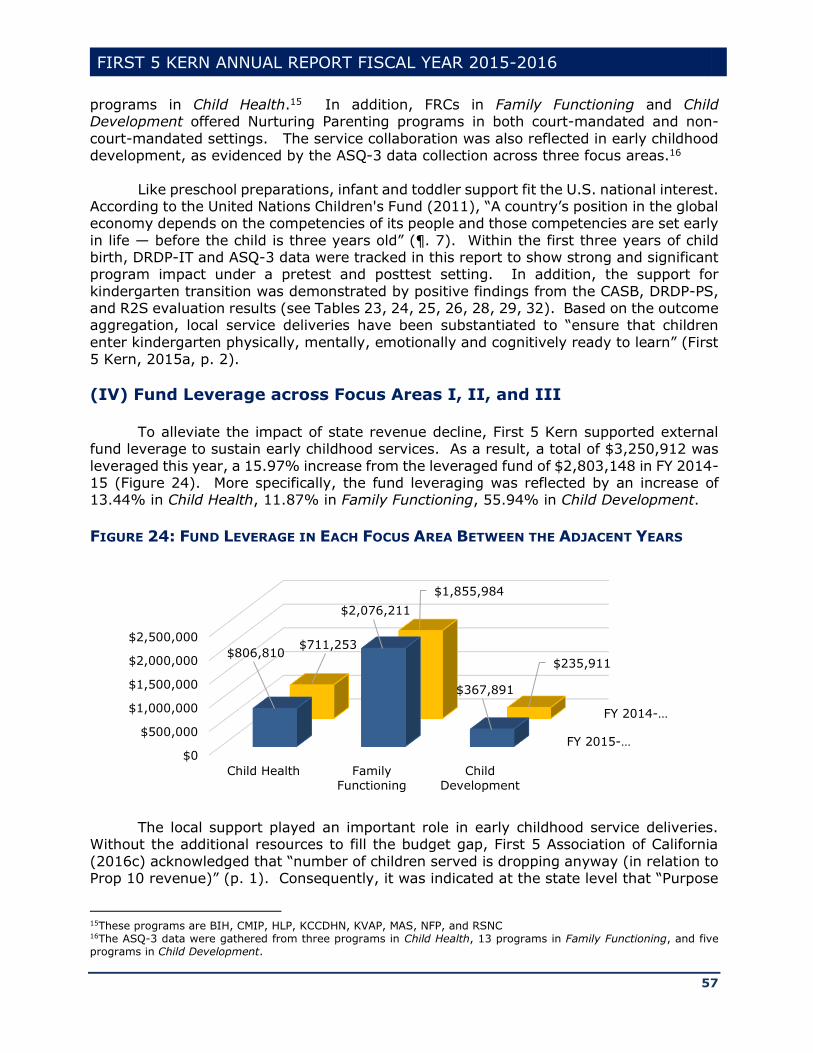
FIRST 5 KERN ANNUAL REPORT FISCAL YEAR 2015-2016
57
programs in Child Health.15 In addition, FRCs in Family Functioning and Child Development offered Nurturing Parenting programs in both court-mandated and non-
court-mandated settings. The service collaboration was also reflected in early childhood development, as evidenced by the ASQ-3 data collection across three focus areas.16
Like preschool preparations, infant and toddler support fit the U.S. national interest. According to the United Nations Children's Fund (2011), “A country’s position in the global economy depends on the competencies of its people and those competencies are set early
in life — before the child is three years old” (¶. 7). Within the first three years of child birth, DRDP-IT and ASQ-3 data were tracked in this report to show strong and significant program impact under a pretest and posttest setting. In addition, the support for
kindergarten transition was demonstrated by positive findings from the CASB, DRDP-PS, and R2S evaluation results (see Tables 23, 24, 25, 26, 28, 29, 32). Based on the outcome aggregation, local service deliveries have been substantiated to “ensure that children
enter kindergarten physically, mentally, emotionally and cognitively ready to learn” (First 5 Kern, 2015a, p. 2).
(IV) Fund Leverage across Focus Areas I, II, and III
To alleviate the impact of state revenue decline, First 5 Kern supported external fund leverage to sustain early childhood services. As a result, a total of $3,250,912 was
leveraged this year, a 15.97% increase from the leveraged fund of $2,803,148 in FY 2014-15 (Figure 24). More specifically, the fund leveraging was reflected by an increase of 13.44% in Child Health, 11.87% in Family Functioning, 55.94% in Child Development.
FIGURE 24: FUND LEVERAGE IN EACH FOCUS AREA BETWEEN THE ADJACENT YEARS
The local support played an important role in early childhood service deliveries.
Without the additional resources to fill the budget gap, First 5 Association of California
(2016c) acknowledged that “number of children served is dropping anyway (in relation to Prop 10 revenue)” (p. 1). Consequently, it was indicated at the state level that “Purpose
15These programs are BIH, CMIP, HLP, KCCDHN, KVAP, MAS, NFP, and RSNC 16The ASQ-3 data were gathered from three programs in Child Health, 13 programs in Family Functioning, and five programs in Child Development.
FY 2015-…
FY 2014-…
$0
$500,000
$1,000,000
$1,500,000
$2,000,000
$2,500,000
Child Health Family
Functioning
Child
Development
$806,810
$2,076,211
$367,891
$711,253
$1,855,984
$235,911
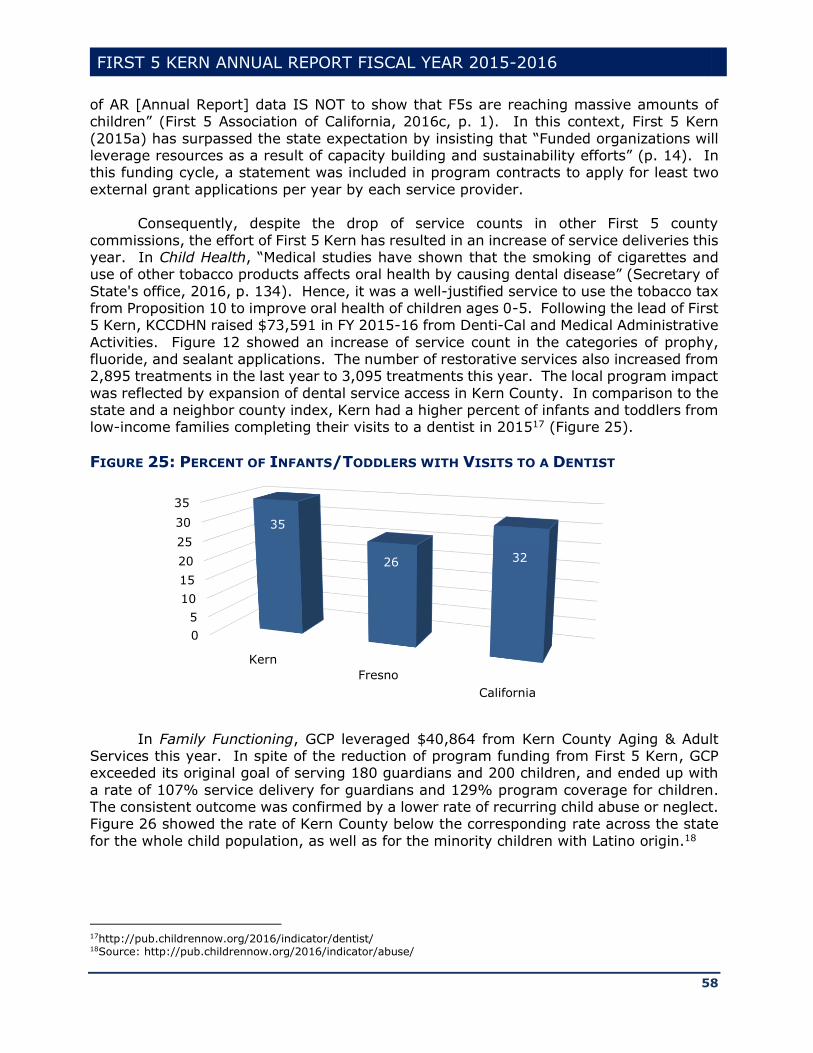
FIRST 5 KERN ANNUAL REPORT FISCAL YEAR 2015-2016
58
of AR [Annual Report] data IS NOT to show that F5s are reaching massive amounts of children” (First 5 Association of California, 2016c, p. 1). In this context, First 5 Kern
(2015a) has surpassed the state expectation by insisting that “Funded organizations will leverage resources as a result of capacity building and sustainability efforts” (p. 14). In this funding cycle, a statement was included in program contracts to apply for least two
external grant applications per year by each service provider. Consequently, despite the drop of service counts in other First 5 county
commissions, the effort of First 5 Kern has resulted in an increase of service deliveries this year. In Child Health, “Medical studies have shown that the smoking of cigarettes and use of other tobacco products affects oral health by causing dental disease” (Secretary of
State's office, 2016, p. 134). Hence, it was a well-justified service to use the tobacco tax from Proposition 10 to improve oral health of children ages 0-5. Following the lead of First 5 Kern, KCCDHN raised $73,591 in FY 2015-16 from Denti-Cal and Medical Administrative
Activities. Figure 12 showed an increase of service count in the categories of prophy, fluoride, and sealant applications. The number of restorative services also increased from 2,895 treatments in the last year to 3,095 treatments this year. The local program impact
was reflected by expansion of dental service access in Kern County. In comparison to the state and a neighbor county index, Kern had a higher percent of infants and toddlers from low-income families completing their visits to a dentist in 201517 (Figure 25).
FIGURE 25: PERCENT OF INFANTS/TODDLERS WITH VISITS TO A DENTIST
In Family Functioning, GCP leveraged $40,864 from Kern County Aging & Adult Services this year. In spite of the reduction of program funding from First 5 Kern, GCP exceeded its original goal of serving 180 guardians and 200 children, and ended up with
a rate of 107% service delivery for guardians and 129% program coverage for children. The consistent outcome was confirmed by a lower rate of recurring child abuse or neglect. Figure 26 showed the rate of Kern County below the corresponding rate across the state
for the whole child population, as well as for the minority children with Latino origin.18
17http://pub.childrennow.org/2016/indicator/dentist/ 18Source: http://pub.childrennow.org/2016/indicator/abuse/
0
5
10
15
20
25
30
35
Kern
Fresno
California
35
26 32
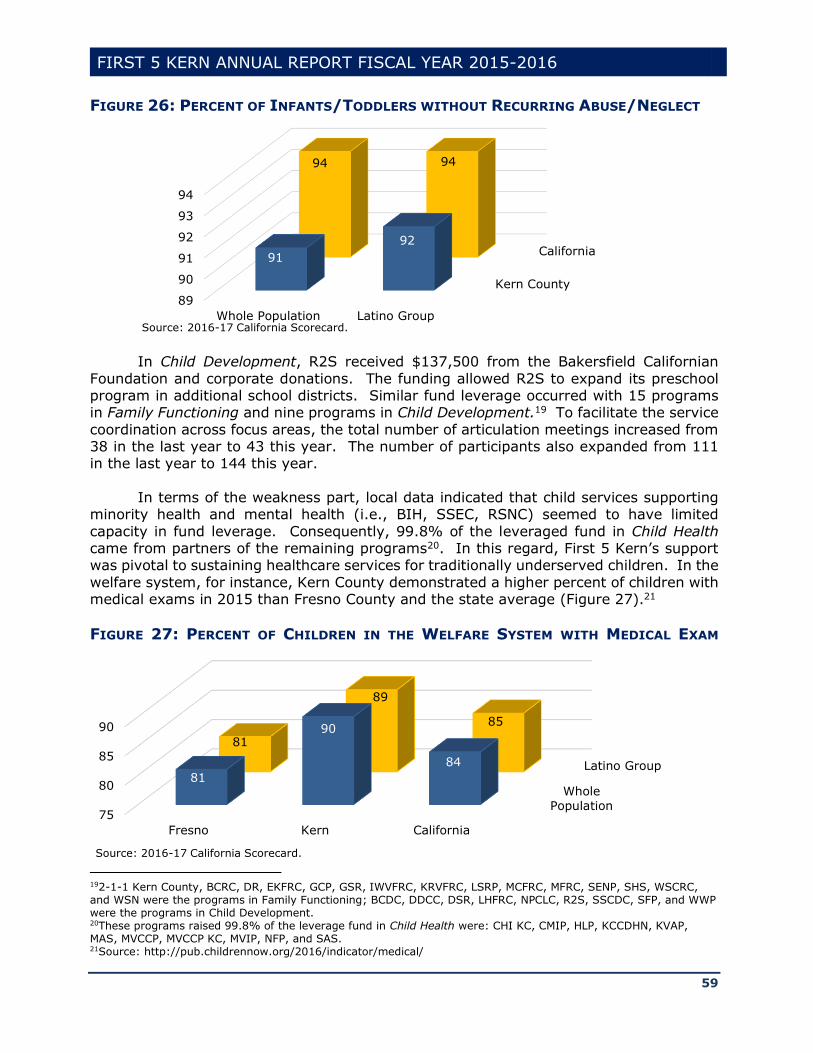
FIRST 5 KERN ANNUAL REPORT FISCAL YEAR 2015-2016
59
FIGURE 26: PERCENT OF INFANTS/TODDLERS WITHOUT RECURRING ABUSE/NEGLECT
In Child Development, R2S received $137,500 from the Bakersfield Californian
Foundation and corporate donations. The funding allowed R2S to expand its preschool program in additional school districts. Similar fund leverage occurred with 15 programs in Family Functioning and nine programs in Child Development.19 To facilitate the service
coordination across focus areas, the total number of articulation meetings increased from 38 in the last year to 43 this year. The number of participants also expanded from 111 in the last year to 144 this year.
In terms of the weakness part, local data indicated that child services supporting
minority health and mental health (i.e., BIH, SSEC, RSNC) seemed to have limited
capacity in fund leverage. Consequently, 99.8% of the leveraged fund in Child Health came from partners of the remaining programs20. In this regard, First 5 Kern’s support was pivotal to sustaining healthcare services for traditionally underserved children. In the
welfare system, for instance, Kern County demonstrated a higher percent of children with medical exams in 2015 than Fresno County and the state average (Figure 27).21
FIGURE 27: PERCENT OF CHILDREN IN THE WELFARE SYSTEM WITH MEDICAL EXAM
192-1-1 Kern County, BCRC, DR, EKFRC, GCP, GSR, IWVFRC, KRVFRC, LSRP, MCFRC, MFRC, SENP, SHS, WSCRC, and WSN were the programs in Family Functioning; BCDC, DDCC, DSR, LHFRC, NPCLC, R2S, SSCDC, SFP, and WWP were the programs in Child Development. 20These programs raised 99.8% of the leverage fund in Child Health were: CHI KC, CMIP, HLP, KCCDHN, KVAP, MAS, MVCCP, MVCCP KC, MVIP, NFP, and SAS. 21Source: http://pub.childrennow.org/2016/indicator/medical/
Kern County
California
89
90
91
92
93
94
Whole Population Latino Group
91
92
94 94
Source: 2016-17 California Scorecard.
Whole
Population
Latino Group
75
80
85
90
Fresno Kern California
81
90
84
81
89
85
Source: 2016-17 California Scorecard.

FIRST 5 KERN ANNUAL REPORT FISCAL YEAR 2015-2016
60
In summary, three major sections were designated in this chapter to aggregate program results in Child Health, Family Functioning, and Child Development
according to glossary definitions of the service outcome from First 5 Association of California (2013). While program quality was addressed by the result tracking on AAPI-2, ASQ-3, ASQ-SE, BCBH, CASB, DANCE, DRDP, ECBI, Sutter-Eyberg, NCFAS-G, and R2S
assessment outcomes, proper attention was given to service expansions to meet the program demand from the local population growth. Unfortunately, the service delivery was hampered by funding declines. It was reported that “Health and human services
programs that serve children are among the most seriously affected by this lack of funding” (California Assembly Committee on Budget, 2011, p. 1). To address this issue, a new section on fund leverage was added to “report leveraged/jointly-funded services,
even though leveraged funds do not always go back to F5s” (First 5 Association of California, 2016c, p. 1). Although Proposition 10 fund distribution was based on the proportion of live births in each county, the cost was much higher for service outreach in
rural areas. First 5 Kern had to support its service providers to leverage $3,250,912 for sustaining the service access by children and families in hard-to-reach communities.
While all 41 programs provided extensive services for Kern County children ages 0-5, the county commission still faces some unpredictable challenges in system building. In part, this is because the steady decline of Proposition 10 funding is no longer the single
factor that pushes First 5 Association of California (2016c) to adjust its original emphasis on service count. In November, 2016, over 64% of California voters approved Proposition
56: The California Healthcare, Research and Prevention Tobacco Tax Act of 2016. As the first tobacco tax increase in California since the passage of Proposition 10, it was acknowledged in Proposition 56 that “Because increasing the tobacco tax will reduce
smoking and the use of other tobacco products, it is important to protect existing tobacco tax funded programs from a decline in tax revenues” (Secretary of State's office, 2016, p. 135). Due to the unprecedented increase of per-pack-cigarette price from 87 cents to
$2.87, the state government is required to determine the effect on state revenue support for the existing trust funds from Proposition 99 and Proposition 10. Given the future uncertainty, spaces have been devoted from this chapter on the service counts to clarify
the baseline results prior to the passage of Proposition 56. The result tracking can be useful in monitoring a promise of Proposition 56 to “Protect existing tobacco tax funded programs, which currently save Californians millions of dollars in healthcare costs”
(Secretary of State's office, 2016, p. 135).
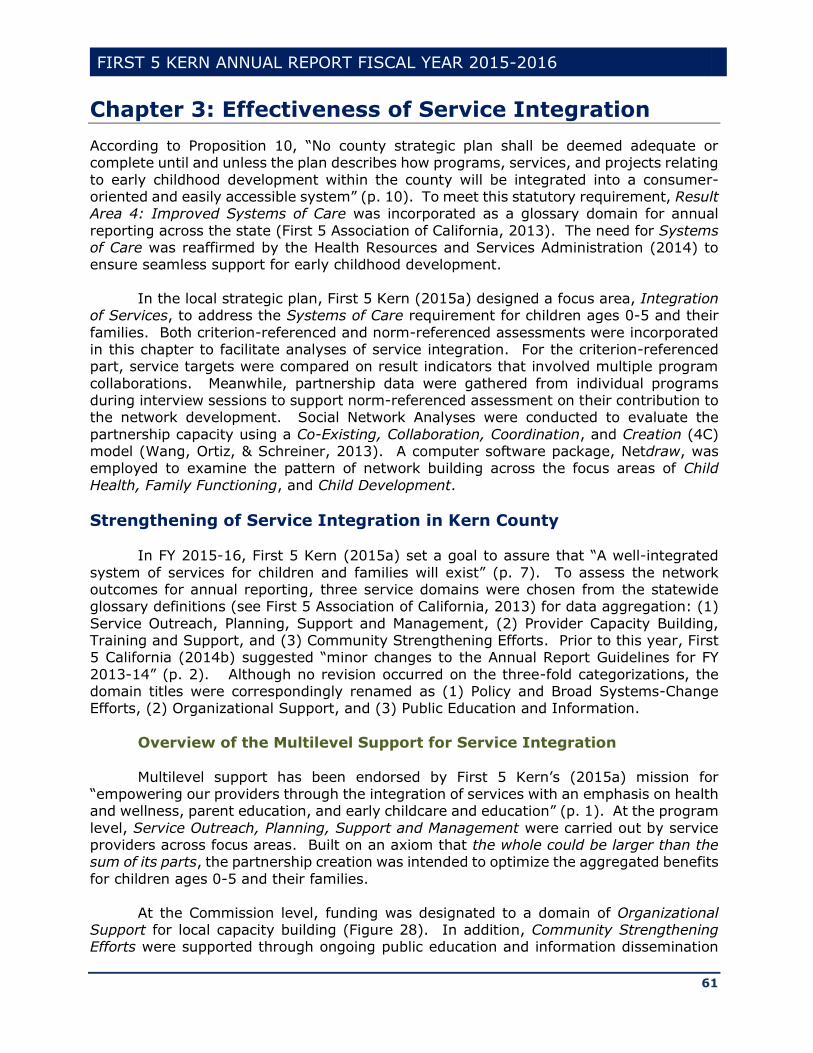
FIRST 5 KERN ANNUAL REPORT FISCAL YEAR 2015-2016
61
Chapter 3: Effectiveness of Service Integration
According to Proposition 10, “No county strategic plan shall be deemed adequate or complete until and unless the plan describes how programs, services, and projects relating
to early childhood development within the county will be integrated into a consumer-oriented and easily accessible system” (p. 10). To meet this statutory requirement, Result Area 4: Improved Systems of Care was incorporated as a glossary domain for annual
reporting across the state (First 5 Association of California, 2013). The need for Systems of Care was reaffirmed by the Health Resources and Services Administration (2014) to ensure seamless support for early childhood development.
In the local strategic plan, First 5 Kern (2015a) designed a focus area, Integration of Services, to address the Systems of Care requirement for children ages 0-5 and their
families. Both criterion-referenced and norm-referenced assessments were incorporated in this chapter to facilitate analyses of service integration. For the criterion-referenced part, service targets were compared on result indicators that involved multiple program
collaborations. Meanwhile, partnership data were gathered from individual programs during interview sessions to support norm-referenced assessment on their contribution to the network development. Social Network Analyses were conducted to evaluate the
partnership capacity using a Co-Existing, Collaboration, Coordination, and Creation (4C) model (Wang, Ortiz, & Schreiner, 2013). A computer software package, Netdraw, was employed to examine the pattern of network building across the focus areas of Child
Health, Family Functioning, and Child Development.
Strengthening of Service Integration in Kern County
In FY 2015-16, First 5 Kern (2015a) set a goal to assure that “A well-integrated
system of services for children and families will exist” (p. 7). To assess the network outcomes for annual reporting, three service domains were chosen from the statewide glossary definitions (see First 5 Association of California, 2013) for data aggregation: (1)
Service Outreach, Planning, Support and Management, (2) Provider Capacity Building, Training and Support, and (3) Community Strengthening Efforts. Prior to this year, First 5 California (2014b) suggested “minor changes to the Annual Report Guidelines for FY
2013-14” (p. 2). Although no revision occurred on the three-fold categorizations, the domain titles were correspondingly renamed as (1) Policy and Broad Systems-Change Efforts, (2) Organizational Support, and (3) Public Education and Information.
Overview of the Multilevel Support for Service Integration
Multilevel support has been endorsed by First 5 Kern’s (2015a) mission for “empowering our providers through the integration of services with an emphasis on health and wellness, parent education, and early childcare and education” (p. 1). At the program
level, Service Outreach, Planning, Support and Management were carried out by service providers across focus areas. Built on an axiom that the whole could be larger than the sum of its parts, the partnership creation was intended to optimize the aggregated benefits
for children ages 0-5 and their families.
At the Commission level, funding was designated to a domain of Organizational Support for local capacity building (Figure 28). In addition, Community Strengthening Efforts were supported through ongoing public education and information dissemination

FIRST 5 KERN ANNUAL REPORT FISCAL YEAR 2015-2016
62
in Domain (3) of the annual report glossary. Because “Too often child health is viewed as separate and distinct from early childhood care and learning” (Bruner, 2009, p. 1), more
funding was invested in Domain (2) to strengthen the integrated effort on provider training and service coordination. The local investment covered First 5 Kern program benefits, as well as services and supplies directly attributed to program activities (Figure 28).
Meanwhile, the commission was recognized as a leader in early childhood services for more than 16 years (First 5 Kern, 2015a). To sustain the countywide support, the funding in Domain (3) covered the cost of supplies for 16 community events22
FIGURE 28: FIRST 5 KERN FUNDING IN FOCUS AREA IV – SERVICE INTEGRATION
Through strategic planning, service targets have been set for each program in Focus Area IV: Integration of Services to guide improvement of Service Outreach, Planning, Support and Management in Domain (1). In addition, Domains (2) and (3) were
aligned in Table 33 to address the four objectives of First 5 Kern (2015a) strategic plan in service integration.
Table 33: Match of Objectives & Glossary Domains
Objectives Service Domains
Community health improvement efforts that support integration of
services for the health and wellness of children and their families.
(2) Community supportive services improvement efforts that support
integration of services for parent education and support services.
Community improvement efforts that support integration of services
for early childcare and education.
Community strengthening efforts that support education and
community awareness.
(3)
22 These events were held at Advancing Parenting, American General Media, Bakersfield Pregnancy Center, Dr.
Martin Luther King Jr. Community Center, Eastern Sierra Association for the Education of Young Children, Family Life Pregnancy Center of Tehachapi, Kern County Autism Center, Kern County Breastfeeding Coalition, KC Department of Child Support Services, Kern County Department of Human Services, Kern Literacy Council, Kern Partnership for Children and Families, March of Dimes, Rotary Club of Taft Foundation, and Tehachapi Collaborative.
Domain (2): Organizational Support
Domain (3): Public Education and Information
$813,809
$29,919
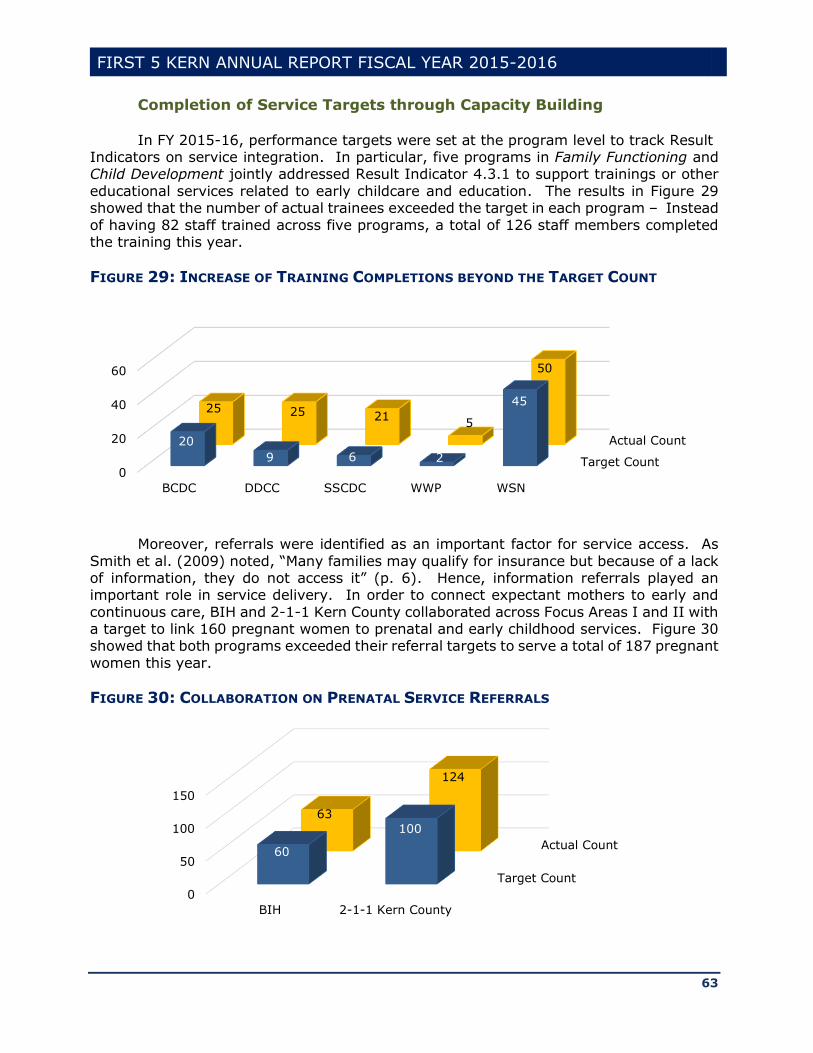
FIRST 5 KERN ANNUAL REPORT FISCAL YEAR 2015-2016
63
Completion of Service Targets through Capacity Building
In FY 2015-16, performance targets were set at the program level to track Result Indicators on service integration. In particular, five programs in Family Functioning and Child Development jointly addressed Result Indicator 4.3.1 to support trainings or other
educational services related to early childcare and education. The results in Figure 29 showed that the number of actual trainees exceeded the target in each program – Instead
of having 82 staff trained across five programs, a total of 126 staff members completed the training this year.
FIGURE 29: INCREASE OF TRAINING COMPLETIONS BEYOND THE TARGET COUNT
Moreover, referrals were identified as an important factor for service access. As
Smith et al. (2009) noted, “Many families may qualify for insurance but because of a lack of information, they do not access it” (p. 6). Hence, information referrals played an important role in service delivery. In order to connect expectant mothers to early and
continuous care, BIH and 2-1-1 Kern County collaborated across Focus Areas I and II with a target to link 160 pregnant women to prenatal and early childhood services. Figure 30 showed that both programs exceeded their referral targets to serve a total of 187 pregnant
women this year.
FIGURE 30: COLLABORATION ON PRENATAL SERVICE REFERRALS
Target Count
Actual Count
0
20
40
60
BCDC DDCC SSCDC WWP WSN
20
9 6 2
4525 25 21
5
50
Target Count
Actual Count
0
50
100
150
BIH 2-1-1 Kern County
60
100
63
124
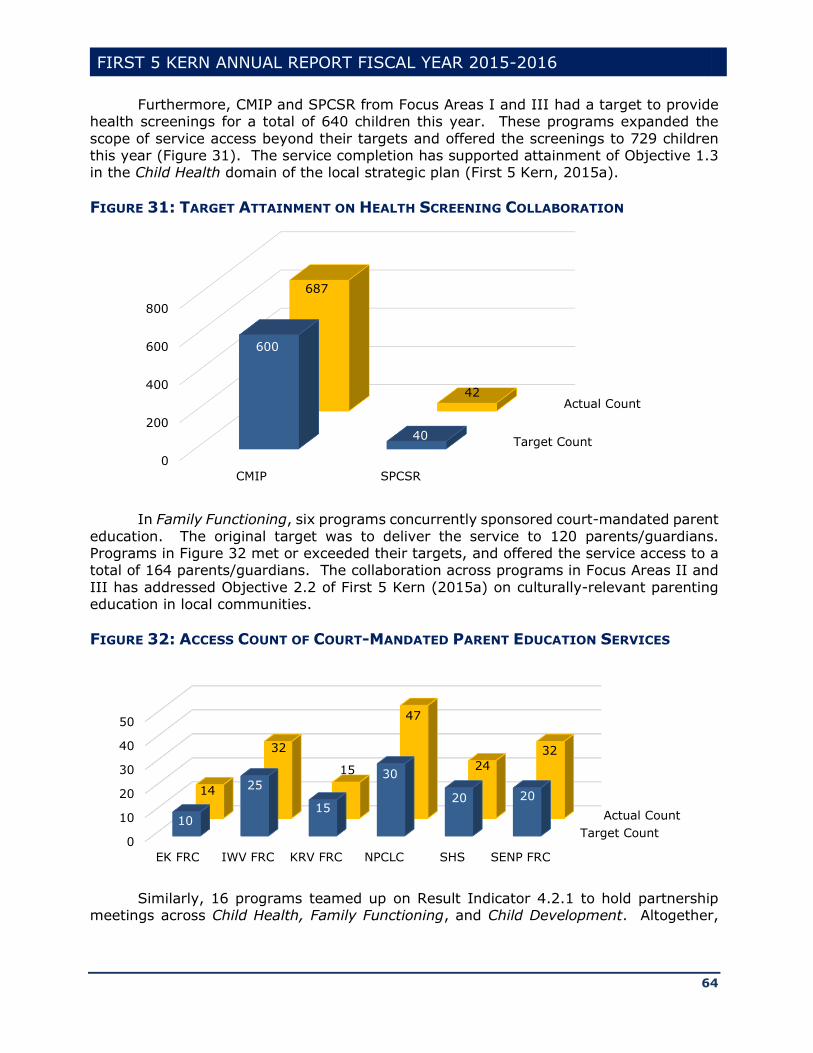
FIRST 5 KERN ANNUAL REPORT FISCAL YEAR 2015-2016
64
Furthermore, CMIP and SPCSR from Focus Areas I and III had a target to provide health screenings for a total of 640 children this year. These programs expanded the
scope of service access beyond their targets and offered the screenings to 729 children this year (Figure 31). The service completion has supported attainment of Objective 1.3 in the Child Health domain of the local strategic plan (First 5 Kern, 2015a).
FIGURE 31: TARGET ATTAINMENT ON HEALTH SCREENING COLLABORATION
In Family Functioning, six programs concurrently sponsored court-mandated parent
education. The original target was to deliver the service to 120 parents/guardians. Programs in Figure 32 met or exceeded their targets, and offered the service access to a total of 164 parents/guardians. The collaboration across programs in Focus Areas II and
III has addressed Objective 2.2 of First 5 Kern (2015a) on culturally-relevant parenting education in local communities.
FIGURE 32: ACCESS COUNT OF COURT-MANDATED PARENT EDUCATION SERVICES
Similarly, 16 programs teamed up on Result Indicator 4.2.1 to hold partnership
meetings across Child Health, Family Functioning, and Child Development. Altogether,
Target Count
Actual Count
0
200
400
600
800
CMIP SPCSR
600
40
687
42
Target Count
Actual Count
0
10
20
30
40
50
EK FRC IWV FRC KRV FRC NPCLC SHS SENP FRC
10
25
15
30
20 2014
32
15
47
24
32
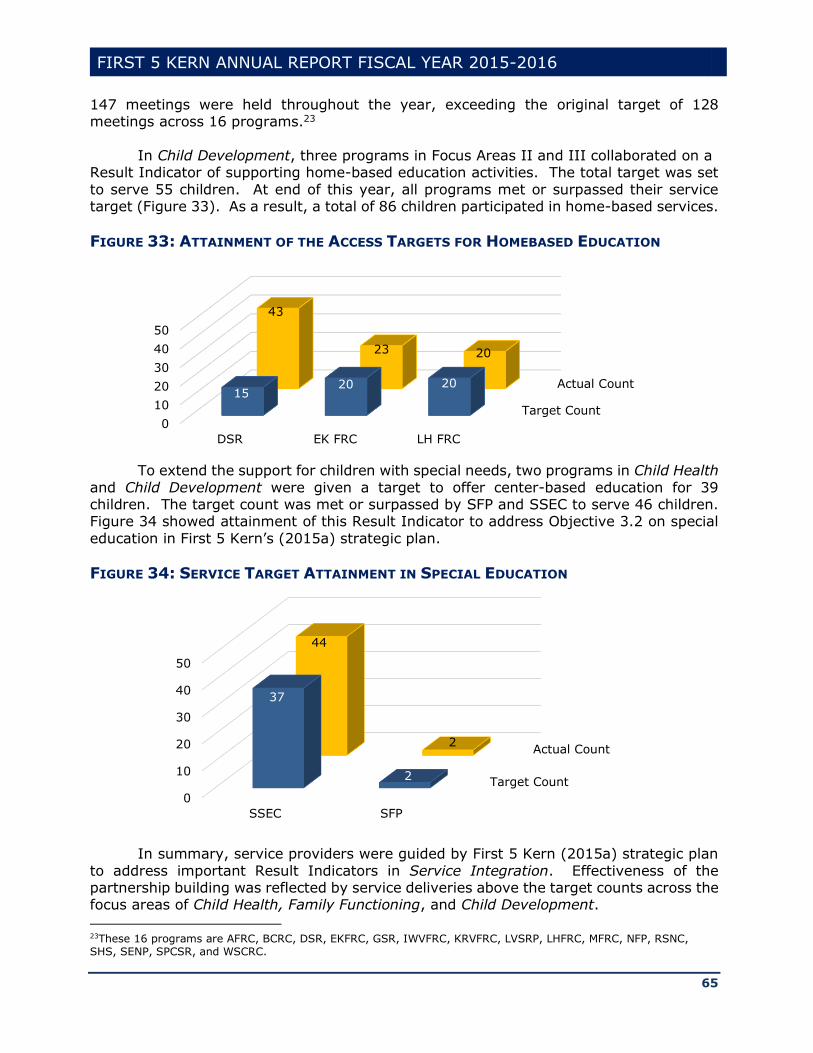
FIRST 5 KERN ANNUAL REPORT FISCAL YEAR 2015-2016
65
147 meetings were held throughout the year, exceeding the original target of 128 meetings across 16 programs.23
In Child Development, three programs in Focus Areas II and III collaborated on a
Result Indicator of supporting home-based education activities. The total target was set
to serve 55 children. At end of this year, all programs met or surpassed their service target (Figure 33). As a result, a total of 86 children participated in home-based services.
FIGURE 33: ATTAINMENT OF THE ACCESS TARGETS FOR HOMEBASED EDUCATION
To extend the support for children with special needs, two programs in Child Health
and Child Development were given a target to offer center-based education for 39 children. The target count was met or surpassed by SFP and SSEC to serve 46 children. Figure 34 showed attainment of this Result Indicator to address Objective 3.2 on special
education in First 5 Kern’s (2015a) strategic plan.
FIGURE 34: SERVICE TARGET ATTAINMENT IN SPECIAL EDUCATION
In summary, service providers were guided by First 5 Kern (2015a) strategic plan
to address important Result Indicators in Service Integration. Effectiveness of the partnership building was reflected by service deliveries above the target counts across the focus areas of Child Health, Family Functioning, and Child Development. 23These 16 programs are AFRC, BCRC, DSR, EKFRC, GSR, IWVFRC, KRVFRC, LVSRP, LHFRC, MFRC, NFP, RSNC, SHS, SENP, SPCSR, and WSCRC.
Target Count
Actual Count
0
10
20
30
40
50
DSR EK FRC LH FRC
1520 20
43
23 20
Target Count
Actual Count
0
10
20
30
40
50
SSEC SFP
37
2
44
2

FIRST 5 KERN ANNUAL REPORT FISCAL YEAR 2015-2016
66
Capacity of Network Connections for Partnership Building
In the current research literature, Social Network Analyses (SNA) were considered as a useful tool to “examine indicators of service integration” (Gillieatt et al., 2015, p.
338). In particular, Cross, Dickman, Newman-Gonchar, and Fagen (2009) confirmed that “Existing research has demonstrated that two primary features of networks, network structure and the strength of ties, have distinct effects on outcomes of interest” (p. 311).
In this section, the SNA approach is taken to investigate network ties and partnership structures for service integration.
Justification of Model Selection for Partnership Evaluation With 41 programs receiving support from First 5 Kern, each service provider may
collaborate with the remaining 40 partners in this funding cycle. Consequently, the network could contain a total of 1,640 (or 40x41) links. In addition to the large quantity, complication also hinged on differences in the network strength. It was reported that
“Evaluating interagency collaboration is notoriously challenging because of the complexity of collaborative efforts and the inadequacy of existing methods” (Cross et al., 2009, p. 310). To support the methodology advancement, the evaluation team developed a Co-
Existing, Collaboration, Coordination, and Creation (4C) model for ranking the network strength across focus areas (Wang, Ortiz, & Schreiner, 2013).
The need for creating a new model was rooted in the current research literature. For instance, Project Safety Net of Palo Alto (2011) suggested a five-level model for network categorization. But the model treated “formal communication” as a characteristic
for a Cooperation category. Because communications could be described as frequent, prioritized, and/or trustworthy, the model did not resolve the entanglement of these overlapping features across multiple categories.
Alternatively, opposite to the lack of mutual exclusiveness was an issue of
incomprehensiveness. As First 5 Fresno (2013) acknowledged, During this time period the coordination and collaboration (highest levels of
interaction) decreased from 42% to 38%. It is speculated that decrease in direct funding, staff turn-over, and other economic pressures resulted in organization becoming more insular thus decreasing their collaboration with other organizations.
(p. 102) Treating Coordination and Collaboration as the highest levels of interaction might
have inadvertently left no room for partnership improvement. Consequently, the Fresno model inherited two problems for the network analysis: (1) It did not conform to Bloom’s taxonomy that labeled creation as another level above integration (Airasian & Krathwohl,
2000), and (2) It downplayed adequacy of Co-Existing partnerships for program referrals. Hence, Fresno’s model seemed too simplistic to describe the capacity of service integration in local communities.
To amend these issues, service integration was conceived in the 4C model from
the context of institutional learning. The model itself was grounded on a well-established
SOLO [Structure of the Observed Learning Outcome] taxonomy (Atherton, 2013; Biggs & Collis, 1982) that defined four levels of learning outcomes above the pre-structure
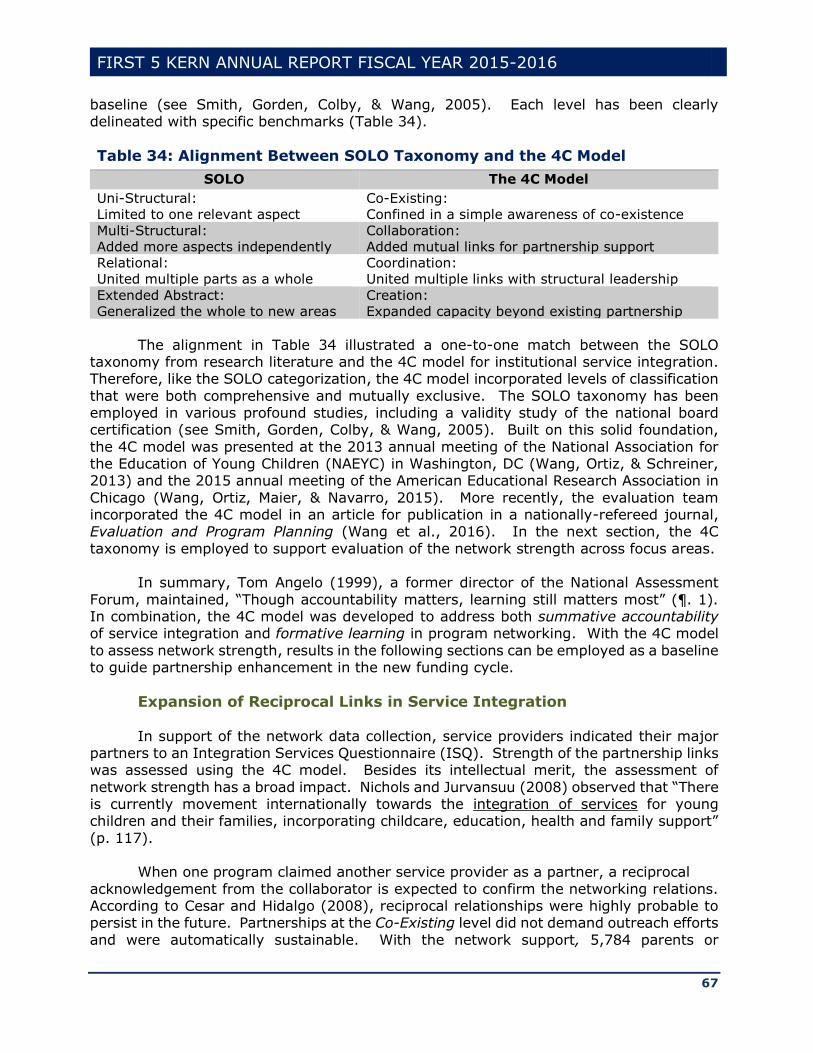
FIRST 5 KERN ANNUAL REPORT FISCAL YEAR 2015-2016
67
baseline (see Smith, Gorden, Colby, & Wang, 2005). Each level has been clearly delineated with specific benchmarks (Table 34).
Table 34: Alignment Between SOLO Taxonomy and the 4C Model
SOLO The 4C Model
Uni-Structural:
Limited to one relevant aspect
Co-Existing:
Confined in a simple awareness of co-existence
Multi-Structural:
Added more aspects independently
Collaboration:
Added mutual links for partnership support
Relational:
United multiple parts as a whole
Coordination:
United multiple links with structural leadership
Extended Abstract:
Generalized the whole to new areas
Creation:
Expanded capacity beyond existing partnership
The alignment in Table 34 illustrated a one-to-one match between the SOLO taxonomy from research literature and the 4C model for institutional service integration. Therefore, like the SOLO categorization, the 4C model incorporated levels of classification
that were both comprehensive and mutually exclusive. The SOLO taxonomy has been employed in various profound studies, including a validity study of the national board certification (see Smith, Gorden, Colby, & Wang, 2005). Built on this solid foundation,
the 4C model was presented at the 2013 annual meeting of the National Association for the Education of Young Children (NAEYC) in Washington, DC (Wang, Ortiz, & Schreiner, 2013) and the 2015 annual meeting of the American Educational Research Association in
Chicago (Wang, Ortiz, Maier, & Navarro, 2015). More recently, the evaluation team incorporated the 4C model in an article for publication in a nationally-refereed journal, Evaluation and Program Planning (Wang et al., 2016). In the next section, the 4C
taxonomy is employed to support evaluation of the network strength across focus areas. In summary, Tom Angelo (1999), a former director of the National Assessment
Forum, maintained, “Though accountability matters, learning still matters most” (¶. 1). In combination, the 4C model was developed to address both summative accountability of service integration and formative learning in program networking. With the 4C model
to assess network strength, results in the following sections can be employed as a baseline to guide partnership enhancement in the new funding cycle.
Expansion of Reciprocal Links in Service Integration
In support of the network data collection, service providers indicated their major partners to an Integration Services Questionnaire (ISQ). Strength of the partnership links was assessed using the 4C model. Besides its intellectual merit, the assessment of
network strength has a broad impact. Nichols and Jurvansuu (2008) observed that “There is currently movement internationally towards the integration of services for young children and their families, incorporating childcare, education, health and family support”
(p. 117). When one program claimed another service provider as a partner, a reciprocal
acknowledgement from the collaborator is expected to confirm the networking relations. According to Cesar and Hidalgo (2008), reciprocal relationships were highly probable to persist in the future. Partnerships at the Co-Existing level did not demand outreach efforts
and were automatically sustainable. With the network support, 5,784 parents or
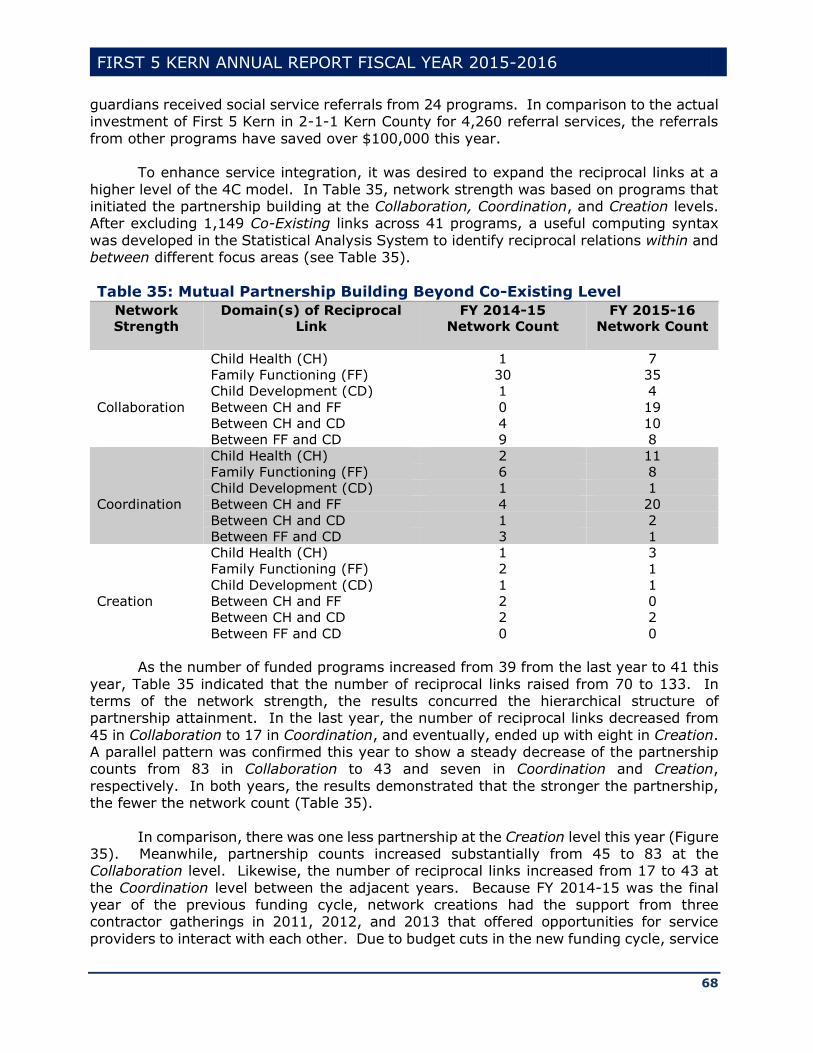
FIRST 5 KERN ANNUAL REPORT FISCAL YEAR 2015-2016
68
guardians received social service referrals from 24 programs. In comparison to the actual investment of First 5 Kern in 2-1-1 Kern County for 4,260 referral services, the referrals
from other programs have saved over $100,000 this year.
To enhance service integration, it was desired to expand the reciprocal links at a
higher level of the 4C model. In Table 35, network strength was based on programs that initiated the partnership building at the Collaboration, Coordination, and Creation levels. After excluding 1,149 Co-Existing links across 41 programs, a useful computing syntax
was developed in the Statistical Analysis System to identify reciprocal relations within and between different focus areas (see Table 35).
Table 35: Mutual Partnership Building Beyond Co-Existing Level
Network
Strength
Domain(s) of Reciprocal
Link
FY 2014-15
Network Count
FY 2015-16
Network Count
Collaboration
Child Health (CH) 1 7
Family Functioning (FF) 30 35
Child Development (CD) 1 4
Between CH and FF 0 19
Between CH and CD 4 10
Between FF and CD 9 8
Coordination
Child Health (CH) 2 11
Family Functioning (FF) 6 8
Child Development (CD) 1 1
Between CH and FF 4 20
Between CH and CD 1 2
Between FF and CD 3 1
Creation
Child Health (CH) 1 3
Family Functioning (FF) 2 1
Child Development (CD) 1 1
Between CH and FF 2 0
Between CH and CD 2 2
Between FF and CD 0 0
As the number of funded programs increased from 39 from the last year to 41 this
year, Table 35 indicated that the number of reciprocal links raised from 70 to 133. In terms of the network strength, the results concurred the hierarchical structure of partnership attainment. In the last year, the number of reciprocal links decreased from
45 in Collaboration to 17 in Coordination, and eventually, ended up with eight in Creation. A parallel pattern was confirmed this year to show a steady decrease of the partnership counts from 83 in Collaboration to 43 and seven in Coordination and Creation,
respectively. In both years, the results demonstrated that the stronger the partnership, the fewer the network count (Table 35).
In comparison, there was one less partnership at the Creation level this year (Figure 35). Meanwhile, partnership counts increased substantially from 45 to 83 at the Collaboration level. Likewise, the number of reciprocal links increased from 17 to 43 at
the Coordination level between the adjacent years. Because FY 2014-15 was the final year of the previous funding cycle, network creations had the support from three contractor gatherings in 2011, 2012, and 2013 that offered opportunities for service
providers to interact with each other. Due to budget cuts in the new funding cycle, service
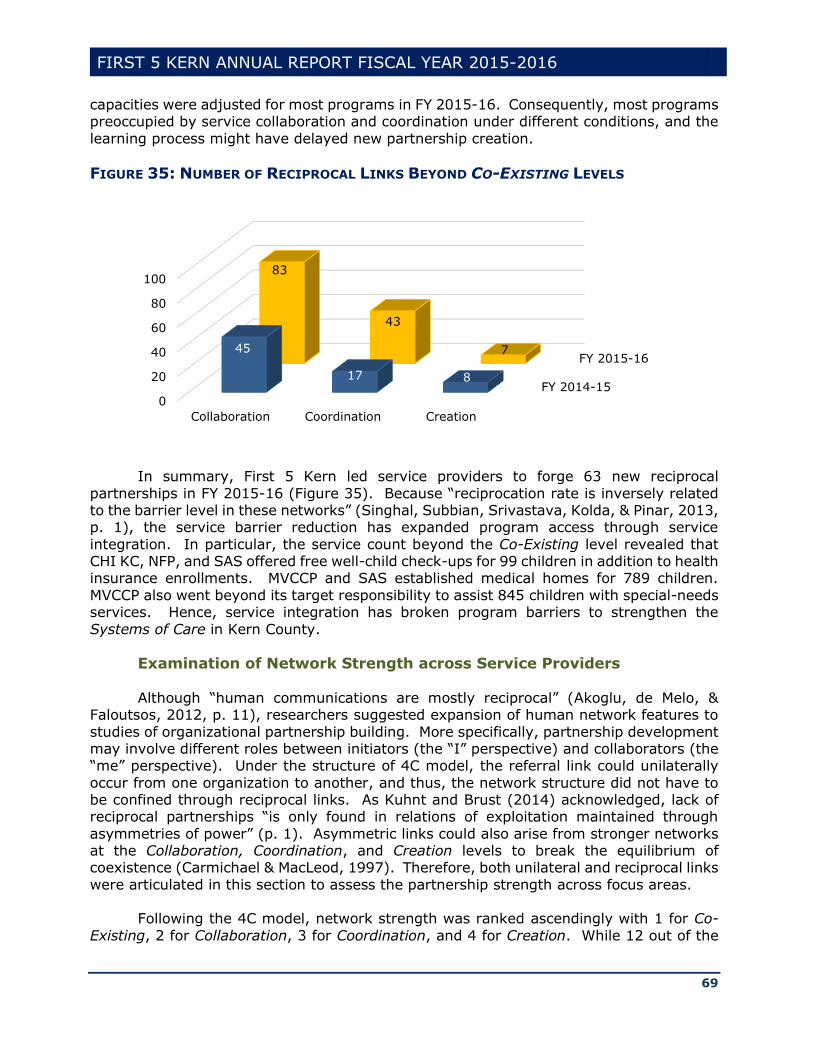
FIRST 5 KERN ANNUAL REPORT FISCAL YEAR 2015-2016
69
capacities were adjusted for most programs in FY 2015-16. Consequently, most programs preoccupied by service collaboration and coordination under different conditions, and the
learning process might have delayed new partnership creation.
FIGURE 35: NUMBER OF RECIPROCAL LINKS BEYOND CO-EXISTING LEVELS
In summary, First 5 Kern led service providers to forge 63 new reciprocal
partnerships in FY 2015-16 (Figure 35). Because “reciprocation rate is inversely related to the barrier level in these networks” (Singhal, Subbian, Srivastava, Kolda, & Pinar, 2013, p. 1), the service barrier reduction has expanded program access through service
integration. In particular, the service count beyond the Co-Existing level revealed that CHI KC, NFP, and SAS offered free well-child check-ups for 99 children in addition to health insurance enrollments. MVCCP and SAS established medical homes for 789 children.
MVCCP also went beyond its target responsibility to assist 845 children with special-needs services. Hence, service integration has broken program barriers to strengthen the
Systems of Care in Kern County.
Examination of Network Strength across Service Providers
Although “human communications are mostly reciprocal” (Akoglu, de Melo, & Faloutsos, 2012, p. 11), researchers suggested expansion of human network features to
studies of organizational partnership building. More specifically, partnership development may involve different roles between initiators (the “I” perspective) and collaborators (the “me” perspective). Under the structure of 4C model, the referral link could unilaterally
occur from one organization to another, and thus, the network structure did not have to be confined through reciprocal links. As Kuhnt and Brust (2014) acknowledged, lack of reciprocal partnerships “is only found in relations of exploitation maintained through
asymmetries of power” (p. 1). Asymmetric links could also arise from stronger networks at the Collaboration, Coordination, and Creation levels to break the equilibrium of coexistence (Carmichael & MacLeod, 1997). Therefore, both unilateral and reciprocal links
were articulated in this section to assess the partnership strength across focus areas.
Following the 4C model, network strength was ranked ascendingly with 1 for Co-
Existing, 2 for Collaboration, 3 for Coordination, and 4 for Creation. While 12 out of the
FY 2014-15
FY 2015-16
0
20
40
60
80
100
Collaboration Coordination Creation
45
17 8
83
43
7
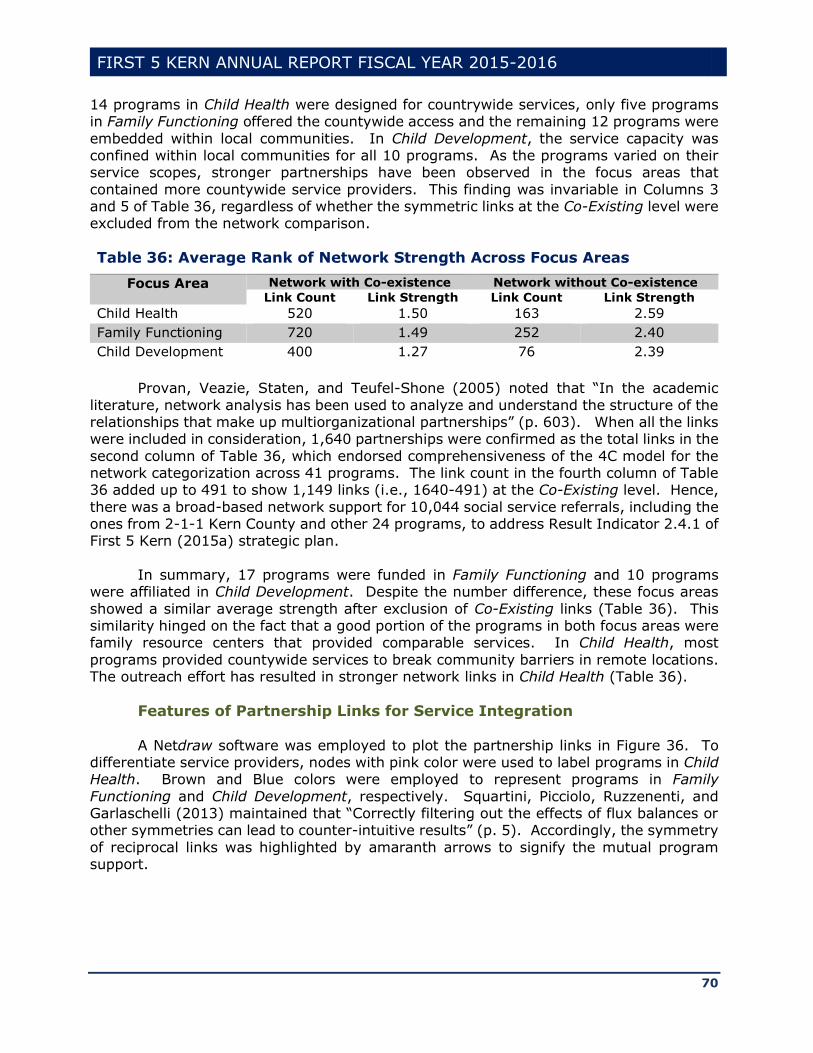
FIRST 5 KERN ANNUAL REPORT FISCAL YEAR 2015-2016
70
14 programs in Child Health were designed for countrywide services, only five programs in Family Functioning offered the countywide access and the remaining 12 programs were
embedded within local communities. In Child Development, the service capacity was confined within local communities for all 10 programs. As the programs varied on their service scopes, stronger partnerships have been observed in the focus areas that
contained more countywide service providers. This finding was invariable in Columns 3 and 5 of Table 36, regardless of whether the symmetric links at the Co-Existing level were excluded from the network comparison.
Table 36: Average Rank of Network Strength Across Focus Areas
Focus Area Network with Co-existence Network without Co-existence
Link Count Link Strength Link Count Link Strength
Child Health 520 1.50 163 2.59
Family Functioning 720 1.49 252 2.40
Child Development 400 1.27 76 2.39
Provan, Veazie, Staten, and Teufel-Shone (2005) noted that “In the academic
literature, network analysis has been used to analyze and understand the structure of the relationships that make up multiorganizational partnerships” (p. 603). When all the links were included in consideration, 1,640 partnerships were confirmed as the total links in the
second column of Table 36, which endorsed comprehensiveness of the 4C model for the network categorization across 41 programs. The link count in the fourth column of Table 36 added up to 491 to show 1,149 links (i.e., 1640-491) at the Co-Existing level. Hence,
there was a broad-based network support for 10,044 social service referrals, including the ones from 2-1-1 Kern County and other 24 programs, to address Result Indicator 2.4.1 of First 5 Kern (2015a) strategic plan.
In summary, 17 programs were funded in Family Functioning and 10 programs
were affiliated in Child Development. Despite the number difference, these focus areas
showed a similar average strength after exclusion of Co-Existing links (Table 36). This similarity hinged on the fact that a good portion of the programs in both focus areas were family resource centers that provided comparable services. In Child Health, most
programs provided countywide services to break community barriers in remote locations. The outreach effort has resulted in stronger network links in Child Health (Table 36).
Features of Partnership Links for Service Integration
A Netdraw software was employed to plot the partnership links in Figure 36. To differentiate service providers, nodes with pink color were used to label programs in Child Health. Brown and Blue colors were employed to represent programs in Family
Functioning and Child Development, respectively. Squartini, Picciolo, Ruzzenenti, and Garlaschelli (2013) maintained that “Correctly filtering out the effects of flux balances or other symmetries can lead to counter-intuitive results” (p. 5). Accordingly, the symmetry
of reciprocal links was highlighted by amaranth arrows to signify the mutual program support.
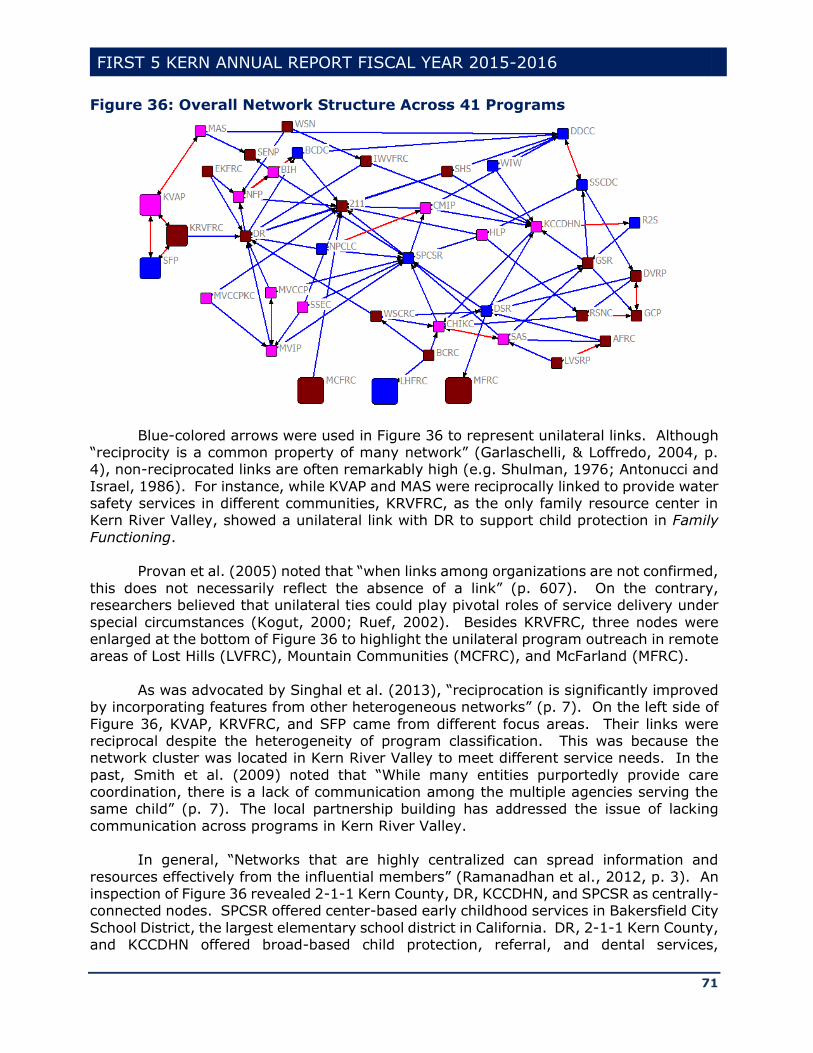
FIRST 5 KERN ANNUAL REPORT FISCAL YEAR 2015-2016
71
Figure 36: Overall Network Structure Across 41 Programs
Blue-colored arrows were used in Figure 36 to represent unilateral links. Although “reciprocity is a common property of many network” (Garlaschelli, & Loffredo, 2004, p. 4), non-reciprocated links are often remarkably high (e.g. Shulman, 1976; Antonucci and
Israel, 1986). For instance, while KVAP and MAS were reciprocally linked to provide water safety services in different communities, KRVFRC, as the only family resource center in Kern River Valley, showed a unilateral link with DR to support child protection in Family
Functioning. Provan et al. (2005) noted that “when links among organizations are not confirmed,
this does not necessarily reflect the absence of a link” (p. 607). On the contrary, researchers believed that unilateral ties could play pivotal roles of service delivery under
special circumstances (Kogut, 2000; Ruef, 2002). Besides KRVFRC, three nodes were enlarged at the bottom of Figure 36 to highlight the unilateral program outreach in remote areas of Lost Hills (LVFRC), Mountain Communities (MCFRC), and McFarland (MFRC).
As was advocated by Singhal et al. (2013), “reciprocation is significantly improved
by incorporating features from other heterogeneous networks” (p. 7). On the left side of
Figure 36, KVAP, KRVFRC, and SFP came from different focus areas. Their links were reciprocal despite the heterogeneity of program classification. This was because the network cluster was located in Kern River Valley to meet different service needs. In the
past, Smith et al. (2009) noted that “While many entities purportedly provide care coordination, there is a lack of communication among the multiple agencies serving the same child” (p. 7). The local partnership building has addressed the issue of lacking
communication across programs in Kern River Valley. In general, “Networks that are highly centralized can spread information and
resources effectively from the influential members” (Ramanadhan et al., 2012, p. 3). An inspection of Figure 36 revealed 2-1-1 Kern County, DR, KCCDHN, and SPCSR as centrally-connected nodes. SPCSR offered center-based early childhood services in Bakersfield City
School District, the largest elementary school district in California. DR, 2-1-1 Kern County, and KCCDHN offered broad-based child protection, referral, and dental services,
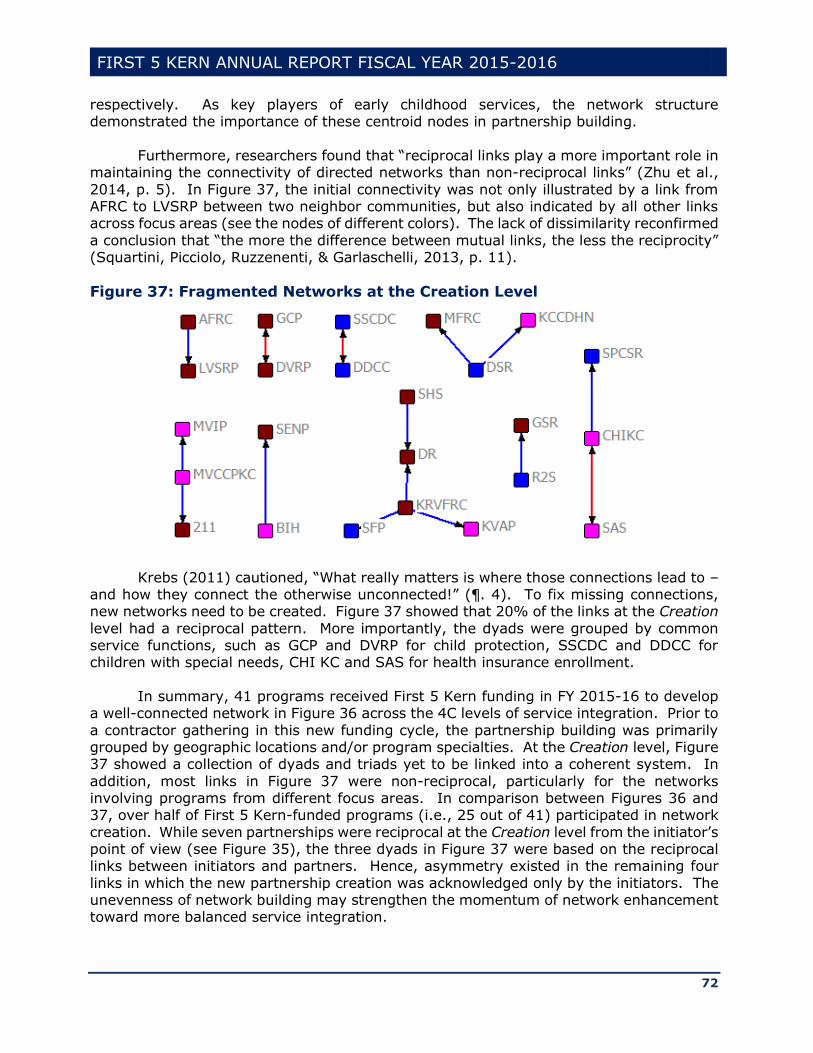
FIRST 5 KERN ANNUAL REPORT FISCAL YEAR 2015-2016
72
respectively. As key players of early childhood services, the network structure demonstrated the importance of these centroid nodes in partnership building.
Furthermore, researchers found that “reciprocal links play a more important role in
maintaining the connectivity of directed networks than non-reciprocal links” (Zhu et al.,
2014, p. 5). In Figure 37, the initial connectivity was not only illustrated by a link from AFRC to LVSRP between two neighbor communities, but also indicated by all other links across focus areas (see the nodes of different colors). The lack of dissimilarity reconfirmed
a conclusion that “the more the difference between mutual links, the less the reciprocity” (Squartini, Picciolo, Ruzzenenti, & Garlaschelli, 2013, p. 11).
Figure 37: Fragmented Networks at the Creation Level
Krebs (2011) cautioned, “What really matters is where those connections lead to – and how they connect the otherwise unconnected!” (¶. 4). To fix missing connections, new networks need to be created. Figure 37 showed that 20% of the links at the Creation
level had a reciprocal pattern. More importantly, the dyads were grouped by common service functions, such as GCP and DVRP for child protection, SSCDC and DDCC for children with special needs, CHI KC and SAS for health insurance enrollment.
In summary, 41 programs received First 5 Kern funding in FY 2015-16 to develop
a well-connected network in Figure 36 across the 4C levels of service integration. Prior to
a contractor gathering in this new funding cycle, the partnership building was primarily grouped by geographic locations and/or program specialties. At the Creation level, Figure 37 showed a collection of dyads and triads yet to be linked into a coherent system. In
addition, most links in Figure 37 were non-reciprocal, particularly for the networks involving programs from different focus areas. In comparison between Figures 36 and 37, over half of First 5 Kern-funded programs (i.e., 25 out of 41) participated in network
creation. While seven partnerships were reciprocal at the Creation level from the initiator’s point of view (see Figure 35), the three dyads in Figure 37 were based on the reciprocal links between initiators and partners. Hence, asymmetry existed in the remaining four
links in which the new partnership creation was acknowledged only by the initiators. The unevenness of network building may strengthen the momentum of network enhancement toward more balanced service integration.
FIRST 5 KERN ANNUAL REPORT FISCAL YEAR 2015-2016
73
It was stipulated by the local strategic plan that “The fourth focus area, Integration of Services, ensures collaboration with other agencies, organizations and entities with
similar goals and objectives to enhance the overall efficiency of provider systems” (First 5 Kern, 2015a, p. 3). Similar to the result description in Chapter 2 for the first three focus areas of Child Health, Family Functioning, and Child Development, service counts were
gathered in this chapter to address Result Indicators (RI) in Service Integration. Following the local strategic plan (First 5 Kern, 2015a), these RIs on service capacity building included:
Workshops to inform parents/guardians of health and wellness services Collaborative meetings among service providers
Trainings or other educational services related to parent education and supportive services
Trainings or other educational services related to early childcare and education
Articulation meetings to establish or review a standardized transition plan for incoming kindergartners
Educational events on early childhood topics
In recent years, First 5 Association of California has placed more emphasis on
service integration than any other focus areas of direct services. As its Executive Director,
Moira Kenney (2016), argued,
If we continue to conduct “business as usual” and focus the majority of our spending on individual direct services, we would only be able to help a relatively small number of families and children for a limited time. Working this way is like
addressing the problem leaf by leaf instead of curing it at the root. (p. 5) Built on the statewide movement toward strengthening the systems of care, common
service outcomes are aggregated across programs in Chapter 4 to analyze improvement of early childhood support in Kern County.

FIRST 5 KERN ANNUAL REPORT FISCAL YEAR 2015-2016
74
Chapter 4: Turning the Curve
Following the spirit of local control in Proposition 10, First 5 Kern has made extensive efforts to support young children and their families in the context of Kern County,
including strengthening program outreach in remote communities. Special needs were considered for children in the input phase to expand service access for minority groups, medically vulnerable infants, and children with disabilities. Care coordination was funded
in the program implementation process to enhance service integration. Outcomes of the service delivery and network building were summarized in Chapters 2 and 3 to evaluate the impact of First 5 Kern in the product phase. Altogether, the report design conformed
to a well-established Context, Input, Process, and Product (CIPP) paradigm with a clear focus on delineating what works, for whom, and in which context.
To sustain the ongoing service improvement, program accomplishments in the product phase formed a new context to support future result optimization. First 5 Kern (2015b) indicated that “a results-based accountability [RBA] framework was employed to
facilitate turning the curve on those result indicators that most accurately represent the developmental needs of Kern County’s children ages prenatal through five and their families” (p. 3). Accordingly, this chapter is built on the theme of Turning the Curve to
describe the improvement of key result indicators on the time dimension. Besides the statutory RBA requirement, Turning the Curve also represented a
prudent approach to confronting the latest budget challenges. On April 4, 2016, Governor Brown signed Senate Bill 3 to increase California’s minimum wage annually toward $15 per hour in 2022. This change will inevitably increase the cost of daycare and other early
childhood services. Since the budget setting was determined at the program level according to the dollar value in 2015, local service providers must increase their efficiency every year to absorb the cost increase in service delivery. In addition, Figure 38 showed
a decline trend of the state revenue from Proposition 10. The future financial uncertainty could be aggravated by the impact of Proposition 56 for adding $2.00-per-pack tax to reduce tobacco consumption.
FIGURE 38: DECLINE OF PROPOSITION 10 REVENUE IN CALIFORNIA
Accompanied with the resource decline is a steady increase of service demand from the local population growth. As a result, First 5 Kern added two new programs in Child Health this year. To track the results across different service providers, the Family
$650
$510
$440
$300
$100
$200
$300
$400
$500
$600
$700
2000 2010 2015 2020
$100/
$215/child

FIRST 5 KERN ANNUAL REPORT FISCAL YEAR 2015-2016
75
Stability Rubric (FSR) was employed to collect data on improvement of home conditions at 16 program sites in FY 2015-16. In addition, the Core Data Elements (CDE) survey
was conducted across 28 programs to monitor indicators of service enhancement between last year and this year. Alignments of the FSR and CDE findings have been provided at the end of this chapter to link empirical findings to focus areas of Child Health, Family
Functioning, and Child Development.
In support of the data tracking, a research protocol was approved by the
Institutional Review Board (IRB) of California State University, Bakersfield (CSUB). Under the IRB supervision, First 5 Kern made quarterly reports to ensure compliance to federal, state, and local regulations during its handling of program evaluation. Confidentiality
trainings were offered multiple times throughout the year for staff professional development. Consent forms were administered prior to information collection. Site visits occurred regularly to monitor any adverse effects across programs. The data gathering
was critical because “The Children and Families Act of 1998 mandates the collection of data for the purpose of demonstrating results” (First 5b Kern, 2015a).
In summary, value-added assessments have been incorporated in this chapter to examine service improvement across First 5 Kern-funded programs. According to Allen (2004), “Value-added assessment generally involves comparing two measurements that
establish baseline and final performance” (p. 9). Following the IRB report timeline, the FSR information was collected on a quarterly basis to monitor family conditions from the
Turning the Curve process. Meanwhile, permanent health records, such as full-term pregnancy and low birth weight, did not change at the individual level. Thus, CDE data were compared between adjacent years to evaluate the change of baseline conditions for
Kern County children ages 0-5.
Strengthening of Family Functioning in FY 2015-16
In last year, statewide data showed a higher percent of children in Kern County living in food insecure households (Figure 39).24 Consequently, family poverty remained
as a countywide issue for many young children. While “The first three years of life are a period of dynamic and unparalleled brain development” (Liu, 2014, p. 3), Cepeda (2015) reported that “poverty adversely affects structural brain development in children” (p. 1).
FIGURE 39: PERCENT OF CHILDREN IN FOOD INSECURE HOUSEHOLDS
24 http://www.kidsdata.org/topic/764/food-insecurity/trend#fmt=1168&loc=2,362&tf=64,79
0%
5%
10%
15%
20%
25%
30%
35%
2011 2012 2013 2014
California Kern County
Source: National Youth Tobacco Survey 2011-15.
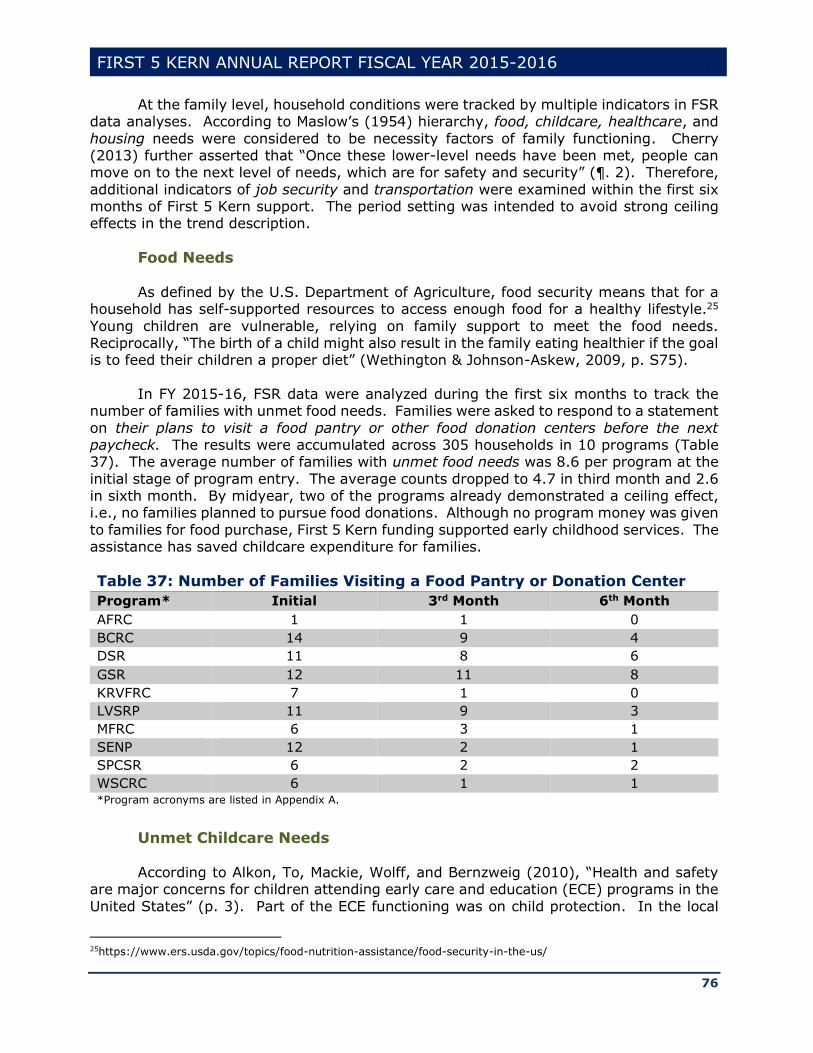
FIRST 5 KERN ANNUAL REPORT FISCAL YEAR 2015-2016
76
At the family level, household conditions were tracked by multiple indicators in FSR data analyses. According to Maslow’s (1954) hierarchy, food, childcare, healthcare, and
housing needs were considered to be necessity factors of family functioning. Cherry (2013) further asserted that “Once these lower-level needs have been met, people can move on to the next level of needs, which are for safety and security” (¶. 2). Therefore,
additional indicators of job security and transportation were examined within the first six months of First 5 Kern support. The period setting was intended to avoid strong ceiling effects in the trend description.
Food Needs
As defined by the U.S. Department of Agriculture, food security means that for a household has self-supported resources to access enough food for a healthy lifestyle.25
Young children are vulnerable, relying on family support to meet the food needs. Reciprocally, “The birth of a child might also result in the family eating healthier if the goal is to feed their children a proper diet” (Wethington & Johnson-Askew, 2009, p. S75).
In FY 2015-16, FSR data were analyzed during the first six months to track the
number of families with unmet food needs. Families were asked to respond to a statement
on their plans to visit a food pantry or other food donation centers before the next paycheck. The results were accumulated across 305 households in 10 programs (Table 37). The average number of families with unmet food needs was 8.6 per program at the
initial stage of program entry. The average counts dropped to 4.7 in third month and 2.6 in sixth month. By midyear, two of the programs already demonstrated a ceiling effect, i.e., no families planned to pursue food donations. Although no program money was given
to families for food purchase, First 5 Kern funding supported early childhood services. The assistance has saved childcare expenditure for families.
Table 37: Number of Families Visiting a Food Pantry or Donation Center
Program* Initial 3rd Month 6th Month
AFRC 1 1 0
BCRC 14 9 4
DSR 11 8 6
GSR 12 11 8
KRVFRC 7 1 0
LVSRP 11 9 3
MFRC 6 3 1
SENP 12 2 1
SPCSR 6 2 2
WSCRC 6 1 1 *Program acronyms are listed in Appendix A.
Unmet Childcare Needs
According to Alkon, To, Mackie, Wolff, and Bernzweig (2010), “Health and safety
are major concerns for children attending early care and education (ECE) programs in the
United States” (p. 3). Part of the ECE functioning was on child protection. In the local
25https://www.ers.usda.gov/topics/food-nutrition-assistance/food-security-in-the-us/
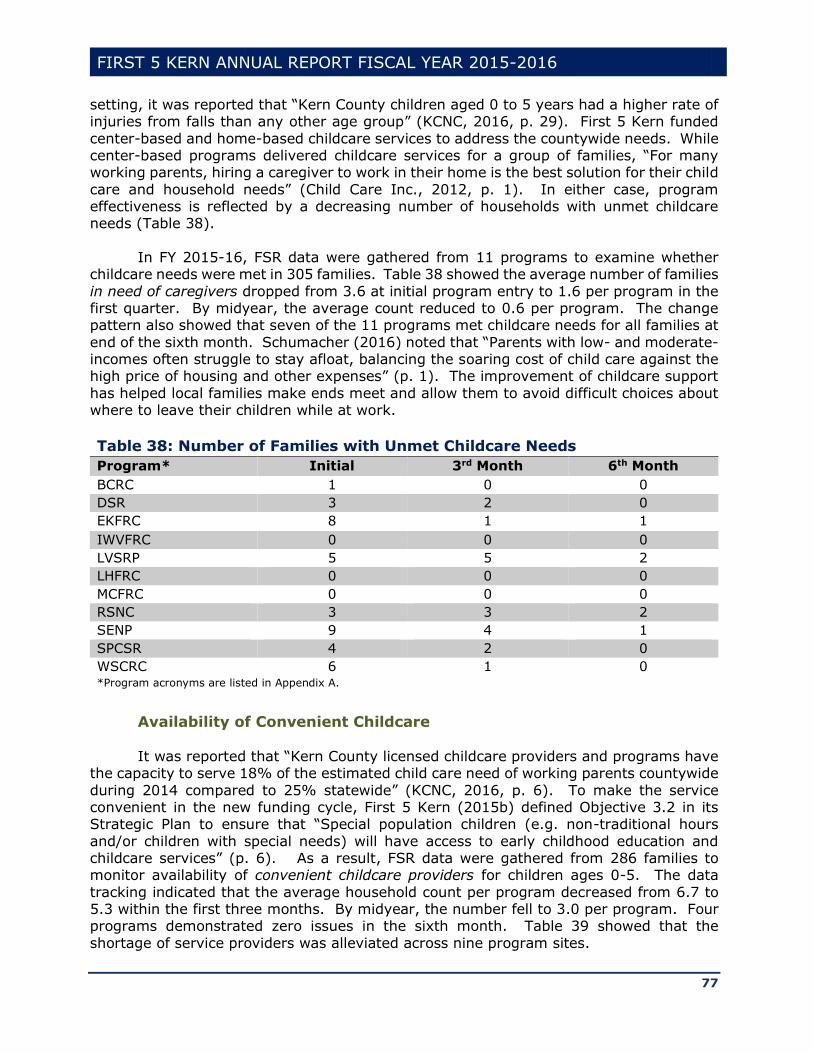
FIRST 5 KERN ANNUAL REPORT FISCAL YEAR 2015-2016
77
setting, it was reported that “Kern County children aged 0 to 5 years had a higher rate of injuries from falls than any other age group” (KCNC, 2016, p. 29). First 5 Kern funded
center-based and home-based childcare services to address the countywide needs. While center-based programs delivered childcare services for a group of families, “For many working parents, hiring a caregiver to work in their home is the best solution for their child
care and household needs” (Child Care Inc., 2012, p. 1). In either case, program effectiveness is reflected by a decreasing number of households with unmet childcare needs (Table 38).
In FY 2015-16, FSR data were gathered from 11 programs to examine whether
childcare needs were met in 305 families. Table 38 showed the average number of families
in need of caregivers dropped from 3.6 at initial program entry to 1.6 per program in the first quarter. By midyear, the average count reduced to 0.6 per program. The change pattern also showed that seven of the 11 programs met childcare needs for all families at
end of the sixth month. Schumacher (2016) noted that “Parents with low- and moderate-incomes often struggle to stay afloat, balancing the soaring cost of child care against the high price of housing and other expenses” (p. 1). The improvement of childcare support
has helped local families make ends meet and allow them to avoid difficult choices about where to leave their children while at work.
Table 38: Number of Families with Unmet Childcare Needs
Program* Initial 3rd Month 6th Month
BCRC 1 0 0
DSR 3 2 0
EKFRC 8 1 1
IWVFRC 0 0 0
LVSRP 5 5 2
LHFRC 0 0 0
MCFRC 0 0 0
RSNC 3 3 2
SENP 9 4 1
SPCSR 4 2 0
WSCRC 6 1 0 *Program acronyms are listed in Appendix A.
Availability of Convenient Childcare It was reported that “Kern County licensed childcare providers and programs have
the capacity to serve 18% of the estimated child care need of working parents countywide
during 2014 compared to 25% statewide” (KCNC, 2016, p. 6). To make the service convenient in the new funding cycle, First 5 Kern (2015b) defined Objective 3.2 in its Strategic Plan to ensure that “Special population children (e.g. non-traditional hours
and/or children with special needs) will have access to early childhood education and childcare services” (p. 6). As a result, FSR data were gathered from 286 families to monitor availability of convenient childcare providers for children ages 0-5. The data
tracking indicated that the average household count per program decreased from 6.7 to 5.3 within the first three months. By midyear, the number fell to 3.0 per program. Four programs demonstrated zero issues in the sixth month. Table 39 showed that the
shortage of service providers was alleviated across nine program sites.
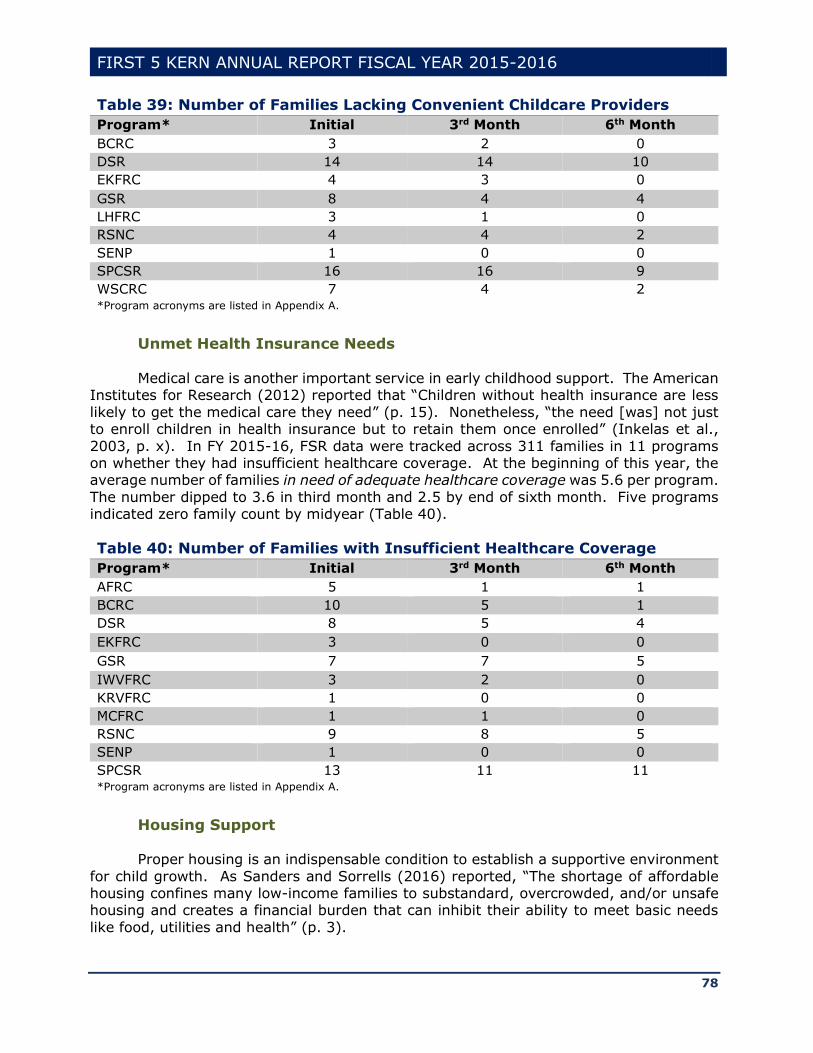
FIRST 5 KERN ANNUAL REPORT FISCAL YEAR 2015-2016
78
Table 39: Number of Families Lacking Convenient Childcare Providers
Program* Initial 3rd Month 6th Month
BCRC 3 2 0
DSR 14 14 10
EKFRC 4 3 0
GSR 8 4 4
LHFRC 3 1 0
RSNC 4 4 2
SENP 1 0 0
SPCSR 16 16 9
WSCRC 7 4 2 *Program acronyms are listed in Appendix A.
Unmet Health Insurance Needs
Medical care is another important service in early childhood support. The American
Institutes for Research (2012) reported that “Children without health insurance are less
likely to get the medical care they need” (p. 15). Nonetheless, “the need [was] not just to enroll children in health insurance but to retain them once enrolled” (Inkelas et al.,
2003, p. x). In FY 2015-16, FSR data were tracked across 311 families in 11 programs on whether they had insufficient healthcare coverage. At the beginning of this year, the average number of families in need of adequate healthcare coverage was 5.6 per program.
The number dipped to 3.6 in third month and 2.5 by end of sixth month. Five programs indicated zero family count by midyear (Table 40).
Table 40: Number of Families with Insufficient Healthcare Coverage
Program* Initial 3rd Month 6th Month
AFRC 5 1 1
BCRC 10 5 1
DSR 8 5 4
EKFRC 3 0 0
GSR 7 7 5
IWVFRC 3 2 0
KRVFRC 1 0 0
MCFRC 1 1 0
RSNC 9 8 5
SENP 1 0 0
SPCSR 13 11 11 *Program acronyms are listed in Appendix A.
Housing Support Proper housing is an indispensable condition to establish a supportive environment
for child growth. As Sanders and Sorrells (2016) reported, “The shortage of affordable housing confines many low-income families to substandard, overcrowded, and/or unsafe housing and creates a financial burden that can inhibit their ability to meet basic needs
like food, utilities and health” (p. 3).
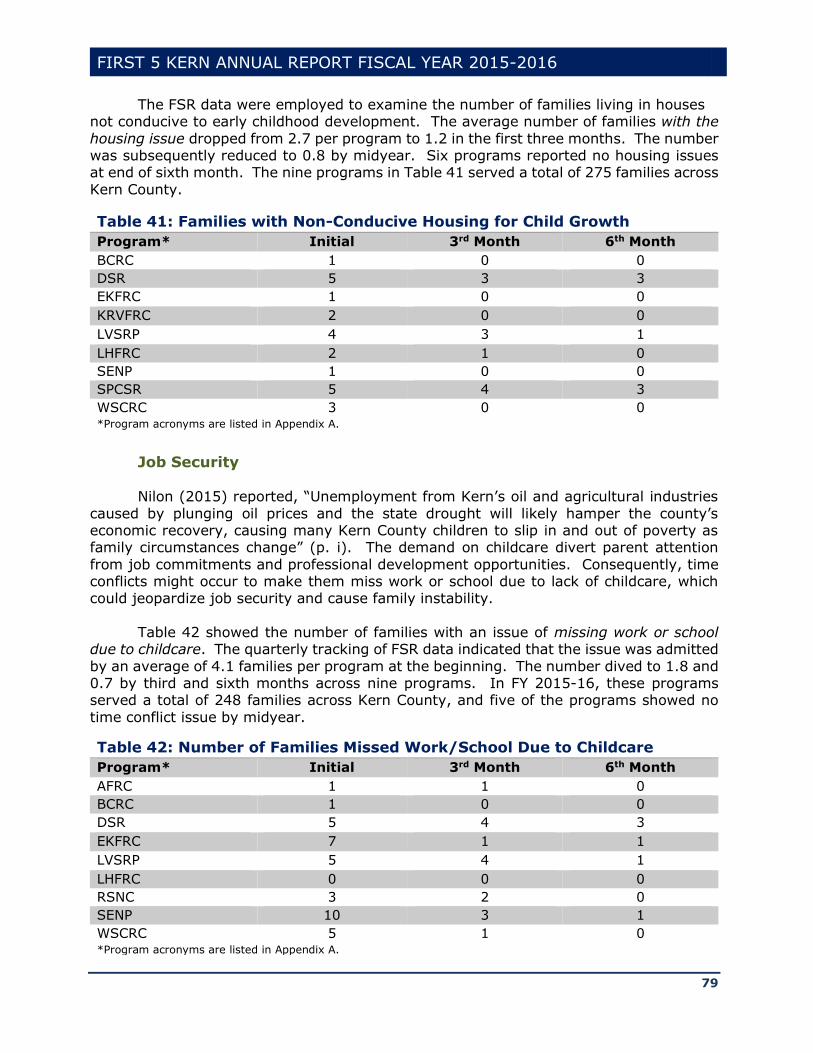
FIRST 5 KERN ANNUAL REPORT FISCAL YEAR 2015-2016
79
The FSR data were employed to examine the number of families living in houses not conducive to early childhood development. The average number of families with the
housing issue dropped from 2.7 per program to 1.2 in the first three months. The number was subsequently reduced to 0.8 by midyear. Six programs reported no housing issues at end of sixth month. The nine programs in Table 41 served a total of 275 families across
Kern County.
Table 41: Families with Non-Conducive Housing for Child Growth
Program* Initial 3rd Month 6th Month
BCRC 1 0 0
DSR 5 3 3
EKFRC 1 0 0
KRVFRC 2 0 0
LVSRP 4 3 1
LHFRC 2 1 0
SENP 1 0 0
SPCSR 5 4 3
WSCRC 3 0 0 *Program acronyms are listed in Appendix A.
Job Security
Nilon (2015) reported, “Unemployment from Kern’s oil and agricultural industries
caused by plunging oil prices and the state drought will likely hamper the county’s economic recovery, causing many Kern County children to slip in and out of poverty as family circumstances change” (p. i). The demand on childcare divert parent attention
from job commitments and professional development opportunities. Consequently, time conflicts might occur to make them miss work or school due to lack of childcare, which could jeopardize job security and cause family instability.
Table 42 showed the number of families with an issue of missing work or school
due to childcare. The quarterly tracking of FSR data indicated that the issue was admitted
by an average of 4.1 families per program at the beginning. The number dived to 1.8 and 0.7 by third and sixth months across nine programs. In FY 2015-16, these programs served a total of 248 families across Kern County, and five of the programs showed no
time conflict issue by midyear.
Table 42: Number of Families Missed Work/School Due to Childcare
Program* Initial 3rd Month 6th Month
AFRC 1 1 0
BCRC 1 0 0
DSR 5 4 3
EKFRC 7 1 1
LVSRP 5 4 1
LHFRC 0 0 0
RSNC 3 2 0
SENP 10 3 1
WSCRC 5 1 0 *Program acronyms are listed in Appendix A.
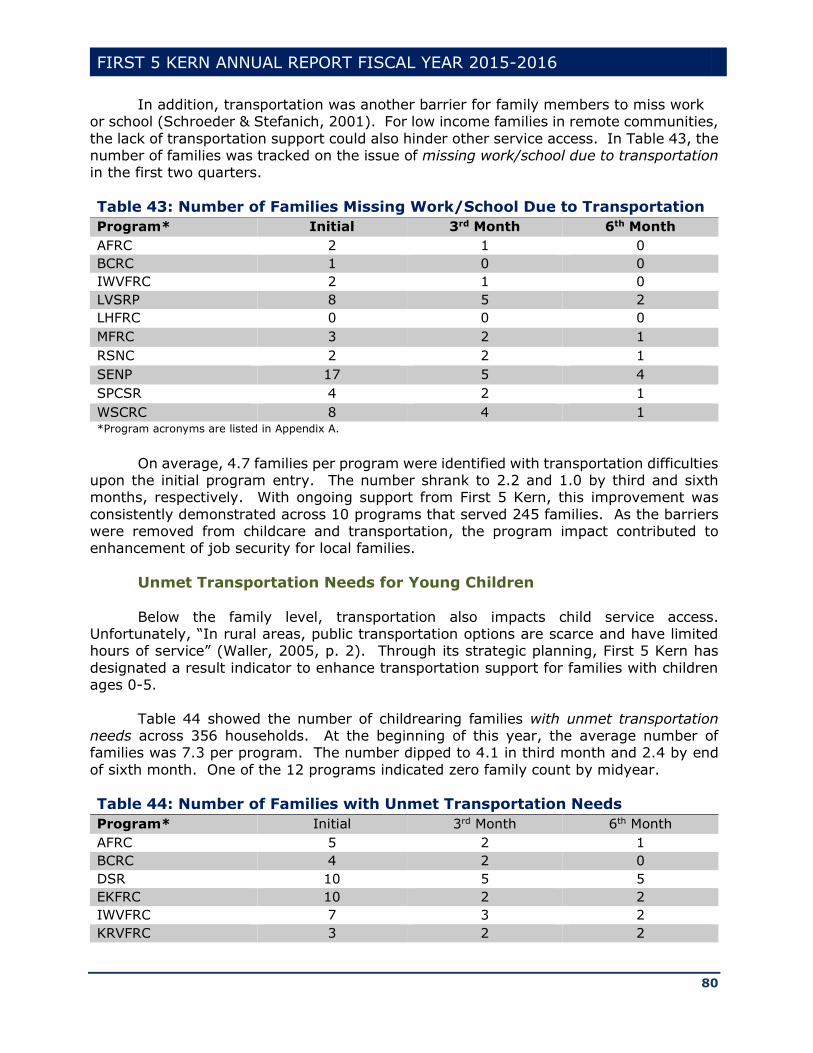
FIRST 5 KERN ANNUAL REPORT FISCAL YEAR 2015-2016
80
In addition, transportation was another barrier for family members to miss work or school (Schroeder & Stefanich, 2001). For low income families in remote communities,
the lack of transportation support could also hinder other service access. In Table 43, the number of families was tracked on the issue of missing work/school due to transportation in the first two quarters.
Table 43: Number of Families Missing Work/School Due to Transportation
Program* Initial 3rd Month 6th Month
AFRC 2 1 0
BCRC 1 0 0
IWVFRC 2 1 0
LVSRP 8 5 2
LHFRC 0 0 0
MFRC 3 2 1
RSNC 2 2 1
SENP 17 5 4
SPCSR 4 2 1
WSCRC 8 4 1 *Program acronyms are listed in Appendix A.
On average, 4.7 families per program were identified with transportation difficulties upon the initial program entry. The number shrank to 2.2 and 1.0 by third and sixth months, respectively. With ongoing support from First 5 Kern, this improvement was
consistently demonstrated across 10 programs that served 245 families. As the barriers were removed from childcare and transportation, the program impact contributed to enhancement of job security for local families.
Unmet Transportation Needs for Young Children
Below the family level, transportation also impacts child service access. Unfortunately, “In rural areas, public transportation options are scarce and have limited hours of service” (Waller, 2005, p. 2). Through its strategic planning, First 5 Kern has
designated a result indicator to enhance transportation support for families with children ages 0-5.
Table 44 showed the number of childrearing families with unmet transportation needs across 356 households. At the beginning of this year, the average number of families was 7.3 per program. The number dipped to 4.1 in third month and 2.4 by end
of sixth month. One of the 12 programs indicated zero family count by midyear.
Table 44: Number of Families with Unmet Transportation Needs
Program* Initial 3rd Month 6th Month
AFRC 5 2 1
BCRC 4 2 0
DSR 10 5 5
EKFRC 10 2 2
IWVFRC 7 3 2
KRVFRC 3 2 2
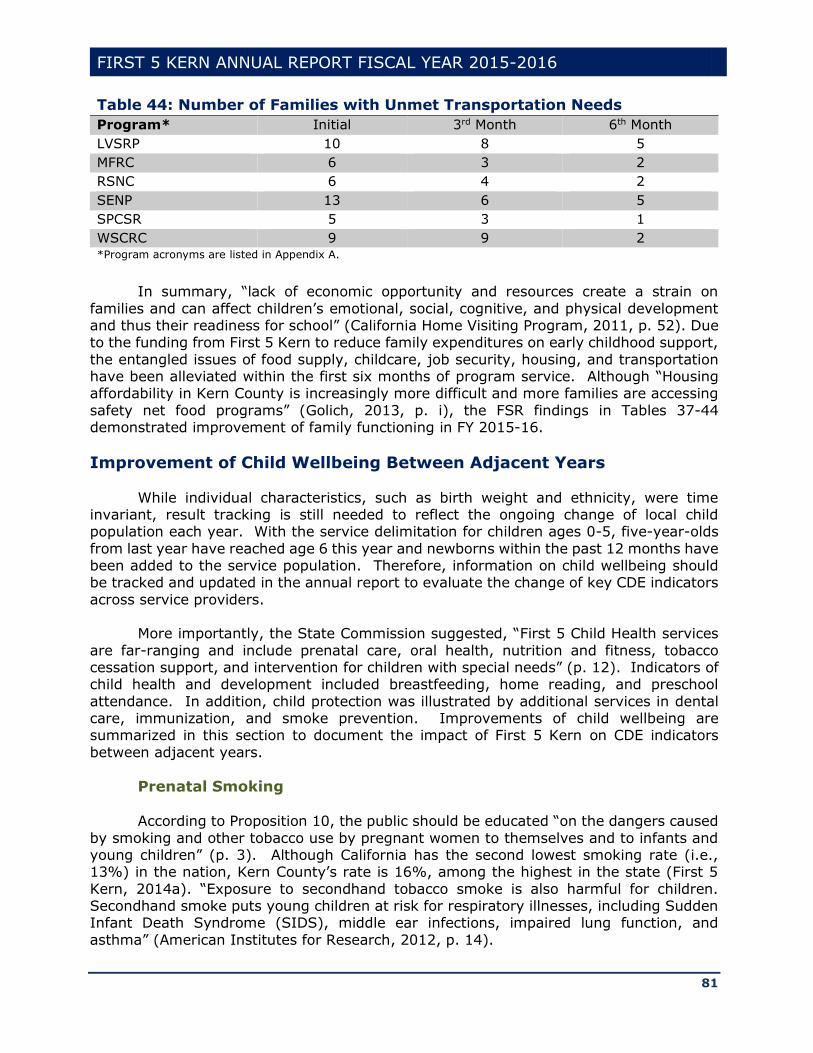
FIRST 5 KERN ANNUAL REPORT FISCAL YEAR 2015-2016
81
Table 44: Number of Families with Unmet Transportation Needs
Program* Initial 3rd Month 6th Month
LVSRP 10 8 5
MFRC 6 3 2
RSNC 6 4 2
SENP 13 6 5
SPCSR 5 3 1
WSCRC 9 9 2 *Program acronyms are listed in Appendix A.
In summary, “lack of economic opportunity and resources create a strain on
families and can affect children’s emotional, social, cognitive, and physical development and thus their readiness for school” (California Home Visiting Program, 2011, p. 52). Due to the funding from First 5 Kern to reduce family expenditures on early childhood support,
the entangled issues of food supply, childcare, job security, housing, and transportation have been alleviated within the first six months of program service. Although “Housing affordability in Kern County is increasingly more difficult and more families are accessing
safety net food programs” (Golich, 2013, p. i), the FSR findings in Tables 37-44 demonstrated improvement of family functioning in FY 2015-16.
Improvement of Child Wellbeing Between Adjacent Years
While individual characteristics, such as birth weight and ethnicity, were time invariant, result tracking is still needed to reflect the ongoing change of local child population each year. With the service delimitation for children ages 0-5, five-year-olds
from last year have reached age 6 this year and newborns within the past 12 months have been added to the service population. Therefore, information on child wellbeing should be tracked and updated in the annual report to evaluate the change of key CDE indicators
across service providers. More importantly, the State Commission suggested, “First 5 Child Health services
are far-ranging and include prenatal care, oral health, nutrition and fitness, tobacco cessation support, and intervention for children with special needs” (p. 12). Indicators of child health and development included breastfeeding, home reading, and preschool
attendance. In addition, child protection was illustrated by additional services in dental care, immunization, and smoke prevention. Improvements of child wellbeing are summarized in this section to document the impact of First 5 Kern on CDE indicators
between adjacent years.
Prenatal Smoking According to Proposition 10, the public should be educated “on the dangers caused
by smoking and other tobacco use by pregnant women to themselves and to infants and young children” (p. 3). Although California has the second lowest smoking rate (i.e., 13%) in the nation, Kern County’s rate is 16%, among the highest in the state (First 5
Kern, 2014a). “Exposure to secondhand tobacco smoke is also harmful for children. Secondhand smoke puts young children at risk for respiratory illnesses, including Sudden Infant Death Syndrome (SIDS), middle ear infections, impaired lung function, and
asthma” (American Institutes for Research, 2012, p. 14).
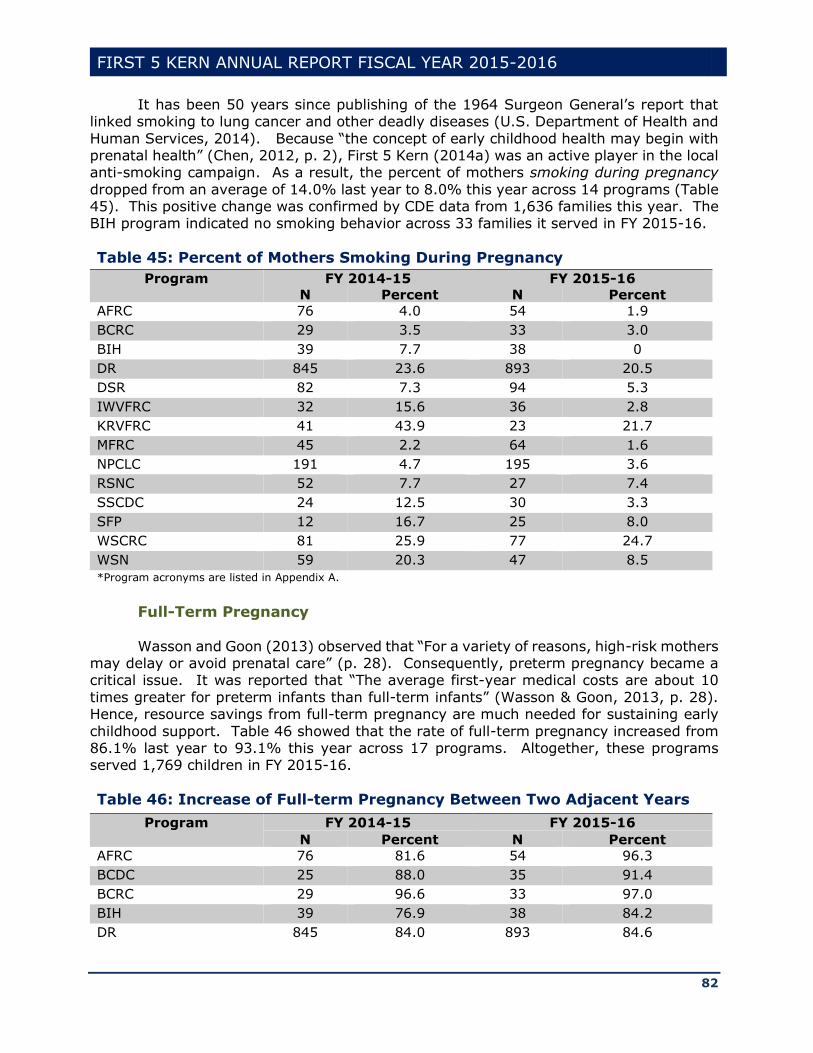
FIRST 5 KERN ANNUAL REPORT FISCAL YEAR 2015-2016
82
It has been 50 years since publishing of the 1964 Surgeon General’s report that linked smoking to lung cancer and other deadly diseases (U.S. Department of Health and
Human Services, 2014). Because “the concept of early childhood health may begin with prenatal health” (Chen, 2012, p. 2), First 5 Kern (2014a) was an active player in the local anti-smoking campaign. As a result, the percent of mothers smoking during pregnancy
dropped from an average of 14.0% last year to 8.0% this year across 14 programs (Table 45). This positive change was confirmed by CDE data from 1,636 families this year. The BIH program indicated no smoking behavior across 33 families it served in FY 2015-16.
Table 45: Percent of Mothers Smoking During Pregnancy
Program FY 2014-15 FY 2015-16
N Percent N Percent
AFRC 76 4.0 54 1.9
BCRC 29 3.5 33 3.0
BIH 39 7.7 38 0
DR 845 23.6 893 20.5
DSR 82 7.3 94 5.3
IWVFRC 32 15.6 36 2.8
KRVFRC 41 43.9 23 21.7
MFRC 45 2.2 64 1.6
NPCLC 191 4.7 195 3.6
RSNC 52 7.7 27 7.4
SSCDC 24 12.5 30 3.3
SFP 12 16.7 25 8.0
WSCRC 81 25.9 77 24.7
WSN 59 20.3 47 8.5
*Program acronyms are listed in Appendix A.
Full-Term Pregnancy
Wasson and Goon (2013) observed that “For a variety of reasons, high-risk mothers may delay or avoid prenatal care” (p. 28). Consequently, preterm pregnancy became a critical issue. It was reported that “The average first-year medical costs are about 10
times greater for preterm infants than full-term infants” (Wasson & Goon, 2013, p. 28). Hence, resource savings from full-term pregnancy are much needed for sustaining early
childhood support. Table 46 showed that the rate of full-term pregnancy increased from 86.1% last year to 93.1% this year across 17 programs. Altogether, these programs served 1,769 children in FY 2015-16.
Table 46: Increase of Full-term Pregnancy Between Two Adjacent Years
Program FY 2014-15 FY 2015-16
N Percent N Percent
AFRC 76 81.6 54 96.3
BCDC 25 88.0 35 91.4
BCRC 29 96.6 33 97.0
BIH 39 76.9 38 84.2
DR 845 84.0 893 84.6
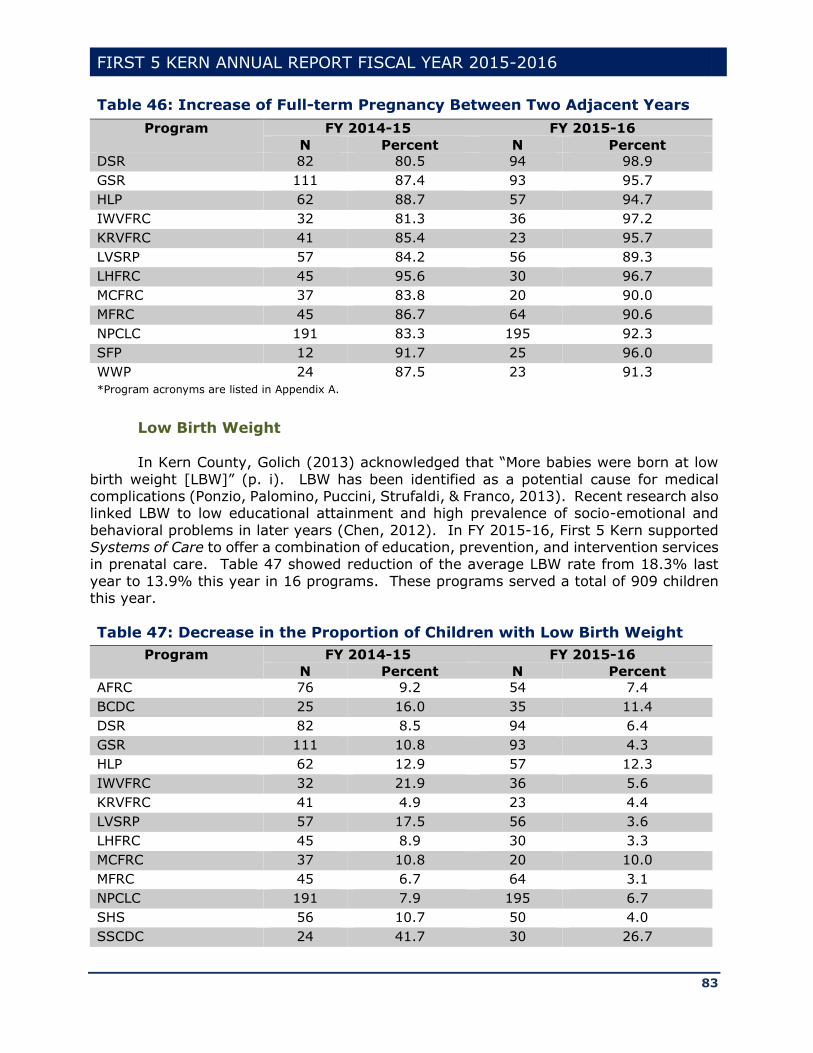
FIRST 5 KERN ANNUAL REPORT FISCAL YEAR 2015-2016
83
Table 46: Increase of Full-term Pregnancy Between Two Adjacent Years
Program FY 2014-15 FY 2015-16
N Percent N Percent
DSR 82 80.5 94 98.9
GSR 111 87.4 93 95.7
HLP 62 88.7 57 94.7
IWVFRC 32 81.3 36 97.2
KRVFRC 41 85.4 23 95.7
LVSRP 57 84.2 56 89.3
LHFRC 45 95.6 30 96.7
MCFRC 37 83.8 20 90.0
MFRC 45 86.7 64 90.6
NPCLC 191 83.3 195 92.3
SFP 12 91.7 25 96.0
WWP 24 87.5 23 91.3
*Program acronyms are listed in Appendix A.
Low Birth Weight
In Kern County, Golich (2013) acknowledged that “More babies were born at low
birth weight [LBW]” (p. i). LBW has been identified as a potential cause for medical complications (Ponzio, Palomino, Puccini, Strufaldi, & Franco, 2013). Recent research also linked LBW to low educational attainment and high prevalence of socio-emotional and
behavioral problems in later years (Chen, 2012). In FY 2015-16, First 5 Kern supported Systems of Care to offer a combination of education, prevention, and intervention services in prenatal care. Table 47 showed reduction of the average LBW rate from 18.3% last
year to 13.9% this year in 16 programs. These programs served a total of 909 children this year.
Table 47: Decrease in the Proportion of Children with Low Birth Weight
Program FY 2014-15 FY 2015-16
N Percent N Percent
AFRC 76 9.2 54 7.4
BCDC 25 16.0 35 11.4
DSR 82 8.5 94 6.4
GSR 111 10.8 93 4.3
HLP 62 12.9 57 12.3
IWVFRC 32 21.9 36 5.6
KRVFRC 41 4.9 23 4.4
LVSRP 57 17.5 56 3.6
LHFRC 45 8.9 30 3.3
MCFRC 37 10.8 20 10.0
MFRC 45 6.7 64 3.1
NPCLC 191 7.9 195 6.7
SHS 56 10.7 50 4.0
SSCDC 24 41.7 30 26.7
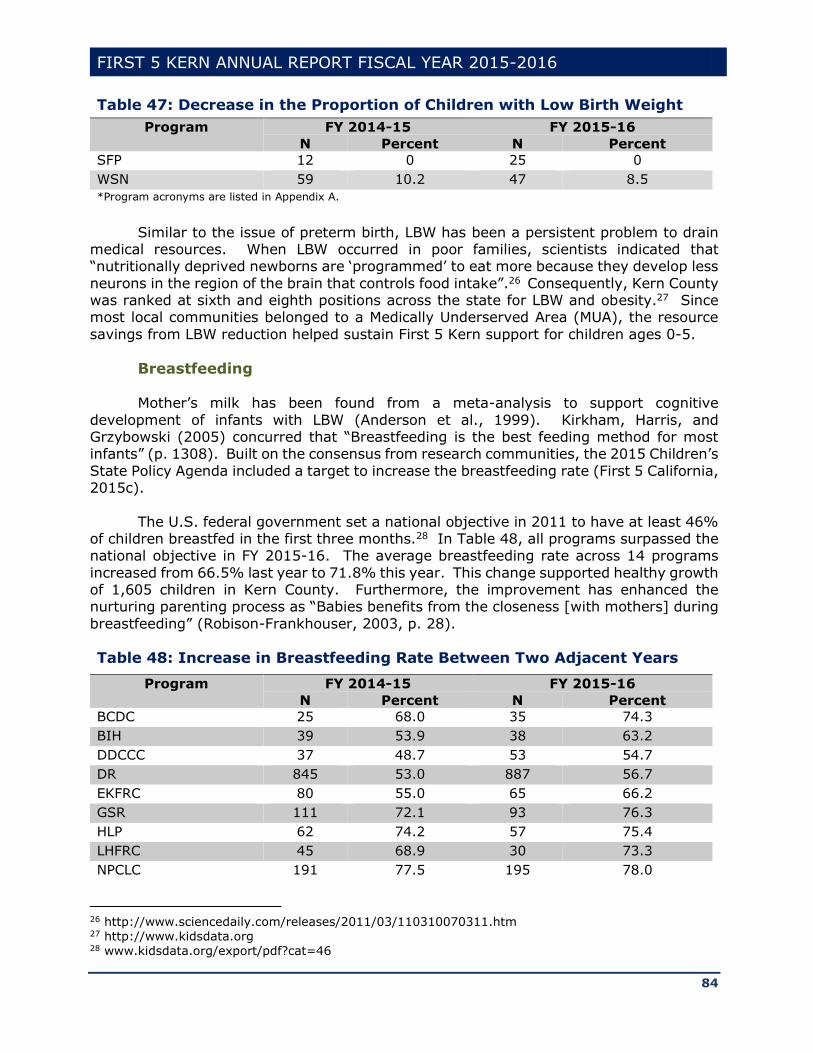
FIRST 5 KERN ANNUAL REPORT FISCAL YEAR 2015-2016
84
Table 47: Decrease in the Proportion of Children with Low Birth Weight
Program FY 2014-15 FY 2015-16
N Percent N Percent
SFP 12 0 25 0
WSN 59 10.2 47 8.5
*Program acronyms are listed in Appendix A.
Similar to the issue of preterm birth, LBW has been a persistent problem to drain medical resources. When LBW occurred in poor families, scientists indicated that “nutritionally deprived newborns are ‘programmed’ to eat more because they develop less
neurons in the region of the brain that controls food intake”.26 Consequently, Kern County was ranked at sixth and eighth positions across the state for LBW and obesity.27 Since most local communities belonged to a Medically Underserved Area (MUA), the resource
savings from LBW reduction helped sustain First 5 Kern support for children ages 0-5.
Breastfeeding
Mother’s milk has been found from a meta-analysis to support cognitive
development of infants with LBW (Anderson et al., 1999). Kirkham, Harris, and Grzybowski (2005) concurred that “Breastfeeding is the best feeding method for most infants” (p. 1308). Built on the consensus from research communities, the 2015 Children’s
State Policy Agenda included a target to increase the breastfeeding rate (First 5 California, 2015c).
The U.S. federal government set a national objective in 2011 to have at least 46% of children breastfed in the first three months.28 In Table 48, all programs surpassed the national objective in FY 2015-16. The average breastfeeding rate across 14 programs
increased from 66.5% last year to 71.8% this year. This change supported healthy growth of 1,605 children in Kern County. Furthermore, the improvement has enhanced the nurturing parenting process as “Babies benefits from the closeness [with mothers] during
breastfeeding” (Robison-Frankhouser, 2003, p. 28).
Table 48: Increase in Breastfeeding Rate Between Two Adjacent Years
Program FY 2014-15 FY 2015-16
N Percent N Percent
BCDC 25 68.0 35 74.3
BIH 39 53.9 38 63.2
DDCCC 37 48.7 53 54.7
DR 845 53.0 887 56.7
EKFRC 80 55.0 65 66.2
GSR 111 72.1 93 76.3
HLP 62 74.2 57 75.4
LHFRC 45 68.9 30 73.3
NPCLC 191 77.5 195 78.0
26 http://www.sciencedaily.com/releases/2011/03/110310070311.htm 27 http://www.kidsdata.org 28 www.kidsdata.org/export/pdf?cat=46
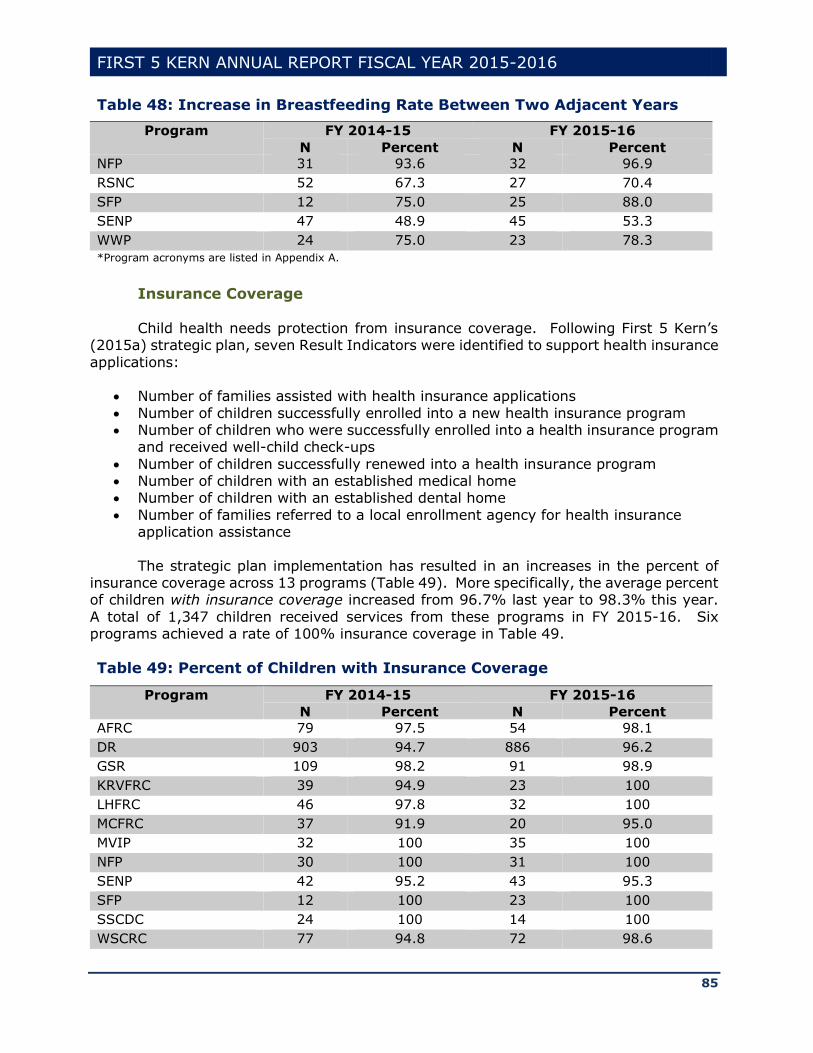
FIRST 5 KERN ANNUAL REPORT FISCAL YEAR 2015-2016
85
Table 48: Increase in Breastfeeding Rate Between Two Adjacent Years
Program FY 2014-15 FY 2015-16
N Percent N Percent
NFP 31 93.6 32 96.9
RSNC 52 67.3 27 70.4
SFP 12 75.0 25 88.0
SENP 47 48.9 45 53.3
WWP 24 75.0 23 78.3
*Program acronyms are listed in Appendix A.
Insurance Coverage Child health needs protection from insurance coverage. Following First 5 Kern’s
(2015a) strategic plan, seven Result Indicators were identified to support health insurance
applications:
Number of families assisted with health insurance applications
Number of children successfully enrolled into a new health insurance program Number of children who were successfully enrolled into a health insurance program
and received well-child check-ups
Number of children successfully renewed into a health insurance program Number of children with an established medical home Number of children with an established dental home
Number of families referred to a local enrollment agency for health insurance application assistance
The strategic plan implementation has resulted in an increases in the percent of insurance coverage across 13 programs (Table 49). More specifically, the average percent of children with insurance coverage increased from 96.7% last year to 98.3% this year.
A total of 1,347 children received services from these programs in FY 2015-16. Six programs achieved a rate of 100% insurance coverage in Table 49.
Table 49: Percent of Children with Insurance Coverage
Program FY 2014-15 FY 2015-16
N Percent N Percent
AFRC 79 97.5 54 98.1
DR 903 94.7 886 96.2
GSR 109 98.2 91 98.9
KRVFRC 39 94.9 23 100
LHFRC 46 97.8 32 100
MCFRC 37 91.9 20 95.0
MVIP 32 100 35 100
NFP 30 100 31 100
SENP 42 95.2 43 95.3
SFP 12 100 23 100
SSCDC 24 100 14 100
WSCRC 77 94.8 72 98.6
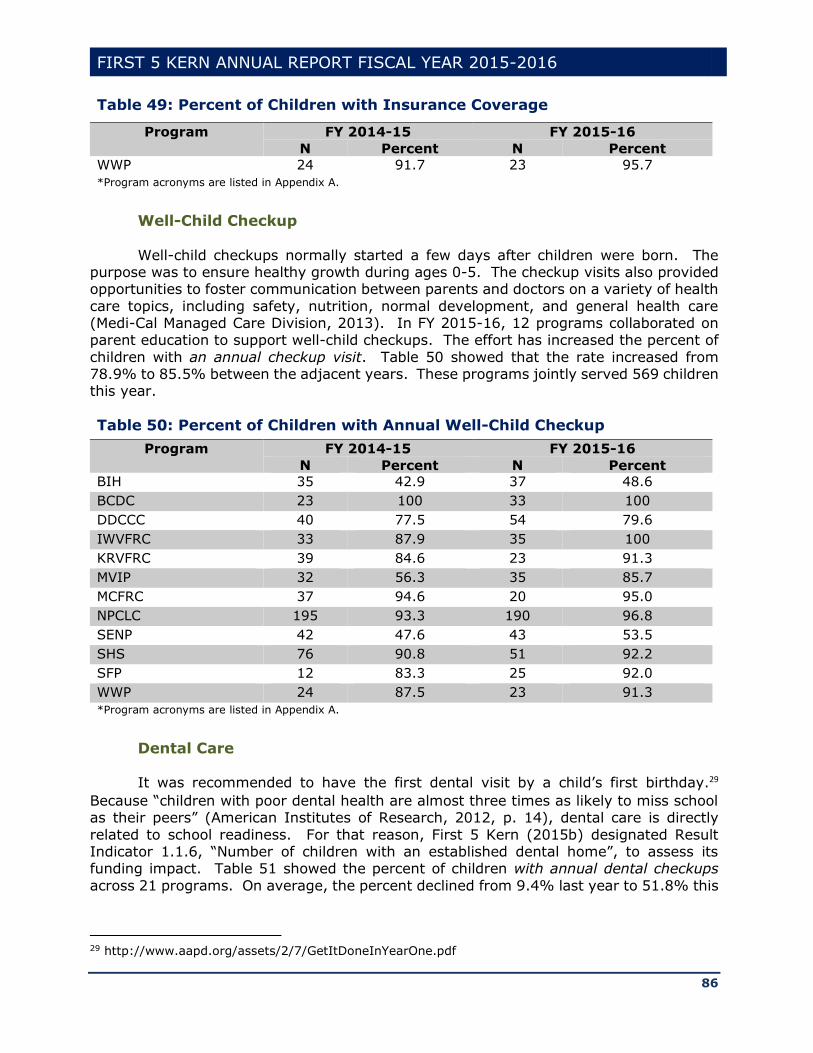
FIRST 5 KERN ANNUAL REPORT FISCAL YEAR 2015-2016
86
Table 49: Percent of Children with Insurance Coverage
Program FY 2014-15 FY 2015-16
N Percent N Percent
WWP 24 91.7 23 95.7
*Program acronyms are listed in Appendix A.
Well-Child Checkup
Well-child checkups normally started a few days after children were born. The purpose was to ensure healthy growth during ages 0-5. The checkup visits also provided opportunities to foster communication between parents and doctors on a variety of health
care topics, including safety, nutrition, normal development, and general health care (Medi-Cal Managed Care Division, 2013). In FY 2015-16, 12 programs collaborated on parent education to support well-child checkups. The effort has increased the percent of
children with an annual checkup visit. Table 50 showed that the rate increased from 78.9% to 85.5% between the adjacent years. These programs jointly served 569 children this year.
Table 50: Percent of Children with Annual Well-Child Checkup
Program FY 2014-15 FY 2015-16
N Percent N Percent
BIH 35 42.9 37 48.6
BCDC 23 100 33 100
DDCCC 40 77.5 54 79.6
IWVFRC 33 87.9 35 100
KRVFRC 39 84.6 23 91.3
MVIP 32 56.3 35 85.7
MCFRC 37 94.6 20 95.0
NPCLC 195 93.3 190 96.8
SENP 42 47.6 43 53.5
SHS 76 90.8 51 92.2
SFP 12 83.3 25 92.0
WWP 24 87.5 23 91.3
*Program acronyms are listed in Appendix A.
Dental Care It was recommended to have the first dental visit by a child’s first birthday.29
Because “children with poor dental health are almost three times as likely to miss school as their peers” (American Institutes of Research, 2012, p. 14), dental care is directly
related to school readiness. For that reason, First 5 Kern (2015b) designated Result Indicator 1.1.6, “Number of children with an established dental home”, to assess its funding impact. Table 51 showed the percent of children with annual dental checkups
across 21 programs. On average, the percent declined from 9.4% last year to 51.8% this
29 http://www.aapd.org/assets/2/7/GetItDoneInYearOne.pdf
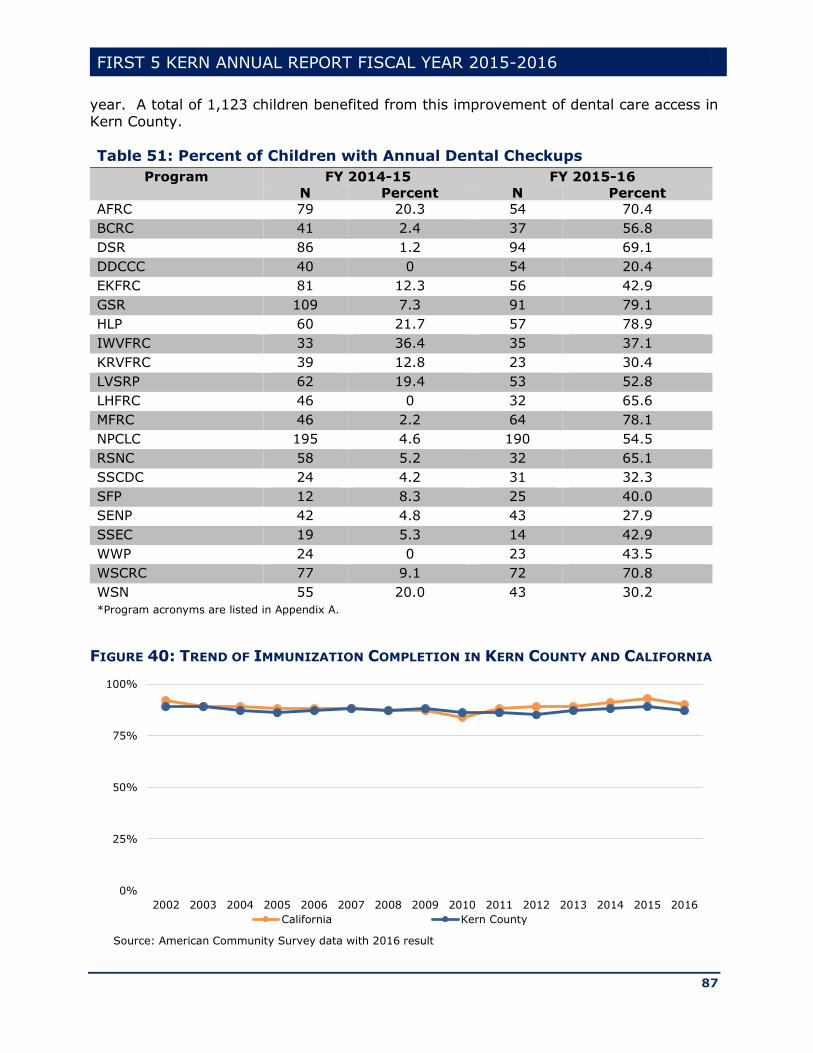
FIRST 5 KERN ANNUAL REPORT FISCAL YEAR 2015-2016
87
year. A total of 1,123 children benefited from this improvement of dental care access in Kern County.
Table 51: Percent of Children with Annual Dental Checkups
Program FY 2014-15 FY 2015-16
N Percent N Percent
AFRC 79 20.3 54 70.4
BCRC 41 2.4 37 56.8
DSR 86 1.2 94 69.1
DDCCC 40 0 54 20.4
EKFRC 81 12.3 56 42.9
GSR 109 7.3 91 79.1
HLP 60 21.7 57 78.9
IWVFRC 33 36.4 35 37.1
KRVFRC 39 12.8 23 30.4
LVSRP 62 19.4 53 52.8
LHFRC 46 0 32 65.6
MFRC 46 2.2 64 78.1
NPCLC 195 4.6 190 54.5
RSNC 58 5.2 32 65.1
SSCDC 24 4.2 31 32.3
SFP 12 8.3 25 40.0
SENP 42 4.8 43 27.9
SSEC 19 5.3 14 42.9
WWP 24 0 23 43.5
WSCRC 77 9.1 72 70.8
WSN 55 20.0 43 30.2
*Program acronyms are listed in Appendix A.
FIGURE 40: TREND OF IMMUNIZATION COMPLETION IN KERN COUNTY AND CALIFORNIA
0%
25%
50%
75%
100%
2002 2003 2004 2005 2006 2007 2008 2009 2010 2011 2012 2013 2014 2015 2016
California Kern County
Source: American Community Survey data with 2016 result
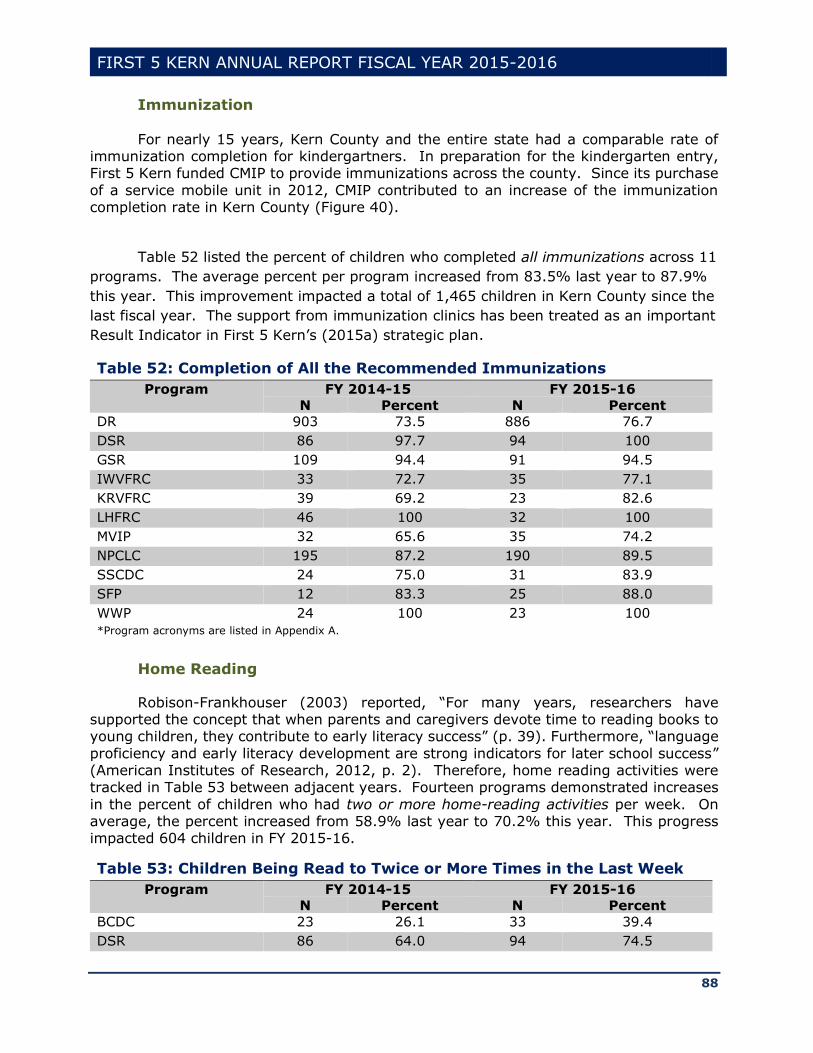
FIRST 5 KERN ANNUAL REPORT FISCAL YEAR 2015-2016
88
Immunization
For nearly 15 years, Kern County and the entire state had a comparable rate of immunization completion for kindergartners. In preparation for the kindergarten entry, First 5 Kern funded CMIP to provide immunizations across the county. Since its purchase
of a service mobile unit in 2012, CMIP contributed to an increase of the immunization completion rate in Kern County (Figure 40).
Table 52 listed the percent of children who completed all immunizations across 11
programs. The average percent per program increased from 83.5% last year to 87.9%
this year. This improvement impacted a total of 1,465 children in Kern County since the
last fiscal year. The support from immunization clinics has been treated as an important
Result Indicator in First 5 Kern’s (2015a) strategic plan.
Table 52: Completion of All the Recommended Immunizations
Program FY 2014-15 FY 2015-16
N Percent N Percent
DR 903 73.5 886 76.7
DSR 86 97.7 94 100
GSR 109 94.4 91 94.5
IWVFRC 33 72.7 35 77.1
KRVFRC 39 69.2 23 82.6
LHFRC 46 100 32 100
MVIP 32 65.6 35 74.2
NPCLC 195 87.2 190 89.5
SSCDC 24 75.0 31 83.9
SFP 12 83.3 25 88.0
WWP 24 100 23 100
*Program acronyms are listed in Appendix A.
Home Reading
Robison-Frankhouser (2003) reported, “For many years, researchers have supported the concept that when parents and caregivers devote time to reading books to young children, they contribute to early literacy success” (p. 39). Furthermore, “language
proficiency and early literacy development are strong indicators for later school success” (American Institutes of Research, 2012, p. 2). Therefore, home reading activities were tracked in Table 53 between adjacent years. Fourteen programs demonstrated increases
in the percent of children who had two or more home-reading activities per week. On average, the percent increased from 58.9% last year to 70.2% this year. This progress impacted 604 children in FY 2015-16.
Table 53: Children Being Read to Twice or More Times in the Last Week
Program FY 2014-15 FY 2015-16
N Percent N Percent
BCDC 23 26.1 33 39.4
DSR 86 64.0 94 74.5

FIRST 5 KERN ANNUAL REPORT FISCAL YEAR 2015-2016
89
Table 53: Children Being Read to Twice or More Times in the Last Week
Program FY 2014-15 FY 2015-16
N Percent N Percent
EKFRC 81 69.1 56 71.4
IWVFRC 33 69.7 35 71.4
KRVFRC 39 71.8 23 91.3
LVSRP 62 62.9 53 73.6
LHFRC 46 41.3 32 43.8
MVIP 32 21.9 35 45.7
MCFRC 37 81.1 20 90.0
RSNC 58 82.8 32 90.6
SHS 76 71.1 51 76.5
SPCSR 110 70.0 66 81.8
SSCDC 24 50.0 31 83.9
SENP 42 42.9 43 48.8
*Program acronyms are listed in Appendix A.
Prenatal Care In FY 2015-16, “Number of pregnant women referred to prenatal care services”
was listed as Result Indicator 1.1.2 in First 5 Kern’s (2015b) Strategic Plan. Programs
were funded to provide education and service access to pregnant mothers. As a result, the average rate of monthly prenatal care increased from 98.1% in the last year to 99.3% this year across 12 programs that served 539 families (Table 54). Eight of the programs
reached 100% this year.
Table 54: Percent of Mothers Receiving Prenatal Care
Program FY 2014-15 FY 2015-16
N Percent N Percent
AFRC 76 98.7 54 100
BCDC 25 100 35 100
BIH 39 100 38 100
DSR 82 95.1 94 98.9
GSR 111 93.7 93 98.9
IWVFRC 32 100 36 100
KRVFRC 41 95.1 23 95.7
LVSRP 57 94.7 56 98.2
NFP 31 100 32 100
SSCDC 24 100 30 100
SFP 12 100 25 100
WWP 24 100 23 100
*Program acronyms are listed in Appendix A.
Preschool Attendance
Preschools were designed to foster the young child’s social and emotional growth (Robison-Frankhouser, 2003). According to First 5 California (2013), “Preschool
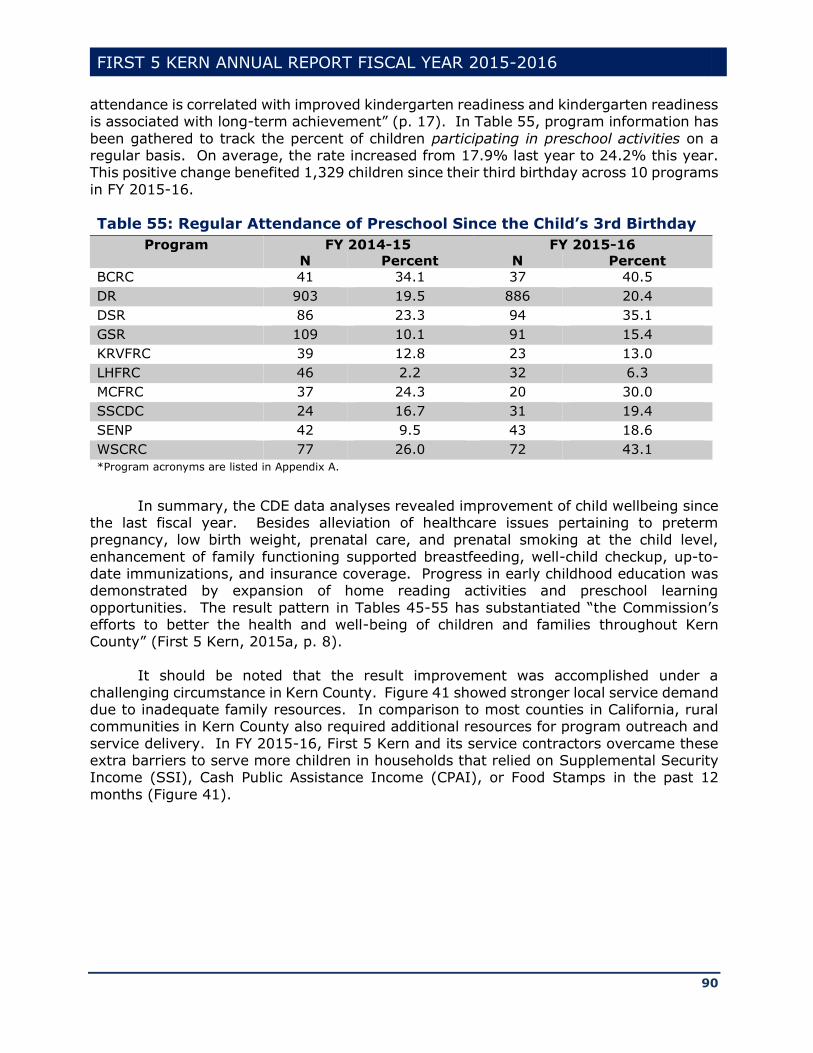
FIRST 5 KERN ANNUAL REPORT FISCAL YEAR 2015-2016
90
attendance is correlated with improved kindergarten readiness and kindergarten readiness is associated with long-term achievement” (p. 17). In Table 55, program information has
been gathered to track the percent of children participating in preschool activities on a regular basis. On average, the rate increased from 17.9% last year to 24.2% this year. This positive change benefited 1,329 children since their third birthday across 10 programs
in FY 2015-16.
Table 55: Regular Attendance of Preschool Since the Child’s 3rd Birthday
Program FY 2014-15 FY 2015-16
N Percent N Percent
BCRC 41 34.1 37 40.5
DR 903 19.5 886 20.4
DSR 86 23.3 94 35.1
GSR 109 10.1 91 15.4
KRVFRC 39 12.8 23 13.0
LHFRC 46 2.2 32 6.3
MCFRC 37 24.3 20 30.0
SSCDC 24 16.7 31 19.4
SENP 42 9.5 43 18.6
WSCRC 77 26.0 72 43.1
*Program acronyms are listed in Appendix A.
In summary, the CDE data analyses revealed improvement of child wellbeing since
the last fiscal year. Besides alleviation of healthcare issues pertaining to preterm pregnancy, low birth weight, prenatal care, and prenatal smoking at the child level,
enhancement of family functioning supported breastfeeding, well-child checkup, up-to-date immunizations, and insurance coverage. Progress in early childhood education was demonstrated by expansion of home reading activities and preschool learning
opportunities. The result pattern in Tables 45-55 has substantiated “the Commission’s efforts to better the health and well-being of children and families throughout Kern County” (First 5 Kern, 2015a, p. 8).
It should be noted that the result improvement was accomplished under a
challenging circumstance in Kern County. Figure 41 showed stronger local service demand due to inadequate family resources. In comparison to most counties in California, rural communities in Kern County also required additional resources for program outreach and
service delivery. In FY 2015-16, First 5 Kern and its service contractors overcame these extra barriers to serve more children in households that relied on Supplemental Security Income (SSI), Cash Public Assistance Income (CPAI), or Food Stamps in the past 12
months (Figure 41).
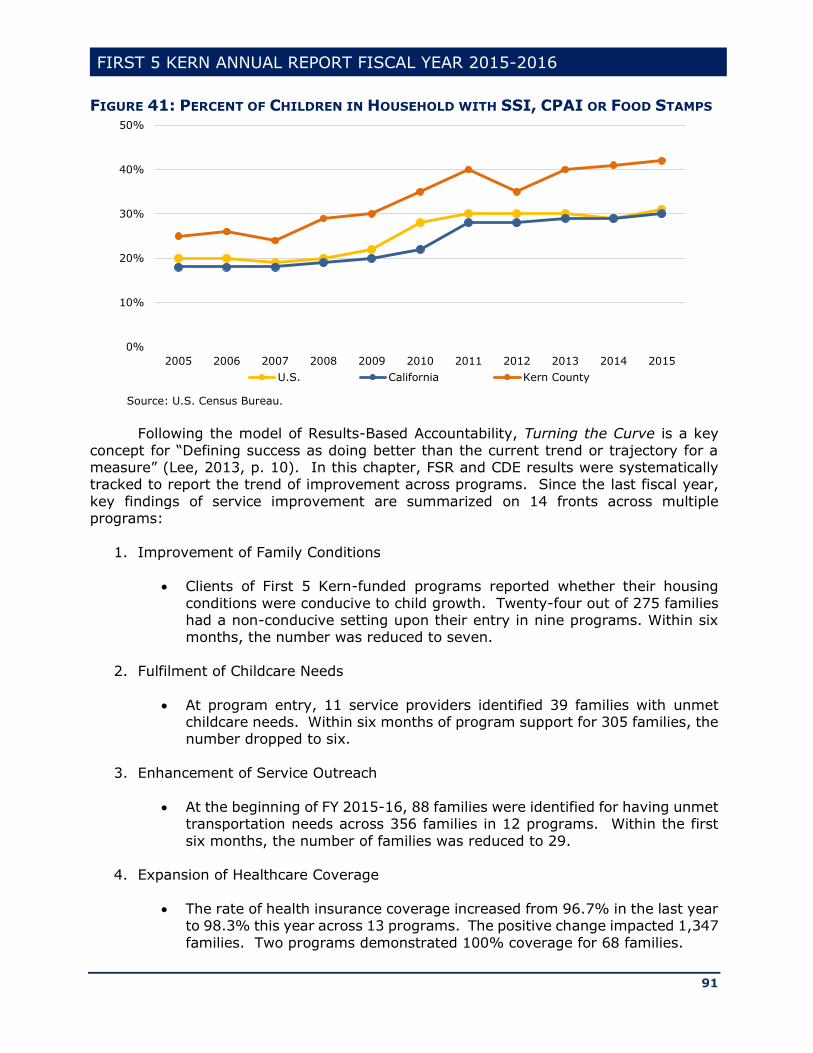
FIRST 5 KERN ANNUAL REPORT FISCAL YEAR 2015-2016
91
FIGURE 41: PERCENT OF CHILDREN IN HOUSEHOLD WITH SSI, CPAI OR FOOD STAMPS
Following the model of Results-Based Accountability, Turning the Curve is a key
concept for “Defining success as doing better than the current trend or trajectory for a measure” (Lee, 2013, p. 10). In this chapter, FSR and CDE results were systematically tracked to report the trend of improvement across programs. Since the last fiscal year,
key findings of service improvement are summarized on 14 fronts across multiple programs:
1. Improvement of Family Conditions
Clients of First 5 Kern-funded programs reported whether their housing
conditions were conducive to child growth. Twenty-four out of 275 families had a non-conducive setting upon their entry in nine programs. Within six months, the number was reduced to seven.
2. Fulfilment of Childcare Needs
At program entry, 11 service providers identified 39 families with unmet childcare needs. Within six months of program support for 305 families, the number dropped to six.
3. Enhancement of Service Outreach
At the beginning of FY 2015-16, 88 families were identified for having unmet transportation needs across 356 families in 12 programs. Within the first
six months, the number of families was reduced to 29.
4. Expansion of Healthcare Coverage
The rate of health insurance coverage increased from 96.7% in the last year
to 98.3% this year across 13 programs. The positive change impacted 1,347
families. Two programs demonstrated 100% coverage for 68 families.
0%
10%
20%
30%
40%
50%
2005 2006 2007 2008 2009 2010 2011 2012 2013 2014 2015
U.S. California Kern County
Source: U.S. Census Bureau.
FIRST 5 KERN ANNUAL REPORT FISCAL YEAR 2015-2016
92
5. Implementation of Well-Child Checkup
The percent of families having annual well-child checkup increased from
78.9% in the last year to 85.5% this year in 12 programs. This positive
change impacted a total of 569 families.
6. Monitoring of Dental Care
Twenty-one programs tracked the number of families with child dental visit
in the last 12 months. The average rate climbed from 9.4% in the last year
to 51.8% this year. In FY 2015-16, there were 1,123 families served by these programs in Kern County.
7. Fulfillment of Immunization Requirements
The rate of children receiving all immunizations increased from 83.5% in the
last year to 87.9% this year across 11 programs. The trend data included information from 1,465 families.
8. Improvement of Preschool Attendance
Ten programs showed an increase of regular preschool attendance from 17.9% in the last year to 24.2% this year. These service providers supported 1,329 families in FY 2015-16.
9. Enhancement of Reading Literacy
The number of children being read to twice or more times per week was tracked for 604 families in 14 programs. The rate increased from 58.9% in the last year to 70.2% this year.
10. Expansion of Prenatal Care
The percent of mothers receiving prenatal care was raised from 98.1% in the last year to 99.3% this year across 12 programs that served 539 families. Eight of the programs reached 100% in FY 2015-16.
11. Reduction of Prenatal Smoking
The rate of prenatal smoking was reduced from 14.0% in the last year to 8.0% this year in 14 programs. The results were derived from the trend of 1,636 families that received early childhood services this year.
12. Increase of Full-Term Pregnancy
The percent of full-term pregnancy increased from 86.1% in the last year to 93.1% this year in 17 programs. Seventeen hundred sixty-nine families received services from these program in FY 2015-16.
FIRST 5 KERN ANNUAL REPORT FISCAL YEAR 2015-2016
93
13. Decline of Low-Birth Weight
The rate of low-birth weight decreased from 12.4% in the last year to 7.4% this year in 16 programs that offered services to 909 families in Kern County.
14. Expansion of Breastfeeding Arrangement
The percent of mothers engaging in breastfeeding increased from 66.5% in
the last year to 71.8% this year across 14 programs that served 1,605 families.
Due to economic inflation, population growth, and minimum wage increase, effort on Turning the Curve was expected for First 5 Kern and its service providers to maintain stability of early childhood support in Kern County. While the result aggregation in Tables
37-54 suggested effective service collaboration across multiple programs, each of the 14 indicators were derived from First 5 Kern’s (2015) strategic plan to confirm improvement of specific service outcomes in Child Health (Points 4, 5, 6, 7, 10), Family Functioning
(Points 1, 2, 3, 11, 14) and Child Development (Points 8, 9, 12, 13).
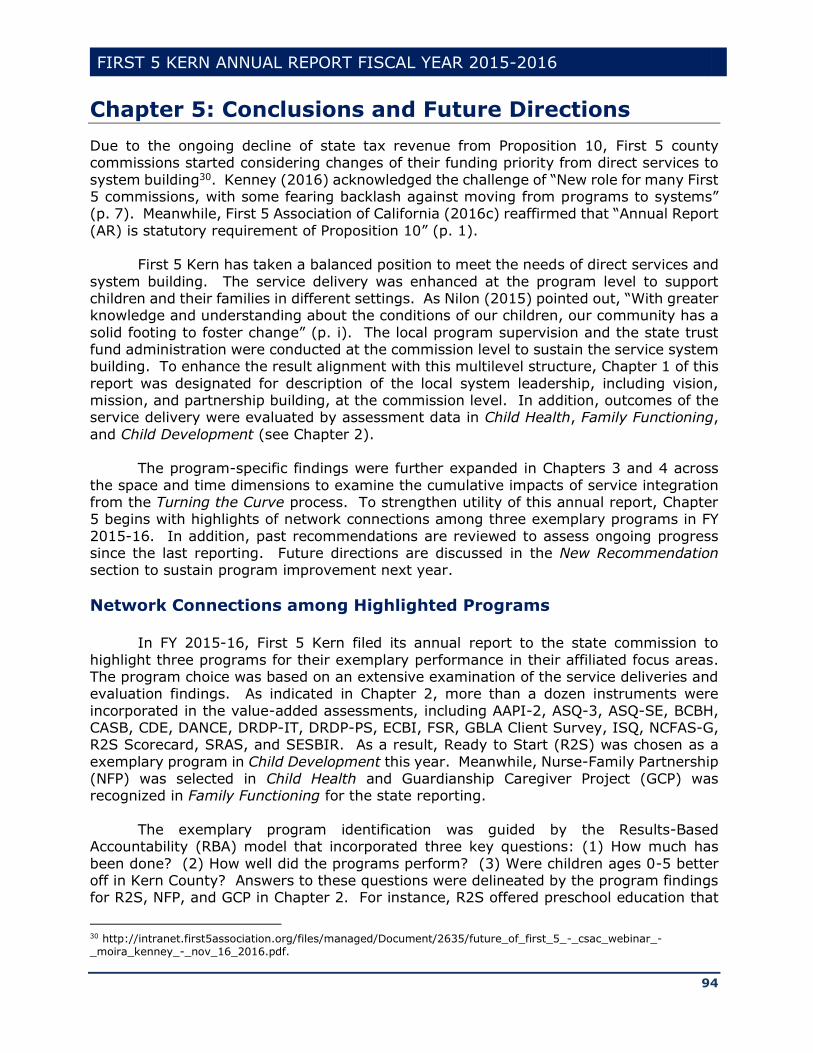
FIRST 5 KERN ANNUAL REPORT FISCAL YEAR 2015-2016
94
Chapter 5: Conclusions and Future Directions
Due to the ongoing decline of state tax revenue from Proposition 10, First 5 county commissions started considering changes of their funding priority from direct services to
system building30. Kenney (2016) acknowledged the challenge of “New role for many First 5 commissions, with some fearing backlash against moving from programs to systems” (p. 7). Meanwhile, First 5 Association of California (2016c) reaffirmed that “Annual Report
(AR) is statutory requirement of Proposition 10” (p. 1).
First 5 Kern has taken a balanced position to meet the needs of direct services and
system building. The service delivery was enhanced at the program level to support children and their families in different settings. As Nilon (2015) pointed out, “With greater knowledge and understanding about the conditions of our children, our community has a
solid footing to foster change” (p. i). The local program supervision and the state trust fund administration were conducted at the commission level to sustain the service system building. To enhance the result alignment with this multilevel structure, Chapter 1 of this
report was designated for description of the local system leadership, including vision, mission, and partnership building, at the commission level. In addition, outcomes of the service delivery were evaluated by assessment data in Child Health, Family Functioning,
and Child Development (see Chapter 2). The program-specific findings were further expanded in Chapters 3 and 4 across
the space and time dimensions to examine the cumulative impacts of service integration from the Turning the Curve process. To strengthen utility of this annual report, Chapter 5 begins with highlights of network connections among three exemplary programs in FY
2015-16. In addition, past recommendations are reviewed to assess ongoing progress since the last reporting. Future directions are discussed in the New Recommendation section to sustain program improvement next year.
Network Connections among Highlighted Programs
In FY 2015-16, First 5 Kern filed its annual report to the state commission to
highlight three programs for their exemplary performance in their affiliated focus areas. The program choice was based on an extensive examination of the service deliveries and evaluation findings. As indicated in Chapter 2, more than a dozen instruments were
incorporated in the value-added assessments, including AAPI-2, ASQ-3, ASQ-SE, BCBH, CASB, CDE, DANCE, DRDP-IT, DRDP-PS, ECBI, FSR, GBLA Client Survey, ISQ, NCFAS-G, R2S Scorecard, SRAS, and SESBIR. As a result, Ready to Start (R2S) was chosen as a
exemplary program in Child Development this year. Meanwhile, Nurse-Family Partnership (NFP) was selected in Child Health and Guardianship Caregiver Project (GCP) was recognized in Family Functioning for the state reporting.
The exemplary program identification was guided by the Results-Based
Accountability (RBA) model that incorporated three key questions: (1) How much has
been done? (2) How well did the programs perform? (3) Were children ages 0-5 better off in Kern County? Answers to these questions were delineated by the program findings for R2S, NFP, and GCP in Chapter 2. For instance, R2S offered preschool education that
30 http://intranet.first5association.org/files/managed/Document/2635/future_of_first_5_-_csac_webinar_-_moira_kenney_-_nov_16_2016.pdf.
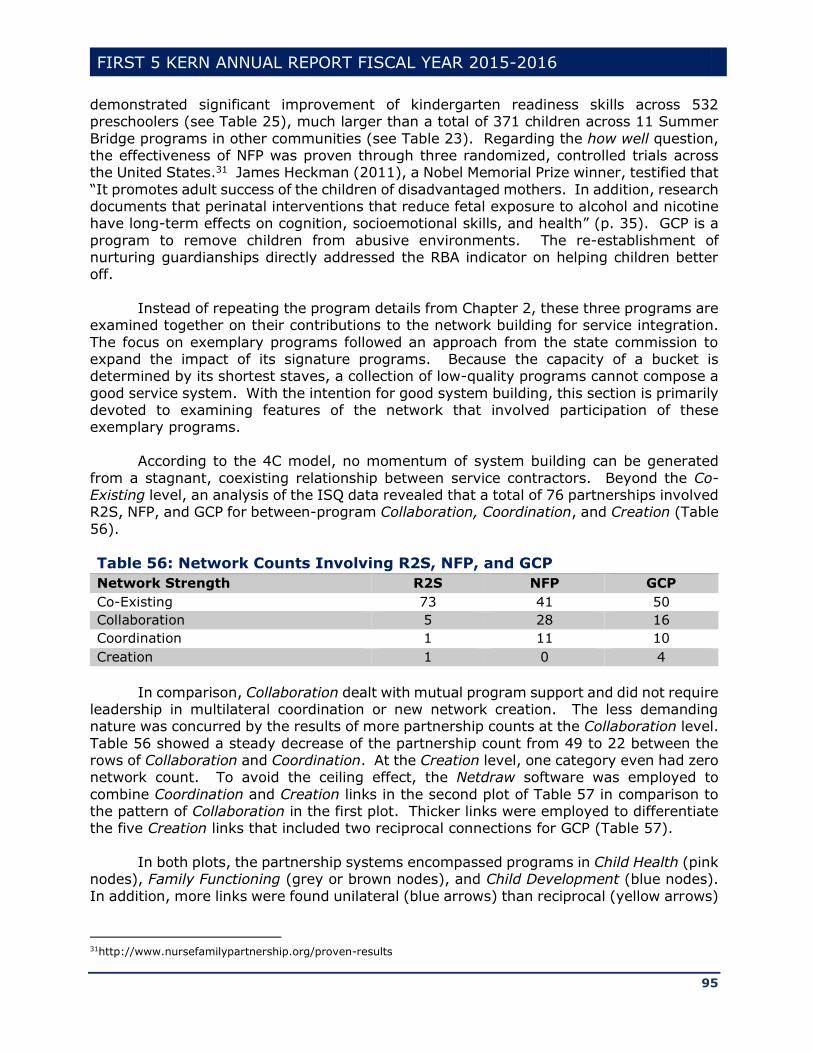
FIRST 5 KERN ANNUAL REPORT FISCAL YEAR 2015-2016
95
demonstrated significant improvement of kindergarten readiness skills across 532 preschoolers (see Table 25), much larger than a total of 371 children across 11 Summer
Bridge programs in other communities (see Table 23). Regarding the how well question, the effectiveness of NFP was proven through three randomized, controlled trials across the United States.31 James Heckman (2011), a Nobel Memorial Prize winner, testified that
“It promotes adult success of the children of disadvantaged mothers. In addition, research documents that perinatal interventions that reduce fetal exposure to alcohol and nicotine have long-term effects on cognition, socioemotional skills, and health” (p. 35). GCP is a
program to remove children from abusive environments. The re-establishment of nurturing guardianships directly addressed the RBA indicator on helping children better off.
Instead of repeating the program details from Chapter 2, these three programs are
examined together on their contributions to the network building for service integration.
The focus on exemplary programs followed an approach from the state commission to expand the impact of its signature programs. Because the capacity of a bucket is determined by its shortest staves, a collection of low-quality programs cannot compose a
good service system. With the intention for good system building, this section is primarily devoted to examining features of the network that involved participation of these exemplary programs.
According to the 4C model, no momentum of system building can be generated
from a stagnant, coexisting relationship between service contractors. Beyond the Co-Existing level, an analysis of the ISQ data revealed that a total of 76 partnerships involved R2S, NFP, and GCP for between-program Collaboration, Coordination, and Creation (Table
56).
Table 56: Network Counts Involving R2S, NFP, and GCP
Network Strength R2S NFP GCP
Co-Existing 73 41 50
Collaboration 5 28 16
Coordination 1 11 10
Creation 1 0 4
In comparison, Collaboration dealt with mutual program support and did not require leadership in multilateral coordination or new network creation. The less demanding nature was concurred by the results of more partnership counts at the Collaboration level.
Table 56 showed a steady decrease of the partnership count from 49 to 22 between the rows of Collaboration and Coordination. At the Creation level, one category even had zero network count. To avoid the ceiling effect, the Netdraw software was employed to
combine Coordination and Creation links in the second plot of Table 57 in comparison to the pattern of Collaboration in the first plot. Thicker links were employed to differentiate the five Creation links that included two reciprocal connections for GCP (Table 57).
In both plots, the partnership systems encompassed programs in Child Health (pink
nodes), Family Functioning (grey or brown nodes), and Child Development (blue nodes).
In addition, more links were found unilateral (blue arrows) than reciprocal (yellow arrows)
31http://www.nursefamilypartnership.org/proven-results
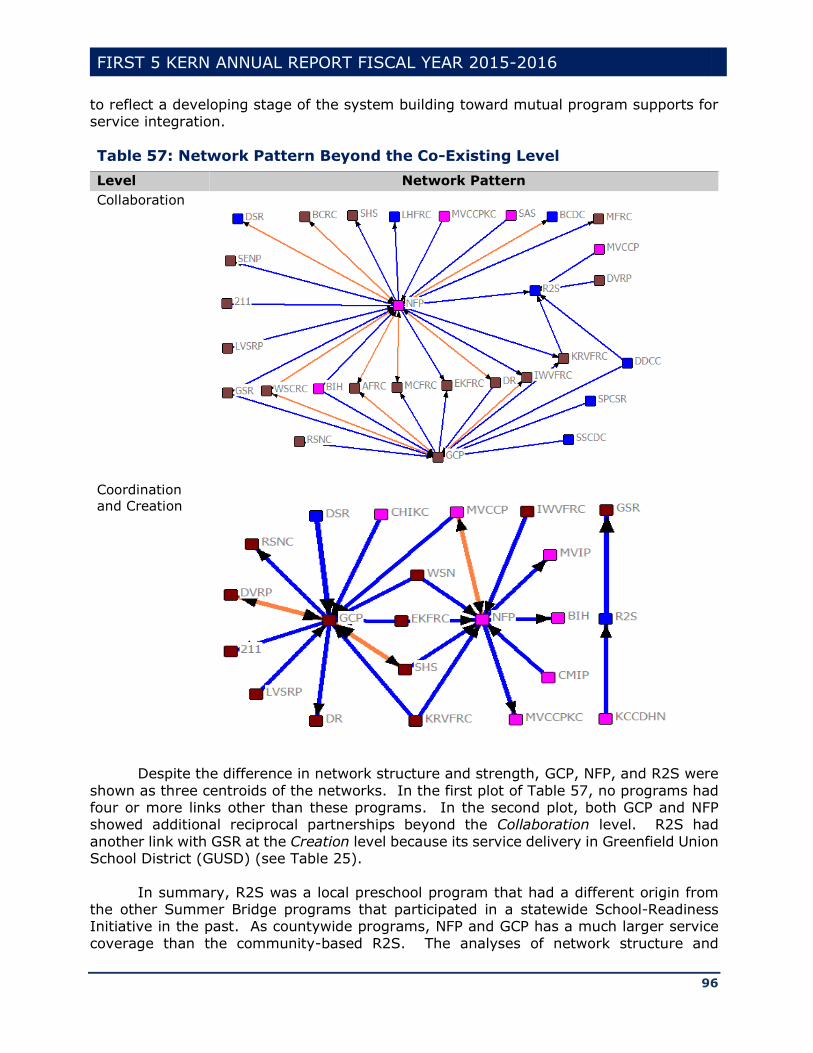
FIRST 5 KERN ANNUAL REPORT FISCAL YEAR 2015-2016
96
to reflect a developing stage of the system building toward mutual program supports for service integration.
Table 57: Network Pattern Beyond the Co-Existing Level
Level Network Pattern
Collaboration
Coordination
and Creation
Despite the difference in network structure and strength, GCP, NFP, and R2S were
shown as three centroids of the networks. In the first plot of Table 57, no programs had four or more links other than these programs. In the second plot, both GCP and NFP showed additional reciprocal partnerships beyond the Collaboration level. R2S had
another link with GSR at the Creation level because its service delivery in Greenfield Union School District (GUSD) (see Table 25).
In summary, R2S was a local preschool program that had a different origin from the other Summer Bridge programs that participated in a statewide School-Readiness Initiative in the past. As countywide programs, NFP and GCP has a much larger service
coverage than the community-based R2S. The analyses of network structure and
FIRST 5 KERN ANNUAL REPORT FISCAL YEAR 2015-2016
97
partnership count indicated additional features of these exemplary programs, i.e., NFP, GCP, and R2S were not only good in their direct service delivery, but also effective in the
system building that connected over two thirds of First 5 Kern-funded programs (Table 57).
Past Recommendations Revisited
Although changes have occurred across the state for First 5 county commissions to “move away from investing in direct services/programs and increasingly invest in systems that support children” (First 5 Association of California, 2016c, p. 1), the principle of local
control remains in the statute of Proposition 10 and First 5 Kern is still responsible for supporting children ages 0-5 and their families in Kern County. To address the local needs, three recommendations were made in the last annual report for First 5 Kern to:
1. Organize a contractor gathering to display service capacity of First Kern-funded
programs;
2. Expand the opportunity of data comparison between First 5 Kern and other county
commissions to reduce service barriers for children ages 0-5 and their families;
3. Conduct a Cost-Benefit Analysis project to demonstrate the public savings from the
services of First 5 Kern and its funded programs.
These recommendations were derived from both internal and external perspectives.
Internally, the capacity display through contractor gathering is beneficial for local
stakeholders to understand the existing resources that are available in each community, as well as additional supports that might be needed from the system building. In addition, since the impact of revenue decline affected all First 5 county commissions, First 5 Kern
may have an external comparison of the program data with other county commissions to reduce service barriers in the local system building. As the state statute requires county commissions to “show where Prop 10 money is going” (First 5 Association of California,
2016c, p. 1), enhancement of the system building can be informed by a cost-benefit analysis (CBA) of the state investment across 41 programs.
In FY 2015-16, First 5 Kern has developed a specific agenda for a contractor gathering in October 2016 to support information exchange and program networking. The First 5 Kern’s annual report to the state included a summary of the experiences from the
contract gathering in the past. Prior to 2010, the gathering was organized in a conference format. Besides presentations on various topics, programs participated in networking
activities. In 2010, the first “free flowing” gathering was organized with an open invitation for the public to attend. Program information was provided on display boards to enhance the mutual service awareness. The last contractor gathering was held in FY 2012-13 to
feature strategic planning on service integration. Based on the progress in supporting the contract gathering, First 5 Kern has met the first recommendation from the 2014-15 annual report.
In FY 2015-16, evaluation staff of First 5 Kern participated in the Persimmony
meetings. First 5 Kern utilized the opportunities to provide county updates, discuss
evaluation issues, compare system building approaches, and share new experiences of common interest with other county commissions. In addition, the Executive Director

FIRST 5 KERN ANNUAL REPORT FISCAL YEAR 2015-2016
98
supported Intranet access by the First 5 Kern commissioners and staff to stay informed about service obstacles, report designs, and budget uncertainties across the state. Hence,
the second recommendation was met by First 5 Kern through the statewide information gathering and analyses.
In June, 2016, First 5 Kern approved a cost-benefit analysis (CBA) project. Innovative approaches have been taken to strengthen credibility of the CBA findings on three key aspects: (1) Content Validity, (2) Criterion Validity, and (3) Construct Validity.
Evidence for supporting content validity will be based on the judgment of experts, including professionals from the University of Virginia, University of California, Los Angeles, and California State University, Bakersfield. For NFP and other programs that
were extensively studied across the nation, criteria will be derived from the literature review to support triangulation of the local CBA findings. In line with the spirit of local control from Proposition 10, special consideration will be given to the unique situation in
Kern County, such as the impact of local fund leverage and the extra cost of service delivery in the third largest county of California by land area. The construct analysis is designed to enrich the value-added assessment on the benefit of local program support.
Therefore, the third recommendation has been adopted by First 5 Kern to reduce cost and increase benefit in the system building.
In summary, all three recommendations were adduced to support the early childhood services in Kern County. The first two recommendations were designed to
strengthen the local community engagement and the statewide commission collaboration. The third recommendation was to support First 5 Kern’s effort to articulate the expenditure and service data for program improvement. The effort fits a statutory demand from
Proposition 10, i.e., “county commissions are required to report annual expenditure and service data on their programs to First 5 California” (First 5 California, 2013, p. 33).
New Recommendations
In California, the state tax per pack of cigarettes was divided into four categories:
(1) 10 cents for State General Funds, (2) 25 cents for Proposition 99, (3) Two cents for Breast Cancer Fund since 1993, and (4) 50 cents for Proposition 10. In history, the tax collection for Category (1) started in 1959. Categories (2), (3), and (4) were established
in 1988, 1993, and 1998 for Proposition 99, Breast Cancer Fund, and Proposition 10, respectively. No change to the 87-cents-per-pack tax over the past 17 years until the passage of Proposition 56 in November 2016. It becomes unclear whether the additional
$2-per-pack tax from Proposition 56 can generate enough backfill revenue to sustain the state investment in the past four categories that included Proposition 10.
Besides the impact of anti-tobacco campaigns since the late 1950s, another recent
change was driven by a sharp increase of e-cigarette use (Figure 42). E-cigarettes users
usually inhaled nicotine from devices that heated a liquid into an aerosol. As a tobacco product, e-cigarettes might have caused reduction in the regular cigarette consumption. Although authority was granted by Proposition 10 to tax cigarettes and other tobacco
products, no mechanism has been introduced in California to generate revenue from e-cigarettes until the passage of Proposition 56. In 2016, the Legislative Analyst’s Office (LAO) made an estimation that “e-cigarette taxation could generate revenue ranging from
the $10-$40M for Prop 10 in 2017-2018” (First 5 Association of California, 2016d, p. 7).
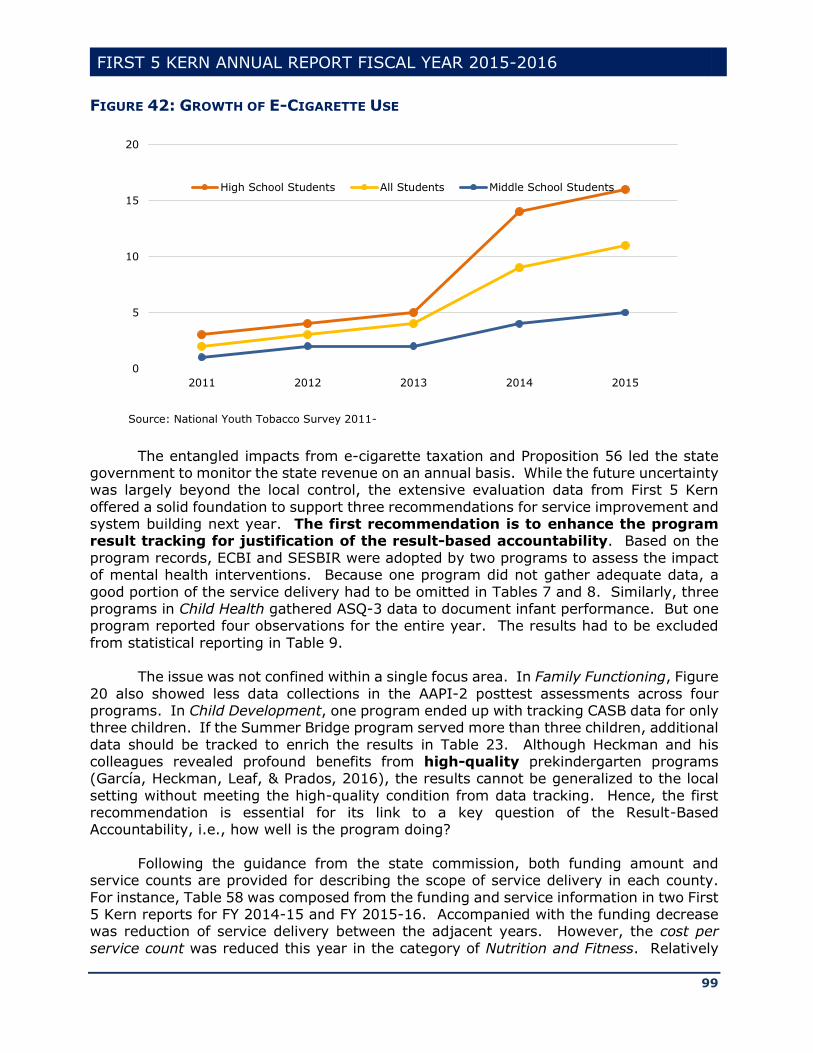
FIRST 5 KERN ANNUAL REPORT FISCAL YEAR 2015-2016
99
FIGURE 42: GROWTH OF E-CIGARETTE USE
The entangled impacts from e-cigarette taxation and Proposition 56 led the state government to monitor the state revenue on an annual basis. While the future uncertainty was largely beyond the local control, the extensive evaluation data from First 5 Kern
offered a solid foundation to support three recommendations for service improvement and system building next year. The first recommendation is to enhance the program result tracking for justification of the result-based accountability. Based on the
program records, ECBI and SESBIR were adopted by two programs to assess the impact of mental health interventions. Because one program did not gather adequate data, a
good portion of the service delivery had to be omitted in Tables 7 and 8. Similarly, three programs in Child Health gathered ASQ-3 data to document infant performance. But one program reported four observations for the entire year. The results had to be excluded
from statistical reporting in Table 9.
The issue was not confined within a single focus area. In Family Functioning, Figure
20 also showed less data collections in the AAPI-2 posttest assessments across four programs. In Child Development, one program ended up with tracking CASB data for only three children. If the Summer Bridge program served more than three children, additional
data should be tracked to enrich the results in Table 23. Although Heckman and his colleagues revealed profound benefits from high-quality prekindergarten programs (García, Heckman, Leaf, & Prados, 2016), the results cannot be generalized to the local
setting without meeting the high-quality condition from data tracking. Hence, the first recommendation is essential for its link to a key question of the Result-Based Accountability, i.e., how well is the program doing?
Following the guidance from the state commission, both funding amount and service counts are provided for describing the scope of service delivery in each county.
For instance, Table 58 was composed from the funding and service information in two First 5 Kern reports for FY 2014-15 and FY 2015-16. Accompanied with the funding decrease was reduction of service delivery between the adjacent years. However, the cost per
service count was reduced this year in the category of Nutrition and Fitness. Relatively
0
5
10
15
20
2011 2012 2013 2014 2015
High School Students All Students Middle School Students
Source: National Youth Tobacco Survey 2011-

FIRST 5 KERN ANNUAL REPORT FISCAL YEAR 2015-2016
100
speaking, this result indicated that these programs delivered more services with less state funding. To support the local system building, the second recommendation is to
monitor the per-service cost for each contractor to justify less service delivery during budget reduction. This approach also supports the turning the curve process to identify effective programs that improve their service outreach beyond the baseline
expectation from the past.
Table 58: Funding and Service Counts in Adjacent Years
Report Categories
FY 2014-15 FY 2015-16
Funding Count Funding Count
Nutrition and Fitness $ 125,982 271 $ 105,000 251
Oral Health $1,307,211 10,514 $1,090,000 8,512
General Parenting
Education and Family Support Programs
$3,011,450 21,376 $1,959,018 12,184
Kindergarten Transition
Services
$1,141,637 6,691 $ 930,620 2,135
As an outcome measure, Result Indicators (RI) were specified in First 5 Kern’s
(2015a) strategic plan to evaluate the wellbeing of children ages 0-5 and their families.
An examination of the Persimmony data showed missing information on nine RIs of the strategic plan (Table 59). Therefore, the third recommendation is to ensure a comprehensive coverage of all result indicators during the local data gathering.
If needed, revision of First 5 Kern strategic plan may occur annually to facilitate the result indicator adjustment. This recommendation is derived from the third component of the Result-Based Accountability to indicate whether children ages 0-5 and their families were
better off due to First 5 Kern support.
Table 59: Result Indicators in Need of Data Gathering
Result
Indicator
Label
1.1.7 Number of families referred to a local enrollment agency for health insurance
application assistance.
1.3.12 Number of children who received asthma/respiratory services.
1.3.13 Number of children who accessed a pediatric dentist.
1.5.1 Number of children who received nutrition and/or fitness education.
2.1.2 Number of children who received individual therapy.
2.1.3 Number of children who received family therapy.
3.2.2 Number of special needs children who participated in educational home-
based activities.
4.4.2 Number of parents/guardians who attended educational events on early
childhood topics.
4.4.3 Number of providers who attended Commission-led trainings or workshops.
FIRST 5 KERN ANNUAL REPORT FISCAL YEAR 2015-2016
101
References
Alkon, A., To, K., Mackie, J., Wolff, M., & Bernzweig, J. (2010). Health and safety needs in early care and education programs: What do Directors, Child Health Records, and National Standards tell us? Public Health Nursing, 27(1), 3–16.
Airasian, P., & Krathwohl, D. (2000). A taxonomy for learning, teaching, and assessing: A revision of Bloom's taxonomy of educational objectives. Boston, MA: Allyn and Bacon.
Akoglu, L., de Melo, P., & Faloutsos, C. (2012). Quantifying reciprocity in large weighted communication networks. Retrieved from http://www3.cs.stonybrook.edu/~leman/pubs/12-pakdd-reciprocity.pdf
Allen, M. (2004). Assessing academic programs in higher education. Bolton, MA: Anker. American Academy of Pediatrics (2011). SIDS and other sleep-related infant deaths:
Expansion of recommendations for a safe infant sleeping environment. Pediatrics, 128 (5), 1030-1039.
American Institutes for Research (2012). Condition of children birth to age five and
status of early childhood services in California: Synthesis of recent research. Washington, DC: Author. Retrieved from http://www.cde.ca.gov/sp/cd/ce/documents/airmetanalysis.pdf.
American Psychological Association (2009). Effective strategies to support positive parenting in community health centers: Report of the working group on child maltreatment prevention in community health centers. Washington, DC: Author.
American Psychological Association (2001). Publication manual of the American Psychological Association (5th ed.). Washington, DC: Author.
Anderson, J.W., Johnstone, B. M., & Remley, D. T. (1999). Breastfeeding and cognitive
development: A meta-analysis. American Journal of Clinical Nutrition, 70, 525–535.
Angelo, T. (1999, May). Doing assessment as if learning matters most. American
Association for Higher Education Bulletin, pp. 1-2. Antonucci, T. C. and Israel, B. A. (1986). Veridicality of social support: A comparison of
principal and network members’ responses. Journal of Consulting and Clinical
Psychology, 54, 432–437. Association of Maternal & Child Health Programs (2015). Kern County (CA) Medically
Vulnerable Care Coordination Project. Washington, DC: Author.
Atherton, J. S. (2013). Learning and teaching: SOLO taxonomy. Retrieved from http://www.learningandteaching.info/learning/solo.htm.
Bartolotta, T., & Shulman, B. (2016). Child development. Retrieved from
http://samples.jbpub.com/9780763747237/47238_CH02_Shulman.pdf. Bavolek, S. (2000). Nurturing Parenting Programs (NCJ 172848). Rockville, MD: NCJRS
Photocopy Services.
Bergal, J. (2015). Should the smoking age be 21? Some legislators say yes. Retrieved from http://www.pewtrusts.org/en/research-and-analysis/blogs/stateline/2015/10/14/should-the-smoking-age-be-21-some-
legislators-say-yes. Biggs, J., & Collis, K. (1982). Evaluating the quality of learning: The SOLO taxonomy.
New York: Academic Press.
Bocanegra, R. (2014). Assembly concurrent resolution No. 155. Retrieved from http://leginfo.legislature.ca.gov/faces/billNavClient.xhtml?bill_id=201320140ACR155.
FIRST 5 KERN ANNUAL REPORT FISCAL YEAR 2015-2016
102
Bowman, S., Pratt, C., Rennekamp, D., & Sektnan, M. (2010). Should we invest in parenting education? Retrieved from
http://www.oregoncf.org/Templates/media/files/grants/Early%20Childhood/should_we_invest_ped.pdf.
Bragg, H. (2003). Child protection in families experiencing domestic violence. Retrieved
from https://www.childwelfare.gov/pubpdfs/domesticviolence.pdf. Brown Armstrong Accountancy (2015). Kern County Children and Families Commission:
Financial statements with independent auditor’s report. Bakersfield, CA: Author.
Bruner, C. (2009). Connecting child health and school readiness. Retrieved from http://www.buildinitiative.org/files/IssueBrief_Bruner_Feb09_Final.pdf.
California Assembly Committee on Budget (2011). California Children and Families Act
of 1998: Use of funds. Retrieved from http://www.leginfo.ca.gov/pub/11-12/bill/asm/ab_0051-0100/ab_99_bill_20110317_enrolled.html.
California Department of Education (2015). DRDP (2015) for use with infants and
toddlers. Sacramento, CA: Author. California Evidence-Based Clearinghouse for Child Welfare (2014). Information and
resources for child welfare professionals. Retrieved from
http://www.first5sacramento.net/Meetings/Documents/HVC/NurturingParentingProgramCEBCRating_201404281314.pdf.
Carmichael, H., & MacLeod, W. (1997). Gift giving and the evolution of cooperation
(Boston College Working Papers in Economics). Retrieved from http://ideas.repec.org/p/boc/bocoec/338.html.
Cepeda, E. (2015). Make preschool available to our neediest children. Retrieved from http://lubbockonline.com/editorial-columnists/2015-11-27/cepeda-make-preschool-available-our-neediest-children#.VmDIuL_T-XA.
Cesar, C., & Hidalgo, A. (2008). The dynamics of a mobile phone network. Physical A: Statistical Mechanics and its Applications, 387(12), 3017–3024.
Chen, J. (2012). Early childhood health and inequalities in children's academic and
behavioral outcomes. Chicago, IL: The University of Chicago (UMI Dissertations Publishing, ProQuest No. 3499715).
Cherry, K. (2013). The five levels of Maslow's hierarchy of needs. Retrieved from
http://psychology.about.com/od/theoriesofpersonality/a/hierarchyneeds.htm. Child Care Inc. (2012). Finding a child care professional to work in your home. NY:
Author (ERIC Reproduction Service No. ED532629).
Cohen, J. (1988). Statistical power analysis for the behavioral sciences (2nd ed.). Hillsdale, NJ: Lawrence Erlbaum Associates.
Coleman-Jensen, A., Rabbot, M., Gregory, C., & Singh, A. (2015). Food security in the
United States in 2014, Statistical Supplement. Table S-3. USDA ERS. Cross, J., Dickman, E., Newman-Gonchar R., & Fagen, J. M. (2009). Using mixed
method design and network analysis to measure development of interagency
collaboration. American Journal of Evaluation, 30(3), 310–329. Duke, N. N., Pettingell, S. L., McMorris, B. J., & Borowsky, I. W. (2010). Adolescent
violence perpetration: Associations with multiple types of adverse childhood
experiences. Pediatrics, 124(4), e778-e786. Family Development Resources (2015). Nurturing Parenting programs and over 30
years of evidence. Retrieved from
http://nurturingparenting.com/nppsevidence.html. First 5 Association of California (2009). Healthy children ready for school. Sacramento,
CA: Author.
FIRST 5 KERN ANNUAL REPORT FISCAL YEAR 2015-2016
103
First 5 Association of California (2013). FIRST 5 annual report glossary definitions. Retrieved from http://first5association.org/wp-content/uploads/2013/08/AR-
Glossary-Definitions-080913.pdf. First 5 Association of California (2015). Overview of Proposition 10. Retrieved from
http://first5association.org/overview-of-proposition-10/.
First 5 Association of California (2016a). Kern County (Central). Retrieved from http://first5association.org/county-commissions/kern-county/
First 5 Association of California (2016b). Fresno County (Central). Retrieved from
http://first5association.org/county-commissions/fresno-county/ First 5 Association of California (2016c). Annual report redesign workday (5.17.16).
Retrieved from
http://intranet.first5association.org/files/managed/Document/1890/5.17.16%20Meeting%20Notes%20-%20Annual%20Report%20Redesign%20Workday.pdf.
First 5 Association of California (2016d). Understanding recent tobacco proposals
webinar. Retrieved from http://intranet.first5association.org/documents/view/1911.
First 5 California (2005). Statewide evaluation framework. Sacramento, CA: Author.
First 5 California (2010). Guidelines for implementing the California Children and Families Act. Sacramento, CA: Author. First 5 California (2013). First 5 California 2011-2012 annual report. Sacramento, CA:
Author. First 5 California (2014a). First 5 California strategic plan. Sacramento, CA: Author.
Retrieved from https://www.ccfc.ca.gov/about/pdf/commission/resources/F5CA_Strategic_Plan.pdf.
First 5 California (2014b). Annual report guidelines for Fiscal Years 2013-14 and 2014-15. Retrieved from http://www.ccfc.ca.gov/pdf/commission/meetings/handouts/Commission-
Handouts_2014-04/Item_5_-_Annual_Report_Guidelines.pdf. First 5 California (2015a). 2013-14 annual report. Retrieved from
http://www.ccfc.ca.gov/pdf/annual_report_pdfs/Annual_Report_13-14.pdf.
First 5 California (2015b). First 5 California 2013-2014 annual report. Sacramento, CA: Author.
First 5 California (2015c). 2015 Children’s State Policy Agenda. Retrieved from
http://www.ccfc.ca.gov/pdf/about/leg/2015%20Children's%20State%20Policy%20Agenda.pdf.
First 5 Fresno (2013). State Annual Report: Fiscal Year 2012-2013. Retrieved from
http://first5fresno.org/wp-content/uploads/2014/05/FY-2012-2013-State-Annual-Report.pdf.
First 5 Kern (2014a). 50 years of warnings. Retrieved from http://first5kern.org/wp-
content/uploads/sites/21/2015/02/Handprints-Fall-Winter-2014.pdf. First 5 Kern (2014b). Best and promising practices in Early Childcare & Education: First
5 Kern position statements. Retrieved from http://first5kern.org/wp-
content/uploads/sites/21/2014/10/12CUGEarlyChildcareandEducat.pdf. First 5 Kern (2015a). First 5 Kern strategic plan. Retrieved from
http://first5kern.org/wp-content/uploads/sites/21/2014/12/StratPlan201415.pdf.
First 5 Kern (2015b). First 5 Kern strategic plan 2015-20 revised. Retrieved from http://first5kern.org/wp-content/uploads/sites/21/2014/12/strategicplanbooklet201520we.pdf.
FIRST 5 KERN ANNUAL REPORT FISCAL YEAR 2015-2016
104
Friedman, M. (2011). Turning the curve. Retrieved from http://www.fiscalpolicystudies.com/PDF%20files/Outcomes%20UK%20TurningTh
eCurveNewsletter1%5B2%5D.pdf. Friedman, M. (2009). Results-Based Accountability producing measurable
improvements for customers and communities. Retrieved from
http://www.oecd.org/site/progresskorea/44120813.pdf. Gallo, D. (1989). Educating for empathy, reason, and imagination. Journal of Creative
Behavior, 23, 98-115.
García, J., Heckman, J., Leaf, D., & Prados, M. (2016). The life-cycle benefits of an influential early childhood program. Retrieved from http://heckmanequation.org/content/resource/lifecycle-benefits-influential-early-
childhood-program. Garlaschelli, D., & Loffredo, M. (2004). Patterns of link reciprocity in directed networks.
Retrieved from http://arxiv.org/pdf/cond-mat/0404521.pdf.
Gearhart, R. (2016). A note on Kern County healthcare. Kern Economic Journal, 18, 13.
Gearhart, R., & Michieka, N. (2016). Economy at a glance! Kern Economic Journal, 18,
4-5. Gillieatt, S., Fernandes, C., Fielding, A., Hendrick, A., Martin, R., & Matthews, S. (2015).
Social network analysis and social work inquiry. Australian Social Work, 68(3),
338-351. Golich, L. (2013). Welcome. Retrieved from http://kerncares.org/wp-files/kerncares-
org/2013/04/2013ReportCard_pv.pdf. Governor’s Budget Office (2016). Demographic information. Retrieved from
http://www.ebudget.ca.gov/2016-
17/pdf/BudgetSummary/DemographicInformation.pdf. Hamilton, P., Keough, K., Ratnatunga, M., & Wong, P. (2015). An economic road map
for Kern County. Retrieved from
https://www.co.kern.ca.us/econdev/pdf/economic-road-map.pdf. Health Resources and Services Administration. (2013). Report of the Secretary’s
Advisory Committee on Infant Mortality: Recommendations for Department of
Health and Human Services action and framework for a national strategy. Retrieved from: http://www.hrsa.gov/advisorycommittees/mchbadvisory/InfantMortality/Correspo
ndence/recommendationsjan2013.pdf Health Resources and Services Administration (2014). Early Childhood Comprehensive
Systems. Retrieved from
http://mchb.hrsa.gov/programs/earlychildhood/comprehensivesystems/. Heckman, J. (2011). The economics of inequality: The value of early childhood
education. American Educator, 35, 31-47.
Heckman, J. (2014). A reanalysis of the Nurse Family Partnership Program: The Memphis randomized control trial. Chicago, IL: The University of Chicago.
Inkelas, M., Halfon, N., Uyeda, K., & Stevens, G. (2003). The health of young children
in California: Findings from the 2001 California Health Interview. Los Angeles, CA: UCLA Center for Health Policy Research Survey.
KCNC [Kern County Network for Children] (2016). 2016 report card. Retrieved from
http://kerncares.org/wp-content/uploads/sites/22/2016/06/2016ReportCard_WEB.pdf.
FIRST 5 KERN ANNUAL REPORT FISCAL YEAR 2015-2016
105
Kenney, M. (2016, December). Advocacy and system building. Presentation made at the National League of Cities and the Center for the Study of Social Policy’s Early
Childhood-LINC All Sites meeting in Washington, D.C. Kirk, R., & Martens, P. (2014). Family assessment, family functioning, and caregiver
engagement in family preservation and reunification programs, and the relation of
these and other factors to reunification service outcomes. Buhl, ID: National Family Preservation Network.
Kirkham, C., Harris, S., & Grzybowski, S. (2005). Evidence-based prenatal care:
General prenatal care and counseling issues. American Family Physician, 71, 1307-1316.
Kogut, B. (2000). The network as knowledge: Generative rules and the emergence of
structure. Strategic Management Journal, 21, 405-25. Krebs, V. (2011). Social network analysis: A brief introduction. Retrieved from
http://www.orgnet.com/sna.html.
Kuhnt, M., & Brust, O. (2014). Low reciprocity rates in acquaintance networks of young adults – Fact or artifact? Retrieved from https://tu-dresden.de/die_tu_dresden/fakultaeten/philosophische_fakultaet/is/methoden/pr
of/mitarbeit/dateien_kuhnt/reciprocity. LaVoice, O. (2016). Kern County program designed to provide one-on-one mentorship
with a nurse for new moms. Retrieved on March 4, 2016 from
http://www.kerngoldenempire.com/news/kern-county-program-designed-to-provide-one-on-one-mentorship-with-a-nurse-for-new-moms
Lee, A. (2013). Results-based public policy in action. Washington, DC: Center for the Study of Social Policy.
Liu, C. (2014). Senate Bill 1123. Retrieved from http://www.leginfo.ca.gov/pub/13-
14/bill/sen/sb_1101-1150/sb_1123_bill_20140219_introduced.pdf. Lopez, C. (2015). First 5 of Kern helping one non-profit keep local smiles bright and
healthy. Retrieved from http://www.kerngoldenempire.com/news/first-5-of-kern-
helping-one-non-profit-keep-local-smiles-bright-and-healthy. MacDorman, M. F. (2014). International comparisons of infant mortality and related
factors: United States and Europe. Centers for Disease Control and Prevention,
National Vital Statistics Reports. Retrieved from: http://www.cdc.gov/nchs/data/nvsr/nvsr63/nvsr63_05.pdf.
Maslow, A. (1954). Motivation and personality. New York, NY: Harper.
Medi-Cal Managed Care Division (2013). Aggregate report for the Medi-Cal Managed Care Program. Retrieved from http://www.dhcs.ca.gov/dataandstats/reports/Documents/MMCD_Qual_Rpts/HED
IS_Reports/CA2013_HEDIS_Aggregate_Report.pdf. National Center for Health Statistics (2016). Life expectancy. Retrieved from
http://www.cdc.gov/nchs/fastats/life-expectancy.htm.
National Coalition for the Homeless (2009). Homeless families with children. Retrieved from http://www.nationalhomeless.org/factsheets/families.html.
Nichols, S., & Jurvansuu, S. (2008). Partnership in integrated early childhood services:
An analysis of policy framings in education and human services. Contemporary Issues in Early Childhood, 9, 117-130.
Nilon, J. (2015). Welcome. In Kern County Network for Children (ed.), 2015 report
card. Retrieved from http://kern.org/kcnc/wp-content/uploads/sites/43/2015/06/2015ReportCard_interactive.pdf.
Piaget, J. (1985). The equilibration of cognitive structures. Chicago: University of
Chicago Press.
FIRST 5 KERN ANNUAL REPORT FISCAL YEAR 2015-2016
106
Pollet, S. (2011). Economic abuse: The unseen side of domestic violence. NYSBA Journal, 83, 40-41.
Ponzio, C., Palomino, Z., Puccini, R., Strufaldi, M., & Franco. M. (2013). Does low birth weight affect the presence of cardiometabolic risk factors in overweight and obese children? European Journal of Pediatrics, 172(12), 1678-1692. (doi:
10.1007/s00431-013-2113-5). Pourat, N., & Nicholson, G. (2009). Unaffordable dental care is linked to frequent school
absences. UCLA Center for Health Policy Research. Retrieved from:
http://healthpolicy.ucla.edu/publications/search/pages/detail.aspx?PubID=92. Price, K. (2016). Kern Medical safe sleeping program received $30,000 donation from
First 5 Kern. Retrieved from http://www.kerngoldenempire.com/news/kern-
medical-safe-sleeping-program-received-30000-donation-from-first-5-kern. Project Safety Net of Palo Alto (2011). Levels of collaboration scale. Retrieved from
http://www.psnpaloalto.com/wp/wp-content/uploads/2011/04/PSN_Levels-of-
Collaboration-Scale_survey.pdf. Proposition 10. Retrieved from http://wwwstatic.kern.org/gems/first5kern/ccfcact.pdf. Provan, K., Veazie, M., Staten, L., & Teufel-Shone, N. (2005). The use of network
analysis to strengthen community partnerships. Public Administration Review, 65, 603-613.
Ramanadhan, S., Salhi, C., Achille, E., Baril, N., D'Entremont, K., Grullon, M., Judge, C.,
Oppenheimer, S., Reeves, C., Savage, C., & Viswanath, K. (2012). Addressing cancer disparities via community network mobilization and intersectoral
partnerships: A social network analysis. PLoS ONE, 7, 1-9. Ready to Start (2012). Retrieved from
http://wwwstatic.kern.org/gems/first5kern/First5NewsletterSummerweb.pdf.
Rintoul, B., Thorne, J., Wallace, I., Mobley, M., Goldman-Fraser, J., & Luckey, H. (1998). Personal characteristics and parental behavior. Retrieved from http://www.rti.org/sites/default/files/resources/child-development.pdf.
Robison-Frankhouser, Z. (2003). An evaluation of parent education programs: Early brain development information that promotes literacy development in pre-school children. Long Beach, CA: CSU Long Beach (UMI No. 1419315).
Ross, J. (2011). Latino health paradox: Latinos boast low infant mortality, long lives despite risk factors. Retrieved from http://www.huffingtonpost.com/2011/08/11/latino-health-a-
mystery_n_924820.html Ruef, M. (2002). Strong ties, weak ties and islands: Structural and cultural predictors of
organizational innovation. Industrial and Corporate Change, 11, 427-429.
Samuelson, A. (2010). Best practices for parent education and support programs: What works. Retrieved from http://whatworks.uwex.edu/attachment/whatworks_10.pdf.
Sanders, S., & Sorrells, N. (2016). Children’s health and housing. Retrieved from http://www.naceda.org/assets/The-Connections-Between-Childrens-Health-and-Housing.pdf.
Schramm, R. (2015). Nurturing Parenting program for parents and their infants, toddlers, and preschoolers. Retrieved from http://www.cebc4cw.org/program/nurturing-parenting-program-for-parents-and-
their-infants-toddlers-and-preschoolers/detailed. Schroeder, M., & Stefanich, G. (2001). Addressing educational, employment, and
transportation issues (Chapter 4). Retrieved from
http://www.uni.edu/stefanic/STIC_Theory-Found.pdf#page=67.
FIRST 5 KERN ANNUAL REPORT FISCAL YEAR 2015-2016
107
Schumacher, K. (2016). Over 1.2 million California children eligible for subsidized child care did not receive services from state programs in 2015. Retrieved from
http://calbudgetcenter.org/wp-content/uploads/Fact-Sheet_Unmet-Need-for-Subsidized-Child-Care_12.15.16.pdf.
Secretary of State's office (2016). Text of proposed laws. Retrieved from
http://vig.cdn.sos.ca.gov/2016/general/en/pdf/text-proposed-laws.pdf. Shulman, N. (1976). Network analysis: A new addition to an old bag of tricks. Acta
Sociologica, 19, 307–323.
Singhal, A., Subbian, K., Srivastava, J., Kolda, T., & Pinar, A. (2013). Dynamics of trust reciprocation in heterogeneous MMOG networks. Retrieved from http://arxiv.org/pdf/1303.6385.pdf.
Smith, K., Soman, L., Duenas, J., Carro, N., Burke, N., Robinson, T., & Inkelas, M. (2009). California’s service system for children and youth with special health care needs. Palo Alto, CA: Lucile Packard Foundation.
Smith, T., Gorden, B., Colby, S., & Wang, J. (2005). An examination of the relationship between depth of student learning and National Board certification status. Boone, NC: Appalachian State University.
Squartini, T., Picciolo, F., Ruzzenenti, F., & Garlaschelli, D. (2013). Reciprocity of weighted networks. Retrieved from http://arxiv.org/pdf/1208.4208.pdf.
Thompson, L., & Uyeda, K. (2004). Family support: Fostering leadership and
partnership to improve access and quality. Retrieved from http://www.healthychild.ucla.edu/Publications/Documents/Family%20Support%2
0Report%20for%20publication.pdf. United Nations Children's Fund (2011). The importance of ages 0-3 years. Retrieved
from http://www.unicef.org/sowc01/1-2.htm.
U.S. Census Bureau (2016a). American factfinder (Form S0901). Retrieved from http://factfinder.census.gov.
U.S. Census Bureau (2016b). American factfinder (Form B01003). Retrieved from
http://factfinder.census.gov. U.S. Department of Health and Human Services. (2014). The health consequences of
smoking: 50 years of progress. Atlanta, GA: U.S. Department of Health and
Human Services, Centers for Disease Control and Prevention, National Center for Chronic Disease Prevention and Health Promotion, Office on Smoking and Health.
Waller, M. (2005). High cost or high opportunity cost? Transportation and family
economic success. Washington, DC: Brookings Institute. Wamaniala, J. (2007). Infant mortality in Latinos. Retrieved from
https://www.asu.edu/courses/css335/jwintro.htm.
Wang, J. (2016). First 5 Kern Annual Report: Fiscal Year 2014-2015. Retrieved from http://files.eric.ed.gov/fulltext/ED564008.pdf.
Wang, J., Ortiz, T., Maier, R., & Navarro, D. (2015, April). A multilevel study of
partnership building to support early childhood development across different education contexts. Paper presented at the 2015 annual meeting of American Educational Research Association, Chicago, IL.
Wang, J., Ortiz, T., Maier, R., Navarro, D., Wang, S., Wang, L., & Wang, L. (2016). An empirical study of early childhood support through partnership building. Evaluation and Program Planning, 59, 74-80.
Wang, J., Ortiz, T., & Scheiner, H. (2013). An examination of partnership building in early childhood education. Paper presented at the 2013 annual meeting of National Association for the Education of Young Children, Washington, DC.
FIRST 5 KERN ANNUAL REPORT FISCAL YEAR 2015-2016
108
Wasson, L., & Goon, J. (2013). Nurse-Family Partnership yields Kern benefits. Kern Business Journal, 2, 28.
Wethington, E., & Johnson-Askew, W. (2009). Contributions of the life course perspective to research on food decision making. Annals of Behavioral Medicine, 38, S74-80.
Wilson, S., & Durbin, C. (2013). Mother-child and father-child dyadic interaction: Parental and child bids and responsiveness to each other during early childhood. Merrill-Palmer Quarterly, 59, 249–279.
Zhu, Y., Zhang, X., Sun, G., Tang, M., Zhou, T., & Zhang, Z. (2014). Influence of reciprocal links in social networks. Retrieved from http://journals.plos.org/plosone/article/file?id=10.1371/journal.pone.0103007&ty
pe=printable.
FIRST 5 KERN ANNUAL REPORT FISCAL YEAR 2015-2016
109
Appendix A – Index of Program Acronyms
A Arvin Family Resource Center (AFRC), 36, 48-51, 65, 72, 76, 78-80, 82-83, 85, 87, 89
B
Bakersfield Adult School Health Literacy Program (HLP), 6-7, 23, 25-26, 30, 32, 54, 57, 59, 83-84, 87
Supporting Parents and Children for School Readiness (SPCSR), 46, 49-51, 64-65, 71, 76-81, 89
Black Infant Health (BIH) Program, 12, 24-26, 29, 48, 57, 59, 63, 82, 84, 86, 89
Blanton Child Development Center (BCDC), 46, 49-50, 54, 59, 82-84, 86, 88-89 Buttonwillow Community Resource Center (BCRC), 36, 48-51, 59, 65, 76-80, 82, 87, 90
C
Children's Health Initiative of Kern County (CHI KC), 24-26, 59, 69, 72 Children's Mobile Immunization Program (CMIP), 24-26, 57, 59, 64, 88
D
Delano School Readiness (DSR), 36, 46, 49-51, 54, 59, 65, 76-80, 82-83, 87-90 Differential Response (DR), 7, 33, 35-36, 43, 45, 59, 71, 82, 84-85, 88, 90
Discovery Depot Child Care Center (DDCCC), 46, 84, 86-87
Domestic Violence Reduction Project (DVRP), 7, 33, 35-36, 44-45, 72 E
East Kern Family Resource Center (EKFRC), 36, 40, 42, 48-50, 59, 65, 77-80, 84, 87, 89
G Greenfield School Readiness (GSR), 36, 48-51, 59, 65, 76, 78, 83-85, 87-90, 96
Guardianship Caregiver Project (GCP), 6-7, 14, 33, 35-36, 44-45, 58-59, 72, 94-97
I Indian Wells Valley Family Resource Center (IWVFRC), 36, 40-42, 49-51, 59, 65, 77-78,
80, 82-83, 86-89

FIRST 5 KERN ANNUAL REPORT FISCAL YEAR 2015-2016
110
K
Kern County Children's Dental Health Network (KCCDHN), 24-28, 32, 57-59, 71
Kern River Valley Family Resource Center – Great Beginnings Program (KRVFRC), 36, 40, 42, 49-50, 59, 65, 71, 76, 78-80, 82-83, 85-90
L Lamont Vineland School Readiness Program (LVSRP), 36, 49, 50, 51, 65, 72, 76, 77, 79,
80, 81, 83, 87, 89 Lost Hills Family Resource Center (LHFRC), 36, 46, 49, 50, 59, 65, 77, 78, 79, 80, 83, 84,
85, 87, 88, 89, 90 M
Make a Splash (MAS), 14, 25, 26, 57, 59, 71
McFarland Family Resource Center (MFRC), 36, 49, 50, 51, 59, 65, 71, 76, 80, 81, 82, 83, 87
Medically Vulnerable Care Coordination Program (MVCCP), 12, 25, 26, 31, 32, 59, 69
Medically Vulnerable Infant Program (MVIP), 12, 25, 26, 29, 30, 48, 59, 85, 86, 88, 89 Mountain Communities Family Resource Center (MCFRC), 36, 49, 50, 51, 59, 71, 77, 78,
83, 85, 86, 89, 90 N
Neighborhood Place Parent Community Learning Center (NPCLC), 36, 40, 41, 42, 46, 49, 50, 59, 82, 83, 84, 86, 87, 88
Nurse Family Partnership Program (NFP), 4, 6, 12, 24, 26, 29, 30, 31, 48, 57, 59, 65, 69, 85, 89, 94, 95, 96, 97, 98
R
Ready to Start (R2S), 6, 46, 52, 53, 57, 59, 60, 94, 95, 96, 97, Richardson Special Needs Collaborative (RSNC), 7, 25, 26, 28, 57, 59, 65, 77, 78, 79, 80,
81, 82, 85, 87, 89 S
Shafter Healthy Start (SHS), 36, 40, 41, 42, 49, 50, 51, 59, 65, 83, 86, 89
FIRST 5 KERN ANNUAL REPORT FISCAL YEAR 2015-2016
111
Small Steps Child Development Center (SSCDC), 46, 54, 59, 72, 82, 83, 85, 87, 88, 89, 90
South Fork Preschool (SFP), 46, 54, 59, 65, 71, 82, 83, 84, 85, 86, 87, 88, 89
Southeast Neighborhood Partnership Family Resource Center (SENP), 36, 40, 41, 42, 49, 50, 59, 65, 76, 77, 78, 79, 80, 81, 85, 86, 87, 89, 90
Special Start for Exceptional Children (SSEC), 25, 26, 28, 29, 54, 59, 65, 87 Successful Application Stipend (SAS), 23, 24, 25, 26, 59, 69, 72
T
The Wind in the Willows Preschool (WWP), 46, 54, 59, 83, 85, 86, 87, 88, 89 W
West Side Community Resource Center (WSCRC), 36, 49, 50, 51, 59, 65, 76, 77, 78, 79, 80, 81, 82, 85, 87, 90
Women's Shelter Network (WSN), 7, 35, 36, 45, 49, 50, 59, 82, 84, 87
2-1-1 Kern County, 33, 34, 59, 63, 68, 70, 71
FIRST 5 KERN ANNUAL REPORT FISCAL YEAR 2015-2016
112
Appendix B – Technical Advisory Committee served in FY 2015-16
Sam Aunai (Commissioner) Dean of Insturction, Porterville College
Tammy Burns Coordinator, Early Childhood Council of Kern - Kern County Superintendent of Schools
Tom Corson Executive Director, Kern County Network for Children
Michelle Curioso Director of Nursing and MCAH, County of Kern Public Health Services
Antoinette Jones-Reed Assistant Director, Child Protective Services, Kern County Department of Human Services
Sandy Koenig Coordinator, West Side Community Resource Center - Taft City School District
Bill Phelps Chief of Programs, Clinica Sierra Vista
Larry J. Rhoades (Commissioner) Retired Kern County Administrator
Rick Robles (Chair and Commissioner) Superintendent, Lamont School District
Al Sandrini Retired School Administrator
Jennifer Sill, LMFT Mental Health Systems Administrator, Kern County Mental Health Department
Meseret Springer, PHN Public Health Nurse, County of Kern Public Health Services
Jennifer Thompson-Solis Maternal Health Unit Supervisor I, Kern County Mental Health
Cindy Wasson Retired Kern County Nurse and Community Advocate
Debbie Wood Coordinator, Supporting Parents & Children for School Readiness - Bakersfield City School
District Jennifer Wood-Slayton South Valley Neighborhood Partnership Coordinator