
Incumbent firms and Response to Disruptive Innovation through
Firms’ innovation objectives and knowledge acquisition strategies
1
PAGE TITLE HERE
Firms’ innovation objectives and knowledge acquisition strategies Stephen Roper, James H Love, Karen Bonner and Ying Zhou ERC Research Paper No.27 November 2014
Firms’ innovation objectives and knowledge acquisition strategies
2
Firms’ innovation objectives and knowledge acquisition strategies
Stephen Roper
Warwick Business School [email protected]
James H Love
Warwick Business School [email protected]
Karen Bonner
Aston University [email protected]
Ying Zhou
University of Birmingham [email protected]
This paper is published by the independent Enterprise Research Centre. The Enterprise Research Centre is a partnership between Warwick Business School, Aston Business School, Imperial College Business School, Strathclyde Business School, Birmingham Business School and De Montfort University. ERC is funded by the Economic and Social Research Council (ESRC); the Department for Business, Innovation & Skills (BIS); the Technology Strategy Board (TSB); and, through the British Bankers Association (BBA), by the Royal Bank of Scotland PLC; Bank of Scotland; HSBC Bank PLC; Barclays Bank PLC and Lloyds TSB Bank PLC. The support of the funders is acknowledged. The views expressed are those of the authors and do not necessarily represent the views of the funders.
Firms’ innovation objectives and knowledge acquisition strategies
3
CONTENTS
ABSTRACT ...................................................................... 4
1. INTRODUCTION ......................................................... 5
2. CONCEPTUAL FRAMEWORK AND HYPOTHESES ... 7
2.1 Firms’ innovation objectives ................................... 7
2.2 Knowledge acquisition for innovation .................... 10
2.3 Innovation strategy and knowledge acquisition ... 13
3. DATA AND METHODS ............................................... 15
4. ESTIMATION RESULTS ............................................. 20
4.1 Whole sample estimates ...................................... 21
3. CONCLUSIONS AND DISCUSSION .......................... 27
REFERENCES ................................................................ 29

Firms’ innovation objectives and knowledge acquisition strategies
4
ABSTRACT
External partnerships play an important role in firms’ acquisition of the
knowledge inputs to innovation. Such partnerships may be interactive –
involving exploration and mutual learning by both parties – or non-
interactive – involving exploitative activity and learning by only one party.
Examples of non-interactive partnerships are copying or imitation. Here, we
consider how firms’ innovation objectives influence their choice of
interactive and/or non-interactive connections. Four empirical results
emerge. First, we find strong and consistent support for complementarity
between non-interactive and interactive connections across firms in all
sectors and sizebands. Second, we find that innovation objectives related
to new products and services are linked only to non-interactive
connections. Third, we find tentative evidence that where firms have
innovation objectives which relate to product or service improvement they
are more likely to establish non-interactive rather than interactive
connections. Fourth, the extent of firms’ interactive and non-interactive
connections are strongly related firms’ human capital endowments. These
latter results suggest interesting second-order innovation effects from
human capital improvements.
Acknowledgements This work has been supported by the Enterprise Research Centre (ERC), grant ES/K006614/1. The ERC is funded by the Economic and Social Research Council, the Department for Business, Innovation & Skills, the Technology Strategy Board and, through the British Bankers Association, by the Royal Bank of Scotland PLC, HSBC Bank PLC, Barclays Bank PLC and Lloyds Bank PLC. The support of the funders is gratefully acknowledged. The views expressed in the paper are those of the authors and do not necessarily represent the views of the funders or the data providers. The statistical data used here is from the Office of National Statistics (ONS) and is Crown copyright and reproduced with the permission of the controller of HMSO and Queens Printer for Scotland. The use of the ONS statistical data in this work does not imply the endorsement of the ONS in relation to the interpretation or analysis of the statistical data. The analysis upon which this paper is based uses research datasets which may not exactly reproduce National Statistics aggregates.
Firms’ innovation objectives and knowledge acquisition strategies
5
1. INTRODUCTION
Innovation partnerships have a long history. James Watt, the steam engine
pioneer, was only able to bring his innovation to market because of
financial and engineering backing from his partner Matthew Boulton, and
specialist expertise in cylinder manufacture from the firm owned by John
Wilkinson. More recent evidence suggests the importance of partnerships
in innovation for stimulating creativity, reducing risk in the innovation
process, accelerating or upgrading the quality of the innovations made, and
signalling the quality of firms’ innovation activities (Powell 1998). Innovation
partnerships may also increase firms’ access to technology developed
elsewhere (Mowery, 1990; Niosi, 1999) and their ability to appropriate the
returns from innovation (Gemser and Wijnberg, 1995). Moreover, having
more extensive networks of partners is likely to increase the probability of
obtaining useful knowledge from outside of the firm (Leiponen and Helfat
2010) and increase the probability that this will be complementary with
aspects of firms’ internal knowledge base (Roper et al. 2008).
In this paper we consider the reasons why firms’ establish external
connections of different types as part of their innovation activity. Firms may
of course decide not to innovate, or to innovate on the basis of proprietary
knowledge developed purely within the firm. While this type of independent
technological development strategy has been linked to the success of
some groups of firms (Simon 1996), it is increasingly uncommon among
innovative smaller firms (van de Vrande et al. 2009). Where a firm does
decide to establish external connections to acquire knowledge for
innovation it has a number of choices relating to the nature of those
connections. Should the firm develop collaborative or interactive
connections with partners to jointly develop new knowledge? Or, should the
firm adopt non-interactive, imitation or copying strategies (Glückler 2013)?
These choices may reflect the fact that interactive and non-interactive
knowledge search strategies may provide different types of knowledge and
provide the basis for different types of innovation. Here, we argue that
interactive knowledge search strategies, involving collaborative or co-
Firms’ innovation objectives and knowledge acquisition strategies
6
operative innovation, may allow exploratory knowledge co-creation leading
to transformational, new-to-the-world innovation. Such interactive
partnering approaches may also have uncertain outcomes but may help
firms to share the risks and costs implicit in innovation. Non-interactive
knowledge search strategies, on the other hand, inevitably involve less
technical and commercial uncertainty - as the market value of the imitated
knowledge is already established. Such activities emphasise the
exploitation of pre-existing knowledge through more incremental
innovation.
But what determines why firms choose either interactive or non-interactive
innovation connections, or both? Some elements of this question have
been discussed elsewhere with a focus on the role of firms’ internal
capabilities and structure in shaping firms’ knowledge acquisition
strategies. Absorptive capacity, for example, typically measured using R&D
and human capital measures, has been shown to play a significant role in
shaping firms’ ability to take advantage of external knowledge (Spithoven,
Clarysse, and Knockaert 2011; Moon 2011). Xia and Roper (2014) also
identify a positive relationship between realised absorptive capacity and the
extent of partnering activity of small bio-technology firms. In a related study,
Freel and Aslesen (2013) consider the role of organisational structure on
firms’ partnering strategies, providing evidence that less hierarchic firms
develop more diverse connections, and that team or project-based working
may be particularly conducive to the development of deep or strong links
between firms. A similar study by (Moon 2011) links the breadth of firms’
(interactive) knowledge search activities to their use of IP protection.
Existing research on the determinants of firms’ knowledge acquisition
strategies has three main limitations which we seek to address here. First,
existing studies focus predominantly on interactive knowledge acquisition
strategies through innovation partnering, paying less attention to the
potential value of non-interactive knowledge sourcing mechanisms such as
imitation or copying. Here, we consider separately the determinants of
interactive and non-interactive knowledge acquisition strategies, which may
Firms’ innovation objectives and knowledge acquisition strategies
7
have very different characteristics and therefore implications for innovation
(Glückler 2013). Secondly, existing studies tend to focus on firm
characteristics such as R&D, skills and organisational structures and their
implications for external knowledge acquisition (Freel and Aslesen 2013;
Spithoven, Clarysse, and Knockaert 2011). Here, following Moon (2011),
we argue that firms’ innovation strategic objectives may also be important
in shaping firms’ knowledge acquisition strategies. Thirdly, we examine size
and sectoral differences, recognising that the rationale for external
knowledge search may differ significantly between larger and smaller
companies and between different sectors (Moon 2011; Vahter, Love, and
Roper 2013). Vahter et al. (2013) argue, for example, that external
knowledge search is of more value for smaller companies due to their
weaker internal knowledge base.
2. CONCEPTUAL FRAMEWORK AND HYPOTHESES
2.1 Firms’ innovation objectives
Discussions of firms’ innovation objectives typically reflect the diversity of
firms’ innovation activities, the relative risks and rewards of each type of
innovation, and the need to balance resources and capabilities across
different activities. Three distinct, although strongly inter-related,
perspectives can be identified within the research literature. First, scholars
in the innovation studies literature have discussed the distinction between
innovation-based and imitation-based strategies (Shenkar 2010; Schnaars
1994; Bolton 1993). Both may involve the introduction of new products or
services to the market, with innovation-based strategies involving new-to-
the-market innovations, while imitations are new products or services,
which are new-to-the-firm but now new-to-the-market. Imitation may, of
course, be of very different types ranging from licensed or unlicensed
(counterfeit) copying of a product or service, through mimic products which
copy some or all of the features of an innovative product or service, to
products which emulate an existing product but may actually be better than
the established market leader (Ulhoi 2012).
Firms’ innovation objectives and knowledge acquisition strategies
8
Innovation-based and imitation-based strategies have very different risks
and rewards. Innovation may create first-mover advantages for the
innovating firm. These may lead to higher returns from a desirable and
unique product or service but may also have other advantages in terms of
helping the first mover to learn rapidly about the markets and build brand
loyalty among customers (Kopel and Loffler 2008)1. For imitators on the
other hand the potential for ‘second mover advantages’ are also evident.
Perhaps the key advantage for imitators is that the market leader has
already taken much of the uncertainty out of the initial product or service
introduction2. On the production side this may mean that the imitator can
copy, emulate or reverse engineer the product design or service delivery of
an innovator. On the demand side, the imitator can learn from the innovator
about consumers’ appetite for a particular product or service and what
consumers are prepared to pay. The imitator’s problem however is not
always simple as they try to establish a position in a market share in which
there is already at least one established player (Ulhoi 2012). Second mover
advantages can certainly occur at a firm level and there is some evidence –
particularly in less dynamic markets – that imitation may be a more
profitable strategy than innovation (Lieberman and Asaba 2006)3.
1 A key issue for innovators in any market place, however, is their ability to sustain their position of market leadership. In some sectors – biotechnology or engineering – this may involve formal strategies such as patenting to protect intellectual property; in other sectors more strategic approaches may be adopted such as frequent changes or upgrades to product or service design. Aggressive pricing also provides a way in which market leaders may protect any first mover advantages (Ulhoi 2012). 2 Imitation may also be a stepping stone towards innovation as firms build innovative capabilities. This process is perhaps clearest in developing economies where firms have steadily developed their R&D and creative competencies. On Korea see (Kim 1997), on Taiwan (Hobday 1995), on China (Lim and Kocaoglu 2011) and on Brazil, (Dorion, Pavoni, and Chalela 2008). 3 Imitation – second-mover - strategies may provide individual firms with a less risky option than innovation. At an industry and social level, however, imitation can have either positive or negative effects. On the positive side imitation may help to maximise the social and consumer benefits of the original innovation by making products or services available to more consumers. Imitation may also have negative effects, however, by reducing the variety of products or services within a market and increasing the collective vulnerability to external competition (Lieberman and Asaba 2006).
Firms’ innovation objectives and knowledge acquisition strategies
9
While discussion of firms’ innovation objectives in the innovation studies
literature has tended to focus on the nature of the innovation itself – i.e. the
innovation versus imitation distinction – discussion in the strategy literature
has adopted a more contingent perspective, integrating the nature of firms’
innovation with their capabilities and market position. Nagji and Tuff (2012),
for example, make a distinction between: core innovation (incremental
changes which optimise existing products for existing customers); adjacent
innovation; and transformational or new-to-the-market innovations. Such
transformational innovation involving the introduction of technologically
innovative products can have a positive effect on business performance
(Xin, Yeung, and Cheng 2010), and also facilitate entry to new export
markets (Ganotakis and Love 2011) and market share (Lee and Kim 2013).
Core innovation, on the other hand, is more to do with delivering increased
value to existing customers through quality improvements, price reductions
or performance improvements (Banbury and Mitchell 1995).
Innovation strategy may also involve process innovations which yield
significant performance gains to the innovating firm (Rasiah, Gopal, and
Sanjivee 2013). Strategies involving the adoption of advanced
management techniques (AMTs), for example, may enable firms to develop
more flexible and adaptive production systems allowing smaller batch sizes
and enabling firms to cope better with perceived environmental uncertainty
(Hofmann and Orr 2005; Zammuto and Oconnor 1992), changes to
regulation etc. More flexible production systems may also allow firms to
adopt more complex innovation strategies with potentially higher returns
(Hewitt-Dundas 2004). Process innovation may also facilitate more radical
innovation strategies as firms seek to create market turbulence by
engaging in disruptive innovation in order to establish a position of market
or technological leadership (Anthony et al. 2008; Hang, Chen, and
Subramian 2010).
Views differ however on the potential for developing strategic recipes for
the optimal balance between core, adjacent and transformational
innovation with (Nagji and Tuff 2012, p. 66) remarking that ‘outperforming

Firms’ innovation objectives and knowledge acquisition strategies
10
firms typically allocate about 70% of their innovation resources to core
offerings, 20% to adjacent efforts and 10% to transformational initiatives’.
On the other hand, Davila et al. (2006), p. 59, remark: ‘There is no menu of
generic innovation strategies from which to choose. Each company’s
management team has to craft its own innovation strategy, adapt to
changing conditions and choose the right time to make key moves … The
innovation strategy must support the business strategy’. Davila et al (2006),
however, do diffferentiate between ‘play-to-win’ strategies which place an
emphasis on adjacent and transformational innovation, and ‘play-not-to-
lose’ strategies which emphasise more incremental, core, innovation4.
A third perspective – grounded in the literature on organisational learning –
makes a distinction between the exploratory and interactive process
involved in the development of more radical innovation and the more
exploitative process underlying incremental innovation, viz: ‘exploitative
innovation strategies primarily build on improvements and refinements of
current skills and processes and lead to incremental product changes …
Exploratory innovation primarily involves the challenging of existing
approaches … Outcomes of exploratory innovation strategies are superior
new products with significant consumer benefits: they can enable the firm
to enter or even create new markets’ (Mueller, Rosenbusch, and Bausch
2013, p. 1607).
2.2 Knowledge acquisition for innovation
We can identify two main strategic mechanisms through which firms may
access, absorb and use external knowledge, and which may influence their
innovation activity5. First, firms may form deliberate, purposive connections
with other firms or organisations as a means of acquiring or accessing new
4 We might also suggest a ‘choose-not-to-play’ strategy in which for whatever reason firms’ decide not to invest in innovation in a given period. Innovation survey data typically suggest a significant minority of firms fall into this category. 5 Firms may also acquire knowledge vicariously and unintentionally through informal spill-over mechanisms such as social contacts between employees and those in other firms, media publicity or demonstration effects, or through the mobility of labour between enterprises. These pure knowledge spill-overs represent un-priced gains to the firm, effectively increasing the social returns to knowledge (Beugelsdijck and Cornet 2001).
Firms’ innovation objectives and knowledge acquisition strategies
11
knowledge. These might be partnerships, network linkages or contractually-
based agreements entered into on either a formal or informal basis. This
type of connection is characterised by strategic intent and mutual
engagement of both parties, and may be characterised as a form of
interactive learning (Glückler 2013). Second, firms might acquire
knowledge deliberately but without the direct engagement of another party.
Examples of this type of mechanism include imitation, reverse engineering
or participation in network or knowledge dissemination events. Here, there
is a clear strategic intent on the part of the focal firm but no mutuality in the
learning process, and this may be characterised as non-interactive
learning. For example, in their analysis of university-business connections
(Hewitt-Dundas and Roper 2011) distinguish between knowledge
connections ‘characterised by a two-way flow of knowledge, e.g. through
formal or informal joint ventures or collaborative R&D projects’, and
knowledge suppliers ‘characterised by a more uni-directional transfer of
knowledge’.
Interactive learning is initiated by firms’ strategic decision to build links and
connections with other firms and economic actors (e.g. research institutes,
universities and government departments) to capitalise on the knowledge
of the linked parties, co-operate with the linked parties, and/or to exploit the
knowledge together (Borgatti and Halgin 2011). Three characteristics seem
important in measuring the potential benefits of interactive learning: the
number of connections the firm has; the mode of interaction adopted; and
the nature of the embeddedness of the networks in which firms are
involved (Borgatti and Halgin 2011; Glückler 2013).
At its simplest, interactive learning and knowledge acquisition can be
positively affected by a firms’ number of connections. In purely statistical
terms, since the payoff from any given innovation connection is unknown in
advance, the chances of obtaining benefit from any connection in a given
distribution of payoffs increases as the number of connections increases
(Love et al, 2014). Having more connections increases the probability of
obtaining useful external knowledge that can be combined with the firm’s
Firms’ innovation objectives and knowledge acquisition strategies
12
internal knowledge to produce innovation (Leiponen and Helfat 2010). The
extent or breadth of a firm’s portfolio of external connections may also have
significant network benefits, reducing the risk of "lock-in" where firms are
either less open to knowledge from outside its own region (Boschma 2005),
or where firms in a region are highly specialised in certain industries, which
lowers their ability to keep up with new technology and market
development (Camagni 1991). However, the capacity of management to
pay attention to and cognitively process many sources of information is not
infinite, since the span of attention of any individual is limited (Simon 1947).
This attention issue means that while the returns to additional connections
may at first be positive, eventually the firm will reach a point at which an
additional connection actually serves to diminish the innovation returns of
external networking (Laursen and Salter 2006; Leiponen and Helfat 2010;
Grimpe and Sofka 2009; Garriga, von Krogh, and Spaeth 2013).
Non-interactive learning is characterised by the absence of reciprocal
knowledge and/or resource transfers between actors. The most frequently
discussed modes of non-interactive learning are: imitation, where a firm
absorbs the knowledge of other actors through observation of the
actions/behaviour of the source actor; reverse engineering, where a firm
derives knowledge from the final product of another firm, obtained from the
market or through supply chain interaction; and the codification of
knowledge, where a firm obtains knowledge through knowledge which is a
public good such as news, patents and regulations etc. (Glückler 2013). As
with interactive connections, the chances of obtaining useful knowledge
from any non-interactive connection will increase as the number of non-
interactive connections increases. Or, put another way, having more non-
interactive connections will increase the probability of obtaining useful
external knowledge.
The contrasting nature of the learning processes involved in interactive and
non-interactive connections, and consequent differences in the types of
knowledge they generate, suggests the potential for a complementary
relationship. Two groups of alternative explanations for this
Firms’ innovation objectives and knowledge acquisition strategies
13
complementarity are possible relating to the contrasting functional contents
of each type of connection and/or their management and co-ordination.
First, in terms of connection content, it may be that the different types of
learning processes - exploratory and exploitative – implicit in interactive
and non-interactive connections generate knowledge which plays a
complementary role in firms’ innovation activity. Collaborative connections
with universities or research centres, for example, may facilitate exploratory
activity, while non-interactive connections with customers or equipment
suppliers may contribute more directly to exploitation (Faems et al. 2010;
Lavie and Rosenkopf 2006). Second, there may be economies of scope as
firms learn how to better manage and co-ordinate their external
connections (Love, Roper, and Vahter 2014). This leads to the first
hypothesis:
Hypothesis 1: Interactive and non-interactive connections are
complementary elements of firms’ knowledge acquisition strategies.
2.3 Innovation strategy and knowledge acquisition
The knowledge necessary for successful innovation includes technical,
commercial and market data, both codified and tacit. The types of
knowledge needed will, however, depend significantly on the technological
novelty, the focus of the innovation (i.e. product, service, process) and the
stage of development of any innovation. Developing new-to-the-market
innovations, for example, is likely to involve exploratory R&D activity and
the development of new technological knowledge either by a firm itself or
through an external connection. Such partnership projects have a number
of potential advantages – speed, risk sharing, access to a broader resource
base – which can increase innovation quality and ameliorate both
technological and commercial risk (Astebro and Michela 2005). Here, there
is likely to be mutual learning as innovation partners interact to generate
new knowledge. This suggests:
Hypothesis 2: Interactive connections will be most important where firms’
innovation objectives emphasise new product or service innovation
Firms’ innovation objectives and knowledge acquisition strategies
14
Alternative knowledge acquisition strategies are non-interactive, involving
mechanisms such as copying, imitation, or the purchase of intellectual
property through mechanisms such as licensing (Anand and Khanna
2000). In each case the emphasis is on the exploitation of existing
knowledge. Such exploitative, non-interactive mechanisms may, however,
allow firms to rapidly establish positions in new technical areas without
undertaking a discovery process, and to avoid both the technological and
commercial uncertainties implicit in such a process. A recent Korean study,
for example, suggested that: ’technology acquisition may be one of the
most efficient collaborative activities when this activity can be simply
conducted to complement insufficient resources’ (Suh and Kim 2012, p.
361). Ulhoi (2012) outlines the range of outcomes which may arise from
non-interactive imitation strategies: Replica – licensed or unlicensed
(counterfeit) copying of a product or service; Mimicry – copying some or all
of the features of an innovative product or service; Analogue – developing
a different product or service but with similar functionality. The implication is
that:
Hypothesis 3: Non-interactive connections will be most important where
firms’ innovation objectives emphasise product or service improvement.
Different types of innovation – product, process or service – will also
require different types of knowledge (Roper, Du, and Love 2008).
Connections with knowledge search among customers, for example, might
impact most strongly on product innovation (Su, Chen, and Sha 2007),
while search with suppliers or external consultants might impact most
directly on process change (Horn 2005; Smith and Tranfield 2005). The
majority of process change is likely to be incremental and “firms frequently
rely on machinery suppliers and outside consultants as sources of
embodied process innovation, the challenges posed by change can draw
on a a variety of technical sources with different knowledge bases and
aims” (Robertson, Casali, and Jacobson 2012, p. 822). Therefore we might
argue that:
Hypothesis 4: Non-interactive connections will be most important where
firms’ innovation objectives emphasise process innovation
Firms’ innovation objectives and knowledge acquisition strategies
15
3. DATA AND METHODS
Our analysis is based on four waves of the UK Innovation Survey, the UK
counterpart of the EU Community Innovation Survey, covering the period
2004 to 2010. Each survey was conducted by post using as a sampling
frame the Interdepartmental Business Register, with structuring by
sizeband, region and sector. Surveys were non-compulsory and achieved
response rates ranging from 51.1 per cent in CIS7 (2010) to 58 per cent in
CIS4 (2004). The UK innovation surveys provide detailed information on
firms' innovation activity, an indication of the objectives of firms' innovation
activity and their external innovation connections. In addition the surveys
provide information on a range of other workplace level characteristics
which we use as control variables6.
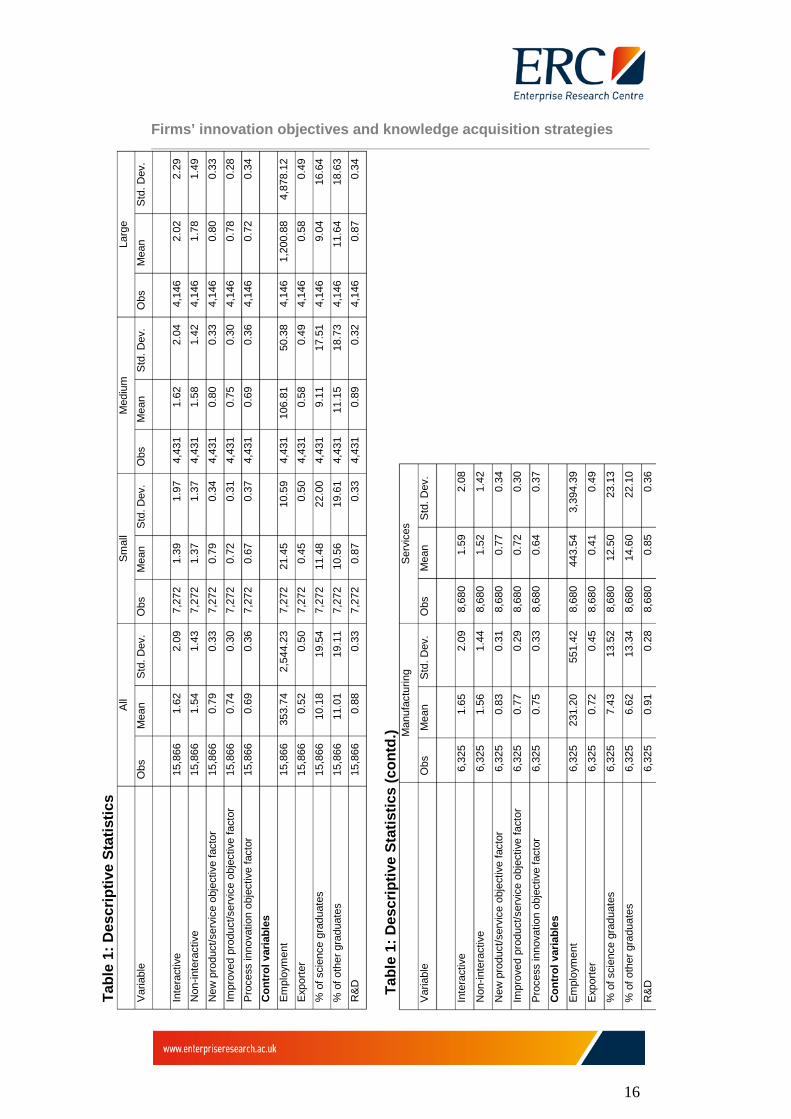
To measure the extent of firms’ interactive knowledge search activity we
define a measure which relates to the number of innovation partner types
with which each firm was working (wherever they were located)7. In the UK
Innovation Survey we find the following question: ‘Which types of
cooperation partner did you use and where were they located?.’ Seven
partner types are identified: other enterprises within the group; suppliers of
equipment, materials, services or software; clients or customers;
competitors within the industry or elsewhere; consultants, commercial labs
or private R&D institutes; universities or other higher education institutions;
government or public research institutes. Our indicator of the extent of
firms’ interactive knowledge search therefore takes values between 0,
where firms had no innovation partners, and 7 where firms were
collaborating with all partner types identified. On average firms were
working with an average of 1.6 interactive types (Table 1).
6 Definitions used in the UK innovation survey accord to the OECD Oslo manual guidelines. 7 This measure of the ‘breadth’ of search activity has been used extensively in studies of the determinants of innovation (Laursen and Salter 2006) and in prior studies of the determinants of ‘openness’ (Moon 2011).
Firms’ innovation objectives and knowledge acquisition strategies
16
Tabl
e 1:
Des
crip
tive
Stat
istic
s
All
Smal
l M
ediu
m
Larg
e V
aria
ble
Obs
M
ean
Std
. Dev
. O
bs
Mea
n S
td. D
ev.
Obs
M
ean
Std
. Dev
. O
bs
Mea
n S
td. D
ev.
Inte
ract
ive
15,8
66
1.62
2.
09
7,27
2 1.
39
1.97
4,
431
1.62
2.
04
4,14
6 2.
02
2.29
N
on-in
tera
ctiv
e 15
,866
1.
54
1.43
7,
272
1.37
1.
37
4,43
1 1.
58
1.42
4,
146
1.78
1.
49
New
pro
duct
/ser
vice
obj
ectiv
e fa
ctor
15
,866
0.
79
0.33
7,
272
0.79
0.
34
4,43
1 0.
80
0.33
4,
146
0.80
0.
33
Impr
oved
pro
duct
/ser
vice
obj
ectiv
e fa
ctor
15
,866
0.
74
0.30
7,
272
0.72
0.
31
4,43
1 0.
75
0.30
4,
146
0.78
0.
28
Pro
cess
inno
vatio
n ob
ject
ive
fact
or
15,8
66
0.69
0.
36
7,27
2 0.
67
0.37
4,
431
0.69
0.
36
4,14
6 0.
72
0.34
C
ontr
ol v
aria
bles
Em
ploy
men
t 15
,866
35
3.74
2,
544.
23
7,27
2 21
.45
10.5
9 4,
431
106.
81
50.3
8 4,
146
1,20
0.88
4,
878.
12
Exp
orte
r 15
,866
0.
52
0.50
7,
272
0.45
0.
50
4,43
1 0.
58
0.49
4,
146
0.58
0.
49
% o
f sci
ence
gra
duat
es
15,8
66
10.1
8 19
.54
7,27
2 11
.48
22.0
0 4,
431
9.11
17
.51
4,14
6 9.
04
16.6
4
% o
f oth
er g
radu
ates
15
,866
11
.01
19.1
1 7,
272
10.5
6 19
.61
4,43
1 11
.15
18.7
3 4,
146
11.6
4 18
.63
R&
D
15,8
66
0.88
0.
33
7,27
2 0.
87
0.33
4,
431
0.89
0.
32
4,14
6 0.
87
0.34
T
able
1: D
escr
iptiv
e St
atis
tics
(con
td.)
M
anuf
actu
ring
Ser
vice
s
Var
iabl
e O
bs
Mea
n S
td. D
ev.
Obs
M
ean
Std
. Dev
.
Inte
ract
ive
6,32
5 1.
65
2.09
8,
680
1.59
2.
08
Non
-inte
ract
ive
6,32
5 1.
56
1.44
8,
680
1.52
1.
42
New
pro
duct
/ser
vice
obj
ectiv
e fa
ctor
6,
325
0.83
0.
31
8,68
0 0.
77
0.34
Impr
oved
pro
duct
/ser
vice
obj
ectiv
e fa
ctor
6,
325
0.77
0.
29
8,68
0 0.
72
0.30
Pro
cess
inno
vatio
n ob
ject
ive
fact
or
6,32
5 0.
75
0.33
8,
680
0.64
0.
37
Con
trol
var
iabl
es
Empl
oym
ent
6,32
5 23
1.20
55
1.42
8,
680
443.
54
3,39
4.39
Exp
orte
r 6,
325
0.72
0.
45
8,68
0 0.
41
0.49
% o
f sci
ence
gra
duat
es
6,32
5 7.
43
13.5
2 8,
680
12.5
0 23
.13
% o
f oth
er g
radu
ates
6,
325
6.62
13
.34
8,68
0 14
.60
22.1
0
R&
D
6,32
5 0.
91
0.28
8,
680
0.85
0.
36
Firms’ innovation objectives and knowledge acquisition strategies
17
We measure the extent of firms’ non-interactive knowledge search in a
similar way using information from a question which asks: ‘How important
to your firm’s innovation were each of the following data sources?’ Here,
we focus on four non-interactive knowledge connections: conferences,
trade fairs, exhibitions; scientific journals and trade/technical publications;
professional and industry associations; technical, industry or service
standards. Our indicator of non-interactive knowledge search therefore
takes values between 0, where the firm is not engaging in any non-
interactive knowledge search activity, and 4 where it uses each non-
interactive data source. On average firms were engaging with 1.5 non-
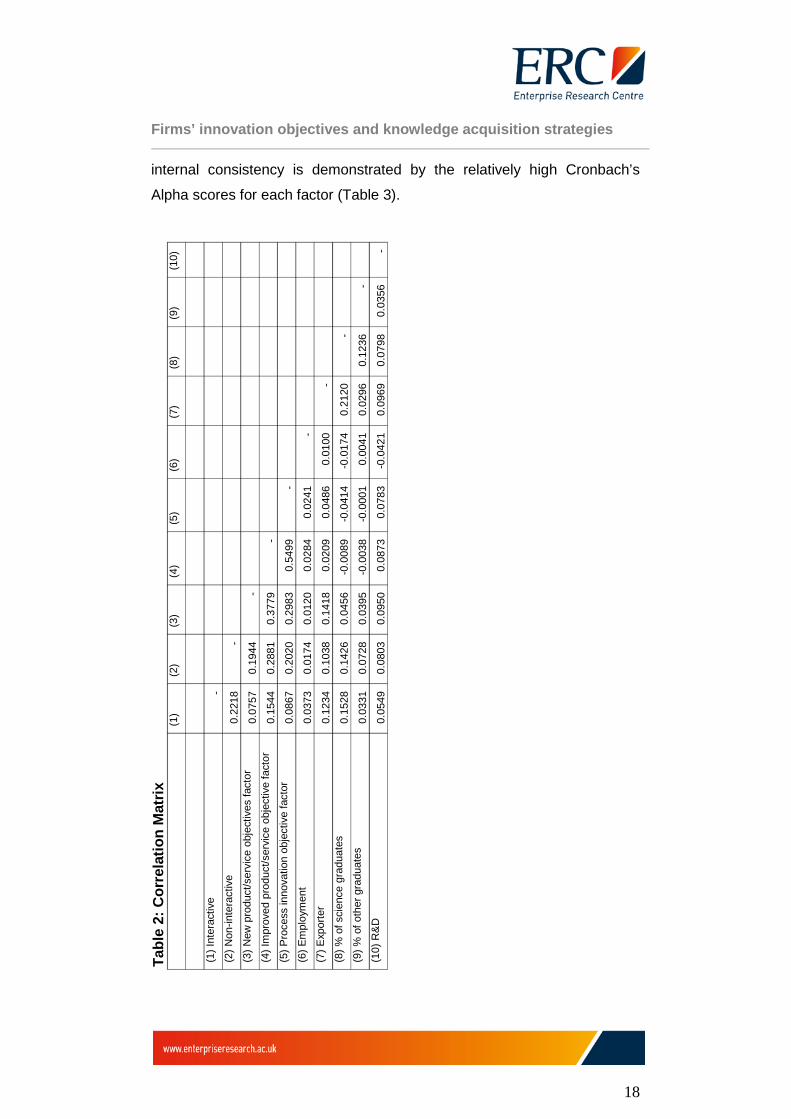
interactive partnering types (Table 1). Interestingly in terms of Hypothesis 1
which suggests complementarity between interactive and non-interactive
knowledge search activity we also find a weak positive correlation (0.22)
between the two variables (Table 2).
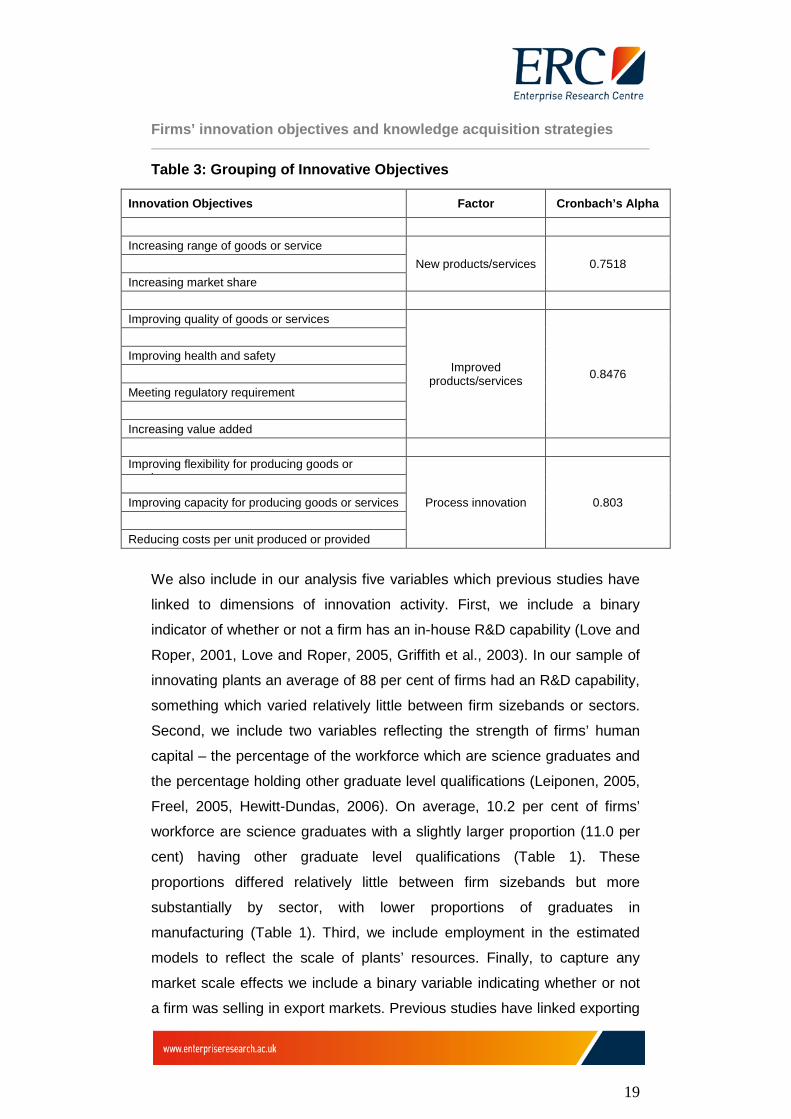
The other key variable in our analysis reflects the objectives of firms'
innovation activity. This is derived from a question which asks: 'How
important were each of the following factors in your decision to innovate in
goods or services and/or process(es)?’.Nine alternative objectives for
engaging in innovation are distinguished in the UK Innovation Survey
(Table 3): we associate each of these with one of the three broad
innovation objectives which are the foci of our hypotheses (i.e. new
products/services; improved products/services; process innovation).
Innovation objectives related to new products/services we associate with
firms’ aims to increase their range of goods or services and/or increasing
market share. The objectives of improving the quality of goods and
services, increasing value added, improving health and safety and meeting
regulatory requirements we associate with improved products or services
with the potential both to attract new customers and add value for existing
customers. And objectives associated with improving flexibility, capacity
and reducing costs we associate with process innovation. In each case the
measure of the broader objective is obtained creating a factor from the
underlying elements. The suitability of the groupings created and their
Firms’ innovation objectives and knowledge acquisition strategies
18
internal consistency is demonstrated by the relatively high Cronbach’s
Alpha scores for each factor (Table 3).
Ta
ble
2: C
orre
latio
n M
atrix
(1)
(2)
(3)
(4)
(5)
(6)
(7)
(8)
(9)
(10)
(1) I
nter
activ
e -
(2
) Non
-inte
ract
ive
0.22
18
-
(3
) New
pro
duct
/ser
vice
obj
ectiv
es fa
ctor
0.
0757
0.
1944
-
(4
) Im
prov
ed p
rodu
ct/s
ervi
ce o
bjec
tive
fact
or
0.15
44
0.28
81
0.37
79
-
(5
) Pro
cess
inno
vatio
n ob
ject
ive
fact
or
0.08
67
0.20
20
0.29
83
0.54
99
-
(6) E
mpl
oym
ent
0.03
73
0.01
74
0.01
20
0.02
84
0.02
41
-
(7
) Exp
orte
r 0.
1234
0.
1038
0.
1418
0.
0209
0.
0486
0.
0100
-
(8
) % o
f sci
ence
gra
duat
es
0.15
28
0.14
26
0.04
56
-0.0
089
-0.0
414
-0.0
174
0.21
20
-
(9
) % o
f oth
er g
radu
ates
0.
0331
0.
0728
0.
0395
-0
.003
8 -0
.000
1 0.
0041
0.
0296
0.
1236
-
(1
0) R
&D
0.
0549
0.
0803
0.
0950
0.
0873
0.
0783
-0
.042
1 0.
0969
0.
0798
0.
0356
-
Firms’ innovation objectives and knowledge acquisition strategies
19
Table 3: Grouping of Innovative Objectives
We also include in our analysis five variables which previous studies have
linked to dimensions of innovation activity. First, we include a binary
indicator of whether or not a firm has an in-house R&D capability (Love and
Roper, 2001, Love and Roper, 2005, Griffith et al., 2003). In our sample of
innovating plants an average of 88 per cent of firms had an R&D capability,
something which varied relatively little between firm sizebands or sectors.
Second, we include two variables reflecting the strength of firms’ human
capital – the percentage of the workforce which are science graduates and
the percentage holding other graduate level qualifications (Leiponen, 2005,
Freel, 2005, Hewitt-Dundas, 2006). On average, 10.2 per cent of firms’
workforce are science graduates with a slightly larger proportion (11.0 per
cent) having other graduate level qualifications (Table 1). These
proportions differed relatively little between firm sizebands but more
substantially by sector, with lower proportions of graduates in
manufacturing (Table 1). Third, we include employment in the estimated
models to reflect the scale of plants’ resources. Finally, to capture any
market scale effects we include a binary variable indicating whether or not
a firm was selling in export markets. Previous studies have linked exporting
Innovation Objectives Factor Cronbach’s Alpha
Increasing range of goods or service
New products/services 0.7518 Increasing market share
Improving quality of goods or services
Improved products/services 0.8476
Improving health and safety
Meeting regulatory requirement
Increasing value added
Improving flexibility for producing goods or
i
Process innovation 0.803 Improving capacity for producing goods or services
Reducing costs per unit produced or provided
Firms’ innovation objectives and knowledge acquisition strategies
20
and innovative activity through both competition and learning effects (Love
and Roper 2013).
Our estimation strategy follows previous studies which have considered the
determinants of the extent of firms’ interactive connections (Moon 2011).
As the dependent variables both in the models for the extent of firms
interactive and non-interactive connections are count variables either
Poisson or Negative Binomial models are appropriate. However, in both
cases a relatively large proportion of innovating firms have no external
connections and so we also consider the zero inflated Poisson (ZIP) and
zero inflated negative binomial models (ZINB)8. Vuong tests consistently
suggest the superiority of the ZIP and ZINB models and both are reported
here9. Our estimation sample is based on pooled data from four waves of
the UK innovation survey, an approach we adopt to allow robust sub-
sample estimates. To allow for sectoral and temporal heterogeneity we also
include sector dummies at the 2-digit level and wave dummies in each
model (not reported).
4. ESTIMATION RESULTS
We divide the presentation of results into three main sections. First, we
report baseline models for the whole group of innovating firms relating
interactive and non-interactive connections to their innovation objectives.
Second, as previous studies have suggested potential differences in the
determinants of firms’ interactive connections by sector (Moon 2011), and
the differential value of external connections for firms of different sizes
(Vahter, Love, and Roper 2013), we report sub-sample estimates for
specific groups of firms by industry and sizeband. These sub-sample
estimates also provide a robustness check on the full sample estimates.
8 For our whole sample of innovating firms 52 per cent of firms have no interactive relationships while 37 have no non-interactive relationships. 9 Estimation of either Poisson or negative binomial models suggest almost identical results to those presented here.
Firms’ innovation objectives and knowledge acquisition strategies
21
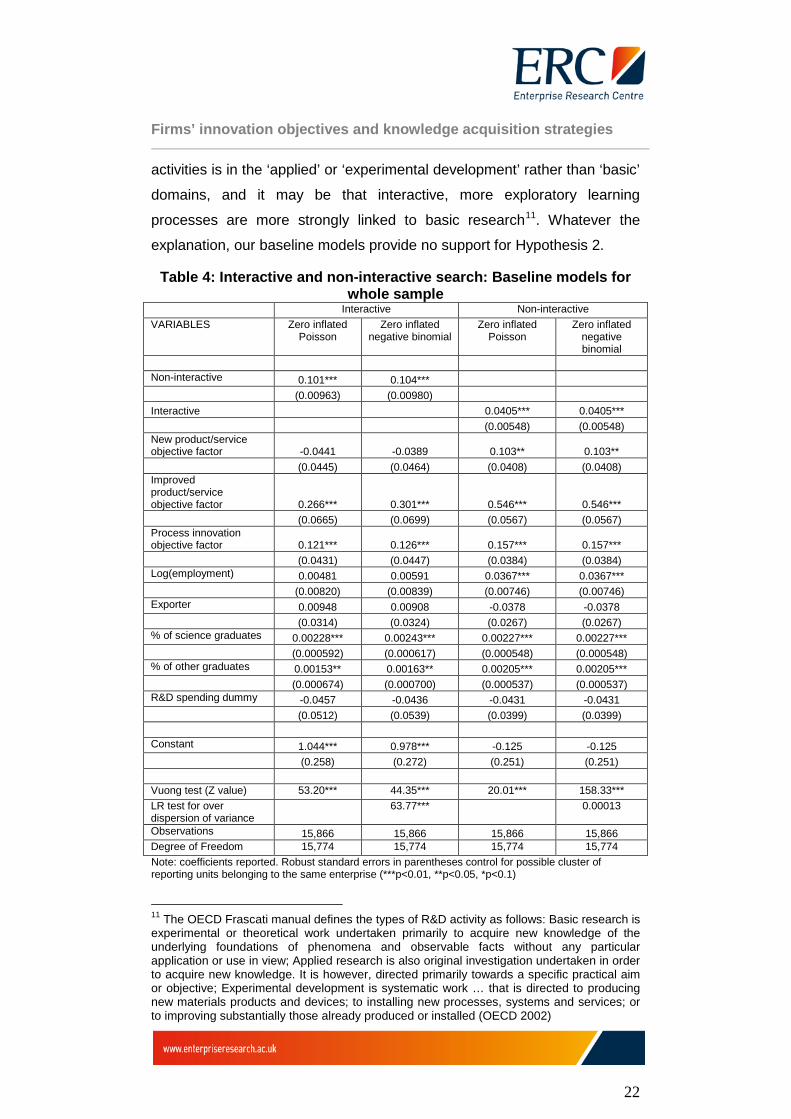
4.1 Whole sample estimates
Baseline models of firms’ interactive and non-interactive connections for
the whole group of innovating firms are reported in Table 4. Our first
hypothesis relates to the potential for a complementary connection
between interactive and non-interactive connections in firms’ knowledge
acquisition strategies10. Positive and strongly significant coefficients on the
number of interactive and non-interactive connections in both models
provide strong support for this hypothesis, a result which proves robust
across different estimation approaches. The implication is that firms with
interactive connections as part of their knowledge acquisition strategy are
also more likely to have non-interactive connections and vice versa. As
indicated above, this complementarity may arise either from the different
types of learning processes - exploratory and exploitative – implicit in
interactive and non-interactive connections, and/or from economies of
scope as firms learn how to better manage and co-ordinate their external
connections (Love, Roper, and Vahter 2014).
Our remaining hypotheses focus on the connections between firms’
innovation objectives and their knowledge acquisition strategies.
Hypothesis 2 argues that interactive connections, which facilitate
exploratory learning processes, will be most strongly related to innovation
strategies which emphasise the introduction of new rather than improved or
upgraded products. The evidence from our baseline models, however,
provides no support for this view with innovation objectives related to new
product or service introductions linked only to non-interactive connections,
while improved products and services are strongly linked to both interactive
and non-interactive forms of search (Table 4). One possibility is that this
reflects a weakness in our survey data which identifies a range of
innovation objectives focussed specifically on the introduction of new
products/services and processes and excludes less blue sky activity. In
terms of standard definitions of different types of R&D activity this range of 10 We have little insight from previous studies about any complementary relationship between firms’ interactive and non-interactive relationships. There is some evidence however of complementarities between specific types of interactive relationships (Roper, Du, and Love 2008).
Firms’ innovation objectives and knowledge acquisition strategies
22
activities is in the ‘applied’ or ‘experimental development’ rather than ‘basic’
domains, and it may be that interactive, more exploratory learning
processes are more strongly linked to basic research11. Whatever the
explanation, our baseline models provide no support for Hypothesis 2.
Table 4: Interactive and non-interactive search: Baseline models for whole sample
Interactive Non-interactive VARIABLES Zero inflated
Poisson Zero inflated
negative binomial Zero inflated
Poisson Zero inflated
negative binomial
Non-interactive 0.101*** 0.104*** (0.00963) (0.00980)
Interactive
0.0405*** 0.0405***
(0.00548) (0.00548)
New product/service objective factor -0.0441 -0.0389 0.103** 0.103** (0.0445) (0.0464) (0.0408) (0.0408) Improved product/service objective factor 0.266*** 0.301*** 0.546*** 0.546*** (0.0665) (0.0699) (0.0567) (0.0567) Process innovation objective factor 0.121*** 0.126*** 0.157*** 0.157*** (0.0431) (0.0447) (0.0384) (0.0384) Log(employment) 0.00481 0.00591 0.0367*** 0.0367*** (0.00820) (0.00839) (0.00746) (0.00746) Exporter 0.00948 0.00908 -0.0378 -0.0378 (0.0314) (0.0324) (0.0267) (0.0267) % of science graduates 0.00228*** 0.00243*** 0.00227*** 0.00227*** (0.000592) (0.000617) (0.000548) (0.000548) % of other graduates 0.00153** 0.00163** 0.00205*** 0.00205*** (0.000674) (0.000700) (0.000537) (0.000537) R&D spending dummy -0.0457 -0.0436 -0.0431 -0.0431 (0.0512) (0.0539) (0.0399) (0.0399)
Constant 1.044*** 0.978*** -0.125 -0.125 (0.258) (0.272) (0.251) (0.251)
Vuong test (Z value) 53.20*** 44.35*** 20.01*** 158.33*** LR test for over dispersion of variance
63.77*** 0.00013
Observations 15,866 15,866 15,866 15,866 Degree of Freedom 15,774 15,774 15,774 15,774 Note: coefficients reported. Robust standard errors in parentheses control for possible cluster of reporting units belonging to the same enterprise (***p<0.01, **p<0.05, *p<0.1)
11 The OECD Frascati manual defines the types of R&D activity as follows: Basic research is experimental or theoretical work undertaken primarily to acquire new knowledge of the underlying foundations of phenomena and observable facts without any particular application or use in view; Applied research is also original investigation undertaken in order to acquire new knowledge. It is however, directed primarily towards a specific practical aim or objective; Experimental development is systematic work … that is directed to producing new materials products and devices; to installing new processes, systems and services; or to improving substantially those already produced or installed (OECD 2002)
Firms’ innovation objectives and knowledge acquisition strategies
23
Hypothesis 3 suggests that where firms’ innovation objectives relates to
product or service improvements, non-interactive connections will be more
common. In our baseline models the equation coefficients provide some
support for Hypothesis 3. Although both interactive and non-interactive
variables have significant coefficients, the latter are much larger than the
former, suggesting the stronger association of non-interactive knowledge
sources (Table 4).
Our final hypothesis argues that process innovation objectives are likely to
be most strongly related to non-interactive connections as firms seek to
make incremental changes to established processes on the basis of
external knowledge embodied in either consultants or suppliers or codified
into technical guidelines or manuals (Robertson, Casali, and Jacobson
2012). There is little support for this hypothesis: Both interactive and non-
interactive search processes have positive and significant coefficients for
the process innovation factor, with coefficients of almost equal size.
To summarise, for all firms we find strong positive complementarity
between firms’ interactive and non-interactive connections. We also find
tentative evidence that non-interactive connections are linked most strongly
to innovation strategies oriented towards incremental product/service
change and (to a lesser extent) process improvement. Perhaps more
surprisingly, we find that there is no association between interactive
linkages and innovation strategies geared towards the introduction of new
products and services. In terms of the control variables, the most
consistent effects relate to the share of firms’ workforces which are
graduates – the more graduate employees the firm has the greater the
likelihood of having both interactive and non-interactive connections (Table
4). This is consistent with an absorptive capacity argument and the idea
that firms with higher levels of human capital may be better able to absorb
external knowledge (Robertson, Casali, and Jacobson 2012). Interestingly,
in the context of previous discussion of firm size and external connections
(van de Vrande et al. 2009; Vahter, Love, and Roper 2013) we find no
significant relationship between the number of interactive connections and
Firms’ innovation objectives and knowledge acquisition strategies
24
firm size although larger firms are more likely to have more non-interactive
connections.
4.2 Sub-sample estimates
Previous studies have suggested differences in the scope and focus of the
innovation strategies of smaller and larger firms (Acs and Audretsch 1990),
and between firms in services and manufacturing industries (Suh and Kim
2012; Tether 2005; Howells and Tether 2004). Previous studies have also
emphasised the rather different partnering behaviour of small firms in
innovation (van de Vrande et al. 2009), and the differential benefits which
firms of different sizes may derive from having external innovation
connections (Vahter, Love, and Roper 2013). Sectoral differences in
organisational factors and appropriability regimes may also influence firms’
external innovation connections (Moon 2011). Both suggest the potential
value of considering possible sizeband and sectoral contrasts in the link
between firms’ innovation objectives and their approach to developing
external innovation connections.
Table 5 links firms’ innovation objectives to the extent of their interactive
and non-interactive connection for small firms (with 0-49 employees),
medium (50-249 employees) and larger firms (250 plus employees). Three
points stand out. First, our general finding of the complementarity of
interactive and non-interactive connections proves robust for firms in each
sizeband. Second, we are again unable to find any support for the notion
that innovation objectives linked to the development of new
products/services will be related more strongly to interactive connections:
indeed the lack of significance here is clear across all three sizebands.
Third, and also consistent with our general findings, there is only tentative
evidence that non-interactive linkages are more strongly associated with
innovation objectives related to product or service improvement. In terms of
innovation objectives related to process change there is, however, some
difference across the sizebands. In the case of large firms Hypothesis 4 is
now confirmed: process change is associated only with non-interactive
knowledge search. Interestingly, the reverse is true for small firms (less
Firms’ innovation objectives and knowledge acquisition strategies
25
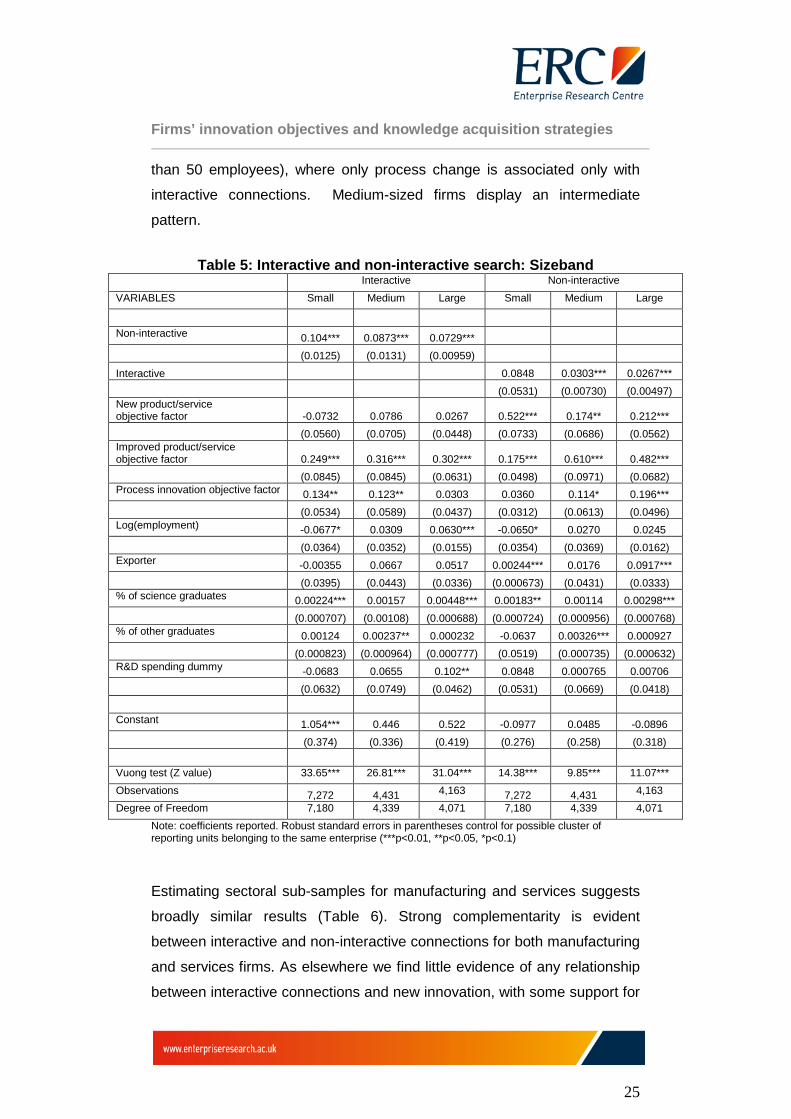
than 50 employees), where only process change is associated only with
interactive connections. Medium-sized firms display an intermediate
pattern.
Table 5: Interactive and non-interactive search: Sizeband Interactive Non-interactive VARIABLES Small Medium Large Small Medium Large Non-interactive 0.104*** 0.0873*** 0.0729*** (0.0125) (0.0131) (0.00959)
Interactive
0.0848 0.0303*** 0.0267***
(0.0531) (0.00730) (0.00497)
New product/service objective factor -0.0732 0.0786 0.0267 0.522*** 0.174** 0.212*** (0.0560) (0.0705) (0.0448) (0.0733) (0.0686) (0.0562) Improved product/service objective factor 0.249*** 0.316*** 0.302*** 0.175*** 0.610*** 0.482*** (0.0845) (0.0845) (0.0631) (0.0498) (0.0971) (0.0682) Process innovation objective factor 0.134** 0.123** 0.0303 0.0360 0.114* 0.196*** (0.0534) (0.0589) (0.0437) (0.0312) (0.0613) (0.0496) Log(employment) -0.0677* 0.0309 0.0630*** -0.0650* 0.0270 0.0245 (0.0364) (0.0352) (0.0155) (0.0354) (0.0369) (0.0162) Exporter -0.00355 0.0667 0.0517 0.00244*** 0.0176 0.0917*** (0.0395) (0.0443) (0.0336) (0.000673) (0.0431) (0.0333) % of science graduates 0.00224*** 0.00157 0.00448*** 0.00183** 0.00114 0.00298*** (0.000707) (0.00108) (0.000688) (0.000724) (0.000956) (0.000768) % of other graduates 0.00124 0.00237** 0.000232 -0.0637 0.00326*** 0.000927 (0.000823) (0.000964) (0.000777) (0.0519) (0.000735) (0.000632) R&D spending dummy -0.0683 0.0655 0.102** 0.0848 0.000765 0.00706 (0.0632) (0.0749) (0.0462) (0.0531) (0.0669) (0.0418)
Constant 1.054*** 0.446 0.522 -0.0977 0.0485 -0.0896 (0.374) (0.336) (0.419) (0.276) (0.258) (0.318)
Vuong test (Z value) 33.65*** 26.81*** 31.04*** 14.38*** 9.85*** 11.07*** Observations 7,272 4,431 4,163 7,272 4,431 4,163 Degree of Freedom 7,180 4,339 4,071 7,180 4,339 4,071
Note: coefficients reported. Robust standard errors in parentheses control for possible cluster of reporting units belonging to the same enterprise (***p<0.01, **p<0.05, *p<0.1)
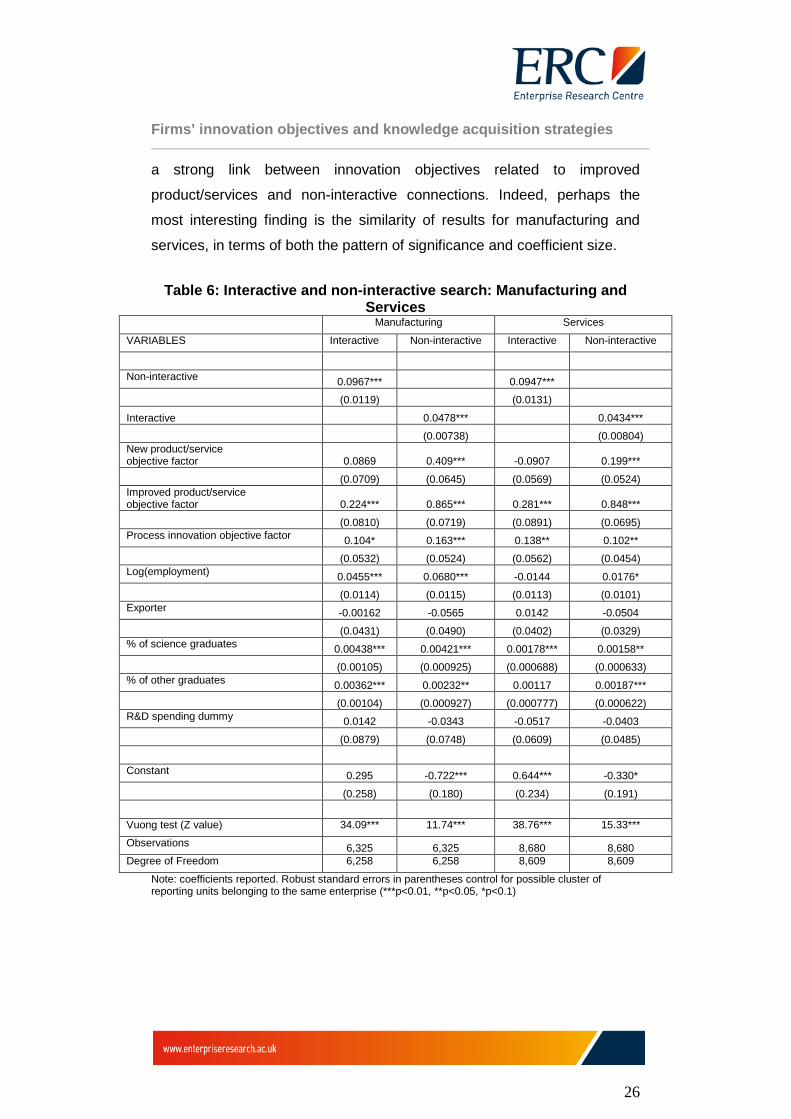
Estimating sectoral sub-samples for manufacturing and services suggests
broadly similar results (Table 6). Strong complementarity is evident
between interactive and non-interactive connections for both manufacturing
and services firms. As elsewhere we find little evidence of any relationship
between interactive connections and new innovation, with some support for
Firms’ innovation objectives and knowledge acquisition strategies
26
a strong link between innovation objectives related to improved
product/services and non-interactive connections. Indeed, perhaps the
most interesting finding is the similarity of results for manufacturing and
services, in terms of both the pattern of significance and coefficient size.
Table 6: Interactive and non-interactive search: Manufacturing and Services
Manufacturing Services
VARIABLES Interactive Non-interactive Interactive Non-interactive
Non-interactive 0.0967***
0.0947***
(0.0119)
(0.0131)
Interactive
0.0478***
0.0434***
(0.00738)
(0.00804)
New product/service objective factor 0.0869 0.409*** -0.0907 0.199*** (0.0709) (0.0645) (0.0569) (0.0524) Improved product/service objective factor 0.224*** 0.865*** 0.281*** 0.848*** (0.0810) (0.0719) (0.0891) (0.0695) Process innovation objective factor 0.104* 0.163*** 0.138** 0.102** (0.0532) (0.0524) (0.0562) (0.0454) Log(employment) 0.0455*** 0.0680*** -0.0144 0.0176* (0.0114) (0.0115) (0.0113) (0.0101) Exporter -0.00162 -0.0565 0.0142 -0.0504 (0.0431) (0.0490) (0.0402) (0.0329) % of science graduates 0.00438*** 0.00421*** 0.00178*** 0.00158** (0.00105) (0.000925) (0.000688) (0.000633) % of other graduates 0.00362*** 0.00232** 0.00117 0.00187*** (0.00104) (0.000927) (0.000777) (0.000622) R&D spending dummy 0.0142 -0.0343 -0.0517 -0.0403 (0.0879) (0.0748) (0.0609) (0.0485)
Constant 0.295 -0.722*** 0.644*** -0.330* (0.258) (0.180) (0.234) (0.191)
Vuong test (Z value) 34.09*** 11.74*** 38.76*** 15.33***
Observations 6,325 6,325 8,680 8,680 Degree of Freedom 6,258 6,258 8,609 8,609
Note: coefficients reported. Robust standard errors in parentheses control for possible cluster of reporting units belonging to the same enterprise (***p<0.01, **p<0.05, *p<0.1)
Firms’ innovation objectives and knowledge acquisition strategies
27
3. CONCLUSIONS AND DISCUSSION
Firms can acquire the knowledge necessary to drive innovation either
through internal discovery processes or through external search
(Chesbrough 2007; Chesborough 2006). Here, using data on a large
sample of UK companies, we examine the factors which determine two
different modes of knowledge acquisition activity: interactive connections
which may be exploratory in character and in which there is a mutuality to
learning, and non-interactive connections in which knowledge flows from
one party to another and learning is therefore one-sided (Glückler 2013).
In terms of our hypotheses two main empirical results stand out. First, we
find strong and consistent support for complementarity between non-
interactive and interactive connections across firms in all sectors and
sizebands. In other words, firms which have more interactive connections
as part of their innovation activity also have more non-interactive
connections. On the basis of our survey data we are, however, unable to
distinguish whether this complementarity is due to differences in the
functional content of these connections (Faems et al. 2010; Lavie and
Rosenkopf 2006), economies of scope in their management and
coordination (Love, Roper, and Vahter 2014), or both. Second, we find
some tentative evidence that where firms have innovation objectives which
relate to product or service improvement they are more likely to establish
non-interactive rather than interactive connections. Such connections are
likely to be exploitative (rather than exploratory) focussed on the application
and commercialisation of existing knowledge rather than the creation of
new knowledge which might provide the basis for the introduction of new
products or services. In our data, however, we are unable to find any
consistent evidence for a link between innovation objectives related to new
products and interactive connections.
Our analysis suggests one other consistent result. We find a consistent
and positive relationship between the quality of firms’ human capital and
their external connections (both interactive and non-interactive). This
Firms’ innovation objectives and knowledge acquisition strategies
28
provides a link between our study and previous analyses which have linked
firms’ propensity to develop external connections to their internal
capabilities – particularly absorptive capacity (Spithoven, Clarysse, and
Knockaert 2011; Schmidt 2010; Xia and Roper 2008). It also suggests that
one – indirect – benefit of investments or policy initiatives designed to
improve firms’ human capital will be an increase in inter-organisational
connectivity or openness which itself has potentially positive externalities
(Roper, Vahter, and Love 2013).
Our findings on the impact human capital on firms’ external connections
highlight the contingent nature of such activities. Sectoral factors, such as
regulation, may be important but individual firm-level influences – such as
skill attributes and firms’ innovation objectives – also play a significant role.
Such factors may also influence the value which firms’ derive from their
external connections and in future papers we aim to examine how firms’
interactive and non-interactive connections contribute to innovation
performance.
Firms’ innovation objectives and knowledge acquisition strategies
29
REFERENCES
Acs, Z.J. and D. Audretsch. 1990. Innovation and Small Firms. Cambridge,
MA.: MIT Press.
Anand, B.N. and T. Khanna. 2000. The structure of licensing contracts.
Journal of Industrial Economics 48:103-135.
Anthony, S.D.; M.W. Johnson; J.V. Sinfiled; and E.J. Altman. 2008. The
Innovators Guide to Growth - Putting Disruptive innovation to work. Boston
MA: Harvard Business Press.
Astebro, T. and J.L. Michela. 2005. Predictors of the survival of
innovations. Journal of Product Innovation Management 22:322-335.
Banbury, C.M. and W. Mitchell. 1995. The Effect Of Introducing Important
Incremental Innovations On Market Share And Business Survival. Strategic
Management Journal 16:161-182.
Beugelsdijck, P.J. and M. Cornet. 2001. How far do they reach? The
localisation of industrial and academic spillovers in the Netherlands. Centre
discussion paper:47.
Bolton, M.K. 1993. Imitation Versus Innovation - Lessons To Be Learned
From The Japanese. Organizational Dynamics 21:30-45.
Borgatti, S.P. and D.S. Halgin. 2011. On Network Theory. Organization
Science 22:1168-1181.
Boschma, R.A. 2005. Proximity and Innovation: A Critical Assessment.
Regional Studies 39:61-74.
Camagni, R. 1991. Local milieu, uncertainty and innovation networks:
towards a new dynamic theory of economic space,. In Innovation Networks,
Spatial Perspectives, ed. R. Camagni. London, New York Belhaven Press.
Firms’ innovation objectives and knowledge acquisition strategies
30
Chesborough, H.W. 2006. Open Innovation: a new paradign for
understanding industrial innovation. Oxford: Oxford University Press.
Chesbrough, H.W. 2007. Why companies should have open business
models. MIT Sloan Management Review 48:22-+.
Dorion, E.; E.T. Pavoni; and L.R. Chalela. 2008. Innovation or Imitation: A
Comparative Study on Common Behavior of Brazilian Entrepreneurs.
Haidian District: Intellectual Property Publ House.
Faems, D.; M. de Visser; P. Andries; and B. Van Looy. 2010. Technology
Alliance Portfolios and Financial Performance: Value-Enhancing and Cost-
Increasing Effects of Open Innovation. Journal of Product Innovation
Management 27:785-796.
Freel, M.S. and H.W. Aslesen. 2013. The organisational antecedents of
openness in small companies. In 25 DRUID Conference Barcelona.
Ganotakis, P. and J.H. Love. 2011. R&D, product innovation, and
exporting: evidence from UK new technology based firms. Oxford
Economic Papers-New Series 63:279-306.
Garriga, H.; G. von Krogh; and S. Spaeth. 2013. How constraints and
knowledge impact open innovation. Strategic Management Journal
34:1134-1144.
Glückler, J. 2013. Knowledge, Networks and Space: Connectivity and the
Problem of Non-Interactive Learning. Regional Studies 47:880-894.
Grimpe, C. and W. Sofka. 2009. Search patterns and absorptive capacity:
low- and high-technology sectors in European countries. Research Policy
38:495-506.
Hang, C.C.; J. Chen; and A.M. Subramian. 2010. Developing Disruptive
Products For Emerging Economies: Lessons From Asian Cases.
Research-Technology Management 53:21-+.
Firms’ innovation objectives and knowledge acquisition strategies
31
Hewitt-Dundas, N. 2004. The adoption of AMT and innovation strategy in
small firms. International Journal of Innovation and Technology
Management 1:17-36.
Hewitt-Dundas, N. and S. Roper. 2011. Creating advantage in peripheral
regions: the role of publicly funded R&D centres. Research Policy 40:832-
841.
Hobday, M. 1995. Innovation in East Asia: The Challenge to Japan.
Aldershot, UK: Edward Elgar.
Hofmann, C. and S. Orr. 2005. Advanced manufacturing technology
adoption - the German experience. Technovation 25:711-724.
Horn, P.M. 2005. The Changing Nature of Innovation. Research
Technology Management 48:28-33.
Howells, J. and B. Tether. 2004. Innovation in Services: Issues at Stake
and Trends. http://www.isi.fhg.de/ti/Downloads/kb_inno_services_final.pdf.
Kim, L. 1997. From imitation to innovation: the dynamics of Korea's
technological learning Boston, MA: Harvard Business Press.
Kopel, M. and C. Loffler. 2008. Commitment, first-mover-, and second-
mover advantage. Journal of Economics 94:143-166.
Laursen, K. and A. Salter. 2006. Open for Innovation: The role of openness
in explaining innovation performance among UK manufacturing firms.
Strategic Management Journal 27:131-150.
Lavie, D. and L. Rosenkopf. 2006. Balancing exporation and exploitation in
alliance formation. Academy of management journal 49:797-818.
Lee, J. and B.C. Kim. 2013. The Relationship between Innovation and
Market Share: Evidence from the Global LCD Industry. Industry and
Innovation 20:1-21.
Firms’ innovation objectives and knowledge acquisition strategies
32
Leiponen, A. and C.E. Helfat. 2010. Innovation objectives, knowledge
sources, and the benefits of breadth. Strategic Management Journal
31:224-236.
Lieberman, M.B. and S. Asaba. 2006. Why do firms imitate each other?
Academy of management review 31:366-385.
Lim, D.J. and D.F. Kocaoglu. 2011. China - Can It Move from Imitation to
Innovation? New York: Ieee.
Love, J.H. and S. Roper. 2013. SME innovation, exporting and growth: A
review of existing evidence. In White Paper No. 5. Warwick Business
School: Enterprise Research Centre.
Love, J.H.; S. Roper; and P. Vahter. 2014. Learning from openness: the
dynamics of breadth in external innovation linkages. Strategic Management
Journal, forthcoming.
Moon, S. 2011. What determines the openness of a firm to external
knowledge? Evidence from the Korean service sector. Asian Journal of
Technology Innovation 19:185-200.
Mueller, V.; N. Rosenbusch; and A. Bausch. 2013. Success Patterns of
Exploratory and Exploitative Innovation: A Meta-Analysis of the Influence of
Institutional Factors. Journal Of Management 39:1606-1636.
Nagji, B. and G. Tuff. 2012. Managing your innovation portfolio. Harvard
Business Review 90:66-74.
OECD. 2002. Frascati Manual - Proposed standard practice for surveys on
research and experimental development. Paris: OECD.
Powell, W.W. 1998. Learning from Collaboration: Knowledge and Networks
in the Biotechnology and Pharmaceutical Industries. California
Management Review 40:228-240.
Firms’ innovation objectives and knowledge acquisition strategies
33
Rasiah, R.; V. Gopal; and P. Sanjivee. 2013. Export and innovation in
Cambodian clothing manufacturing firms. Asian Journal of Technology
Innovation 21:305-316.
Robertson, P.L.; G.L. Casali; and D. Jacobson. 2012. Managing open
incremental process innovation: Absorptive Capacity and distributed
learning. Research Policy 41:822-832.
Roper, S.; J. Du; and J.H. Love. 2008. Modelling the Innovation Value
Chain. Research Policy 37:961-977.
Roper, S.; P. Vahter; and J.H. Love. 2013. Externalities of openness in
innovation. Research Policy 42:1544-1554.
Schmidt, T. 2010. Absorptive Capacity - One Size Fits All? A Firm-Level
Analysis of Absorptive Capacity for Different Kinds of Knowledge.
Managerial and Decision Economics 31:1-18.
Schnaars, S.P. 1994. Managing Imitation Strategies. New York: Free
Press.
Shenkar, O. 2010. Imitation Is More Valuable Than Innovation. Harvard
Business Review 88:28-29.
Simon, H. 1996. Hidden champions - lessons from 500 of the world's best
unknown companies. Boston, MA: Harvard Business School Press.
Simon, H.A. 1947. Administrative Behavior: A Study of Decision-Making
Process in Administrative Organization Chicago: Macmillan.
Smith, D.J. and D. Tranfield. 2005. Talented suppliers? Strategic change
and innovation in the UK aerospace industry. R&D Management 35:37-49.
Sohal, A.S. 1996. Assessing AMT implementations: An empirical field
study. Technovation 16:377-384.
Firms’ innovation objectives and knowledge acquisition strategies
34
Spithoven, A.; B. Clarysse; and M. Knockaert. 2011. Building absorptive
capacity to organise inbound open innovation in traditional industries.
Technovation 31:10-21.
Spithoven, A.; B. Clarysse; and M. Knockaert. 2011. Building absorptive
capacity to organize inbound open innovation in traditional industries.
Technovation 31:10-21.
Su, C.T.; Y.H. Chen; and D.Y.J. Sha. 2007. Managing product and
customer knowledge in innovative new product development. International
Journal Of Technology Management 39:105-130.
Suh, Y. and M.S. Kim. 2012. Effects of SME collaboration on R&D in the
service sector in open innovation. Innovation-Management Policy &
Practice 14:349-362.
Tether, B.S. 2005. Do Services Innovate (Differently)? Insights from the
European Innobarometer Survey. Industry and Innovation 12:153-184.
Ulhoi, J.P. 2012. Modes and orders of market entry: revisiting innovation
and imitation strategies. Technology Analysis & Strategic Management
24:37-50.
Vahter, P.; J.H. Love; and S. Roper. 2013. Openness and innovation
performance: are small firms different? Research Paper Enterprise
Research Centre.
van de Vrande, V.; J.P.J. de Jong; W. Vanhaverbeke; and M. de
Rochemont. 2009. Open innovation in SMEs: trends, motives and
management challenges. Technovation 29:423–437.
Xia, H. and S. Roper. 2008. From Capability to Connectivity: Absorptive
Capacity and Exploratory Alliances in Biopharmaceutical Firms: A US-
Europe Comparison. Technovation 28: 776-785

Firms’ innovation objectives and knowledge acquisition strategies
35
Xin, J.Y.; A.C.L. Yeung; and T.C.E. Cheng. 2010. First to market: Is
technological innovation in new product development profitable in health
care industries? International Journal of Production Economics 127:129-
135.
Zammuto, R.F. and E.J. Oconnor. 1992. Gaining Advanced Manufacturing
Technologies Benefits - The Roles Of Organization Design And Culture.
Academy of management review 17:701-728.

Firms’ innovation objectives and knowledge acquisition strategies
36
Centre Manager Enterprise Research Centre
Aston Business School Birmingham, B1 7ET
Centre Manager Enterprise Research Centre
Warwick Business School Coventry, CV4 7AL
The Enterprise Research Centre is an independent research centre funded by the Economic and Social Research Council (ESRC); the Department for Business,
Innovation & Skills (BIS); the Technology Strategy Board (TSB); and, through the British Bankers Association (BBA), by the Royal Bank of Scotland PLC; Bank of Scotland PLC;
HSBC Bank PLC; Barclays Bank PLC and Lloyds TSB Bank PLC.