Firm size and job creation: evidence from Turkey
20
Full Terms & Conditions of access and use can be found at http://www.tandfonline.com/action/journalInformation?journalCode=rero20 Download by: [161.53.47.211] Date: 04 May 2017, At: 01:51 Economic Research-Ekonomska Istraživanja ISSN: 1331-677X (Print) 1848-9664 (Online) Journal homepage: http://www.tandfonline.com/loi/rero20 Firm size and job creation: evidence from Turkey Ergun Dogan, M. Qamarul Islam & Mehmet Yazici To cite this article: Ergun Dogan, M. Qamarul Islam & Mehmet Yazici (2017) Firm size and job creation: evidence from Turkey, Economic Research-Ekonomska Istraživanja, 30:1, 349-367, DOI: 10.1080/1331677X.2017.1305804 To link to this article: http://dx.doi.org/10.1080/1331677X.2017.1305804 © 2017 The Author(s). Published by Informa UK Limited, trading as Taylor & Francis Group Published online: 11 Apr 2017. Submit your article to this journal Article views: 42 View related articles View Crossmark data
Transcript of Firm size and job creation: evidence from Turkey
Full Terms & Conditions of access and use can be found athttp://www.tandfonline.com/action/journalInformation?journalCode=rero20
Download by: [161.53.47.211] Date: 04 May 2017, At: 01:51
Economic Research-Ekonomska Istraživanja
ISSN: 1331-677X (Print) 1848-9664 (Online) Journal homepage: http://www.tandfonline.com/loi/rero20
Firm size and job creation: evidence from Turkey
Ergun Dogan, M. Qamarul Islam & Mehmet Yazici
To cite this article: Ergun Dogan, M. Qamarul Islam & Mehmet Yazici (2017) Firm size and jobcreation: evidence from Turkey, Economic Research-Ekonomska Istraživanja, 30:1, 349-367, DOI:10.1080/1331677X.2017.1305804
To link to this article: http://dx.doi.org/10.1080/1331677X.2017.1305804
© 2017 The Author(s). Published by InformaUK Limited, trading as Taylor & FrancisGroup
Published online: 11 Apr 2017.
Submit your article to this journal
Article views: 42
View related articles
View Crossmark data
Economic REsEaRch-Ekonomska istRaživanja, 2017voL. 30, no. 1, 349–367http://dx.doi.org/10.1080/1331677X.2017.1305804
Firm size and job creation: evidence from Turkey
Ergun Dogana, M. Qamarul Islamb and Mehmet Yazicia
aDepartment of Economics, cankaya University, ankara, turkey; bstatistics Unit, inter-curricular courses Department, cankaya University, ankara, turkey
ABSTRACTThis study examines the relationship between firm size and job creation by using an extensive data set covering all non-farm Turkish businesses with 20 or more employees from 2003 to 2010. We find that small firms (firms with employees between 20 and 100 employees) have higher mean job flow rates (job creation, job destruction and net job creation rates) than large firms. Firm size and job flow rates are inversely related, and this relationship is especially prominent for firms with 50 employees or more. Although the overall pattern observed is also observed in both sectors, job creation rates in services are higher than the ones in manufacturing. The magnitudes of job destruction rates are comparable across sectors. Higher job creation rate in services but comparable job destruction rate results in higher net job creation rate in services. As for shares, only for smaller firms (20–49 and 50–99 size categories), job creation shares are greater than their shares in employment. But these firms have disproportionate job destruction shares as well. We also find that only the 20–49 category firms contribute to net job creation more than their share in employment. The smaller firms have high disproportionate shares in job creation and destruction in manufacturing and services as well.
1. Introduction
Debate about the relationship between firm size and job creation in general, and in particular whether small firms play a more important role in job creation than large ones, has been going on for a long time. The most influential work in the initiation of this debate were the studies by Birch (1979, 1981, 1987) which argued that it is the small firms that were the most important engines of job creation. Findings by Birch were later challenged and criticised by other authors, especially by Davis, Haltiwanger, and Schuh (1996a) on methodological grounds. Davis et al. (1996a) argued that size definition of a firm used by Birch tends to bias the contribution of firms to job creation in favour of small firms due to regression fallacy. Davis et al. (1996a) propose and use another definition, which overcomes the regression fallacy, and conclude that, unlike Birch’s findings, no relationship exists between plant size and employment growth.
KEYWORDSjob creation; job destruction; small firms; firm growth; entry; exit
JEL CLASSIFICATIONSj20; L11; L25; L53
ARTICLE HISTORYReceived 21 march 2014 accepted 25 February 2016
© 2017 the author(s). Published by informa Uk Limited, trading as taylor & Francis Group.this is an open access article distributed under the terms of the creative commons attribution License (http://creativecommons.org/licenses/by/4.0/), which permits unrestricted use, distribution, and reproduction in any medium, provided the original work is properly cited.
CONTACT mehmet Yazici [email protected]
OPEN ACCESS
350 E. DOGAN ET AL.
The results from recent literature are mixed. Some studies (for example, Broersma & Gautier, [1997] for Netherlands, Voulgaris, Papadogonas, & Agiomirgianakis, [2005] for Greece, Neumark et al., [2011] for the U.S., Hijzen, Upward, & Wright, [2010] for the U.K.) find a negative relationship between firm size and job creation like Birch, and some (for example, Hohti, [2000] for Finland, Juniper, Mitchell, & Myers, [2004] for Australia) find no or a positive one like Davis et al. (1996a). Haltiwanger Jarmin, and Miranda (2013) focus on firm age and find that in the U.S., once the firm age is accounted for, systematic negative relationship between firm size and job creation that is reported in some of the studies mentioned above disappears.
The studies on developing countries and emerging economies such as Turkey are rel-atively limited. Rijkers, Arouri, Freund, and Nucifora (2014) find a positive relationship between net job creation and firm size in Tunisia, even after controlling for firm age. Kerr, Wittenberg, and Arrow (2013) show that larger firms in South Africa have higher net job creation rates. Distributions of size-weighted employment growth rates reported in Shiferaw and Bedi (2013) show an inverse relationship between employment growth and firm size. To the best of our knowledge, there is no published study investigating the role of firm size in job creation in the case of Turkey.
The firm size and job growth relationship is important for policy as well. In many countries governments have financial and other types of support programmes in place, costing the taxpayers large sums of money. In Turkey, services and support programmes for small and medium-sized enterprises (S.M.E.s) are mainly provided by the Small and Medium-Sized Enterprises Development Organisation. These services and programmes include information dissemination, financial guidance, technology development, export promotion, regional devel-opment, and entrepreneurship development. Existence of S.M.E.-supporting institutions is justified by positing that small and medium firms contribute to job creation disproportionately with their share in total employment. But is this view really supported empirically? There is yet no consensus on this issue, on which the present study aims to shed light.
This study also contributes to the literature in several ways. Firstly, as mentioned above, this is the first study looking into the role of firm size in job creation and destruction in Turkey – a fast-developing dynamic economy. Secondly, we not only examine the issue for the overall economy, to find out if there is any variation across sectors, we also investigate it in manufacturing and services sectors. Thirdly, we examine the role of entry and exit in job creation and destruction across size categories and explore how it varies across manufac-turing and services, if at all. Finally, in investigating the relationship between firm size and job creation, we have used non-parametric methods in addition to the conventional ones.
The rest of the article is organised as follows. In the next section we explain how we meas-ure firm size and job growth. In Section 3, we present our main results, which include results related with entry–exit and sectoral results. In Section 4 we explore the sensitivity of results to the inclusion of firm age in the analysis by using limited age data available to us. Section 5 deals with the issue of how long job creation or destruction persists. The final section concludes.
2. Data and measurement
2.1. Data
We use confidential firm-level data provided by the Turkish Statistical Institute (TurkStat).1 Data were collected by annual surveys from enterprises (firms), which can operate several
ECONOMIC RESEARCH-EKONOMSKA ISTRAŽIVANJA 351
smaller units (plants or establishments). TurkStat uses full enumeration method for firms with 20 or more employees; that is, all of the registered firms in this category are included in the frame. For firms that have fewer than 20 employees, sampling method is used. Data cover the period from 2003 to 2010.
Since we need to calculate the annual variations in employment and the number of firms (firm entry–exit), we use only the data that were obtained by full enumeration method (data on firms with 20 or more employees) in the study. Full enumeration gives much better results because firms can be traced out consistently in the data over several years. A firm may appear or disappear in the data due to sampling when sampling method is used, which reduces the number of observations, since employment changes could not be calculated. Furthermore, these firms could mistakenly be treated as entrants and exiters. In line with the information we received from TurkStat officials, we have used the average number of persons engaged to separate out sampled firms from the fully counted ones.2 We include in the sample any firm whose average number of persons engaged is less than 20 in a given year if in any other year its average num-ber of persons engaged is 20 or more. Our final data set has 348, 428 firm/year observations.
We use the number of employees as of November each year to calculate job creation and destruction figures, and to construct size categories. Employees include all people who work for the firm, including the part-timers, as of November. Hence, by using the number of employees, we only count persons who receive some form of payment (wages, salaries, fees, gratuities, etc.) from the firm.
We use the same size categories used by TurkStat to report the results. These size catego-ries match with those used in the literature, and thus we are able to compare our results with the ones in previous studies. In classifying firms as small, medium or large, the following criteria are used by TurkStat, which follow the criteria used by Eurostat: firms employing fewer than 50 workers are considered small; those employing more than 50 and fewer than 250 are considered medium-sized; and those employing more than 250 are considered large firms. 3 The criterion of fewer than 100 workers has also been used in the literature to classify small firms (e.g., for U.K., see Hijzen et al., 2010).
2.2. Measurement of job creation and destruction and firm size
We use a methodology similar to the one in Davis and Haltiwanger (1992) in measuring job creation and destruction.
Gross job creation rate in a size group s in year t:
where S is the set of all firms in group s, ei is employment of firm i, and Est is average employment in size group s between period t and t–1 and defined as:
Gross job destruction rate in a group s in year t:
(1)GJCR
st=
∑i∈S
t
(eit− e
it−1)
Est
for (eit≥ e
it−1)
(2)Est=(∑
i∈St
eit+∑
i∈St
eit−1
)∕2
(3)GJDRst=
���∑
i∈St
(eit− e
it−1)���
Est
for (eit≤ e
it−1)
352 E. DOGAN ET AL.
Net job creation or growth rate is:
In defining the size of a firm, basically there are two size definitions used in the literature; base-year size and average size. Base-year size is the size of the firm at the initial year of the time interval over which employment growth is measured. Since we calculate the employ-ment growth over the period from year t–1 to year t, base-year size of a firm is the size at t–1, which in our case is equal to eit–1. Average size is the simple average of the firm size at the beginning and at the end of the time interval over employment growth is calculated. In our case average size of firm is equal to (eit + eit–1)/2. Because it is by now well established that when base-year size definition is used, contribution of small businesses tends to be overestimated (see, e.g., Davis, Haltiwanger, & Schuh, [1996b]; Neumark et al., [2011]), we report only results based on the average-size definition.
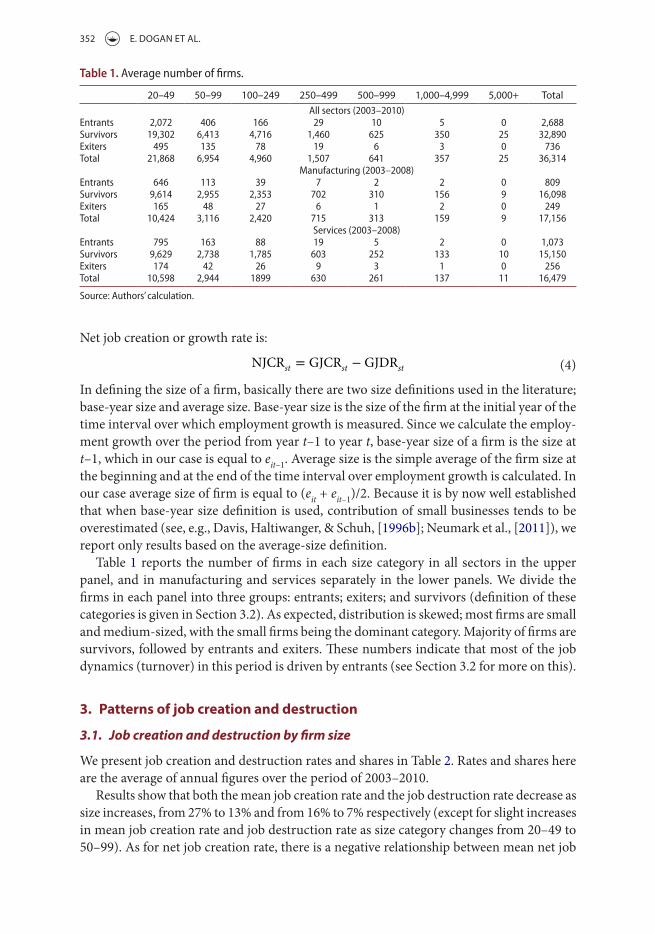
Table 1 reports the number of firms in each size category in all sectors in the upper panel, and in manufacturing and services separately in the lower panels. We divide the firms in each panel into three groups: entrants; exiters; and survivors (definition of these categories is given in Section 3.2). As expected, distribution is skewed; most firms are small and medium-sized, with the small firms being the dominant category. Majority of firms are survivors, followed by entrants and exiters. These numbers indicate that most of the job dynamics (turnover) in this period is driven by entrants (see Section 3.2 for more on this).
3. Patterns of job creation and destruction
3.1. Job creation and destruction by firm size
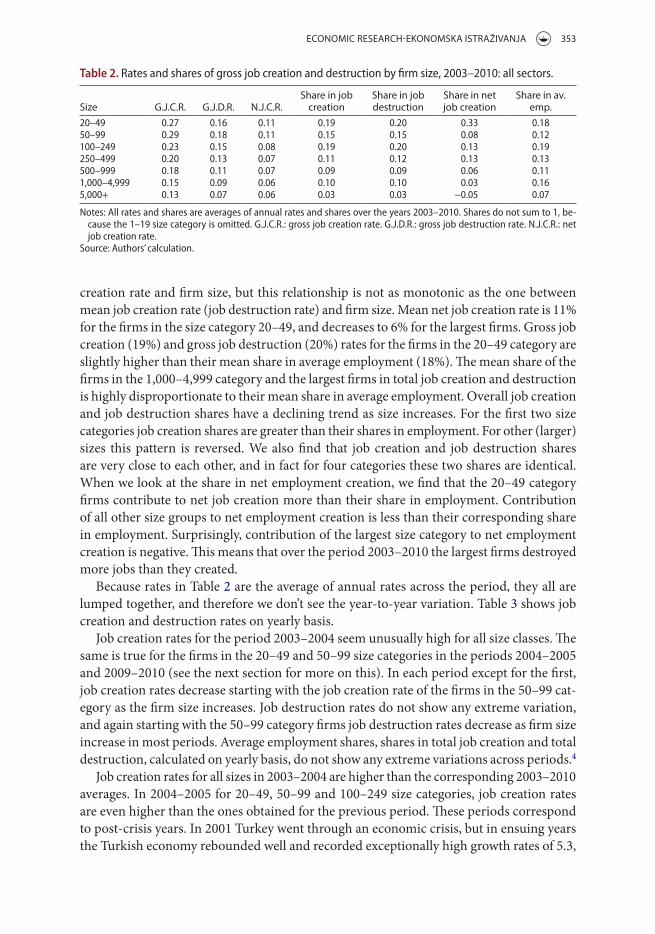
We present job creation and destruction rates and shares in Table 2. Rates and shares here are the average of annual figures over the period of 2003–2010.
Results show that both the mean job creation rate and the job destruction rate decrease as size increases, from 27% to 13% and from 16% to 7% respectively (except for slight increases in mean job creation rate and job destruction rate as size category changes from 20–49 to 50–99). As for net job creation rate, there is a negative relationship between mean net job
(4)NJCRst= GJCR
st− GJDR
st
Table 1. average number of firms.
source: authors’ calculation.
20–49 50–99 100–249 250–499 500–999 1,000–4,999 5,000+ Totalall sectors (2003–2010)
Entrants 2,072 406 166 29 10 5 0 2,688survivors 19,302 6,413 4,716 1,460 625 350 25 32,890Exiters 495 135 78 19 6 3 0 736total 21,868 6,954 4,960 1,507 641 357 25 36,314
manufacturing (2003–2008)Entrants 646 113 39 7 2 2 0 809survivors 9,614 2,955 2,353 702 310 156 9 16,098Exiters 165 48 27 6 1 2 0 249total 10,424 3,116 2,420 715 313 159 9 17,156
services (2003–2008)Entrants 795 163 88 19 5 2 0 1,073survivors 9,629 2,738 1,785 603 252 133 10 15,150Exiters 174 42 26 9 3 1 0 256total 10,598 2,944 1899 630 261 137 11 16,479
ECONOMIC RESEARCH-EKONOMSKA ISTRAŽIVANJA 353
creation rate and firm size, but this relationship is not as monotonic as the one between mean job creation rate (job destruction rate) and firm size. Mean net job creation rate is 11% for the firms in the size category 20–49, and decreases to 6% for the largest firms. Gross job creation (19%) and gross job destruction (20%) rates for the firms in the 20–49 category are slightly higher than their mean share in average employment (18%). The mean share of the firms in the 1,000–4,999 category and the largest firms in total job creation and destruction is highly disproportionate to their mean share in average employment. Overall job creation and job destruction shares have a declining trend as size increases. For the first two size categories job creation shares are greater than their shares in employment. For other (larger) sizes this pattern is reversed. We also find that job creation and job destruction shares are very close to each other, and in fact for four categories these two shares are identical. When we look at the share in net employment creation, we find that the 20–49 category firms contribute to net job creation more than their share in employment. Contribution of all other size groups to net employment creation is less than their corresponding share in employment. Surprisingly, contribution of the largest size category to net employment creation is negative. This means that over the period 2003–2010 the largest firms destroyed more jobs than they created.
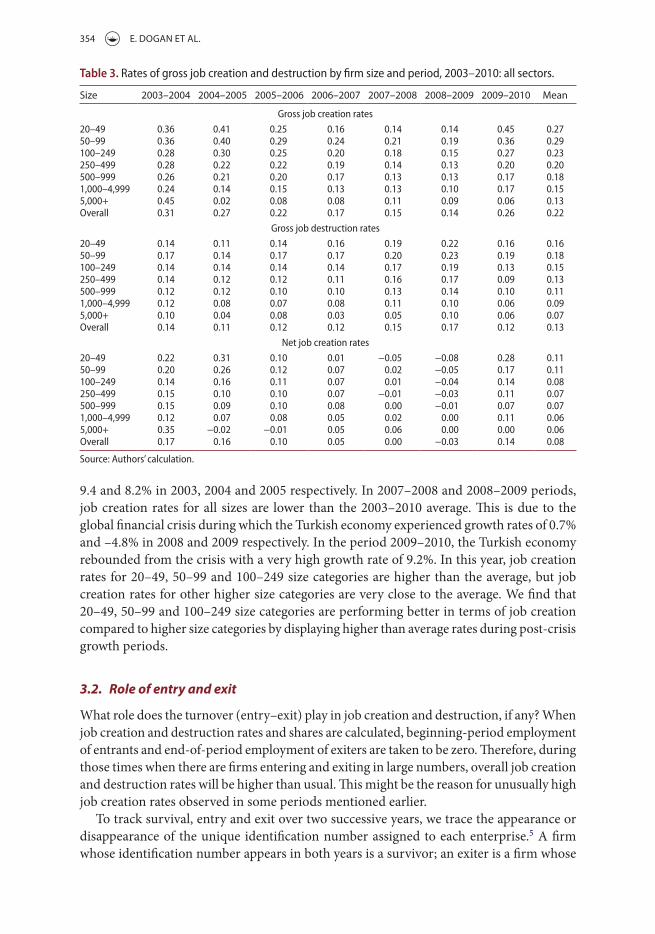
Because rates in Table 2 are the average of annual rates across the period, they all are lumped together, and therefore we don’t see the year-to-year variation. Table 3 shows job creation and destruction rates on yearly basis.
Job creation rates for the period 2003–2004 seem unusually high for all size classes. The same is true for the firms in the 20–49 and 50–99 size categories in the periods 2004–2005 and 2009–2010 (see the next section for more on this). In each period except for the first, job creation rates decrease starting with the job creation rate of the firms in the 50–99 cat-egory as the firm size increases. Job destruction rates do not show any extreme variation, and again starting with the 50–99 category firms job destruction rates decrease as firm size increase in most periods. Average employment shares, shares in total job creation and total destruction, calculated on yearly basis, do not show any extreme variations across periods.4
Job creation rates for all sizes in 2003–2004 are higher than the corresponding 2003–2010 averages. In 2004–2005 for 20–49, 50–99 and 100–249 size categories, job creation rates are even higher than the ones obtained for the previous period. These periods correspond to post-crisis years. In 2001 Turkey went through an economic crisis, but in ensuing years the Turkish economy rebounded well and recorded exceptionally high growth rates of 5.3,
Table 2. Rates and shares of gross job creation and destruction by firm size, 2003–2010: all sectors.
notes: all rates and shares are averages of annual rates and shares over the years 2003–2010. shares do not sum to 1, be-cause the 1–19 size category is omitted. G.j.c.R.: gross job creation rate. G.j.D.R.: gross job destruction rate. n.j.c.R.: net job creation rate.
source: authors’ calculation.
Size G.J.C.R. G.J.D.R. N.J.C.R.Share in job
creationShare in job destruction
Share in net job creation
Share in av. emp.
20–49 0.27 0.16 0.11 0.19 0.20 0.33 0.1850–99 0.29 0.18 0.11 0.15 0.15 0.08 0.12100–249 0.23 0.15 0.08 0.19 0.20 0.13 0.19250–499 0.20 0.13 0.07 0.11 0.12 0.13 0.13500–999 0.18 0.11 0.07 0.09 0.09 0.06 0.111,000–4,999 0.15 0.09 0.06 0.10 0.10 0.03 0.165,000+ 0.13 0.07 0.06 0.03 0.03 −0.05 0.07
354 E. DOGAN ET AL.
9.4 and 8.2% in 2003, 2004 and 2005 respectively. In 2007–2008 and 2008–2009 periods, job creation rates for all sizes are lower than the 2003–2010 average. This is due to the global financial crisis during which the Turkish economy experienced growth rates of 0.7% and –4.8% in 2008 and 2009 respectively. In the period 2009–2010, the Turkish economy rebounded from the crisis with a very high growth rate of 9.2%. In this year, job creation rates for 20–49, 50–99 and 100–249 size categories are higher than the average, but job creation rates for other higher size categories are very close to the average. We find that 20–49, 50–99 and 100–249 size categories are performing better in terms of job creation compared to higher size categories by displaying higher than average rates during post-crisis growth periods.
3.2. Role of entry and exit
What role does the turnover (entry–exit) play in job creation and destruction, if any? When job creation and destruction rates and shares are calculated, beginning-period employment of entrants and end-of-period employment of exiters are taken to be zero. Therefore, during those times when there are firms entering and exiting in large numbers, overall job creation and destruction rates will be higher than usual. This might be the reason for unusually high job creation rates observed in some periods mentioned earlier.
To track survival, entry and exit over two successive years, we trace the appearance or disappearance of the unique identification number assigned to each enterprise.5 A firm whose identification number appears in both years is a survivor; an exiter is a firm whose
Table 3. Rates of gross job creation and destruction by firm size and period, 2003–2010: all sectors.
source: authors’ calculation.
Size 2003–2004 2004–2005 2005–2006 2006–2007 2007–2008 2008–2009 2009–2010 Mean
Gross job creation rates
20–49 0.36 0.41 0.25 0.16 0.14 0.14 0.45 0.2750–99 0.36 0.40 0.29 0.24 0.21 0.19 0.36 0.29100–249 0.28 0.30 0.25 0.20 0.18 0.15 0.27 0.23250–499 0.28 0.22 0.22 0.19 0.14 0.13 0.20 0.20500–999 0.26 0.21 0.20 0.17 0.13 0.13 0.17 0.181,000–4,999 0.24 0.14 0.15 0.13 0.13 0.10 0.17 0.155,000+ 0.45 0.02 0.08 0.08 0.11 0.09 0.06 0.13overall 0.31 0.27 0.22 0.17 0.15 0.14 0.26 0.22
Gross job destruction rates
20–49 0.14 0.11 0.14 0.16 0.19 0.22 0.16 0.1650–99 0.17 0.14 0.17 0.17 0.20 0.23 0.19 0.18100–249 0.14 0.14 0.14 0.14 0.17 0.19 0.13 0.15250–499 0.14 0.12 0.12 0.11 0.16 0.17 0.09 0.13500–999 0.12 0.12 0.10 0.10 0.13 0.14 0.10 0.111,000–4,999 0.12 0.08 0.07 0.08 0.11 0.10 0.06 0.095,000+ 0.10 0.04 0.08 0.03 0.05 0.10 0.06 0.07overall 0.14 0.11 0.12 0.12 0.15 0.17 0.12 0.13
net job creation rates
20–49 0.22 0.31 0.10 0.01 −0.05 −0.08 0.28 0.1150–99 0.20 0.26 0.12 0.07 0.02 −0.05 0.17 0.11100–249 0.14 0.16 0.11 0.07 0.01 −0.04 0.14 0.08250–499 0.15 0.10 0.10 0.07 −0.01 −0.03 0.11 0.07500–999 0.15 0.09 0.10 0.08 0.00 −0.01 0.07 0.071,000–4,999 0.12 0.07 0.08 0.05 0.02 0.00 0.11 0.065,000+ 0.35 −0.02 −0.01 0.05 0.06 0.00 0.00 0.06overall 0.17 0.16 0.10 0.05 0.00 −0.03 0.14 0.08
ECONOMIC RESEARCH-EKONOMSKA ISTRAŽIVANJA 355
identification number appears in the first year of the period but not in the second; and an entrant is a firm whose identification number only appears in the second year.
Entrants and exiters may not be true entrants and exiters, since a firm would be classified as an entrant (exiter) when its employment rises above (falls below) the threshold of 20 employees. This also means that there will be firms who exit from and enter the database multiple times, especially in the 20–49 size class. We classify such firms as survivors, not exiters or entrants, which means that their job creation and destruction rates cannot be calculated.
Accounting for multiple entry and exit in the beginning and end of the whole sample period is not without its problems. Firms that do not appear in 2003 but in do 2004 would necessarily be classified as entrants even though they might be re-entrants, and hence would have been classified as survivors had it been known that they were operating in earlier periods. Similarly, since it is not possible to track firms after 2010, the firms that do appear in 2009 but not in 2010 would necessarily be classified as exiters even though they might have re-appeared in later periods, and would have been properly classified as survivors if that happened.
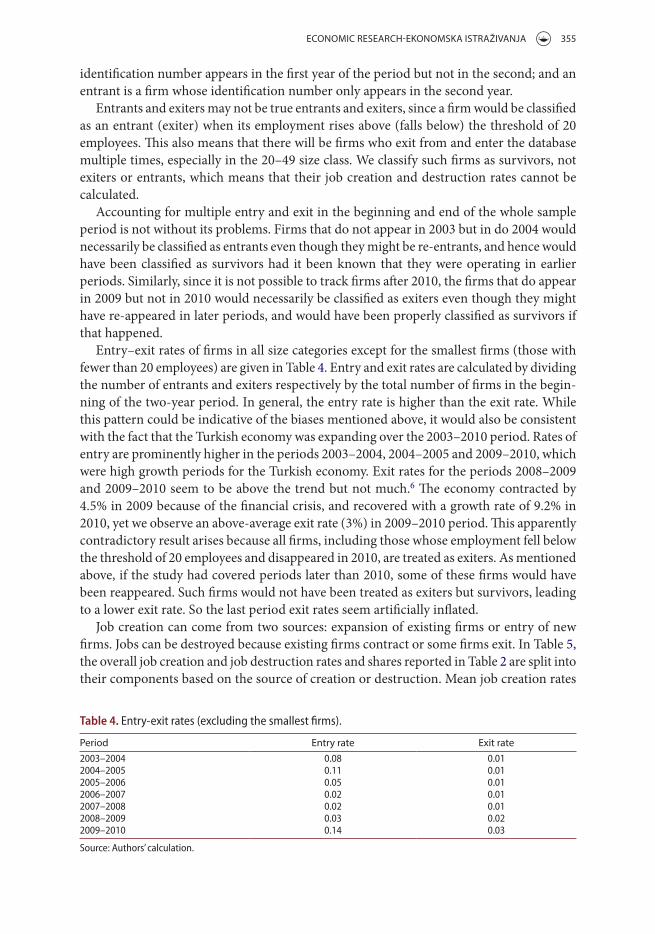
Entry–exit rates of firms in all size categories except for the smallest firms (those with fewer than 20 employees) are given in Table 4. Entry and exit rates are calculated by dividing the number of entrants and exiters respectively by the total number of firms in the begin-ning of the two-year period. In general, the entry rate is higher than the exit rate. While this pattern could be indicative of the biases mentioned above, it would also be consistent with the fact that the Turkish economy was expanding over the 2003–2010 period. Rates of entry are prominently higher in the periods 2003–2004, 2004–2005 and 2009–2010, which were high growth periods for the Turkish economy. Exit rates for the periods 2008–2009 and 2009–2010 seem to be above the trend but not much.6 The economy contracted by 4.5% in 2009 because of the financial crisis, and recovered with a growth rate of 9.2% in 2010, yet we observe an above-average exit rate (3%) in 2009–2010 period. This apparently contradictory result arises because all firms, including those whose employment fell below the threshold of 20 employees and disappeared in 2010, are treated as exiters. As mentioned above, if the study had covered periods later than 2010, some of these firms would have been reappeared. Such firms would not have been treated as exiters but survivors, leading to a lower exit rate. So the last period exit rates seem artificially inflated.
Job creation can come from two sources: expansion of existing firms or entry of new firms. Jobs can be destroyed because existing firms contract or some firms exit. In Table 5, the overall job creation and job destruction rates and shares reported in Table 2 are split into their components based on the source of creation or destruction. Mean job creation rates
Table 4. Entry-exit rates (excluding the smallest firms).
source: authors’ calculation.
Period Entry rate Exit rate2003–2004 0.08 0.012004–2005 0.11 0.012005–2006 0.05 0.012006–2007 0.02 0.012007–2008 0.02 0.012008–2009 0.03 0.022009–2010 0.14 0.03

356 E. DOGAN ET AL.
of entrants range from 3% to 17% (see Table 5). Those entrants employing 20–49 workers have a higher mean job creation rate than the survivors in the same category. In other size categories this pattern is reversed. Mean job destruction rates for exiters range between 2% and 4%. For all size categories, mean job destruction rates of exiters are less than those of survivors. Mean shares in job creation and destruction range from 1% to 11% and from 1% to 4%, respectively. Except for the first two size categories entrants’ (exiters’) mean share in job creation (destruction) is lower than that of survivors’.
As the results reported in Table 5 show, entrants in the 20–49 and 50–99 categories have very high rates of job creation, which drive overall job creation rates higher for the firms in these size categories. For other categories the opposite is true. In line with overall job creation rates, job creation rates of entrants show a declining pattern as the size gets larger. Because entry mostly occurs in smaller size categories, contribution of entrants to job cre-ation is greater in smaller sizes. This has the implication that job creation rates of survivors get closer to the overall rate as the size gets larger.
Job destruction rates of exiters range between 3 and 4% in smaller size categories and 2% in larger size categories. This implies that, given the declining pattern of overall job destruction, the percentage of the jobs destroyed by exiters in overall destruction rises as the size gets larger. Almost constant job destruction rates by exiters also imply that job destruction rates by survivors mimic the overall rates.
The share of entrants in job creation exceeds that of survivors in the 20–49 size category. In all other size categories, survivors create more jobs than entrants. Entrants’ share in job creation first declines and then after the 100–249 size category it becomes steady. Exiters’ share in job destruction is less than that of survivors for all categories. Exiters’ share in job destruction does not vary much over size categories, ranging from 1% to 4%. So, most of the jobs that are destructed are destructed by contraction of existing firms. In other words, given the small and steady share of exiters, overall job destruction share is driven
Table 5. Rates and shares of gross job creation and destruction by firm size and turnover 2003–2010: all sectors.
notes: all rates and shares are averages of annual rates and shares over the years 2003–2010. shares do not sum to 1, because the 1–19 size category is omitted.
source: authors’ calculation.
Size
Gross job creation rate Gross job destruction rate
Entrants Survivors All Exiters Survivors All20–49 0.17 0.11 0.27 0.03 0.13 0.1650–99 0.12 0.18 0.29 0.04 0.14 0.18100–249 0.07 0.17 0.23 0.03 0.12 0.15250–499 0.04 0.16 0.20 0.02 0.10 0.13500–999 0.03 0.15 0.18 0.02 0.09 0.111,000–4,999 0.03 0.12 0.15 0.02 0.07 0.095,000+ 0.07 0.06 0.13 0.02 0.05 0.07
share in job creation share in job destructionEntrants survivors all Exiters survivors all
20–49 0.11 0.08 0.19 0.04 0.16 0.2050–99 0.06 0.09 0.15 0.03 0.12 0.15100–249 0.05 0.14 0.19 0.04 0.16 0.20250–499 0.02 0.09 0.11 0.02 0.10 0.12500–999 0.01 0.07 0.09 0.02 0.07 0.091,000–4,999 0.02 0.09 0.10 0.02 0.08 0.105,000+ 0.02 0.02 0.03 0.01 0.02 0.03
ECONOMIC RESEARCH-EKONOMSKA ISTRAŽIVANJA 357
by contracting survivors. This finding is also consistent with the earlier finding of a low exit rate. We also find that the share of the largest size category is very small in both job creation and job destruction. In this size category we also find that shares of survivors and entrants in job creation are the same, and shares of exiters and survivors in job destruction are very close to each other.
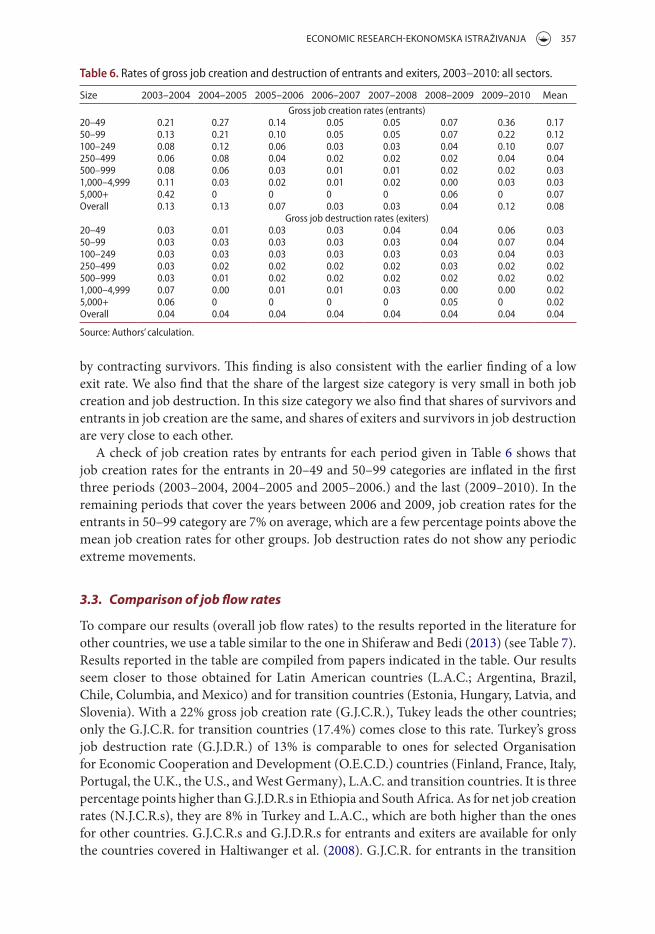
A check of job creation rates by entrants for each period given in Table 6 shows that job creation rates for the entrants in 20–49 and 50–99 categories are inflated in the first three periods (2003–2004, 2004–2005 and 2005–2006.) and the last (2009–2010). In the remaining periods that cover the years between 2006 and 2009, job creation rates for the entrants in 50–99 category are 7% on average, which are a few percentage points above the mean job creation rates for other groups. Job destruction rates do not show any periodic extreme movements.
3.3. Comparison of job flow rates
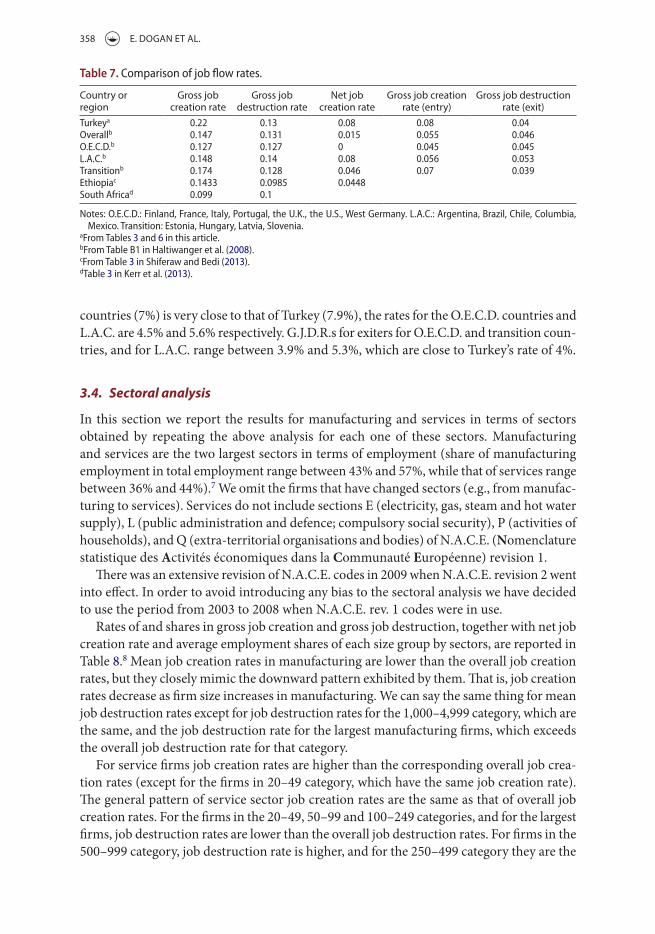
To compare our results (overall job flow rates) to the results reported in the literature for other countries, we use a table similar to the one in Shiferaw and Bedi (2013) (see Table 7). Results reported in the table are compiled from papers indicated in the table. Our results seem closer to those obtained for Latin American countries (L.A.C.; Argentina, Brazil, Chile, Columbia, and Mexico) and for transition countries (Estonia, Hungary, Latvia, and Slovenia). With a 22% gross job creation rate (G.J.C.R.), Tukey leads the other countries; only the G.J.C.R. for transition countries (17.4%) comes close to this rate. Turkey’s gross job destruction rate (G.J.D.R.) of 13% is comparable to ones for selected Organisation for Economic Cooperation and Development (O.E.C.D.) countries (Finland, France, Italy, Portugal, the U.K., the U.S., and West Germany), L.A.C. and transition countries. It is three percentage points higher than G.J.D.R.s in Ethiopia and South Africa. As for net job creation rates (N.J.C.R.s), they are 8% in Turkey and L.A.C., which are both higher than the ones for other countries. G.J.C.R.s and G.J.D.R.s for entrants and exiters are available for only the countries covered in Haltiwanger et al. (2008). G.J.C.R. for entrants in the transition
Table 6. Rates of gross job creation and destruction of entrants and exiters, 2003–2010: all sectors.
source: authors’ calculation.
Size 2003–2004 2004–2005 2005–2006 2006–2007 2007–2008 2008–2009 2009–2010 MeanGross job creation rates (entrants)
20–49 0.21 0.27 0.14 0.05 0.05 0.07 0.36 0.1750–99 0.13 0.21 0.10 0.05 0.05 0.07 0.22 0.12100–249 0.08 0.12 0.06 0.03 0.03 0.04 0.10 0.07250–499 0.06 0.08 0.04 0.02 0.02 0.02 0.04 0.04500–999 0.08 0.06 0.03 0.01 0.01 0.02 0.02 0.031,000–4,999 0.11 0.03 0.02 0.01 0.02 0.00 0.03 0.035,000+ 0.42 0 0 0 0 0.06 0 0.07overall 0.13 0.13 0.07 0.03 0.03 0.04 0.12 0.08
Gross job destruction rates (exiters)20–49 0.03 0.01 0.03 0.03 0.04 0.04 0.06 0.0350–99 0.03 0.03 0.03 0.03 0.03 0.04 0.07 0.04100–249 0.03 0.03 0.03 0.03 0.03 0.03 0.04 0.03250–499 0.03 0.02 0.02 0.02 0.02 0.03 0.02 0.02500–999 0.03 0.01 0.02 0.02 0.02 0.02 0.02 0.021,000–4,999 0.07 0.00 0.01 0.01 0.03 0.00 0.00 0.025,000+ 0.06 0 0 0 0 0.05 0 0.02overall 0.04 0.04 0.04 0.04 0.04 0.04 0.04 0.04
358 E. DOGAN ET AL.
countries (7%) is very close to that of Turkey (7.9%), the rates for the O.E.C.D. countries and L.A.C. are 4.5% and 5.6% respectively. G.J.D.R.s for exiters for O.E.C.D. and transition coun-tries, and for L.A.C. range between 3.9% and 5.3%, which are close to Turkey’s rate of 4%.
3.4. Sectoral analysis
In this section we report the results for manufacturing and services in terms of sectors obtained by repeating the above analysis for each one of these sectors. Manufacturing and services are the two largest sectors in terms of employment (share of manufacturing employment in total employment range between 43% and 57%, while that of services range between 36% and 44%).7 We omit the firms that have changed sectors (e.g., from manufac-turing to services). Services do not include sections E (electricity, gas, steam and hot water supply), L (public administration and defence; compulsory social security), P (activities of households), and Q (extra-territorial organisations and bodies) of N.A.C.E. (Nomenclature statistique des Activités économiques dans la Communauté Européenne) revision 1.
There was an extensive revision of N.A.C.E. codes in 2009 when N.A.C.E. revision 2 went into effect. In order to avoid introducing any bias to the sectoral analysis we have decided to use the period from 2003 to 2008 when N.A.C.E. rev. 1 codes were in use.
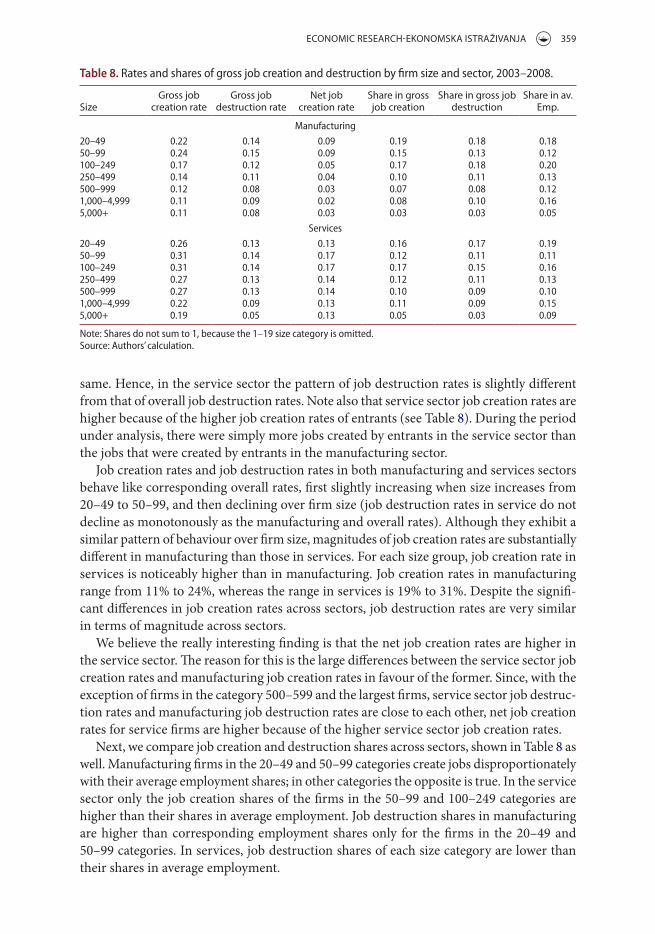
Rates of and shares in gross job creation and gross job destruction, together with net job creation rate and average employment shares of each size group by sectors, are reported in Table 8.8 Mean job creation rates in manufacturing are lower than the overall job creation rates, but they closely mimic the downward pattern exhibited by them. That is, job creation rates decrease as firm size increases in manufacturing. We can say the same thing for mean job destruction rates except for job destruction rates for the 1,000–4,999 category, which are the same, and the job destruction rate for the largest manufacturing firms, which exceeds the overall job destruction rate for that category.
For service firms job creation rates are higher than the corresponding overall job crea-tion rates (except for the firms in 20–49 category, which have the same job creation rate). The general pattern of service sector job creation rates are the same as that of overall job creation rates. For the firms in the 20–49, 50–99 and 100–249 categories, and for the largest firms, job destruction rates are lower than the overall job destruction rates. For firms in the 500–999 category, job destruction rate is higher, and for the 250–499 category they are the
Table 7. comparison of job flow rates.
notes: o.E.c.D.: Finland, France, italy, Portugal, the U.k., the U.s., West Germany. L.a.c.: argentina, Brazil, chile, columbia, mexico. transition: Estonia, hungary, Latvia, slovenia.
aFrom tables 3 and 6 in this article.bFrom table B1 in haltiwanger et al. (2008).cFrom table 3 in shiferaw and Bedi (2013).dtable 3 in kerr et al. (2013).
Country or region
Gross job creation rate
Gross job destruction rate
Net job creation rate
Gross job creation rate (entry)
Gross job destruction rate (exit)
turkeya 0.22 0.13 0.08 0.08 0.04overallb 0.147 0.131 0.015 0.055 0.046o.E.c.D.b 0.127 0.127 0 0.045 0.045L.a.c.b 0.148 0.14 0.08 0.056 0.053transitionb 0.174 0.128 0.046 0.07 0.039Ethiopiac 0.1433 0.0985 0.0448south africad 0.099 0.1
ECONOMIC RESEARCH-EKONOMSKA ISTRAŽIVANJA 359
same. Hence, in the service sector the pattern of job destruction rates is slightly different from that of overall job destruction rates. Note also that service sector job creation rates are higher because of the higher job creation rates of entrants (see Table 8). During the period under analysis, there were simply more jobs created by entrants in the service sector than the jobs that were created by entrants in the manufacturing sector.
Job creation rates and job destruction rates in both manufacturing and services sectors behave like corresponding overall rates, first slightly increasing when size increases from 20–49 to 50–99, and then declining over firm size (job destruction rates in service do not decline as monotonously as the manufacturing and overall rates). Although they exhibit a similar pattern of behaviour over firm size, magnitudes of job creation rates are substantially different in manufacturing than those in services. For each size group, job creation rate in services is noticeably higher than in manufacturing. Job creation rates in manufacturing range from 11% to 24%, whereas the range in services is 19% to 31%. Despite the signifi-cant differences in job creation rates across sectors, job destruction rates are very similar in terms of magnitude across sectors.
We believe the really interesting finding is that the net job creation rates are higher in the service sector. The reason for this is the large differences between the service sector job creation rates and manufacturing job creation rates in favour of the former. Since, with the exception of firms in the category 500–599 and the largest firms, service sector job destruc-tion rates and manufacturing job destruction rates are close to each other, net job creation rates for service firms are higher because of the higher service sector job creation rates.
Next, we compare job creation and destruction shares across sectors, shown in Table 8 as well. Manufacturing firms in the 20–49 and 50–99 categories create jobs disproportionately with their average employment shares; in other categories the opposite is true. In the service sector only the job creation shares of the firms in the 50–99 and 100–249 categories are higher than their shares in average employment. Job destruction shares in manufacturing are higher than corresponding employment shares only for the firms in the 20–49 and 50–99 categories. In services, job destruction shares of each size category are lower than their shares in average employment.
Table 8. Rates and shares of gross job creation and destruction by firm size and sector, 2003–2008.
note: shares do not sum to 1, because the 1–19 size category is omitted.source: authors’ calculation.
SizeGross job
creation rateGross job
destruction rateNet job
creation rateShare in gross job creation
Share in gross job destruction
Share in av. Emp.
manufacturing
20–49 0.22 0.14 0.09 0.19 0.18 0.1850–99 0.24 0.15 0.09 0.15 0.13 0.12100–249 0.17 0.12 0.05 0.17 0.18 0.20250–499 0.14 0.11 0.04 0.10 0.11 0.13500–999 0.12 0.08 0.03 0.07 0.08 0.121,000–4,999 0.11 0.09 0.02 0.08 0.10 0.165,000+ 0.11 0.08 0.03 0.03 0.03 0.05
services
20–49 0.26 0.13 0.13 0.16 0.17 0.1950–99 0.31 0.14 0.17 0.12 0.11 0.11100–249 0.31 0.14 0.17 0.17 0.15 0.16250–499 0.27 0.13 0.14 0.12 0.11 0.13500–999 0.27 0.13 0.14 0.10 0.09 0.101,000–4,999 0.22 0.09 0.13 0.11 0.09 0.155,000+ 0.19 0.05 0.13 0.05 0.03 0.09
360 E. DOGAN ET AL.
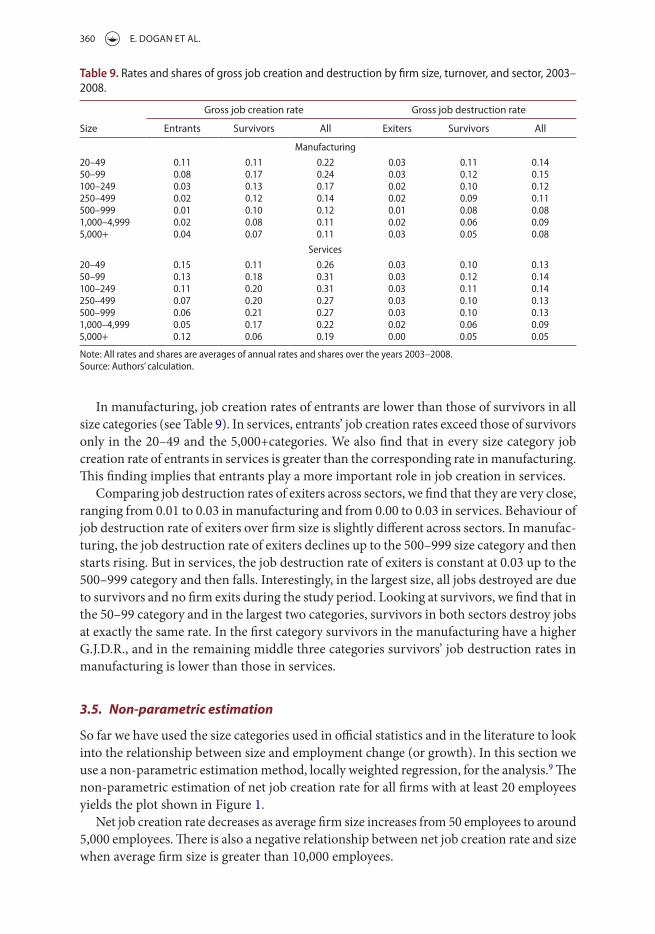
In manufacturing, job creation rates of entrants are lower than those of survivors in all size categories (see Table 9). In services, entrants’ job creation rates exceed those of survivors only in the 20–49 and the 5,000+categories. We also find that in every size category job creation rate of entrants in services is greater than the corresponding rate in manufacturing. This finding implies that entrants play a more important role in job creation in services.
Comparing job destruction rates of exiters across sectors, we find that they are very close, ranging from 0.01 to 0.03 in manufacturing and from 0.00 to 0.03 in services. Behaviour of job destruction rate of exiters over firm size is slightly different across sectors. In manufac-turing, the job destruction rate of exiters declines up to the 500–999 size category and then starts rising. But in services, the job destruction rate of exiters is constant at 0.03 up to the 500–999 category and then falls. Interestingly, in the largest size, all jobs destroyed are due to survivors and no firm exits during the study period. Looking at survivors, we find that in the 50–99 category and in the largest two categories, survivors in both sectors destroy jobs at exactly the same rate. In the first category survivors in the manufacturing have a higher G.J.D.R., and in the remaining middle three categories survivors’ job destruction rates in manufacturing is lower than those in services.
3.5. Non-parametric estimation
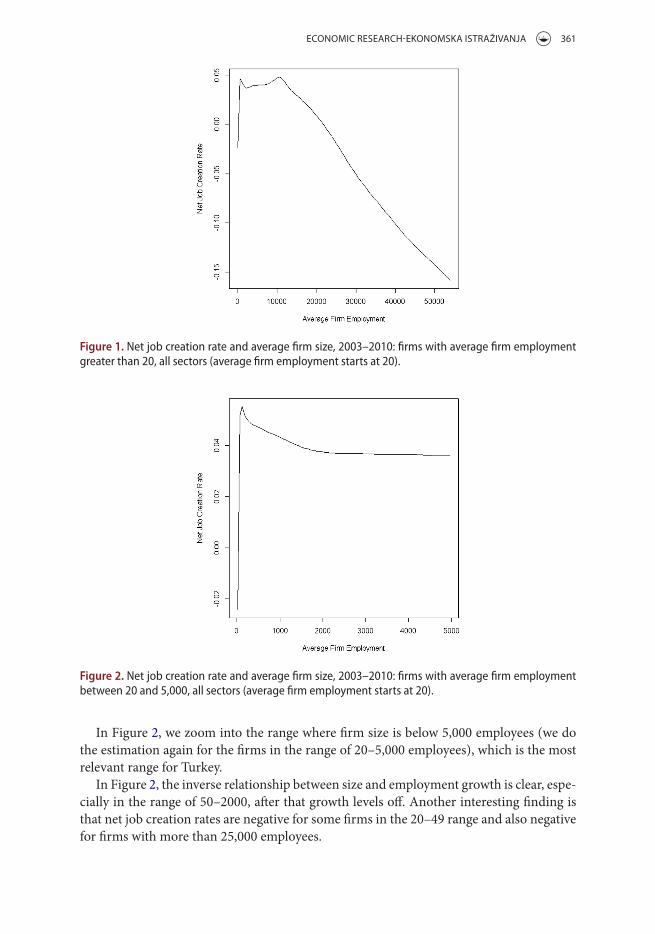
So far we have used the size categories used in official statistics and in the literature to look into the relationship between size and employment change (or growth). In this section we use a non-parametric estimation method, locally weighted regression, for the analysis.9 The non-parametric estimation of net job creation rate for all firms with at least 20 employees yields the plot shown in Figure 1.
Net job creation rate decreases as average firm size increases from 50 employees to around 5,000 employees. There is also a negative relationship between net job creation rate and size when average firm size is greater than 10,000 employees.
Table 9. Rates and shares of gross job creation and destruction by firm size, turnover, and sector, 2003–2008.
note: all rates and shares are averages of annual rates and shares over the years 2003–2008.source: authors’ calculation.
Size
Gross job creation rate Gross job destruction rate
Entrants Survivors All Exiters Survivors All
manufacturing
20–49 0.11 0.11 0.22 0.03 0.11 0.1450–99 0.08 0.17 0.24 0.03 0.12 0.15100–249 0.03 0.13 0.17 0.02 0.10 0.12250–499 0.02 0.12 0.14 0.02 0.09 0.11500–999 0.01 0.10 0.12 0.01 0.08 0.081,000–4,999 0.02 0.08 0.11 0.02 0.06 0.095,000+ 0.04 0.07 0.11 0.03 0.05 0.08
services
20–49 0.15 0.11 0.26 0.03 0.10 0.1350–99 0.13 0.18 0.31 0.03 0.12 0.14100–249 0.11 0.20 0.31 0.03 0.11 0.14250–499 0.07 0.20 0.27 0.03 0.10 0.13500–999 0.06 0.21 0.27 0.03 0.10 0.131,000–4,999 0.05 0.17 0.22 0.02 0.06 0.095,000+ 0.12 0.06 0.19 0.00 0.05 0.05
ECONOMIC RESEARCH-EKONOMSKA ISTRAŽIVANJA 361
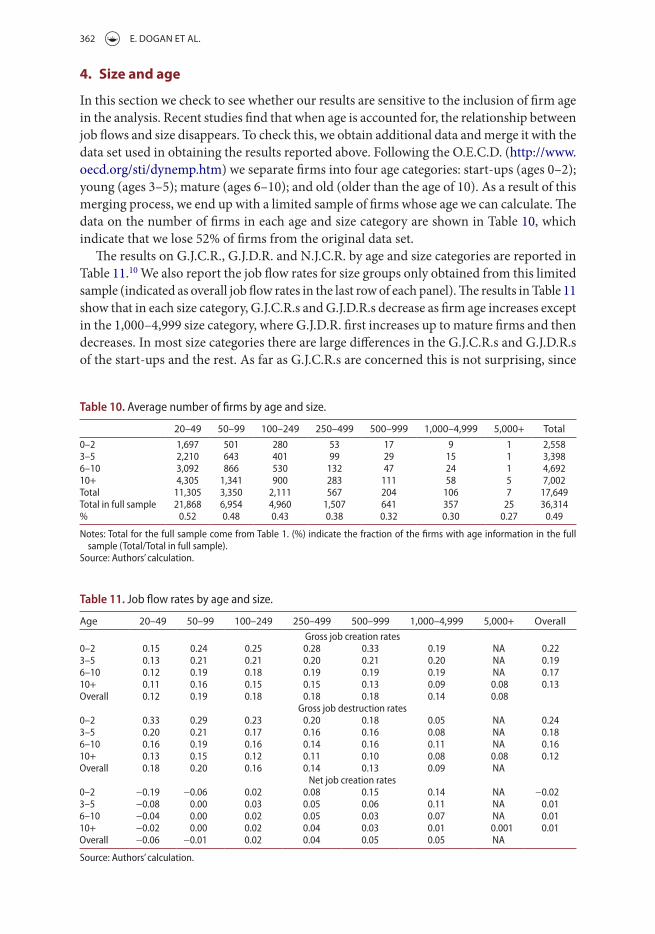
In Figure 2, we zoom into the range where firm size is below 5,000 employees (we do the estimation again for the firms in the range of 20–5,000 employees), which is the most relevant range for Turkey.
In Figure 2, the inverse relationship between size and employment growth is clear, espe-cially in the range of 50–2000, after that growth levels off. Another interesting finding is that net job creation rates are negative for some firms in the 20–49 range and also negative for firms with more than 25,000 employees.
Figure 1. net job creation rate and average firm size, 2003–2010: firms with average firm employment greater than 20, all sectors (average firm employment starts at 20).
Figure 2. net job creation rate and average firm size, 2003–2010: firms with average firm employment between 20 and 5,000, all sectors (average firm employment starts at 20).
362 E. DOGAN ET AL.
4. Size and age
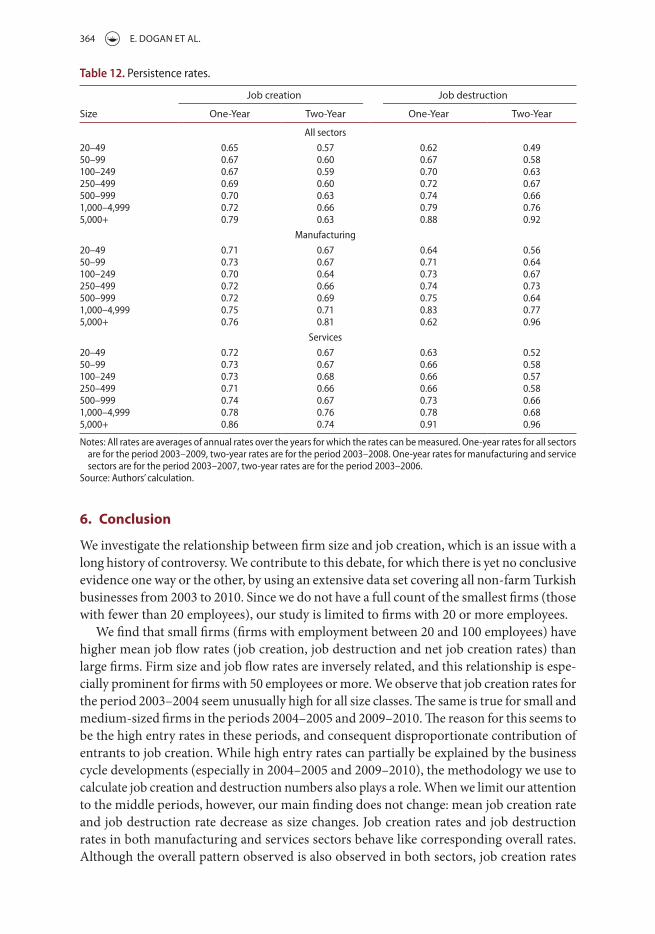
In this section we check to see whether our results are sensitive to the inclusion of firm age in the analysis. Recent studies find that when age is accounted for, the relationship between job flows and size disappears. To check this, we obtain additional data and merge it with the data set used in obtaining the results reported above. Following the O.E.C.D. (http://www.oecd.org/sti/dynemp.htm) we separate firms into four age categories: start-ups (ages 0–2); young (ages 3–5); mature (ages 6–10); and old (older than the age of 10). As a result of this merging process, we end up with a limited sample of firms whose age we can calculate. The data on the number of firms in each age and size category are shown in Table 10, which indicate that we lose 52% of firms from the original data set.
The results on G.J.C.R., G.J.D.R. and N.J.C.R. by age and size categories are reported in Table 11.10 We also report the job flow rates for size groups only obtained from this limited sample (indicated as overall job flow rates in the last row of each panel). The results in Table 11 show that in each size category, G.J.C.R.s and G.J.D.R.s decrease as firm age increases except in the 1,000–4,999 size category, where G.J.D.R. first increases up to mature firms and then decreases. In most size categories there are large differences in the G.J.C.R.s and G.J.D.R.s of the start-ups and the rest. As far as G.J.C.R.s are concerned this is not surprising, since
Table 10. average number of firms by age and size.
notes: total for the full sample come from table 1. (%) indicate the fraction of the firms with age information in the full sample (total/total in full sample).
source: authors’ calculation.
20–49 50–99 100–249 250–499 500–999 1,000–4,999 5,000+ Total0–2 1,697 501 280 53 17 9 1 2,5583–5 2,210 643 401 99 29 15 1 3,3986–10 3,092 866 530 132 47 24 1 4,69210+ 4,305 1,341 900 283 111 58 5 7,002total 11,305 3,350 2,111 567 204 106 7 17,649total in full sample 21,868 6,954 4,960 1,507 641 357 25 36,314% 0.52 0.48 0.43 0.38 0.32 0.30 0.27 0.49
Table 11. job flow rates by age and size.
source: authors’ calculation.
Age 20–49 50–99 100–249 250–499 500–999 1,000–4,999 5,000+ OverallGross job creation rates
0–2 0.15 0.24 0.25 0.28 0.33 0.19 na 0.223–5 0.13 0.21 0.21 0.20 0.21 0.20 na 0.196–10 0.12 0.19 0.18 0.19 0.19 0.19 na 0.1710+ 0.11 0.16 0.15 0.15 0.13 0.09 0.08 0.13overall 0.12 0.19 0.18 0.18 0.18 0.14 0.08
Gross job destruction rates0–2 0.33 0.29 0.23 0.20 0.18 0.05 na 0.243–5 0.20 0.21 0.17 0.16 0.16 0.08 na 0.186–10 0.16 0.19 0.16 0.14 0.16 0.11 na 0.1610+ 0.13 0.15 0.12 0.11 0.10 0.08 0.08 0.12overall 0.18 0.20 0.16 0.14 0.13 0.09 na
net job creation rates0–2 −0.19 −0.06 0.02 0.08 0.15 0.14 na −0.023–5 −0.08 0.00 0.03 0.05 0.06 0.11 na 0.016–10 −0.04 0.00 0.02 0.05 0.03 0.07 na 0.0110+ −0.02 0.00 0.02 0.04 0.03 0.01 0.001 0.01overall −0.06 −0.01 0.02 0.04 0.05 0.05 na

ECONOMIC RESEARCH-EKONOMSKA ISTRAŽIVANJA 363
entrants, whose G.J.C.R.s should be very high, are included in the first age category. For instance, G.J.C.R.s of the start-ups with 500–999 employees and G.J.D.R.s of the start-ups with 20–49 employees are 33%, while that of the old firms are 13%.
The results also show that for a given age category G.J.C.R.s increase and G.J.D.R.s decrease as size increase. Hence, N.J.C.R.s increase as size increases in each age category. This also means that size still matters because, even when age is controlled for, there is still a relationship between size and the job flow rates.
Notice also that as size increases overall, N.J.C.R. increases, which is the opposite of what we find by using the full sample (see Table 2). This may be due to those large firms with very low N.J.C.R. being left out for lack of age information.
5. Persistence
It would be interesting to examine the persistence of jobs created or destroyed, especially for policy purposes. We track persistency of job flows by calculating the percentage of jobs out of the number of jobs created or destructed initially that remain in place or that does not reappear in each subsequent period. This definition is in accordance with the one in Davis et al. (1996a, p. 22). More formally, let cit = eit – eit–1 and cit+1 = eit+1 – eit be the number of jobs created by all firms in size i in periods t and t+1 respectively, then
all of the jobs created between period t–1 and period t (cit) persists in period t+1 if cit+1 ≥ 0 (persistence rate is 1 or 100%),
none of the jobs created between period t–1 and period t (cit) persists in period t+1 if cit+1 < 0 and (cit + cit+1) ≤ 0,
(cit+1 + cit) of the jobs created between period t–1 and period t (cit) persists in period t+1 if cit+1 < 0 and (cit + cit+1) > 0 (persistence rate is (cit + cit+1)/cit)).
This can be illustrated as follows for job creation. Suppose that a firm increases its employ-ment from 100 in year t to 120 in year t+1. The number of jobs created in year t+1 would be 20. If this firm’s employment decreases to 110 in year t+2 and to 100 in year t+3, one-year and two-year persistence rates are 50% and 0%, subsequently. If, on the other hand, employment decreases to 105 in year t+3, two-year persistence rate will be 25%. If the year t+3 employment increases to 120, two-year persistence rate will be 50%.
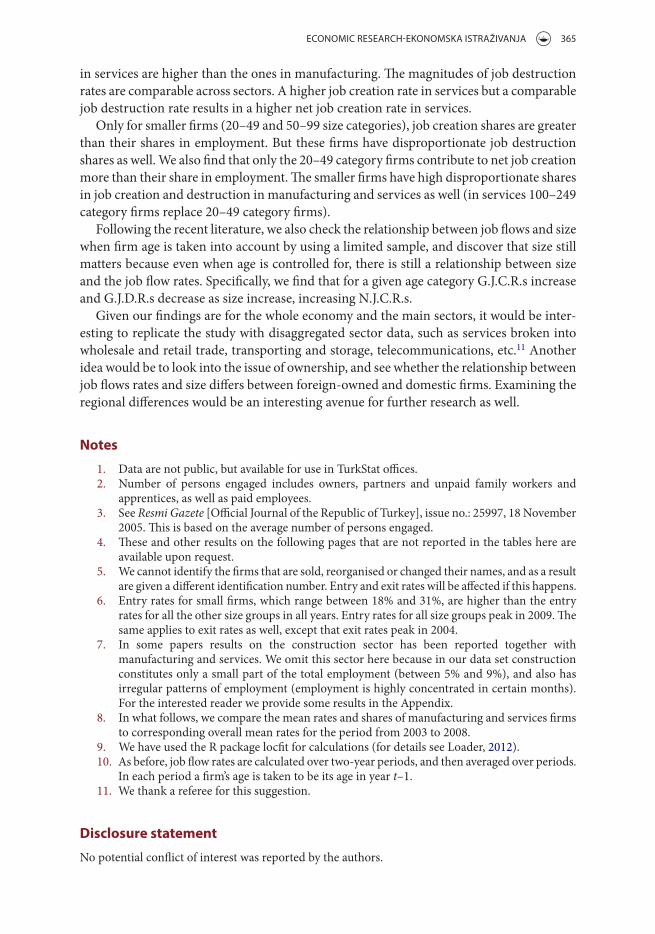
The results given in Table 12 show that newly created jobs are more likely to survive one or two periods the larger the firm is. The same is true for the job destruction rates. Newly created jobs at small firms that have more than 20 but fewer than 50 employees are less likely to survive one or two periods than those created at the largest firms. While 57% of jobs created by small firms (firms in the 20–49 category) persist for two years, 63% of those created by the largest firms do so. Persistence rates of jobs destructed for the largest firms are also higher than those of small firms. Two-year persistence rate of jobs destructed is 92% at the largest firms compared to 49% at small firms. Note also that only the firms in the 20–49 and 50–99 categories have job creation persistence rates greater than the job destruction persistence rates.
Persistence rates for job creation in the service sector are higher than those that are in the manufacturing sector for most size groups. Persistence rates for job destruction in the service sector are generally lower than those in the manufacturing sector. In both sectors larger firms have higher persistence rates than the firms in the 20–49 and 50–99 categories.
364 E. DOGAN ET AL.
6. Conclusion
We investigate the relationship between firm size and job creation, which is an issue with a long history of controversy. We contribute to this debate, for which there is yet no conclusive evidence one way or the other, by using an extensive data set covering all non-farm Turkish businesses from 2003 to 2010. Since we do not have a full count of the smallest firms (those with fewer than 20 employees), our study is limited to firms with 20 or more employees.
We find that small firms (firms with employment between 20 and 100 employees) have higher mean job flow rates (job creation, job destruction and net job creation rates) than large firms. Firm size and job flow rates are inversely related, and this relationship is espe-cially prominent for firms with 50 employees or more. We observe that job creation rates for the period 2003–2004 seem unusually high for all size classes. The same is true for small and medium-sized firms in the periods 2004–2005 and 2009–2010. The reason for this seems to be the high entry rates in these periods, and consequent disproportionate contribution of entrants to job creation. While high entry rates can partially be explained by the business cycle developments (especially in 2004–2005 and 2009–2010), the methodology we use to calculate job creation and destruction numbers also plays a role. When we limit our attention to the middle periods, however, our main finding does not change: mean job creation rate and job destruction rate decrease as size changes. Job creation rates and job destruction rates in both manufacturing and services sectors behave like corresponding overall rates. Although the overall pattern observed is also observed in both sectors, job creation rates
Table 12. Persistence rates.
notes: all rates are averages of annual rates over the years for which the rates can be measured. one-year rates for all sectors are for the period 2003–2009, two-year rates are for the period 2003–2008. one-year rates for manufacturing and service sectors are for the period 2003–2007, two-year rates are for the period 2003–2006.
source: authors’ calculation.
Size
Job creation Job destruction
One-Year Two-Year One-Year Two-Year
all sectors
20–49 0.65 0.57 0.62 0.4950–99 0.67 0.60 0.67 0.58100–249 0.67 0.59 0.70 0.63250–499 0.69 0.60 0.72 0.67500–999 0.70 0.63 0.74 0.661,000–4,999 0.72 0.66 0.79 0.765,000+ 0.79 0.63 0.88 0.92
manufacturing
20–49 0.71 0.67 0.64 0.5650–99 0.73 0.67 0.71 0.64100–249 0.70 0.64 0.73 0.67250–499 0.72 0.66 0.74 0.73500–999 0.72 0.69 0.75 0.641,000–4,999 0.75 0.71 0.83 0.775,000+ 0.76 0.81 0.62 0.96
services
20–49 0.72 0.67 0.63 0.5250–99 0.73 0.67 0.66 0.58100–249 0.73 0.68 0.66 0.57250–499 0.71 0.66 0.66 0.58500–999 0.74 0.67 0.73 0.661,000–4,999 0.78 0.76 0.78 0.685,000+ 0.86 0.74 0.91 0.96
ECONOMIC RESEARCH-EKONOMSKA ISTRAŽIVANJA 365
in services are higher than the ones in manufacturing. The magnitudes of job destruction rates are comparable across sectors. A higher job creation rate in services but a comparable job destruction rate results in a higher net job creation rate in services.
Only for smaller firms (20–49 and 50–99 size categories), job creation shares are greater than their shares in employment. But these firms have disproportionate job destruction shares as well. We also find that only the 20–49 category firms contribute to net job creation more than their share in employment. The smaller firms have high disproportionate shares in job creation and destruction in manufacturing and services as well (in services 100–249 category firms replace 20–49 category firms).
Following the recent literature, we also check the relationship between job flows and size when firm age is taken into account by using a limited sample, and discover that size still matters because even when age is controlled for, there is still a relationship between size and the job flow rates. Specifically, we find that for a given age category G.J.C.R.s increase and G.J.D.R.s decrease as size increase, increasing N.J.C.R.s.
Given our findings are for the whole economy and the main sectors, it would be inter-esting to replicate the study with disaggregated sector data, such as services broken into wholesale and retail trade, transporting and storage, telecommunications, etc.11 Another idea would be to look into the issue of ownership, and see whether the relationship between job flows rates and size differs between foreign-owned and domestic firms. Examining the regional differences would be an interesting avenue for further research as well.
Notes
1. Data are not public, but available for use in TurkStat offices.2. Number of persons engaged includes owners, partners and unpaid family workers and
apprentices, as well as paid employees.3. See Resmi Gazete [Official Journal of the Republic of Turkey], issue no.: 25997, 18 November
2005. This is based on the average number of persons engaged.4. These and other results on the following pages that are not reported in the tables here are
available upon request.5. We cannot identify the firms that are sold, reorganised or changed their names, and as a result
are given a different identification number. Entry and exit rates will be affected if this happens.6. Entry rates for small firms, which range between 18% and 31%, are higher than the entry
rates for all the other size groups in all years. Entry rates for all size groups peak in 2009. The same applies to exit rates as well, except that exit rates peak in 2004.
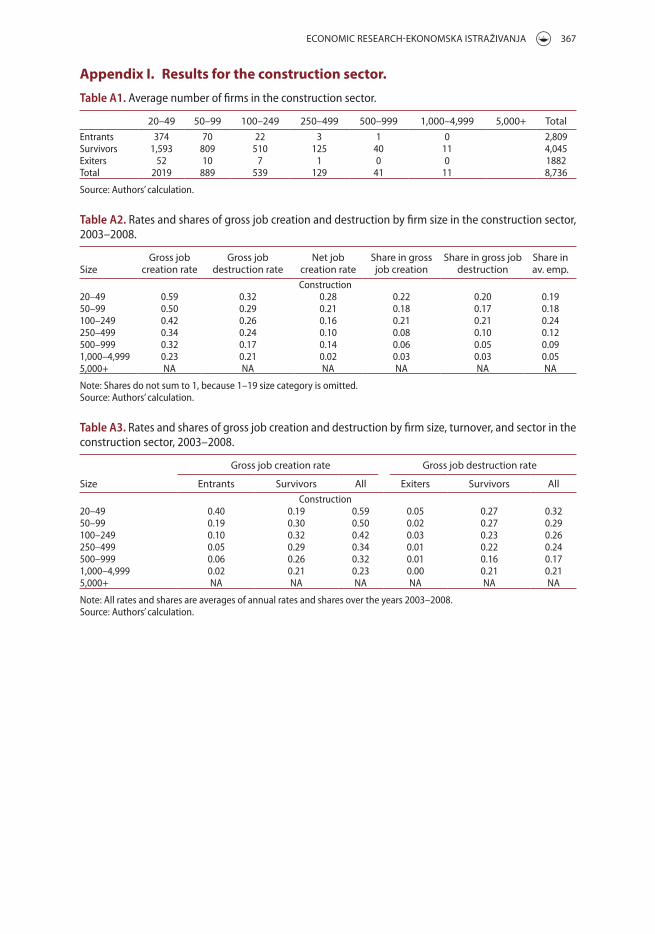
7. In some papers results on the construction sector has been reported together with manufacturing and services. We omit this sector here because in our data set construction constitutes only a small part of the total employment (between 5% and 9%), and also has irregular patterns of employment (employment is highly concentrated in certain months). For the interested reader we provide some results in the Appendix.
8. In what follows, we compare the mean rates and shares of manufacturing and services firms to corresponding overall mean rates for the period from 2003 to 2008.
9. We have used the R package locfit for calculations (for details see Loader, 2012).10. As before, job flow rates are calculated over two-year periods, and then averaged over periods.
In each period a firm’s age is taken to be its age in year t–1.11. We thank a referee for this suggestion.
Disclosure statement
No potential conflict of interest was reported by the authors.
366 E. DOGAN ET AL.
References
Birch, D. L. (1979). The job generation process. Unpublished report. Washington, DC: MIT Program on Neighbourhood and Regional Change for the Economic Development Administration, U.S. Department of Commerce.
Birch, D. L. (1981). Who creates jobs? Public Interest, 65, 3–14.Birch, D. L. (1987). Job creation in America: How our smallest companies put the most people to work.
New York, NY: Free Press.Broersma, L., & Gautier, P. (1997). Job creation and job destruction by small firms: An empirical
investigation for the Dutch manufacturing sector. Small Business Economics, 9, 211–224.Davis, S. J., & Haltiwanger, J. (1992). Gross job creation, gross job destruction, and employment
reallocation. The Quarterly Journal of Economics, 107, 819–863.Davis, S. J., Haltiwanger, J., & Schuh, S. (1996a). Job creation and destruction. Cambridge, MA: MIT
Press.Davis, S. J., Haltiwanger, J., & Schuh, S. (1996b). Small business and job creation: Dissecting the myth
and reassessing the facts. Small Business Economics, 8, 297–315.Haltiwanger, J., Jarmin, R. S., & Miranda, J. (2013). Who creates jobs? Small versus large versus young.
Review of Economics and Statistics, 95, 347–361.Haltiwanger, J., Scarpetta, S., & Schweiger, H. (2008). Assessing job flows across countries: The role
of industry, firm size and regulations (NBER Working Paper No. 13920). Cambridge, MA: The National Bureau of Economic Research (N.B.E.R.).
Hijzen, A., Upward, R., & Wright, P. W. (2010). Job creation, job destruction and the role of small firms: Firm-level evidence for the UK. Oxford Bulletin of Economics and Statistics, 72, 621–647.
Hohti, S. (2000). Job flows and job quality by establishment size in the Finnish manufacturing sector 1980–94. Small Business Economics, 15, 265–281.
Juniper, J., Mitchell, W. F., & Myers, J. (2004, December). Small business employment dynamics in Australia. The Full Employment Imperative, Proceedings of the 6th Path to Full Employment Conference/11th National Conference on Unemployment, University of Newcastle.
Kerr, A., Wittenberg, M., & Arrow, J. (2013). Job creation and destruction in South Africa. Unpublished manuscript. Retrieved from http://www.opensaldru.uct.ac.za/handle/11090
Loader, C. (2012). Locfit: Local regression, likelihood and density estimation (R package version 1.5-8). http://CRAN.R-project.org/package=locfit
Neumark, D., Wall, B., & Zhang, J. (2011). Do small businesses create more jobs? New evidence for the Unites States from the national establishment time series. Review of Economics and Statistics, 93, 16–29.
Rijkers, B., Arouri, H., Freund, C., & Nucifora, A. (2014). Which firms create the most jobs in developing countries? Evidence from Tunisia. Labour Economics, 31, 84–102.
Shiferaw, A., & Bedi, A. S. (2013). The dynamics of job creation and job destruction in an African Economy: Evidence from Ethiopia. Journal of African Economies, 22, 651–692.
Voulgaris, F., Papadogonas, T., & Agiomirgianakis, G. (2005). Job creation and job destruction in Greek Manufacturing. Review of Development Economics, 9, 289–301.
ECONOMIC RESEARCH-EKONOMSKA ISTRAŽIVANJA 367
Appendix I. Results for the construction sector.
Table A1. average number of firms in the construction sector.
20–49 50–99 100–249 250–499 500–999 1,000–4,999 5,000+ TotalEntrants 374 70 22 3 1 0 2,809survivors 1,593 809 510 125 40 11 4,045Exiters 52 10 7 1 0 0 1882total 2019 889 539 129 41 11 8,736
source: authors’ calculation.
Table A2. Rates and shares of gross job creation and destruction by firm size in the construction sector, 2003–2008.
SizeGross job
creation rateGross job
destruction rateNet job
creation rateShare in gross job creation
Share in gross job destruction
Share in av. emp.
construction20–49 0.59 0.32 0.28 0.22 0.20 0.1950–99 0.50 0.29 0.21 0.18 0.17 0.18100–249 0.42 0.26 0.16 0.21 0.21 0.24250–499 0.34 0.24 0.10 0.08 0.10 0.12500–999 0.32 0.17 0.14 0.06 0.05 0.091,000–4,999 0.23 0.21 0.02 0.03 0.03 0.055,000+ na na na na na na
note: shares do not sum to 1, because 1–19 size category is omitted.source: authors’ calculation.
Table A3. Rates and shares of gross job creation and destruction by firm size, turnover, and sector in the construction sector, 2003–2008.
Size
Gross job creation rate Gross job destruction rate
Entrants Survivors All Exiters Survivors Allconstruction
20–49 0.40 0.19 0.59 0.05 0.27 0.3250–99 0.19 0.30 0.50 0.02 0.27 0.29100–249 0.10 0.32 0.42 0.03 0.23 0.26250–499 0.05 0.29 0.34 0.01 0.22 0.24500–999 0.06 0.26 0.32 0.01 0.16 0.171,000–4,999 0.02 0.21 0.23 0.00 0.21 0.215,000+ na na na na na na
note: all rates and shares are averages of annual rates and shares over the years 2003–2008.source: authors’ calculation.