Firearm Homicides and Suicides in Major Metropolitan · PDF fileearlier report* that provided...
20
INSIDE 603 Mycoplasma pneumoniae Outbreak at a University — Georgia, 2012 607 Vaccination Coverage Among Children in Kindergarten — United States, 2012–13 School Year 613 Notes from the Field: Use of Electronic Messaging and the News Media to Increase Case Finding During a Cyclospora Outbreak — Iowa, July 2013 615 QuickStats Continuing Education examination available at http://www.cdc.gov/mmwr/cme/conted_info.html#weekly. U.S. Department of Health and Human Services Centers for Disease Control and Prevention Morbidity and Mortality Weekly Report Weekly / Vol. 62 / No. 30 August 2, 2013 Firearm homicides and suicides are a continuing public health concern in the United States. During 2009–2010, a total of 22,571 firearm homicides and 38,126 firearm sui- cides occurred among U.S. residents (1). This includes 3,397 firearm homicides and 1,548 firearm suicides among persons aged 10–19 years; the firearm homicide rate for this age group was slightly above the all-ages rate. This report updates an earlier report* that provided statistics on firearm homicides and suicides in major metropolitan areas for 2006–2007, with special emphasis on persons aged 10–19 years in recognition of the importance of early prevention efforts. Firearm homicide and suicide rates were calculated for the 50 most populous U.S. metropolitan statistical areas (MSAs) † for 2009–2010 using mortality data from the National Vital Statistics System (NVSS) and population data from the U.S. Census Bureau. Comparison statistics were recalculated for 2006–2007 to reflect revisions to MSA delineations and population estimates subsequent to the earlier report. Although the firearm homicide rate for large MSAs collectively remained above the national rate during 2009–2010, more than 75% of these MSAs showed a decreased rate from 2006–2007, largely accounting for a national decrease. The firearm homicide rate for persons aged 10–19 years exceeded the all-ages rate in many of these MSAs during 2009–2010, similar to the earlier reporting period. Conversely, although the firearm suicide rate for large MSAs collectively remained below the national rate during 2009–2010, nearly 75% of these MSAs showed an increased rate from 2006–2007, paralleling the national trend. Firearm suicide rates among persons aged 10–19 years were low com- pared with all-ages rates during both periods. These patterns can inform the development and monitoring of strategies directed at reducing firearm-related violence. NVSS mortality data for 2006–2007 and 2009–2010 (the most recent available) were used to identify deaths attributed to firearm homicides (International Classification of Diseases, 10th Revision [ICD-10] underlying cause codes X93–X95 and U01.4 [provisional]) and firearm suicides (codes X72–X74) among U.S. residents. Firearm homicide and suicide counts were tabulated for county groupings forming the 50 larg- est MSAs (by population rank mid-year 2010). § Tabulated counts were integrated with U.S. Census Bureau population estimates for the counties forming these MSAs to calculate annual firearm homicide and suicide rates for persons of all ages (excluding those aged <10 years for suicides because intent for self-harm typically is not attributed to young children). Rates were calculated similarly for persons aged 10–19 years. All-ages rates were age-adjusted to the year 2000 U.S. standard. MSA- level data involving firearm homicide or suicide counts <20 are not reported separately because of concerns about statistical stability and data privacy. However, such data were included in the calculations for all MSAs combined. * Available at http://www.cdc.gov/mmwr/pdf/wk/mm6018.pdf. † An MSA is defined by the U.S. Office of Management and Budget (OMB) as “a core area containing a substantial population nucleus, together with adjacent communities.” This report is based on the revised geographic delineations for MSAs issued by OMB in February 2013. § The same MSAs were the 50 most populous during both reporting periods; rankings by total population changed slightly. Firearm Homicides and Suicides in Major Metropolitan Areas — United States, 2006–2007 and 2009–2010
Transcript of Firearm Homicides and Suicides in Major Metropolitan · PDF fileearlier report* that provided...
INSIDE603 Mycoplasma pneumoniae Outbreak at a University —
Georgia, 2012607 Vaccination Coverage Among Children in
Kindergarten — United States, 2012–13 School Year613 Notes from the Field: Use of Electronic Messaging
and the News Media to Increase Case Finding During a Cyclospora Outbreak — Iowa, July 2013
615 QuickStats
Continuing Education examination available at http://www.cdc.gov/mmwr/cme/conted_info.html#weekly.
U.S. Department of Health and Human ServicesCenters for Disease Control and Prevention
Morbidity and Mortality Weekly ReportWeekly / Vol. 62 / No. 30 August 2, 2013
Firearm homicides and suicides are a continuing public health concern in the United States. During 2009–2010, a total of 22,571 firearm homicides and 38,126 firearm sui-cides occurred among U.S. residents (1). This includes 3,397 firearm homicides and 1,548 firearm suicides among persons aged 10–19 years; the firearm homicide rate for this age group was slightly above the all-ages rate. This report updates an earlier report* that provided statistics on firearm homicides and suicides in major metropolitan areas for 2006–2007, with special emphasis on persons aged 10–19 years in recognition of the importance of early prevention efforts. Firearm homicide and suicide rates were calculated for the 50 most populous U.S. metropolitan statistical areas (MSAs)† for 2009–2010 using mortality data from the National Vital Statistics System (NVSS) and population data from the U.S. Census Bureau. Comparison statistics were recalculated for 2006–2007 to reflect revisions to MSA delineations and population estimates subsequent to the earlier report. Although the firearm homicide rate for large MSAs collectively remained above the national rate during 2009–2010, more than 75% of these MSAs showed a decreased rate from 2006–2007, largely accounting for a national decrease. The firearm homicide rate for persons aged 10–19 years exceeded the all-ages rate in many of these MSAs during 2009–2010, similar to the earlier reporting period. Conversely, although the firearm suicide rate for large MSAs collectively remained below the national rate during 2009–2010, nearly 75% of these MSAs showed an increased rate from 2006–2007, paralleling the national trend. Firearm suicide rates among persons aged 10–19 years were low com-pared with all-ages rates during both periods. These patterns can inform the development and monitoring of strategies directed at reducing firearm-related violence.
NVSS mortality data for 2006–2007 and 2009–2010 (the most recent available) were used to identify deaths attributed to firearm homicides (International Classification of Diseases, 10th Revision [ICD-10] underlying cause codes X93–X95 and U01.4 [provisional]) and firearm suicides (codes X72–X74) among U.S. residents. Firearm homicide and suicide counts were tabulated for county groupings forming the 50 larg-est MSAs (by population rank mid-year 2010).§ Tabulated counts were integrated with U.S. Census Bureau population estimates for the counties forming these MSAs to calculate annual firearm homicide and suicide rates for persons of all ages (excluding those aged <10 years for suicides because intent for self-harm typically is not attributed to young children). Rates were calculated similarly for persons aged 10–19 years. All-ages rates were age-adjusted to the year 2000 U.S. standard. MSA-level data involving firearm homicide or suicide counts <20 are not reported separately because of concerns about statistical stability and data privacy. However, such data were included in the calculations for all MSAs combined.
* Available at http://www.cdc.gov/mmwr/pdf/wk/mm6018.pdf.† An MSA is defined by the U.S. Office of Management and Budget (OMB) as
“a core area containing a substantial population nucleus, together with adjacent communities.” This report is based on the revised geographic delineations for MSAs issued by OMB in February 2013.
§ The same MSAs were the 50 most populous during both reporting periods; rankings by total population changed slightly.
Firearm Homicides and Suicides in Major Metropolitan Areas — United States, 2006–2007 and 2009–2010
Morbidity and Mortality Weekly Report
598 MMWR / August 2, 2013 / Vol. 62 / No. 30
The MMWR series of publications is published by the Office of Surveillance, Epidemiology, and Laboratory Services, Centers for Disease Control and Prevention (CDC), U.S. Department of Health and Human Services, Atlanta, GA 30333.Suggested citation: Centers for Disease Control and Prevention. [Article title]. MMWR 2013;62:[inclusive page numbers].
Centers for Disease Control and PreventionThomas R. Frieden, MD, MPH, Director
Harold W. Jaffe, MD, MA, Associate Director for ScienceJames W. Stephens, PhD, Director, Office of Science Quality
Denise M. Cardo, MD, Acting Deputy Director for Surveillance, Epidemiology, and Laboratory ServicesStephanie Zaza, MD, MPH, Director, Epidemiology and Analysis Program Office
MMWR Editorial and Production StaffRonald L. Moolenaar, MD, MPH, Editor, MMWR Series
John S. Moran, MD, MPH, Deputy Editor, MMWR SeriesTeresa F. Rutledge, Managing Editor, MMWR Series
Douglas W. Weatherwax, Lead Technical Writer-EditorDonald G. Meadows, MA, Jude C. Rutledge, Writer-Editors
Martha F. Boyd, Lead Visual Information Specialist
Maureen A. Leahy, Julia C. Martinroe, Stephen R. Spriggs, Terraye M. Starr
Visual Information SpecialistsQuang M. Doan, MBA, Phyllis H. King
Information Technology Specialists
MMWR Editorial BoardWilliam L. Roper, MD, MPH, Chapel Hill, NC, Chairman
Matthew L. Boulton, MD, MPH, Ann Arbor, MIVirginia A. Caine, MD, Indianapolis, INBarbara A. Ellis, PhD, MS, Atlanta, GA
Jonathan E. Fielding, MD, MPH, MBA, Los Angeles, CADavid W. Fleming, MD, Seattle, WA
William E. Halperin, MD, DrPH, MPH, Newark, NJKing K. Holmes, MD, PhD, Seattle, WA
Timothy F. Jones, MD, Nashville, TNRima F. Khabbaz, MD, Atlanta, GADennis G. Maki, MD, Madison, WI
Patricia Quinlisk, MD, MPH, Des Moines, IAPatrick L. Remington, MD, MPH, Madison, WI
John V. Rullan, MD, MPH, San Juan, PRWilliam Schaffner, MD, Nashville, TN
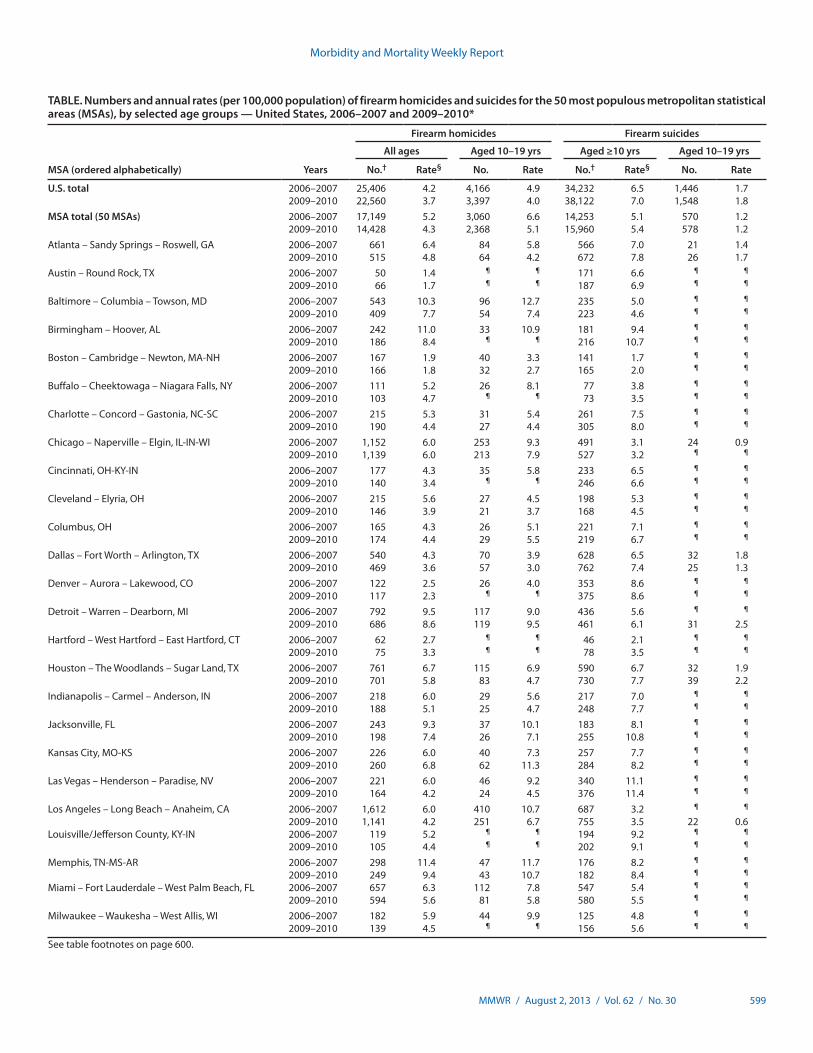
All-ages firearm homicide rates during 2009–2010 varied widely by MSA, ranging from 1.1 to 19.0 per 100,000 residents per year (Table). The rate for all MSAs combined was 4.3, compared with a national rate of 3.7. This represents a decrease from 2006–2007, when the combined MSA rate was 5.2 and the national rate was 4.2. Firearm homicide rates decreased for 78% of MSAs (39 of 50) across reporting periods, accounting for most of the national decrease. The firearm homicide rate among persons aged 10–19 years for the MSAs collectively was 5.1 during 2009–2010. This also reflects a decrease from 2006–2007, when the combined MSA rate for persons aged 10–19 years was 6.6. Rates for this age group exceeded all-ages rates in 72% of MSAs during 2009–2010 (23 of 32 MSAs with reportable youth firearm homicide statistics), comparable to the percentage observed for the earlier period. Males accounted for approximately 85% of firearm homicide victims (all ages) during both reporting periods, for all MSAs combined as well as nationally.
All-ages firearm suicide rates during 2009–2010 also var-ied widely by MSA, ranging from 1.6 to 11.4 (Table). The combined MSA rate was 5.4, compared with a national rate of 7.0. This represents an increase from 2006–2007, when the combined MSA rate was 5.1 and the national rate was 6.5. Across reporting periods, firearm suicide rates increased for 74% of MSAs (37 of 50), mirroring the national trend. Firearm suicide rates among persons aged 10–19 years were low compared with all-ages rates; the combined MSA rate for this age group was 1.2 during both reporting periods. Males
represented approximately 87% of firearm suicides (all ages) in both reporting periods for all MSAs combined and nationally.
Reported by
Scott R. Kegler, PhD, Div of Analysis, Research, and Practice Integration; James A. Mercy, PhD, Div of Violence Prevention, National Center for Injury Prevention and Control, CDC. Corresponding contributor: Scott R. Kegler, [email protected], 770-488-3830.
Editorial Note
During 2009–2010, homicide was the 15th leading cause of death (all ages) in the United States and the second leading cause among persons aged 10–19 years; a firearm injury was the underlying cause in 68% of all homicides and in 83% of homicides among youths (1). The findings in this report show that despite declining firearm homicide rates in most large met-ropolitan areas, rates collectively remained higher in these areas compared with the United States overall. Residents of the 50 largest MSAs represented 54% of the U.S. population during 2009–2010 (unchanged from 2006–2007) but accounted for 64% of firearm homicide victims nationally (somewhat below the percentage for 2006–2007). These MSAs accounted for 70% of the national firearm homicide total (2,368 of 3,397) among persons aged 10–19 years.
Concurrently, suicide was the 10th leading cause of death (all ages) nationally and the third leading cause for persons aged 10–19 years; a firearm injury was the underlying cause in
Morbidity and Mortality Weekly Report
MMWR / August 2, 2013 / Vol. 62 / No. 30 599
TABLE. Numbers and annual rates (per 100,000 population) of firearm homicides and suicides for the 50 most populous metropolitan statistical areas (MSAs), by selected age groups — United States, 2006–2007 and 2009–2010*
MSA (ordered alphabetically) Years
Firearm homicides Firearm suicides
All ages Aged 10–19 yrs Aged ≥10 yrs Aged 10–19 yrs
No.† Rate§ No. Rate No.† Rate§ No. Rate
U.S. total 2006–2007 25,406 4.2 4,166 4.9 34,232 6.5 1,446 1.72009–2010 22,560 3.7 3,397 4.0 38,122 7.0 1,548 1.8
MSA total (50 MSAs) 2006–2007 17,149 5.2 3,060 6.6 14,253 5.1 570 1.22009–2010 14,428 4.3 2,368 5.1 15,960 5.4 578 1.2
Atlanta – Sandy Springs – Roswell, GA 2006–2007 661 6.4 84 5.8 566 7.0 21 1.42009–2010 515 4.8 64 4.2 672 7.8 26 1.7
Austin – Round Rock, TX 2006–2007 50 1.4 ¶ ¶ 171 6.6 ¶ ¶
2009–2010 66 1.7 ¶ ¶ 187 6.9 ¶ ¶
Baltimore – Columbia – Towson, MD 2006–2007 543 10.3 96 12.7 235 5.0 ¶ ¶
2009–2010 409 7.7 54 7.4 223 4.6 ¶ ¶
Birmingham – Hoover, AL 2006–2007 242 11.0 33 10.9 181 9.4 ¶ ¶
2009–2010 186 8.4 ¶ ¶ 216 10.7 ¶ ¶
Boston – Cambridge – Newton, MA-NH 2006–2007 167 1.9 40 3.3 141 1.7 ¶ ¶
2009–2010 166 1.8 32 2.7 165 2.0 ¶ ¶
Buffalo – Cheektowaga – Niagara Falls, NY 2006–2007 111 5.2 26 8.1 77 3.8 ¶ ¶
2009–2010 103 4.7 ¶ ¶ 73 3.5 ¶ ¶
Charlotte – Concord – Gastonia, NC-SC 2006–2007 215 5.3 31 5.4 261 7.5 ¶ ¶
2009–2010 190 4.4 27 4.4 305 8.0 ¶ ¶
Chicago – Naperville – Elgin, IL-IN-WI 2006–2007 1,152 6.0 253 9.3 491 3.1 24 0.92009–2010 1,139 6.0 213 7.9 527 3.2 ¶ ¶
Cincinnati, OH-KY-IN 2006–2007 177 4.3 35 5.8 233 6.5 ¶ ¶
2009–2010 140 3.4 ¶ ¶ 246 6.6 ¶ ¶
Cleveland – Elyria, OH 2006–2007 215 5.6 27 4.5 198 5.3 ¶ ¶
2009–2010 146 3.9 21 3.7 168 4.5 ¶ ¶
Columbus, OH 2006–2007 165 4.3 26 5.1 221 7.1 ¶ ¶
2009–2010 174 4.4 29 5.5 219 6.7 ¶ ¶
Dallas – Fort Worth – Arlington, TX 2006–2007 540 4.3 70 3.9 628 6.5 32 1.82009–2010 469 3.6 57 3.0 762 7.4 25 1.3
Denver – Aurora – Lakewood, CO 2006–2007 122 2.5 26 4.0 353 8.6 ¶ ¶
2009–2010 117 2.3 ¶ ¶ 375 8.6 ¶ ¶
Detroit – Warren – Dearborn, MI 2006–2007 792 9.5 117 9.0 436 5.6 ¶ ¶
2009–2010 686 8.6 119 9.5 461 6.1 31 2.5Hartford – West Hartford – East Hartford, CT 2006–2007 62 2.7 ¶ ¶ 46 2.1 ¶ ¶
2009–2010 75 3.3 ¶ ¶ 78 3.5 ¶ ¶
Houston – The Woodlands – Sugar Land, TX 2006–2007 761 6.7 115 6.9 590 6.7 32 1.92009–2010 701 5.8 83 4.7 730 7.7 39 2.2
Indianapolis – Carmel – Anderson, IN 2006–2007 218 6.0 29 5.6 217 7.0 ¶ ¶
2009–2010 188 5.1 25 4.7 248 7.7 ¶ ¶
Jacksonville, FL 2006–2007 243 9.3 37 10.1 183 8.1 ¶ ¶
2009–2010 198 7.4 26 7.1 255 10.8 ¶ ¶
Kansas City, MO-KS 2006–2007 226 6.0 40 7.3 257 7.7 ¶ ¶
2009–2010 260 6.8 62 11.3 284 8.2 ¶ ¶
Las Vegas – Henderson – Paradise, NV 2006–2007 221 6.0 46 9.2 340 11.1 ¶ ¶
2009–2010 164 4.2 24 4.5 376 11.4 ¶ ¶
Los Angeles – Long Beach – Anaheim, CA 2006–2007 1,612 6.0 410 10.7 687 3.2 ¶ ¶
2009–2010 1,141 4.2 251 6.7 755 3.5 22 0.6Louisville/Jefferson County, KY-IN 2006–2007 119 5.2 ¶ ¶ 194 9.2 ¶ ¶
2009–2010 105 4.4 ¶ ¶ 202 9.1 ¶ ¶
Memphis, TN-MS-AR 2006–2007 298 11.4 47 11.7 176 8.2 ¶ ¶
2009–2010 249 9.4 43 10.7 182 8.4 ¶ ¶
Miami – Fort Lauderdale – West Palm Beach, FL 2006–2007 657 6.3 112 7.8 547 5.4 ¶ ¶
2009–2010 594 5.6 81 5.8 580 5.5 ¶ ¶
Milwaukee – Waukesha – West Allis, WI 2006–2007 182 5.9 44 9.9 125 4.8 ¶ ¶
2009–2010 139 4.5 ¶ ¶ 156 5.6 ¶ ¶
See table footnotes on page 600.
Morbidity and Mortality Weekly Report
600 MMWR / August 2, 2013 / Vol. 62 / No. 30
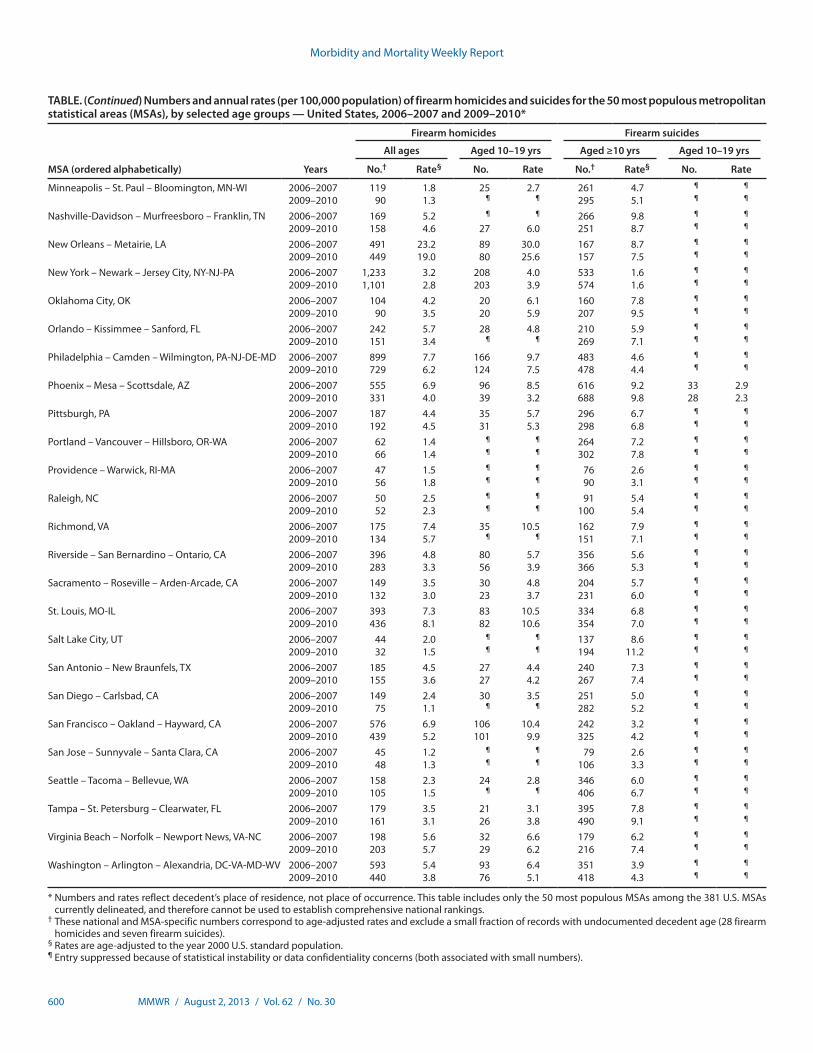
TABLE. (Continued) Numbers and annual rates (per 100,000 population) of firearm homicides and suicides for the 50 most populous metropolitan statistical areas (MSAs), by selected age groups — United States, 2006–2007 and 2009–2010*
MSA (ordered alphabetically) Years
Firearm homicides Firearm suicides
All ages Aged 10–19 yrs Aged ≥10 yrs Aged 10–19 yrs
No.† Rate§ No. Rate No.† Rate§ No. Rate
Minneapolis – St. Paul – Bloomington, MN-WI 2006–2007 119 1.8 25 2.7 261 4.7 ¶ ¶
2009–2010 90 1.3 ¶ ¶ 295 5.1 ¶ ¶
Nashville-Davidson – Murfreesboro – Franklin, TN 2006–2007 169 5.2 ¶ ¶ 266 9.8 ¶ ¶
2009–2010 158 4.6 27 6.0 251 8.7 ¶ ¶
New Orleans – Metairie, LA 2006–2007 491 23.2 89 30.0 167 8.7 ¶ ¶
2009–2010 449 19.0 80 25.6 157 7.5 ¶ ¶
New York – Newark – Jersey City, NY-NJ-PA 2006–2007 1,233 3.2 208 4.0 533 1.6 ¶ ¶
2009–2010 1,101 2.8 203 3.9 574 1.6 ¶ ¶
Oklahoma City, OK 2006–2007 104 4.2 20 6.1 160 7.8 ¶ ¶
2009–2010 90 3.5 20 5.9 207 9.5 ¶ ¶
Orlando – Kissimmee – Sanford, FL 2006–2007 242 5.7 28 4.8 210 5.9 ¶ ¶
2009–2010 151 3.4 ¶ ¶ 269 7.1 ¶ ¶
Philadelphia – Camden – Wilmington, PA-NJ-DE-MD 2006–2007 899 7.7 166 9.7 483 4.6 ¶ ¶
2009–2010 729 6.2 124 7.5 478 4.4 ¶ ¶
Phoenix – Mesa – Scottsdale, AZ 2006–2007 555 6.9 96 8.5 616 9.2 33 2.92009–2010 331 4.0 39 3.2 688 9.8 28 2.3
Pittsburgh, PA 2006–2007 187 4.4 35 5.7 296 6.7 ¶ ¶
2009–2010 192 4.5 31 5.3 298 6.8 ¶ ¶
Portland – Vancouver – Hillsboro, OR-WA 2006–2007 62 1.4 ¶ ¶ 264 7.2 ¶ ¶
2009–2010 66 1.4 ¶ ¶ 302 7.8 ¶ ¶
Providence – Warwick, RI-MA 2006–2007 47 1.5 ¶ ¶ 76 2.6 ¶ ¶
2009–2010 56 1.8 ¶ ¶ 90 3.1 ¶ ¶
Raleigh, NC 2006–2007 50 2.5 ¶ ¶ 91 5.4 ¶ ¶
2009–2010 52 2.3 ¶ ¶ 100 5.4 ¶ ¶
Richmond, VA 2006–2007 175 7.4 35 10.5 162 7.9 ¶ ¶
2009–2010 134 5.7 ¶ ¶ 151 7.1 ¶ ¶
Riverside – San Bernardino – Ontario, CA 2006–2007 396 4.8 80 5.7 356 5.6 ¶ ¶
2009–2010 283 3.3 56 3.9 366 5.3 ¶ ¶
Sacramento – Roseville – Arden-Arcade, CA 2006–2007 149 3.5 30 4.8 204 5.7 ¶ ¶
2009–2010 132 3.0 23 3.7 231 6.0 ¶ ¶
St. Louis, MO-IL 2006–2007 393 7.3 83 10.5 334 6.8 ¶ ¶
2009–2010 436 8.1 82 10.6 354 7.0 ¶ ¶
Salt Lake City, UT 2006–2007 44 2.0 ¶ ¶ 137 8.6 ¶ ¶
2009–2010 32 1.5 ¶ ¶ 194 11.2 ¶ ¶
San Antonio – New Braunfels, TX 2006–2007 185 4.5 27 4.4 240 7.3 ¶ ¶
2009–2010 155 3.6 27 4.2 267 7.4 ¶ ¶
San Diego – Carlsbad, CA 2006–2007 149 2.4 30 3.5 251 5.0 ¶ ¶
2009–2010 75 1.1 ¶ ¶ 282 5.2 ¶ ¶
San Francisco – Oakland – Hayward, CA 2006–2007 576 6.9 106 10.4 242 3.2 ¶ ¶
2009–2010 439 5.2 101 9.9 325 4.2 ¶ ¶
San Jose – Sunnyvale – Santa Clara, CA 2006–2007 45 1.2 ¶ ¶ 79 2.6 ¶ ¶
2009–2010 48 1.3 ¶ ¶ 106 3.3 ¶ ¶
Seattle – Tacoma – Bellevue, WA 2006–2007 158 2.3 24 2.8 346 6.0 ¶ ¶
2009–2010 105 1.5 ¶ ¶ 406 6.7 ¶ ¶
Tampa – St. Petersburg – Clearwater, FL 2006–2007 179 3.5 21 3.1 395 7.8 ¶ ¶
2009–2010 161 3.1 26 3.8 490 9.1 ¶ ¶
Virginia Beach – Norfolk – Newport News, VA-NC 2006–2007 198 5.6 32 6.6 179 6.2 ¶ ¶
2009–2010 203 5.7 29 6.2 216 7.4 ¶ ¶
Washington – Arlington – Alexandria, DC-VA-MD-WV 2006–2007 593 5.4 93 6.4 351 3.9 ¶ ¶
2009–2010 440 3.8 76 5.1 418 4.3 ¶ ¶
* Numbers and rates reflect decedent’s place of residence, not place of occurrence. This table includes only the 50 most populous MSAs among the 381 U.S. MSAs currently delineated, and therefore cannot be used to establish comprehensive national rankings.
† These national and MSA-specific numbers correspond to age-adjusted rates and exclude a small fraction of records with undocumented decedent age (28 firearm homicides and seven firearm suicides).
§ Rates are age-adjusted to the year 2000 U.S. standard population.¶ Entry suppressed because of statistical instability or data confidentiality concerns (both associated with small numbers).
Morbidity and Mortality Weekly Report
MMWR / August 2, 2013 / Vol. 62 / No. 30 601
51% of all suicides and in 40% of suicides among youths (1). Firearm suicide rates increased in most large metropolitan areas across reporting periods; however, rates collectively remained lower in these areas compared with the United States overall. Although residents of the large MSAs comprised more than half of the U.S. population, they accounted for just 42% of firearm suicides nationally (identical to the percentage for 2006–2007). For persons aged 10–19 years, these MSAs accounted for 37% of firearm suicides nationwide.
The findings in this report are subject to at least four limi-tations. First, statistics for central cities within MSAs are not presented because of lack of age-specific population estimates suitable for supporting rate comparisons across the periods considered. Second, statistics on nonfatal injuries associated with firearm assault or self-harm are not presented because population-based nonfatal injury data are not available for MSAs. Third, although the statistics for victims aged 10–19 years convey the serious impact of firearm-related violence on youths, other age groups not separately considered in this report had higher firearm homicide rates (e.g., persons aged 20–39 years, for whom rates have been declining recently) or higher firearm suicide rates (most or all other age groups, for whom rates variously have been level or increasing). Finally, the fraction of NVSS records with the underlying cause of death
coded as “other ill-defined and unspecified causes of mortality” (ICD-10 code R99) was higher than usual for several states (New Jersey, Ohio, and West Virginia) and the District of Columbia for 2009. The influence of nonspecific cause codes on firearm fatality statistics is not known; however, the annual fraction of such records remained low (approximately 5% or less) for each of these states.
The observed declines in firearm homicide rates and increases in firearm suicide rates are consistent with longer-term trends in homicide and suicide nationally (1). Homicide rates gen-erally have been declining in the United States during the past two decades (1). Factors identified by previous research as influencing this decline include shifting demographics, changes in markets for illegal drugs (e.g., type, demand, and participants), law enforcement responses to gun violence and drug-related crime, increased incarceration rates, community policing and related efforts, and improving economic condi-tions throughout much of the 1990s (2). Increasing suicide rates have been prominent in the middle-aged population dur-ing the past decade as the percentage of suicides accounted for by this group has steadily increased (1,3). Suicide rates within this age group previously have been associated with business cycles (4); national unemployment rates notably doubled from 2006–2007 to 2009–2010 (5).
A factor likely affecting firearm homicide and suicide is access to firearms by persons at risk for harming themselves or others. Potential strategies for reducing firearm-related violence among such persons include initiatives promoting safe storage of guns (6), waiting periods to reduce the consequences of impulsive suicidal behavior (7), designing firearms to make them safer (8), and efforts such as background checks to prevent high-risk persons from possessing firearms (e.g., persons convicted of violent crimes, persons subject to protective orders because of threats of domestic violence, and persons with documented mental illness posing a risk to themselves or others) (9). Further research is needed to assess the effectiveness of such strategies.
Effective approaches for preventing violence include early education through school-based programs addressing social, emotional, and behavioral competencies; parent and family-based programs promoting positive relationships, communica-tion, support, and proper supervision; and efforts to improve school, neighborhood, and community environments in ways that reduce the likelihood of violence (10).¶ Promoting the capacity of communities to implement such approaches might prove essential to achieving population-level impacts.
What is already known on this topic?
Firearm homicide rates for large metropolitan statistical areas (MSAs) have been found to be higher than for the United States overall, with rates also higher among persons aged 10–19 years than among persons of all ages. In contrast, firearm suicide rates have been found to be lower in these large urban areas than for the nation overall.
What is added by this report?
Although geographic and age-specific differences in firearm homicide rates have persisted, rates declined from 2006–2007 to 2009–2010 for most large MSAs, as well as nationally. The national decline in the firearm homicide rate can be attributed primarily to declines in these large metropolitan areas. Geographic differences in firearm suicide rates also have persisted; however, firearm suicide rates increased from 2006–2007 to 2009–2010 for most large MSAs and nationally.
What are the implications for public health practice?
Prevention and intervention research should focus on identify-ing effective strategies for sustaining declines in firearm homicide rates and stemming recent increases in firearm suicide rates. Although further study is needed, initiatives for reducing firearm-related violence can draw upon a growing evidence base for effectively addressing behavioral and environmental factors associated with both firearm and nonfirearm violence.
¶ Additional information available at http://www.cdc.gov/violenceprevention/stryve/index.html and http://www.thecommunityguide.org/violence/schoolbasedprograms.html.
Morbidity and Mortality Weekly Report
602 MMWR / August 2, 2013 / Vol. 62 / No. 30
Acknowledgments
J. Lee Annest, PhD, Marcie-jo Kresnow, MS, Div of Analysis, Research, and Practice Integration, National Center for Injury Prevention and Control, CDC.
References1. CDC. Web-based Injury Statistics Query and Reporting System
(WISQARS). Atlanta, GA: US Department of Health and Human Services, CDC; 2013. Available at http://www.cdc.gov/injury/wisqars/index.html.
2. Blumstein A, Wallman J. The recent rise and fall of American violence. In: Blumstein A, Wallman J, eds. The crime drop in America, revised edition. New York, NY: Cambridge University Press; 2006.
3. CDC. Suicide among adults aged 35–64 years—United States, 1999–2010. MMWR 2013;62:321–5.
4. Luo F, Florence CS, Quispe-Agnoli M, Ouyang L, Crosby AE. Impact of business cycles on US suicide rates, 1928–2007. Am J Public Health 2011;101:1139–46.
5. Bureau of Labor Statistics. Labor force statistics (Current Population Survey). Washington, DC: US Department of Labor, Bureau of Labor Statistics; 2013. Available at http://data.bls.gov.
6. Sidman EA, Grossman DC, Koepsell TD, et al. Evaluation of a community-based handgun safe-storage campaign. Pediatrics 2005; 115:e654–61.
7. Lampert MT, Silva PS. An update on the impact of gun control legislation on suicide. Psychiatr Q 1998;69:127–34.
8. Teret SP, Mernit AD. Personalized guns: using technology to save lives. In: Webster DS, Vernick JS, eds. Reducing gun violence in America: informing policy with evidence and analysis. Baltimore, MD: Johns Hopkins University Press; 2013.
9. Wintemute GJ. Broadening denial criteria for the purchase and possession of firearms: need, feasibility, and effectiveness. In: Webster DS, Vernick JS, eds. Reducing gun violence in America: informing policy with evidence and analysis. Baltimore, MD: Johns Hopkins University Press; 2013.
10. Jensen JM, Powell A, Forrest-Bank S. Effective violence prevention approaches in school, family, and community settings. In: Herrenkohl TI, Aisenberg E, Williams JH, Jensen JM, eds. Violence in context: current evidence on risk, protection, and prevention. New York, NY: Oxford University Press; 2011.
Morbidity and Mortality Weekly Report
MMWR / August 2, 2013 / Vol. 62 / No. 30 603
Mycoplasma pneumoniae Outbreak at a University — Georgia, 2012
On October 17, 2012, the Georgia Department of Public Health (DPH) was notified by the Fulton County Department of Health and Wellness that a local university, the Georgia Institute of Technology, was experiencing a pneumonia outbreak among students. DPH epidemiologists investigated to identify the etiology, find additional cases, and recommend control mea-sures. Respiratory swabs collected from students with pneumonia and tested at CDC using a quantitative real-time polymerase chain reaction (qPCR) assay were positive for Mycoplasma pneu-moniae. The university alerted students, faculty, and staff mem-bers to the outbreak and recommended prevention measures by e-mail, social media, and posters. A survey administered to students assessed illness prevention behaviors, outbreak aware-ness, and communication preferences. Eighty-three cases were diagnosed among students during September 1–December 4, 2012, making this outbreak the largest reported at a U.S. uni-versity in 35 years (1). No cases were reported among faculty or staff members. Of the 83 patients, 19 had specimens tested by qPCR, of which 12 (63%) were positive for M. pneumoniae. Despite university communication efforts, approximately half of students surveyed were unaware of the outbreak when surveyed in December. DPH recommendations included implementing university policies that facilitate students staying home and seeking medical care when ill and refining health messages and communication methods to improve awareness of disease outbreaks among students.
M. pneumoniae is a common cause of respiratory infection among children and young adults, causing up to 40% of all cases of community-acquired pneumonia (2). In rare cases, M. pneumoniae can cause extrapulmonary manifestations, including neurologic, dermatologic, hematologic, and cardiac syndromes. Recommended first-line antibiotic treatments include tetracyclines and macrolides; however, a growing trend of macrolide-resistance worldwide has been reported (2,3). Outbreaks largely occur in closed and semiclosed settings, including schools and universities (4–6).
To investigate the outbreak, university health services records were reviewed weekly, beginning October 17, 2012, to identify cases of pneumonia among students, and information regard-ing demographics, signs and symptoms, underlying conditions, and treatment was collected. Retrospective record review was performed to identify cases diagnosed as early as September 1, 2012. Beginning on October 17, 2012, oropharyngeal and nasal or nasopharyngeal swabs were obtained from consenting students who agreed to testing and who received a diagnosis of pneumonia from a university health services physician. Initial patient specimens were tested using qPCR for 20 respiratory
pathogens to identify the causative agent (7); subsequent specimens were tested for M. pneumoniae, Chlamydophila pneu-moniae, and Legionella species using a multiplex qPCR assay (8). Culture and macrolide resistance testing were attempted on all M. pneumoniae-positive specimens using previously described methods (9).
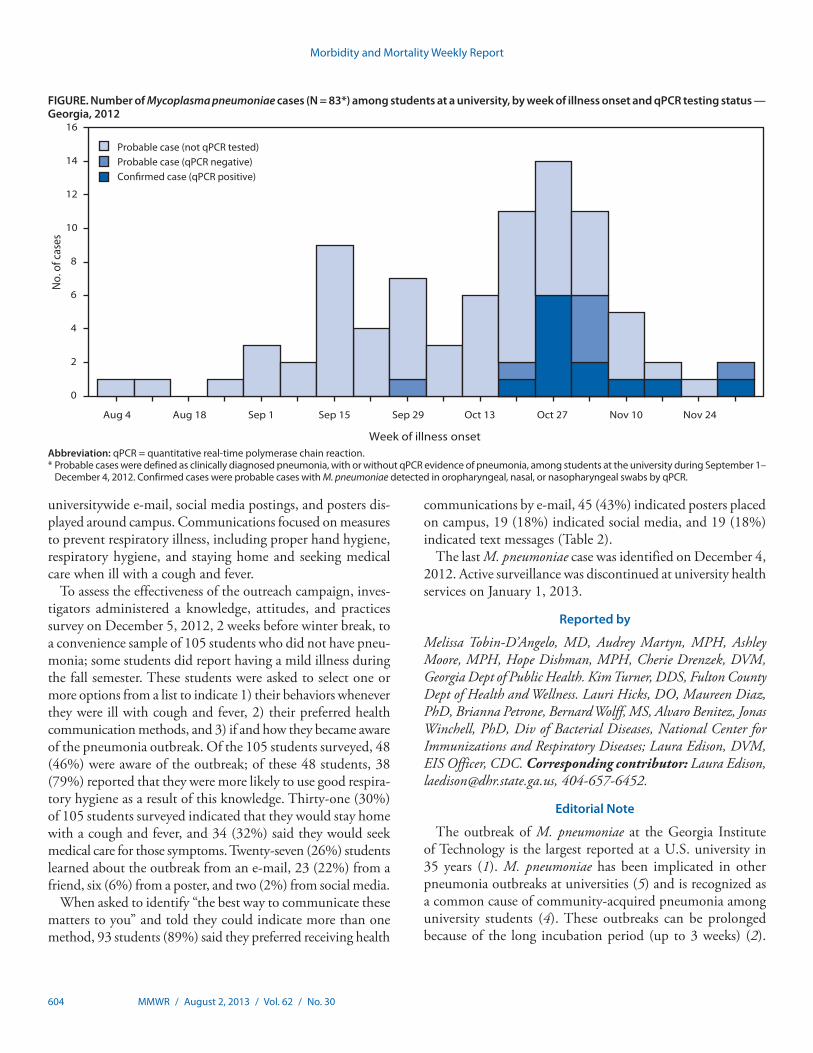
Probable cases were defined as a physician diagnosis of pneumonia in a Georgia Institute of Technology student dur-ing September 1–December 4, 2012, with or without qPCR evidence. Confirmed cases met the criteria for a probable case and had M. pneumoniae detected in oropharyngeal, nasal, or nasopharyngeal swabs by qPCR. During September 1–December 4, 2012, a total of 83 cases were identified, including 12 confirmed and 71 probable cases. Illness onset occurred during August 4–December 2, 2012 and peaked at the begin-ning of November (Figure). Patients were predominantly men (72%), and the age range was 18–30 years (median: 21 years), both representative of the overall student population. Ten (12%) patients had underlying asthma; this rate of asthma is statistically similar to the expected rate among adults aged 18–24 years in Georgia, according to results from the 2010 Behavioral Risk Factor Surveillance System survey.* A total of 79 patients (95%) reported cough, 64 (77%) fever, 36 (43%) headache, and 34 (41%) sore throat. Five (6%) patients with no underlying medical conditions were hospitalized with complications, including four with respiratory failure and one with perimyocarditis; all recovered. Forty-three (52%) patients were treated with doxycycline, 23 (28%) with azithromycin, and seven (8%) with other or multiple antibiotics (Table 1).
Nineteen (23%) of 83 cases had specimens tested by qPCR; 12 (63%) specimens were positive for M. pneumoniae and were cultured, yielding 10 isolates identified as M. pneumoniae. No other pathogens were identified. All 12 qPCR-positive speci-mens tested negative for macrolide resistance by qPCR testing of the primary specimen or isolate. Radiographs were admin-istered for 99% of students with pneumonia diagnoses; 61 (74%) had radiographic findings consistent with pneumonia.
Public Health ResponseOn November 7, 2012, DPH provided the university with
recommendations to curtail the outbreak, including initiation of an outreach campaign to alert the university community to the outbreak and education regarding preventive health behaviors to reduce the spread of illness. During November, the university began an outreach campaign that included a
* Additional information available at http://www.cdc.gov/brfss.
Morbidity and Mortality Weekly Report
604 MMWR / August 2, 2013 / Vol. 62 / No. 30
universitywide e-mail, social media postings, and posters dis-played around campus. Communications focused on measures to prevent respiratory illness, including proper hand hygiene, respiratory hygiene, and staying home and seeking medical care when ill with a cough and fever.
To assess the effectiveness of the outreach campaign, inves-tigators administered a knowledge, attitudes, and practices survey on December 5, 2012, 2 weeks before winter break, to a convenience sample of 105 students who did not have pneu-monia; some students did report having a mild illness during the fall semester. These students were asked to select one or more options from a list to indicate 1) their behaviors whenever they were ill with cough and fever, 2) their preferred health communication methods, and 3) if and how they became aware of the pneumonia outbreak. Of the 105 students surveyed, 48 (46%) were aware of the outbreak; of these 48 students, 38 (79%) reported that they were more likely to use good respira-tory hygiene as a result of this knowledge. Thirty-one (30%) of 105 students surveyed indicated that they would stay home with a cough and fever, and 34 (32%) said they would seek medical care for those symptoms. Twenty-seven (26%) students learned about the outbreak from an e-mail, 23 (22%) from a friend, six (6%) from a poster, and two (2%) from social media.
When asked to identify “the best way to communicate these matters to you” and told they could indicate more than one method, 93 students (89%) said they preferred receiving health
communications by e-mail, 45 (43%) indicated posters placed on campus, 19 (18%) indicated social media, and 19 (18%) indicated text messages (Table 2).
The last M. pneumoniae case was identified on December 4, 2012. Active surveillance was discontinued at university health services on January 1, 2013.
Reported by
Melissa Tobin-D’Angelo, MD, Audrey Martyn, MPH, Ashley Moore, MPH, Hope Dishman, MPH, Cherie Drenzek, DVM, Georgia Dept of Public Health. Kim Turner, DDS, Fulton County Dept of Health and Wellness. Lauri Hicks, DO, Maureen Diaz, PhD, Brianna Petrone, Bernard Wolff, MS, Alvaro Benitez, Jonas Winchell, PhD, Div of Bacterial Diseases, National Center for Immunizations and Respiratory Diseases; Laura Edison, DVM, EIS Officer, CDC. Corresponding contributor: Laura Edison, [email protected], 404-657-6452.
Editorial Note
The outbreak of M. pneumoniae at the Georgia Institute of Technology is the largest reported at a U.S. university in 35 years (1). M. pneumoniae has been implicated in other pneumonia outbreaks at universities (5) and is recognized as a common cause of community-acquired pneumonia among university students (4). These outbreaks can be prolonged because of the long incubation period (up to 3 weeks) (2).
FIGURE. Number of Mycoplasma pneumoniae cases (N = 83*) among students at a university, by week of illness onset and qPCR testing status — Georgia, 2012
Abbreviation: qPCR = quantitative real-time polymerase chain reaction.* Probable cases were defined as clinically diagnosed pneumonia, with or without qPCR evidence of pneumonia, among students at the university during September 1–
December 4, 2012. Confirmed cases were probable cases with M. pneumoniae detected in oropharyngeal, nasal, or nasopharyngeal swabs by qPCR.
0
2
4
6
8
10
12
14
16
Aug 4 Aug 18 Sep 1 Sep 29 Oct 13 Oct 27 Nov 10 Nov 24
No.
of c
ases
Week of illness onset
Probable case (not qPCR tested)Probable case (qPCR negative)Con�rmed case (qPCR positive)
Sep 15

Morbidity and Mortality Weekly Report
MMWR / August 2, 2013 / Vol. 62 / No. 30 605
Because M. pneumoniae infection most commonly causes upper respiratory illness (only an estimated 3%–10% of persons with infection experience pneumonia [2,3]), infected persons often go about their normal activities and infect others, as in this outbreak. No cases were identified among faculty or staff members, perhaps in part because they generally do not use university health services. The five hospitalizations demonstrate the risk for severe complications during substantial outbreaks of M. pneumoniae; early outbreak recognition is critical because control measures can limit transmission and complications (3).
The multiplex qPCR assay was used as the primary test-ing method in this investigation because of the documented sensitivity and specificity (8), cost-effectiveness, and status as a Clinical Laboratory Improvement Amendments (CLIA)–approved testing method. Culture, a less reliable method for M. pneumoniae detection (2), was used in this investigation to obtain isolates that could be further characterized through additional molecular testing methods.
M. pneumoniae is spread through respiratory droplets; there-fore, preventive health behaviors, including proper hand and respiratory hygiene and self-isolation when ill, can limit the spread of disease (3). No data are available to support the use of antibiotic prophylaxis during university outbreaks. Inducing preventive health behaviors among university students requires that they become aware of the outbreak, perceive a personal risk, and know of a behavior that can reduce the risk for infec-tion (10). In a survey of 105 students, 54% said they were unaware of the outbreak despite a campuswide e-mail message, social media postings, and posters placed around campus. Among the 46% of students who were aware of the outbreak, 79% said they would be more likely to engage in preventive health behaviors because of this awareness.
To be effective during a M. pneumoniae outbreak at a univer-sity, health messages need to reach students and educate them regarding their risk for infection and behaviors that can prevent infection. More research is needed to determine the most effec-tive ways to communicate these messages to university students. Sending multiple e-mails and text messages with attention-getting words in the subject line (e.g., outbreak or pneumonia) and the use of informal social networks (e.g., announcements at
TABLE 1. Number and percentage of Mycoplasma pneumoniae cases (N = 83) among students at a university, by selected characteristics — Georgia, 2012
Characteristic No.* (%)
Case type 83 (100)Confirmed case 12 (14)Probable case 71 (86)
SexMen 60 (72)Women 23 (28)
SymptomCough 79 (95)Fever 64 (77)Shortness of breath 23 (28)Body aches 26 (31)Headache 36 (43)Sore throat 34 (41)Nasal congestion 32 (39)Rash 3 (4)
RadiographNo. of patients administered 82 (99)No. with findings consistent with pneumonia 61 (73)
Underlying conditionAsthma 10 (12)Allergies 5 (6)
Antibiotic treatmentAzithromycin 23 (28)Doxycycline 43 (52)Other† 7 (8)None 3 (4)Information missing 7 (8)
Abbreviation: qPCR = quantitative real-time polymerase chain reaction.* Probable cases were defined as clinically diagnosed pneumonia, with or
without qPCR evidence of pneumonia among students at the university during September 1–December 4, 2012. Confirmed cases were probable cases with M. pneumoniae detected in oral or nasal or nasopharyngeal swabs by qPCR.
† Includes combination therapy, ceftriaxone, erythromycin, clarithromycin, and levofloxacin.
TABLE 2. Knowledge and practices of surveyed students (N = 105) regarding outbreak of Mycoplasma pneumoniae at a university — Georgia, 2012
Knowledge/Practices No. (%)
Are you aware of increased pneumonia on campus?Yes 48 (46)No 57 (54)
How did you hear about it?E-mail 27 (26)Friend 23 (22)Posters around campus 6 (6)Health services website 5 (5)Professor 4 (4)Social media 2 (2)
Best way to communicate these matters to you?*E-mail 93 (89)Posters in common areas 45 (43)Social media 19 (18)Text messages 19 (18)Campus newspaper 17 (16)Residence advisors 15 (14)Academic advisors 6 (6)
Which are you most likely to do if you become ill?*Cover cough and sneezes more often 62 (59)Take over-the-counter medications 53 (50)Wash hands more 46 (44)Go to a doctor 34 (32)Stay home when not feeling well 31 (30)Do nothing 7 (7)
Are you more likely to wash your hands, cover your cough, or stay home if ill after seeing the posters and e-mails? (n = 48)Yes 38 (79)No 10 (21)
* Students could select multiple answers.
Morbidity and Mortality Weekly Report
606 MMWR / August 2, 2013 / Vol. 62 / No. 30
group activities or in classes) might serve to increase awareness. Effective communications, coupled with university policies that facilitate students staying home and seeking medical care when ill, might reduce transmission of M. pneumoniae and the severe complications that can go with it.
Acknowledgments
Matthew Crist, MD, Georgia Dept of Public Health. Frank Pickens, MD, Gregory Moore, MD, Stamps Health Svcs, Georgia Institute of Technology. Eddie Weiss, MD, Scientific Education and Professional Development Program Office, Office of Surveillance, Epidemiology, and Laboratory Svcs, CDC.
References 1. Ralston D, Cochran B. A college epidemic of Mycoplasma pneumoniae.
J Am Coll Health Assoc 1979;27:264,6. 2. Waites KB, Talkington DF. Mycoplasma pneumoniae and its role as a
human pathogen. Clin Microbiol Rev 2004;17:697–728. 3. Walter ND, Grant GB, Bandy U, et al. Community outbreak of
Mycoplasma pneumoniae infection: school-based cluster of neurologic disease associated with household transmission of respiratory illness. J Infect Dis 2008;198:1365–74.
4. Fernald GW, Clyde WA, Jr. Epidemic pneumonia in university students. J Adolesc Health Care 1989;10:520–6.
5. Evans AS, Allen V, Sueltmann S. Mycoplasma pneumoniae infections in University of Wisconsin students. Am Rev Respir Dis 1967;96:237–44.
6. CDC. Mycoplasma pneumoniae respiratory illness—two rural counties, West Virginia, 2011. MMWR 2012;61:834–8.
7. Kodani M, Yang G, Conklin LM, et al. Application of TaqMan low-density arrays for simultaneous detection of multiple respiratory pathogens. J Clin Microbiol 2011;49:2175–82.
8. Thurman KA, Warner AK, Cowart KC, Benitez AJ, Winchell JM. Detection of Mycoplasma pneumoniae, Chlamydia pneumoniae, and Legionella spp. in clinical specimens using a single-tube multiplex real-time PCR assay. Diagn Microbiol Infect Dis 2011;70:1–9.
9. Wolff BJ, Thacker WL, Schwartz SB, Winchell JM. Detection of macrolide resistance in Mycoplasma pneumoniae by real-time PCR and high-resolution melt analysis. Antimicrob Agents Chemother 2008;52:3542–9.
10. Katz R, May L, Sanza M, Johnston L, Petinaux B. H1N1 preventive health behaviors in a university setting. J Am Coll Health 2012;60:46–56.
What is already known on this topic?
Mycoplasma pneumoniae is a common cause of respiratory infection and community-acquired pneumonia among young adults. Approximately 3%–10% of persons infected with M. pneumoniae experience pneumonia, and a limited proportion of persons can experience extrapulmonary manifestations, including cardiac syndromes. Outbreaks are known to occur in closed and semiclosed settings, including schools and universities.
What is added by this report?
During September 1–December 4, 2012, a total of 83 cases of M. pneumoniae infection were diagnosed among students at a university in Georgia, the largest reported outbreak of M. pneumoniae at a U.S. university in 35 years. Despite multiple communication efforts, approximately half of students surveyed in December said they were unaware of the outbreak. Students unaware of an outbreak are unlikely to adopt preventive health behaviors that might limit disease spread
What are the implications for public health practice?
M. pneumoniae should be considered in outbreaks of pneumo-nia among university students. University students are more likely to engage in preventive health behaviors when they are aware of an outbreak, yet students can be difficult to reach, even when their preferred methods of health communication are employed. Health messages should be tailored to reach students and educate them about their risk for infection, and behaviors to prevent infection; more research needs to be done to determine the most effective way to communicate health messages to students.
Morbidity and Mortality Weekly Report
MMWR / August 2, 2013 / Vol. 62 / No. 30 607
State and local school vaccination requirements are imple-mented to maintain high vaccination coverage and minimize the risk from vaccine preventable diseases (1). To assess school vac-cination coverage and exemptions, CDC annually analyzes school vaccination coverage data from federally funded immunization programs. These awardees include 50 states and the District of Columbia (DC), five cities, and eight U.S.-affiliated jurisdictions.* This report summarizes vaccination coverage from 48 states and DC and exemption rates from 49 states and DC for children entering kindergarten for the 2012–13 school year. Forty-eight states and DC reported vaccination coverage, with medians of 94.5% for 2 doses of measles, mumps, and rubella (MMR) vac-cine; 95.1% for local requirements for diphtheria, tetanus toxoid, and acellular pertussis (DTaP) vaccination; and 93.8% for 2 doses of varicella vaccine among awardees with a 2-dose requirement. Forty-nine states and DC reported exemption rates, with the median total of 1.8%. Although school entry coverage for most awardees was at or near national Healthy People 2020 targets of maintaining 95% vaccination coverage levels for 2 doses of MMR vaccine, 4 doses of DTaP† vaccine, and 2 doses of varicella vac-cine (2), low vaccination and high exemption levels can cluster within communities, increasing the risk for disease. Reports to CDC are aggregated at the state level; however, local reporting of school vaccination coverage might be accessible by awardees. These local-level data can be used to create evidence-based health communication strategies to help parents understand the risks for vaccine-preventable diseases and the benefits of vaccinations to the health of their children and other kindergarteners.
Vaccination coverage among children entering kindergarten is assessed annually by awardees. Each school year, the health department, school nurse, or other school personnel assess the vaccination and exemption status of a census or sample of kin-dergarteners enrolled in public and private schools to determine vaccination coverage, as defined by state and local school require-ments established to protect children from vaccine-preventable diseases. Among the 50 states and DC, 43 awardees used an immunization information system (IIS) as at least one source of data for some of their school assessment. To collect data, 33
awardees used a census of kindergarteners; 11 a sample of schools, kindergarteners, or both; two a voluntary response of schools; and five a mix of methods. Results of the school-level assessments are reported to the health department. Aggregated data are reported to CDC for public and private schools. Data for homeschooled students were not reported to CDC. All estimates of coverage and exemption were weighted based on each awardee’s response rates and sampling methodology, unless otherwise noted. Of the 50 states and DC, 12 awardees met CDC standards for school assessment methods in 2012–13.§
Kindergarteners were considered up-to-date for each vacci-nation if they had received all of the doses required for school entry in their jurisdiction. School entry requirements varied by awardee: all reporting awardees required 2 doses of MMR vaccine; for DTaP vaccine, two awardees required 3 doses, 35 required 4 doses, and 20 required 5 doses; and for varicella vaccine, 13 required 1 dose, 41 required 2 doses, and three did not require varicella vaccination.
The types of exemptions allowed varied by awardee. All report-ing awardees allowed medical exemptions, 46 allowed religious exemptions, 18 allowed philosophic exemptions, and two (Mississippi and West Virginia) did not allow exemptions for reli-gious or philosophic reasons. Medical, religious, and philosophic exemptions were reported as the percentage of kindergarteners with each type of exemption. Total exemptions were reported as the percentage of kindergarteners with any exemption.
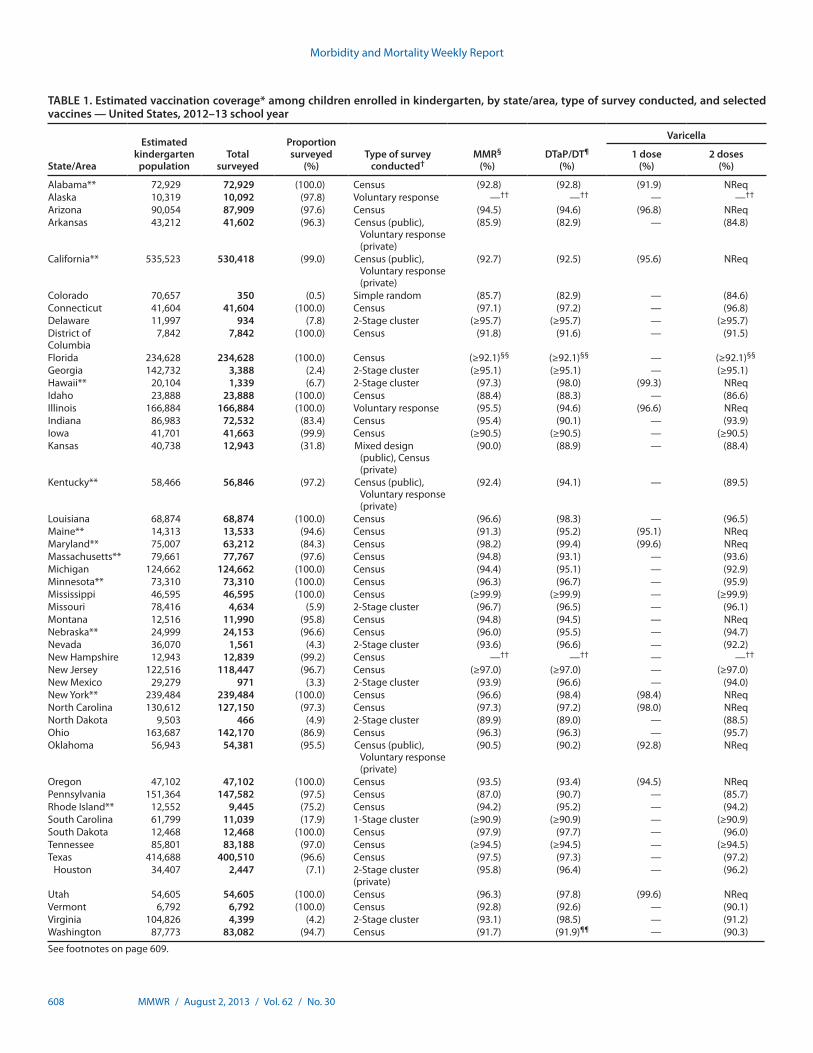
Overall, among the 48 states and DC that reported 2012–13 school vaccination coverage, median 2-dose MMR vaccination coverage was 94.5% (range: 85.7% in Colorado to ≥99.9% in Mississippi); 20 reported coverage ≥95% (Table 1). Median DTaP vaccination coverage was 95.1% (range: 82.9% in Colorado and Arkansas to ≥99.9% in Mississippi); 25 reported coverage ≥95%. Median 2-dose varicella vaccination cover-age among the 36 states and DC requiring and reporting 2 doses was 93.8% (range: 84.6% in Colorado to ≥99.9% in Mississippi); 14 reported coverage ≥95%.
An estimated 91,453 exemptions were reported among a total estimated population of 4,242,558 kindergarten-ers. Overall, among the 49 states and DC that reported 2012–13 school vaccination exemptions, the percentage of * Vaccination coverage and exemption data were reported to CDC by Guam,
the Commonwealth of the Northern Mariana Islands, Palau, Puerto Rico, and the U.S. Virgin Islands. No data were reported by American Samoa, the Marshall Islands, and the Federated States of Micronesia. Data from these U.S.-affiliated jurisdictions were excluded from the national analysis.
† The Healthy People 2020 DTaP vaccination coverage target (IID-10.1) is based on 4 doses of DTaP vaccine. This report describes compliance with state regulations of 3, 4, or 5 doses of DTaP vaccine. Of the 51 awardees, only Nebraska, New York, and Pennsylvania report <4 doses of DTaP vaccine.
§ CDC standards included use of a census or random sample to assess public and private schools or students, assessment using number of doses recommended by the Advisory Committee on Immunization Practices, assessment of vaccination status before December 31, collection of data by health department personnel or school nurses, validation of data collected by school administrative staff, and vaccination documentation from a health-care provider.
Vaccination Coverage Among Children in Kindergarten — United States, 2012–13 School Year
Morbidity and Mortality Weekly Report
608 MMWR / August 2, 2013 / Vol. 62 / No. 30
TABLE 1. Estimated vaccination coverage* among children enrolled in kindergarten, by state/area, type of survey conducted, and selected vaccines — United States, 2012–13 school year
State/Area
Estimated kindergarten
populationTotal
surveyed
Proportion surveyed
(%)Type of survey
conducted†MMR§
(%)DTaP/DT¶
(%)
Varicella
1 dose (%)
2 doses (%)
Alabama** 72,929 72,929 (100.0) Census (92.8) (92.8) (91.9) NReqAlaska 10,319 10,092 (97.8) Voluntary response —†† —†† — —††
Arizona 90,054 87,909 (97.6) Census (94.5) (94.6) (96.8) NReqArkansas 43,212 41,602 (96.3) Census (public),
Voluntary response (private)
(85.9) (82.9) — (84.8)
California** 535,523 530,418 (99.0) Census (public), Voluntary response (private)
(92.7) (92.5) (95.6) NReq
Colorado 70,657 350 (0.5) Simple random (85.7) (82.9) — (84.6)Connecticut 41,604 41,604 (100.0) Census (97.1) (97.2) — (96.8)Delaware 11,997 934 (7.8) 2-Stage cluster (≥95.7) (≥95.7) — (≥95.7)District of Columbia
7,842 7,842 (100.0) Census (91.8) (91.6) — (91.5)
Florida 234,628 234,628 (100.0) Census (≥92.1)§§ (≥92.1)§§ — (≥92.1)§§
Georgia 142,732 3,388 (2.4) 2-Stage cluster (≥95.1) (≥95.1) — (≥95.1)Hawaii** 20,104 1,339 (6.7) 2-Stage cluster (97.3) (98.0) (99.3) NReqIdaho 23,888 23,888 (100.0) Census (88.4) (88.3) — (86.6)Illinois 166,884 166,884 (100.0) Voluntary response (95.5) (94.6) (96.6) NReqIndiana 86,983 72,532 (83.4) Census (95.4) (90.1) — (93.9)Iowa 41,701 41,663 (99.9) Census (≥90.5) (≥90.5) — (≥90.5)Kansas 40,738 12,943 (31.8) Mixed design
(public), Census (private)
(90.0) (88.9) — (88.4)
Kentucky** 58,466 56,846 (97.2) Census (public), Voluntary response (private)
(92.4) (94.1) — (89.5)
Louisiana 68,874 68,874 (100.0) Census (96.6) (98.3) — (96.5)Maine** 14,313 13,533 (94.6) Census (91.3) (95.2) (95.1) NReqMaryland** 75,007 63,212 (84.3) Census (98.2) (99.4) (99.6) NReqMassachusetts** 79,661 77,767 (97.6) Census (94.8) (93.1) — (93.6)Michigan 124,662 124,662 (100.0) Census (94.4) (95.1) — (92.9)Minnesota** 73,310 73,310 (100.0) Census (96.3) (96.7) — (95.9)Mississippi 46,595 46,595 (100.0) Census (≥99.9) (≥99.9) — (≥99.9)Missouri 78,416 4,634 (5.9) 2-Stage cluster (96.7) (96.5) — (96.1)Montana 12,516 11,990 (95.8) Census (94.8) (94.5) — NReqNebraska** 24,999 24,153 (96.6) Census (96.0) (95.5) — (94.7)Nevada 36,070 1,561 (4.3) 2-Stage cluster (93.6) (96.6) — (92.2)New Hampshire 12,943 12,839 (99.2) Census —†† —†† — —††
New Jersey 122,516 118,447 (96.7) Census (≥97.0) (≥97.0) — (≥97.0)New Mexico 29,279 971 (3.3) 2-Stage cluster (93.9) (96.6) — (94.0)New York** 239,484 239,484 (100.0) Census (96.6) (98.4) (98.4) NReqNorth Carolina 130,612 127,150 (97.3) Census (97.3) (97.2) (98.0) NReqNorth Dakota 9,503 466 (4.9) 2-Stage cluster (89.9) (89.0) — (88.5)Ohio 163,687 142,170 (86.9) Census (96.3) (96.3) — (95.7)Oklahoma 56,943 54,381 (95.5) Census (public),
Voluntary response (private)
(90.5) (90.2) (92.8) NReq
Oregon 47,102 47,102 (100.0) Census (93.5) (93.4) (94.5) NReqPennsylvania 151,364 147,582 (97.5) Census (87.0) (90.7) — (85.7)Rhode Island** 12,552 9,445 (75.2) Census (94.2) (95.2) — (94.2)South Carolina 61,799 11,039 (17.9) 1-Stage cluster (≥90.9) (≥90.9) — (≥90.9) South Dakota 12,468 12,468 (100.0) Census (97.9) (97.7) — (96.0)Tennessee 85,801 83,188 (97.0) Census (≥94.5) (≥94.5) — (≥94.5)Texas 414,688 400,510 (96.6) Census (97.5) (97.3) — (97.2)
Houston 34,407 2,447 (7.1) 2-Stage cluster (private)
(95.8) (96.4) — (96.2)
Utah 54,605 54,605 (100.0) Census (96.3) (97.8) (99.6) NReqVermont 6,792 6,792 (100.0) Census (92.8) (92.6) — (90.1)Virginia 104,826 4,399 (4.2) 2-Stage cluster (93.1) (98.5) — (91.2)Washington 87,773 83,082 (94.7) Census (91.7) (91.9)¶¶ — (90.3)
See footnotes on page 609.
Morbidity and Mortality Weekly Report
MMWR / August 2, 2013 / Vol. 62 / No. 30 609
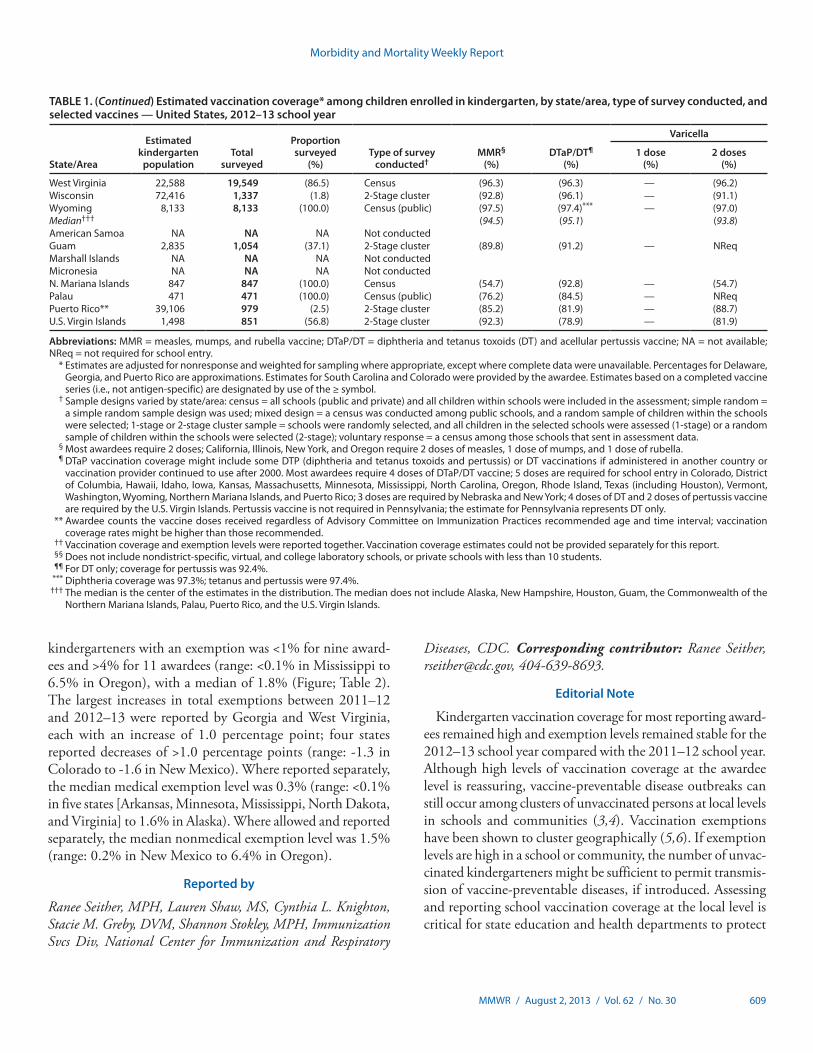
kindergarteners with an exemption was <1% for nine award-ees and >4% for 11 awardees (range: <0.1% in Mississippi to 6.5% in Oregon), with a median of 1.8% (Figure; Table 2). The largest increases in total exemptions between 2011–12 and 2012–13 were reported by Georgia and West Virginia, each with an increase of 1.0 percentage point; four states reported decreases of >1.0 percentage points (range: -1.3 in Colorado to -1.6 in New Mexico). Where reported separately, the median medical exemption level was 0.3% (range: <0.1% in five states [Arkansas, Minnesota, Mississippi, North Dakota, and Virginia] to 1.6% in Alaska). Where allowed and reported separately, the median nonmedical exemption level was 1.5% (range: 0.2% in New Mexico to 6.4% in Oregon).
Reported by
Ranee Seither, MPH, Lauren Shaw, MS, Cynthia L. Knighton, Stacie M. Greby, DVM, Shannon Stokley, MPH, Immunization Svcs Div, National Center for Immunization and Respiratory
Diseases, CDC. Corresponding contributor: Ranee Seither, [email protected], 404-639-8693.
Editorial Note
Kindergarten vaccination coverage for most reporting award-ees remained high and exemption levels remained stable for the 2012–13 school year compared with the 2011–12 school year. Although high levels of vaccination coverage at the awardee level is reassuring, vaccine-preventable disease outbreaks can still occur among clusters of unvaccinated persons at local levels in schools and communities (3,4). Vaccination exemptions have been shown to cluster geographically (5,6). If exemption levels are high in a school or community, the number of unvac-cinated kindergarteners might be sufficient to permit transmis-sion of vaccine-preventable diseases, if introduced. Assessing and reporting school vaccination coverage at the local level is critical for state education and health departments to protect
TABLE 1. (Continued) Estimated vaccination coverage* among children enrolled in kindergarten, by state/area, type of survey conducted, and selected vaccines — United States, 2012–13 school year
State/Area
Estimated kindergarten
populationTotal
surveyed
Proportion surveyed
(%)Type of survey
conducted†MMR§
(%)DTaP/DT¶
(%)
Varicella
1 dose (%)
2 doses (%)
West Virginia 22,588 19,549 (86.5) Census (96.3) (96.3) — (96.2)Wisconsin 72,416 1,337 (1.8) 2-Stage cluster (92.8) (96.1) — (91.1)Wyoming 8,133 8,133 (100.0) Census (public) (97.5) (97.4)*** — (97.0)Median††† (94.5) (95.1) (93.8)American Samoa NA NA NA Not conducted Guam 2,835 1,054 (37.1) 2-Stage cluster (89.8) (91.2) — NReqMarshall Islands NA NA NA Not conducted Micronesia NA NA NA Not conducted N. Mariana Islands 847 847 (100.0) Census (54.7) (92.8) — (54.7)Palau 471 471 (100.0) Census (public) (76.2) (84.5) — NReqPuerto Rico** 39,106 979 (2.5) 2-Stage cluster (85.2) (81.9) — (88.7)U.S. Virgin Islands 1,498 851 (56.8) 2-Stage cluster (92.3) (78.9) — (81.9)
Abbreviations: MMR = measles, mumps, and rubella vaccine; DTaP/DT = diphtheria and tetanus toxoids (DT) and acellular pertussis vaccine; NA = not available; NReq = not required for school entry. * Estimates are adjusted for nonresponse and weighted for sampling where appropriate, except where complete data were unavailable. Percentages for Delaware,
Georgia, and Puerto Rico are approximations. Estimates for South Carolina and Colorado were provided by the awardee. Estimates based on a completed vaccine series (i.e., not antigen-specific) are designated by use of the ≥ symbol.
† Sample designs varied by state/area: census = all schools (public and private) and all children within schools were included in the assessment; simple random = a simple random sample design was used; mixed design = a census was conducted among public schools, and a random sample of children within the schools were selected; 1-stage or 2-stage cluster sample = schools were randomly selected, and all children in the selected schools were assessed (1-stage) or a random sample of children within the schools were selected (2-stage); voluntary response = a census among those schools that sent in assessment data.
§ Most awardees require 2 doses; California, Illinois, New York, and Oregon require 2 doses of measles, 1 dose of mumps, and 1 dose of rubella. ¶ DTaP vaccination coverage might include some DTP (diphtheria and tetanus toxoids and pertussis) or DT vaccinations if administered in another country or
vaccination provider continued to use after 2000. Most awardees require 4 doses of DTaP/DT vaccine; 5 doses are required for school entry in Colorado, District of Columbia, Hawaii, Idaho, Iowa, Kansas, Massachusetts, Minnesota, Mississippi, North Carolina, Oregon, Rhode Island, Texas (including Houston), Vermont, Washington, Wyoming, Northern Mariana Islands, and Puerto Rico; 3 doses are required by Nebraska and New York; 4 doses of DT and 2 doses of pertussis vaccine are required by the U.S. Virgin Islands. Pertussis vaccine is not required in Pennsylvania; the estimate for Pennsylvania represents DT only.
** Awardee counts the vaccine doses received regardless of Advisory Committee on Immunization Practices recommended age and time interval; vaccination coverage rates might be higher than those recommended.
†† Vaccination coverage and exemption levels were reported together. Vaccination coverage estimates could not be provided separately for this report. §§ Does not include nondistrict-specific, virtual, and college laboratory schools, or private schools with less than 10 students. ¶¶ For DT only; coverage for pertussis was 92.4%. *** Diphtheria coverage was 97.3%; tetanus and pertussis were 97.4%. ††† The median is the center of the estimates in the distribution. The median does not include Alaska, New Hampshire, Houston, Guam, the Commonwealth of the
Northern Mariana Islands, Palau, Puerto Rico, and the U.S. Virgin Islands.
Morbidity and Mortality Weekly Report
610 MMWR / August 2, 2013 / Vol. 62 / No. 30
kindergarteners and the community from vaccine-preventable diseases. Among the 50 states and DC, a total of 11 awardees reported local-level data online, ensuring that local level data are widely available.¶ These local-level data can be used by health departments and schools to develop health communica-tion strategies based on the specific vaccine-preventable disease risk at a local school caused by low vaccination coverage or high exemption levels.
An exemption does not necessarily imply a child was not vaccinated. More than 99% of the 2006–2007 birth cohorts who became kindergarteners in 2012–13 received at least one vaccine (7). Additionally, in some areas, a parent or guardian may complete the required exemption paperwork if the kin-dergartener’s vaccination history cannot be easily documented at school enrollment (8,9). Less stringent exemption standards have been associated with higher numbers of exemptions (8,9).
School vaccination coverage assessment is a local-level data reporting system required as part of state or local level school vaccination requirements. CDC supports the use of standards to improve the ability to use the school vaccination coverage data to reliably monitor local vaccination coverage, including appropriate sampling methods, data collection by trained staff, and validation. One way to improve the quality of vaccination coverage reporting is to link school vaccination assessment systems to an IIS. In 2011, 45 of 51 awardees allowed schools to obtain data from their IIS, of which 43 awardees reported using the IIS capacity to complete their school vaccination assessment reporting and 20 were able to generate reports for school vaccination coverage (10). Allowing school vaccination assessment systems to link to awardee IIS data can help ensure provider-reported vaccinations are reported to the schools, minimizing the reporting burden on busy parents and schools, and might help health and education departments identify local areas with low levels of vaccination coverage.
The findings in this report are subject to at least two limita-tions. First, these data are cross-sectional, collected at a single point in the school year. Vaccination and exemption status reflected the child’s status at the time of assessment. Some children might have been in the process of receiving required vaccines and final vaccination or exemption status might have changed after the survey was completed. Reports might or
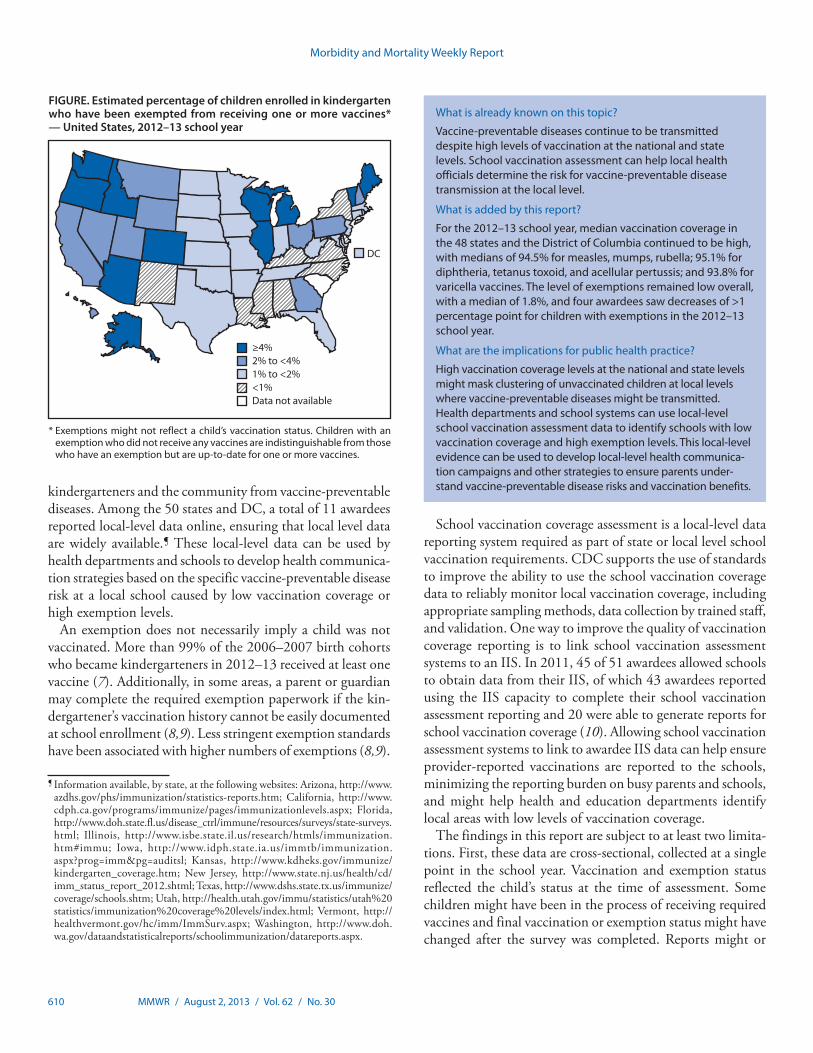
FIGURE. Estimated percentage of children enrolled in kindergarten who have been exempted from receiving one or more vaccines* — United States, 2012–13 school year
* Exemptions might not reflect a child’s vaccination status. Children with an exemption who did not receive any vaccines are indistinguishable from those who have an exemption but are up-to-date for one or more vaccines.
≥4%2% to <4%1% to <2%<1%Data not available
DC
What is already known on this topic?
Vaccine-preventable diseases continue to be transmitted despite high levels of vaccination at the national and state levels. School vaccination assessment can help local health officials determine the risk for vaccine-preventable disease transmission at the local level.
What is added by this report?
For the 2012–13 school year, median vaccination coverage in the 48 states and the District of Columbia continued to be high, with medians of 94.5% for measles, mumps, rubella; 95.1% for diphtheria, tetanus toxoid, and acellular pertussis; and 93.8% for varicella vaccines. The level of exemptions remained low overall, with a median of 1.8%, and four awardees saw decreases of >1 percentage point for children with exemptions in the 2012–13 school year.
What are the implications for public health practice?
High vaccination coverage levels at the national and state levels might mask clustering of unvaccinated children at local levels where vaccine-preventable diseases might be transmitted. Health departments and school systems can use local-level school vaccination assessment data to identify schools with low vaccination coverage and high exemption levels. This local-level evidence can be used to develop local-level health communica-tion campaigns and other strategies to ensure parents under-stand vaccine-preventable disease risks and vaccination benefits.
¶ Information available, by state, at the following websites: Arizona, http://www.azdhs.gov/phs/immunization/statistics-reports.htm; California, http://www.cdph.ca.gov/programs/immunize/pages/immunizationlevels.aspx; Florida, http://www.doh.state.fl.us/disease_ctrl/immune/resources/surveys/state-surveys.html; Illinois, http://www.isbe.state.il.us/research/htmls/immunization.htm#immu; Iowa, http://www.idph.state.ia.us/immtb/immunization.aspx?prog=imm&pg=auditsl; Kansas, http://www.kdheks.gov/immunize/kindergarten_coverage.htm; New Jersey, http://www.state.nj.us/health/cd/imm_status_report_2012.shtml; Texas, http://www.dshs.state.tx.us/immunize/coverage/schools.shtm; Utah, http://health.utah.gov/immu/statistics/utah%20statistics/immunization%20coverage%20levels/index.html; Vermont, http://healthvermont.gov/hc/imm/ImmSurv.aspx; Washington, http://www.doh.wa.gov/dataandstatisticalreports/schoolimmunization/datareports.aspx.
http://health.utah.gov/immu/statistics/utah%20statistics/immunization%20coverage%20levels/index.html
Morbidity and Mortality Weekly Report
MMWR / August 2, 2013 / Vol. 62 / No. 30 611
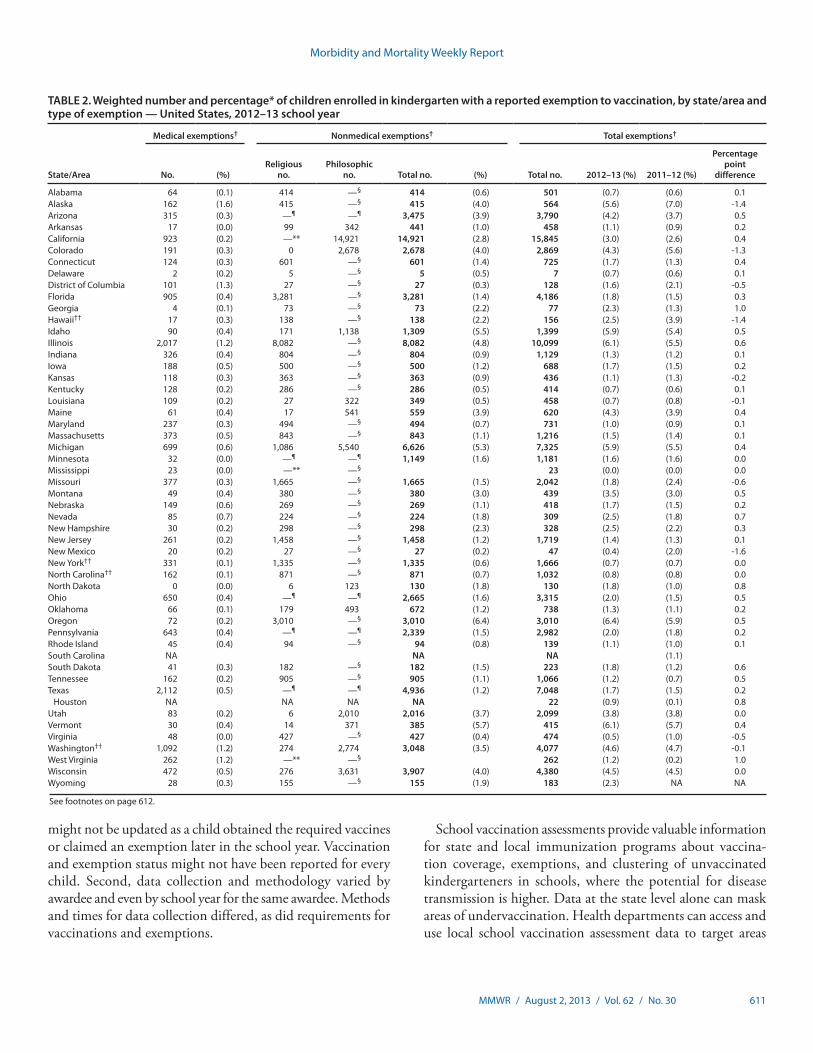
might not be updated as a child obtained the required vaccines or claimed an exemption later in the school year. Vaccination and exemption status might not have been reported for every child. Second, data collection and methodology varied by awardee and even by school year for the same awardee. Methods and times for data collection differed, as did requirements for vaccinations and exemptions.
TABLE 2. Weighted number and percentage* of children enrolled in kindergarten with a reported exemption to vaccination, by state/area and type of exemption — United States, 2012–13 school year
State/Area
Medical exemptions† Nonmedical exemptions† Total exemptions†
No. (%)Religious
no.Philosophic
no. Total no. (%) Total no. 2012–13 (%) 2011–12 (%)
Percentage point
difference
Alabama 64 (0.1) 414 —§ 414 (0.6) 501 (0.7) (0.6) 0.1Alaska 162 (1.6) 415 —§ 415 (4.0) 564 (5.6) (7.0) -1.4Arizona 315 (0.3) —¶ —¶ 3,475 (3.9) 3,790 (4.2) (3.7) 0.5Arkansas 17 (0.0) 99 342 441 (1.0) 458 (1.1) (0.9) 0.2California 923 (0.2) —** 14,921 14,921 (2.8) 15,845 (3.0) (2.6) 0.4Colorado 191 (0.3) 0 2,678 2,678 (4.0) 2,869 (4.3) (5.6) -1.3Connecticut 124 (0.3) 601 —§ 601 (1.4) 725 (1.7) (1.3) 0.4Delaware 2 (0.2) 5 —§ 5 (0.5) 7 (0.7) (0.6) 0.1District of Columbia 101 (1.3) 27 —§ 27 (0.3) 128 (1.6) (2.1) -0.5Florida 905 (0.4) 3,281 —§ 3,281 (1.4) 4,186 (1.8) (1.5) 0.3Georgia 4 (0.1) 73 —§ 73 (2.2) 77 (2.3) (1.3) 1.0Hawaii†† 17 (0.3) 138 —§ 138 (2.2) 156 (2.5) (3.9) -1.4Idaho 90 (0.4) 171 1,138 1,309 (5.5) 1,399 (5.9) (5.4) 0.5Illinois 2,017 (1.2) 8,082 —§ 8,082 (4.8) 10,099 (6.1) (5.5) 0.6Indiana 326 (0.4) 804 —§ 804 (0.9) 1,129 (1.3) (1.2) 0.1Iowa 188 (0.5) 500 —§ 500 (1.2) 688 (1.7) (1.5) 0.2Kansas 118 (0.3) 363 —§ 363 (0.9) 436 (1.1) (1.3) -0.2Kentucky 128 (0.2) 286 —§ 286 (0.5) 414 (0.7) (0.6) 0.1Louisiana 109 (0.2) 27 322 349 (0.5) 458 (0.7) (0.8) -0.1Maine 61 (0.4) 17 541 559 (3.9) 620 (4.3) (3.9) 0.4Maryland 237 (0.3) 494 —§ 494 (0.7) 731 (1.0) (0.9) 0.1Massachusetts 373 (0.5) 843 —§ 843 (1.1) 1,216 (1.5) (1.4) 0.1Michigan 699 (0.6) 1,086 5,540 6,626 (5.3) 7,325 (5.9) (5.5) 0.4Minnesota 32 (0.0) —¶ —¶ 1,149 (1.6) 1,181 (1.6) (1.6) 0.0Mississippi 23 (0.0) —** —§ 23 (0.0) (0.0) 0.0Missouri 377 (0.3) 1,665 —§ 1,665 (1.5) 2,042 (1.8) (2.4) -0.6Montana 49 (0.4) 380 —§ 380 (3.0) 439 (3.5) (3.0) 0.5Nebraska 149 (0.6) 269 —§ 269 (1.1) 418 (1.7) (1.5) 0.2Nevada 85 (0.7) 224 —§ 224 (1.8) 309 (2.5) (1.8) 0.7New Hampshire 30 (0.2) 298 —§ 298 (2.3) 328 (2.5) (2.2) 0.3New Jersey 261 (0.2) 1,458 —§ 1,458 (1.2) 1,719 (1.4) (1.3) 0.1New Mexico 20 (0.2) 27 —§ 27 (0.2) 47 (0.4) (2.0) -1.6New York†† 331 (0.1) 1,335 —§ 1,335 (0.6) 1,666 (0.7) (0.7) 0.0North Carolina†† 162 (0.1) 871 —§ 871 (0.7) 1,032 (0.8) (0.8) 0.0North Dakota 0 (0.0) 6 123 130 (1.8) 130 (1.8) (1.0) 0.8Ohio 650 (0.4) —¶ —¶ 2,665 (1.6) 3,315 (2.0) (1.5) 0.5Oklahoma 66 (0.1) 179 493 672 (1.2) 738 (1.3) (1.1) 0.2Oregon 72 (0.2) 3,010 —§ 3,010 (6.4) 3,010 (6.4) (5.9) 0.5Pennsylvania 643 (0.4) —¶ —¶ 2,339 (1.5) 2,982 (2.0) (1.8) 0.2Rhode Island 45 (0.4) 94 —§ 94 (0.8) 139 (1.1) (1.0) 0.1South Carolina NA NA NA (1.1) South Dakota 41 (0.3) 182 —§ 182 (1.5) 223 (1.8) (1.2) 0.6Tennessee 162 (0.2) 905 —§ 905 (1.1) 1,066 (1.2) (0.7) 0.5Texas 2,112 (0.5) —¶ —¶ 4,936 (1.2) 7,048 (1.7) (1.5) 0.2
Houston NA NA NA NA 22 (0.9) (0.1) 0.8Utah 83 (0.2) 6 2,010 2,016 (3.7) 2,099 (3.8) (3.8) 0.0Vermont 30 (0.4) 14 371 385 (5.7) 415 (6.1) (5.7) 0.4Virginia 48 (0.0) 427 —§ 427 (0.4) 474 (0.5) (1.0) -0.5Washington†† 1,092 (1.2) 274 2,774 3,048 (3.5) 4,077 (4.6) (4.7) -0.1West Virginia 262 (1.2) —** —§ 262 (1.2) (0.2) 1.0Wisconsin 472 (0.5) 276 3,631 3,907 (4.0) 4,380 (4.5) (4.5) 0.0Wyoming 28 (0.3) 155 —§ 155 (1.9) 183 (2.3) NA NA
See footnotes on page 612.
School vaccination assessments provide valuable information for state and local immunization programs about vaccina-tion coverage, exemptions, and clustering of unvaccinated kindergarteners in schools, where the potential for disease transmission is higher. Data at the state level alone can mask areas of undervaccination. Health departments can access and use local school vaccination assessment data to target areas
Morbidity and Mortality Weekly Report
612 MMWR / August 2, 2013 / Vol. 62 / No. 30
for vaccination interventions during outbreaks of vaccine-preventable disease. This information also can be used by health departments and schools to develop evidence-based health communication strategies and other interventions that protect kindergarteners and the community against vaccine-preventable diseases.
References1. Orenstein W, Hinman A. The immunization system in the United States:
the role of school immunization laws. Vaccine 1999;17(Suppl 3):S19–24.2. US Department of Health and Human Services. Healthy people 2020:
immunization and infectious diseases. Washington, DC: US Department of Health and Human Services; 2010. Available at http://www.healthypeople.gov/2020/topicsobjectives2020/overview.aspx?topicId=23.
3. Gay N. The theory of measles elimination: implications for the design of elimination strategies. J Infect Dis 2004;189(Suppl 1):S27–35.
4. CDC. Two measles outbreaks after importation—Utah, March–June 2011. MMWR 2013;62:222–5.
TABLE 2. (Continued) Weighted number and percentage* of children enrolled in kindergarten with a reported exemption to vaccination, by state/area and type of exemption — United States, 2012–13 school year
State/Area
Medical exemptions† Nonmedical exemptions† Total exemptions†
No. (%)Religious
no.Philosophic
no. Total no. (%) Total no. 2012–13 (%) 2011–12 (%)
Percentage point
difference
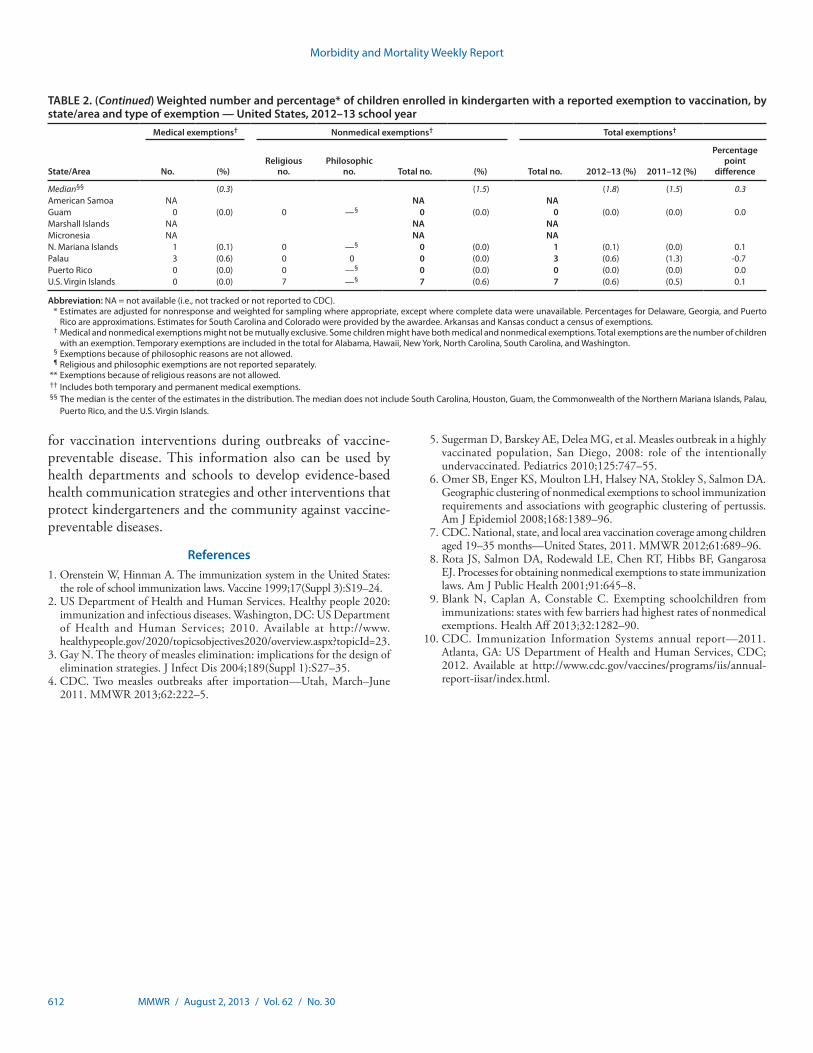
Median§§ (0.3) (1.5) (1.8) (1.5) 0.3American Samoa NA NA NA Guam 0 (0.0) 0 —§ 0 (0.0) 0 (0.0) (0.0) 0.0Marshall Islands NA NA NA Micronesia NA NA NA N. Mariana Islands 1 (0.1) 0 —§ 0 (0.0) 1 (0.1) (0.0) 0.1Palau 3 (0.6) 0 0 0 (0.0) 3 (0.6) (1.3) -0.7Puerto Rico 0 (0.0) 0 —§ 0 (0.0) 0 (0.0) (0.0) 0.0U.S. Virgin Islands 0 (0.0) 7 —§ 7 (0.6) 7 (0.6) (0.5) 0.1
Abbreviation: NA = not available (i.e., not tracked or not reported to CDC). * Estimates are adjusted for nonresponse and weighted for sampling where appropriate, except where complete data were unavailable. Percentages for Delaware, Georgia, and Puerto
Rico are approximations. Estimates for South Carolina and Colorado were provided by the awardee. Arkansas and Kansas conduct a census of exemptions. † Medical and nonmedical exemptions might not be mutually exclusive. Some children might have both medical and nonmedical exemptions. Total exemptions are the number of children
with an exemption. Temporary exemptions are included in the total for Alabama, Hawaii, New York, North Carolina, South Carolina, and Washington. § Exemptions because of philosophic reasons are not allowed. ¶ Religious and philosophic exemptions are not reported separately. ** Exemptions because of religious reasons are not allowed. †† Includes both temporary and permanent medical exemptions. §§ The median is the center of the estimates in the distribution. The median does not include South Carolina, Houston, Guam, the Commonwealth of the Northern Mariana Islands, Palau,
Puerto Rico, and the U.S. Virgin Islands.
5. Sugerman D, Barskey AE, Delea MG, et al. Measles outbreak in a highly vaccinated population, San Diego, 2008: role of the intentionally undervaccinated. Pediatrics 2010;125:747–55.
6. Omer SB, Enger KS, Moulton LH, Halsey NA, Stokley S, Salmon DA. Geographic clustering of nonmedical exemptions to school immunization requirements and associations with geographic clustering of pertussis. Am J Epidemiol 2008;168:1389–96.
7. CDC. National, state, and local area vaccination coverage among children aged 19–35 months—United States, 2011. MMWR 2012;61:689–96.
8. Rota JS, Salmon DA, Rodewald LE, Chen RT, Hibbs BF, Gangarosa EJ. Processes for obtaining nonmedical exemptions to state immunization laws. Am J Public Health 2001;91:645–8.
9. Blank N, Caplan A, Constable C. Exempting schoolchildren from immunizations: states with few barriers had highest rates of nonmedical exemptions. Health Aff 2013;32:1282–90.
10. CDC. Immunization Information Systems annual report—2011. Atlanta, GA: US Department of Health and Human Services, CDC; 2012. Available at http://www.cdc.gov/vaccines/programs/iis/annual-report-iisar/index.html.
Morbidity and Mortality Weekly Report
MMWR / August 2, 2013 / Vol. 62 / No. 30 613
Notes from the Field
Use of Electronic Messaging and the News Media to Increase Case Finding During a Cyclospora Outbreak — Iowa, July 2013
On Friday, June 28, 2013, the Iowa Department of Public Health (IDPH) routinely reported two cases of cyclosporiasis in its weekly electronic newsletter, the EPI Update. The newslet-ter’s primary audience consists of Iowa’s public health officials and health-care providers, but readers also include members of the news media.
By Wednesday, July 3, an additional four cases had been reported to IDPH, indicating that an outbreak could be occurring (before 2013, only 10 cases had been reported in Iowa). In response, IDPH released a special EPI Update Alert and a Health Alert Network alert to all hospitals, emergency departments, infection preventionists, public health agencies, and other health-care providers in Iowa. Both electronic alerts included information on symptoms of cyclosporiasis, and diagnosis and treatment guidelines. By July 4, when a CDC Epidemic Information Exchange alert was issued, most major media outlets in Iowa had reported on the outbreak. An e-mail press release with updated information was issued on July 8 to nearly 400 members of the news media, and the first round of 14 messages was sent to 5,282 Twitter followers. By July 9, daily updates, including case counts, were being requested by the media and posted on the IDPH website. Over the next several weeks, as health-care providers and the public became aware of the outbreak, many Iowans were tested and given diagnoses of cyclosporiasis.
Cyclospora, a coccidian parasite, can cause prolonged and relapsing watery diarrhea, which, if untreated, can last several weeks to months (1). This long duration of diarrhea is unusual among foodborne pathogens and allows time for patients to seek medical attention and have their illness diagnosed (1,3). Testing for Cyclospora is not routinely done in most U.S. laboratories, even when stool specimens are tested for para-sites; health-care providers must specifically request testing for Cyclospora when indicated. The preferred treatment for cyclosporiasis is trimethoprim-sulfamethoxazole; to date, no reliably effective alternative treatments have been identified (1,3). Cyclospora is not spread from person to person because excreted oocysts require several days to weeks outside the host to become infectious. Previous outbreaks in the United States have been associated with fruits (i.e., raspberries [2]) and raw vegetables (i.e., mesclun lettuce, basil, and snow peas [3]).
As of July 26, nearly all of Iowa’s 135 reported cases of cyclosporiasis had been diagnosed by testing at the state’s
public health laboratory, the State Hygienic Laboratory (SHL) (Figure). The two initial cases, reported in the June 28 issue of EPI Update, were diagnosed by a laboratorian at SHL who identified possible Cyclospora oocysts on microscopic examina-tion of fresh stool and confirmed this diagnosis using a modi-fied acid-fast stain technique. In June at SHL, before electronic messaging was used and media attention was attracted, 271 stool tests for ova and parasites were requested but none spe-cifically for Cyclospora. In contrast, during the first 23 days of July, requests for general ova and parasite stool tests had increased to 762, and specific Cyclospora testing was requested on 1,460 specimens.
In addition to case ascertainment, increased attention by the news media and health department notifications led to improved diagnosis and treatment. For example, one patient with severe vomiting and diarrhea was discharged without a diagnosis after a 5-day hospital stay and extensive laboratory testing, only to relapse days later. After reading the EPI Update Alert, the patient’s health-care provider ordered Cyclospora testing on the patient, and the result was positive. The patient was treated with trimethoprim-sulfamethoxazole, and the symptoms resolved.
The use of electronic messaging and media attention in the early stages of this outbreak investigation provided public health agencies a unique opportunity to increase testing for this uncommon disease, which might not otherwise have been considered by health-care providers or their patients. After diagnosis and case reporting, patients provided IDPH with valuable information on their potential exposures to Cyclospora, increasing the power of statistical analyses and the likelihood of finding the source of the infection. The Cyclospora outbreak investigation is ongoing.
Reported by
Nicholas Kalas, MPH, Patricia Quinlisk, MD, Iowa Dept of Public Health. Corresponding contributor: Nicholas Kalas, [email protected], 515-242-6027
References1. Herwaldt BL. Cyclospora cayetanensis: a review, focusing on the outbreaks
of cyclosporiasis in the 1990s. Clin Infect Dis 2000;31:1040–57.2. Ho AY, Lopez AS, Eberhart MG, et al. Outbreak of cyclosporiasis
associated with imported raspberries, Philadelphia, Pennsylvania, 2000. Emerg Infect Dis 2002;8:783–8.
3. Ortega Ynes R, Sanchez R. Update on Cyclospora cayetanensis, a food-borne and waterborne parasite. Clin Microbiol Rev 2010;23:218–34.
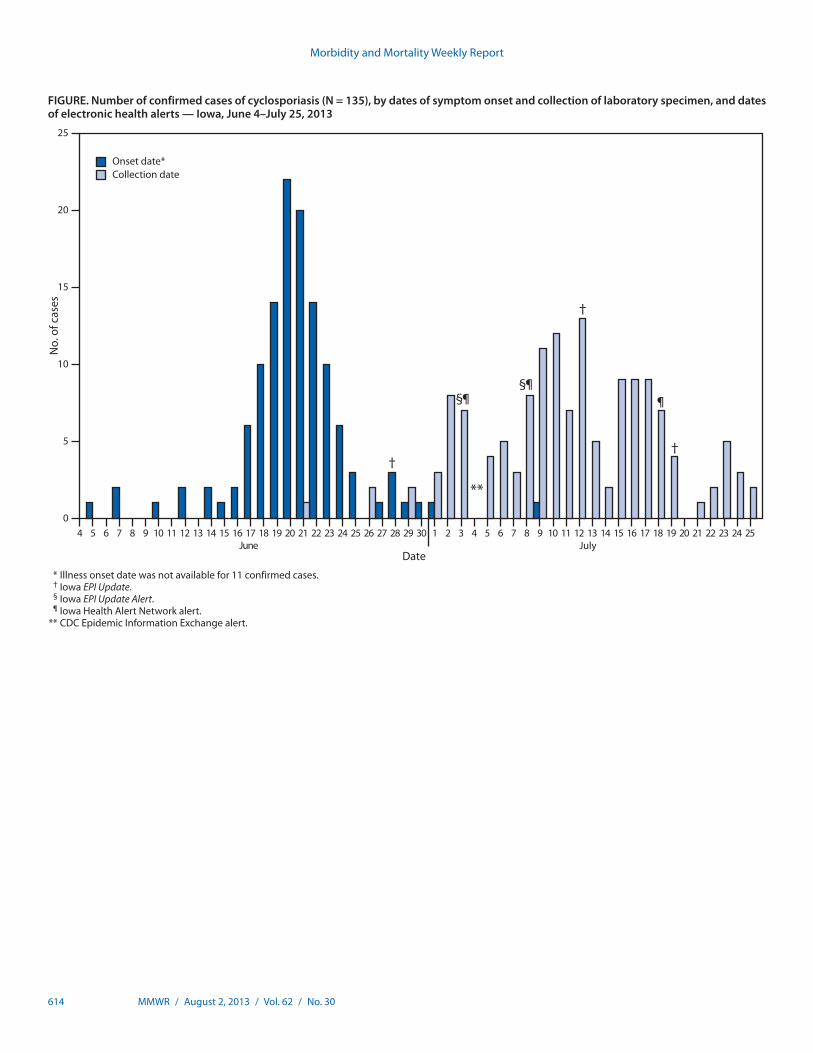
Morbidity and Mortality Weekly Report
614 MMWR / August 2, 2013 / Vol. 62 / No. 30
FIGURE. Number of confirmed cases of cyclosporiasis (N = 135), by dates of symptom onset and collection of laboratory specimen, and dates of electronic health alerts — Iowa, June 4–July 25, 2013
0
5
10
15
20
25
4 5 6 7 8 9 10 11 12 13 14 15 16 17 18 19 20 21 22 23 24 25 26 27 28 29 30 1 2 3 4 5 6 7 8 9 10 11 12 13 14 15 16 17 18 19 20 21 22 23 24
No.
of c
ases
DateJune July
†
§¶
**
§
†
†
Onset date*Collection date
25
¶¶
* Illness onset date was not available for 11 confirmed cases. † Iowa EPI Update. § Iowa EPI Update Alert. ¶ Iowa Health Alert Network alert. ** CDC Epidemic Information Exchange alert.
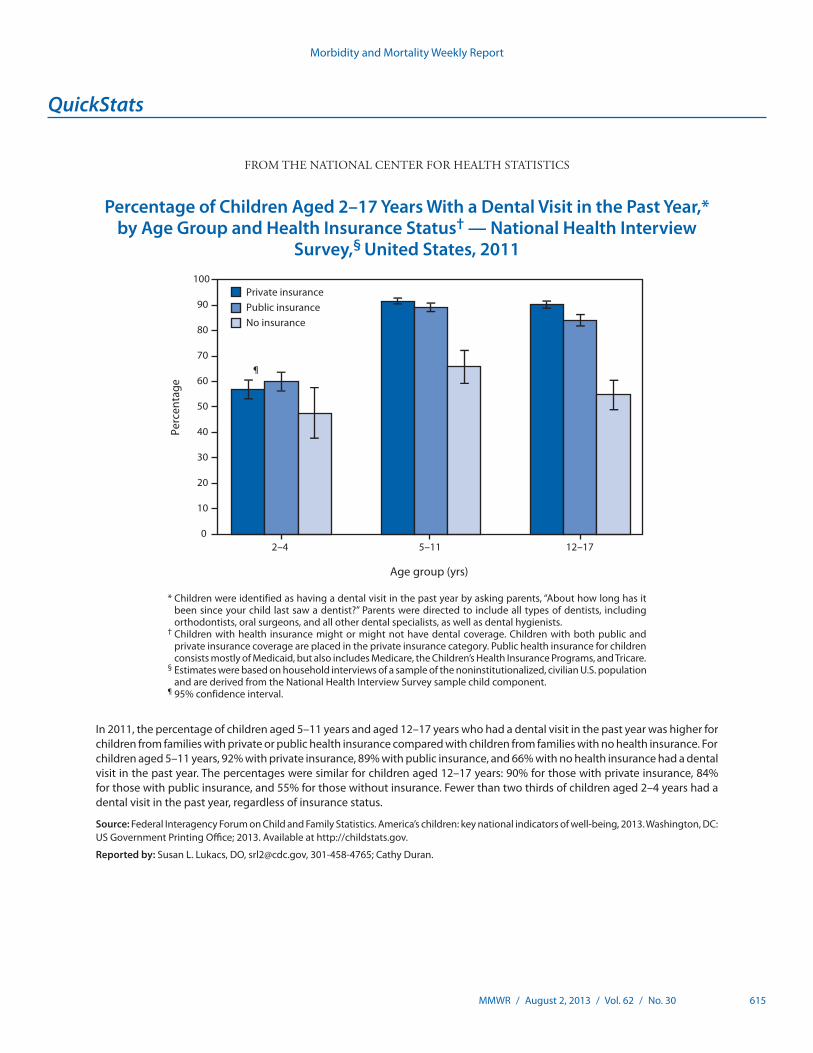
Morbidity and Mortality Weekly Report
MMWR / August 2, 2013 / Vol. 62 / No. 30 615
* Children were identified as having a dental visit in the past year by asking parents, “About how long has it been since your child last saw a dentist?” Parents were directed to include all types of dentists, including orthodontists, oral surgeons, and all other dental specialists, as well as dental hygienists.
† Children with health insurance might or might not have dental coverage. Children with both public and private insurance coverage are placed in the private insurance category. Public health insurance for children consists mostly of Medicaid, but also includes Medicare, the Children’s Health Insurance Programs, and Tricare.
§ Estimates were based on household interviews of a sample of the noninstitutionalized, civilian U.S. population and are derived from the National Health Interview Survey sample child component.
¶ 95% confidence interval.
In 2011, the percentage of children aged 5–11 years and aged 12–17 years who had a dental visit in the past year was higher for children from families with private or public health insurance compared with children from families with no health insurance. For children aged 5–11 years, 92% with private insurance, 89% with public insurance, and 66% with no health insurance had a dental visit in the past year. The percentages were similar for children aged 12–17 years: 90% for those with private insurance, 84% for those with public insurance, and 55% for those without insurance. Fewer than two thirds of children aged 2–4 years had a dental visit in the past year, regardless of insurance status.
Source: Federal Interagency Forum on Child and Family Statistics. America’s children: key national indicators of well-being, 2013. Washington, DC: US Government Printing Office; 2013. Available at http://childstats.gov.
Reported by: Susan L. Lukacs, DO, [email protected], 301-458-4765; Cathy Duran.
0
10
20
30
40
50
60
70
80
90
100
2–4 5–11 12–17
Perc
enta
ge
Age group (yrs)
Private insurancePublic insuranceNo insurance
¶
QuickStats
FROM THE NATIONAL CENTER FOR HEALTH STATISTICS
Percentage of Children Aged 2–17 Years With a Dental Visit in the Past Year,* by Age Group and Health Insurance Status† — National Health Interview
Survey,§ United States, 2011
U.S. Government Printing Office: 2013-623-030/01017 Region IV ISSN: 0149-2195
The Morbidity and Mortality Weekly Report (MMWR) Series is prepared by the Centers for Disease Control and Prevention (CDC) and is available free of charge in electronic format. To receive an electronic copy each week, visit MMWR’s free subscription page at http://www.cdc.gov/mmwr/mmwrsubscribe.html. Paper copy subscriptions are available through the Superintendent of Documents, U.S. Government Printing Office, Washington, DC 20402; telephone 202-512-1800.
Data presented by the Notifiable Disease Data Team and 122 Cities Mortality Data Team in the weekly MMWR are provisional, based on weekly reports to CDC by state health departments. Address all inquiries about the MMWR Series, including material to be considered for publication, to Editor, MMWR Series, Mailstop E-90, CDC, 1600 Clifton Rd., N.E., Atlanta, GA 30333 or to [email protected].
All material in the MMWR Series is in the public domain and may be used and reprinted without permission; citation as to source, however, is appreciated.
Use of trade names and commercial sources is for identification only and does not imply endorsement by the U.S. Department of Health and Human Services.
References to non-CDC sites on the Internet are provided as a service to MMWR readers and do not constitute or imply endorsement of these organizations or their programs by CDC or the U.S. Department of Health and Human Services. CDC is not responsible for the content of these sites. URL addresses listed in MMWR were current as of the date of publication.
Morbidity and Mortality Weekly Report