Fintech Scoping in South Africa - National Treasury Scopi… · The industry’s market segments...
89
Fintech Scoping in South Africa October 2019
Transcript of Fintech Scoping in South Africa - National Treasury Scopi… · The industry’s market segments...

Fintech Scoping in South AfricaOctober 2019

The views and recommendations put forward in this report are the views and opinions of the independent service provider,
Genesis Analytics (“Genesis”). The recommendations are based solely on the research and analysis done by Genesis, and are
not the views of the members of the IFWG (South African Reserve Bank, Financial Intelligence Centre, Financial Sector
Conduct Authority, National Treasury, National Credit Regulator, and South African Revenue Service), The World Bank Group
or The Swiss State Secretariat for Economic Affairs (SECO).
Disclaimer

Overview
Segmentation
Market diagnostics
Segment Prioritisation
Insights from industry
Recommendations
Appendices
Table of Contents
Financial technology (fintech) is transforming the financial services sector across the globe. It holds the potential to improve efficiency and
reduce operating costs for providers, allow seamless, real-time customer transactions, and drive hyper-personalisation by improving an
understanding of the needs and behaviour of customers. This presents significant benefits in not only improving the efficiency of the financial
sector, but also enhancing the financial health of South Africans - including those in previously excluded financial segments, by meeting their
needs to manage risk and grow their wealth. Supporting the development of fintechs provides an opportunity not only to solve for payment,
credit and remittance problems, but also provide accessible and appropriate financial products such as investments, savings and insurance at
scale.
South Africa’s financial services sector is internationally recognised as one of the most sophisticated. In the last decade, this has been
complemented by a small, but fast-growing fintech community. While South African fintechs are world-class – three being listed in the “fintech
100” list in 2016, incumbents continue to dominate the financial sector making it challenging for fintechs to find scale. This is further
exacerbated by a risk-averse funding environment, a shortage of entrepreneurial skills and South Africa’s complex regulatory environment.
This report seeks to map the current landscape of fintechs in South Africa and in understanding the sector, will serve to support regulators and
policymakers as they make decisions to enable more solution-orientated engagement among the industry’s stakeholders (e.g. incubators,
venture capitalists, new fintech start-ups etc.). The analysis begins by capturing all active fintechs in the South African market and segmenting
them by function. The fintech market size of each segment is then estimated and compared to the total segment size. International trends and
fintech business models are assessed to determine the potential growth of each segment. A sample of fintech entrepreneurs were interviewed
to understand their journey, the challenges they face, and their perceptions of the regulatory environment. Using this as an input, the analysis
then focuses on financial services regulation in SA and concludes with recommendations on how regulators can support the fintech sector.
For the purpose of this report, “fintech” is defined as advanced technology firms that have the potential to transform the provision of
financial services spurring the development of new business models, applications, & whose products and services are directly
applicable in the delivery of financial services.1 Our analysis covers firms which originated as start-ups, founded from 2008 onwards
and have a physical presence in South Africa. The focus will be on small, start-up, agile and independent fintech businesses to understand
drivers that support and challenge innovation in this sector.
SA has a small but fast-growing fintech industry, presenting considerable benefits and risks.
As a result, regulators need an understanding of the fintech landscape in South Africa in
order to manage risks in a way that does not stifle innovation.
2Sources : 1. Adapted from IMF Policy Paper; The Bali fintech Agenda; August 2018.
Overview
Segmentation
Market diagnostics
Segment Prioritisation
Insights from industry
Recommendations
Appendices
Table of Contents
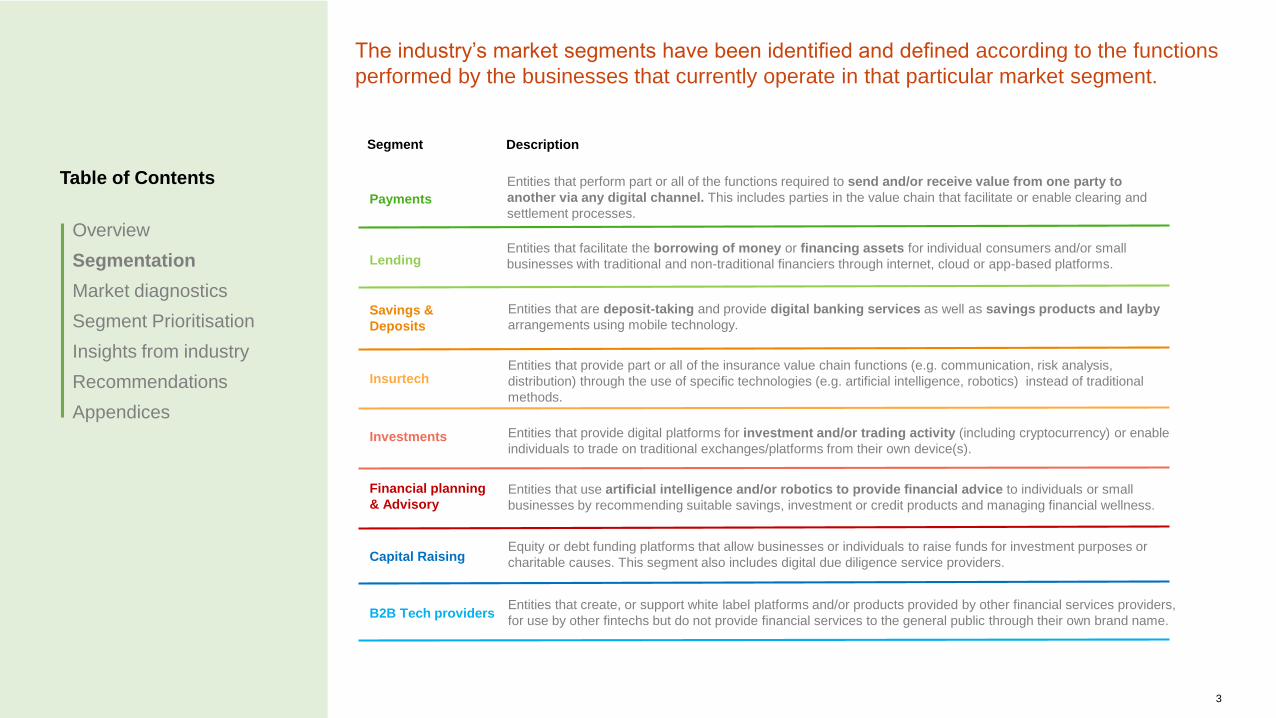
The industry’s market segments have been identified and defined according to the functions
performed by the businesses that currently operate in that particular market segment.
Payments
Entities that perform part or all of the functions required to send and/or receive value from one party to
another via any digital channel. This includes parties in the value chain that facilitate or enable clearing and
settlement processes.
Lending Entities that facilitate the borrowing of money or financing assets for individual consumers and/or small
businesses with traditional and non-traditional financiers through internet, cloud or app-based platforms.
Savings &
Deposits
Entities that are deposit-taking and provide digital banking services as well as savings products and layby
arrangements using mobile technology.
InsurtechEntities that provide part or all of the insurance value chain functions (e.g. communication, risk analysis,
distribution) through the use of specific technologies (e.g. artificial intelligence, robotics) instead of traditional
methods.
Investments Entities that provide digital platforms for investment and/or trading activity (including cryptocurrency) or enable
individuals to trade on traditional exchanges/platforms from their own device(s).
Financial planning
& Advisory Entities that use artificial intelligence and/or robotics to provide financial advice to individuals or small
businesses by recommending suitable savings, investment or credit products and managing financial wellness.
Capital Raising Equity or debt funding platforms that allow businesses or individuals to raise funds for investment purposes or
charitable causes. This segment also includes digital due diligence service providers.
B2B Tech providers Entities that create, or support white label platforms and/or products provided by other financial services providers,
for use by other fintechs but do not provide financial services to the general public through their own brand name.
3
Segment Description

Each segment has been further divided into sub-segments to understand the particular products and services offered
within each fintech segment. Segment
framework
Financial services segmentation
Payments
mPOS (acquirers)
Crypto payments
Cross-border
payments
Closed loop mobile
wallets
(Bill) Payments
aggregators
3rd party payment
providers
Lending
Lending market places
Online (alternative)
lenders1
Alternative scoring
Asset financing
Savings &
DepositsInsurtech
Connected
insurance4
Automated risk
analysis
Digital distributionDigital banking
(issuers)
Digital community
savings
Claims management
Peer-to-peer
insurance5Savings products
Layby2
Investments
Retail trading
Crypto currency
trading
Alternative exchange
Financial
planning &
Advisory
Robo advisory
Personal finance
management
Small business
finance
management
B2B Tech
providers
Aggregators6
Open infra structure
Data applications
Security & ID
Process automation
White label
platforms (solutions)
RegTech & risk
management
Capital raising
Crowd investing
Due diligence3
Notes:
1. Online lenders are distinguished from Lending platforms based on how the loan is funded. If it is funded from the fintech’s balance sheet then it’s an online lender, otherwise, it is a lending market place.
2. Layby includes fintechs that provide layby services online, allowing consumers to pay a fee and a deposit for a good. The good is then held by the retailer while the customer pays per an agreed payment plan.
3. Due diligence includes fintechs that provide a web-based tool that increases due diligence efficiency through alternative digital methods for entrepreneurs, investors and service providers through process automation.
4. Connected insurance includes fintechs that use internet of things to connect devices to insurance services.
5. Peer-to-peer insurance (P2P) is a risk sharing network where a group of individuals pool their premiums together to insure against a risk.
6. Aggregators are fintechs that collect related items or content and display them in one central platform, e.g. Hippo.
*Definitions of each sub-segment can be found in the appendix.
4
Overview
Segmentation
Market diagnostics
Fintech landscape
Operating environment
Future market
Segment Prioritisation
Insights from industry
Recommendations
Appendices
More than 200 fintechs operate in South Africa. This number is expected to grow through
support from innovation hubs and the increasing adoption of technology in financial services.
Payments30%
Lending12%
Savings & Deposits6%
Insurtech9%
Investments10%
Financial planning &
Advisory 7%
Capital raising
4%
B2B Tech Support
20%
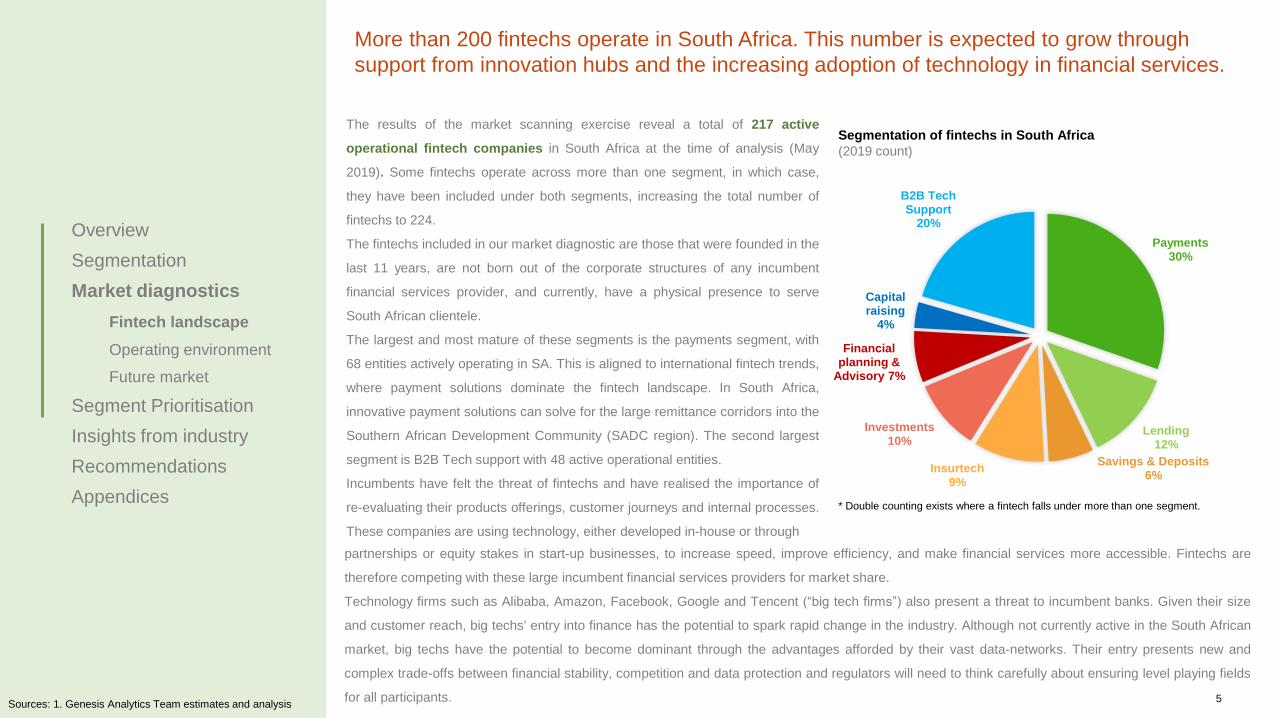
The results of the market scanning exercise reveal a total of 217 active
operational fintech companies in South Africa at the time of analysis (May
2019). Some fintechs operate across more than one segment, in which case,
they have been included under both segments, increasing the total number of
fintechs to 224.
The fintechs included in our market diagnostic are those that were founded in the
last 11 years, are not born out of the corporate structures of any incumbent
financial services provider, and currently, have a physical presence to serve
South African clientele.
The largest and most mature of these segments is the payments segment, with
68 entities actively operating in SA. This is aligned to international fintech trends,
where payment solutions dominate the fintech landscape. In South Africa,
innovative payment solutions can solve for the large remittance corridors into the
Southern African Development Community (SADC region). The second largest
segment is B2B Tech support with 48 active operational entities.
Incumbents have felt the threat of fintechs and have realised the importance of
re-evaluating their products offerings, customer journeys and internal processes.
These companies are using technology, either developed in-house or through
partnerships or equity stakes in start-up businesses, to increase speed, improve efficiency, and make financial services more accessible. Fintechs are
therefore competing with these large incumbent financial services providers for market share.
Technology firms such as Alibaba, Amazon, Facebook, Google and Tencent (“big tech firms”) also present a threat to incumbent banks. Given their size
and customer reach, big techs' entry into finance has the potential to spark rapid change in the industry. Although not currently active in the South African
market, big techs have the potential to become dominant through the advantages afforded by their vast data-networks. Their entry presents new and
complex trade-offs between financial stability, competition and data protection and regulators will need to think carefully about ensuring level playing fields
for all participants.
* Double counting exists where a fintech falls under more than one segment.
Segmentation of fintechs in South Africa
(2019 count)
5Sources: 1. Genesis Analytics Team estimates and analysis

Like many developed markets, the payments segment in South Africa is the most mature segment as it offers
consumers faster and more efficient ways for moving money.
18%
9%
15%
9%7%
38%
4%
Payment aggregators (Bills)
mPOS
Crypto payments
Cross-border payments
Closed loop mobile wallets
3rd party payment providers
Payroll
Payments fintechs by sub-segment (% share)
The majority of Payment fintechs are
Payment Services Providers (third
party).
2019
Proportion of the addressable market served by fintechs
The payments segment is the largest segment with 68 active fintechs and is considered one of the most
mature segments, with an average age of 5 years per firm.
In line with global trends, the growth of fintechs in South Africa (SA) has mainly been in the payments segment. Fintechs have
been able to disrupt a core “banking” service and offer simpler, faster solutions. Increased access to internet and the growth of
e-commerce created the opportunity to facilitate and process digital payments. As a result, a large majority of payment
fintechs are third-party payment providers or payment services providers (PSPs). These fintechs offer retailers the ability to
accept electronic payments via a number of payment rails (e.g. credit card, direct debit, bank transfer, and real-time bank
transfer). The third party sub-segment is relatively mature and can even be described as saturated with very few new entrants
in the market in 2017 or 2018.
In addition to registering as a financial services provider, most payment fintechs must also register as a third party payment
provider (TPPP) or systems operator (SO) (see following page) with the Payments Association of South Africa (PASA).
WiGroup is one of the oldest PSPs; it launched in 2008 as a mobile wallet, and evolved into a facilitator of mobile transaction
services. To date, the company has facilitated over R7 billion of transactions. Some of their customers include big retail
brands such as Pick n Pay, Vodacom, and Woolworths. This fintech has grown from processing an average of R650 million in
value (between the years 2008 to 2016), to processing R1.8 billion of transactions in 2017.
Some solutions have been designed specifically for the large remittance market; many workers who remit money back to
families fall into low income segments and although they may have a banking product, they are reliant on cash. While most of
the 11 remittance fintechs were developed in South Africa to service the South African market, Zoona was developed in
South Africa but services markets outside the country. Zoona initially received funding to operate in Zambia, where financial
inclusion is comparatively low, and has extended operations to Malawi and Mozambique. Zoona provides retail and wholesale
savings products and payment solutions, such as to send and receive money (bulk payments, bill payments). Since inception,
Zoona has processed over USD 2 billion (about R27.9 billion) in transactions. Banks in SA are addressing this market with
innovative ATM solutions that allow customers to send money to family, who withdraw using a PIN at an ATM and do not need
an account with the bank. They also have partnerships with retailers that allow customers to withdraw money at the till.
The crypto payments sub-segment in contrast is very immature. While platforms such as Luno and VALR provide crypto
wallets, these fintechs are mainly considered crypto currency trading platforms. Their platforms have focused on the buying
and selling of crypto currencies for investment purposes with very low payment transaction values and volume – there are few
merchants that accept crypto payments.
97%
3% 6%
94%
Total addressable
market
Fintech
Transactional values Transactional volumes
Approximately 3% of total
transaction values go through
fintechs, 6% in terms of
volumes. This is an
aggressive estimation,
estimating the maximum
possible proportion fintechs
would capture, and is
possibly lower in reality.
Payments
Segment
6Sources: 1. Genesis Analytics Team estimates and analysis

There are a number of “non-bank” entities that have been operational for many years and that are registered to
facilitate digital payments. Some of these businesses are also offering innovative payment services and can be
classified as fintechs.
Payments
Segment
7Sources: 1. Payments Association of South Africa | 2. Genesis Analytics Team estimates and analysis | 3. PASA defines fintech as technology and innovation that aims to compete with
traditional financial methods in the delivery of financial services (Payments Study Tour Report, PWC, August 2019) | See appendix for list of all SOs and TPPPs
The National Payment Systems Act, 1998 (NPS Act) regulates payment systems in South Africa, and established the Payments Association of South
Africa (or PASA) as the body responsible for overseeing the participation of banks and non-bank role-players in the South African payment system.
There are two categories of non-bank role-players dealt with under the NPS Act framework – SOs and TPPPs:
Settlement Participants
Clearing participants
System Operators
Third Party payment providers
• SOs are non-banks that provide services in relation to payment instructions,
i.e. they provide electronic means to persons to make or receive payments.
SOs are authorised in terms of the SARB Directive 2 of 2007 by PASA and
must be registered as members of PASA.
• Various entities which effectively facilitate the transfer of information between
a payment portal and a payment provider or acquiring bank have been
authorised as system operators in compliance with the NPS Act.
• A TPPP accepts money or payment instructions from persons for the purpose
of making payments on behalf of those persons to third parties to whom those
payments are due.
• For example, a merchant is able to accept money from customers for the
payment of their utility bills.
• A TPPP may hold funds in its own bank account for a short period of time
prior to paying those funds over to the third party concerned. This differs from
system operators, which provide the technology behind payments but
typically do not receive money or the proceeds of payment instructions.
• There is some overlap of fintechs, SOs and TPPPs. There are some SOs or
TPPPs with innovative business models, providing new payment services that
are classified as fintechs.3
System operators (% share)
Third Party payment providers (% share)
Registered SOs and TPPPs that can be
classified as fintechs
Non-fintechs
Fintechs
15.6%
84.4%
7.3%
Non-fintechs
92.7%
Fintechs
Lending fintechs in South Africa have shown significant potential with many new players entering the market, but the
segment has only captured a small share of the addressable market to date.
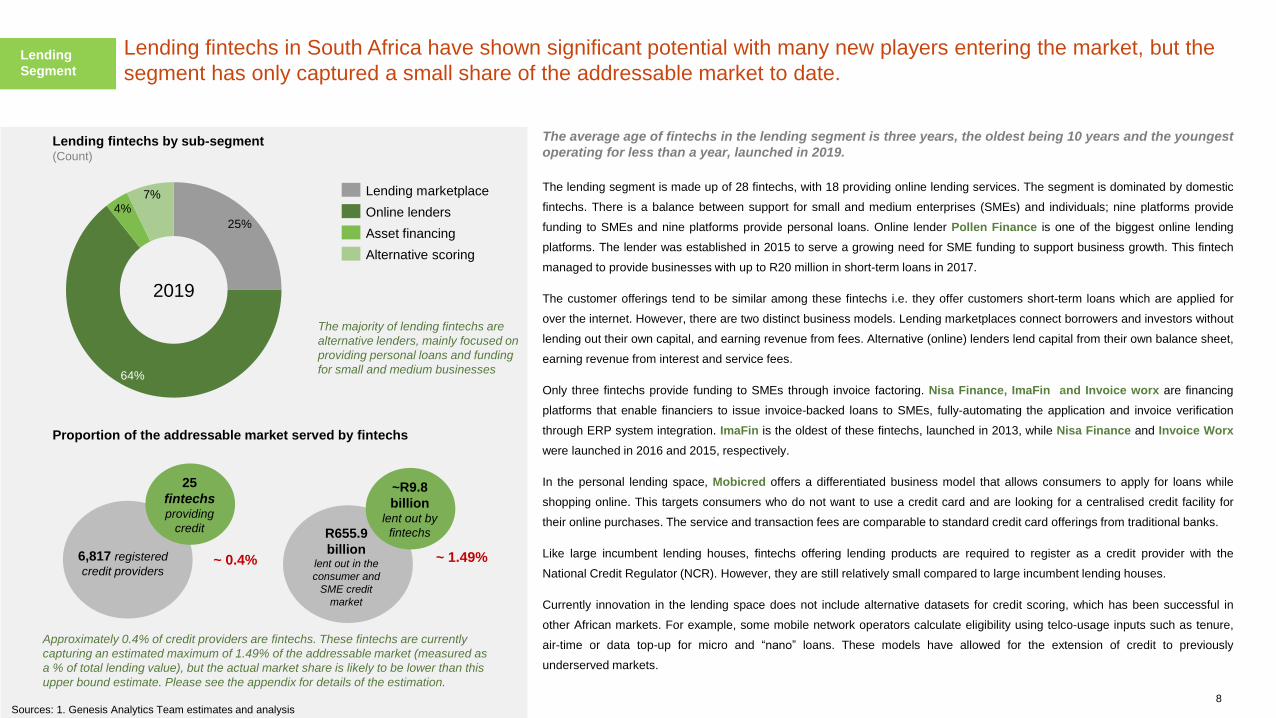
The average age of fintechs in the lending segment is three years, the oldest being 10 years and the youngest
operating for less than a year, launched in 2019.
The lending segment is made up of 28 fintechs, with 18 providing online lending services. The segment is dominated by domestic
fintechs. There is a balance between support for small and medium enterprises (SMEs) and individuals; nine platforms provide
funding to SMEs and nine platforms provide personal loans. Online lender Pollen Finance is one of the biggest online lending
platforms. The lender was established in 2015 to serve a growing need for SME funding to support business growth. This fintech
managed to provide businesses with up to R20 million in short-term loans in 2017.
The customer offerings tend to be similar among these fintechs i.e. they offer customers short-term loans which are applied for
over the internet. However, there are two distinct business models. Lending marketplaces connect borrowers and investors without
lending out their own capital, and earning revenue from fees. Alternative (online) lenders lend capital from their own balance sheet,
earning revenue from interest and service fees.
Only three fintechs provide funding to SMEs through invoice factoring. Nisa Finance, ImaFin and Invoice worx are financing
platforms that enable financiers to issue invoice-backed loans to SMEs, fully-automating the application and invoice verification
through ERP system integration. ImaFin is the oldest of these fintechs, launched in 2013, while Nisa Finance and Invoice Worx
were launched in 2016 and 2015, respectively.
In the personal lending space, Mobicred offers a differentiated business model that allows consumers to apply for loans while
shopping online. This targets consumers who do not want to use a credit card and are looking for a centralised credit facility for
their online purchases. The service and transaction fees are comparable to standard credit card offerings from traditional banks.
Like large incumbent lending houses, fintechs offering lending products are required to register as a credit provider with the
National Credit Regulator (NCR). However, they are still relatively small compared to large incumbent lending houses.
Currently innovation in the lending space does not include alternative datasets for credit scoring, which has been successful in
other African markets. For example, some mobile network operators calculate eligibility using telco-usage inputs such as tenure,
air-time or data top-up for micro and “nano” loans. These models have allowed for the extension of credit to previously
underserved markets.
25%
64%
4%
7% Lending marketplace
Online lenders
Alternative scoring
Asset financing
Lending fintechs by sub-segment (Count)
The majority of lending fintechs are
alternative lenders, mainly focused on
providing personal loans and funding
for small and medium businesses
25
fintechs providing
credit
6,817 registered
credit providers
~R9.8
billionlent out by
fintechs R655.9
billion lent out in the
consumer and
SME credit
market
2019
Approximately 0.4% of credit providers are fintechs. These fintechs are currently
capturing an estimated maximum of 1.49% of the addressable market (measured as
a % of total lending value), but the actual market share is likely to be lower than this
upper bound estimate. Please see the appendix for details of the estimation.
Proportion of the addressable market served by fintechs
Lending
Segment
~ 1.49%~ 0.4%
8Sources: 1. Genesis Analytics Team estimates and analysis

The Savings & Deposit segment is small in comparison to traditional banks, but there has been much activity in terms
of new players entering the market.
29%
29%
21%
21%
Layby
Digital banking
Digital community
savings
Savings products
Savings & Deposits fintechs by sub-segment
(Count)
The majority of fintechs are digital
banking and digital community
savings players, both of which
account for 29% of the market
2019
Proportion of the addressable market serviced by fintechs
About 291
thousand customers
28.7 million Banked
population
1.2 billion deposits
1.3
trillionDeposits in
2017
Savings & Deposit fintechs in South Africa currently serve approximately 1.0% of the
banked population, but only capture an upper-bound estimate of 0.09% of the total
value of deposits taken.
The entrance of new digital banks in the market is expected to change the landscape and provide strong
competition to traditional banks.
The Savings & Deposit segment is made up of 14 fintechs, including four digital banks and digital community savings
platforms. Deposit-taking is a heavily regulated function and this has historically protected the market from new entrants.
Applicants for a banking licence are subject to obligations concerning capital and liquidity ratios and reserve requirements and
are difficult to acquire.
In 2019, new digital banks are expected to disrupt the market and are already recording increasing consumer numbers. Tyme
Bank is reportedly signing 5,000 new customers each week, with a reported total of 250,000 customers in April 2019,
following its soft-launch in November 2018. Hello Paisa, which already provides payments solutions and has also launched a
digital bank, is expected to leverage the 1.2 million users who use their payments platform. Early indications show that
incumbent banks are taking the threat of fintechs seriously with a number of banks focusing on product innovation and
lowering fees.
Fomo Travel, Layby Café and Lay Up are three fintechs that provide layby services online, allowing consumers to pay a
deposit toward a good while the retailer in turn holds the good until the customer can pay the balance. Customers usually
have a payment plan as part of the deal and are charged a fee. Layby Café has reported serving 2,350 consumers by 2015,
only a year from being launched. Overall consumer numbers remain low for these platforms as most customers will have the
option of a credit card which allows the customer to purchase the good immediately.
The savings product sub-segment includes fintechs such as Jumo, Zoona and Prospa. Prospa provides a mobile savings
wallet for low-income earning South Africans that makes it easy to save small amounts infrequently using prepaid vouchers.
Prospa then pools all savings on its platform, taking advantage of banks’ higher interest rates for larger savings balances. The
sub-segment is still young with only one fintech operating purely as a savings platform.
Savings &
Deposits
Segment
~ 0.09%~ 1.0%
9Sources: 1. Genesis Analytics Team estimates and analysis
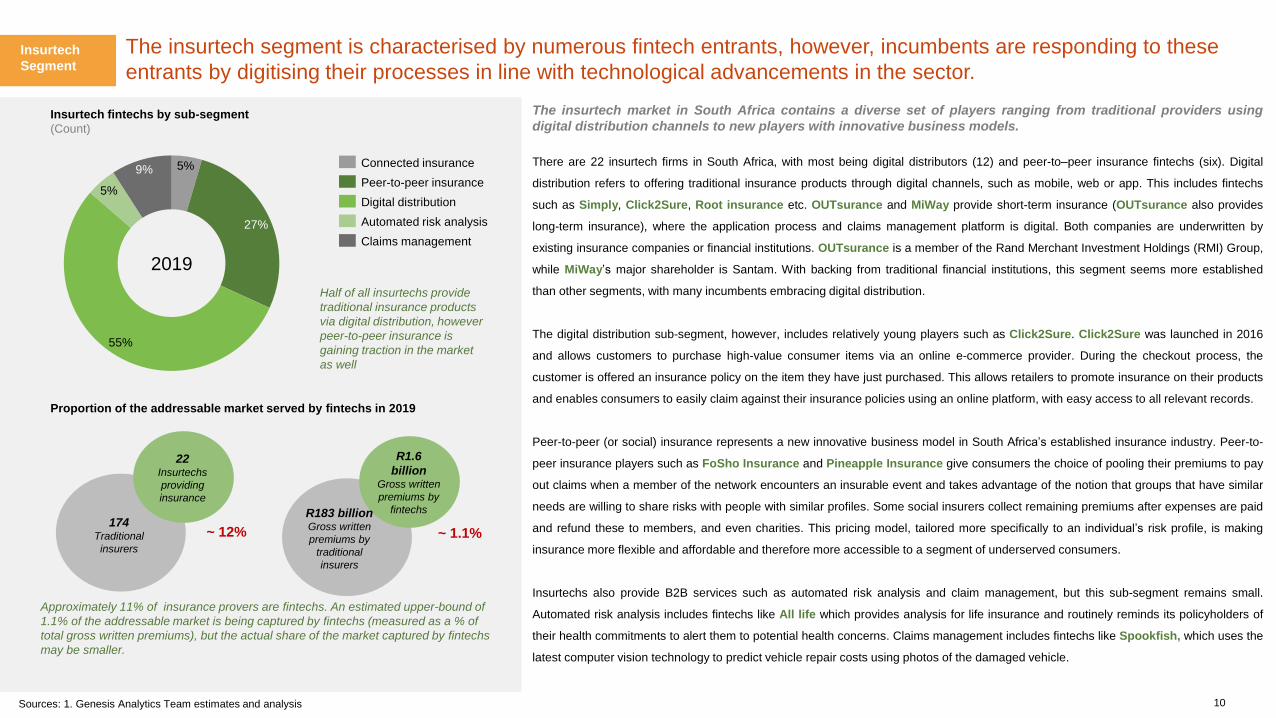
The insurtech segment is characterised by numerous fintech entrants, however, incumbents are responding to these
entrants by digitising their processes in line with technological advancements in the sector.
5%
27%
55%
5%
9%Connected insurance
Automated risk analysis
Claims management
Peer-to-peer insurance
Digital distribution
Insurtech fintechs by sub-segment
(Count)
Half of all insurtechs provide
traditional insurance products
via digital distribution, however
peer-to-peer insurance is
gaining traction in the market
as well
2019
Proportion of the addressable market served by fintechs in 2019
Approximately 11% of insurance provers are fintechs. An estimated upper-bound of
1.1% of the addressable market is being captured by fintechs (measured as a % of
total gross written premiums), but the actual share of the market captured by fintechs
may be smaller.
The insurtech market in South Africa contains a diverse set of players ranging from traditional providers using
digital distribution channels to new players with innovative business models.
There are 22 insurtech firms in South Africa, with most being digital distributors (12) and peer-to–peer insurance fintechs (six). Digital
distribution refers to offering traditional insurance products through digital channels, such as mobile, web or app. This includes fintechs
such as Simply, Click2Sure, Root insurance etc. OUTsurance and MiWay provide short-term insurance (OUTsurance also provides
long-term insurance), where the application process and claims management platform is digital. Both companies are underwritten by
existing insurance companies or financial institutions. OUTsurance is a member of the Rand Merchant Investment Holdings (RMI) Group,
while MiWay’s major shareholder is Santam. With backing from traditional financial institutions, this segment seems more established
than other segments, with many incumbents embracing digital distribution.
The digital distribution sub-segment, however, includes relatively young players such as Click2Sure. Click2Sure was launched in 2016
and allows customers to purchase high-value consumer items via an online e-commerce provider. During the checkout process, the
customer is offered an insurance policy on the item they have just purchased. This allows retailers to promote insurance on their products
and enables consumers to easily claim against their insurance policies using an online platform, with easy access to all relevant records.
Peer-to-peer (or social) insurance represents a new innovative business model in South Africa’s established insurance industry. Peer-to-
peer insurance players such as FoSho Insurance and Pineapple Insurance give consumers the choice of pooling their premiums to pay
out claims when a member of the network encounters an insurable event and takes advantage of the notion that groups that have similar
needs are willing to share risks with people with similar profiles. Some social insurers collect remaining premiums after expenses are paid
and refund these to members, and even charities. This pricing model, tailored more specifically to an individual’s risk profile, is making
insurance more flexible and affordable and therefore more accessible to a segment of underserved consumers.
Insurtechs also provide B2B services such as automated risk analysis and claim management, but this sub-segment remains small.
Automated risk analysis includes fintechs like All life which provides analysis for life insurance and routinely reminds its policyholders of
their health commitments to alert them to potential health concerns. Claims management includes fintechs like Spookfish, which uses the
latest computer vision technology to predict vehicle repair costs using photos of the damaged vehicle.
22Insurtechs
providing
insurance
174 Traditional
insurers
~ 12%
R1.6
billionGross written
premiums by
fintechsR183 billionGross written
premiums by
traditional
insurers
~ 1.1%
Insurtech
Segment
10Sources: 1. Genesis Analytics Team estimates and analysis

Equity trading and investing is a largely exclusive sector in SA, traditionally serving middle and upper income
consumers. Fintechs are making these financial services accessible to the mass market.
30%
48%
22%
Retail trading
Alternative exchange
Cryptocurrency trading
Investment fintechs by sub-segment
(Count)
The majority of local investment
fintechs focus on making
cryptocurrency trading available to
individuals wherever they are.
2019
Proportion of the addressable market serviced by fintechs
(No. of trades per annum, 2018)
Cryptocurrency
trading volumes
are about 1.39% of
all trading activity
in the JSE, while
alternative
exchanges trading
volume are about
0.002%.
The investment segment seems to be underdeveloped, but certain sub-segments such as retail trading are
showing rapid growth as they become more appealing to the mass market.
Similar to insurance, investments are considered secondary financial services. As a result, investment products have been more
attractive for middle to high-income earners who had the means and the intention to increase their wealth. This was further
exacerbated by the high cost linked to transacting in traditional capital markets (e.g. portfolio management / investment advice
fees, trading fees, etc.). However, the entrance of fintechs in the investment space is changing this landscape, making it more
accessible for retail consumers to gain access to the equity trading and investment sector by providing investment services on a
smartphone with a lower fee structure.
There are a total of 22 fintechs under the Investment segment, 10 being cryptocurrency trading platforms and eight retail trading
platforms. The cryptocurrency market has offered investors a new asset class. Domestic cryptocurrency trading platforms such
as Luno and Project Ubu make it easy and simple to trade cryptocurrency by buying and selling the currency on your mobile
phone. The sub-segment also includes international players such as the American fintech Bitcom.com that has a similar
business model. The majority of traders on domestic cryptocurrency trading platforms are domestic (about 86% in 2017),
however, the number of international investors trading on domestic platforms has increased from 11.7% of trades in 2017 to
13.8% in 2018.
Retail trading platforms are making stock market trading cheaper and more accessible to ordinary South Africans. There are
175 JSE-registered stockbrokers which execute trades on various instruments on behalf of individual and corporate clients.
Platforms such as EasyEquities allow customers to trade or invest without the need for intermediaries or brokers. This allows
these platforms to decrease their costs, and hence able to offer lower fees to their consumers. The four large retail banks offer
customers online share trading and international platforms such as IG Trading, is also present in the market.
In 2014, regulators introduced stricter trading rules that limited smaller companies from trading their stocks privately. This has
created the opportunity for new alternative exchanges to directly compete with the JSE. The FSCA has issued five licences to
alternative exchanges such as A2X, AltX, 4AX and EESE since 2016, removing the oligopoly once held by the JSE and SAFEX
(SA Futures Exchange). Smaller companies now have access to equity investors and large companies can decide to have a
secondary listing for increased liquidity.
~ 0.002%
Investment
Segment
1,410
trades on
alternative
exchanges
68 million
trades
At the JSE
946,750
trades
In crypto-
currency
~ 1.39%*
~ 1.392%
11
*This only includes crypto-currency platforms in South Africa reporting to the South African Reserve Bank
Sources: 1. Genesis Analytics Team estimates and analysis

Financial planning & advisory fintechs empower individuals and businesses by enabling direct access to financial
advice through the use of robotics and artificial intelligence.
44%
31%
25%
Robo-advisory
Small business finance
management
Personal finance
management
Financial planning & advisory fintechs by sub-segment
(Count)
Advisory empowers individuals and
businesses by enabling direct access
to financial advice through the use of
robotics.
2019
Proportion of the addressable market serviced by fintechs in 2019
There are a total of 16 fintechs under the Investment segment, seven being robo-advisory, five personal finance management
and four small business finance management. Robo-advisory includes fintechs that provide financial advice or investment
management online with no human intervention. This sub-segment includes fintechs like Arcus Capital which is creating
robo-advisors with advanced algorithms that analyse market performance and match this to investors’ risk preferences to
develop a portfolio to deliver against the investor’s financial goals.
Finance management segments include fintechs that help consumers manage their finance, through financial advice or
aggregating financial information. In the micro, small and medium enterprise (MSMEs) space, most fintechs focus on assisting
with financial management, accounting, and working capital, e.g. SMEasy and FitMoney. In the personal finance
management space, fintechs like 22seven aggregate account information. Pocketslip has software that is integrated with
point-of-sale devices so cashiers can send the receipts directly to a client.
South Africa’s traditional financial advisory firms still enjoy substantial scale and market share, however, the entry of advisory
fintechs has forced them to improve their business models and adopt better technology to improve effectiveness. Under the
Financial Advisory and Intermediary Services (FAIS) Act, services are defined as financial advice when they guide decisions
within a set of alternative financial products, which includes robo-advisors. Firms using robo-advice are required to register as
a financial services provider (FSP) with the Financial Sector Conduct Authority (FSCA). In March 2018, the FSB (now FSCA)
had 10,139 registered category I FSPs, less than 0.2% of them being fintechs. The small number of fintechs in this space
signals that, although artificial intelligence and robo-advisory technologies are gaining traction in the market, these
technologies are being used by existing traditional financial planning and advisory firms to enhance their customer journeys
and not being used by new, smaller players to enter the market.
16Advisory
fintechs
10,139 registered
category I
FSPs
~ 0.2%
Financial
Planning &
Advisory
60,642 fintech
consumers
1,273,488FSPs
consumers
~ 4.76 %
Approximately 0.2% of financial planning and advisors are fintechs. Approximately
4.76 % of the market is being captured by fintechs (% of consumers).
12Sources: 1. Genesis Analytics Team estimates and analysis.
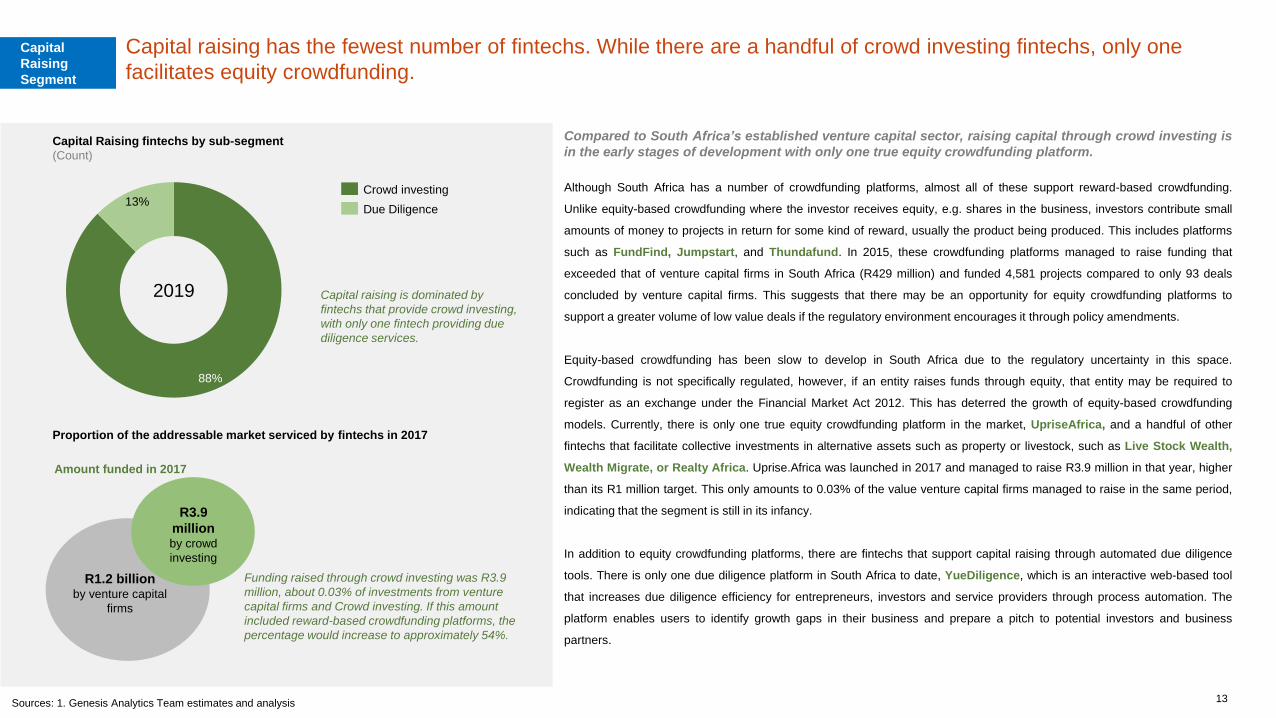
Capital raising has the fewest number of fintechs. While there are a handful of crowd investing fintechs, only one
facilitates equity crowdfunding.
88%
13%Crowd investing
Due Diligence
Capital Raising fintechs by sub-segment
(Count)
Capital raising is dominated by
fintechs that provide crowd investing,
with only one fintech providing due
diligence services.
2019
Proportion of the addressable market serviced by fintechs in 2017
Funding raised through crowd investing was R3.9
million, about 0.03% of investments from venture
capital firms and Crowd investing. If this amount
included reward-based crowdfunding platforms, the
percentage would increase to approximately 54%.
Amount funded in 2017
Compared to South Africa’s established venture capital sector, raising capital through crowd investing is
in the early stages of development with only one true equity crowdfunding platform.
Although South Africa has a number of crowdfunding platforms, almost all of these support reward-based crowdfunding.
Unlike equity-based crowdfunding where the investor receives equity, e.g. shares in the business, investors contribute small
amounts of money to projects in return for some kind of reward, usually the product being produced. This includes platforms
such as FundFind, Jumpstart, and Thundafund. In 2015, these crowdfunding platforms managed to raise funding that
exceeded that of venture capital firms in South Africa (R429 million) and funded 4,581 projects compared to only 93 deals
concluded by venture capital firms. This suggests that there may be an opportunity for equity crowdfunding platforms to
support a greater volume of low value deals if the regulatory environment encourages it through policy amendments.
Equity-based crowdfunding has been slow to develop in South Africa due to the regulatory uncertainty in this space.
Crowdfunding is not specifically regulated, however, if an entity raises funds through equity, that entity may be required to
register as an exchange under the Financial Market Act 2012. This has deterred the growth of equity-based crowdfunding
models. Currently, there is only one true equity crowdfunding platform in the market, UpriseAfrica, and a handful of other
fintechs that facilitate collective investments in alternative assets such as property or livestock, such as Live Stock Wealth,
Wealth Migrate, or Realty Africa. Uprise.Africa was launched in 2017 and managed to raise R3.9 million in that year, higher
than its R1 million target. This only amounts to 0.03% of the value venture capital firms managed to raise in the same period,
indicating that the segment is still in its infancy.
In addition to equity crowdfunding platforms, there are fintechs that support capital raising through automated due diligence
tools. There is only one due diligence platform in South Africa to date, YueDiligence, which is an interactive web-based tool
that increases due diligence efficiency for entrepreneurs, investors and service providers through process automation. The
platform enables users to identify growth gaps in their business and prepare a pitch to potential investors and business
partners.
R3.9
million by crowd
investing
R1.2 billion by venture capital
firms
Capital
Raising
Segment
13Sources: 1. Genesis Analytics Team estimates and analysis

The number of exchanges has grown in the SA market since 2016, providing competition to the incumbent JSE and
offering efficiencies such as real-time settlement. Other areas that are seeing disruption include post trade processes.
“[While] most of the disruption [in the SA market] has been in the retail banking sector, the threat to investment banking and
capital markets is imminent.”1
Advances in technologies such as blockchain and artificial intelligence (AI) - including machine learning and data analytics - as well as increased computer
processing power, data storage capabilities, and affordability will have a significant impact on disruptive business models in the capital markets space.
Core market infrastructure:
Technology can facilitate more transparent access to liquidity and allow for more efficient trading and clearing. South Africa’s large and sophisticated OTC
market developed a number of share-matching platforms, some web-based, that connected buyers and sellers in the OTC market. However, in 2014, the
FSB ruled that these platforms constitute exchanges and must either be licenced as such or cease operations. Some of these platforms have shifted to
information platforms without matching services (such as OTC Express) and others have become licenced exchanges (ZAR X; 4Africa Exchange; A2X and
EESE).
Post-trade digitisation:
Technology offers the opportunity to automate manual processes that still exist within the compliance, regulatory, collateral management, and securities
lending spaces. Strate (South Africa’s Central Securities Depository) is also licenced to be an independent provider of post-trade products and services for
the financial markets. Strate is working with Nasdaq in the US to use blockchain technology to improve corporate processes. The first use-case has been
around automating shareholder meetings and voting processes. Using an app, powered by blockchain technology, shareholders can login remotely, share
data securely, vote and trade shares with other shareholders in real-time. Transacting in real-time eliminates the need for inefficient reconciliation
processes.
Smart contracts are an area where blockchain technology can significantly improve post-trade efficiency. Blockchain allows for actions to be coded and
executed once a set of conditions is met. They have the ability to remove some of the more manual processes such as distributing dividends, executing
stock splits, issue of rights, warrants, pay-ups, with a much lower margin of error. Custody is another area where blockchain can allow investors to have
better control over assets and data.
Data & analytics:
AI allows for solutions that that utilise in-memory computing and machine learning to leverage the massive swell of structured and unstructured data to
make predictions, and build analytics at the point of trade. Big data analytics will allow traders to analyse broader and deeper sets of data to inform trading
strategies. There are a number of trading platforms (e.g. South African based company - Sharenet) that allow for algorithmic and high-frequency trading.
Capital
Markets
14Sources: 1. The SA Fintech in Motion Report, RMB, 2019 | 2. Advancing Capital markets with Blockchain Technology, ConsenSys, April 2019.
Project Khokha is an award-winning innovation by the South African
Reserve Bank. The SARB, in consortium with seven commercial
banks, created a blockchain-based interbank network that processed
more than the typical daily volume of payments with full confidentiality
and finality in record time. Khokha exceeded the transaction
performance target at 70,000 transactions in under two hours. This
project proved that a blockchain-based system can deliver real-time
gross settlement, and allowed SARB to fulfill its role without being a
single central point of failure.2
Licenced exchanges in South Africa:
• Johannesburg Securities Exchange is the primary stock
exchange in South Africa. In 2003, the JSE launched an
alternative exchange, AltX, for small and mid-sized listings.
• ZAR X was granted a licence to operate a stock exchange by
the Financial Services Board (FSB) in September 2016 and
operates differently to the JSE, offering investors benefits such
as real-time settlement and zero custody fees.
• 4 Africa Exchange (4AX) was granted a licence in 2016 and
aims to attract issuers and investors who are not served by
current incumbents.
• A2X Markets (A2X) was granted an exchange licence in 2017
and competes directly with the JSE, providing an alternative
platform for companies to secondary list and trade their shares.
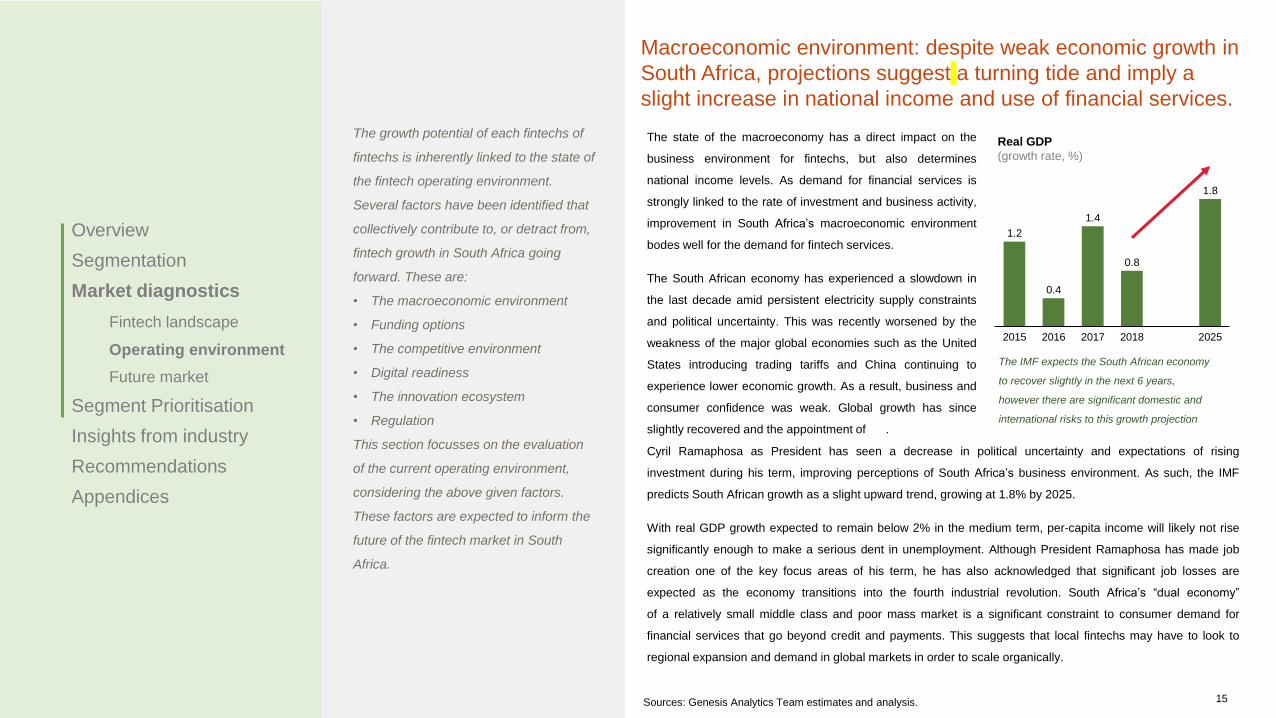
Macroeconomic environment: despite weak economic growth in
South Africa, projections suggest a turning tide and imply a
slight increase in national income and use of financial services.
The growth potential of each fintechs of
fintechs is inherently linked to the state of
the fintech operating environment.
Several factors have been identified that
collectively contribute to, or detract from,
fintech growth in South Africa going
forward. These are:
• The macroeconomic environment
• Funding options
• The competitive environment
• Digital readiness
• The innovation ecosystem
• Regulation
This section focusses on the evaluation
of the current operating environment,
considering the above given factors.
These factors are expected to inform the
future of the fintech market in South
Africa.
1.2
0.4
1.4
0.8
1.8
2016 202520172015 2018
Real GDP
(growth rate, %)
The state of the macroeconomy has a direct impact on the
business environment for fintechs, but also determines
national income levels. As demand for financial services is
strongly linked to the rate of investment and business activity,
improvement in South Africa’s macroeconomic environment
bodes well for the demand for fintech services.
The South African economy has experienced a slowdown in
the last decade amid persistent electricity supply constraints
and political uncertainty. This was recently worsened by the
weakness of the major global economies such as the United
States introducing trading tariffs and China continuing to
experience lower economic growth. As a result, business and
consumer confidence was weak. Global growth has since
slightly recovered and the appointment of .
The IMF expects the South African economy
to recover slightly in the next 6 years,
however there are significant domestic and
international risks to this growth projection
Overview
Segmentation
Market diagnostics
Fintech landscape
Operating environment
Future market
Segment Prioritisation
Insights from industry
Recommendations
Appendices
Sources: Genesis Analytics Team estimates and analysis. 15
Cyril Ramaphosa as President has seen a decrease in political uncertainty and expectations of rising
investment during his term, improving perceptions of South Africa’s business environment. As such, the IMF
predicts South African growth as a slight upward trend, growing at 1.8% by 2025.
With real GDP growth expected to remain below 2% in the medium term, per-capita income will likely not rise
significantly enough to make a serious dent in unemployment. Although President Ramaphosa has made job
creation one of the key focus areas of his term, he has also acknowledged that significant job losses are
expected as the economy transitions into the fourth industrial revolution. South Africa’s “dual economy”
of a relatively small middle class and poor mass market is a significant constraint to consumer demand for
financial services that go beyond credit and payments. This suggests that local fintechs may have to look to
regional expansion and demand in global markets in order to scale organically.
Funding Options
Given the sophistication of the South African financial sector, the country does not have a shortage of funding channels available. However, many of these channels
are not accessible to fintechs during the early stages of operation and expansion because they have yet to develop a proven business model, have not yet secured
regulatory compliance, or have yet to scale – all of which make them relatively high-risk investments. Growing South Africa’s angel investor network and improving
linkages to foreign risk capital will be important developments in improving access to smaller-ticket risk capital required by early-stage fintechs. In addition, public
sector financing channels aimed at addressing these gaps are not well coordinated and are not specifically tailored to fintechs.
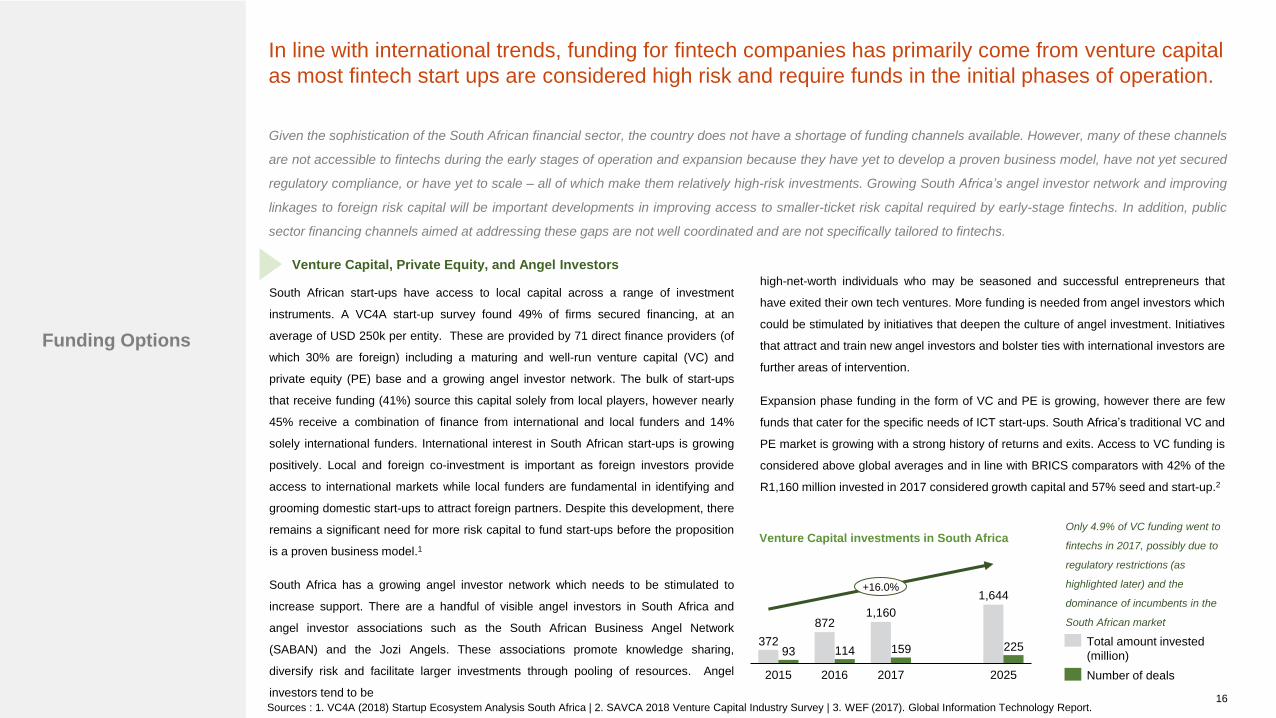
In line with international trends, funding for fintech companies has primarily come from venture capital
as most fintech start ups are considered high risk and require funds in the initial phases of operation.
Venture Capital, Private Equity, and Angel Investors
372
872
93 114 159 225
1,160
2015 2016 2017 2025
1,644+16.0%
Total amount invested
(million)
Number of deals
Venture Capital investments in South Africa
16Sources : 1. VC4A (2018) Startup Ecosystem Analysis South Africa | 2. SAVCA 2018 Venture Capital Industry Survey | 3. WEF (2017). Global Information Technology Report.
South African start-ups have access to local capital across a range of investment
instruments. A VC4A start-up survey found 49% of firms secured financing, at an
average of USD 250k per entity. These are provided by 71 direct finance providers (of
which 30% are foreign) including a maturing and well-run venture capital (VC) and
private equity (PE) base and a growing angel investor network. The bulk of start-ups
that receive funding (41%) source this capital solely from local players, however nearly
45% receive a combination of finance from international and local funders and 14%
solely international funders. International interest in South African start-ups is growing
positively. Local and foreign co-investment is important as foreign investors provide
access to international markets while local funders are fundamental in identifying and
grooming domestic start-ups to attract foreign partners. Despite this development, there
remains a significant need for more risk capital to fund start-ups before the proposition
is a proven business model.1
South Africa has a growing angel investor network which needs to be stimulated to
increase support. There are a handful of visible angel investors in South Africa and
angel investor associations such as the South African Business Angel Network
(SABAN) and the Jozi Angels. These associations promote knowledge sharing,
diversify risk and facilitate larger investments through pooling of resources. Angel
investors tend to be
high-net-worth individuals who may be seasoned and successful entrepreneurs that
have exited their own tech ventures. More funding is needed from angel investors which
could be stimulated by initiatives that deepen the culture of angel investment. Initiatives
that attract and train new angel investors and bolster ties with international investors are
further areas of intervention.
Expansion phase funding in the form of VC and PE is growing, however there are few
funds that cater for the specific needs of ICT start-ups. South Africa’s traditional VC and
PE market is growing with a strong history of returns and exits. Access to VC funding is
considered above global averages and in line with BRICS comparators with 42% of the
R1,160 million invested in 2017 considered growth capital and 57% seed and start-up.2
Only 4.9% of VC funding went to
fintechs in 2017, possibly due to
regulatory restrictions (as
highlighted later) and the
dominance of incumbents in the
South African market

Venture Capital, Private Equity, and Angel Investors continued
The Section 12J tax incentives to promote venture capital financing in small businesses excludes investments in
financial services and advisory services companies, and the banking sector is not well equipped to cover early-stage
firms.
Funding
Options
The PE market has grown at a 9.4% CAGR since 1994 to reach R158.6 million in funds under management
in 2017. Nearly 30% of PE investments were targeted at start-up and early-stage firms while 27.5% focus
on expansion.1 There are only a handful of players dedicated to ICT and technology who have a grounded
understanding of the specific needs of these kinds of businesses. RaizCorp incubates nearly 3,000
entrepreneurs a year and have seed funding available following proof of concept while Cortex Logic is
introducing a VC arm and developing a network of service providers by taking partial ownership of and
nurturing emerging technology businesses.
Section 12J venture capital funds are funneling investment towards employment-creating MSMEs and
growing rapidly in popularity. The 12J tax incentive allows individuals, corporates and funds investing in
qualifying venture capital companies (VCCs) to offset their income tax burden by 45% of the investment. In
2015, an estimated 30 funds were registered for the 12J incentive. This accelerated to over 100 in 2018,
illustrating the attractiveness of the fund and its recent recognition among investors leading to an estimated
R3.6 billion assets under management. However, VCCs are specifically restricted from investing in MSMEs
in a number of sectors including financial services and advisory services, which covers most of the scope of
fintech activities. As such, fintech access to financing is not being supported by this tax incentive and
suggests that a broadening of the incentive mandate may be required. National Treasury’s forthcoming
review of the fund will determine whether the economic benefits outweigh foregone tax revenues and
understand the degree to which funding is diversified. This comes amidst concerns of excessive use
(‘abuse’) of the fund by individual investors and the potential for distorting investment decisions to the
detriment of investment quality, but could include reviewing whether other mandates (beyond job creation)
should be considered.2
The early-stage financing industry therefore remains nascent and entrepreneurs struggle to motivate for
and secure funding. Funding would be bolstered significantly through
17
Sources : 1. SAVCA (2018). Private Equity Industry Report | 2. Ngwenya (2014). A study of the section 12J VCC regime as a capital procurement instrument for SMMEs. | 3. WEF (2018) Global Competitiveness Index. | 4. World Bank (2017).
South African Economic Update: Innovation for Productivity and Inclusiveness | 5. IFC (2018) The Unseen Sector Report on SMME Financing.
government and donor investment in the VC sector, increased interest from institutional funders, and tailored
tax incentives which cover investments in financial sector start-ups. This may increase availability of Series B
Round funding and improve what tends to be an illiquid market with relatively few exits. Support can
furthermore be provided to entrepreneurs seeking to source start-up finance. The bulk of entrepreneurs
approaching VC and angel financiers are ‘first rounders’ who lack skills in pitching and deter investors
through unrealistic expectations and valuations, insufficiently developed growth strategies, and a lack of
detailed competitor and market analysis.
Bank financing
South Africa has a world-class financial system which ranks 18 of 140 markets in its efficiency,
trustworthiness and confidence.3 This quality is reflected in the deep availability of credit, with domestic
credit provided to the private sector estimated at 144% of GDP – in line with OECD averages.4 South Africa’s
banking sector is a key financer of this credit at 66% of GDP and nearly 10% above global averages. The
banking sector is robust given its strong regulatory and legal framework and is globally competitive with a
host of well-established and emerging institutions.
However, the banking sector is better set up to serve the financing needs of established firms compared to
start-ups and smaller-scale firms. Considering the overall MSME market in South Africa, only 40% of their
funding comes from banks. Approximately 75% of MSME credit applications are rejected, while only 2% of
new MSMEs are able to access bank loans. Much of this relates to the methods banks employ to deal with
credit risk – information on the MSME’s cash flow, capital and credit history are used as indicators of their
ability and willingness to repay, and the provision of movable and immovable assets as security against
default. This tends to exclude a portion of the MSME market from accessing formal finance due to the lack
of available information or access to collateral, particularly in the early stages of business operations.5

Crowdfunding
Due to the funding gap, alternative funding sources like crowdfunding are emerging while several government
departments have also introduced a number of funding programmes to address this gap.Funding
Options
Alternative financing sources are gaining traction and offer an innovative solution to the finance shortfall.
Crowdfunding platforms have emerged as possible sources of working and growth capital for early stage
firms regardless of the regulatory uncertainty around them. The People’s Fund targets black owned
business and has raised over R1.5 million for 12 campaigns. This includes MySurfer – a provider of low-
cost internet access solutions – that required capital to install wireless access in 175 buildings and have
since been successfully paying out investors. The People’s Fund is furthermore raising a working capital
base for SMEs servicing government, that suffer from long payment lags. The nascent industry provides a
much needed source of finance for SMEs.
Most crowdfunding platforms in South Africa, however, are reward or debt-based, with only one equity-
based crowdfunding platform. This is mainly due to regulation – if an entity negotiates fundraising with an
equity component, it may be required to register as an exchange under the Financial Market Act.
Crowdfunding platforms are increasingly becoming a popular channel for funding fintechs through debt and
equity instruments globally. In a speech in 2018, the Deputy Governor of The South African Reserve Bank,
Francois Groepe, said that the bank would be accelerating actions including reviewing regulation on
investment-based and lending-based crowdfunding service providers for businesses in South Africa.
18Sources : 1. IFC (2018) The Unseen Sector Report on MSME Financing | 2. Centre of Excellence in Financial Services, 2018, The impact of the fourth industrial revolution on financial services in South Africa.
Government financing
The government’s role in enabling fintech financing is multifaceted, with a responsibility for policy
coordination, supportive regulation, and potentially the provision of financing and capacity building support
to start-ups. In addition, the government can have a more direct role to play in supporting the growth of
fintechs through strengthening the capacity of institutions that support MSMEs, and providing targeted
guarantees or deploying blended finance instruments that reduce the public or private risk of lending into
the segment. Some of the specific institutions that play this direct financing role are discussed below.
Small Enterprise Financing Agency (SEFA)
SEFA is the main government financing arm with a dedicated focus on MSMEs. SEFA provides MSME
financing through two channels: direct lending to MSMEs, and wholesale lending to other financial
institutions such as MFIs, including credit guarantees and joint ventures. The majority of SEFA’s funding
goes toward its wholesale funding channel – only about 24% of SEFA’s loan book goes to direct lending.
SEFA has a difficult task of financing enterprises that are typically not served by commercial financing
institutions, and so faces high rates of default and challenges with accurately pricing risk. SEFA’s primary
segment focus – informal and survivalist micro entrepreneurs – primarily gives rise to these challenges.
Given the funding gap for tech-enabled start-ups in South Africa, expanding SEFA’s mandate into growth-
oriented businesses that cannot access commercial capital but wish to operate in the formal sector could
improve both fintech financing and SEFA’s risk profile.1
Small Enterprise Development Agency (SEDA)
SEDA is an agency of the Department of Small Business Development which offers support to small and
micro-enterprises. It has introduced a technology programme that provides funding to a network of
business incubators, promoting and facilitating entrepreneurship in industry, particularly in enabling small
enterprises to access appropriate technology to become more competitive and grow their businesses.
Industrial Development Corporation (IDC)
The IDC is a state-owned development finance institution in South Africa focusing on promoting
entrepreneurship through the building of competitive industries. While IDC funding has typically been
associated with industries like energy, agro-processing and manufacturing, funding approvals also assist
SMEs. The IDC has a new financing line focused on “new industries.” This includes a component on the
creation of 4IR technologies and business models, including the internet-of-things, robotics, and artificial
intelligence; technologies that are being used to develop new fintech business models.

Despite the multitude of funding channels available, the constraints apparent in many of these channels mean that
many fintech entrepreneurs have to “bootstrap” to start their operations.Funding
Options
Department of Science and Technology
The Department of Science and Technology (DST) manages the government’s R&D
spend and incentives, and has programmes focused on supporting technology
innovation. Government accounted for 44.6% of gross expenditure on R&D in 20152 –
aligned with the average of a sample of 68 countries including OECD benchmarks.
This share has been growing since 2013, offsetting the slowing growth in spend from
the business sector. Government prioritises R&D spending on sectors that provide
broad national benefits such as agriculture, education and medicine. Government
seeks to double the 0.77% of GDP spent on R&D to 1.5% by 2020. This target can be
pursued through direct expenditure or through private sector tax incentives.4
South Africa’s key innovation tax deductions – managed by DST, National Treasury,
and SARB – are competitive relative to global leaders and BRICS nations. The Section
11D R&D tax incentive allows a maximum of 150% tax deduction on expenditure on
research on an invention, or on new or improved product designs and functionalities
and allows for accelerated depreciation of capital expenditure. This is a competitive
policy when benchmarked to innovation leaders. Israel allows qualifying large
enterprises a corporate tax rate of 5-8% and between 7.5% and 16% for SMEs; and
the US gives a non-refundable tax credit to reduce income tax up to 9.1%. The 11D tax
incentive has had a limited, though positive, impact on investment in R&D. Between its
introduction in 2006 and June 2017, 292 companies received approval for the tax
deduction. .
The impact of the incentive is dependent on the DST’s ability to efficiently process
applications as qualification requires preapproval from the DST. The 2015 National
Treasury budget review found severe backlogs in the process of approving
applications, attributed to capacity constraints in the DST.
Department of Trade and Industry (the dti)
The dti and its subsidiary agencies are involved in promoting economic
development, Black Economic Empowerment, implementing commercial law,
promoting and regulating international trade, and consumer protection. The
Support Programme for Industrial Innovation and the Technology and Human
Resources Programme under the dti both provide grant funding to help tech
entrepreneurs and support local innovation initiatives in South Africa.
National Empowerment Fund (NEF)
The NEF is promotes and facilitates black economic participation through provision
of financial and non-financial support.
• Funding channels mostly
require fintechs to have a
proven business model that is
scalable with high expected
returns.
• Acquiring early-stage and
growth financing often requires
fintechs to be regulatory
compliant in order to assure
investors that they have a viable
business model.
• Government support and
incentives for tech financing can
be better coordinated as they
currently do not adequately
cover sectors like fintech.
• Unclear regulation around
crowdfunding limits scaling of
alternative financing channels.
Issues:
1
19Sources : 1. IDC Annual Report 2018 | 2. HSRC (2016) South African National Survey of Research and Experimental Development | 3. Deloitte (2018). Survey of Global
Investment and Innovation Incentives | 4. National Advisory Council on Innovation (2015) Review of The White Paper on Science and Technology Key issues discussed in recommendation slide (slide 42)
Government financing continued
Bootstrapping
Due to the constraints in many of these funding channels, a number of
entrepreneurs opt to fund their own fintech ventures. These individuals typically
fund their start-ups for two to three years without profit in the hope of being
purchased or partnering with an incumbent provider. Although this is not specific to
fintech entrepreneurs, as a benchmark the 2010 FinScope survey found that 45%
of small business owners fund their activities from savings or friends and family.
The South African financial sector is sophisticated, supported by a large number of domestic and foreign institutions providing a full range of financial services
backed by a sound regulatory and legal framework. As a result, traditional financial services providers dominate South Africa’s financial sector. Digital adoption
among traditional providers has limited the ability of fintechs to capture new customer segments using digital, and the comprehensive regulatory environment has
created barriers to entry. However, despite high rates of overall financial inclusion, a relatively poor quality of inclusion products provides fintechs with an
opportunity for customer growth through low-cost products that are simple and accessible and which solve problems specific to mass market customers.
The South African financial sector is dominated by traditional financial services providers with a large
distribution network capturing the majority of the market, giving rise to high rates of financial inclusion.
Incumbent digital strategiesAs a result, investment in digital solutions to date has largely been in the retail banking space
focused on improving the customer experience. The major South African banks all support
internet banking channels, mobile apps and digital payment facilities and offer a cash
remittance product that allows customers to transfer money to a recipient without a bank
account. There has not been a great deal of differentiation between the banks’ digital
solutions. One reason for this could be the result of the way banks approach innovation
compared to fintechs.
Fintechs are technologists by nature and consider how to leverage technology to revolutionise
the financial system. Banks think about how to improve existing processes through the use of
technology; their focus is on continuing to provide customers with reliable and secure banking
facilities more efficiently. Therefore while the sophistication and appetite for digital adoption
among incumbents has limited the disruptive potential for new fintech players, there is
significant scope for fintechs without the constraints of legacy operating systems to carve out
niche value propositions on the basis of nimble data-driven operating models. The emergence
of digital banks TYME, Bank Zero and Discovery Bank are already signing up customers on
the basis of quick application processes and lower fees, but it remains to be seen how
disruptive this will be when incumbents like FNB also offer remote account opening and
sophisticated digital channels.
An added challenge for new entrants is the highly concentrated nature of South Africa’s
financial sector. While the sector is large and sophisticated, it has high operational
requirements.
Competitive
environment
20Sources : 1. Centre of Excellence in Financial Services, 2018, The impact of the fourth industrial revolution on financial services in South Africa | 2. PWC, 2018, A marketplace without boundaries 2.0
South Africa’s favourable international financial sector rankings stem from a large
amount of investment in financial infrastructure during the 1990s. The establishment of
what is now called BankServAfrica in 1993 created a single processing hub and the
country’s first multi-channel payments switch. In 1994 the SARB and South African
banks launched a modernisation project for South Africa’s payment system which
resulted in the formation of PASA, providing a robust institutional framework for
payments system development and innovation. This led to South Africa being one of
the first countries to implement real-time inter-bank clearing in 2006.
On the back of this progressive infrastructure development, South Africa’s large
incumbent banks and insurers have embarked on large-scale transformation projects
in the last decade to improve customer experience, generate enterprise-wide cost
reduction, and introduce product and channel innovations. The major South African
banks all have a digital strategy in place – many have appointed a Chief Digital Officer
and have invested in growing digital capability with a combination of domestic and
foreign skills. This highlights the importance of digital in the banks’ infrastructure.
However, these banks have struggled to transition from legacy operating systems
which has limited the speed and extent of digital transformation among incumbents.
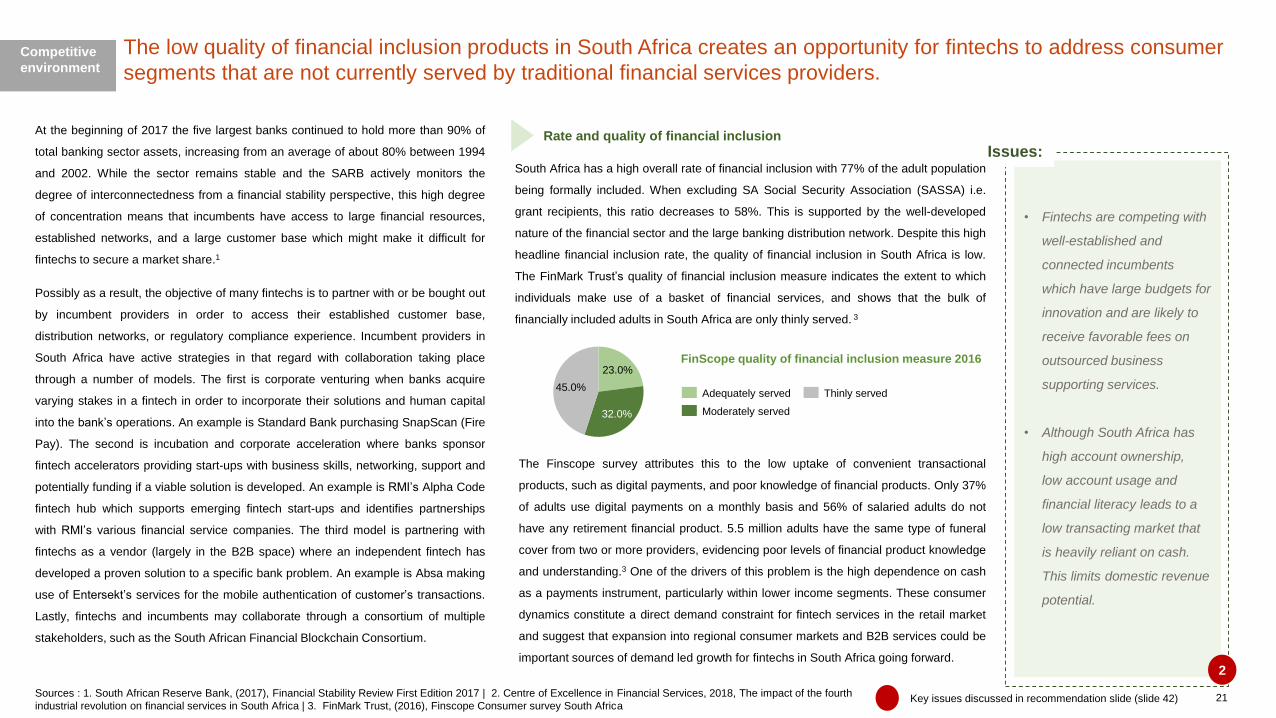
The low quality of financial inclusion products in South Africa creates an opportunity for fintechs to address consumer
segments that are not currently served by traditional financial services providers.Competitive
environment
• Fintechs are competing with
well-established and
connected incumbents
which have large budgets for
innovation and are likely to
receive favorable fees on
outsourced business
supporting services.
• Although South Africa has
high account ownership,
low account usage and
financial literacy leads to a
low transacting market that
is heavily reliant on cash.
This limits domestic revenue
potential.
Issues:
2
21Sources : 1. South African Reserve Bank, (2017), Financial Stability Review First Edition 2017 | 2. Centre of Excellence in Financial Services, 2018, The impact of the fourth
industrial revolution on financial services in South Africa | 3. FinMark Trust, (2016), Finscope Consumer survey South Africa Key issues discussed in recommendation slide (slide 42)
Rate and quality of financial inclusion
45.0%
23.0%
32.0%
Adequately served
Moderately served
Thinly served
FinScope quality of financial inclusion measure 2016
The Finscope survey attributes this to the low uptake of convenient transactional
products, such as digital payments, and poor knowledge of financial products. Only 37%
of adults use digital payments on a monthly basis and 56% of salaried adults do not
have any retirement financial product. 5.5 million adults have the same type of funeral
cover from two or more providers, evidencing poor levels of financial product knowledge
and understanding.3 One of the drivers of this problem is the high dependence on cash
as a payments instrument, particularly within lower income segments. These consumer
dynamics constitute a direct demand constraint for fintech services in the retail market
and suggest that expansion into regional consumer markets and B2B services could be
important sources of demand led growth for fintechs in South Africa going forward.
South Africa has a high overall rate of financial inclusion with 77% of the adult population
being formally included. When excluding SA Social Security Association (SASSA) i.e.
grant recipients, this ratio decreases to 58%. This is supported by the well-developed
nature of the financial sector and the large banking distribution network. Despite this high
headline financial inclusion rate, the quality of financial inclusion in South Africa is low.
The FinMark Trust’s quality of financial inclusion measure indicates the extent to which
individuals make use of a basket of financial services, and shows that the bulk of
financially included adults in South Africa are only thinly served. 3
At the beginning of 2017 the five largest banks continued to hold more than 90% of
total banking sector assets, increasing from an average of about 80% between 1994
and 2002. While the sector remains stable and the SARB actively monitors the
degree of interconnectedness from a financial stability perspective, this high degree
of concentration means that incumbents have access to large financial resources,
established networks, and a large customer base which might make it difficult for
fintechs to secure a market share.1
Possibly as a result, the objective of many fintechs is to partner with or be bought out
by incumbent providers in order to access their established customer base,
distribution networks, or regulatory compliance experience. Incumbent providers in
South Africa have active strategies in that regard with collaboration taking place
through a number of models. The first is corporate venturing when banks acquire
varying stakes in a fintech in order to incorporate their solutions and human capital
into the bank’s operations. An example is Standard Bank purchasing SnapScan (Fire
Pay). The second is incubation and corporate acceleration where banks sponsor
fintech accelerators providing start-ups with business skills, networking, support and
potentially funding if a viable solution is developed. An example is RMI’s Alpha Code
fintech hub which supports emerging fintech start-ups and identifies partnerships
with RMI’s various financial service companies. The third model is partnering with
fintechs as a vendor (largely in the B2B space) where an independent fintech has
developed a proven solution to a specific bank problem. An example is Absa making
use of Entersekt’s services for the mobile authentication of customer’s transactions.
Lastly, fintechs and incumbents may collaborate through a consortium of multiple
stakeholders, such as the South African Financial Blockchain Consortium.

With smartphone and internet penetration increasing, fintechs have the opportunity to scale their
service provision to the majority of the population if the affordability of connecting digitally is addressed.
South Africa’s mobile phone penetration already exceeds 90% of the adult population
with 69% using smartphones. Mobile phones are the most popular devices used to
access the internet, with 72% of the population using a mobile phone as the sole
device for connecting digitally. 3
Approximately 61% of smartphone sales in South Africa in 2018 were low-end
smartphones costing less than R1,500. South Africa has experienced a 41% price drop
in the average price of smartphones between 2012 and 2017. Despite this fall,
advanced smartphones are still unaffordable to the majority of South Africans.
Imported smartphones are considered luxury goods by the South African revenue
authority and subject to standard luxury good import duties as a result. A geographic
divide also exists in terms of smartphone ownership, with 54% of the urban population
owning smartphones versus 33% of those in rural areas. 3
Smartphone penetration
Financial and Digital literacy
However, with increasing internet penetration from 46% in 2015 to 52% in 2017, the
population is relatively “digital-savvy” with the highest levels of digital literacy in
Africa. This provides fintechs with an opportunity to overcome financial literacy
barriers using digital channels. By providing digital financial services such as
financial planning and advisory, more consumers could have access to a broader
range of digital financial services.
• The cost of a smartphone and of data in South Africa is still expensive for low-income earners, who cannot have a contract and buy data on pre-paid.
Issues:
Poor price competition among MNOs is driving the high costs of prepaid mobile data
bundles. The cost of data is high relative by continental comparison – the cheapest
domestic 1GB of prepaid mobile data bundle costs 600% more than the cheapest
1GB in Egypt and 134% more than BRICS nations. An oligopolistic market which
leads to poor pricing competition between mobile operators contributes to the high
data costs. The mobile network’s Herfindahl-Hirschman index – a measure of market
concentration – reflects a concentrated market with Vodacom’s data revenue share at
40%, followed by MTN at 34% and Cell C at 30%.4
Low-income earners are paying disproportionately higher costs for small packets of
data as per MB costs are higher for smaller data bundles. Individuals who are on
contracts tend to spend less on data as a proportion of income, but low-income
earners cannot obtain contracts due to credit constraints or being able to only pay as
they use.
Cost of Data
Digital readiness
2
22Key issues discussed in recommendation slide
(slide 42)
Financial literacy is critical to an individual’s ability to access and make meaningful use
of the right kinds of financial services for their context. This includes accessing financial
services through digital channels. According to the Organisation for Economic Co-
operation and Development (OECD), the level of financial literacy in South Africa is
relatively low. South Africans lack the ability to set financial goals and knowledge to use
available financial products, both of which are important for demanding and successfully
choosing more sophisticated financial products.
Sources : 1. HSRC, (2016), Financial literacy in South Africa: Results from the 2015 South African Social Attitudes Survey I 2. StatsSA I 3. Pew
Research Centre, Majorities in SSA own mobile phones but smartphone adoption is modest, 2018 I
4. https://www.cable.co.uk/mobiles/worldwide-data-pricing/

For the fintech industry to grow, it requires South Africa’s innovation ecosystem to be well developed
so that access to skills and a well-coordinated policy response are not barriers.
Academic incubators
Academic incubators are becoming more prominent and will aim to provide the ideas,
future skills and young entrepreneurs to the ecosystem. The University of Cape Town
launched the first fintech degree in 2017 and fintech short courses for business in
2018. Stellenbosch University, through Launch Lab (in partnership with the government
and Nedbank), provide their students with expertise to support new businesses and
foster a culture of entrepreneurship.
Migration and Visa policies
The Immigration Amendment Act of 2011 compelled the Department of Home Affairs to
compile a critical skills list required for South African development, some of which must
be sourced internationally. However, applying for a work permit is cumbersome,
requiring a large volume of documentation e.g. proof of post-qualification experience of
at least five years. Migration lawyers have described their clients experiencing
unexplained and unacceptable delays with many believing that they received unfair and
incorrect decisions.
Tech skills, migration and visa policies Intellectual Property & data protection regulation
Intellectual Property
South Africa’s historical IP system has been fragmented and reliant on a ‘depository’
IP system. The depository system is believed to undermine genuine innovation as
patents are granted when meeting thin formal requirements and only ever examined
if challenged in litigation. As a result, the Intellectual Property Policy in South Africa is
currently under review, with the aim of improving capacity to support applications and
simplification of the process to reduce application costs.
Data protection
The introduction of the Protection of Personal Information Act codified the manner in
which organisations can source and use entities’ personal information, including
digital information. While the act is considered to be in line with international best
practice (e.g. the EU’s GDPR), its enforcement is yet to be delivered, with the
Information Regulator having only recently been appointed.
South Africa’s cybersecurity regulatory framework is in the process of being updated,
though impending legislation prioritises punitive measures without enforcing
preventative action. This has led to the establishment of the National Cybersecurity
Hub, which is the key point of contact for cybersecurity matters. It coordinates
cybersecurity response activities and facilitates information and technology sharing.
The development of the fintech industry requires a number of enablers for tech innovation to be supported: technical skills and knowledge, an updated regulatory
framework for IP and data protection, and a well-coordinated policy response to supporting tech innovation. To date, South Africa’s innovation ecosystem has not
performed highly on some of these aspects, despite policies for promoting innovation being in place. This suggests that an update to South Africa’s innovation policy
is required with better co-ordination between government departments in addition to a more supportive regulatory environment.
Innovation
Ecosystem
23Sources : 1. South Africa’s massive immigration problem, SA Migration International 2019 | 2. Owusu-Sekyere et. Al. A critical skills attrition index South Africa, Human Science Research Council
Government innovation policies and initiatives
Several government policies and initiatives have been introduced to support the innovation ecosystem through
providing financial support and supportive policies for new ideas. Innovation
Ecosystem
National System of Innovation (NSI)
Innovation policies are coordinated under the NSI which was implemented in 1996.
The NSI is supported by three key institutions: the National Advisory Council on
Innovation (NACI), the Technology Innovation Agency (TIA), and the National
Research Foundation (NRF).
• The NACI was created by legislation and the NACI Council is appointed by the
Minister for Science and Technology for guidance. The Council provides guidance
to the Minister and the Cabinet on the role and contribution of science,
mathematics, innovation and technology, including locally produced technologies,
in promoting and achieving national objectives.
• TIA is a national public entity that serves as the key institutional intervention to
bridge the innovation chasm between research and development from higher
education institutions, science councils, public entities, and private sector, and
commercialisation. TIA’s focus is on technology development, from proof of
concept to the pre-commercialisation.
• The NRF is an independent statutory body established through the National
Research Foundation Act and functions as a research funding agency.
• Lack of transparent,
proportionate eligibility
thresholds impede the
successful application of
skilled individuals
seeking to migrate to
South Africa.
• Impeding IP and data
protections laws - still in
review.
• Public sector efforts to
create an enabling
environment for tech
innovation such as IFWG
and Innovation Hub, and
the employment of tech
in digital business
models, are currently
siloed.
Issues:The NSI can improve its offering through better coordination across government
departments to avoid fragmented, dislocated and inefficient national efforts.
Financial center for Africa policy
The National Treasury has been trying to develop South Africa into a financial centre
for Africa in order to improve inward investment flows, boost employment creation,
improve financial revenue and support economic growth. With financial services
changing as digital players enter this space, the strategy includes making South
Africa a fintech or innovation hub for the region. Through this strategy, Treasury will
introduce recommendations on making the South African financial sector conducive
to fintechs scaling regionally, and improving local access to funding.
Presidential Commission on the fourth industrial revolution
The Department of Communication and Digital Technology has been appointed to
convene government consultations on the 4IR. The President has convened a
Commission on 4IR, comprising experts across a range of fields to advise on the
development of a national 4IR masterplan for South Africa which is being developed
and should be ready by June 2020.
3
24Key issues discussed in recommendation slide (slide 42)
The International Monetary Fund and the World Bank Group launched the Bali fintech Agenda, a set of 12 policy elements aimed at helping member countries to harness the benefits
and opportunities of rapid advances in financial technology, while at the same time managing the inherent risks. The 12 policy elements include calling on governments to: embrace the
promise of fintech; enable new technology to enhance financial service provision; reinforce competition and commitment to open, free and contestable markets; foster fintech to
promote financial inclusion and develop financial markets; safeguard the integrity of financial systems; etc. The Agenda proposes a framework of high-level issues that countries should
consider in their own domestic policy discussions and aims to guide staff from the two institutions in their own work and dialogue with national authorities.
Case study: International initiatives - The Bali fintech Agenda
Sources : 1. IMF Policy Paper; The Bali fintech Agenda; August 2018.

Achieving a balance between supporting innovation and managing the potential risk they pose to the
financial sector is imperative to support fintech growth while maintaining a stable financial system.
Some potential benefits of a growing fintech industry
• Provide more distribution channels and access to finance for more individuals as
digital solutions are more accessible and do not require the physical presence to
bring them into the formal sector.
• Fintech could also increase the number and range of product choices.
• Can reduce the cost of finance as new entrants are able to enter the market at
lower costs than larger and more heavily-regulated traditional banks.
• MSMEs can access finance through innovative scoring models, therefore
increasing economic activity and creating better wealth distribution.
• Allows savers and investors to earn higher yields in low interest rate environments.
• Insurance customers benefit from having more appropriate, customised cover to
insure specific events/items and pay out when the need arises.
• Increase in competition (new entrants) within the financial services sector would
increase stability.
Some highlighted risks of a growing an unregulated fintech industry
• Lack of regulation means depositors and investors can be exposed to higher
levels of default risk.
• Lack of recourse on unfair outcomes to customers as fintechs are currently not
formally regulated.
• Technologies such as AI and machine learning can potentially result in unfair
customer profiling.
• Adverse impacts on financial stability, liquidity management and monetary policy.
• Increased risk of cybersecurity and other fraud prevention systems where
fintechs become targets for cyber crime and fraud.
• Potential for regulatory arbitrage allows small financial services providers to by-
pass regulation and undermines regulators’ authority. This creates uneven
regulatory playing-fields and can disadvantage incumbents.
Fintechs are contributing towards hyper-personalised, customer-centric, digital offerings in the financial sector. Information is being gathered from multiple
touchpoints, and analysed using advanced data analytics, which provides entities with accurate insight into the attitudes and behaviours of customers, as well
as enterprise operations such as risk analysis. This presents significant benefits, but also comes with considerable risks. The opportunities for fraud and cyber
crime are increasing as digital channels and products expand, and the rapid adoption of new technology by financial services providers can introduce
systemic and conduct risk when the technology fails. Consumer protection is also an important element when dealing with unknown entities who may mislead
consumers. Financial regulation is necessary to respond to the significant risk that rapid increases of technology use in financial services creates. Financial
regulators are therefore faced with the challenge of managing these risks in a way which does not significantly stifle innovation.
25
Regulatory
environment
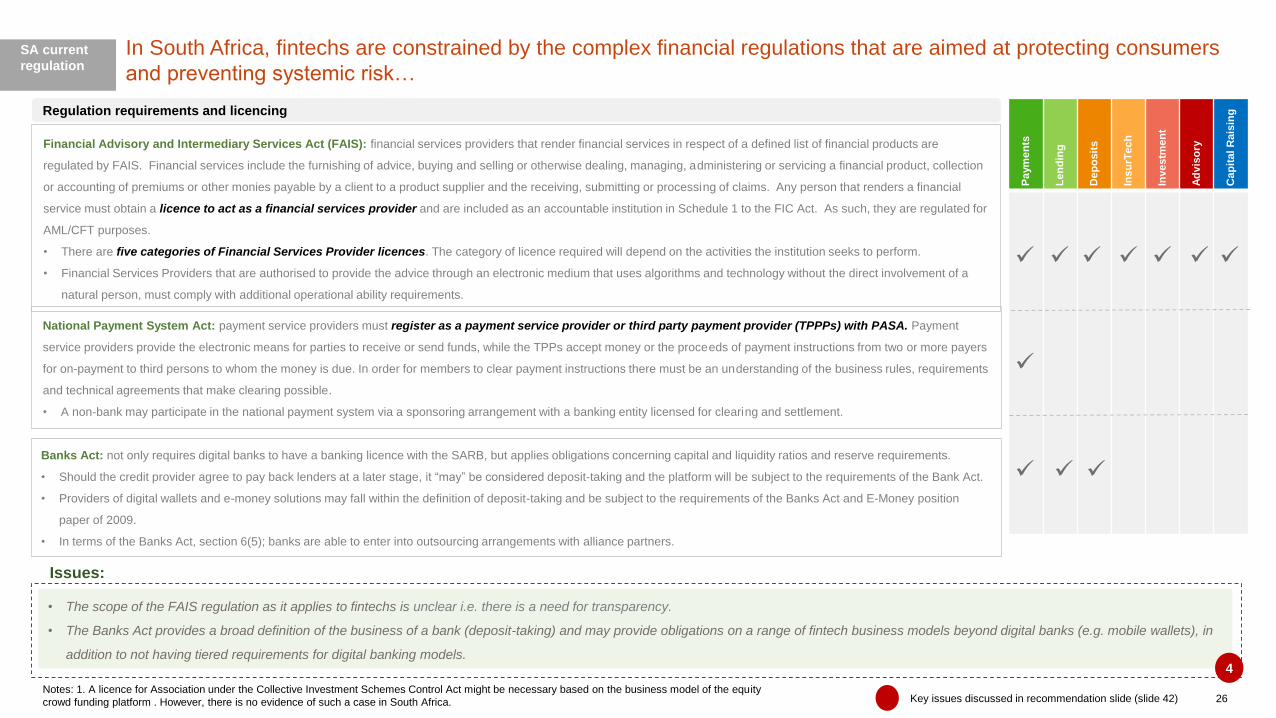
In South Africa, fintechs are constrained by the complex financial regulations that are aimed at protecting consumers
and preventing systemic risk…
Notes: 1. A licence for Association under the Collective Investment Schemes Control Act might be necessary based on the business model of the equity
crowd funding platform . However, there is no evidence of such a case in South Africa.
SA current
regulation
Regulation requirements and licencing
Financial Advisory and Intermediary Services Act (FAIS): financial services providers that render financial services in respect of a defined list of financial products are
regulated by FAIS. Financial services include the furnishing of advice, buying and selling or otherwise dealing, managing, administering or servicing a financial product, collection
or accounting of premiums or other monies payable by a client to a product supplier and the receiving, submitting or processing of claims. Any person that renders a financial
service must obtain a licence to act as a financial services provider and are included as an accountable institution in Schedule 1 to the FIC Act. As such, they are regulated for
AML/CFT purposes.
• There are five categories of Financial Services Provider licences. The category of licence required will depend on the activities the institution seeks to perform.
• Financial Services Providers that are authorised to provide the advice through an electronic medium that uses algorithms and technology without the direct involvement of a
natural person, must comply with additional operational ability requirements.
26
National Payment System Act: payment service providers must register as a payment service provider or third party payment provider (TPPPs) with PASA. Payment
service providers provide the electronic means for parties to receive or send funds, while the TPPs accept money or the proceeds of payment instructions from two or more payers
for on-payment to third persons to whom the money is due. In order for members to clear payment instructions there must be an understanding of the business rules, requirements
and technical agreements that make clearing possible.
• A non-bank may participate in the national payment system via a sponsoring arrangement with a banking entity licensed for clearing and settlement.
Pa
ym
en
ts
Le
nd
ing
Dep
os
its
Ins
urT
ec
h
Inv
es
tme
nt
Ad
vis
ory
Cap
ita
lR
ais
ing
• The scope of the FAIS regulation as it applies to fintechs is unclear i.e. there is a need for transparency.
• The Banks Act provides a broad definition of the business of a bank (deposit-taking) and may provide obligations on a range of fintech business models beyond digital banks (e.g. mobile wallets), in
addition to not having tiered requirements for digital banking models.
Issues:
Banks Act: not only requires digital banks to have a banking licence with the SARB, but applies obligations concerning capital and liquidity ratios and reserve requirements.
• Should the credit provider agree to pay back lenders at a later stage, it “may” be considered deposit-taking and the platform will be subject to the requirements of the Bank Act.
• Providers of digital wallets and e-money solutions may fall within the definition of deposit-taking and be subject to the requirements of the Banks Act and E-Money position
paper of 2009.
• In terms of the Banks Act, section 6(5); banks are able to enter into outsourcing arrangements with alliance partners.
4
Key issues discussed in recommendation slide (slide 42)
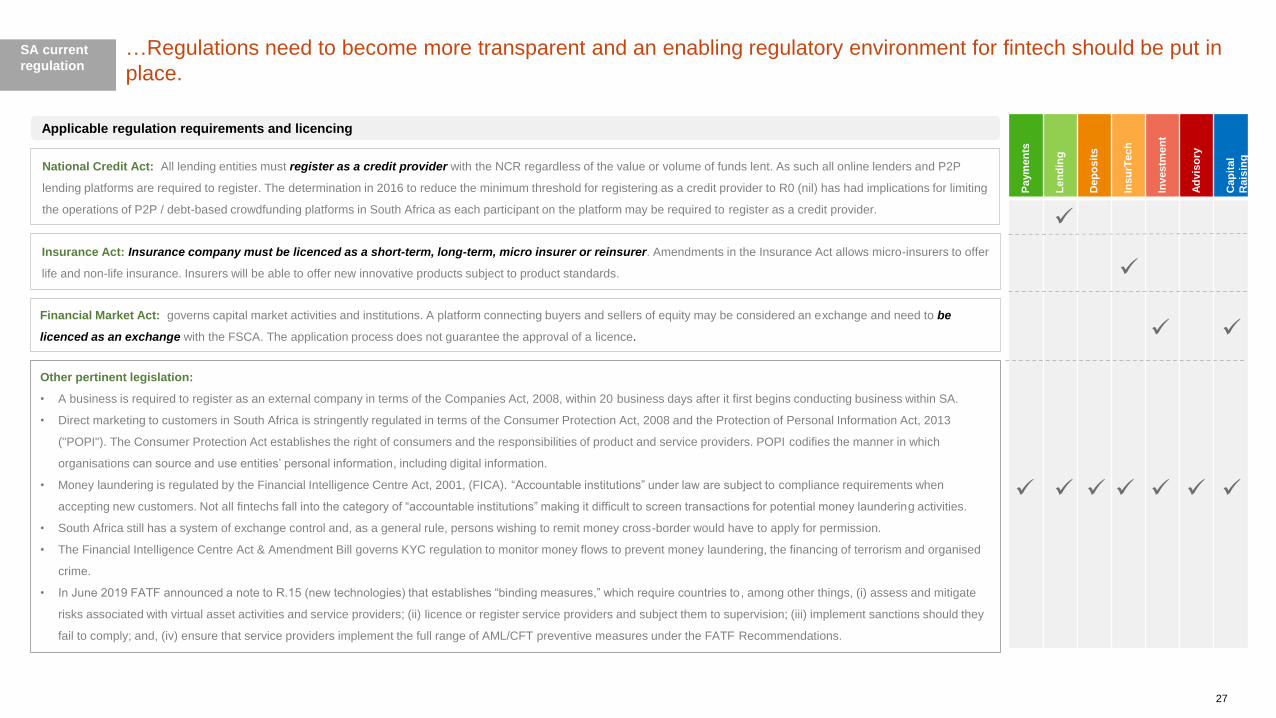
…Regulations need to become more transparent and an enabling regulatory environment for fintech should be put in
place.
SA current
regulation
Applicable regulation requirements and licencing
National Credit Act: All lending entities must register as a credit provider with the NCR regardless of the value or volume of funds lent. As such all online lenders and P2P
lending platforms are required to register. The determination in 2016 to reduce the minimum threshold for registering as a credit provider to R0 (nil) has had implications for limiting
the operations of P2P / debt-based crowdfunding platforms in South Africa as each participant on the platform may be required to register as a credit provider.
27
Insurance Act: Insurance company must be licenced as a short-term, long-term, micro insurer or reinsurer. Amendments in the Insurance Act allows micro-insurers to offer
life and non-life insurance. Insurers will be able to offer new innovative products subject to product standards.
Financial Market Act: governs capital market activities and institutions. A platform connecting buyers and sellers of equity may be considered an exchange and need to be
licenced as an exchange with the FSCA. The application process does not guarantee the approval of a licence.
Other pertinent legislation:
• A business is required to register as an external company in terms of the Companies Act, 2008, within 20 business days after it first begins conducting business within SA.
• Direct marketing to customers in South Africa is stringently regulated in terms of the Consumer Protection Act, 2008 and the Protection of Personal Information Act, 2013
("POPI"). The Consumer Protection Act establishes the right of consumers and the responsibilities of product and service providers. POPI codifies the manner in which
organisations can source and use entities’ personal information, including digital information.
• Money laundering is regulated by the Financial Intelligence Centre Act, 2001, (FICA). “Accountable institutions” under law are subject to compliance requirements when
accepting new customers. Not all fintechs fall into the category of “accountable institutions” making it difficult to screen transactions for potential money laundering activities.
• South Africa still has a system of exchange control and, as a general rule, persons wishing to remit money cross-border would have to apply for permission.
• The Financial Intelligence Centre Act & Amendment Bill governs KYC regulation to monitor money flows to prevent money laundering, the financing of terrorism and organised
crime.
• In June 2019 FATF announced a note to R.15 (new technologies) that establishes “binding measures,” which require countries to , among other things, (i) assess and mitigate
risks associated with virtual asset activities and service providers; (ii) licence or register service providers and subject them to supervision; (iii) implement sanctions should they
fail to comply; and, (iv) ensure that service providers implement the full range of AML/CFT preventive measures under the FATF Recommendations.
Paym
en
ts
Le
nd
ing
Dep
os
its
Ins
urT
ech
Inv
estm
en
t
Ad
vis
ory
Cap
ital
Rais
ing
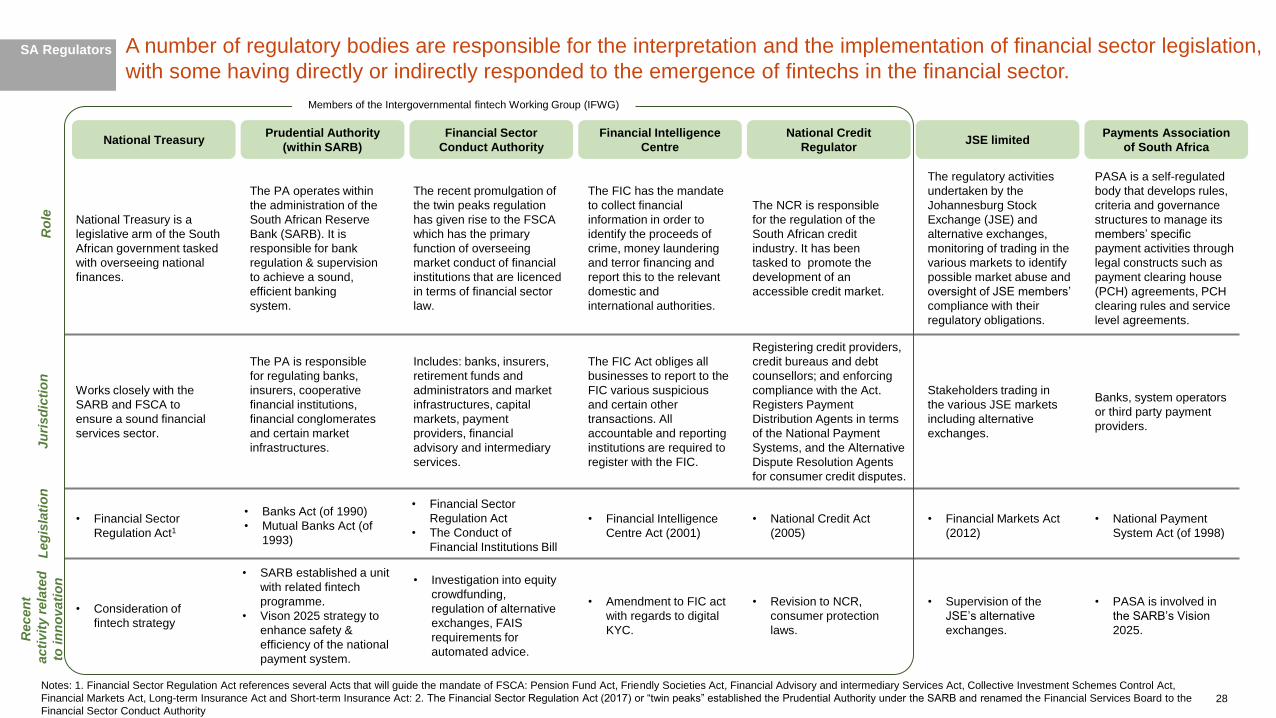
Notes: 1. Financial Sector Regulation Act references several Acts that will guide the mandate of FSCA: Pension Fund Act, Friendly Societies Act, Financial Advisory and intermediary Services Act, Collective Investment Schemes Control Act,
Financial Markets Act, Long-term Insurance Act and Short-term Insurance Act: 2. The Financial Sector Regulation Act (2017) or “twin peaks” established the Prudential Authority under the SARB and renamed the Financial Services Board to the
Financial Sector Conduct Authority
A number of regulatory bodies are responsible for the interpretation and the implementation of financial sector legislation,
with some having directly or indirectly responded to the emergence of fintechs in the financial sector.SA Regulators
Prudential Authority
(within SARB)
The PA operates within
the administration of the
South African Reserve
Bank (SARB). It is
responsible for bank
regulation & supervision
to achieve a sound,
efficient banking
system.
• Banks Act (of 1990)
• Mutual Banks Act (of
1993)
The PA is responsible
for regulating banks,
insurers, cooperative
financial institutions,
financial conglomerates
and certain market
infrastructures.
Financial Sector
Conduct Authority
The recent promulgation of
the twin peaks regulation
has given rise to the FSCA
which has the primary
function of overseeing
market conduct of financial
institutions that are licenced
in terms of financial sector
law.
Includes: banks, insurers,
retirement funds and
administrators and market
infrastructures, capital
markets, payment
providers, financial
advisory and intermediary
services.
National Credit
RegulatorNational Treasury
National Treasury is a
legislative arm of the South
African government tasked
with overseeing national
finances.
Works closely with the
SARB and FSCA to
ensure a sound financial
services sector.
JSE limitedFinancial Intelligence
Centre
Ro
leJu
risd
icti
on
Payments Association
of South Africa
• Financial Sector
Regulation Act
• The Conduct of
Financial Institutions Bill
Recen
t
acti
vit
y r
ela
ted
to in
no
vati
on
• Financial Sector
Regulation Act1
• SARB established a unit
with related fintech
programme.
• Vison 2025 strategy to
enhance safety &
efficiency of the national
payment system.
• Investigation into equity
crowdfunding,
regulation of alternative
exchanges, FAIS
requirements for
automated advice.
The NCR is responsible
for the regulation of the
South African credit
industry. It has been
tasked to promote the
development of an
accessible credit market.
• National Credit Act
(2005)
Registering credit providers,
credit bureaus and debt
counsellors; and enforcing
compliance with the Act.
Registers Payment
Distribution Agents in terms
of the National Payment
Systems, and the Alternative
Dispute Resolution Agents
for consumer credit disputes.
• Revision to NCR,
consumer protection
laws.
The FIC has the mandate
to collect financial
information in order to
identify the proceeds of
crime, money laundering
and terror financing and
report this to the relevant
domestic and
international authorities.
• Financial Intelligence
Centre Act (2001)
The FIC Act obliges all
businesses to report to the
FIC various suspicious
and certain other
transactions. All
accountable and reporting
institutions are required to
register with the FIC.
• Amendment to FIC act
with regards to digital
KYC.
PASA is a self-regulated
body that develops rules,
criteria and governance
structures to manage its
members’ specific
payment activities through
legal constructs such as
payment clearing house
(PCH) agreements, PCH
clearing rules and service
level agreements.
Banks, system operators
or third party payment
providers.
• National Payment
System Act (of 1998)
• PASA is involved in
the SARB’s Vision
2025.
The regulatory activities
undertaken by the
Johannesburg Stock
Exchange (JSE) and
alternative exchanges,
monitoring of trading in the
various markets to identify
possible market abuse and
oversight of JSE members’
compliance with their
regulatory obligations.
• Financial Markets Act
(2012)
Stakeholders trading in
the various JSE markets
including alternative
exchanges.
• Supervision of the
JSE’s alternative
exchanges.
28
Members of the Intergovernmental fintech Working Group (IFWG)
• Consideration of
fintech strategy
Leg
isla
tio
n

Several regulators have collaborated to form the Intergovernmental fintech Working Group, a combined effort to
develop a deeper understanding of the local fintech industry and identifying an appropriate regulatory response.
SA regulation
responses
South African
Reserve Bank
Financial Sector
Conduct Authority
National Treasury
Financial Intelligence
Centre
Members of the IFWG
As a result of the growing interest and rapid innovation in fintech, the IFWG
was established to co-ordinate, track and develop a common response to
fintech regulation in South Africa. The IFWG was formed by members from
National Treasury, the SARB, the FSB (now FSCA) and the FIC at the end of
2016. During 2019, the NCR and South African Revenue Service (SARS)
became members of the group.
Objective:
To enable policymakers and regulators to understand, more broadly, the
fintech developments and relevant policy and regulatory implications for the
South African financial sector and economy in order that a coordinated
approach to fintech policy making could be developed and adopted. The
overall objective is to foster fintech innovation while ensuring a continued
efficient functioning of financial markets, financial stability and protecting the
rights and interests of customers and investors.
As part of this coordinated approach, the IFWG hosted its inaugural workshop on 19
and 20 April 2018, with the objective of providing a platform for regulators and
policymakers to engage with industry, identify key considerations, (risks and benefits)
and develop a harmonised approach to fintech-driven innovations for the benefit of all
South Africans. The conference was attended by a mix of fintech firms, incumbent
financial institutions, academic institutions, regulators and policymakers, and other
stakeholders with a vested interest in the financial services sector in South Africa. The
2018 agenda focused on Private crypto-currencies, Financial inclusion, Innovation
facilitation, and Regulatory and Policy Responses.
Activities since inception
April 2018 - Hosted the IFWG fintech workshop
November 2018 - Crypto Asset working group within the IFWG had a
workshop
January 2019 - Published a consultation paper on Crypto Assets: the paper
highlights the benefits and risks of the related activities, reviews the
approaches by other jurisdictions, and presents recommendations for dealing
with crypto assets from a South African perspective, taking into account the
FATF developments in this area
The 2019 fintech conference took place on the 3rd and 4th of September and focused
on the following topical issues:
• Digital identity
• Innovation
• Artificial intelligence (AI)
• Central bank digital currency
• Open banking
• Cyber risk
National Credit
Regulator
South African
Revenue Service
29

30
Regulators such as SARB and FSCA have been proactive in monitoring new technologies to understand the way in
which they may impact the underlying economic activities. SA regulation
responses
SARB’s fintech Programme
The SARB has established a fintech programme to strategically asses the emergence of fintech and consider its regulatory
implications. The fintech programme has three objectives:
o Review the SARB’s position on private cryptocurrencies to inform an appropriate policy framework and regulatory
regime.
o To investigate possible innovation facilitation mechanisms e.g. regulatory sandboxes, innovation hubs and
accelerators for SARB.
o Launch Project Khokha which will contribute to the global initiatives which assess the application and use cases of
distributed ledger technology (DLT). The project involved developing a proof-of-concept (PoC) wholesale payment
system for interbank settlement using a tokenised South African rand on DLT.
SARB’s Vision 2025
The main goal of the SARB’s Vision 2025 is to enhance safety, efficiency and accessibility of the national payment system.
In its Vision 2025 the SARB states that they support increased competition in the payments system value chain. This
includes the emergence of fintechs in the space, to foster the development of innovative solutions. As such, they promote
collaboration between fintechs and traditional payment services providers. Their strategy is to review and assess the
potential impact of new technologies such as APIs, DLT, the IoT and fintech offerings.
FSCA’s Regulatory Strategy
The FSCA released its Regulatory Strategy of the Financial Sector Conduct Authority in which they described their
supervisory approach to emerging financial sector trends and risks. For the next three years the FSCA highlighted their
focus areas, which includes financial inclusion and fintechs. The key outcomes of these priorities are to establish a fintech
department that is suitably resourced and actively engaged with fintech start-ups and incumbents using fintech.
FSCA’s fintech strategy seeks to create an appropriate balance between innovation and risk management to ensure good
outcomes for consumers. As a result, they plan to work closely with innovators to understand fintech start-ups through
innovation hubs and regulatory sandboxes.
Key dates:
July 2017 - The SARB announced that it will review its stance on crypto assets.
2018 - The FSCA drafted a position paper for internal consultation regarding the most
appropriate regulatory and supervisory framework for equity crowdfunding. This was not
a public document but a guideline for internal use, the outcome of which was
communicated to relevant stakeholders.
June 2018 - As part of Project Khokha, SARB published a paper on DLT which
investigated whether confidentiality could be achieved at scale, i.e. with production-level
volumes, and whether multiple node types, each configured by a participating bank,
could be accommodated.
Jan 2019 - SARB joins the Global Financial Innovation Network (GFIN). The GFIN, as a
network, provides an efficient conduit for innovative firms to interact with regulators and
to help them navigate between countries as they look to scale new ideas in the interest
of consumers.
2019 - The SARB is currently investigating the possibility of a central bank digital
currency (CBDC) backed by the rand, and hopes to experiment with at least three
different designs and/or deployment models during 2019.
- SARB and FSCA announced that they will establish an innovation hub for regulation of
fintechs and innovative financial products in the first half of 2020.
Sources: 1. Regulatory Strategy of the FSCA 2018 | 2. SARB media statements, 2018 | 3. SA to get fintech innovation hub, 2019.
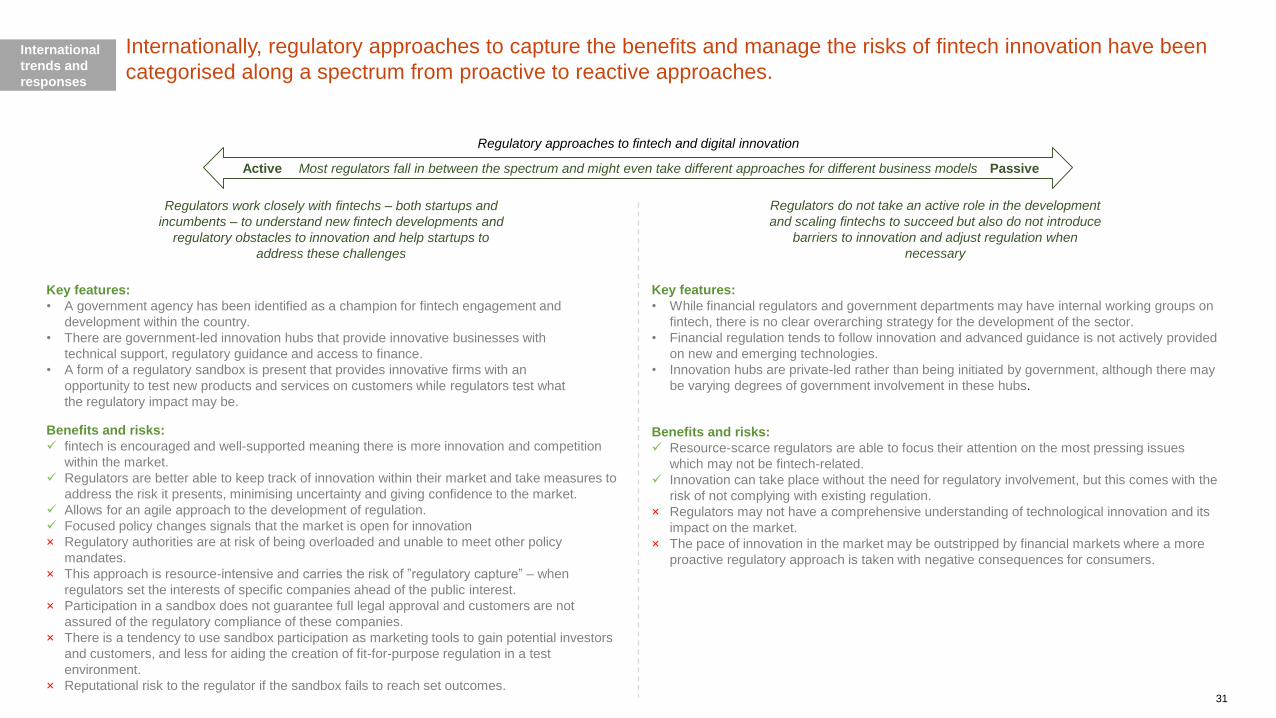
Internationally, regulatory approaches to capture the benefits and manage the risks of fintech innovation have been
categorised along a spectrum from proactive to reactive approaches.International
trends and
responses
Regulators work closely with fintechs – both startups and
incumbents – to understand new fintech developments and
regulatory obstacles to innovation and help startups to
address these challenges
Regulators do not take an active role in the development
and scaling fintechs to succeed but also do not introduce
barriers to innovation and adjust regulation when
necessary
Key features:
• A government agency has been identified as a champion for fintech engagement and
development within the country.
• There are government-led innovation hubs that provide innovative businesses with
technical support, regulatory guidance and access to finance.
• A form of a regulatory sandbox is present that provides innovative firms with an
opportunity to test new products and services on customers while regulators test what
the regulatory impact may be.
Key features:
• While financial regulators and government departments may have internal working groups on
fintech, there is no clear overarching strategy for the development of the sector.
• Financial regulation tends to follow innovation and advanced guidance is not actively provided
on new and emerging technologies.
• Innovation hubs are private-led rather than being initiated by government, although there may
be varying degrees of government involvement in these hubs.
Active PassiveMost regulators fall in between the spectrum and might even take different approaches for different business models
Regulatory approaches to fintech and digital innovation
Benefits and risks:
fintech is encouraged and well-supported meaning there is more innovation and competition
within the market.
Regulators are better able to keep track of innovation within their market and take measures to
address the risk it presents, minimising uncertainty and giving confidence to the market.
Allows for an agile approach to the development of regulation.
Focused policy changes signals that the market is open for innovation
× Regulatory authorities are at risk of being overloaded and unable to meet other policy
mandates.
× This approach is resource-intensive and carries the risk of ”regulatory capture” – when
regulators set the interests of specific companies ahead of the public interest.
× Participation in a sandbox does not guarantee full legal approval and customers are not
assured of the regulatory compliance of these companies.
× There is a tendency to use sandbox participation as marketing tools to gain potential investors
and customers, and less for aiding the creation of fit-for-purpose regulation in a test
environment.
× Reputational risk to the regulator if the sandbox fails to reach set outcomes.
Benefits and risks:
Resource-scarce regulators are able to focus their attention on the most pressing issues
which may not be fintech-related.
Innovation can take place without the need for regulatory involvement, but this comes with the
risk of not complying with existing regulation.
× Regulators may not have a comprehensive understanding of technological innovation and its
impact on the market.
× The pace of innovation in the market may be outstripped by financial markets where a more
proactive regulatory approach is taken with negative consequences for consumers.
31

Several regulatory mechanisms have been developed, with the approach taken by countries largely depending on the
capacity investment regulators are willing dedicate to monitor and support development.International
trends and
responses
Regulatory mechanisms
• SA: SARB announced it is
reviewing the potential of a
regulatory sandbox
• Regulatory sandboxes
enable businesses to test out
new products and services in a
semi-controlled environment
that functions in the market
under a temporary licencing
regime. The UK was the first
country to launch a sandbox in
2015, followed by Australia.
• Several countries have
expressed intention to
introduce a sandbox, including
Canada and the USA in 2018,
and India in 2019.
• Kenya became one of the first
African nations to launch a
regulatory sandbox in 2019,
followed by Sierra Leone, with
Mauritius announcing its
intention to launch regulatory
sandboxes.
Regulatory Sandboxes
• SA: SARB has joined the Global
Financial Innovation Network
(GFIN)
• Agencies championing the
fintech regulation process
frequently enter into cooperation
agreements with regulators in
other markets to facilitate
knowledge sharing as well as
instituting collaboration that may
help establish regulatory and
enforcement best practices.
• The UK has signed cooperation
agreements to share
information on market
innovations and trends with
China, Singapore, Korea,
Australia, Hong Kong, Canada
and Japan, among others.
• Similarly, Kenya has signed
cooperation agreements with
the Australian Securities and
Investments Commission and
the Abu Dhabi Global Markets
Financial Services Regulatory
Authority.
Cooperation Agreements
• SA: SARB and FSCA to establish
an innovation hub in the first half
of 2020
• Innovation hubs provide
innovators with direct support and
guidance, offering fintechs direct
access to regulatory personnel
who help the business
understand how best to navigate
current regulation applicable to
their product or service.
• The UK and Australia have set up
an innovation hub.
• Australian Securities and
Investments Commission (ASIC)
has also set out a regulatory
framework to assist fintechs
considering the use of
blockchain.
• In Kenya, Nairobi is known as the
Silicon Savannah, due to the
burgeoning number of tech start-
ups that are being formed and the
number of hubs supporting
technological innovation.
Innovation hubs
• SA: 12J Venture Capital tax
incentive (although currently does
not include investing on fintechs)
• Tax relief assists in reducing
the cost burden and
investment risk of start-ups.
• The UK provides relief for VCs
involved in small companies,
capital gain tax relief for
entrepreneurs, R&D
expenditure relief and tax-free
accounts for P2P lending
platform users.
• In Australia, the government is
proposing to remove the
‘double taxation’ treatment for
digital currencies.
• In India, tax exemptions and
relief include three years of
exemption for start-ups.
Tax incentives
• SA: Established the
Intergovernmental fintech
Working Group (IFWG)
• Several countries have
established inter-regulatory
working groups with a mandate to
study and understand fintechs,
assess opportunities and risks
and investigate the necessary
changes to align regulation with
the market.
• In Brazil numerous private/public
working groups are working
together with the securities
exchange and organisations such
as the Brazilian Payments
Association, the Brazilian
Association of Digital Credit and
Brazilian Association of Fintechs.
• Digital Financial Advisory
Committee in Australia is a
cross-section of finance experts
to supplement the ASIC’s
knowledge and support the
fintech community.
Inter-regulatory working groups
Sources: 1. International Comparative Legal Guide 2017 | 2. Ernst & Young, 201632

Compared to the UK, South African fintech regulation remains more reactive. However, certain regulatory responses
have surpassed other leading markets in African, like Kenya. International
trends and
responses
The UK is considered an international standard setter when it comes to fintech regulation.
Project Innovate under the FCA is the cornerstone of an enabling fintech strategy that
assists fintechs to navigate regulatory policy. The project includes a regulatory sandbox,
innovation hub and an advice unit which provides regulatory feedback for firms developing
automated models to deliver lower-cost advice and guidance to consumers. The UK also
has various policies such as the UK Angel co-fund, a publicly-backed venture capital loan
and loan fund which help ease the start-up process.
The implementation of open banking standards is expected to be the next international
standard setter. Open banking enables bank customers, both consumers and businesses,
to use third-party providers to manage their finances. Consumers then use fintechs to
make payments and analyse their finances, while still having their money safe in their
bank account, as banks are obligated to provide these third-party providers access to their
customers’ accounts through open APIs. This will enable third-parties to build financial
services on top of banks’ data and infrastructure. This has significant consequences for
banks, who will not only be competing with other banks but any other financial services
providers. This poses a great opportunity for fintechs to scale advisory and payment
services, using the transactional data collected by incumbent banks – which typically hold
the largest customer networks.
33
Sources : 1. Regulation and supervision of fintechs 2019 | 2. PSD2 - the directive that will change banking as we know it 2019 | 3. Centre of Excellence in Financial Services, 2018, The impact of the fourth industrial revolution on financial
services in South Africa
Case study:
UK- international leader
Kenya is one of the world leaders in mobile money and home to perhaps the most well-known
example of FinTech-based financial inclusion, M-Pesa. In Kenya, regulation has significantly lagged
behind the development of technology. In 2007 when M-Pesa was launched, the central bank issued
a ‘Letter of No Objection’ to Safaricom and only enacted the National Payment System Act in 2011
and the National Payment System Regulations in 2014. Hence, despite the recent introduction of the
regulatory sandbox, the Kenyan approach has mainly been reactive to the development of
technology.
There are aspects of the Kenyan regulatory framework that are somewhat underdeveloped. Kenya
does not have any statute dealing with the handling of personal data, however, the Data Protection
Bill has been pending before Parliament for the last six years. There is no restriction on the transfer of
data outside the country provided that the transfer does not infringe on the individual’s right to
privacy.
Similar to South Africa, crowdfunding is not regulated in Kenya. As a result, a number of regulators
can have the authority to regulate various forms of crowdfunding, including the Central Bank of
Kenya, the Capital Markets Authority and the Communications Authority of Kenya. In 2015, the
Central Bank of Kenya issued its declaration concerning cryptocurrencies. The bank declined to
recognise virtual currencies such as bitcoin and issued a public notice against dealing with virtual
currencies.
Case study:
Kenya - regional leader
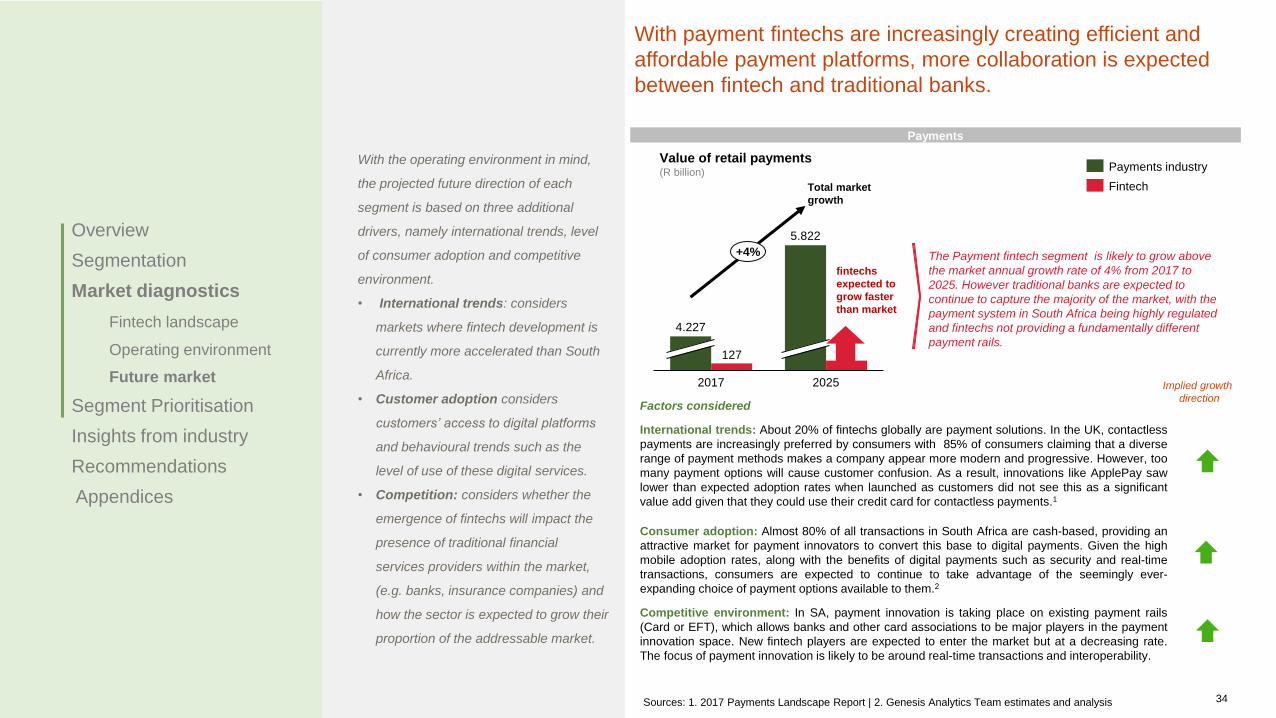
With payment fintechs are increasingly creating efficient and
affordable payment platforms, more collaboration is expected
between fintech and traditional banks.
Payments
Implied growth
direction
With the operating environment in mind,
the projected future direction of each
segment is based on three additional
drivers, namely international trends, level
of consumer adoption and competitive
environment.
• International trends: considers
markets where fintech development is
currently more accelerated than South
Africa.
• Customer adoption considers
customers’ access to digital platforms
and behavioural trends such as the
level of use of these digital services.
• Competition: considers whether the
emergence of fintechs will impact the
presence of traditional financial
services providers within the market,
(e.g. banks, insurance companies) and
how the sector is expected to grow their
proportion of the addressable market.
Sources: 1. 2017 Payments Landscape Report | 2. Genesis Analytics Team estimates and analysis
fintechs
expected to
grow faster
than market
Value of retail payments (R billion)
Factors considered
International trends: About 20% of fintechs globally are payment solutions. In the UK, contactless
payments are increasingly preferred by consumers with 85% of consumers claiming that a diverse
range of payment methods makes a company appear more modern and progressive. However, too
many payment options will cause customer confusion. As a result, innovations like ApplePay saw
lower than expected adoption rates when launched as customers did not see this as a significant
value add given that they could use their credit card for contactless payments.1
Consumer adoption: Almost 80% of all transactions in South Africa are cash-based, providing an
attractive market for payment innovators to convert this base to digital payments. Given the high
mobile adoption rates, along with the benefits of digital payments such as security and real-time
transactions, consumers are expected to continue to take advantage of the seemingly ever-
expanding choice of payment options available to them.2
Competitive environment: In SA, payment innovation is taking place on existing payment rails
(Card or EFT), which allows banks and other card associations to be major players in the payment
innovation space. New fintech players are expected to enter the market but at a decreasing rate.
The focus of payment innovation is likely to be around real-time transactions and interoperability.
The Payment fintech segment is likely to grow above
the market annual growth rate of 4% from 2017 to
2025. However traditional banks are expected to
continue to capture the majority of the market, with the
payment system in South Africa being highly regulated
and fintechs not providing a fundamentally different
payment rails. 127
2025
4.227
2017
5.822
+4%
Payments industry
Fintech
34
Total market
growth
Overview
Segmentation
Market diagnostics
Fintech landscape
Operating environment
Future market
Segment Prioritisation
Insights from industry
Recommendations
Appendices

Both the Lending and Savings & Deposits segments will see growth, however growth in Savings & Deposits is
expected to slow in the medium term as traditional banks continue to digitise their operations.
Sources: 1. 2020 Global lending industry Trends Be& Do value consulting Report | 2. Digital lending Report by the Boston Consulting Group | 3. The future of fintech and financial services EY Report | 4. Redrawing the lines: fintech's growing
influence on Financial Services PWC report | 5. Financial Times: Hong Kong hands out its first digital banking licences | 6. Genesis Analytics Team estimates and analysis
Future Market
10
656
2017 2025
863+3%
20252017
9.995
9
17.376
+7%
Value of loans extended in the market(R billion)
Value of deposits taken in the market(R billion)
Factors considered
International trends: The lending segment is one of the first segments to disrupt financial
services, entering the market at a time where big banks pulled back on making small business
and personal loans in the wake of the financial crisis. They have since experienced high
growth rates in a world where consumers are increasingly using internet searches to find credit
and where alternative credit rating models and advanced data analytics are including a market
of low-income consumers often overlooked by traditional lenders. In Asia, alternative lenders
experienced a CAGR of around 79% between 2015 to 2016 and 43% between 2014 and 2017
in the UK. Globally, digital lending is projected to increase by a CAGR of 48% between 2018
and 2023.
Consumer adoption: Traditional lenders have historically viewed lo- income consumers as an
unprofitable segment. Poor credit history and a lack of data have led to these consumers being
classified as risky. Similarly, SMEs without financial data find it difficult to secure credit. The
digitisation of data has allowed fintechs to use unstructured and external datasets to calculate
credit scores. This has allowed lending fintechs to service consumers that would otherwise be
excluded; thereby growing the overall size of the market.
Competitive environment: The extension of credit is often seen as a “hook” or anchor
product by financial institutions (FIs). As a result, banks have been more willing to partner and
collaborate with fintechs to improve their product offering and customer experience,
increasing the investment in this area.
Implied growth
directionFactors considered
International trends: There has been an increase in digital banking offerings globally.
However, due to regulation, traditional banks have managed to retain their competitive
advantage, capturing most of the market. In Hong Kong, however, regulators issued digital
banking licences in March 2019, allowing traditional financial institutions and Chinese
companies a chance to compete for the retail banking business. In the UK, New Banks Start-
up Unit introduced over 20 new banks, both digital as well as brick and mortar banks have
been authorised, changing the landscape significantly.
Consumer adoption: By moving away from physical to digital distribution channels, and
investing in digital core banking systems, digital banks have managed to provide banking
services, often with unique value propositions (such as real-time account opening) and more
intuitive customer journeys while keeping costs low. Lower fee models and innovative
products have attracted consumers away from traditional banks.
Competitive environment: 2019 will see three new digital banks entering the South
Africamarket and there has been much media hype around their innovative business models.
Tyme Bank has managed to grow from 80,000 consumers in March 2019 to 250,000 a month
later. These players are expected to increase the competition for traditional banks. However,
given that digital banks are still required to apply for a banking licence (both an expensive
and time consuming process), it is not expected that there will be continued growth in this
sector.
Implied growth
direction
Lending Savings & Deposits
Lending market
Fintechs
The Lending fintech segment is likely to grow above
the market annual growth rate of 3% from 2017 to
2025, possibly providing loans with a value more that
R13 billion by 2025.
The Savings & deposit fintech segment is likely to
grow above the market annual growth rate of 7% in the
next few years, however, by 2025 this trend should
slow down. The proportion of deposits taken by
fintechs will increase slightly by 2025.
35
fintechs
expected to
grow faster
than market
fintechs
expected to
grow faster
than market

Factors considered
International trends: Cryptocurrency and crypto assets are leading the growth in the global
investment market; the sector is estimated to grow at a CAGR of 31.3% between 2017 to 2025.
Initial Coin Offering (ICOs), a mechanism for investors to crowdfund crypto-assets, has recently
been replaced by Initial Exchange Offerings (IEOs) which moves the administration of fund-
raising to a crypto exchange allowing investors to sidestep legal requirements themselves.
Europe and North America are the two largest markets for cryptocurrency investing supported
by advanced bitcoin mining capabilities.
Consumer adoption: South Africa and Nigeria are the largest cryptocurrency markets in Africa,
however trading volumes are very low in comparison to global market leaders. As the global
price of bitcoin increased, many South Africans invested in the cryptocurrency, while the
subsequent crash in the price of bitcoin has subdued the market. In a recent survey, more than
60% of respondents were unaware of what cryptocurrency is.
Competitive environment: Despite the fact that the FSCA, previously the Financial Services
Board, has granted five licences to alternative exchanges since 2015, activity on these
exchanges remains low. Cryptocurrency payments, wallets and mining are gaining traction, with
more international cryptocurrency exchanges looking to enter the South African market.
Cryptocurrency is not considered legal currency in South Africa but is considered in the same
class as promissory notes, futures contracts, and derivatives based on underlying commodities
for tax purposes.
Insurtech is predicted to grow slightly ahead of traditional insurance providers, due to a large number of new entrants
and technology adoption of traditional insurers, whilst the Investment segment is expected to grow in line with global
markets.
Sources: 1. BisReport.com, 2018 I 2. ResearchandMarkets.com, Dec 2018 I 3. PWC Africa Insurance Report, 2018, I 4. Accenture SA Insurance Survey, 2018 | 5. Transparent Market Research 2018 | 5. ResearchandMarket.com |
6. Old Mutual Savings & Investment Monitor, 2018 | 7. Genesis Analytics Team estimates and analysis
Future Market
Value of Gross Written Premiums by Short-term Insurers(ZAR billion)
Factors considered
International trends: The EMEA general insurance industry is predicted to grow between 3-
4% between 2016-2022. Insurtech evolution is expected to remain on a positive trajectory,
having grown at 7.81% in 2017.
Consumer adoption: Digital awareness is higher among South African insurance customers
(41%) compared to other developed markets like the UK (38%), but uptake of insurtech is low.
Insurance penetration, in general, is low in South Africa (12.6% of GDP in 2017) and has been
on a decline due to the tough economic environment and lower discretionary spending of
consumers. New business models that reduce costs and offer lower premiums could be
successful. Peer-to-peer insurance could result in a significant shift in the attitudes of
consumers, where members can select their network and their premiums can be used for
paying claims of people whose behaviours are more aligned to their own. South Africa has a
large funeral insurance market, largely facilitated through burial societies that could benefit
from digitisation.
Competitive environment: The insurtech market is dynamic and competitive, with numerous
new short-term insurers entering the market in 2017 and 2018 and more players anticipated to
launch in 2019. Traditional insurers are also taking advantage of technology to increase
efficiency and improve the speed and quality of service in order to maintain their relevance in
the market.
Implied growth
direction
2
2018 2025
98
134
+5%
Insurance industry
Insurtech
The insurtech market will continue to grow
moderately ahead of the traditional insurance
market over the forecast period.
Insurtech
Average number of trades per day(Count, 0000s)
10
2018 2025
320
1.006+18%
Fintechs
Investments industry
The investment fintech market will continue to
grow, however, this is highly dependent on
whether regulatory reforms allowing trade in
cryptocurrency will be passed and activity on
alternative exchanges increases.
Investments
36
fintechs
expected to
grow faster
than market
fintechs
expected to
grow slower
than market
Implied growth
direction

The Financial Planning & Advisory segment is expected to grow in line with global markets, whilst the future growth of
crowd investing is uncertain as it is largely dependent of regulatory reform.
Sources: 1. Transparency Market Research, 2018 I 2. ResearchAndMarkets.com, 2017 I 3. Old Mutual Savings & Investments Monitor, 2018 | 4. Crowdfunding in Emerging Markets: Lessons form East African Startups | 5. Crowdfunding in
Africa Afrikstart Report | 6. 2017 Payments Landscape Report | 7. Genesis Analytics Team estimates and analysis
Future Market
South Africans using paid advisory Services(Count, 000s)
Factors considered
International trends: The global robo-advisory market is expected to grow at an overall
CAGR of 53.54% from 2018 to 2023. Advanced data analytics, AI technology and rising
internet penetration have increased affordability and accessibility of financial advice.
Consumer adoption: Currently, adoption of automated financial planning & advisory
services is low and limited to segments of the market (middle to high-income segments) that
already have access to formal financial services and have the option of traditional financial
advice. The low savings rate make adoption of new, convenient and cheaper ways to
manage finances slow. However, fintech that promotes financial education and wellness for
mass-market consumers has great potential to step change the status quo.
Competitive environment: There have not been frequent new entrants into this segment.
The majority of the activity is with incumbent financial advisory service providers who are
using the advancements in technology and collaborating with fintechs to lower their costs
and provide innovative services to their client base. Trust is an important element for
consumers when selecting an FI to assist them to manage their money, thus it is expected
that competition will largely be with incumbents and trusted brands adopting fintech in a way
that resonates with the financial needs and goals of consumers.
Implied growth
direction
58
2018 2025
1.212
1.590+4%
Incumbents will continue to invest
in innovation to reduce their
operational costs but it will be
difficult for a start-up to disrupt this
market
Financial planning & Advisory
0
2017
1.162
2025
22.333+45%
Factors considered
International trends: Prior to 2015, crowdfunding was most prevalent in North America and
Europe. However, it has become increasingly popular in developing markets including Sub-
Saharan Africa where crowdfunding is expected to register a CAGR of 33% from 2016 to 2023.
However, most of the platforms in the region direct funds to start-ups through credit and
donations (many recipients include social causes and charity projects). The popularity of equity
investment in developed markets has also been driven by low market yields; in developing
markets (where yields are higher) individuals may be more reluctant to invest in high-risk
models based on assumption-heavy valuations.
Consumer adoption: Crowdfunding platforms usually appeal to entrepreneurs, looking for
smaller amounts of capital who may fall below the threshold of venture capital firms.
Registering on a crowdfunding platform could have the added benefit of marketing a new
venture’s products and services, and loyalty/rewards propositions create advocacy for the
brand.
Competitive environment: The number of future entrants will depend on regulatory reforms.
Despite providing a more accessible service for entrepreneurs, South Africa has only one
equity crowd investing platform, Uprise.Africa. Raising equity investment is a highly regulated
area thus crowdfunding platforms will most likely remain reward-based or debt-based.
Implied growth
direction
Growth in Crowd investing is expected to be flat,
possibly growing lower than the market due to the
current regulatory environment
Capital raising
Value of funds raised by Venture Capital firms and crowd investing platforms (R million)
37
fintechs are
not expected
to grow
Financial planning & advisory industry
FintechsVenture Capital industry
Fintech
fintechs
expected to
grow in line
with the
market

38
Most of the segments are expected to grow, however, there are several factors that might limit growth within the
segments. Future Market
Payments Lending Savings and deposits InsurTech Investments Financial planning &
Advisory Capital Raising
Lim
itin
g f
acto
rs
Given that payment
innovation is taking place
on existing payment rails
and banks remain major
players in the payment
innovation space, the main
challenge for payment
would be competition with
incumbents. Partnership
with banks will be
important for the growth
of the sector.
Traditional banks dominate
this highly regulated space.
New players, which will
launch during 2019 and 2020,
will disrupt the market.
However the high regulatory
requirements remain the
biggest constraint.
Consumers also tend to trust
a recognised brand with their
money.
Incumbents with multiple
product offerings have the
advantage of cross-selling
and bundling products.
Pro
jecti
on
The Payment fintech
segment is likely to grow
above the market annual
growth rate of 4% from
2017 to 2025.
Lending fintech segment is
likely to grow above the
market annual growth rate
of 3% from 2017 to 2025.
Savings & Deposit fintech
segment is likely to grow
above the market annual
growth rate of 7% in the first
few years, however, by 2025
this trend should slow down.
The insurtech market will
continue to grow
moderately ahead of the
traditional insurance market
over the forecast period.
Fintechs are expected to
grow in line with the
market.
The investment fintech
market is expected to
grow slower that market.
Growth in Crowd
investing is expected to
be flat, possibly
growing lower than the
market.
Gro
wth
facto
rs
Factors such as funding, market readiness and innovative incentives to develop the innovation ecosystem have implication for all segments.
Global regulatory trends are
opening up the payments
space by requiring banks to
share data with fintechs. It is
reasonable to assume these
trends will filter into the
South African market.
Consumers will increasingly
prefer the convenience of
digital payments.
High levels of
indebtedness amongst low-
income citizens in South
Africa has led to
Parliament’s consideration
of a legislative drive to
write off debt of
overburdened
consumers. Amendments
to the NCA will make the
lending processes more
difficult which could hamper
growth.
Growth is likely to be
driven by high consumer
demand as these fintechs
resonate with previously
underserved consumer
segments not being
catered for by formal
financial services
providers.
Digital channels, new
product features, 24/7
access to providers and
innovative value
propositions (such as
instant account opening)
will encourage customer
adoption of new entrants.
Niche or tailored risk
and pricing models will
likely drive the growth of
this segment, as products
will be priced more
competitively. Digital
channels will make
products more accessible
and will improve customer
experience on processes
like claims.
Digital access and the
removal of intermediaries
will improve customer
adoption by reducing fees
and making investment
products more accessible.
Robo-advice is being used
to replace the high cost of
personal advice. There is
a wide range of business
use for this type of
technology ranging from
retirement planning to
portfolio selection.
Underserved MSMEs could
be a valuable market for
crowdfunding platforms as
well as start-ups currently
bootstrapping their business.
There is also a market for
investors looking for
alternative investment
channels, where small
amounts can be invested at
and higher returns.
Traditional insurers have a
higher client and asset
base. As a result, they are
able to use this position to
price competitively.
Sustainability of fintechs
underwriting low value
assets is the biggest risk
for growth in this sector.
Investment products are
regarded as a secondary
financial need. Difficult
economic conditions, and a
poor savings and
investment culture, will
make this a challenging
area to grow. In addition,
consumers have high trust
in incumbent FSPs when
thinking about investing
long term.
The biggest constraint is
regulation, as financial
services providing advice
through an electronic
medium that uses
algorithms and
technology without the
direct involvement of a
natural person must
comply with additional
operational ability
requirements.
With no specific regulation
for crowding funding, these
business are required to
comply with numerous
regulations (e.g. Financial
Markets Act, FAIS, NCA
etc) that were developed
for traditional investment
firms or FSPs.
* Please note, views expressed in these interviews are of Genesis Analytics, based on independent research and analysis

Payments
segment
Lending
segment
Deposits &
Savings
Segment
Insurtech
segment
Investment
segment
Financial
planning &
advisory
Capital
Raising
B2B Tech
providers
Scalability
4 3 2 2 1 2 1 4
Basic financial
services that
can be easily
integrated
with channels
outside of
banking e.g.
social media
High
customer
demand, with
new credit
scoring
models to
include
previously
excluded
clients
Success of
Capitec
demonstrates
that there is a
market for
lower fees,
simple
products and
better interest
rates
Image
processing
tools and
digital
platforms for
sales and
claims
processing
make
insurance
more
accessible
Secondary
financial
product for
middle
income
consumers
Providing
financial
advice for the
mass market
which is
otherwise
unable to
access
traditional
channels
The
incumbent
exchange
(JSE) is likely
to maintain
market share
but new
exchanges
may attract
smaller
investors
Large market
for tech
solutions to
support
incumbent
financial
institutions or
other fintechs
as white label
solutions
Improve quality of
financial services
4 4 2 2 2 3 2 3
Making
payments
more efficient
(real-time),
improving the
cost of
remittances,
and reducing
the reliance
on cash
Seamless
credit
application
process with
short loan
application
turnaround
time
Innovative
products and
CVPs are
incentivising
savings
behaviour
Improving risk
management
models by
allowing
consumers to
tailor their risk
exposures
Simple and
easy to
understand
system will
help
inexperienced
investors
navigate the
sector
Provides
information on
product
availability
and suitability
to the
consumer’s
portfolio
Competition
improves
trading and
settlement
fees and
offers
investors
more choice
Building
solutions that
that improve
security,
automaton
and customer
experience
Understanding which segments are likely to make the biggest impact on the financial
services sector will aid policymakers prioritise initiatives.
Overview
Segmentation
Market diagnostics
Segment Prioritisation
Insights from industry
Recommendations
Appendices
The prioritisation framework builds on the findings of the market diagnostic. Commercially successful segments that have the potential to yield
important development benefit in the South African economy are identified based on success factors/features of fintech business models that
policymakers and regulators would want to encourage.1 The results of that assessment are presented below.
Notes: 1. Explanation on factors included in the next slide 39

Payments
segment
Lending
segment
Deposits &
Savings
Segment
Insurtech
segment
Investment
segment
Financial
planning &
advisory
Capital RaisingB2B Tech
providers
Improves financial
well-being
1 1 3 2 2 3 1 N/A
Processing
payments at
lower costs
Digital
payments are
safer than cash
transactions
Responsible
lending
provides
liquidity for
SMEs and
individuals to
cover economic
shocks
Access to
savings
provides
liquidity for
unforeseen
circumstances
Allowing
consumers to
protect against
potential
financial loss at
low premiums
Allows
consumers to
realise long
term savings
goals and
improve wealth
Providing
financial
information at
low cost,
improving
consumers’
financial
decisions
Access to
investment
opportunities
will encourage
more investors
to participate
but there are
investment risks
Economic
development
2 3 3 1 2 2 3 1
Digitises cash in
the economy
Access to credit
is a
fundamental
part of growing
the economy
Higher savings
rates have a
positive impact
on economic
growth
Helps MSMEs
and individuals
mitigate risk
Higher savings
and
investments
improve
economic
growth
Encourages
long term
savings which
has a positive
impact on the
economy
Allows smaller
companies /
MSMEs to
benefit from
access to equity
capital
Facilitates
innovative
financial
solutions
Risk factors
-2 -3 -3 -2 -2 -2 -2 -2
Customer
preference for
cash
Competition
with traditional
banks who are
digitising
payments
Increasing
regulation will
make it difficult
to grow this
sector
Poor economic
conditions could
increase non-
performing
loans
Dominance of
incumbents with
stringent
regulation may
deter segment
growth
Historical low
savings rates
could impede
growth
Uncertainty
around
sustainability of
covering low-
value assets
SA’s low
financial literacy
and savings
rate makes
investment less
viable
Consumers
prefer face to
face advice for
more complex
financial
decisions
Design and
testing of
algorithms for
accuracy must
be monitored
Uniform
regulation that
applies to all
platforms will
limit the number
of crowdfunding
platforms
Partnership
models – many
incumbents
prefer to buy a
stake in fintech
B2B business
or limit them to
an exclusivity
arrangement
Overall impact 9 8 7 5 5 8 5 6
Factors considered:
• Scalability: Considers whether
fintech business models are likely
to succeed, grow, attract
customers, improve efficiency,
and be sustainable.
• Improves quality of financial
services: Considers the level of
innovation that can bring new
products and services to market
with greater efficiency within the
financial sector.
• Improves financial well-being:
Considers how fintechs help
consumers make better financial
decisions, including providing
services at a low cost.
• Economic development:
Considers how the development of
the fintech sector could contribute
to the economy.
• Risk factors: Considers potential
risks that may deter the progress
of each segment.
The Financial Planning & Advisory segment has a high overall score with Lending and Capital
Raising segments showing highest potential to provide economic and developmental benefits.
Highest - Lowest priority segments
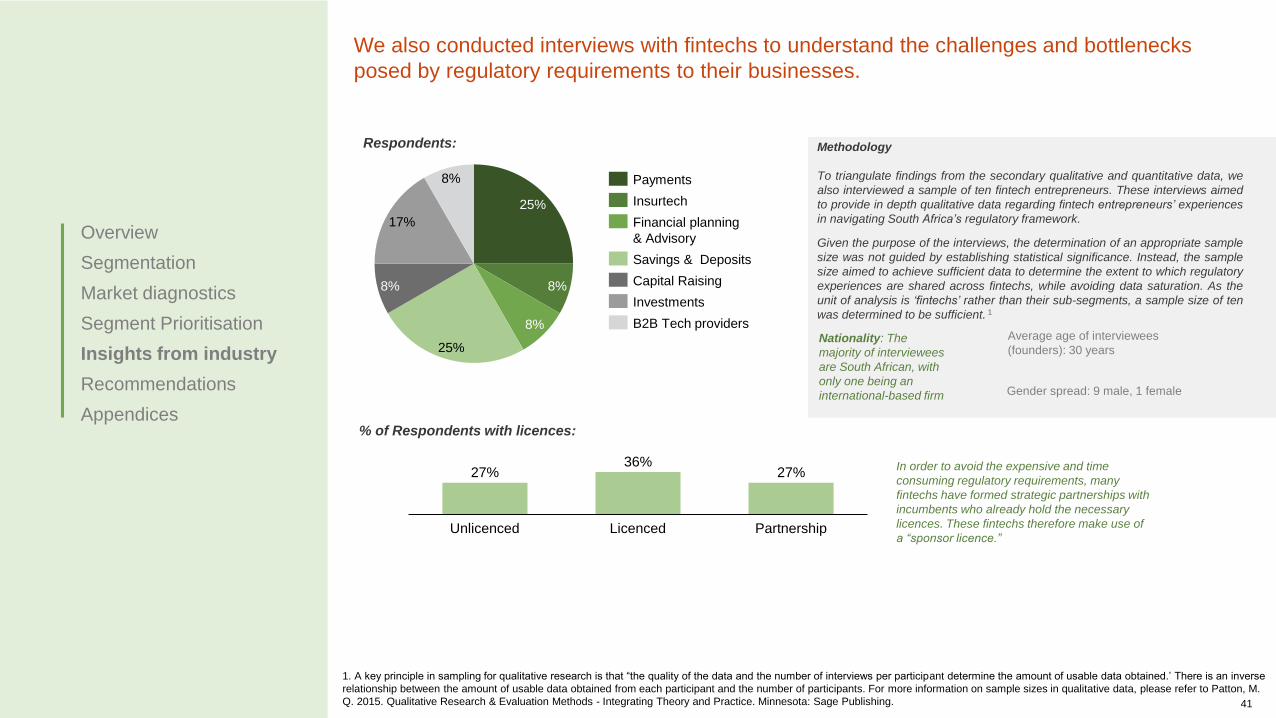
Overview
Segmentation
Market diagnostics
Segment Prioritisation
Insights from industry
Recommendations
Appendices
We also conducted interviews with fintechs to understand the challenges and bottlenecks
posed by regulatory requirements to their businesses.
25%
8%
8%
25%
8%
17%
8%
Financial planning
& Advisory
Payments
Savings & Deposits
Insurtech
Capital Raising
Investments
B2B Tech providers
Respondents: Methodology
To triangulate findings from the secondary qualitative and quantitative data, we
also interviewed a sample of ten fintech entrepreneurs. These interviews aimed
to provide in depth qualitative data regarding fintech entrepreneurs’ experiences
in navigating South Africa’s regulatory framework.
Given the purpose of the interviews, the determination of an appropriate sample
size was not guided by establishing statistical significance. Instead, the sample
size aimed to achieve sufficient data to determine the extent to which regulatory
experiences are shared across fintechs, while avoiding data saturation. As the
unit of analysis is ‘fintechs’ rather than their sub-segments, a sample size of ten
was determined to be sufficient. 1
Partnership
36%
Unlicenced Licenced
27% 27%
Nationality: The
majority of interviewees
are South African, with
only one being an
international-based firm
Average age of interviewees
(founders): 30 years
% of Respondents with licences:
In order to avoid the expensive and time
consuming regulatory requirements, many
fintechs have formed strategic partnerships with
incumbents who already hold the necessary
licences. These fintechs therefore make use of
a “sponsor licence.”
1. A key principle in sampling for qualitative research is that “the quality of the data and the number of interviews per participant determine the amount of usable data obtained.’ There is an inverse
relationship between the amount of usable data obtained from each participant and the number of participants. For more information on sample sizes in qualitative data, please refer to Patton, M.
Q. 2015. Qualitative Research & Evaluation Methods - Integrating Theory and Practice. Minnesota: Sage Publishing.
Gender spread: 9 male, 1 female
41
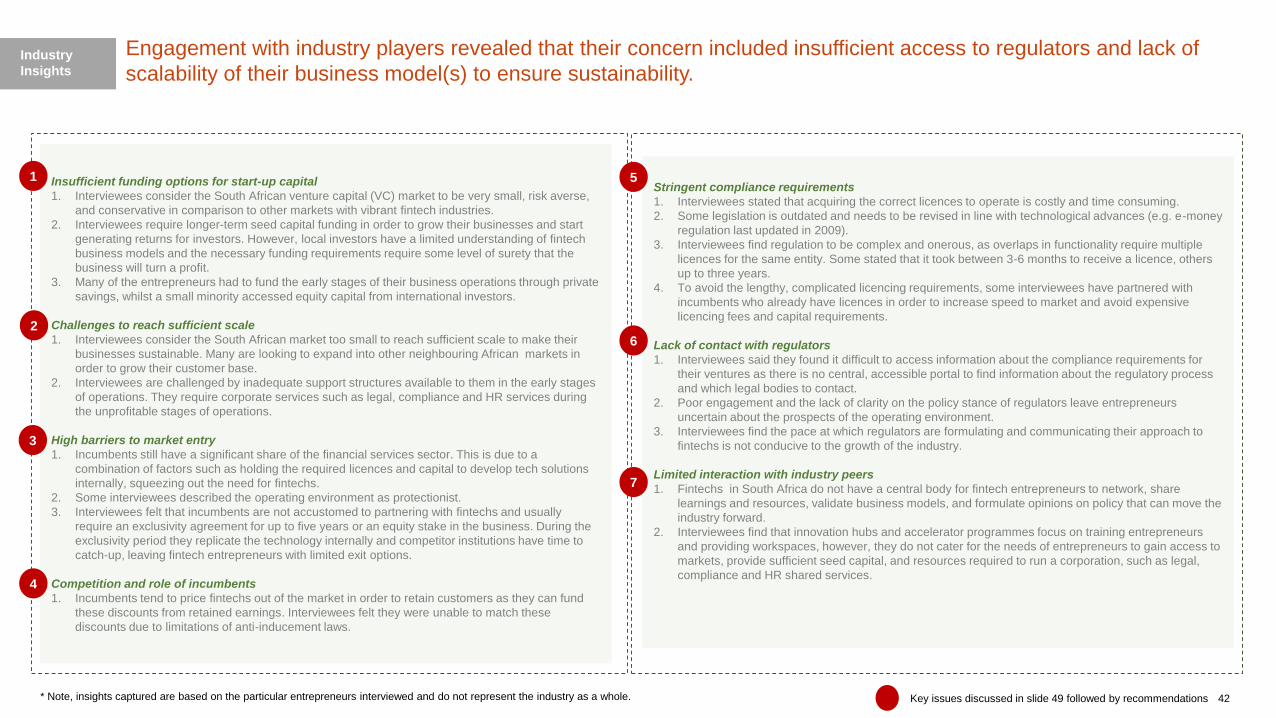
Engagement with industry players revealed that their concern included insufficient access to regulators and lack of
scalability of their business model(s) to ensure sustainability.Industry
Insights
Insufficient funding options for start-up capital
1. Interviewees consider the South African venture capital (VC) market to be very small, risk averse,
and conservative in comparison to other markets with vibrant fintech industries.
2. Interviewees require longer-term seed capital funding in order to grow their businesses and start
generating returns for investors. However, local investors have a limited understanding of fintech
business models and the necessary funding requirements require some level of surety that the
business will turn a profit.
3. Many of the entrepreneurs had to fund the early stages of their business operations through private
savings, whilst a small minority accessed equity capital from international investors.
Challenges to reach sufficient scale
1. Interviewees consider the South African market too small to reach sufficient scale to make their
businesses sustainable. Many are looking to expand into other neighbouring African markets in
order to grow their customer base.
2. Interviewees are challenged by inadequate support structures available to them in the early stages
of operations. They require corporate services such as legal, compliance and HR services during
the unprofitable stages of operations.
High barriers to market entry
1. Incumbents still have a significant share of the financial services sector. This is due to a
combination of factors such as holding the required licences and capital to develop tech solutions
internally, squeezing out the need for fintechs.
2. Some interviewees described the operating environment as protectionist.
3. Interviewees felt that incumbents are not accustomed to partnering with fintechs and usually
require an exclusivity agreement for up to five years or an equity stake in the business. During the
exclusivity period they replicate the technology internally and competitor institutions have time to
catch-up, leaving fintech entrepreneurs with limited exit options.
Competition and role of incumbents
1. Incumbents tend to price fintechs out of the market in order to retain customers as they can fund
these discounts from retained earnings. Interviewees felt they were unable to match these
discounts due to limitations of anti-inducement laws.
Stringent compliance requirements
1. Interviewees stated that acquiring the correct licences to operate is costly and time consuming.
2. Some legislation is outdated and needs to be revised in line with technological advances (e.g. e-money
regulation last updated in 2009).
3. Interviewees find regulation to be complex and onerous, as overlaps in functionality require multiple
licences for the same entity. Some stated that it took between 3-6 months to receive a licence, others
up to three years.
4. To avoid the lengthy, complicated licencing requirements, some interviewees have partnered with
incumbents who already have licences in order to increase speed to market and avoid expensive
licencing fees and capital requirements.
Lack of contact with regulators
1. Interviewees said they found it difficult to access information about the compliance requirements for
their ventures as there is no central, accessible portal to find information about the regulatory process
and which legal bodies to contact.
2. Poor engagement and the lack of clarity on the policy stance of regulators leave entrepreneurs
uncertain about the prospects of the operating environment.
3. Interviewees find the pace at which regulators are formulating and communicating their approach to
fintechs is not conducive to the growth of the industry.
Limited interaction with industry peers
1. Fintechs in South Africa do not have a central body for fintech entrepreneurs to network, share
learnings and resources, validate business models, and formulate opinions on policy that can move the
industry forward.
2. Interviewees find that innovation hubs and accelerator programmes focus on training entrepreneurs
and providing workspaces, however, they do not cater for the needs of entrepreneurs to gain access to
markets, provide sufficient seed capital, and resources required to run a corporation, such as legal,
compliance and HR shared services.
42
1
2
3
5
7
Key issues discussed in slide 49 followed by recommendations
6
4
* Note, insights captured are based on the particular entrepreneurs interviewed and do not represent the industry as a whole.

Overview
Segmentation
Market diagnostics
Segment Prioritisation
Insights from industry
Recommendations
Appendices
The recommendations proposed in
this section of the report are based
on research on international trends
as well as interviews with
entrepreneurs that are currently
operating in the market and have
had to ensure that their businesses
are compliant.1
Interactions with fintechs together with the analysis of the current
market reveal a number of key issues that inhibit seamless entry into
the local financial services sector.
Themes of key issues
43
Funding &
support
Market
opportunity
Innovation
Ecosystem
Regulation
Communication
1
2
3
4
5
• South African regulators have been slow to formulate and communicate a clear
stance on the fintech industry.
• Fintechs need better avenues to contact regulators and enquire about compliance
issues.
• Fintechs cite the limited peer-to-peer interaction with similar businesses as another
factor that makes the business environment difficult to navigate.
• Traditional financial services providers still hold the lion’s share of the market due to
the high costs and complex regulatory requirements to run a financial operation in
SA.
• The cost of a smartphones and of data in South Africa is still expensive for low-
income earners, who cannot have a contract and buy data on pre-paid.
• Fintechs find licencing requirements complex, time consuming and expensive.
Regulation usually requires a fintech to define their business and activity, placing
them in a box that can be limiting.
• Cumbersome bureaucratic processes impede the successful application of skilled
individuals seeking to migrate to South Africa.
• Impeding IP and data protections laws – still in review.
• Poor coordination across government departments results in fragmented, dislocated
and inefficient national efforts.
• Funding channels mostly require fintechs to have a proven business model that is
scalable with high expected returns.
• Acquiring early-stage and growth financing often requires fintechs to be regulatory
compliant.
• Government support and incentives for tech financing are poorly coordinated. There
is unclear regulation around crowdfunding limits scaling of alternative financing.
1. Note the recommendations outlined in this section are those of Genesis Analytics, and not that of the IFWG members, the
World Bank Group, or SECO.

Issue Gaps Existing structures and initiatives Recommendations to address gaps
Regulatory support Policymakers have relatively limited levers to
pull regarding the operation of VC and PE
funding. However one avenue that has a large
impact is regulatory transparency and clarity.
VC and PE firms tend to have risk-adverse
outlooks and look for indicators of success. They
also prefer investments that are unlikely to face
future issues around regulatory compliance.
• SARB innovation hub
• IFWG regulatory sandbox in development
Regulators need to come up with streamlined, accessible and
transparent processes to assess and mitigate the risk of a start-up
business model. One method is by leveraging regulatory tools
available to the regulator within their mandate such as those
highlighted below. This will provide confidence to both investors and
consumers of fintech solutions.
This could the form of:
• Letter of no objection;
• Conditional licences;
• Entry into regulatory sandbox for testing; or
• Provision of a basic fintech start up licence.
Facilitating public
financing
Fintech entrepreneurs face funding challenges;
their options are either to secure private
investments, partner with an incumbent (with the
risk of losing independence) or using personal
savings. There is little direct public sector
support for fintech entrepreneurs.
Indirect support, for example the section 12J tax
incentive scheme, excludes fintech investments
entirely.
Currently no publically-announced actions to specifically
support fintech funding.
There are public financing arms such as the SEFA and the IDC that
could be engaged to develop dedicated financing lines for tech
entrepreneurs.
National Treasury, as a member of the IFWG, could broaden the
mandate of Section 12J beyond job creation to include sectors like
financial services and financial technology.
Similar to the model employed by the UK government, create and
support publicly-backed venture capital and loan funds to address a
market failure and support MSMEs or start-up firms. These funds
should have an innovation focus.
High regulatory
thresholds around
alternative financing
Crowdfunding platforms have proven to be an
important facilitator of private investment to
support tech entrepreneurs. The development of
equity / debt-based platforms in South Africa has
been muted. This has denied fintechs a valuable
source of funding.
No known actions to develop this sector at present. Use the current equity-based crowdfunding platform as a case study
or “sandbox” to evaluate the risk of the business model with the
intention to properly regulate equity-based crowdfunding in future.
Funding &
Support 1
Regulators and policymakers have a role to play in facilitating funding mechanisms and providing tools. In countries
such as the UK, the government has gone as far as supporting publicly-backed VC and loan funds to address market
failures.
Recommend
ation
44* Please note, the recommendations listed in this document are those of Genesis Analytics, and not that of the regulators, World Bank, or members of the IFWG

Issue Gaps Existing structures and initiatives Recommendations to address gaps
Competition from
incumbents
South Africa has a high banked population,
where almost 80% of the population have an
existing relationship with an incumbent bank.
High barriers have created high market
concentration in the retail banking market.
Incumbents invest heavily in digitising and
including innovation in their product offerings
and channels. Incumbents often buy out start-
ups to include in their own operating models
• Past reviews by the Competition Commission on the
banking sector highlights the sector’s uncompetitive
nature.
• The regulator has granted licences to five new banks
that are expected to launch between 2018 and 2020.
A tiered licencing regime would reduce barriers to entry for fintech
players especially in the sectors of retail banking, insurance,
investment and capital raising. These licences have clear restrictions
and limits to protect market stability.
In the longer term, regulators could consider implementing open
banking requirements (such as PSD2 in Europe) to mandate data
sharing between fintechs and incumbents.
Data affordability and
smartphone costs
The cost of smartphones (all imported
technology) and the cost of data is still
expensive for low-income earners, who typically
buy pre-paid data. Without access to affordable
data, many are excluded from innovative
solutions that could improve their daily lives.
• Independent Communications Authority of South Africa
(ICASA) compelled mobile operators to allow
customers to roll over unused data from March 2019.
• ICASA has cut mobile termination rates – the
price operators charge each other to carry calls
between their networks. This is part of its broader
programme to reduce the cost to communicate.
• The Competition Commission has conducted a data
services market inquiry (not yet enacted).
Although out of the scope of the financial services sector, the ICT
infrastructure is a key component of facilitating digital innovations. To
that end policymakers could broker zero-rated data agreements with
MNOs for fintech services.
Government could increase the roll out public WiFi hotspot trials
(e.g. Tshwane) that have already proven successful.
There should also be a review of the luxury tax definition and its
impact on the price of smartphones.
Scalability with high
expected returns
Although South Africa has high financial
inclusion, it also has low financial literacy that
leads to a low transacting market that is heavily
reliant on cash. This limits domestic revenue
potential.
There are also few examples of support
mechanisms for regional expansion
• South Africa is currently a member of the Common
Monetary Area and SADC.
• Social grants have been moved to digital channels
(money is distributed by card) but there has been little
action to encourage behaviour change, with most
recipients immediately withdrawing the grant in cash.
To continue the development of the SADC region, regulators could
consider the implementation of a regional sandbox, thereby
increasing the market for entrepreneurs.
There should also be better cooperation agreements between
regulators and passporting arrangements to attract innovators to the
country and encourage cross learning.
There is also the opportunity to develop an inter-regulatory regional
body to facilitate innovation development in financial services (e.g.
SADC CCBG).
Entrepreneurs need to scale their solutions in order to create sustainable business models and enable consumers to
benefit from a competitive market. Creating a regional market can help fintechs build scale and establish South Africa
as an innovation hub.
Recommend
ation
45
Grow Market
Opportunity2
* Please note, the recommendations listed in this document are those of Genesis Analytics, and not that of the regulators, World Bank, or members of the IFWG
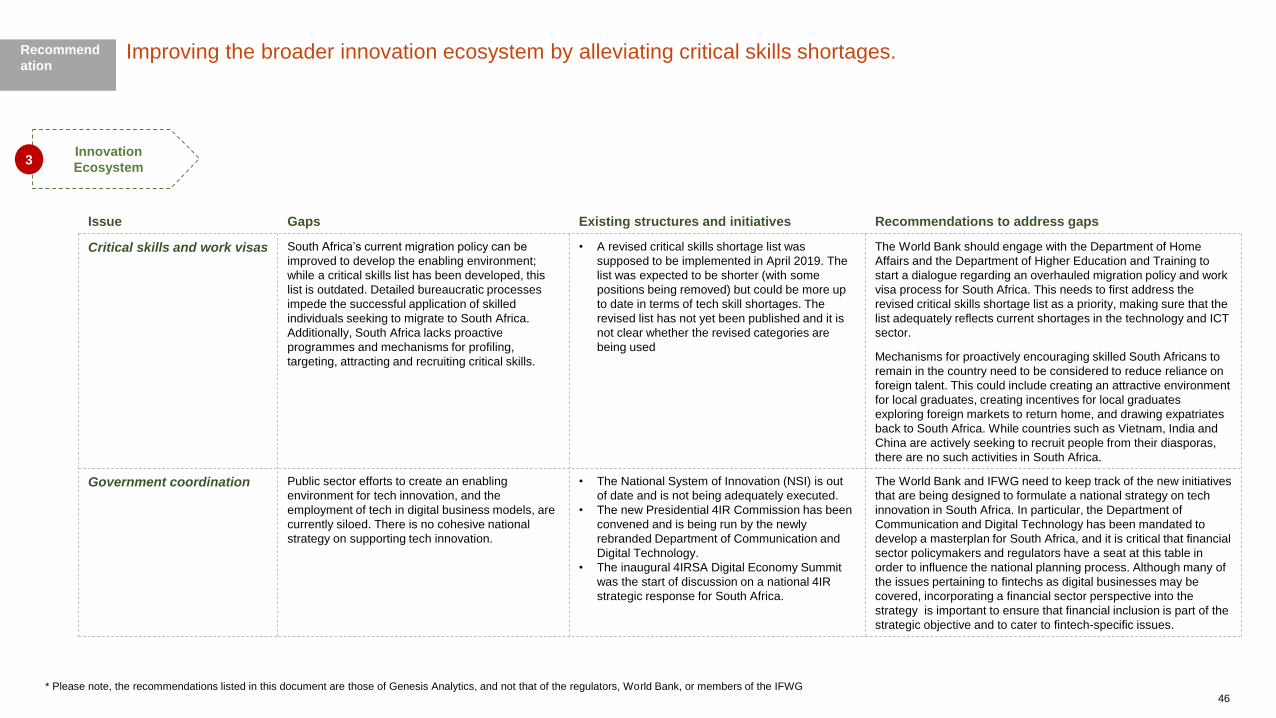
Issue Gaps Existing structures and initiatives Recommendations to address gaps
Critical skills and work visas South Africa’s current migration policy can be
improved to develop the enabling environment;
while a critical skills list has been developed, this
list is outdated. Detailed bureaucratic processes
impede the successful application of skilled
individuals seeking to migrate to South Africa.
Additionally, South Africa lacks proactive
programmes and mechanisms for profiling,
targeting, attracting and recruiting critical skills.
• A revised critical skills shortage list was
supposed to be implemented in April 2019. The
list was expected to be shorter (with some
positions being removed) but could be more up
to date in terms of tech skill shortages. The
revised list has not yet been published and it is
not clear whether the revised categories are
being used
The World Bank should engage with the Department of Home
Affairs and the Department of Higher Education and Training to
start a dialogue regarding an overhauled migration policy and work
visa process for South Africa. This needs to first address the
revised critical skills shortage list as a priority, making sure that the
list adequately reflects current shortages in the technology and ICT
sector.
Mechanisms for proactively encouraging skilled South Africans to
remain in the country need to be considered to reduce reliance on
foreign talent. This could include creating an attractive environment
for local graduates, creating incentives for local graduates
exploring foreign markets to return home, and drawing expatriates
back to South Africa. While countries such as Vietnam, India and
China are actively seeking to recruit people from their diasporas,
there are no such activities in South Africa.
Government coordination Public sector efforts to create an enabling
environment for tech innovation, and the
employment of tech in digital business models, are
currently siloed. There is no cohesive national
strategy on supporting tech innovation.
• The National System of Innovation (NSI) is out
of date and is not being adequately executed.
• The new Presidential 4IR Commission has been
convened and is being run by the newly
rebranded Department of Communication and
Digital Technology.
• The inaugural 4IRSA Digital Economy Summit
was the start of discussion on a national 4IR
strategic response for South Africa.
The World Bank and IFWG need to keep track of the new initiatives
that are being designed to formulate a national strategy on tech
innovation in South Africa. In particular, the Department of
Communication and Digital Technology has been mandated to
develop a masterplan for South Africa, and it is critical that financial
sector policymakers and regulators have a seat at this table in
order to influence the national planning process. Although many of
the issues pertaining to fintechs as digital businesses may be
covered, incorporating a financial sector perspective into the
strategy is important to ensure that financial inclusion is part of the
strategic objective and to cater to fintech-specific issues.
Improving the broader innovation ecosystem by alleviating critical skills shortages.Recommend
ation
Innovation
Ecosystem 3
46* Please note, the recommendations listed in this document are those of Genesis Analytics, and not that of the regulators, World Bank, or members of the IFWG

Issue Gaps Existing structures and initiatives Recommendations to address gaps
Regulation that
does not
support
innovation
Fintechs find licencing requirements complex, time consuming and expensive.
The broad nature of some financial sector legislation means that fintechs are
subject to the same regulatory requirements as traditional service providers,
and the legislation has not been updated to provide exemptions or specific
requirements for new digital models of financial services. While early guidance
or discussion documents have been provided in a few areas, there are still
specific pieces of regulation that have been identified as stifling innovation:
• NCA limiting P2P lending: All credit providers as defined by the act must be
registered. The act was amended to include any entity that lends, regardless
of the value or quantity of loans provided. By this definition, individual
lenders on P2P platforms may be considered credit providers.
• Various regulations limiting equity crowdfunding: Investment-based
crowdfunding may be construed as falling under the activity of a number of
additional regulations. If the platform’s due diligence and risk-rating services
are interpreted as an intermediary service connecting investors and
entrepreneurs, the platform may be subject to the FAIS Act. Additionally, if
the act of connecting the buyers and issuers of securities together are
considered to meet the definition of an over-the-counter exchange, the
platform would be required under the Financial Markets Act to obtain a
licence as a registered exchange. By restructuring the platform as an
investment vehicle, the platform would fall under CISCA
• Banking Act: the act has a single and broad definition of banking activities
with high hurdles for new entrants.
• Financial sector regulators have already
established the IFWG to collectively
address fintech regulatory issues.
• The IFWG has hosted an inaugural
conference to collect data on regulatory
bottlenecks and discuss solutions.
• The FSCA has mandated specific
requirements for FSPs offering robo-
advice through the determination of fit
and proper requirements under FAIS.
The FSCA is also is in the process of
considering revisions to FAIS to regulate
equity crowdfunding (a discussion paper
has been generated but not published).
• The IFWG has published a consultation
paper on the regulation of crypto assets
and has started collecting voluntary
transactional data from crypto
exchanges.
• The IFWG has announced plans to
establish an innovation hub that will
include a regulatory sandbox – planned
to be operational by early 2020
The IFWG should establish a website that provides information on
regulatory guidance and revisions to regulation in a central
platform with simple and easy to follow instructions and contact
points to assist fintechs with the complexity of regulation in South
Africa. The group expanded its membership to other financial
sector regulators, such as the NCR and SARS, to ensure
adequate coverage of IFWG activities.
The licencing process for the SARB, PASA, FSCA and NCR
should be reviewed and automated (where it is not already) to
address inefficiencies and time lags associated with paper-based
application processes. This could be linked to an IFWG web portal
that centralises the licence application process and provides
information on regulatory requirements.
The NCR, FSCA, and PA (SARB) as the custodians of the NCA,
FAIS/FMA/CISCA, and Banking Act respectively should urgently
review their regulatory frameworks and consider the
implementation of tiered licences, regulatory exemptions, and
regulatory guidance notes to create clarity on how fintech
business models will be regulated within the existing regulatory
landscape.
The SARB could prioritise the launch of its planned innovation
facilitation tools, in particular the innovation hub and regulatory
sandbox, to evidence its commitment to fintech development and
ability to rapidly respond to industry developments.
Regulation 4
Frequent communication between regulators and fintechs will increase activity in the sector as entrepreneurs have
clear directive(s) on when and how to address regulatory concerns. This in turn will spur interaction in the sector and
assist in creating an enabling environment for doing business.
Recommend
ation
47* Please note, the recommendations listed in this document are those of Genesis Analytics, and not that of the regulators, World Bank, or members of the IFWG

Issue
Gaps Existing levers and recommendations Target
Supporting business
services
Fintech start ups find it expensive to procure
support services required for the licencing
processes such as legal and compliance
advisory.
Private sector incubator hubs include this in the description
of their model but fintech entrepreneurs do not feel like this
is realised.
As part of an innovation hub operated by regulators, include access
to regulatory and legal advisory services.
Peer-to-peer
interaction
Entrepreneurs feel that there is limited peer-to-
peer interaction with similar businesses. They
believe that more collaboration with peers would
help transfer knowledge, solve market issues
and help navigate complex issues such as
licencing.
• There are pockets of informal networking that exist
among entrepreneurs who know one another socially.
• Private incubators facilitate networking opportunities.
Fund the formation of a fintech industry association in South Africa.
In the set-up stage, this association will need guidance and
policymakers can leverage their networks to create links with similar
international bodies. There should be a plan to hand this over to a
sustainable member-fee revenue model within three years.
Interaction and communication with fintech businesses is important for regulators to be able to assess evolving
technology and business models while peer networks will help fintechs collaborate and navigate complex processes
such as licencing.
Recommend
ation
48
Communication5
* Please note, the recommendations listed in this document are those of Genesis Analytics, and not that of the regulators, World Bank, or members of the IFWG
Table of Contents
Overview
Segmentation
Market diagnostics
Segment Prioritisation
Insights from industry
Recommendations
Appendices:
Market scanning methodology
Segments and sub-segments definitions
Market sizing methodology
Market sizing assumptions and calculations by segment
Case Studies
Fintech directory
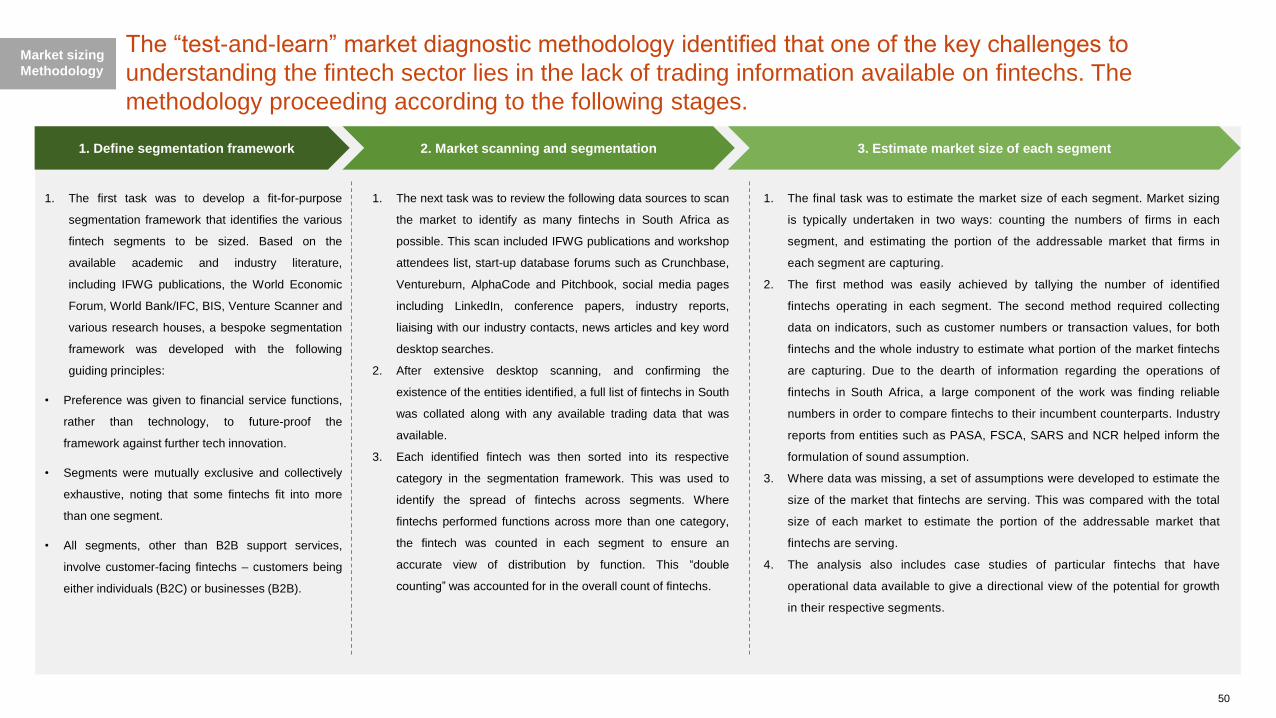
The “test-and-learn” market diagnostic methodology identified that one of the key challenges to
understanding the fintech sector lies in the lack of trading information available on fintechs. The
methodology proceeding according to the following stages.
Market sizing
Methodology
1. Define segmentation framework 2. Market scanning and segmentation 3. Estimate market size of each segment
1. The first task was to develop a fit-for-purpose
segmentation framework that identifies the various
fintech segments to be sized. Based on the
available academic and industry literature,
including IFWG publications, the World Economic
Forum, World Bank/IFC, BIS, Venture Scanner and
various research houses, a bespoke segmentation
framework was developed with the following
guiding principles:
• Preference was given to financial service functions,
rather than technology, to future-proof the
framework against further tech innovation.
• Segments were mutually exclusive and collectively
exhaustive, noting that some fintechs fit into more
than one segment.
• All segments, other than B2B support services,
involve customer-facing fintechs – customers being
either individuals (B2C) or businesses (B2B).
1. The next task was to review the following data sources to scan
the market to identify as many fintechs in South Africa as
possible. This scan included IFWG publications and workshop
attendees list, start-up database forums such as Crunchbase,
Ventureburn, AlphaCode and Pitchbook, social media pages
including LinkedIn, conference papers, industry reports,
liaising with our industry contacts, news articles and key word
desktop searches.
2. After extensive desktop scanning, and confirming the
existence of the entities identified, a full list of fintechs in South
was collated along with any available trading data that was
available.
3. Each identified fintech was then sorted into its respective
category in the segmentation framework. This was used to
identify the spread of fintechs across segments. Where
fintechs performed functions across more than one category,
the fintech was counted in each segment to ensure an
accurate view of distribution by function. This “double
counting” was accounted for in the overall count of fintechs.
1. The final task was to estimate the market size of each segment. Market sizing
is typically undertaken in two ways: counting the numbers of firms in each
segment, and estimating the portion of the addressable market that firms in
each segment are capturing.
2. The first method was easily achieved by tallying the number of identified
fintechs operating in each segment. The second method required collecting
data on indicators, such as customer numbers or transaction values, for both
fintechs and the whole industry to estimate what portion of the market fintechs
are capturing. Due to the dearth of information regarding the operations of
fintechs in South Africa, a large component of the work was finding reliable
numbers in order to compare fintechs to their incumbent counterparts. Industry
reports from entities such as PASA, FSCA, SARS and NCR helped inform the
formulation of sound assumption.
3. Where data was missing, a set of assumptions were developed to estimate the
size of the market that fintechs are serving. This was compared with the total
size of each market to estimate the portion of the addressable market that
fintechs are serving.
4. The analysis also includes case studies of particular fintechs that have
operational data available to give a directional view of the potential for growth
in their respective segments.
50
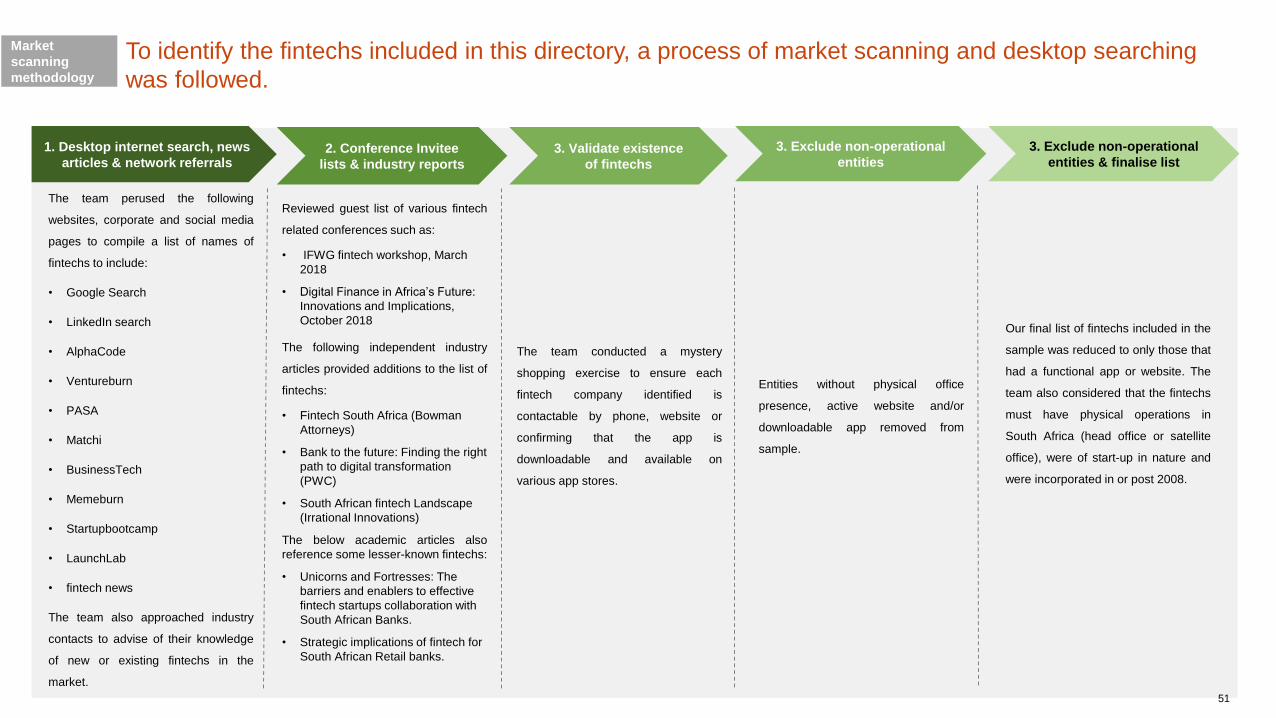
Market
scanning
methodology
To identify the fintechs included in this directory, a process of market scanning and desktop searching
was followed.
1. Desktop internet search, news
articles & network referrals2. Conference Invitee
lists & industry reports
3. Validate existence
of fintechs
The team perused the following
websites, corporate and social media
pages to compile a list of names of
fintechs to include:
• Google Search
• LinkedIn search
• AlphaCode
• Ventureburn
• PASA
• Matchi
• BusinessTech
• Memeburn
• Startupbootcamp
• LaunchLab
• fintech news
The team also approached industry
contacts to advise of their knowledge
of new or existing fintechs in the
market.
Reviewed guest list of various fintech
related conferences such as:
• IFWG fintech workshop, March
2018
• Digital Finance in Africa’s Future:
Innovations and Implications,
October 2018
The following independent industry
articles provided additions to the list of
fintechs:
• Fintech South Africa (Bowman
Attorneys)
• Bank to the future: Finding the right
path to digital transformation
(PWC)
• South African fintech Landscape
(Irrational Innovations)
The below academic articles also
reference some lesser-known fintechs:
• Unicorns and Fortresses: The
barriers and enablers to effective
fintech startups collaboration with
South African Banks.
• Strategic implications of fintech for
South African Retail banks.
3. Exclude non-operational
entities
The team conducted a mystery
shopping exercise to ensure each
fintech company identified is
contactable by phone, website or
confirming that the app is
downloadable and available on
various app stores.
Entities without physical office
presence, active website and/or
downloadable app removed from
sample.
3. Exclude non-operational
entities & finalise list
Our final list of fintechs included in the
sample was reduced to only those that
had a functional app or website. The
team also considered that the fintechs
must have physical operations in
South Africa (head office or satellite
office), were of start-up in nature and
were incorporated in or post 2008.
51

Market sizing assumptions and calculations by segment
Methodology Data required Data collected and/or be
estimated
Data for estimation Sources Assumptions
Payment segment
• The proportion of
transaction values and
volumes made through
fintechs: Transaction values
through fintechs as a
percentage of total transaction
values as well as transaction
volumes through fintechs as a
percentage of total transaction
volumes.
• Total transaction volumes
• Total transaction values
• Fintech transaction volumes
• Fintech transactional values
Data collected for 2017:
Total transaction volumes
Total transaction values
Estimated:
• Fintech transaction volumes
• Fintech transactional values
Wi Group data:
• Worth R1.8 billion transactions
in 2017.
Yoco:
• R4 billion worth transactions in
2017 and 1.8 million
transactions.
Easy Pay:
• R2.4 billion worth transactions
in 2017 and 1 million
transactions.
Channels for remittances in
South Africa – mainly through
taxis and approximately 5%
through banks. Total remittances
were R16.6 billion in 2016.
• Bank of International
Settlement: Total transaction
volumes and values.
• Fintech web sites and news
articles.
• Updating the South Africa –
SADC remittance Channel
estimates: Channels for
remittances in South Africa.
• The biggest fintech in the sub-
segment indicates the highest
transactional values and
volumes fintechs in that sub-
segment can have in a year.
• Remittance numbers were
estimated based on the value
of total remittances and some
assumptions on the
percentage that would be
represented by fintechs
(approximately 0.75%).
Estimation
Estimation was based on the maximum:
Each sub-segment has a big fintech (WiGroup, Easy Pay Yoco) and were rewarded the same numbers of these fintechs to indicated the maximum value or volumes they can perform.
• Bill Payments were rewarded the numbers for Easy Pay of R2.4 billion in transaction value and 1 million in transactions volumes.
• Closed loop mobile wallets were assumed to have similar features as MPOS payments and hence rewarded the values for Yoco which is R4billion worth of transactions with 1.8 million transactions made.
• MPOS fintechs were given the same values as Yoco
• 3rd Party payment providers were given WiGroup numbers with transactions worth R1.8 billion. It was estimated that transaction volumes would probably be close to Easy Pay at approximately 1 million.
• For remittances, 5% of R16.6 billion (R830 million) was through banks. Fintechs are assumed to account for significantly less at 0.75% which is approximately R126 million. Given the percentage of SADC migrants that live
in South Africa the volume of transactions is assumed to be 7% of Easy Pay’s volumes. These numbers were rewarded to all fintechs in this sub-segment.
• Payroll payments were assumed to be the same value as WiGroup with volumes only 5% of Easy Pay volumes.
The summation of these numbers was the total transactional value and volumes fintechs performed.
Market sizing
assumptions
52
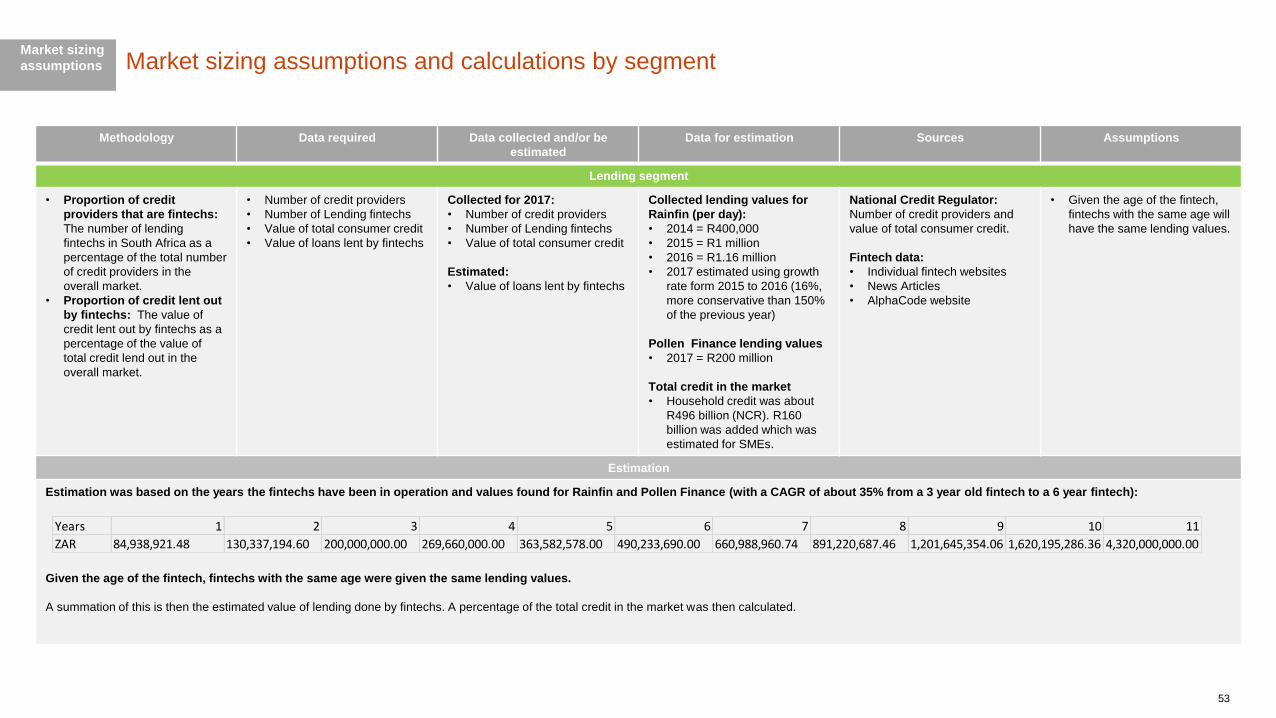
Market sizing assumptions and calculations by segment
Methodology Data required Data collected and/or be
estimated
Data for estimation Sources Assumptions
Lending segment
• Proportion of credit
providers that are fintechs:
The number of lending
fintechs in South Africa as a
percentage of the total number
of credit providers in the
overall market.
• Proportion of credit lent out
by fintechs: The value of
credit lent out by fintechs as a
percentage of the value of
total credit lend out in the
overall market.
• Number of credit providers
• Number of Lending fintechs
• Value of total consumer credit
• Value of loans lent by fintechs
Collected for 2017:
• Number of credit providers
• Number of Lending fintechs
• Value of total consumer credit
Estimated:
• Value of loans lent by fintechs
Collected lending values for
Rainfin (per day):
• 2014 = R400,000
• 2015 = R1 million
• 2016 = R1.16 million
• 2017 estimated using growth
rate form 2015 to 2016 (16%,
more conservative than 150%
of the previous year)
Pollen Finance lending values
• 2017 = R200 million
Total credit in the market
• Household credit was about
R496 billion (NCR). R160
billion was added which was
estimated for SMEs.
National Credit Regulator:
Number of credit providers and
value of total consumer credit.
Fintech data:
• Individual fintech websites
• News Articles
• AlphaCode website
• Given the age of the fintech,
fintechs with the same age will
have the same lending values.
Estimation
Estimation was based on the years the fintechs have been in operation and values found for Rainfin and Pollen Finance (with a CAGR of about 35% from a 3 year old fintech to a 6 year fintech):
Given the age of the fintech, fintechs with the same age were given the same lending values.
A summation of this is then the estimated value of lending done by fintechs. A percentage of the total credit in the market was then calculated.
Market sizing
assumptions
53
Years 1 2 3 4 5 6 7 8 9 10 11
ZAR 84,938,921.48 130,337,194.60 200,000,000.00 269,660,000.00 363,582,578.00 490,233,690.00 660,988,960.74 891,220,687.46 1,201,645,354.06 1,620,195,286.36 4,320,000,000.00

Market sizing assumptions and calculations by segment
Methodology Data required Data collected and/or be
estimated
Data for estimation Sources Assumptions
Savings & Deposits segment
• Proportion of banked
population captured by
fintechs: The number of
consumers fintechs have as a
percentage of the banked
population in South Africa.
• The value of deposits held by
fintechs as a proportion of total
deposits in the market.
• Banked population
• Value of bank deposits
• Savings & Deposit fintech
consumers
• Value of deposits in fintechs
Collected 2017:
• Banked population
• Value of bank deposits
Estimated:
• Savings & Deposit fintech
consumers
• Value of deposits in fintechs
Data for Stockfella:
• 800 Stokvel groups and 9000
users
Data for Stokvel industry:
• 810,000 Stokvel groups with
11,500,000 individuals.
• Amount in Stokvels R49
billion.
• World Bank: banked
population
• South African Reserve
Bank: value of bank deposits
• National Stokvel
Association of South Africa
• Stockfella website
• News feeds: for Tyme bank,
Bank Zero and Bettr consumer
numbers are 80,000, 125 000
and 10,000 respectively.
• Fintech will acquire a set
number of consumers per year
and fintechs with of the same
age have the same number of
consumers.
• Deposits in fintechs are the
same as deposits that would
be made in a digital Stokvel.
Estimation
Estimation was based on the years the fintechs have been in operation and the number of users in Stokfella’s platform and average deposit in Stokvels in South Africa:
• Average consumer numbers per year is calculated using Stokfella numbers (9,000/2 = 4,500). Multiplying this average number of consumers by the age of the fintech (except Tyme Bank, Bank Zero and Bettr) in order to
get the number of consumers per fintech.
• Average transactions per client was estimated as the total amount in Stokvels (R49 billion) divided by the number of individuals in Stokvels (11,500,000) = R4,260.87.
• Output for each firm was considered and adjusted when necessary based on subjective judgement (considering characteristics of the fintech as expressed in some news articles).
Summation of consumer numbers will give the total number of consumers fintech, and deposit would give the total value of deposits held by fintechs.
Market sizing
assumptions
54

Market sizing assumptions and calculations by segment
Methodology Data required Data collected and/or be
estimated
Data for estimation Sources Assumptions and Estimation method
Insurtech
• Value of gross written
premiums (GWP) written by
insurtechs versus traditional
insurance providers in 2018
using industry leader,
Outsurance, as a
benchmark for insurtech
performance.
• GWP of insurtechs for a
financial year.
• GWP of insurance policies
written by South African
insurers.
Collected
• GWP of SA’s short and long
term insurers for the FY
2017
• GWP of market leader,
Outsurance
• Number of policies in-force
Estimated
• GWP of Insurtechs
• Number of policies in-force
Pineapple – 7,200
Simply - 11,753
Outsurance – 848,734
Total GWP Outsurance SA
operations (30 June 2018) =
ZAR 8,264,728,000
• Relative size of Pineapple:
Outsurance by policies in-
force = 0.85%
• Relative size of
Simply:Outsurance by
policies in-force = 1.38%
• Average size of an
insurtech:Outsurance =
1.12%.
• Estimated no. of policies in-
force of an insurtech =
9,477.
• No of insurtechs in
calculation sample= 22.
• Total GWP of South African
insurance industry 2018=
ZAR 183,533,163,000.
• FSCA Annual report 2018:
total GWP of South African
insurance industry for 2018.
• Outsurance Annual report
2018:
• Pineapple news paper
articles: no. of policies in-
force.
• Simply website: no. of
policies in-force.
• Number of policies in-force
is a proxy of the relative size
of the insurtechs and
Outsurance.
• Multiply relative size of an
individual insurtech (1.12%)
by no. of insurtech (17) and
by total GWP of total GWP
of insurance providers for
South Africa in 2018 to get
estimation of value of
polices (GWP) issued by
South African insurtechs.
• Total estimated GWP of
insurtechs = 1.12% *22*
ZAR 107,301,288,000 =
ZAR 2,036,428,4.98
• % addressable market
served by insurtechs cannot
exceed = 1.1%.
Market sizing
assumptions
55
*Calculation breakdown on following page

Market sizing calculation steps
Approach Calculation steps Current example Data sources
Insurtech
Benchmark fintech performance with an existing market
leading incumbent insurtech to arrive at a relative size of
fintech:incumbent in order to estimate the percentage of
the market addressed by fintechs versus traditional
insurers. The unit of measure for market size is gross
written premiums.
1. Select “benchmark” insurtech (Outsurance). Outsurance: 848,734 Outsurance Annual Report 30 June 2018
2. Find no. of policies in force for benchmark entity,
and for as many fintechs as possible.
1. Pineapple: 7,200
2. Simply: 11,753
1. Online article
2. Company website
3. Calculate average size of a fintech by no. of
policies in force.
3. 9 477 = (7 200+11 753)/2
4. Calculate ratio of no. of policies in force for the
average fintech vs. an established insurtech
4. 1.12% = 9,477/ 848,734
5. Ascertain proxy for total market size. 5. R183,533,163,000 (estimate) 3. GWP from KPMG SA Insurance Survey 2018 &
FSCA Annual report 2018
6. Calculate average gross written premiums of
fintechs (no. of fintechs * relative size of fintech *
GWP of benchmark insurer).
6. 2,036,428.98 = 22 * 1.12% * 8,264,728.00
7. Estimate percentage of market served by fintechs
versus traditional insurers by dividing estimated
fintech GWP by GWP of traditional insurers +
fintechs.
7. 1.1% = 2,036,428.98/183,533,163,000
Market sizing
calculations
56

Market sizing calculation stepsMarket sizing
calculations
57
Approach Calculation steps Current example Data sources
Investments
Trading activity is the base unit of measure of total market
size (per annum)
1. Divide no. of trades on alternative exchanges by no. of
trades on JSE.
2. Divide no. of crypto trades in South Africa by no. of
trades on JSE.
3. Annual trades on JSE - % trades from Alternative
exchange and cryptocurrencies is % market served by
JSE.
1. 0.002% = (5.64 / 272,1987) *(250/250)
2. 1.39% = (3,787 / 272,1987) *(250/250)
3. 98.4% = 1 – 0.002% -1.39%
1. Websites of alternative exchanges
2. Aggregation of SARB cryptocurrecy trade data
3. FSCA Annual report
Financial planning and advisory
Top down assumptions to derive market size and
percentage of total market needs addressed by fintechs.
This is an assumptions-based approach, results may differ
where assumptions are altered.
1. Total South African population and reduce to total
market by doing the following steps:
2. Estimate no. of South Africans using advisory services
by:
a. Total no. of taxpayers (those with an
income).
3. Tax payers with an income above R350k (assume
earners only take up advisory products above this
threshold).
4. Based on results of a survey, ascertain investment
preferences of this income group between traditional
and robo-advisory.
1. 57.7 million total population
2. a. 4,898,565 total tax payers
i. 1,332,798 tax payers earning above
R350,000 p.a.
3. 1,212,846 = 91% * 1,332,798 no. of individuals
paying for financial advisory services.
4. 60,642 = 5% * 1,212,846 no. of individuals willing to
accept financial advice on a digital platform.
5. 1,273,488 = 1,212,846+ 60,642 =Total market size.
6. 4.76% = 60,642/1,273,488 = portion of market
served by robo-advisors and digital financial advice
platforms.
1. StatsSA
2. SARS Annual report (2017/18)
3. Deloitte survey, Automation of financial advice, June
2018.

Methodology Data required Data collected and/or be
estimated
Data for estimation Sources Assumptions
Capital Raising
• The value of funds raised by
crowd investing as a percentage
of funds raised by Venture Capital
Firms and Crowd investing.
• Value of funds raised by Venture
Capital Firms
• Value of funds raised by crowd
investing
Collected for 2017:
• Value of funds raised by Venture
Capital Firms
• Value of funds raised by crowd
investing
Collected values of funds raised by
UpriseAfrica:
• 2017:
Venture Capital values
• 2017 = R200 million
SAVCA 2018 Venture Capital Industry
Survey
UpriseAfrica
• News Article
Not applicable
Market sizing assumptions and calculations by segmentMarket sizing
assumptions
58
Table of Contents
Overview
Segmentation
Market diagnostics
Segment Prioritisation
Insights from industry
Recommendations
Appendices:
Market scanning methodology
Segments and sub-segments definitions
Market sizing methodology
Market sizing assumptions and calculations by segment
Case Studies
Fintech directory
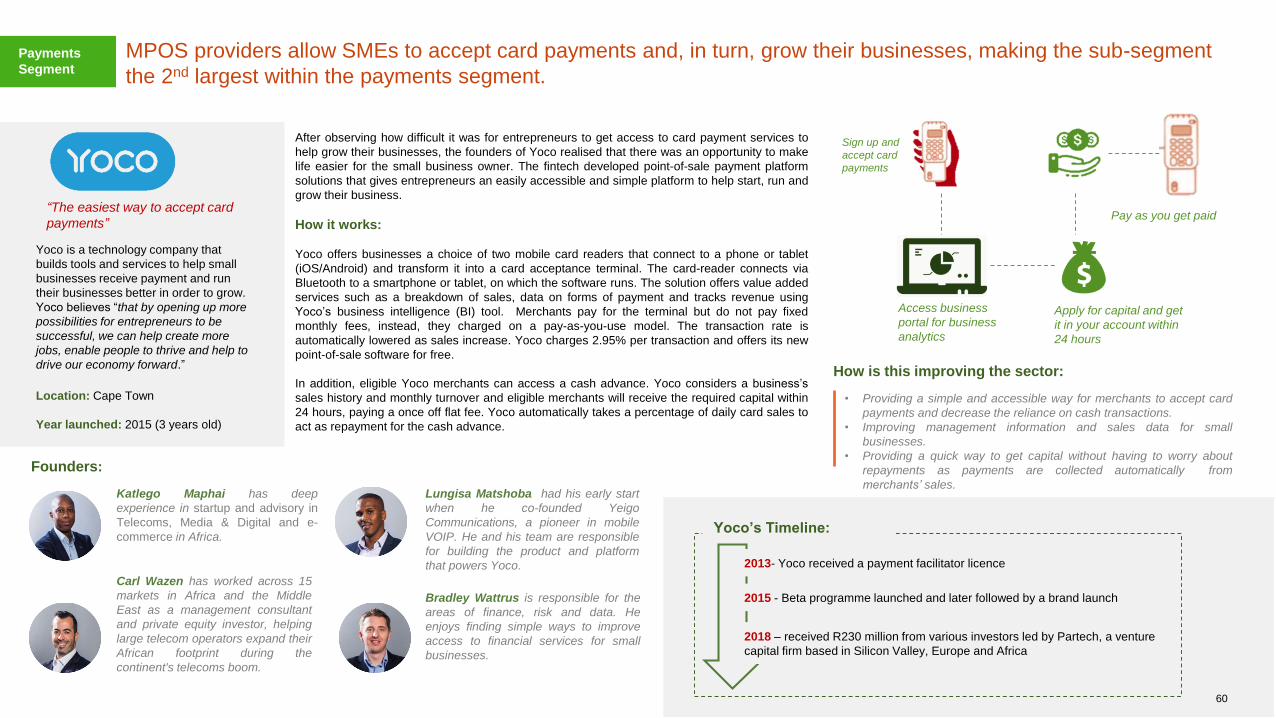
MPOS providers allow SMEs to accept card payments and, in turn, grow their businesses, making the sub-segment
the 2nd largest within the payments segment.
“The easiest way to accept card
payments”
Yoco is a technology company that
builds tools and services to help small
businesses receive payment and run
their businesses better in order to grow.
Yoco believes “that by opening up more
possibilities for entrepreneurs to be
successful, we can help create more
jobs, enable people to thrive and help to
drive our economy forward.”
Location: Cape Town
Year launched: 2015 (3 years old)
Founders:
Katlego Maphai has deep
experience in startup and advisory in
Telecoms, Media & Digital and e-
commerce in Africa.
How is this improving the sector:
• Providing a simple and accessible way for merchants to accept card
payments and decrease the reliance on cash transactions.
• Improving management information and sales data for small
businesses.
• Providing a quick way to get capital without having to worry about
repayments as payments are collected automatically from
merchants’ sales.
After observing how difficult it was for entrepreneurs to get access to card payment services to
help grow their businesses, the founders of Yoco realised that there was an opportunity to make
life easier for the small business owner. The fintech developed point-of-sale payment platform
solutions that gives entrepreneurs an easily accessible and simple platform to help start, run and
grow their business.
How it works:
Yoco offers businesses a choice of two mobile card readers that connect to a phone or tablet
(iOS/Android) and transform it into a card acceptance terminal. The card-reader connects via
Bluetooth to a smartphone or tablet, on which the software runs. The solution offers value added
services such as a breakdown of sales, data on forms of payment and tracks revenue using
Yoco’s business intelligence (BI) tool. Merchants pay for the terminal but do not pay fixed
monthly fees, instead, they charged on a pay-as-you-use model. The transaction rate is
automatically lowered as sales increase. Yoco charges 2.95% per transaction and offers its new
point-of-sale software for free.
In addition, eligible Yoco merchants can access a cash advance. Yoco considers a business’s
sales history and monthly turnover and eligible merchants will receive the required capital within
24 hours, paying a once off flat fee. Yoco automatically takes a percentage of daily card sales to
act as repayment for the cash advance.
Carl Wazen has worked across 15
markets in Africa and the Middle
East as a management consultant
and private equity investor, helping
large telecom operators expand their
African footprint during the
continent's telecoms boom.
Lungisa Matshoba had his early start
when he co-founded Yeigo
Communications, a pioneer in mobile
VOIP. He and his team are responsible
for building the product and platform
that powers Yoco.
Bradley Wattrus is responsible for the
areas of finance, risk and data. He
enjoys finding simple ways to improve
access to financial services for small
businesses.
2013- Yoco received a payment facilitator licence
Yoco’s Timeline:
2015 - Beta programme launched and later followed by a brand launch
2018 – received R230 million from various investors led by Partech, a venture
capital firm based in Silicon Valley, Europe and Africa
Sign up and
accept card
payments
Access business
portal for business
analytics
Apply for capital and get
it in your account within
24 hours
Pay as you get paid
Payments
Segment
60

Yoco is the largest MPOS payment provider and a formidable competitor for traditional POS and other MPOS
providers in South Africa.
Yoco is very mature in the
MPOS space, but relatively
small in the larger POS
payment space.
2014
2013
2015
2012
2008
Value:
R4million
Volume:
11.8
million
Value: R1
billion
Volume:
2664 million
There are 11 mPOS providers in the South African market. Yoco was launched in 2015 and is relatively
young, compared to the other mPOS providers. However, it has experienced considerable growth in a short
period.
SnapScan, a QR based acceptance solution that is run on card rails, was launched in 2013. By 2017, it had
26,000 merchants on its platform after operating for four years (an average of 7,250 acquired per year). The
latest figures on their website show that the platform has signed on 50,000 merchants.
In 2017, Yoco had 10,000 merchants on its platform (an average of 5,000 merchants acquired per year). To
date, it has acquired 40,000 merchants. A merchant funding proposition, easy to use business management
tools and targeted marketing campaigns are all reasons for the fintech’s success.
Competing fintechs by inception dates
SnapScan had 50,000
merchants in 5 years versus
Yoco which achieved 40,000
merchants in 3 years
16%
20%
20%
33%
2%
4%5%
Standard Bank
Nedbank
Emerge
ABSA
EFT POS
Yoco
Others
Number of mPOS devices*
(2017)
*From available sources and estimations
Yoco vs other MPOS providers and POS payments
Total POS payments
Yoco payments
Yoco has distributed more MPOS devices than the large established South African retail banks. They provide
an alternative to the traditional POS device and serve small merchants that were not served by the banks’
acquiring businesses. Growing card acceptance at a merchant level grows digital payments more broadly and
decreases the use of cash in an economy.
Yoco has grown the acceptance market by servicing micro and small merchants that may otherwise not qualify
for a POS device from a bank. However, QR solutions like SnapScan and Zapper are taken up by merchants
who usually already have a POS device but want to offer their customers a faster and more digital payment
process. Zapper has focused on developing a solution specifically for restaurants or food outlets and provides
merchants with value added solutions like customer data, business reporting and integration of POS data into
business management or accounting software.
Although payment fintechs in South Africa are gaining traction, there has been little significant innovation to
the way the payment is made. Payment fintechs are still facilitating payments on traditional payment rails such
as credit card, unlike other African markets where mobile wallets have created a new way to transfer money
between individuals and businesses.
Payments
Segment
61
POS transactions vs Yoco transactions
(2017)
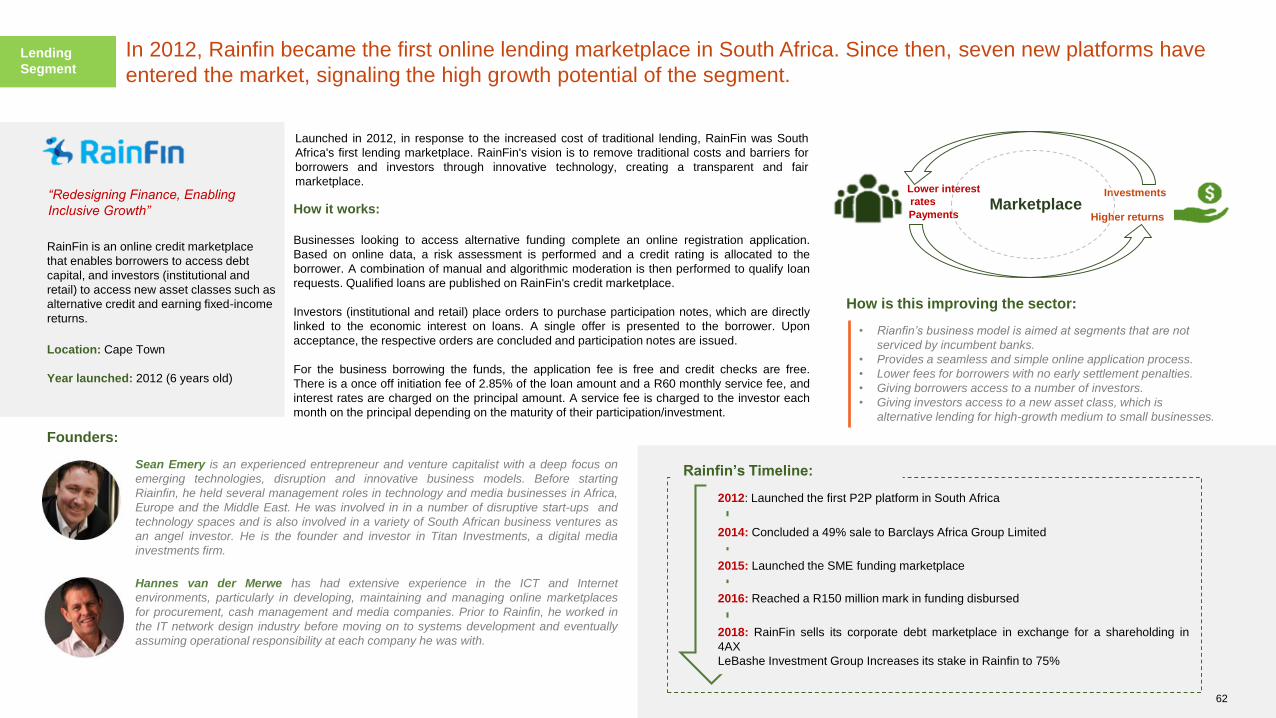
In 2012, Rainfin became the first online lending marketplace in South Africa. Since then, seven new platforms have
entered the market, signaling the high growth potential of the segment.
“Redesigning Finance, Enabling
Inclusive Growth”
RainFin is an online credit marketplace
that enables borrowers to access debt
capital, and investors (institutional and
retail) to access new asset classes such as
alternative credit and earning fixed-income
returns.
Location: Cape Town
Year launched: 2012 (6 years old)
Founders:
Sean Emery is an experienced entrepreneur and venture capitalist with a deep focus on
emerging technologies, disruption and innovative business models. Before starting
Riainfin, he held several management roles in technology and media businesses in Africa,
Europe and the Middle East. He was involved in in a number of disruptive start-ups and
technology spaces and is also involved in a variety of South African business ventures as
an angel investor. He is the founder and investor in Titan Investments, a digital media
investments firm.
Hannes van der Merwe has had extensive experience in the ICT and Internet
environments, particularly in developing, maintaining and managing online marketplaces
for procurement, cash management and media companies. Prior to Rainfin, he worked in
the IT network design industry before moving on to systems development and eventually
assuming operational responsibility at each company he was with.
How it works:
Businesses looking to access alternative funding complete an online registration application.
Based on online data, a risk assessment is performed and a credit rating is allocated to the
borrower. A combination of manual and algorithmic moderation is then performed to qualify loan
requests. Qualified loans are published on RainFin's credit marketplace.
Investors (institutional and retail) place orders to purchase participation notes, which are directly
linked to the economic interest on loans. A single offer is presented to the borrower. Upon
acceptance, the respective orders are concluded and participation notes are issued.
For the business borrowing the funds, the application fee is free and credit checks are free.
There is a once off initiation fee of 2.85% of the loan amount and a R60 monthly service fee, and
interest rates are charged on the principal amount. A service fee is charged to the investor each
month on the principal depending on the maturity of their participation/investment.
Payments Higher returns
Lower interest
rates Investments
Marketplace
Launched in 2012, in response to the increased cost of traditional lending, RainFin was South
Africa's first lending marketplace. RainFin's vision is to remove traditional costs and barriers for
borrowers and investors through innovative technology, creating a transparent and fair
marketplace.
2012: Launched the first P2P platform in South Africa
2014: Concluded a 49% sale to Barclays Africa Group Limited
2015: Launched the SME funding marketplace
2016: Reached a R150 million mark in funding disbursed
Rainfin’s Timeline:
2018: RainFin sells its corporate debt marketplace in exchange for a shareholding in
4AX
LeBashe Investment Group Increases its stake in Rainfin to 75%
Lending
Segment
62
How is this improving the sector:
• Rianfin’s business model is aimed at segments that are not
serviced by incumbent banks.
• Provides a seamless and simple online application process.
• Lower fees for borrowers with no early settlement penalties.
• Giving borrowers access to a number of investors.
• Giving investors access to a new asset class, which is
alternative lending for high-growth medium to small businesses.

Although Rainfin is a leading lender in comparison to its fintech counterparts, it remains very small compared to
traditional lenders such as Capitec.
The Lending marketplace sub-segment remains very small with only seven lending marketplaces in South
Africa. Most competitors were launched after Rainfin with the exception of Prodigy Finance. Prodigy
Finance, though founded by two South Africans, was launched and registered in London and offers study
loans to international students looking for funding for their MBA studies.
Excluding Prodigy Finance, Rainfin remains the most popular and successful lending market in South Africa.
Peerfin is another lender who provides reliable asset-backed loans with favorable returns. Peerfin created an
online platform where asset-backed peer-to-peer lending, specifically for firearms, can take place. They have
financed R2.5 million worth of firearms since 1 December 2016. This is about 0.2% of what Rainfin has lent
out in the same period.146 365 423 490
year 5year 3year 2 year 4 year 6
1.477
7
1.9042.259
2.863
5.162
+36,7%
Capitec
Rainfin
Lending values for Capitec and Rainfin, years from inception ( R million)
Rainfin has managed to achieve a
lending value CAGR of 194.6% in 6
years, with Capitec only experiencing a
36.7% CAGR in its first 6 years, although
off a much larger base.
Loans advanced by
Rainfin in 2018 are
only 1.7% ot the total
value of loans
advanced by Capitec
in the same year
2015
2013
2017
2008
Competing fintechs by inception dates Rainfin is currently experiencing higher growth rates than those experienced by Capitec in
its early years.
Fintechs are only capturing a small share of the addressable lending market, however, the number of new
platforms entering the market shows the potential in this space. The business models are focused on servicing
individuals and businesses who are not being targeted by traditional banks. Access to credit is an important
element of financial inclusion as it assists households and businesses smooth over financial shocks. At the
same time this is a highly regulated sector as consumers should be protected from irresponsible lending
practices. Most fintechs in the lending segment are still in the early stage of their growth phase, experiencing
high growth, but still off a relatively small base compared to their traditional competitors.
Rainfin vs a traditional bank
PeerFin loans
advanced: R2.5
million since
2016
Rainfin loans
advanced: R125
million since 2016
Lending
Segment
63
+195%
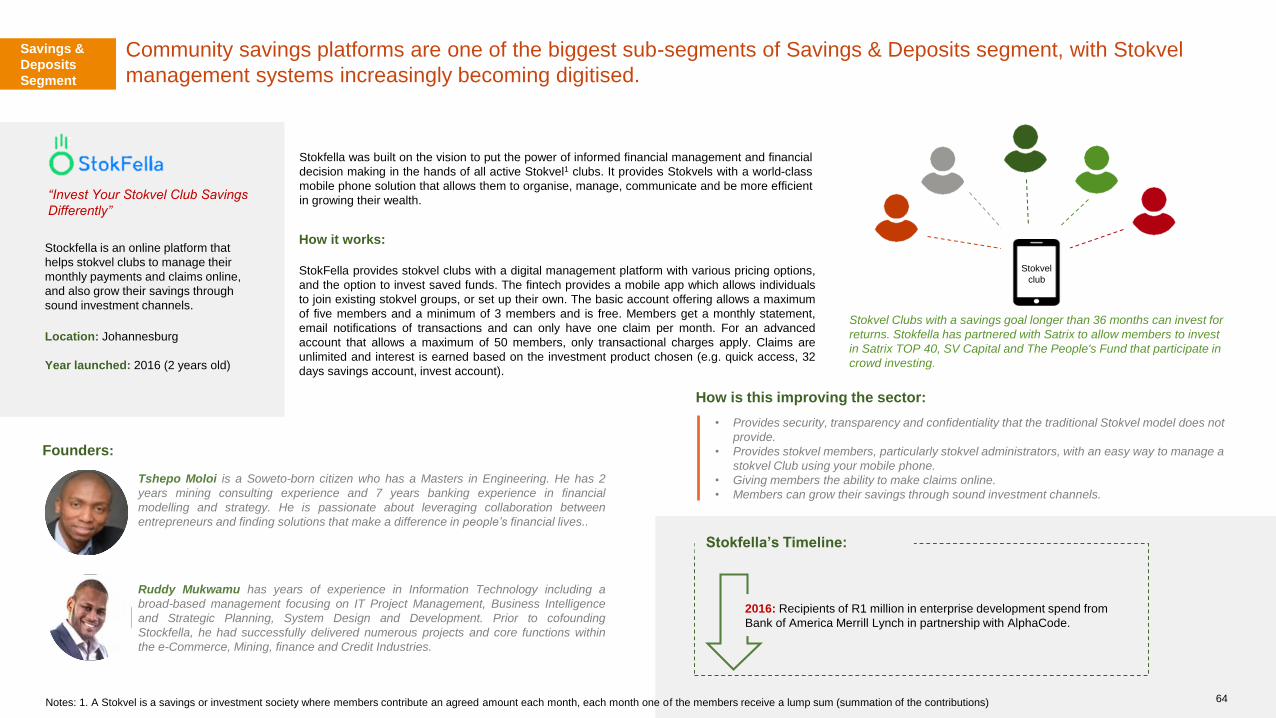
Community savings platforms are one of the biggest sub-segments of Savings & Deposits segment, with Stokvel
management systems increasingly becoming digitised.
“Invest Your Stokvel Club Savings
Differently”
Stockfella is an online platform that
helps stokvel clubs to manage their
monthly payments and claims online,
and also grow their savings through
sound investment channels.
Location: Johannesburg
Year launched: 2016 (2 years old)
Founders:
Tshepo Moloi is a Soweto-born citizen who has a Masters in Engineering. He has 2
years mining consulting experience and 7 years banking experience in financial
modelling and strategy. He is passionate about leveraging collaboration between
entrepreneurs and finding solutions that make a difference in people’s financial lives..
Ruddy Mukwamu has years of experience in Information Technology including a
broad-based management focusing on IT Project Management, Business Intelligence
and Strategic Planning, System Design and Development. Prior to cofounding
Stockfella, he had successfully delivered numerous projects and core functions within
the e-Commerce, Mining, finance and Credit Industries.
How it works:
StokFella provides stokvel clubs with a digital management platform with various pricing options,
and the option to invest saved funds. The fintech provides a mobile app which allows individuals
to join existing stokvel groups, or set up their own. The basic account offering allows a maximum
of five members and a minimum of 3 members and is free. Members get a monthly statement,
email notifications of transactions and can only have one claim per month. For an advanced
account that allows a maximum of 50 members, only transactional charges apply. Claims are
unlimited and interest is earned based on the investment product chosen (e.g. quick access, 32
days savings account, invest account).
How is this improving the sector:
• Provides security, transparency and confidentiality that the traditional Stokvel model does not
provide.
• Provides stokvel members, particularly stokvel administrators, with an easy way to manage a
stokvel Club using your mobile phone.
• Giving members the ability to make claims online.
• Members can grow their savings through sound investment channels.
Stokfella was built on the vision to put the power of informed financial management and financial
decision making in the hands of all active Stokvel1 clubs. It provides Stokvels with a world-class
mobile phone solution that allows them to organise, manage, communicate and be more efficient
in growing their wealth.
2016: Recipients of R1 million in enterprise development spend from
Bank of America Merrill Lynch in partnership with AlphaCode.
Stokfella’s Timeline:
Stokvel
club
Stokvel Clubs with a savings goal longer than 36 months can invest for
returns. Stokfella has partnered with Satrix to allow members to invest
in Satrix TOP 40, SV Capital and The People's Fund that participate in
crowd investing.
Savings &
Deposits
Segment
Notes: 1. A Stokvel is a savings or investment society where members contribute an agreed amount each month, each month one of the members receive a lump sum (summation of the contributions) 64
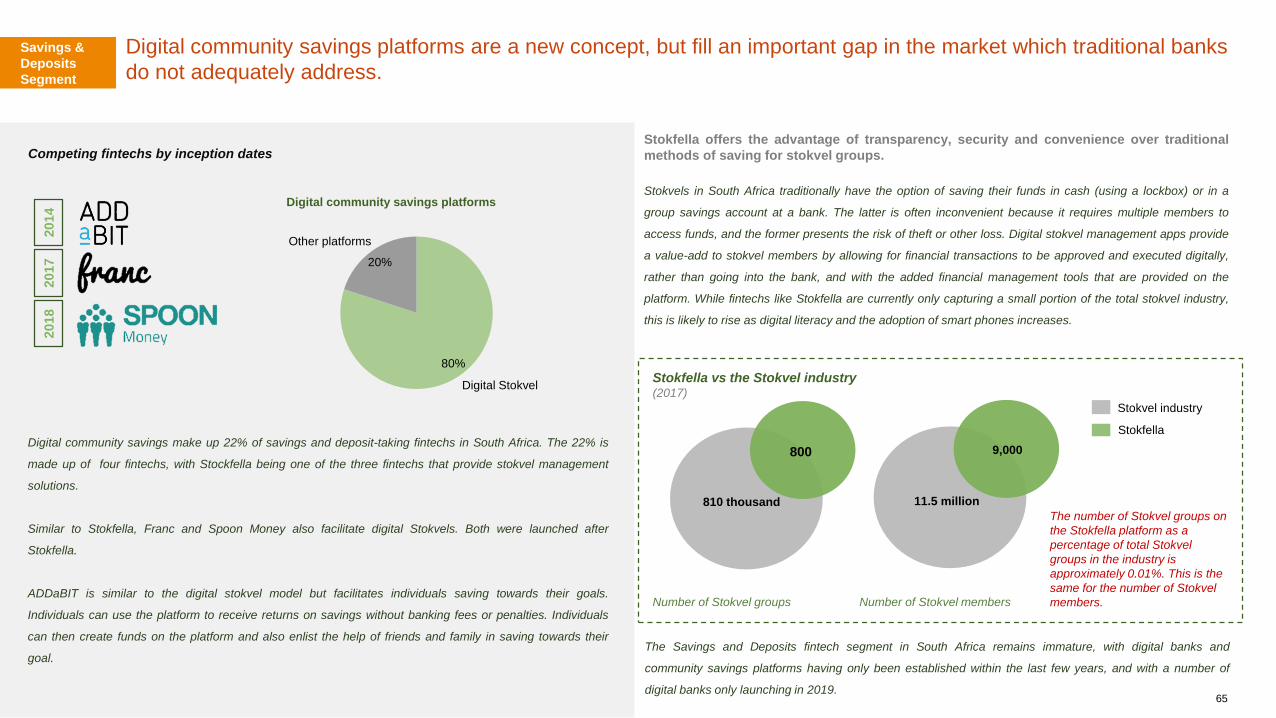
Digital community savings platforms are a new concept, but fill an important gap in the market which traditional banks
do not adequately address.
Competing fintechs by inception dates
2017
2014
2018
Digital community savings make up 22% of savings and deposit-taking fintechs in South Africa. The 22% is
made up of four fintechs, with Stockfella being one of the three fintechs that provide stokvel management
solutions.
Similar to Stokfella, Franc and Spoon Money also facilitate digital Stokvels. Both were launched after
Stokfella.
ADDaBIT is similar to the digital stokvel model but facilitates individuals saving towards their goals.
Individuals can use the platform to receive returns on savings without banking fees or penalties. Individuals
can then create funds on the platform and also enlist the help of friends and family in saving towards their
goal.
Stokfella vs the Stokvel industry(2017)
Stokvel industry
Stokfella
Number of Stokvel groups Number of Stokvel members
800
810 thousand
9,000
11.5 million
The number of Stokvel groups on
the Stokfella platform as a
percentage of total Stokvel
groups in the industry is
approximately 0.01%. This is the
same for the number of Stokvel
members.
Stokfella offers the advantage of transparency, security and convenience over traditional
methods of saving for stokvel groups.
Stokvels in South Africa traditionally have the option of saving their funds in cash (using a lockbox) or in a
group savings account at a bank. The latter is often inconvenient because it requires multiple members to
access funds, and the former presents the risk of theft or other loss. Digital stokvel management apps provide
a value-add to stokvel members by allowing for financial transactions to be approved and executed digitally,
rather than going into the bank, and with the added financial management tools that are provided on the
platform. While fintechs like Stokfella are currently only capturing a small portion of the total stokvel industry,
this is likely to rise as digital literacy and the adoption of smart phones increases.
80%
20%
Digital Stokvel
Other platforms
Savings &
Deposits
Segment
The Savings and Deposits fintech segment in South Africa remains immature, with digital banks and
community savings platforms having only been established within the last few years, and with a number of
digital banks only launching in 2019.65
Digital community savings platforms

Pineapple Insurance aims to bring consumer trust back into insurance by remaining transparent and fair in the way
premiums are disbursed by bringing the element of communal insurance.
“Fair, instant insurance for your
stuff”
Pineapple is a completely digital peer-to-
peer short-term insurance company that
allows customers to insure their personal
items by sending a picture of the item via
the app.
Location: Johannesburg
Year launched: 2018 (1 years old)
Founders:
Marnus van Heerden is 27 years
old. He is has a Bachelor’s in
Accounting from the university of
Stellenbosch. Prior to starting
Pineapple he was a Trainee
Accountant at at KPMG.
How it works:
Pineapple’s application, quotation and acceptance process is completely app-based. The
consumer, using the Pineapple app, registers and can start insuring their assets by sending a
picture of their items to be insured. The consumer then selects the people to share the risk
with, thus building their own network. This allows individuals to tailor their risk and reduce their
premiums. Consumers then pay monthly premiums into their individual wallets. Funds in the
wallet are then used to pay for the claims of the people in the network.
Premium quotations are given using photo-imagery assessment, so potential customers just
upload a picture of the item to insure, and can accept the quote immediately. The consumer is
able to pay and track premiums and, at the end of the year, all unclaimed premiums are
returned to the customer.
How is this improving the sector:
• The consumer is involved in the risk analysis process, being able to reduce
their premiums based on the people they choose to be in their networks.
• There is complete transparency and control of usage of premiums in the
network, lowering the risk of fraud.
• Unpaid premiums are paid back - incentivising users to avoid unnecessary
claims.
• Provides a straight-through online application and process.
• Photo imagery improves the customer journey.
The founders of Pineapple Insurance met through a 6-month long innovation competition run
by international reinsurance company, Hannover-Re. The concept for Pineapple Insurance
was born out of this programme and the team was later awarded R5.2 million in seed
funding from Lireas Holdings to take the product to market after winning the competition. Individuals contribute
their premiums in
their individual wallets
Ndabenhle Junior Ngulube is 27 years
old. He is has a an undergrad in
accounting and an honors in taxation from
the University of Cape Town. Prior to
starting Pineapple he was a Junior
Backend Developer at Platform45.
2016: The team participate in the Journey Re entrepreneurship innovation
competition
Pineapple’s Timeline:
2018: Pineapple launches and become the first Insurtech accepted into
Google Launchpad Accelerator Africa class
In December Pineapple reaches 7,200 registered users and wins award
for Best Insurtech Globally from the Digital Insurer, Singapore.
2017: Secures R5.2 million equity funding from Lireas Holdings
Matthew Elan Smith is 25
years old. He is has a
Bachelor’s in Actuarial Science
and Mathematical Statistics
from the university of the
Witwatersrand. Prior to starting
Pineapple he was a Actuarial
Analyst at Credit Guarantee.
All of them then
contribute towards a
claim when it arises
Insurtech
Segment
66

EasyEquities aims to democratise share investing by reducing the cost of trading and removing minimum investment
requirements.
75
70
120
43
50
99
120
100
81
98
75
99
0
201
0
141
195
0
170
125
198
The cost of share trading on SA’s most popular retail share trading platforms
0.50
0.25
0.40
0.50
0.90
0.70
0.50
4.620.8
38.8
68.7
201820162015 2017
+146%
155870
2016 20182015
3,466
2017
1,421
+182%
No. of funded investment accounts
(Units, 000s)
Value of platform assets
(ZAR millions)
The rapid growth of EasyEquities bears testament to the market’s appetite for low-cost share investing
alternatives. Through their low-fee model and no requirement for a minimum investment amount, the
brand has managed to grow faster than market since 2014. EasyEquities clients are mostly first time
investors who are millennials, some as young as 13.
EasyEquities is owned by the Purple Group, a financial services disruptor that also owns market trading
platform GT247.com and Emperor Asset Management. In a December 2018 interview, the CEO stated
that “More than 150,000 accounts have been opened on Easy Equities of which 68,739 are active. 65% of
customers who opened EasyEquities accounts are millennials, or younger customers, who are taking up
investing for the first time.”
Investment
Segment
Brokerage fees (% of investment) Monthly fees (ZAR) Minimum brokerage fee (ZAR)
“Investing made easy. Your Turn”
EasyEquities is an online platform that
enables individuals to buy and sell
shares in publicly traded companies
directly for only 64c per R100 invested,
eliminating the need for a broker.
EasyEquities App was launched and
Sanlam Investments bought a 25%
equity stake in EasyEquities for R100
million.
Charles H. Savage Chief Executive Officer
of Purple Group Limited since November
2007. Charles was one of the pioneers of
spread & CFD trading in South Africa in his
role as CTO of GT247.com in 2000.
How is this improving the sector:
• Providing low-cost investment services (low trading fees).
• Giving consumers the ability to trade from your mobile phone with low transaction charges.
• Providing financial education by tutorials and videos on how to trade on exchanges.
Location: Johannesburg
Year launched: 2014 (4 years old)
67
EasyEquities performance
Sources: 1. SA watches as brokers fight it out, Mail & Gaurdian, Sep 2018 2. EasyEquities website
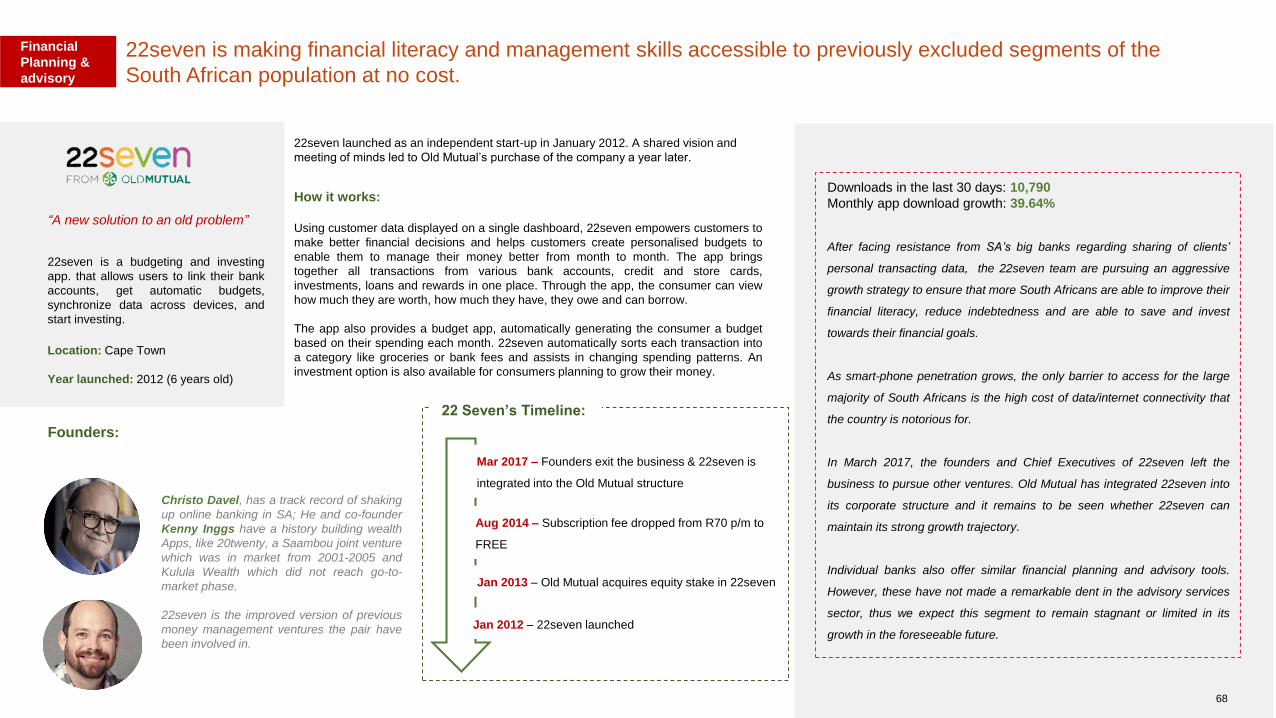
22seven is making financial literacy and management skills accessible to previously excluded segments of the
South African population at no cost.
“A new solution to an old problem”
22seven is a budgeting and investing
app. that allows users to link their bank
accounts, get automatic budgets,
synchronize data across devices, and
start investing.
Location: Cape Town
Year launched: 2012 (6 years old)
Founders:
Christo Davel, has a track record of shaking
up online banking in SA; He and co-founder
Kenny Inggs have a history building wealth
Apps, like 20twenty, a Saambou joint venture
which was in market from 2001-2005 and
Kulula Wealth which did not reach go-to-
market phase.
22seven is the improved version of previous
money management ventures the pair have
been involved in.
How it works:
Using customer data displayed on a single dashboard, 22seven empowers customers to
make better financial decisions and helps customers create personalised budgets to
enable them to manage their money better from month to month. The app brings
together all transactions from various bank accounts, credit and store cards,
investments, loans and rewards in one place. Through the app, the consumer can view
how much they are worth, how much they have, they owe and can borrow.
The app also provides a budget app, automatically generating the consumer a budget
based on their spending each month. 22seven automatically sorts each transaction into
a category like groceries or bank fees and assists in changing spending patterns. An
investment option is also available for consumers planning to grow their money.
Jan 2012 – 22seven launched
Jan 2013 – Old Mutual acquires equity stake in 22seven
Aug 2014 – Subscription fee dropped from R70 p/m to
FREE
Mar 2017 – Founders exit the business & 22seven is
integrated into the Old Mutual structure
22 Seven’s Timeline:
Downloads in the last 30 days: 10,790
Monthly app download growth: 39.64%
After facing resistance from SA’s big banks regarding sharing of clients’
personal transacting data, the 22seven team are pursuing an aggressive
growth strategy to ensure that more South Africans are able to improve their
financial literacy, reduce indebtedness and are able to save and invest
towards their financial goals.
As smart-phone penetration grows, the only barrier to access for the large
majority of South Africans is the high cost of data/internet connectivity that
the country is notorious for.
In March 2017, the founders and Chief Executives of 22seven left the
business to pursue other ventures. Old Mutual has integrated 22seven into
its corporate structure and it remains to be seen whether 22seven can
maintain its strong growth trajectory.
Individual banks also offer similar financial planning and advisory tools.
However, these have not made a remarkable dent in the advisory services
sector, thus we expect this segment to remain stagnant or limited in its
growth in the foreseeable future.
22seven launched as an independent start-up in January 2012. A shared vision and
meeting of minds led to Old Mutual’s purchase of the company a year later.
Financial
Planning &
advisory
68

Thundafund is one of the first and largest crowdfunding platforms in South Africa. Its business model puts forward a
high potential for equity crowdfunding, pending regulatory changes.
“SA‘s leading crowdfunding platform
for creatives and innovators”
Through Thundafund, entrepreneurs
with projects & ideas can raise
capital and build a supportive crowd
of backers through the process of
crowdfunding.
Location: Johannesburg
Year launched: 2013 (5 years old)
Founders:
Patrick Schofield is an award winning social entrepreneur. Having
consulted widely in the development world and personally established and
built successful high social and environmental impact organisations, Patrick
recognised the need and opportunity for the crowdfunding model in South
Africa & Africa. Patrick began working on Thundafund.com in 2013.
How it works:
Like most crowdfunding platforms, project creators (e.g. entrepreneurs) register their idea on the
platform. Sponsors can then register and make contributions to the projects. The Thundafund
team works with the project creator to understand the idea or project, including its funding needs,
crowdfunding targets, what the money will be used for, potential rewards as well as marketing
advice. Each project then devises a variety of project-related items, known as rewards, that will
be presold to backers in turn for their funding contribution. These rewards include retail items,
recognition and experience/exposure.
After defining the project, its target time period of between 30 to 90 days, and its three different
monetary milestones, the project is then advertised. All projects on Thundafund are required to
reach their tipping point (minimum required to make your project work) before their project closes
in order to receive all their funds. If their target is not reached all backers of the project will be
reimbursed minus the banking fees
Once a project is successfully funded, Thundafund receives a commission on the final amount
crowdfunded: 5% for certified NGOs and 7% for individuals and organisations.
How is this improving the sector:
• Entrepreneurs can test their ideas and build a base of supporters.
• Entrepreneurs can get more than capital support, as backers usually
want the business to succeed and provide advice and assistance.
• It is a risk-free model, allowing project creators to raise awareness
within their market or audience by pre-selling the product before
engaging in significant resource.
Thundafund believes that by changing the way entrepreneurial funding works, and by making
this transparent and inclusive, they can build trust and loyalty between entrepreneurs and their
customers, thereby growing economies and creating jobs.
The crowdfunding industry in South Africa is mostly reward-based. Very few raise debt or equity
capital due to the regulatory framework governing equity trading. With crowdfunding platforms such
as Thundafund experiencing great success, there is an opportunity to turn reward-based crowd
funders’ business models into crowd investing, leveraging on their existing networks.Andrea Morgan worked the online frontline for 2 and half years with a
passion for business and communication for Thundafund. Using her media,
journalistic and entrepreneurship experience, her ever present sense of
curiosity and love of creativity to bring to the Thundafund community a firm
foundation for crowdfunding..
ThundaFund provides assistance in articulating the idea, measuring
funding needs and providing marketing advice. They only allow viable
projects on their site.
Capital
Raising
Segment
69
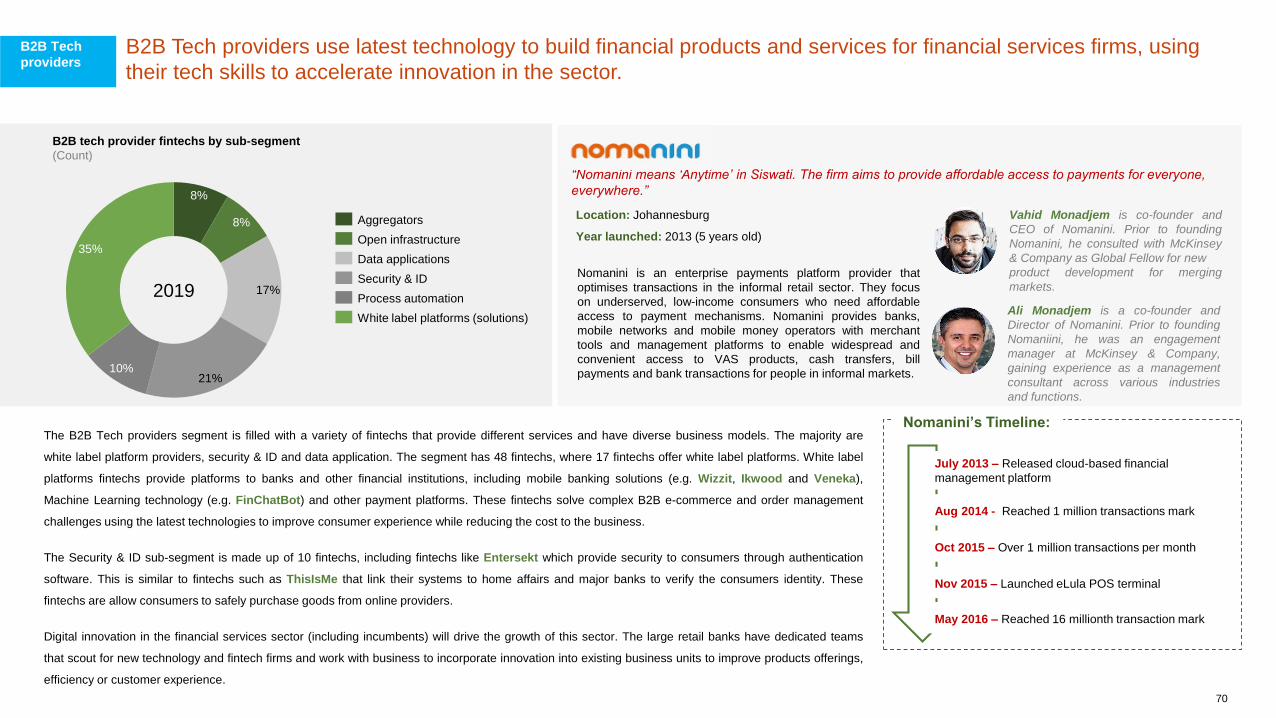
B2B Tech providers use latest technology to build financial products and services for financial services firms, using
their tech skills to accelerate innovation in the sector.
8%
8%
17%
21%10%
35%Open infrastructure
Aggregators
Process automation
Security & ID
Data applications
White label platforms (solutions)
B2B tech provider fintechs by sub-segment
(Count)
2019
B2B Tech
providers
“Nomanini means ‘Anytime’ in Siswati. The firm aims to provide affordable access to payments for everyone,
everywhere.”
Nomanini is an enterprise payments platform provider that
optimises transactions in the informal retail sector. They focus
on underserved, low-income consumers who need affordable
access to payment mechanisms. Nomanini provides banks,
mobile networks and mobile money operators with merchant
tools and management platforms to enable widespread and
convenient access to VAS products, cash transfers, bill
payments and bank transactions for people in informal markets.
Vahid Monadjem is co-founder and
CEO of Nomanini. Prior to founding
Nomanini, he consulted with McKinsey
& Company as Global Fellow for new
product development for merging
markets.
Location: Johannesburg
Year launched: 2013 (5 years old)
The B2B Tech providers segment is filled with a variety of fintechs that provide different services and have diverse business models. The majority are
white label platform providers, security & ID and data application. The segment has 48 fintechs, where 17 fintechs offer white label platforms. White label
platforms fintechs provide platforms to banks and other financial institutions, including mobile banking solutions (e.g. Wizzit, Ikwood and Veneka),
Machine Learning technology (e.g. FinChatBot) and other payment platforms. These fintechs solve complex B2B e-commerce and order management
challenges using the latest technologies to improve consumer experience while reducing the cost to the business.
The Security & ID sub-segment is made up of 10 fintechs, including fintechs like Entersekt which provide security to consumers through authentication
software. This is similar to fintechs such as ThisIsMe that link their systems to home affairs and major banks to verify the consumers identity. These
fintechs are allow consumers to safely purchase goods from online providers.
Digital innovation in the financial services sector (including incumbents) will drive the growth of this sector. The large retail banks have dedicated teams
that scout for new technology and fintech firms and work with business to incorporate innovation into existing business units to improve products offerings,
efficiency or customer experience.
Ali Monadjem is a co-founder and
Director of Nomanini. Prior to founding
Nomaniini, he was an engagement
manager at McKinsey & Company,
gaining experience as a management
consultant across various industries
and functions.
Nov 2015 – Launched eLula POS terminal
Oct 2015 – Over 1 million transactions per month
Aug 2014 - Reached 1 million transactions mark
July 2013 – Released cloud-based financial
management platform
Nomanini’s Timeline:
May 2016 – Reached 16 millionth transaction mark
70

Sub-segment
definitions
Payments
mPOS (acquires): Entities that provide a portable Point-of-Sale on a smartphone or tablet that functions as a cash register or electronic point-of-sale terminal.
Crypto payments: Entities that allow clients to make and/or receive payments in cryptocurrency.
Cross border payments: Entities that allow clients to make or receive payments outside the borders of South Africa. Transactions involving individuals, companies, banks
or settlement institutions operating in at least two different countries.
(Bill) payment aggregators: Entities that allow for the processing of payments to several parties on a single account (e.g. paying all your bills from one account).
3rd party payment providers: Entities that accepts money or the proceeds of payment instructions from two or more payers for on-payment to third persons to whom the
money is due.
Lending
Online (alternative) lenders: Entities that provide credit online, where the application process is completely done on the lenders website without any visiting any branch.
The loan is funded from the fintechs balance sheet.
Asset financing: Fintechs that allow companies to use their balance sheet assets, including short-term investments, inventory and accounts receivable, to borrow money.
Alternative scoring: Fintechs that capture informal financial behaviours and provides a credit identity for the 'unscored' or underscored low-income consumer.
Lending market places: Fintechs that connect borrowers and investors together, lending to borrowers without lending out their own capital.
Savings &
Deposits
Digital community savings: Entities that provide a platform were a group individuals could save towards a certain goal together, contributing an agreed amount each
month.
Savings products: Entities that provide traditional savings products online.
Layby: Fintechs that provide providing layby services online, allowing consumers to pay a fee and a deposit on a good in order for the retailer to hold the good until the
balance is paid off.
Digital banking (issuers): Entities that offer online banking, where banking services are delivered over the internet.
InsurTechs
Connected insurance: Fintechs that use internet of things technology to connect devices to insurance services.
Peer-to-peer insurance: Peer-to-peer insurance (P2P) is a risk-sharing network where a group of individuals pool their premiums together to insure against a risk.
Automated risk analysis: Entities that provide technology that automates risk analysis based on the client’s information with limited human intervention.
Digital distribution: Entities that provide technology to insurance companies that assist with delivering insurance products online distribution.
Claims management: Entities that provide technology to insurance companies that assist in claim management.
Investments
Retail trading: Entities that provide a platform that allows consumers to buy or sell stocks, currencies etc.
Crypto currency trading: Entities that provide a platform that allows consumers to buy or sell cryptocurrency or digital currency.
Alternative exchanges: These are alternative trading system that are regulated as an alternative exchange.
Definitions of sub-segments
71*The definitions used in this report are based on the definitions explained in the segmentation framework presented in the beginning of this report and aligns to the fintech definition given for this research paper

Capital Raising
B2B Tech providers
Financial planning
& Advisory
Robo-advisory: Entities that provide financial product recommendations using robotics and algorithms instead of the traditional human needs analysis based advice.
Personal finance management: Entities that create applications to assist customers to track their spend, budget and save towards particular goals.
Small business finance management: Entities that automate administrative tasks for small business owners such as bookkeeping, payroll and other admin without the
need for proprietary software, but rather Application Programming Interface (APIs).
Crowd investing: Raising capital (debt or equity) from individuals for charity or business ventures through online platforms.
Due diligence: Digital platforms that use alternative transactional and behavioural data sources to determine risk ratings for granting finance.
Aggregators: Entities that collect related items or content and display them in one central platform, e.g. Hippo.
Open infrastructure: Shared online platforms (APIs) that allows players in the same industry to access clientele and ancillary services. These platforms give customers
access to a range of related (or unrelated) goods or services through one platform.
RegTech & risk management: Technology that supports the digitisation of regulatory compliance by financial services providers in order to ensure compliance and
minimise risk.
Data applications: Applications that use artificial intelligence and machine learning to predict customer preferences and/or behaviour (applied to financial decision-
making).
Security & ID: Technologies that allow for safe and secure verification of a customer transacting digitally without the need for physical signature or presenting themselves
to the financial services provider.
Process automation: Technologies that remove the need for manual processing of back or middle office tasks (usually digitizing paper-based tasks)
White label platforms: Technology solutions created by Tech companies to financial services providers to improve efficiency of current operations.
Sub-segment
definitions
Definitions of sub-segments contd.
72

Table of Contents
Overview
Segmentation
Market diagnostics
Segment Prioritisation
Insights from industry
Recommendations
Appendices:
Market scanning methodology
Segments and sub-segments definitions
Market sizing methodology
Market sizing assumptions and calculations by segment
Case Studies
Fintech directory

Fintech directoryPayments segment
No
.Name Sub-segment Location Website Licencing
1 Beyonic3rd party payment
providersUganda, SA https://beyonic.com/ No info provided
2 BitPesa Crypto payments Kenya, SA https://www.bitpesa.co/ No info provided
3 BitSure (Xigo)3rd party payment
providersCape Town https://xago.io/ No info provided
4 ByteMoney3rd party payment
providersCape Town
http://www.bytemoney.c
o.za/No info provided
5 Call Pay3rd party payment
providersCape Town http://www.callpay.com/ No info provided
6 CentBee Crypto payments Johannesburghttps://www.centbee.co
m/TPPP (PASA)
7 CrowdcoinPayment aggregators
(Bills)Limpopo
https://www.crowdcoin.c
o.zaNo info provided
8 Cubebucks Crypto payments London, UK http://cubebucks.com/ No info provided
9 Dashpay Crypto payments USA, SA https://www.dash.org/ TPPP(PASA)
10 Easy PayPayment aggregators
(Bills)Cape Town
https://new.easypay.co.
za/TPPP & SO
11Ecentric
Payment
3rd party payment
providersCape Town
http://www.ecentric.co.z
a/TPPP & SO
12 Electrum3rd party payment
providersCape Town https://electrum.co.za/ No info provided
13 Exchange 4 free Cross-border payments London, UKhttps://exchange4free.c
om/FCA (UK)
14 Flutterwave Third party US, SAhttps://flutterwave.com/
za/No info provided
15 Flexpay.co.za Payroll Johannesburghttps://www.flexpay.co.z
a/No info provided
16 Geopay Cross-border payments Johannesburg https://geopay.co.za/ No info provided
17 Hello Paisa Cross-border payments https://hellopaisa.co.za/ Sponsor: Sasfin Bank
18 Howler Closed loop mobile wallets Johannesburghttps://www.howler.co.z
a/#what-we-doNo info provided
19 Hyphen3rd party payment
providersJohannesburg
https://www.hyphen.co.
za/TPPP & SO
20 Ikhokha mPos (acquires) Durbanhttps://www.ikhokha.co
mNo info provided
21 IMB Closed loop mobile wallets Cape Town https://imb.co/ Credit provider/FSP
22 KarriPayment aggregators
(Bills)Cape Town https://karri.co.za/ Sponsor:: Nedbank
23 Kineto3rd party payment
providersCape Town http://kineto.co/ No info provided
70
Payments segment
No
.Name Sub-segment Location Website Licencing
24 Luno* Crypto payments UK, SA https://www.luno.com/ No info provided
25 Mama money Cross-border payments Cape Townhttps://www.mamamone
y.co.za/No info provided
26 Maxicash Cross-border payments Johannesburghttps://www.maxicashap
p.com/Registered FSP
27 MobiPaid mPOS (acquires) USA, UK, SA https://mobipaid.com/ Applied with PASA
28 Mukuru Money Cross-border paymentshttps://www.mukuru.co
m/sa/No info provided
29 mvendr mPOS (acquires) UK, SA https://mvendr.com/ No info provided
30 m-vendr3rd party payment
providersUK, SA https://mvendr.com/ No info provided
31 OTT voucher Third party Johannesburg http://ottvoucher.com/ No info provided
32Ozow secure pauments
(iPay)
3rd party payment
providersJohannesburg https://ozow.com/ No info provided
33 Pago Cross-border paymentshttp://www.paywithpago.
com/No info provided
34 Pay space Payroll Johannesburghttps://www.payspace.c
om/No info provided
35 Paycorp3rd party payment
providersJohannesburg
http://paycorp.co.za/abo
ut/contact-us/SO (PASA)
36 PayFast3rd party payment
providersCape Town
https://www.payfast.co.z
a/TPPP(PASA)
37 PayLiquid3rd party payment
providersSingapore, SA
https://www.liquidpay.co
m/No info provided
38 Payment24 Closed loop mobile wallet Cape Townhttps://www.payment24.
co.za/No info provided
39 Payport3rd party payment
providersCape Town https://payportsa.co.za/ No info provided
40 PayU3rd party payment
providersCape Town
https://corporate.payu.c
om/TPPP & SO
41 Peach Payments3rd party payment
providers
Cape Town,
Johannesburg
https://www.peachpaym
ents.com/#/homeSO (PASA)
42PopApp deals
(moWallet)Closed loop mobile wallets Johannesburg http://popappdeals.com/ No info provided
43 Q link(Bills) Payment
aggregators Pretoria
https://www.qlink.co.za/
QLHome/index_site.phpTPPP & SO
44 Retriever Fintech3rd party payment
providersMidrand
http://www.retrieverft.co
m/TPPP & SO
45 Scode3rd party payment
providersCape Town http://www.scode.co.za/ No info provided
46 Selpal mPOS (acquires) Johannesburg http://www.selpal.co.za/ TPPP (PASA)
Notes: * represents fintechs that are in more than one segment
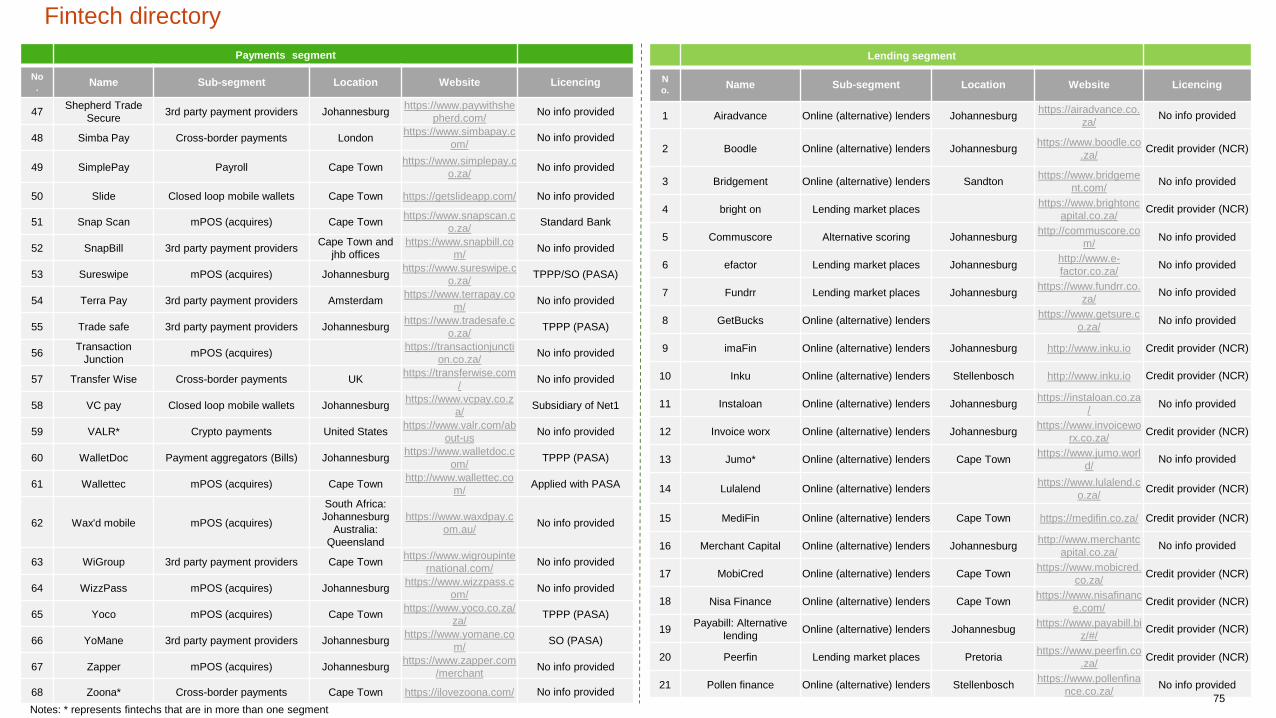
Payments segment
No
.Name Sub-segment Location Website Licencing
47Shepherd Trade
Secure3rd party payment providers Johannesburg
https://www.paywithshe
pherd.com/No info provided
48 Simba Pay Cross-border payments Londonhttps://www.simbapay.c
om/No info provided
49 SimplePay Payroll Cape Townhttps://www.simplepay.c
o.za/No info provided
50 Slide Closed loop mobile wallets Cape Town https://getslideapp.com/ No info provided
51 Snap Scan mPOS (acquires) Cape Townhttps://www.snapscan.c
o.za/Standard Bank
52 SnapBill 3rd party payment providersCape Town and
jhb offices
https://www.snapbill.co
m/No info provided
53 Sureswipe mPOS (acquires) Johannesburghttps://www.sureswipe.c
o.za/TPPP/SO (PASA)
54 Terra Pay 3rd party payment providers Amsterdamhttps://www.terrapay.co
m/No info provided
55 Trade safe 3rd party payment providers Johannesburghttps://www.tradesafe.c
o.za/TPPP (PASA)
56Transaction
JunctionmPOS (acquires)
https://transactionjuncti
on.co.za/No info provided
57 Transfer Wise Cross-border payments UKhttps://transferwise.com
/No info provided
58 VC pay Closed loop mobile wallets Johannesburghttps://www.vcpay.co.z
a/Subsidiary of Net1
59 VALR* Crypto payments United Stateshttps://www.valr.com/ab
out-usNo info provided
60 WalletDoc Payment aggregators (Bills) Johannesburghttps://www.walletdoc.c
om/TPPP (PASA)
61 Wallettec mPOS (acquires) Cape Townhttp://www.wallettec.co
m/Applied with PASA
62 Wax'd mobile mPOS (acquires)
South Africa:
Johannesburg
Australia:
Queensland
https://www.waxdpay.c
om.au/No info provided
63 WiGroup 3rd party payment providers Cape Townhttps://www.wigroupinte
rnational.com/No info provided
64 WizzPass mPOS (acquires) Johannesburghttps://www.wizzpass.c
om/No info provided
65 Yoco mPOS (acquires) Cape Townhttps://www.yoco.co.za/
za/TPPP (PASA)
66 YoMane 3rd party payment providers Johannesburghttps://www.yomane.co
m/SO (PASA)
67 Zapper mPOS (acquires) Johannesburghttps://www.zapper.com
/merchantNo info provided
68 Zoona* Cross-border payments Cape Town https://ilovezoona.com/ No info provided
Notes: * represents fintechs that are in more than one segment
Lending segment
N
o. Name Sub-segment Location Website Licencing
1 Airadvance Online (alternative) lenders Johannesburghttps://airadvance.co.
za/No info provided
2 Boodle Online (alternative) lenders Johannesburghttps://www.boodle.co
.za/Credit provider (NCR)
3 Bridgement Online (alternative) lenders Sandtonhttps://www.bridgeme
nt.com/No info provided
4 bright on Lending market placeshttps://www.brightonc
apital.co.za/Credit provider (NCR)
5 Commuscore Alternative scoring Johannesburghttp://commuscore.co
m/No info provided
6 efactor Lending market places Johannesburghttp://www.e-
factor.co.za/No info provided
7 Fundrr Lending market places Johannesburghttps://www.fundrr.co.
za/No info provided
8 GetBucks Online (alternative) lendershttps://www.getsure.c
o.za/No info provided
9 imaFin Online (alternative) lenders Johannesburg http://www.inku.io Credit provider (NCR)
10 Inku Online (alternative) lenders Stellenbosch http://www.inku.io Credit provider (NCR)
11 Instaloan Online (alternative) lenders Johannesburghttps://instaloan.co.za
/No info provided
12 Invoice worx Online (alternative) lenders Johannesburghttps://www.invoicewo
rx.co.za/Credit provider (NCR)
13 Jumo* Online (alternative) lenders Cape Townhttps://www.jumo.worl
d/No info provided
14 Lulalend Online (alternative) lendershttps://www.lulalend.c
o.za/Credit provider (NCR)
15 MediFin Online (alternative) lenders Cape Town https://medifin.co.za/ Credit provider (NCR)
16 Merchant Capital Online (alternative) lenders Johannesburghttp://www.merchantc
apital.co.za/No info provided
17 MobiCred Online (alternative) lenders Cape Townhttps://www.mobicred.
co.za/Credit provider (NCR)
18 Nisa Finance Online (alternative) lenders Cape Townhttps://www.nisafinanc
e.com/Credit provider (NCR)
19Payabill: Alternative
lendingOnline (alternative) lenders Johannesbug
https://www.payabill.bi
z/#/Credit provider (NCR)
20 Peerfin Lending market places Pretoriahttps://www.peerfin.co
.za/Credit provider (NCR)
21 Pollen finance Online (alternative) lenders Stellenboschhttps://www.pollenfina
nce.co.za/No info provided
Fintech directory
75
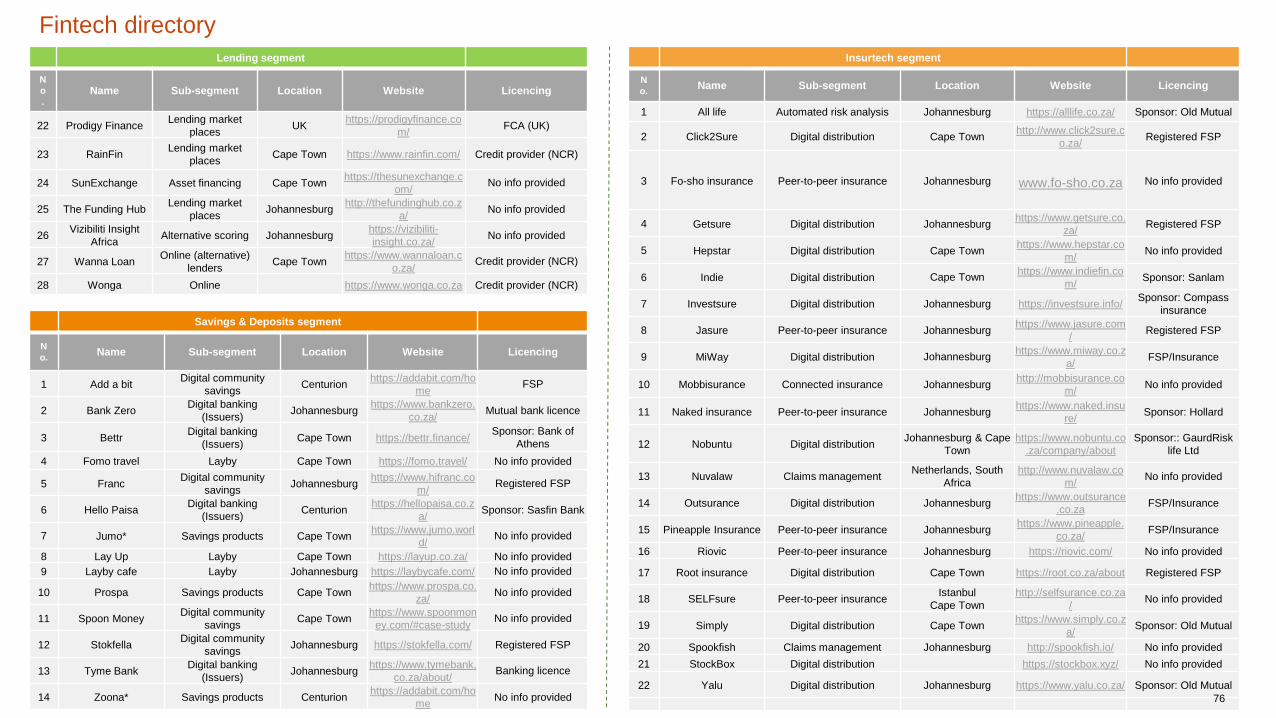
74Notes: * represents fintechs that are in more than one segment
Lending segment
N
o
.Name Sub-segment Location Website Licencing
22 Prodigy FinanceLending market
placesUK
https://prodigyfinance.co
m/FCA (UK)
23 RainFinLending market
placesCape Town https://www.rainfin.com/ Credit provider (NCR)
24 SunExchange Asset financing Cape Townhttps://thesunexchange.c
om/No info provided
25 The Funding HubLending market
placesJohannesburg
http://thefundinghub.co.z
a/No info provided
26Vizibiliti Insight
AfricaAlternative scoring Johannesburg
https://vizibiliti-
insight.co.za/No info provided
27 Wanna LoanOnline (alternative)
lendersCape Town
https://www.wannaloan.c
o.za/Credit provider (NCR)
28 Wonga Online https://www.wonga.co.za Credit provider (NCR)
Savings & Deposits segment
N
o.Name Sub-segment Location Website Licencing
1 Add a bitDigital community
savingsCenturion
https://addabit.com/ho
meFSP
2 Bank ZeroDigital banking
(Issuers)Johannesburg
https://www.bankzero.
co.za/Mutual bank licence
3 BettrDigital banking
(Issuers)Cape Town https://bettr.finance/
Sponsor: Bank of
Athens
4 Fomo travel Layby Cape Town https://fomo.travel/ No info provided
5 FrancDigital community
savingsJohannesburg
https://www.hifranc.co
m/Registered FSP
6 Hello PaisaDigital banking
(Issuers)Centurion
https://hellopaisa.co.z
a/Sponsor: Sasfin Bank
7 Jumo* Savings products Cape Townhttps://www.jumo.worl
d/No info provided
8 Lay Up Layby Cape Town https://layup.co.za/ No info provided
9 Layby cafe Layby Johannesburg https://laybycafe.com/ No info provided
10 Prospa Savings products Cape Townhttps://www.prospa.co.
za/No info provided
11 Spoon MoneyDigital community
savingsCape Town
https://www.spoonmon
ey.com/#case-studyNo info provided
12 StokfellaDigital community
savingsJohannesburg https://stokfella.com/ Registered FSP
13 Tyme BankDigital banking
(Issuers)Johannesburg
https://www.tymebank.
co.za/about/Banking licence
14 Zoona* Savings products Centurionhttps://addabit.com/ho
meNo info provided
Insurtech segment
N
o.Name Sub-segment Location Website Licencing
1 All life Automated risk analysis Johannesburg https://alllife.co.za/ Sponsor: Old Mutual
2 Click2Sure Digital distribution Cape Townhttp://www.click2sure.c
o.za/Registered FSP
3 Fo-sho insurance Peer-to-peer insurance Johannesburg www.fo-sho.co.za No info provided
4 Getsure Digital distribution Johannesburghttps://www.getsure.co.
za/Registered FSP
5 Hepstar Digital distribution Cape Townhttps://www.hepstar.co
m/No info provided
6 Indie Digital distribution Cape Townhttps://www.indiefin.co
m/Sponsor: Sanlam
7 Investsure Digital distribution Johannesburg https://investsure.info/Sponsor: Compass
insurance
8 Jasure Peer-to-peer insurance Johannesburghttps://www.jasure.com
/Registered FSP
9 MiWay Digital distribution Johannesburghttps://www.miway.co.z
a/FSP/Insurance
10 Mobbisurance Connected insurance Johannesburghttp://mobbisurance.co
m/No info provided
11 Naked insurance Peer-to-peer insurance Johannesburghttps://www.naked.insu
re/Sponsor: Hollard
12 Nobuntu Digital distributionJohannesburg & Cape
Town
https://www.nobuntu.co
.za/company/about
Sponsor:: GaurdRisk
life Ltd
13 Nuvalaw Claims managementNetherlands, South
Africa
http://www.nuvalaw.co
m/No info provided
14 Outsurance Digital distribution Johannesburghttps://www.outsurance
.co.zaFSP/Insurance
15 Pineapple Insurance Peer-to-peer insurance Johannesburghttps://www.pineapple.
co.za/FSP/Insurance
16 Riovic Peer-to-peer insurance Johannesburg https://riovic.com/ No info provided
17 Root insurance Digital distribution Cape Town https://root.co.za/about Registered FSP
18 SELFsure Peer-to-peer insuranceIstanbul
Cape Town
http://selfsurance.co.za
/No info provided
19 Simply Digital distribution Cape Townhttps://www.simply.co.z
a/Sponsor: Old Mutual
20 Spookfish Claims management Johannesburg http://spookfish.io/ No info provided
21 StockBox Digital distribution https://stockbox.xyz/ No info provided
22 Yalu Digital distribution Johannesburg https://www.yalu.co.za/ Sponsor: Old Mutual
Fintech directory
76

Notes: * represents fintechs that are in more than one segment
Investments segment
No. Name Sub-segment Location Website Licencing
1 4AX Alternative exchange Johannesburg https://4ax.co.za/home No info provided
2 A2X Alternative exchange Johannesburg https://www.a2x.co.za/ No info provided
3 Affinity Mining Cryptocurrency trading Johannesburghttps://www.affinitymini
ng.co.za/Registered FSP
4 AvaTrade Alternative exchangeDublin
Johannesburg
https://www.avatrade.c
o.za/No info provided
5 Bitcoin.com Cryptocurrency tradingCape Town
USA
https://www.bitcom.com
/No info provided
6 Caesium Capital Retail trading Johannesburghttps://caesiumcapital.c
om/No info provided
7 chainex Cryptocurrency trading Kouga, Eastern Cape https://chainex.io/about No info provided
8 CoinBR Cryptocurrency tradingSao Paulo
Cape Town www.coinbr.net/No info provided
9 Coindirect Cryptocurrency trading Cape Townhttps://www.coindirect.c
om/za/No info provided
10 Coreshares Retail trading Johannesburg http://coreshares.co.za Registered FSP
11 Easy Equities Retail trading Johannesburghttps://www.easyequitie
s.co.za/Registered FSP
12 Edcoin Cryptocurrency trading Johannesburg https://www.ed-coin.io/ No info provided
13 IG trading Retail trading Johannesburg https://www.ig.com/za No info provided
14Internet Currency
Evolution (ice3X)Cryptocurrency trading Matlosana, North-West https://ice3x.com/ No info provided
15 Itransact Retail trading Johannesburghttps://www.itransact.co
.za/Registered FSP
16 Luno* Cryptocurrency tradingLondon
Johannesburghttps://www.luno.com/ No info provided
17 NMRQL Retail trading Stellenboschhttps://nmrql.com/resea
rch/Registered FSP
18 Project Ubu Cryptocurrency trading Johannesburghttps://www.projectubu.
com/No info provided
19 ProsperiProp Cryptocurrency trading Cape Town www.prosperiprop.co.z
a
No info provided
20 Reality Africa Alternative exchangehttps://www.realtyafrica.
com/No info provided
21 VALR* Crypto payments United Stateshttps://www.valr.com/ab
out-usNo info provided
22 Wealth Migrate Retail trading Londonhttps://www.wealthmigr
ate.com/No info provided
23 ZarX Alternative exchange Johannesburg https://www.zarx.co.za/ No info provided
Financial Planning & Advisory segment
No
.Name Sub-segment Location Website Licencing
1 22sevenPersonal finance
managementCape Town
https://www.22seven.co
m/Part of Old Mutual
2 Akiba DigitalPersonal finance
management
Johannesburgwww.akibadigital.com No info provided
3 Arcus Capital Robo advisory Johannesburg http://arcuscapital.co.za/Sponsored:
EasyEquities
4 Ctrl Robo advisory Paarlhttps://www.takectrl.co.z
a/Registered FSP
5 Diga DigitalSmall business finance
management
Johannesburg
East Londonhttps://www.diga.co.za/ No info provided
6 Fincheck Robo advisory USA https://fincheck.com/ No info provided
7 FitMoneySmall business finance
management
http://createoptimal.com/
fitmoney.htmlNo info provided
8 MyTreasury Robo advisory Johannesburghttps://www.mytreasury.
co.za/No info provided
9 Outsurance outvest Robo advisory Centurion www.outvest.co.za Registered FSP
10 PocketslipPersonal finance
managementPaarl
https://www.pocketslip.c
om/No info provided
11 Realty Wealth Robo advisory US www.realtywealth.com USA SEC
12 SmartmoneyPersonal finance
managementJohannesburg
https://smartmoney.co.z
a/No info provided
13 SMEasySmall business finance
managementSouth Africa
https://www.smeasy.co.z
a/enzaNo info provided
14 StriderTechSmall business finance
managementJohannesburg https://stridertech.co.za/ No info provided
15 TaxTim Robo advisory Cape Townhttps://www.taxtim.com/z
a/Registered FSP
16 The money schoolPersonal finance
management
https://www.themoneysc
hool.co.za/tms/No info provided
No info provided
Fintech directory
77

Notes: * represents fintechs that are in more than one segment
Capital Raising segment
No
. Name Sub-segment Location Website Licencing
1 Candystick Crowd investing Cape Townhttps://candystick.co.
za/No info provided
2 Fundfind Crowd investing Cape Town www.fundfind.co.za No info provided
3 Jumpstart Crowd investing Johannesburghttps://www.jumpstar
t.co.za/No info provided
4Live stock wealth (crowd
investing)Crowd investing Johannesburg
https://www.livestock
wealth.com/No info provided
5 The People's Fund Crowd investing Johannesburghttps://thepeople.co.
za/No info provided
6Thundafund (market
place)Crowd investing Cape Town
https://www.thundaf
und.com/No info provided
7 Uprise Africa Crowd investing Cape Town https://uprise.africa/ Registered FSP
8 Yue Diligence Due Diligence Johannesburghttps://www.yuedilig
ence.com/No info provided
No info provided
B2B Tech providers segment
Name Sub-segment Location Website Licencing
1 AgrigateData applications
Japan??https://www.agrigate.c
o.nz/No info provided
2 Airvantage White label
platforms (solutions)Johannesburg
https://www.airvantag
e.co.za/No info provided
3 Altcoin TraderOpen infrastructure
Roodepoorthttps://www.altcointrad
er.co.za/No info provided
4 bankymoonOpen infrastructure
Johannesburghttp://bankymoon.co.z
a/No info provided
5 Business OpticsData applications
Johannesburghttps://www.businesso
ptics.biz/No info provided
6 Causal Nexus White label
platforms (solutions)Johannesburg
https://causalnexus.co
m/No info provided
7 Compare GuruAggregators
Cape Townhttps://compareguru.c
o.za/Registered FSP
8 ConsenSys White label
platforms (solutions)New York https://consensys.net/ No info provided
9 CustosSecurity & ID
Stellenboschhttps://www.custostec
h.com/No info provided
10 Diga Digital*Process automation
East Londonhttps://www.diga.co.za
/No info provided
11 DocFoxSecurity & ID
Johannesburghttps://www.docfoxapp
.com/?locale=en_ZANo info provided
B2B Tech providers segment
No
.Name Sub-segment Location Website Licencing
12 Emerge Analytics Data applications Johannesburghttp://emergeanalytics.c
om/No info provided
13 Entersekt Security & ID
South Africa and
presence Mauritius ,
London , Atlanta,
Utrecht and Munich
https://www.entersekt.c
om/No info provided
14 FinChatBotWhite label platforms
(solutions)Johannesburg https://finchatbot.com/ No info provided
15 Finfind Aggregators Durban https://www.finfind.co.za No info provided
16 FintecLabsWhite label platforms
(solutions)Stellenbosch
https://www.fintec.group
/TPPP (PASA)
17 Flickswitch Open infrastructure Pretoriahttps://www.flickswitch.c
o.za/No info provided
18 Green Model Process automation Johannesburghttp://www.greenmodel.
co.za/pilotNo info provided
19 Hippo.co.za Aggregators Johannesburg https://www.hippo.co.za Registered FSP
20 IkwookWhite label platforms
(solutions)
San Francisco
Johannesburg
https://www.ikwook.com
/page/homeNo info provided
21 ISpani GroupWhite label platforms
(solutions)Johannesburg
https://www.ispanigroup
.co.za/No info provided
22 iVeriWhite label platforms
(solutions)Johannesburg http://www.iveri.com No info provided
23 Jumo* Data applications Cape Town https://www.jumo.world/ No info provided
24 Kusasa Outsourcing Process automation Durbanhttps://www.kusasaouts
ourcing.co.za/No info provided
25 Liquid Thought Data applications Cape Townhttp://www.liquidthought
.co.za/No info provided
26 MWR Security & IDFinland (head office),
Sandton (local arm)
https://www.mwrinfosec
urity.com/No info provided
27 NomaniniWhite label platforms
(solutions)Cape Town
https://www.nomanini.co
m/No info provided
28 OrdercloudWhite label platforms
(solutions)Stellenbosch
https://www.ordercloud.
co.za/No info provided
29 PayD Security & ID https://www.payd.net/ No info provided
30 RedBlade Process automation Cape Town http://www.redblade.io/ No info provided
31 RehiveWhite label platforms
(solutions)Cape Town https://rehive.com/ No info provided
32 SASA SolutionsWhite label platforms
(solutions)Cape Town http://sasa.solutions/ No info provided
Fintech directory
78
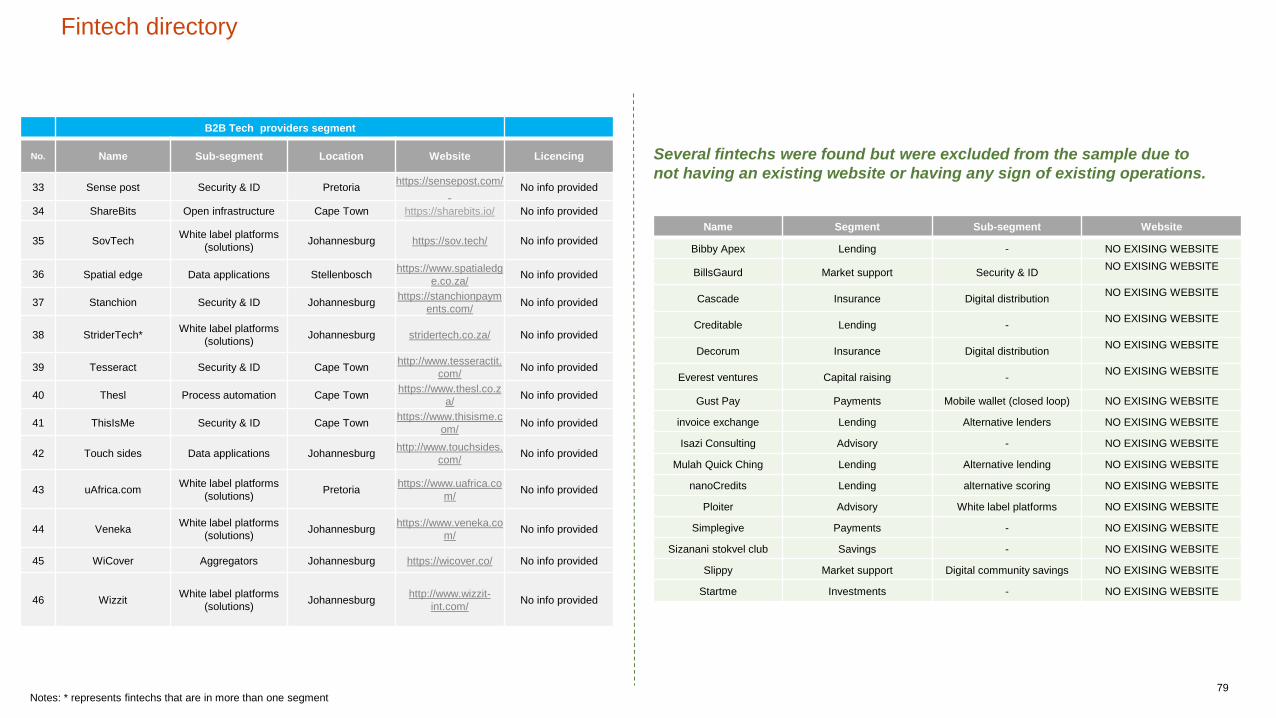
Notes: * represents fintechs that are in more than one segment
B2B Tech providers segment
No. Name Sub-segment Location Website Licencing
33 Sense post Security & ID Pretoriahttps://sensepost.com/
No info provided
34 ShareBits Open infrastructure Cape Town https://sharebits.io/ No info provided
35 SovTechWhite label platforms
(solutions)Johannesburg https://sov.tech/ No info provided
36 Spatial edge Data applications Stellenboschhttps://www.spatialedg
e.co.za/No info provided
37 Stanchion Security & ID Johannesburghttps://stanchionpaym
ents.com/No info provided
38 StriderTech*White label platforms
(solutions)Johannesburg stridertech.co.za/ No info provided
39 Tesseract Security & ID Cape Townhttp://www.tesseractit.
com/No info provided
40 Thesl Process automation Cape Townhttps://www.thesl.co.z
a/No info provided
41 ThisIsMe Security & ID Cape Townhttps://www.thisisme.c
om/No info provided
42 Touch sides Data applications Johannesburghttp://www.touchsides.
com/No info provided
43 uAfrica.comWhite label platforms
(solutions)Pretoria
https://www.uafrica.co
m/No info provided
44 VenekaWhite label platforms
(solutions)Johannesburg
https://www.veneka.co
m/No info provided
45 WiCover Aggregators Johannesburg https://wicover.co/ No info provided
46 WizzitWhite label platforms
(solutions)Johannesburg
http://www.wizzit-
int.com/No info provided
Name Segment Sub-segment Website
Bibby Apex Lending - NO EXISING WEBSITE
BillsGaurd Market support Security & IDNO EXISING WEBSITE
Cascade Insurance Digital distributionNO EXISING WEBSITE
Creditable Lending -NO EXISING WEBSITE
Decorum Insurance Digital distributionNO EXISING WEBSITE
Everest ventures Capital raising -NO EXISING WEBSITE
Gust Pay Payments Mobile wallet (closed loop) NO EXISING WEBSITE
invoice exchange Lending Alternative lenders NO EXISING WEBSITE
Isazi Consulting Advisory - NO EXISING WEBSITE
Mulah Quick Ching Lending Alternative lending NO EXISING WEBSITE
nanoCredits Lending alternative scoring NO EXISING WEBSITE
Ploiter Advisory White label platforms NO EXISING WEBSITE
Simplegive Payments - NO EXISING WEBSITE
Sizanani stokvel club Savings - NO EXISING WEBSITE
Slippy Market support Digital community savings NO EXISING WEBSITE
Startme Investments - NO EXISING WEBSITE
Several fintechs were found but were excluded from the sample due to
not having an existing website or having any sign of existing operations.
Fintech directory
79

TPPPs
No. Bank Institution
1Absa Bank Limited Pick 'n Pay Retailers (Pty) Limited
2Absa Bank Limited Touchstone Enterprise Services (Pty) Ltd
3Absa Bank Limited
Ackermans A Division of Pepkor Trading (Pty)
Ltd
4Absa Bank Limited Administrative Healthcare Solutions (Pty) Ltd
5Absa Bank Limited Afeleton Pty. Ltd
6Absa Bank Limited African Payments Solutions Ltd
7Absa Bank Limited All Encompassing Switching (Pty) Ltd
8Absa Bank Limited Altech Card Solutions, division of Altron TMT
9Absa Bank Limited Altech NuPay a division of Altron (Pty) Ltd
10Absa Bank Limited Badger Administration
11Absa Bank Limited Bay Payment Technology
12Absa Bank Limited bidorbuy (Pty) Ltd
13Absa Bank Limited Bitventure Consulting
14Absa Bank Limited BRIDGE COLLECTIONS
15Absa Bank Limited Buyisa Financial Services Cc
16Absa Bank Limited Capital Computer Bureau (Pty) Ltd
17Absa Bank Limited Capital Software Solutions Pty Ltd
18Absa Bank Limited Cigi Cell (Pty) Ltd
19Absa Bank Limited Clientele Life Assurance Company Ltd.
20Absa Bank Limited Collecnet Pty LTD
Organisations registered with PASA
TPPPs
No. Bank Institution
21Absa Bank Limited Dataforce Trading 102 (Pty) Ltd.
22Absa Bank Limited DataOpt cc.
23Absa Bank Limited Debiti Data (Pty) Limited
24Absa Bank Limited Easydebit
25Absa Bank Limited EEZIPAY MANAGEMENT SYSTEMS PTY LTD
26Absa Bank Limited Emerge Mobile (RF) (Pty) Ltd
27Absa Bank Limited Finclude Technologies (Pty) Ltd
28Absa Bank Limited Fintec Labs (Pty) Ltd
29Absa Bank Limited Flash Mobile Vending (PTY) Ltd t/a Flash
30Absa Bank Limited Flexifusions (PTY) LTD.
31Absa Bank Limited Hyphen Technology (Pty) Ltd
32Absa Bank Limited Insure Group Managers Ltd.
33Absa Bank Limited Intelento
34Absa Bank Limited ISP CASH (PTY) Ltd
35Absa Bank Limited Iteiga Technologies (pty)LTD
36Absa Bank Limited Jarvis Solutions (PTY) Ltd.
37Absa Bank Limited Keyfleet Management Systems (Pty) Ltd
38Absa Bank Limited Kianga Trading (PTY) Ltd
39Absa Bank Limited Kingdom Administration (Pty) Ltd.
40Absa Bank Limited Maravedi Credit Solutions (Pty) Ltd80

TPPPs
No. Bank Institution
41Absa Bank Limited Massdiscounters (Pty) Limited
42Absa Bank Limited MCash South Africa Ltd.
43Absa Bank Limited
MediKredit Integrated Healthcare Solutions
(Pty) Ltd
44Absa Bank Limited Mobile Merchant (Pty) Ltd
45Absa Bank Limited MyGate Communications (Pty) Ltd
46Absa Bank Limited netUP
47Absa Bank Limited Ntsele Systems (Pty) Ltd
48Absa Bank Limited Opengate Technolgies
49Absa Bank Limited Pay At Services (Pty) Ltd
50Absa Bank Limited PayFast (PTY) Ltd.
51Absa Bank Limited Paysoft Pty. Ltd.
52Absa Bank Limited PayU Payment Solutions (Pty) Ltd
53Absa Bank Limited PEP A Division of Pepkor Trading (Pty) Ltd
54Absa Bank Limited Product Credit Solutions
55Absa Bank Limited ProPay (Pty) Ltd.
56Absa Bank Limited Property Payment Solutions
57Absa Bank Limited Q Link Holdings Pty Ltd
58Absa Bank Limited Q-Mart (Pty) Ltd.
59Absa Bank Limited Quandovax (Pty) Ltd.
60Absa Bank Limited Real Pay Marketing (PTY) Ltd.
Organisations registered with PASA
TPPPs
No. Bank Institution
61Absa Bank Limited Rental Connect Pty Ltd
62Absa Bank Limited Retriever Fintech (PTY) Ltd.
63Absa Bank Limited Rock Solid Network cc
64Absa Bank Limited Saicom Payphones (Pty) Ltd
65Absa Bank Limited Sanceda Collections Services
66Absa Bank Limited Sanlam Life Insurance Limited t/a Multi-Data
67Absa Bank Limited Shoprite Checkers (Pty) Ltd
68Absa Bank Limited Smartec Technologies
69Absa Bank Limited Snappy (Pty) Limited
70Absa Bank Limited
SOUTH AFRICAN PAYMENT EXCHANGE
PTY LTD
71Absa Bank Limited Spazapp Systems (PTY) Ltd
72Absa Bank Limited Strata Healthcare Management (Pty) Ltd.
73Absa Bank Limited StratCol Ltd
74Absa Bank Limited Stratcol Premium Collections (Pty) Ltd.
75Absa Bank Limited Sureswipe Proprietay Limited
76Absa Bank Limited SWAP Mobile (Pty) Ltd
77Absa Bank Limited Talentbase (Pty) Ltd
78Absa Bank Limited TMT Services and Supplies (Pty) Ltd
79Absa Bank Limited Top it Up
80Absa Bank Limited
Transaction Capital Payment Solutions (Pty)
Ltd81
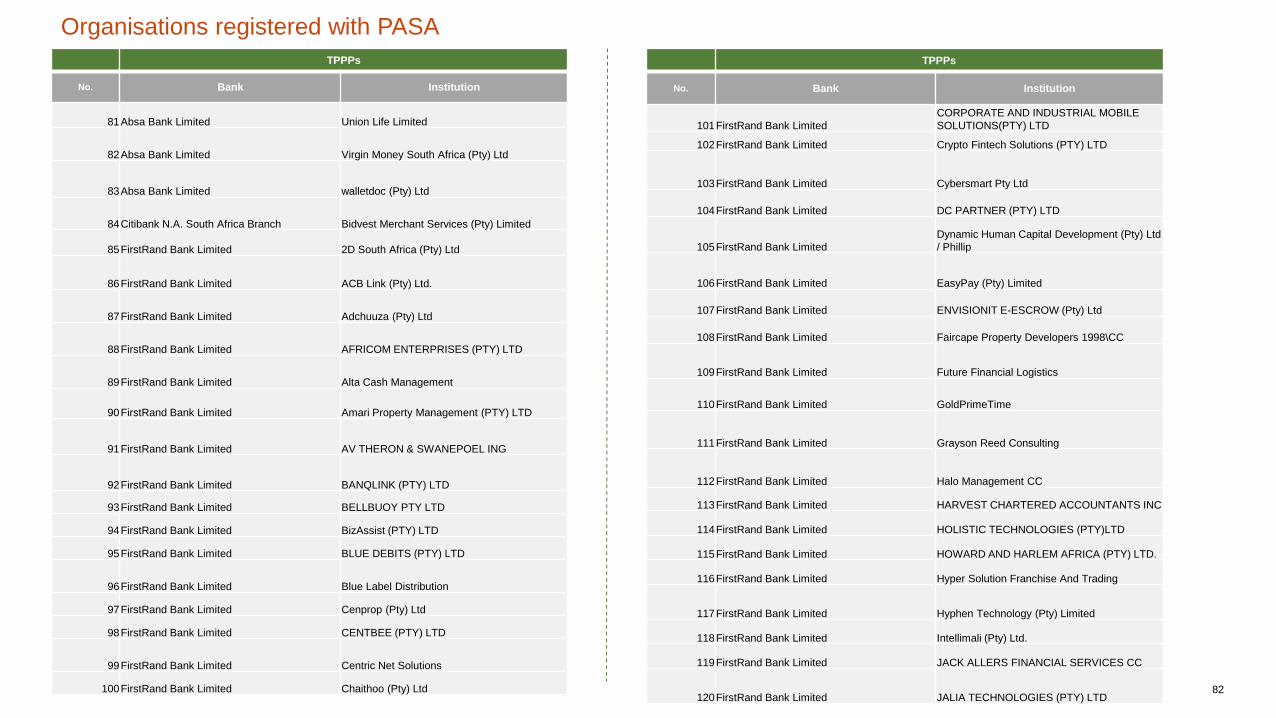
TPPPs
No. Bank Institution
81Absa Bank Limited Union Life Limited
82Absa Bank Limited Virgin Money South Africa (Pty) Ltd
83Absa Bank Limited walletdoc (Pty) Ltd
84Citibank N.A. South Africa Branch Bidvest Merchant Services (Pty) Limited
85FirstRand Bank Limited 2D South Africa (Pty) Ltd
86FirstRand Bank Limited ACB Link (Pty) Ltd.
87FirstRand Bank Limited Adchuuza (Pty) Ltd
88FirstRand Bank Limited AFRICOM ENTERPRISES (PTY) LTD
89FirstRand Bank Limited Alta Cash Management
90FirstRand Bank Limited Amari Property Management (PTY) LTD
91FirstRand Bank Limited AV THERON & SWANEPOEL ING
92FirstRand Bank Limited BANQLINK (PTY) LTD
93FirstRand Bank Limited BELLBUOY PTY LTD
94FirstRand Bank Limited BizAssist (PTY) LTD
95FirstRand Bank Limited BLUE DEBITS (PTY) LTD
96FirstRand Bank Limited Blue Label Distribution
97FirstRand Bank Limited Cenprop (Pty) Ltd
98FirstRand Bank Limited CENTBEE (PTY) LTD
99FirstRand Bank Limited Centric Net Solutions
100FirstRand Bank Limited Chaithoo (Pty) Ltd
Organisations registered with PASA
TPPPs
No. Bank Institution
101FirstRand Bank Limited
CORPORATE AND INDUSTRIAL MOBILE
SOLUTIONS(PTY) LTD
102FirstRand Bank Limited Crypto Fintech Solutions (PTY) LTD
103FirstRand Bank Limited Cybersmart Pty Ltd
104FirstRand Bank Limited DC PARTNER (PTY) LTD
105FirstRand Bank Limited
Dynamic Human Capital Development (Pty) Ltd
/ Phillip
106FirstRand Bank Limited EasyPay (Pty) Limited
107FirstRand Bank Limited ENVISIONIT E-ESCROW (Pty) Ltd
108FirstRand Bank Limited Faircape Property Developers 1998\CC
109FirstRand Bank Limited Future Financial Logistics
110FirstRand Bank Limited GoldPrimeTime
111FirstRand Bank Limited Grayson Reed Consulting
112FirstRand Bank Limited Halo Management CC
113FirstRand Bank Limited HARVEST CHARTERED ACCOUNTANTS INC
114FirstRand Bank Limited HOLISTIC TECHNOLOGIES (PTY)LTD
115FirstRand Bank Limited HOWARD AND HARLEM AFRICA (PTY) LTD.
116FirstRand Bank Limited Hyper Solution Franchise And Trading
117FirstRand Bank Limited Hyphen Technology (Pty) Limited
118FirstRand Bank Limited Intellimali (Pty) Ltd.
119FirstRand Bank Limited JACK ALLERS FINANCIAL SERVICES CC
120FirstRand Bank Limited JALIA TECHNOLOGIES (PTY) LTD82
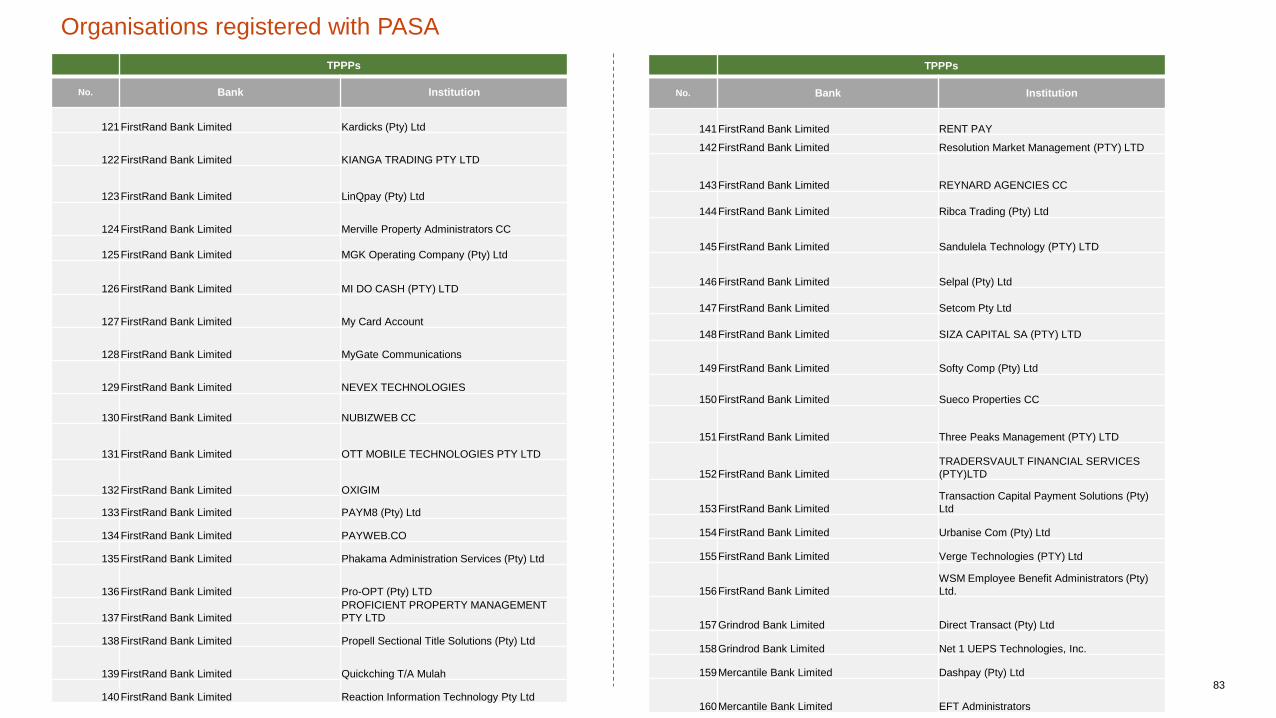
TPPPs
No. Bank Institution
121FirstRand Bank Limited Kardicks (Pty) Ltd
122FirstRand Bank Limited KIANGA TRADING PTY LTD
123FirstRand Bank Limited LinQpay (Pty) Ltd
124FirstRand Bank Limited Merville Property Administrators CC
125FirstRand Bank Limited MGK Operating Company (Pty) Ltd
126FirstRand Bank Limited MI DO CASH (PTY) LTD
127FirstRand Bank Limited My Card Account
128FirstRand Bank Limited MyGate Communications
129FirstRand Bank Limited NEVEX TECHNOLOGIES
130FirstRand Bank Limited NUBIZWEB CC
131FirstRand Bank Limited OTT MOBILE TECHNOLOGIES PTY LTD
132FirstRand Bank Limited OXIGIM
133FirstRand Bank Limited PAYM8 (Pty) Ltd
134FirstRand Bank Limited PAYWEB.CO
135FirstRand Bank Limited Phakama Administration Services (Pty) Ltd
136FirstRand Bank Limited Pro-OPT (Pty) LTD
137FirstRand Bank Limited
PROFICIENT PROPERTY MANAGEMENT
PTY LTD
138FirstRand Bank Limited Propell Sectional Title Solutions (Pty) Ltd
139FirstRand Bank Limited Quickching T/A Mulah
140FirstRand Bank Limited Reaction Information Technology Pty Ltd
Organisations registered with PASA
TPPPs
No. Bank Institution
141FirstRand Bank Limited RENT PAY
142FirstRand Bank Limited Resolution Market Management (PTY) LTD
143FirstRand Bank Limited REYNARD AGENCIES CC
144FirstRand Bank Limited Ribca Trading (Pty) Ltd
145FirstRand Bank Limited Sandulela Technology (PTY) LTD
146FirstRand Bank Limited Selpal (Pty) Ltd
147FirstRand Bank Limited Setcom Pty Ltd
148FirstRand Bank Limited SIZA CAPITAL SA (PTY) LTD
149FirstRand Bank Limited Softy Comp (Pty) Ltd
150FirstRand Bank Limited Sueco Properties CC
151FirstRand Bank Limited Three Peaks Management (PTY) LTD
152FirstRand Bank Limited
TRADERSVAULT FINANCIAL SERVICES
(PTY)LTD
153FirstRand Bank Limited
Transaction Capital Payment Solutions (Pty)
Ltd
154FirstRand Bank Limited Urbanise Com (Pty) Ltd
155FirstRand Bank Limited Verge Technologies (PTY) Ltd
156FirstRand Bank Limited
WSM Employee Benefit Administrators (Pty)
Ltd.
157Grindrod Bank Limited Direct Transact (Pty) Ltd
158Grindrod Bank Limited Net 1 UEPS Technologies, Inc.
159Mercantile Bank Limited Dashpay (Pty) Ltd
160Mercantile Bank Limited EFT Administrators
83

TPPPs
No. Bank Institution
161Mercantile Bank Limited Iconaf Pty Ltd
162Mercantile Bank Limited INFOBOLT (PTY) LTD
163Mercantile Bank Limited Insure Group Managers Ltd
164Mercantile Bank Limited Linkserv
165Mercantile Bank Limited Mercantile Payment Solutions Pty Ltd
166Mercantile Bank Limited MHA Management Holdings Pty Ltd
167Mercantile Bank Limited PLATINUM LIFE (PTY) LTD
168Mercantile Bank Limited Proraiz Pty Ltd
169Mercantile Bank Limited Sage Pay Pty Ltd
170Mercantile Bank Limited Wirecard Africa Holdings (Pty) Ltd
171Mercantile Bank Limited YOCO Technologies (Pty) Ltd
172Nedbank Limited *ECOM INVESTMENT HOLDINGS (PTY) LTD
173Nedbank Limited AddPay Trust
174Nedbank Limited ADO Manufacturing (Pty) Ltd
175Nedbank Limited AH Financial Services
176Nedbank Limited Allxs Media Pty Ltd 2007/031085/07
177Nedbank Limited BUPHE INVESTMENT CORPORATIONS
178Nedbank Limited EasyPay Pty Ltd
179Nedbank Limited
EDUCATION PAYMENT SOLUTIONS LTD
PTY
180Nedbank Limited Fulcrum Collections Pty Ltd
Organisations registered with PASA
TPPPs
No. Bank Institution
181Nedbank Limited Hello Finance (Pty)Ltd
182Nedbank Limited i-Pay Secure Payment Pty Ltd
183Nedbank Limited IS-Administrators (Pty) Ltd
184Nedbank Limited Manny Gurran and Son's Pty Ltd
185Nedbank Limited National Payment Distribution Agency
186Nedbank Limited
Net1 Applied Technologies South Africa (PTY)
Ltd
187Nedbank Limited Net1 FIHRST Holdings (Pty) Ltd
188Nedbank Limited Payaccsys Services (Pty) Ltd
189Nedbank Limited PAYZ Net (Pty) Ltd 2019/023650/07
190Nedbank Limited
PHAKAMA ADMINISTRATION SERVICE
(PTY) LTD
191Nedbank Limited PWV INSURANCE BROKERS (PTY) LTD
192Nedbank Limited SA Payment Exchange Pty Ltd
193Nedbank Limited
South African Bankers Services Company
Proprietary Limited
194Nedbank Limited StratCol
195Nedbank Limited SwitchPay (Pty) Ltd
196Nedbank Limited Syntell (PTY) Ltd
197Nedbank Limited Ziyabuya Staffing Solutions (Pty) Ltd
198Sasfin Bank Limited Face value ZA Credits (Pty) Ltd
199Sponsored non-bank by ABSA Nomad Information Systems
200The South African Bank of Athens Limited Direct Transact (Pty) Ltd 84
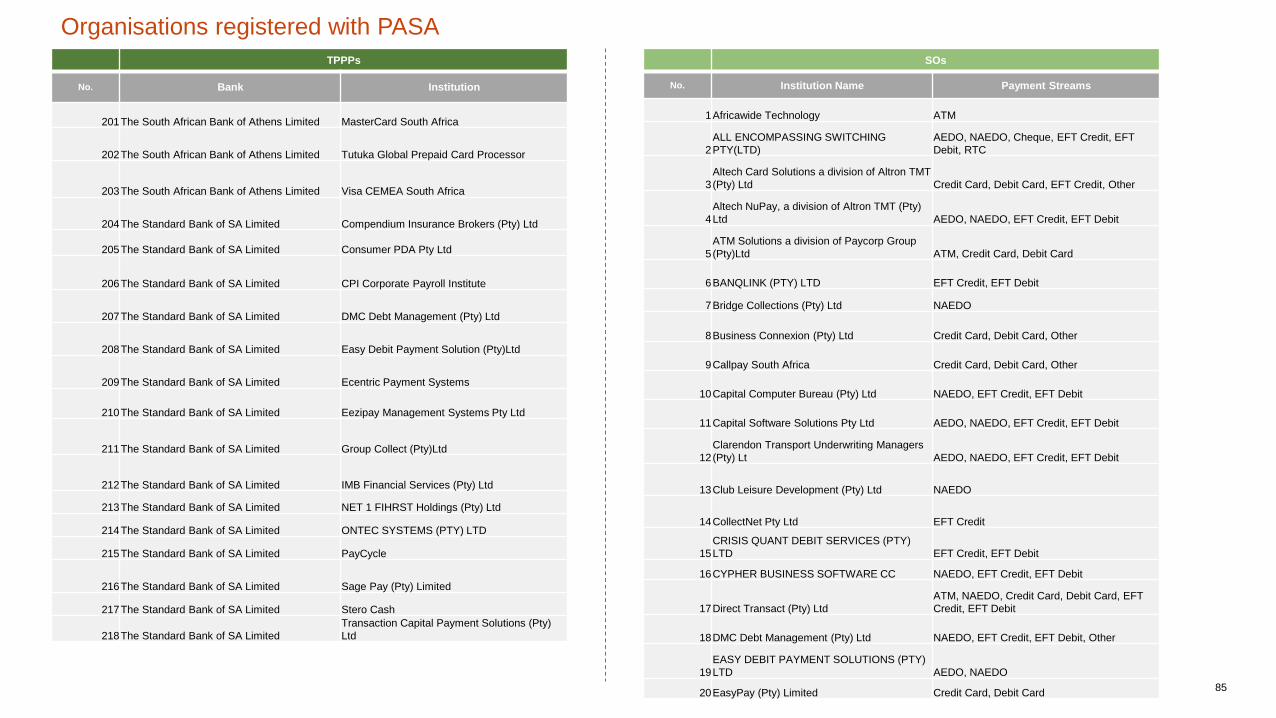
TPPPs
No. Bank Institution
201The South African Bank of Athens Limited MasterCard South Africa
202The South African Bank of Athens Limited Tutuka Global Prepaid Card Processor
203The South African Bank of Athens Limited Visa CEMEA South Africa
204The Standard Bank of SA Limited Compendium Insurance Brokers (Pty) Ltd
205The Standard Bank of SA Limited Consumer PDA Pty Ltd
206The Standard Bank of SA Limited CPI Corporate Payroll Institute
207The Standard Bank of SA Limited DMC Debt Management (Pty) Ltd
208The Standard Bank of SA Limited Easy Debit Payment Solution (Pty)Ltd
209The Standard Bank of SA Limited Ecentric Payment Systems
210The Standard Bank of SA Limited Eezipay Management Systems Pty Ltd
211The Standard Bank of SA Limited Group Collect (Pty)Ltd
212The Standard Bank of SA Limited IMB Financial Services (Pty) Ltd
213The Standard Bank of SA Limited NET 1 FIHRST Holdings (Pty) Ltd
214The Standard Bank of SA Limited ONTEC SYSTEMS (PTY) LTD
215The Standard Bank of SA Limited PayCycle
216The Standard Bank of SA Limited Sage Pay (Pty) Limited
217The Standard Bank of SA Limited Stero Cash
218The Standard Bank of SA Limited
Transaction Capital Payment Solutions (Pty)
Ltd
Organisations registered with PASA
SOs
No. Institution Name Payment Streams
1Africawide Technology ATM
2
ALL ENCOMPASSING SWITCHING
PTY(LTD)
AEDO, NAEDO, Cheque, EFT Credit, EFT
Debit, RTC
3
Altech Card Solutions a division of Altron TMT
(Pty) Ltd Credit Card, Debit Card, EFT Credit, Other
4
Altech NuPay, a division of Altron TMT (Pty)
Ltd AEDO, NAEDO, EFT Credit, EFT Debit
5
ATM Solutions a division of Paycorp Group
(Pty)Ltd ATM, Credit Card, Debit Card
6BANQLINK (PTY) LTD EFT Credit, EFT Debit
7Bridge Collections (Pty) Ltd NAEDO
8Business Connexion (Pty) Ltd Credit Card, Debit Card, Other
9Callpay South Africa Credit Card, Debit Card, Other
10Capital Computer Bureau (Pty) Ltd NAEDO, EFT Credit, EFT Debit
11Capital Software Solutions Pty Ltd AEDO, NAEDO, EFT Credit, EFT Debit
12
Clarendon Transport Underwriting Managers
(Pty) Lt AEDO, NAEDO, EFT Credit, EFT Debit
13Club Leisure Development (Pty) Ltd NAEDO
14CollectNet Pty Ltd EFT Credit
15
CRISIS QUANT DEBIT SERVICES (PTY)
LTD EFT Credit, EFT Debit
16CYPHER BUSINESS SOFTWARE CC NAEDO, EFT Credit, EFT Debit
17Direct Transact (Pty) Ltd
ATM, NAEDO, Credit Card, Debit Card, EFT
Credit, EFT Debit
18DMC Debt Management (Pty) Ltd NAEDO, EFT Credit, EFT Debit, Other
19
EASY DEBIT PAYMENT SOLUTIONS (PTY)
LTD AEDO, NAEDO
20EasyPay (Pty) Limited Credit Card, Debit Card85

Organisations registered with PASASOs
No. Institution Name Payment Streams
41MMI Health (Pty) Ltd EFT Credit, EFT Debit
42Mobipaid Pty Ltd Credit Card, Debit Card
43MyGate Communications Credit Card, EFT Credit, EFT Debit
44
Net1 FIHRST Holdings (Pty) Ltd t/a FIHRST
Management Services EFT Credit, EFT Debit
45netUP Bureaux
46Network International Payment Services Credit Card, Debit Card, Other
47Nevex Technologies ATM, EFT Credit
48Nomad Information System Credit Card, Debit Card, Other
49NuDebt Management (Pty) Ltd NAEDO, EFT Debit
50O'KEEFFE AND SWARTZ BPO (Pty) Ltd AEDO, NAEDO, EFT Credit, EFT Debit
51Olympus Mobile (Proprietary) Limited
ATM, AEDO, NAEDO, Credit Card, Debit Card,
EFT Credit, EFT Debit, RTC
52Pattern Matched Technologies (Pty) Ltd EFT Credit, RTC, Bureaux
53Pay At Services (Pty) Limited EFT Credit, EFT Debit, Other
54Payaccsys Services (Pty) Ltd NAEDO, EFT Credit, EFT Debit
55Paycorp Group (PTY) Ltd ATM
56Paycorp VAS (Pty) Ltd EFT Credit
57PayGate (Pty) Ltd Credit Card
58Paym8 (Pty) Ltd NAEDO, Credit Card, EFT Credit, EFT Debit
59Payon (Pty) Limited t/a PAYLINE Credit Card, Debit Card
60Paysoft (Pty) Limited NAEDO, EFT Credit, EFT Debit
SOs
No. Institution Name Payment Streams
21Ecentric Payment Systems (Pty) Ltd
ATM, Credit Card, Debit Card, EFT Credit, EFT
Debit, Other
22
EFTPOS, a division of Paycorp Group (Pty)
Ltd EFT Credit
23eTranzact Global South Africa Other
24EXXARO RESOURCES LIMITED EFT Debit
25FIDELITY SECURITY (PTY) LTD Other
26Fintec Labs (Pty) Ltd NAEDO, EFT Credit, EFT Debit, RTC, Other
27
FLUTTERWAVE TECHNOLOGY
SOLUTIONS
Credit Card, Debit Card, EFT Credit, EFT
Debit, Other
28FNDS3000 (PTY) LTD Debit Card
29G4S Cash Solutions (SA) (Pty) Ltd Other
30HYPHEN Technology (Pty) Limited
NAEDO, Credit Card, EFT Credit, EFT Debit,
RTC
31 i-Pay Secure Payment Proprietary Limited EFT Credit
32 IMB Financial Services PTY Ltd EFT Credit, EFT Debit
33 Incatorque (Pty) Ltd EFT Credit
34 Information Technology Consultants (Pty) Ltd
ATM, AEDO, NAEDO, EFT Credit, EFT Debit,
Other
35 Innervation Value Added Services (PTY) Ltd Credit Card, Debit Card
36 Integrated Processing Solutions (Pty) ltd IPS Cheque, EFT Credit
37 Internet Filing Trading as Interfile Pty Ltd EFT Credit, EFT Debit
38Kianga Trading (Pty) Ltd NAEDO, EFT Credit, EFT Debit
39Mastercard Southern Africa Pty Ltd Cheque, Credit Card, Debit Card, Other
40Mercantile Payment Solutions Pty Ltd NAEDO, EFT Credit, EFT Debit, Other
86

Organisations registered with PASASOs
No. Institution Name Payment Streams
81Sureswipe Credit Card, Debit Card
82SureSystems (Pty) Ltd AEDO, NAEDO
83The One sp (Pty) Ltd EFT Credit, RTC, Other
84Three Peaks Management (Pty) Ltd EFT Credit, EFT Debit
85Transaction Capital Payment Solutions NAEDO, EFT Credit, EFT Debit
86Transaction Junction (Pty) Ltd ATM, Credit Card, Debit Card
87Trustlink Bureaux
88Tsogatec ( Pty) Ltd Credit Card
89Tutuka Software (Pty) Ltd Debit Card, Other
90Waxed Mobile Payments (Pty) Ltd EFT Credit
91WeconnectU PTY LTD EFT Credit, EFT Debit
92Wirecard Africa Holdings (Pty) Ltd Credit Card, Debit Card, Other
93Xago Technologies(Pty) Ltd EFT Credit, EFT Debit
94XLink Communications (Pty) Ltd Credit Card, Debit Card, Other
95YoMane (Pty) Limited Other
SOs
No. Institution Name Payment Streams
61Payteq ( PTY ) LTD EFT Credit, EFT Debit, RTC
62PayU Payment Solutions (Pty) Ltd Credit Card, Debit Card, EFT Credit, EFT Debit
63Peach Payment Services (Pty) Ltd. Credit Card, Debit Card
64PEXSA Bureaux, Other
65Platinum Life NAEDO, EFT Debit
66PRODUCT CREDIT SOLUTIONS (PTY) LTD NAEDO, EFT Credit, EFT Debit
67Profile Corporate Services (Pty) Ltd EFT Credit, EFT Debit
68Q LINK Holdings (Pty) Ltd NAEDO, EFT Debit
69Real Pay Payment Solutions Pty Ltd NAEDO, EFT Credit, EFT Debit
70Retriever Fintech (Pty) Ltd NAEDO, EFT Credit, EFT Debit
71Sage Pay (Pty) Ltd NAEDO, Credit Card, EFT Credit, EFT Debit
72Sanlam Life Insurance Limited t/a Multi-Data NAEDO, EFT Credit, EFT Debit, RTC
73SBV Services (Pty) Ltd EFT Credit
74Setcom (Pty) Ltd Credit Card, EFT Credit
75SmartPurse Solutions (Pty) Ltd Debit Card
76Softy Comp NAEDO, EFT Credit, EFT Debit
77South African Bankers Services Cheque, Other
78South African Payment Exchange (Pty) LTD NAEDO, EFT Credit, EFT Debit
79Spark ATM Systems (PTY) LTD ATM
80StratCol Limited NAEDO, Credit Card, EFT Credit, EFT Debit87

Cryptocurrency market players
No. Organisation Name Sub-segment Location Website
1Affinity Mining Crypto currency trading Johannesburghttps://www.affinitymining.co.za/
2Bitcom.com Crypto currency trading SAhttps://www.bitcom.com/
3BitPesa Crypto-payments SA https://www.bitpesa.co/
4CentBee Crypto-payments USA, SA https://www.centbee.com/
5chainex Crypto currency trading SA https://chainex.io/about
6CoinBR Crypto currency trading Brazil, SAwww.coinbr.net/
7coindirect Crypto currency trading SA https://www.coindirect.com/za/
8Cubebucks Crypto-payments UK, SA http://cubebucks.com/
9Dash Crypto-payments International, SA https://www.dash.org/
10Edcoin Cryptocurrency trading International, SA https://www.ed-coin.io/
11 Internet Currency Evolution (ice3X) Cryptocurrency tradingInternational, SA
https://ice3x.com/
12Luno*Cryptocurrency trading
UK, Singapore, SAhttps://www.luno.com/
13Luno*Crypto payments
UK, Singapore, SAhttps://www.luno.com/
14Project Ubu Cryptocurrency trading Johannesburg, Cape Town https://www.projectubu.com/
15ProsperiProp Cryptocurrency trading Canada, SA www.prosperiprop.co.za
16VALR Crypto payments United States https://www.valr.com/about-us
88