
Finlight Research - Market Perspectives - Aug 2016
62
Market Perspectives Aug 2016 Aug. 12 th , 2016 Month II Post-Brexit www.finlightresearch.com Alice in Wonderland
-
Upload
finlight-research -
Category
Economy & Finance
-
view
138 -
download
0
Transcript of Finlight Research - Market Perspectives - Aug 2016

Market PerspectivesAug 2016
Aug. 12th, 2016
Month II Post-Brexit
www.finlightresearch.com
Alice in Wonderland

“My understanding is that there have been
movements that are quite biased, one-sided
and speculator-driven. We will pay the closest
possible attention [to the yen] and watch it
intensely to ensure that speculator-driven
movements won't accelerate, and if
necessary, we will take firm action”– Mr. Asakawa, Japanese vice-minister of
finance for international affairs
2FinLight Research | www.finlightresearch.com

Executive Summary: Global Asset Allocation
� In July, market concerns over the US economy and the Brexitimpact eased, inducing a risk-on environment. the S&P 500 has made new all-time highs, the VIX has fallen, bonds started to sell off, and cyclicals have outperformed defensives.
� Precious metals remain firmly in a bullish trend, supported by a mixture of Fed hold-on posture, NIRP policies, and global uncertainties. Gold outperformance is rarely good news for real growth
� Our biggest concerns relate to the lack of earning growth (earnings recovery keeps getting pushed further into the future), the need for more business confidence, and corporate investment.
� The market remains expensive and needs increased earnings to move higher.
� A key concern at this stage remains the lack of diversification as most safe assets appear too stretched
� Central banks continue their irrational game, with the hope to levitate financial asset prices long enough to allow fundamentals to catch up.
� At this stage, investors appear more afraid of missing out on a rally than getting caught in a selloff
� We make minor adjustments to our asset allocation this month, except on Energy where we’ve turned UW.
� We summarize our views as follows �
3FinLight Research | www.finlightresearch.com

MACRO VIEW
� The Good� China's PMI readings were mixed but not disastrous. The official manufacturing reading
slipped to 49.9 from 50, when the Caixin Manufacturing PMI rose to 50.6 from 48.6 in June. This was the first reading above the 50 threshold in 17 months.
� US jobs number was a strong one. 255k jobs were created in July (versus expectations of 185k). But we see more revisions to the initial estimate that was reported in previous months.
� The Bad� US GDP grew at an anemic rate of 1.2% in Q2. Combined with Q1, US economy is growing at
the slowest rate since 2011� Corporate investment remains moribund� European banks are retreating after the stress test results. � Growth shock from Brexit seems to be completely ignored by the market outside of the UK� Profit margins seem more vulnerable than ever
� The Ugly � Main systemic risk resides in China: China is not recovering but rather just re-leveraging.
Chinese debt bomb is ticking. Debt is used to create the illusion of growth. The Chinese banking sector is going to end up needing a bailout.
� Something huge is probably gathering in Japan: Abenomics has failed! Contrary to every economic theory, debt accumulation, debt monetization and record amounts of currency creation have resulted in a rising yen and falling prices.
4FinLight Research | www.finlightresearch.com

5FinLight Research | www.finlightresearch.com
Any Brexit Effect?
� The common belief is that direct impact of Brexit on US / European corporate profitability will likely be contained.
� Brexit is more and more appearing as a UK confined shock.
� Based on JP Morgan economic activity surprise indices, any global contagion seems hard to detect, at this stage
� We feel cautious about the apparent resilience of the Eurozone economy.
� We fear the second order effects due to contagion through political, economic and financial channels

6FinLight Research | www.finlightresearch.com
US Macro Data
� Despite the last sluggish US GDP reading, US macro data have been better than expected over the last few weeks.
� JP Morgan Economic Data Surprise Index is now close to its highest level since the mid-2015
� It’s however worth noting that these positive macro surprises may be partly due to lowered expectations after the Brexit shock.

7FinLight Research | www.finlightresearch.com
US Durable / Capital Goods
� Durable goods orders plunged 6.4% YoY (and 4%in June).
� The picture of business capital spendingremains ugly.
� Capital spending has now contracted for 3consecutive quarters, for the first time since theGFC.
� Orders for non-defense capital goodsexcluding aircraft was down 3.8% YoY(and only +0.2% in June)
� Capital spending continues to contractin lieu of stock buybacks and otherforms of financial engineering
� These trends in fixed and private non-residential investment seem to point to alower employment.

8FinLight Research | www.finlightresearch.com
Inventories & Growth
� The consensus expects thedecline in inventories to feedproduction, employment andgrowth.
� The issue with this assumptionis the inventories-to-sales ratiois still too high, implying acontinued reduction ininventories and a lower growth.

9FinLight Research | www.finlightresearch.com
US Employment
� US jobs number was astrong one.
� 255k jobs were created in July(versus expectations of 185k).
� However, we see morenegative revisions to theinitial estimate that wasreported in previous months.

10FinLight Research | www.finlightresearch.com
US Employment
� Four out of the five months (till May) of this year have seendownward revisions, with an average revision at -10,000jobs.
� Last year we saw 7 negative revisions, the most since 2008.
� We see these negative revisions as a warning signal. Aturning point is probably in place for employment andgrowth.
Mean
revision
Negative
months
2016 -10,000 4 out of 5
2015 -4,000 7
2014 37,000 1
2013 21,000 4
2012 24,000 3
2011 28,000 3
2010 40,000 1
2009 12,000 4
2008 -73,000 11
2007 5,000 6
2006 23,000 5
2005 31,000 3
2004 21,000 4
Source: Fuller AM

11FinLight Research | www.finlightresearch.com
The Big Four Economic Indicators
� Industrial Production has been the weakest link in the economic recovery since the GFC� The current picture is characterized by relatively strong Employment and Income, a weak Industrial
Production (down in 8 of the last 12 months) and Real Retail Sales hovering around a flat line.
� The average of these indicators has been trending lower since Nov. ‘14, suggesting that the economy is still moving sideways.

12FinLight Research | www.finlightresearch.com
GS – Global Leading Indicator (GLI)
� The July Final GLI came in at2.4%yoy. Its MoM momentumcame at 0.34% (close to itslast month’s 0.36%)
� GLI has been in expansionaryterritory since September2015, and seems now to beheading towards “Slowdown”
� Only five of the ten underlyingcomponents of the GLIimproved in July
� We continue to think that theacceleration we’ve beenwitnessing since Jan. ‘15 isquite modest for a typicalexpansion phase

13FinLight Research | www.finlightresearch.com
EQUITY
� Global stock valuations appear stretched while volatility has fallen
� With easy liquidity, stocks hit new all-time highs, when earnings continue to be revised to the down side.For now, it appears that fundamentals no longer matter… Price momentum and trend remain strong,although we are in a seasonally weak period.
� The US earnings season also proved better than feared Earnings beat rates appear high. But, companies are currently beating estimates mostly because those estimates had been significantly lowered at the beginning of2016.
� Furthermore, a stronger dollar will induce another headwind to already weak earnings
� Other data points to some sort of corrective action over the next two months. Some sentiment indicators(high NAAIM Exposure Index, low CBOE put/call ratio, low Inverse ETF volumes) are cause for concern.We are seeing levels of euphoria and complacency worthy of (at least) an intermediate markettop.
� Capital spending continues to contract and to be replaced by stock buybacks and other forms of financialengineering.

14FinLight Research | www.finlightresearch.com
EQUITY
� Despite our OW (tactical) positioning, our equity outlook remains cautious. We see the marketmore vulnerable than ever to growth and policy disappointments.
� We still think that key fundamental data will eventually matter… in a BIG BIG way. For now,investors are buying the rumor of better future earnings. One day, they will be selling the news of badeffective earnings.
� We keep the same scenarios, but lower the probability attached to the primary one.
� Our main scenario from here (70% chance) : A massive top forming around the current levels� Equities remain expensive, earnings growth poor and profit margins are showing increasing
evidence of peaking. On Price/Sales metric, equities are trading at the top of the historical range. � A resumption of earnings growth going into 2016 will be necessary for equities to move higher.
� Our alternative scenario (30% chance) : The S&P500 breaks the 2170 resistance, opening the way to 2225 - 2300. Such a breakout would need a new round of stimulus and/or a new impulse to macro fundamentals
� A pull back below 2155 is needed in order to confirm our primary scenario!� Above 2225, we’ll be obliged to recognize the alternative scenario is in.

15FinLight Research | www.finlightresearch.com
EQUITY
� Bottom line :
� De-risking should continue. A higher allocation to cash is sensible in this late-stage stock bull.� We adjust our positioning rules on the S&P 500 as follows:
� We remain OW as long as the 2155 level is preserved. � We will turn Neutral if the spot breaks below the 2150-2155 range� We will switch to UW as soon as the 2000 – 2010 range is materially broken to the downside. � Any clean break below the ‘09 trend would make us move massively UW
� We like the low US beta. As expected, US equities proved more resilient than their Eurozone counterparts as the Fed kept its dovish stance. We remain Neutral Japan and UW Europe vs. US.
� We remain UW in US small caps vs large caps. � We remain OW defensive, high dividend and value stocks vs. cyclical stocks.
� We remain UW EMs vs DMs despite the recent EM outperformance and robust flows going into EM Equities (since the start of July). � An “on hold” Fed and a range bounded US dollar is positive for EM sentiment� But, we see risks to the downside. We expect another (last) leg of USD strengthening.
Negative spillovers from China (and RMB one-off devaluation) will also likely have a strong impact on other EMs.

16FinLight Research | www.finlightresearch.com
US Earnings
� The S&P500 stands within an earnings recession.
� For Q2 2016, the estimated earnings decline is -3.5% YoY (+0.4% if energy is excluded), marking the first time the index has seen 5 consecutive quarters of YoY declines in earnings since 2008/2009
� For all of 2016, the estimated S&P 500 growth rate is now projected at -0.4% for earnings and +1.7% for revenues.
� For Q3-2016, 62 companies have issued negative EPS guidance and 28 companies have issued positive EPS guidance
� Analysts still expect earnings growth and revenue growth to return in the second half of 2016

17FinLight Research | www.finlightresearch.com
US Earnings
� Earnings recovery is getting pushed further into the future
� Trailing Twelve Month EPS on the S&P500 reached a top in Q3-2014 (around $106) and have been down since. Q3 2016 TTM EPS is expected to be only $92
� EPS growth for Q3 2016 was expected at +11% in Mar. ‘16. It’s now flat.

18FinLight Research | www.finlightresearch.com
US Earnings
� Based on JP Morgan model for expected EPS growth, we see realized EPS growth (over next 5 years) on a negative slope for the coming months / years
� EPS growth should be flat for the period 2015 – 2020, and negative over 2016-2021

19
EMU vs US Equity Valuation
� European forward PEs appear relatively low relative when compared to the US …
� But European stocks are not ascheap as they look, as earningsexpectations continue to berevised down and the effects ofEuro depreciation fade.
� Thus, we remain UW Europevs. US
FinLight Research | www.finlightresearch.com

20FinLight Research | www.finlightresearch.com
Market Sentiment - Risk Appetite
� According to Deutsche Bank’s risk appetite indicator, US equity market is somewhere between complacency an mania, as of and of July.

21FinLight Research | www.finlightresearch.com
Market Sentiment – Inverse ETF Volume
� Inverse ETF volume has dropped to very low levels (2nd lowest level in more than 5 years), which � was historically a signal of market
peaks.� might be another sign of
complacency

22FinLight Research | www.finlightresearch.com
Market Sentiment – VIX Index
� Another sign of complacency and euphoria: The VIX index is back to levels last seen in August of last year, even as the market enters a period historically known for its turbulences.
� Usually, volatility does not last long at current levels and tends to bounce in sharp spikes.
� Going long VIX could be done through the volatility ETF $VXX despite its negative carry (because we feel confident this is the right timing). Current level = $37. Target = $50. Stop @ $33
� A safer (but less exciting) way to do it, is to buy the UBS ETRACS Daily Long-Short VIX ETN (XVIX). It is basically long 100% the VIX Mid-Term Futures index Excess Return, mitigated by a short 50% the VIX Short-Term Futures index Excess Return
23
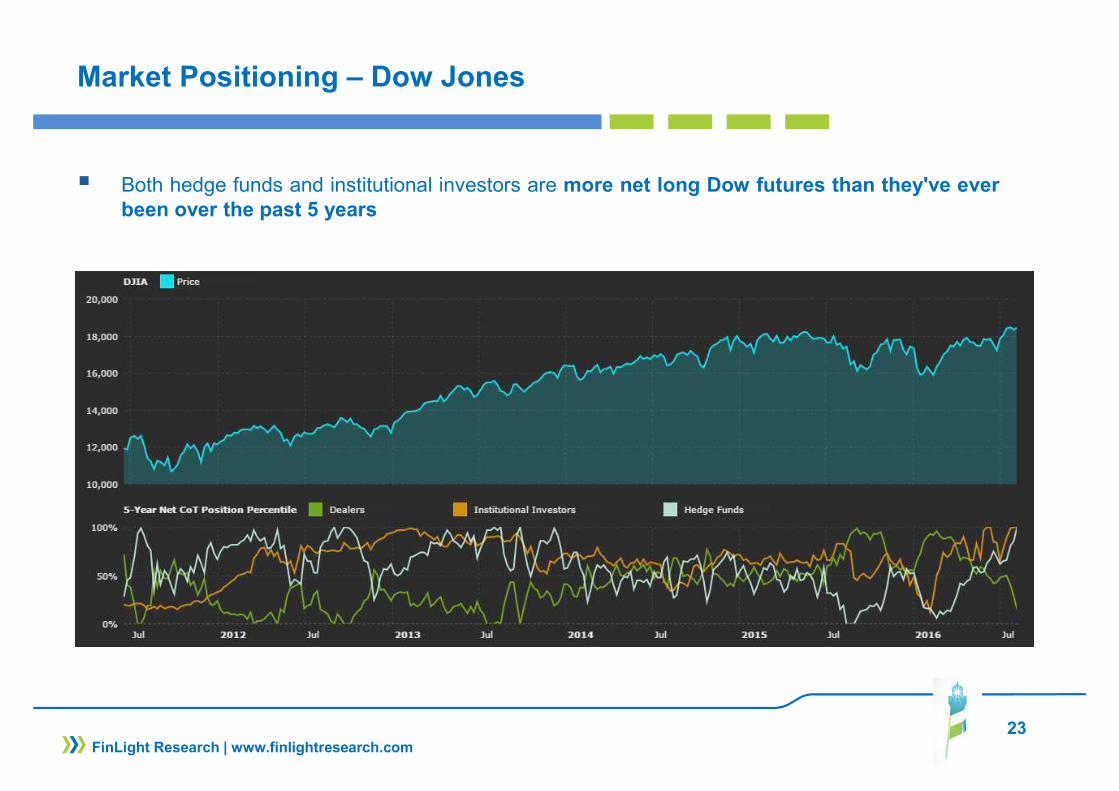
Market Positioning – Dow Jones
� Both hedge funds and institutional investors are more net long Dow futures than they've everbeen over the past 5 years
FinLight Research | www.finlightresearch.com

24
Market Positioning – VIX
� In the same time, hedge funds are very short VIX futures
FinLight Research | www.finlightresearch.com

25FinLight Research | www.finlightresearch.com
S&P500 – A Long-Term Perspective
� Despite the fact that we’re running into 5 straight quarters of earnings contraction, the S&P500 is making new all-time highs.
� Equity markets still appear at lofty valuations, whatever the valuation metric we use.
� All these indicators suggest a cautious long-term outlook and weak long-term return expectations � These measures are consistent with flat (0%) 12 year S&P 500 nominal total returns

26FinLight Research | www.finlightresearch.com
S&P 500 – A Medium-Term Perspective
� In our previous report, we said: “For now, we stay OW, as we see the index ready to resume its uptrend. We expect a final leg up (target ~ 2160 - 2170!).”
� Our target was reached and exceeded.
� We remain OW as long as the 2155 level is preserved.
� From here, we will turn Neutral if the spot breaks below the 2150-2155 range
� We will switch to UW as soon as the 2000 – 2010 range is materially broken to the downside.

27FinLight Research | www.finlightresearch.com
S&P500 – A Short-Term Perspective
� Our prop. Short-Term trading model has no strong conviction, for now
� Since Jun 30 (SPX @ 2098.86), the model has been flat to modestly short, targeting 2083 and 2062
600.0
800.0
1000.0
1200.0
1400.0
1600.0
1800.0
2000.0
2200.0
2400.0
39000.0
41000.0
43000.0
45000.0
47000.0
49000.0
51000.0
53000.0
janv.-06 sept.-08 juin-11 mars-14 déc.-16
S&
P 5
00
NA
V
Quant Model
S&P500
28
FIXED INCOME & CREDIT
GOVIES & INFLATION-LINKED
� Treasury yields had gotten so oversold due after the Brexit vote that a reversal became necessary
� G3 government yields are inconsistent with fundamentals. Eurozone (like Japanese) yields appear too low when compared to nominal GDP growth.
� In our view, this is a bubble inflated by investors who think that central banks will support such prices indefinitely..
� We continue to think that the ECB and BOJ's experiments with negative interest rates will not end well
� The endgame will be disastrous given the extreme levels reached by valuation and market positioning
� We’ve been OW since the UST 10y yield broke below 1.65 in June. For now, we remain OW.
� Inflation isn't on anyone's radar right now. Inflation expectations haven't moved up yet. Any surprise on the inflation front would make a lot of damage on the market.
� Inflationary signs should be watched closely as they will foreshadow a steepening decline in Govies.
� We remain Neutral 10y-TIPS and HICP Inflation as we expect breakevens to trade sideways from here
FinLight Research | www.finlightresearch.com
29
FIXED INCOME & CREDIT
CORPORATE CREDIT
� Credit spreads tightened significantly on both sides of the Atlantic, in the HY in particular.
� After a brief pause following the Brexit vote, the search for yield is back.
� The demand for corporate bonds is illustrated by their outperformance vs their CDS, with CDS basis at its narrowest levels in more than a year
� The global scarcity of yield should continue to support US HG spreads, as ECB / BoJ continuous easing should push Japanese and European investors to search for yield outside home
� We remain overweight US vs EUR credit (more on IG than HY) because of our fundamentally bearishview on European credit, the relative yield disadvantage and the fact that the re-leveraging cycle looks more mature in the US.
� We keep our bias towards higher quality. Any unpriced rate hike (and/or dollar strengthening) would weigh on low quality bonds (High Yield and EM debt). We remain UW on HY and Neutral on IG.
� We remain, however, concerned about the outlook for the US HY market, where default rates continue to move up and balance sheets are deteriorating. Renewed weakness in oil prices will bring this issue under the spotlights again
� We expect the focus on liquidity to remain. As said in previous reports, we feel concerned about the credit market liquidity as the rate of turnover in corporate bonds has steadily declined since 2009, despite the huge inflows
FinLight Research | www.finlightresearch.com

30
FIXED INCOME & CREDIT
EM DEBT
� The dollar strengthening we still expect would weigh on EM debt
� We remain Neutral on EM bonds, because of all the macro challenges facing the EM economies at a time when the Fed is likely to be more hawkish
� Bottom line : We change nothing to our views : OW Govies, UW US vs Eurozone Govies, remain long flatteners on the US yield curve and short duration in 2y USTs, UW credit mainly through HY and Neutral on IG (duration hedged), UW Eurozone vs US in IG & HY credit, Neutral 10y-TIPS and Neutral HICP Inflation, UW High Yield vs High Grade, Neutral on EM sovereigns with a little preference for local bonds
FinLight Research | www.finlightresearch.com
31
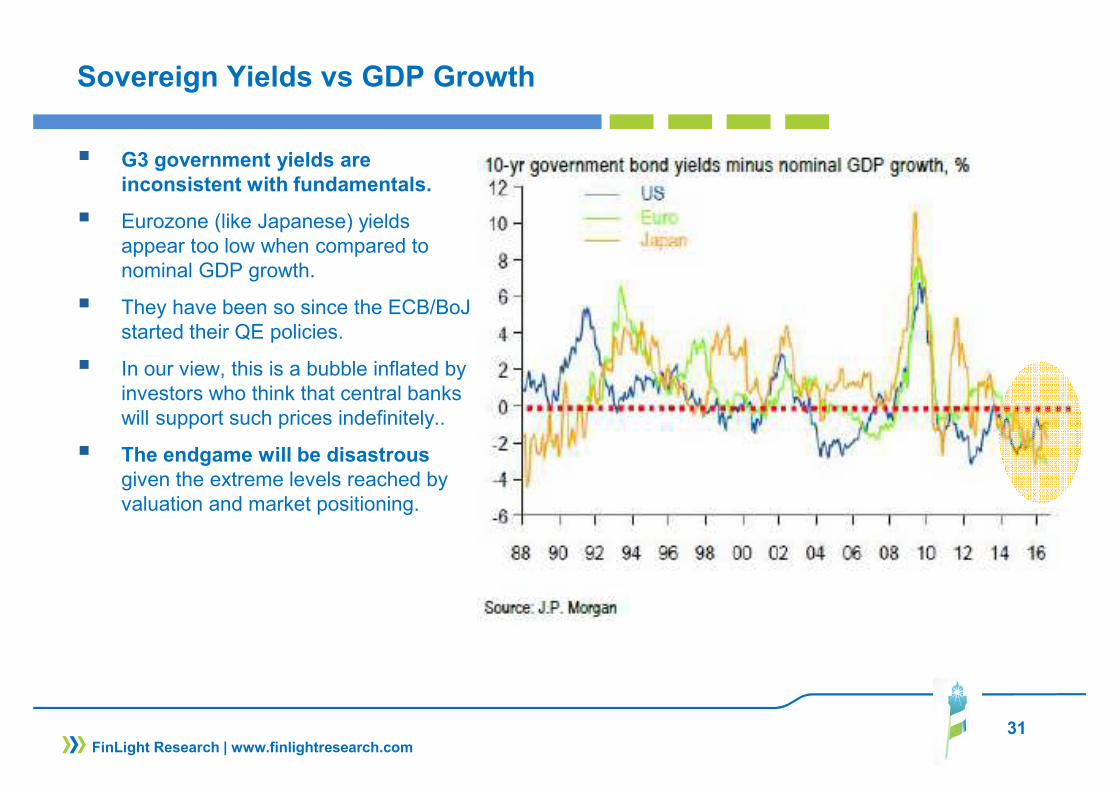
Sovereign Yields vs GDP Growth
� G3 government yields are inconsistent with fundamentals.
� Eurozone (like Japanese) yields appear too low when compared to nominal GDP growth.
� They have been so since the ECB/BoJstarted their QE policies.
� In our view, this is a bubble inflated by investors who think that central banks will support such prices indefinitely..
� The endgame will be disastrous given the extreme levels reached by valuation and market positioning.
FinLight Research | www.finlightresearch.com

32
TED Spread – Liquidity Stress?
� TED Spread is usually used as an indicator of funding market stress. It widens on liquidityissues in the banking sector, and its widening tends to precede market corrections.
� TED spread is currently at levels last seen around Jan. ‘12 and before that in Mar. ‘07.
FinLight Research | www.finlightresearch.com
33
US Govies – ZIRP Impact
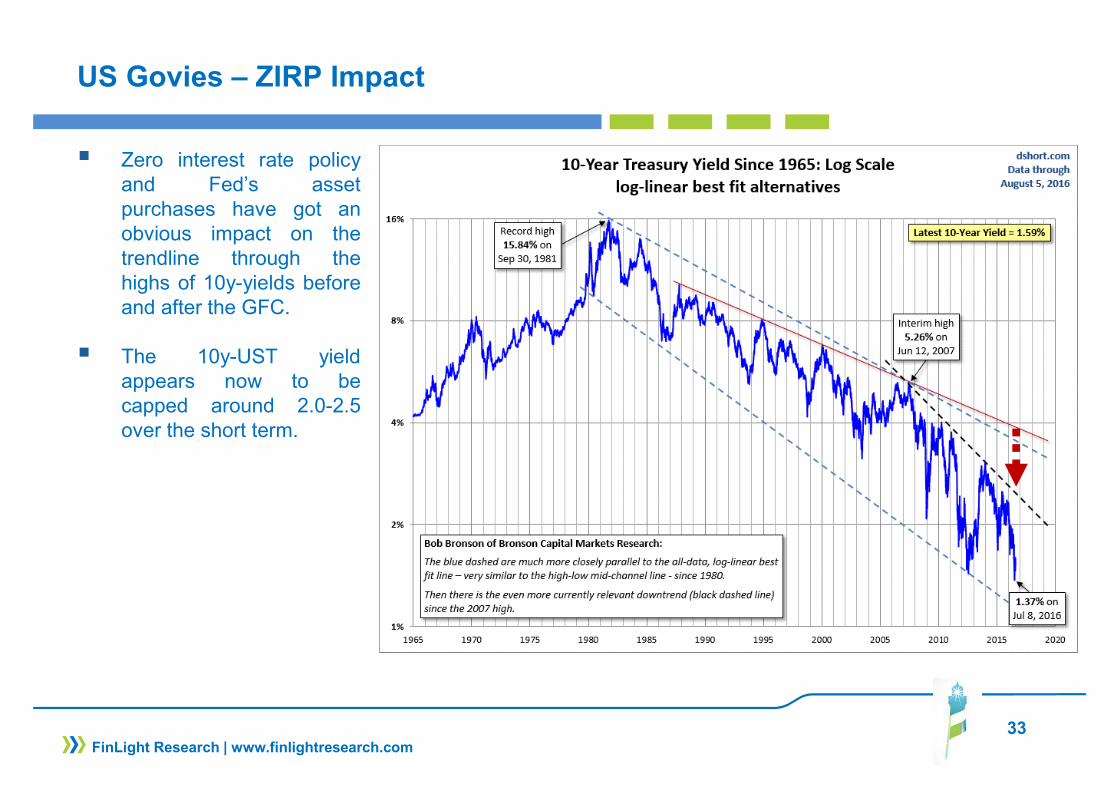
� Zero interest rate policyand Fed’s assetpurchases have got anobvious impact on thetrendline through thehighs of 10y-yields beforeand after the GFC.
� The 10y-UST yieldappears now to becapped around 2.0-2.5over the short term.
FinLight Research | www.finlightresearch.com

34
US Govies – 10y UST
� In June, we moved to OWas the 10y yield brokebelow 1.65.
� Technically speaking, therisk of an impulsive declinehas diminished.
� Our positioning rules remainunchanged:
� We’ll turn Neutral againabove 1.65 and we’ll remainso as long as the 1.90 levelis preserved.
� We’ll move also Neutralaround 1.25-1.28
� Above 1.90, we’ll move toUW.
FinLight Research | www.finlightresearch.com

35
US Govies – Yield Curve Slope
� The big picture remains the same. The UST yield curve continues its flattening.� Over the last weeks, the curve flattened on bad durable goods, then steepened modestly on the
good employment report. But the big trend remains intact.
� We remain long flatteners on the US yield curve and short duration in 2y USTs
FinLight Research | www.finlightresearch.com

36
EUR Credit – Brexit Impact
� Over July, credit spreads tightened significantly on both sides of the Atlantic, in the High Yield segment in particular.
� However, credit has not reached a low in spreads while equity indices are at all-time highs
� In addition, we saw a sharp trend reversal at the end of the month (mainly in the US HY) on the back of falling oil prices.
� For now, we stick to our preference for US vs European credit on growth considerations and Brexit (forgotten) fears
FinLight Research | www.finlightresearch.com
Op
tio
n A
dju
ste
d S
pre
ad
s (
Bp
s)

37
EUR Credit – Brexit Impact
� After the Brexit, the distribution of EUR credit spreads FYE 2016 kept sensibly the same modal.
� But it was clearly twisted to higher spreads (wither a higher mean and a fatter tail)
FinLight Research | www.finlightresearch.com
Distribution of EUR Credit Spread Outlook for FYE 2016

38
CDS Basis
� High Grade CDS-Bond Basis has narrowed to tights last seen in May. ‘15.
� HG bonds are trading only 22bp wide to their CDS, on average.
� The basis tightening could explained by:
� bond outperformance driven by the demand for cash bonds and the search for yield
� the increase in the 5y swap spread(as bond performance is usually monitored versus treasuries)
� This basis normalization is a good sign for bond liquidity.
FinLight Research | www.finlightresearch.com

39
EXCHANGE RATES
� Central banks remain one of the key drivers of foreign exchange,
� The failure of the Fed to hike rates in H1 (and the reluctance of ECB/BoJ for additional easing) haspushed some to suggest that the dollar rally is over. We don’t agree on that. The US economy is in abetter shape than suggested by the Q2 GDP.
� While we remain structural Dollar bulls, the near-term picture looks confusing. US dollar hasn'tbeen able to rally despite the BOJ / ECB interventions and the recent positive employment reports
� In our previous reports, we’ve already moderated our view for the dollar as the (dovish) Fed haskept pressure on it, capping any higher yields attempts. But, we still expect the US dollar to remainon the strong side (vs most DM currencies + Yuan, except the Yen), at least for 2 reasons:
� The large carry differential between the US and other DM markets, combined with negative yieldson Govies in Europe / Japan, is moving money into US Treasuries, pushing the US dollar higheragainst most currencies.
� The flight-to-safety sentiment induced by the Brexit-induced uncertainties
FinLight Research | www.finlightresearch.com

40
EXCHANGE RATES
� Two months ago, we moved to UW on the EUR-USD after the clean break below 1.13.� We remain UW for the moment. We will move to Neutral above 1.14, and to OW if the spot breaks
above the 1.165 resistance to target 1.18� Our positioning rules remain unchanged:
� Move to Neutral within the 1.14 - 1.165 range� Move to OW if the spot breaks above the 1.165 resistance to target 1.18� Remain UW below 1.14. Target = 1.08 and then 1.04 to parity over 2H
� In June, we turned Neutral on USD-JPY as our target of 102 was reached.� For now, we remain Neutral, but we see the risk of continued losses in USD-JPY ahead of the next
BoJ meeting end of Sep. ‘16� Our positioning rules on USD-JPY remain unchanged:
� Remain Neutral below 106.6� Move to OW above� We may turn to UW after a clean break of the 100.30-100.90 resistance area, and target 98-99
� We anticipate that pressure on EM currencies will resume and continue until we see a more constructive / fundamental improvement for global growth and commodities supply/demand imbalances.
� We remain UW EM and Commodity FX
FinLight Research | www.finlightresearch.com

41
Market Positioning - EUR
� Hedge funds appear to be more and more bearish on the euro, when institutional investors are goinglong the currency
FinLight Research | www.finlightresearch.com

42
US Dollar Index
� The US dollar has been in arange over more than a year
� In our previous report, we said:“Next target ~97.10. Only abreak above would open theway towards 99-100…” Ourtarget has been reached, butthe index reversed its course.
� We feel confused by the factthat the dollar hasn't beenable to rally despite the BOJ/ ECB interventions and therecent positive employmentreports.
� On the downside, 92 .7remains the level to watch.Breaking the support level of92.7 to the downside will openthe door to a much moresubstantial correction.
FinLight Research | www.finlightresearch.com

43
EUR-USD
� 2 months ago, we moved to UWon the EUR-USD after the cleanbreak below 1.13.
� We remain UW for the moment.We will move to Neutral above1.14, and to OW if the spotbreaks above the 1.165resistance to target 1.18
� Over the medium-term (2H-2016), we maintain our downsideprojections towards 1.08-1.04-parity. For that, we need a cleanbreak through the 1.0910-1.0981 area.
FinLight Research | www.finlightresearch.com
44
USD-JPY
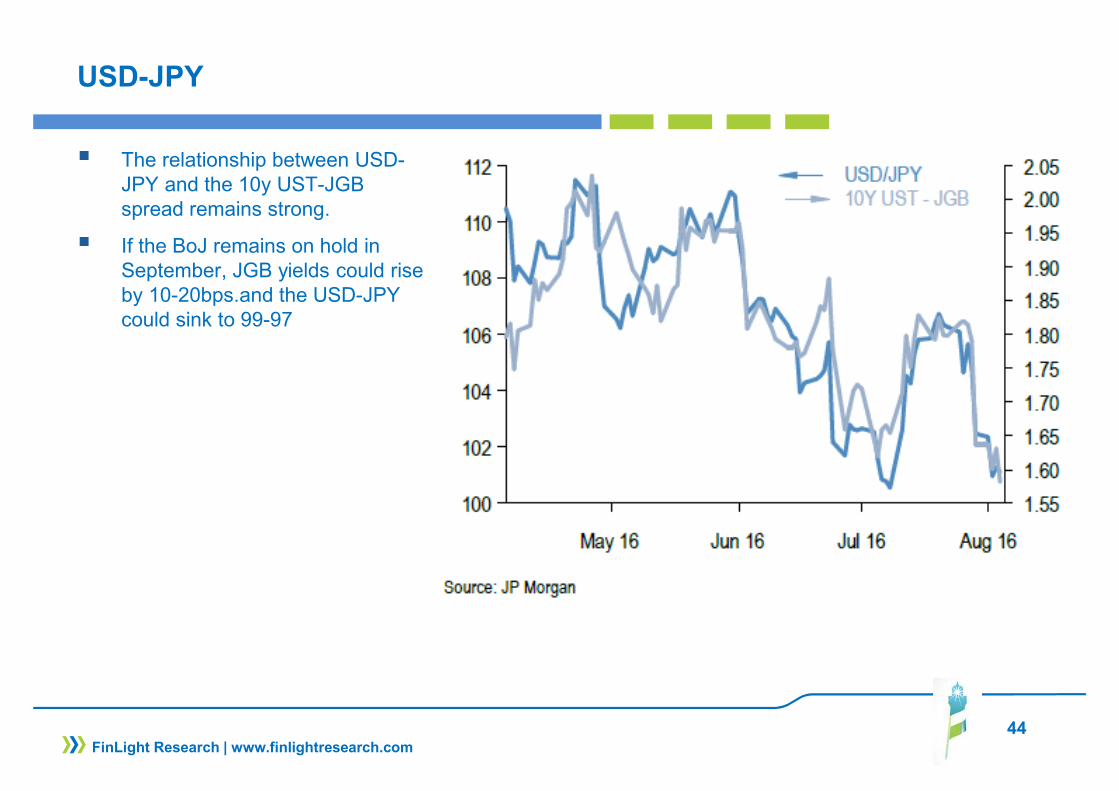
� The relationship between USD-JPY and the 10y UST-JGB spread remains strong.
� If the BoJ remains on hold in September, JGB yields could rise by 10-20bps.and the USD-JPY could sink to 99-97
FinLight Research | www.finlightresearch.com

45
USD-JPY
� In June, we turned Neutral onUSD-JPY as our target of 102was reached.
� For now, we remain Neutral.
� Our positioning rules on USD-JPY remain unchanged:� Remain Neutral below
106.6� Move to OW above� We may turn to UW after a
clean break of the 100.30-100.90 resistance area,and target 98-99
FinLight Research | www.finlightresearch.com

46
COMMODITY
� Since end of July, commodity prices seem on a upward trajectory. But, for now, we see that more as a technical move than as a fundamentally-driven one.
� We don’t see any sustainable recovery without a pick-up in global growth or a material tightening on the supply side. It is likely that supply destruction (due to pull-back in capital investment) will be the main catalyst for the next sustainable recovery in prices.
� We also expect a considerable volatility along the way
� We remain UW commodities over 3-6 months as we believe the recent rally might be short-lived� The supply side has adjusted but still has a way to go in many commodities before erasing
current imbalances. In order to get more cuts in supply, we think there needs another legdown in prices to force capitulation
� US dollar strengthening should resume. Dollar will dictate both direction and velocity in commos.We expect the stronger dollar to put downward pressure on commodities despite supportivefundamentals for some of them
� We may have a summer sell-off as was the case in both 2014 and 2015.
� The downtrend in commodities looks about to bottom out. We see one last leg down in energyand metals.
FinLight Research | www.finlightresearch.com

47
COMMODITY
� Bottom Line :Energy:
The market has been reporting higher oil production when demand seems to be slowing.
� Oil remains a wild card but a bottom may be forming with supply/demand imbalances coming to anend by mid-2017
� Ample supply and growing inventories remain the major problem plaguing the oil market
� The carry along the oil forward curve has turned negative, discouraging long positioning in oil
� We think that the bottom is in for oil, but we don’t expect a significant rally from here. Any growing evidence that the downtrend in U.S. crude production is ending, would induce another sharp drop in prices.
� We actually expect the spot to test again the 25-30 area before putting in a permanent rebound. At this stage, we watch a few key levels ($40, $36, $31, $25). We need to see how we do around these levels to make our projections.
� We expect oil to remain within the US$25-45 range for a while, and volatility to persist.
� According to our positioning rules (please see our previous reports), we’ve turned from Neutral to UWas the WTI broke below the trendline across the lows since Jan. ‘16.
� Our tactical rules remain unchanged:� Move to Neutral as soon as the spot reintegrates the channel drawn from Jan. ‘16� Remain UW below the trendline resistance (currently around $47)� Move to OW above the channel ceil or below $29.
FinLight Research | www.finlightresearch.com

48
COMMODITY
Precious Metals:
Outlook for precious metals continues to be dominated by the Fed dovish stance, macroeconomic and political uncertainties and the subsequent impact on US dollar, real yields and sovereign credit.
� Mixture of Fed hold-on posture, NIRP policies, and global uncertainties constitute a constructive environment for Gold. Gold did pull back after the US employment report, but remains firmly in a bullish trend. The performance of silver has been even more impressive.
� According to our positioning rules, we turned OW on Gold as it broke above 1295, two months ago.
� We feel, however, cautious about the sustainability of the recent rally as long positioning becomes very crowded
� At the end, the stronger US dollar and higher real rates should drive gold prices lower
� At this stage, we think that gold / silver are still due for a final leg down. Our ultimate target was raised to 1000 – 1040 on gold and 12.5-13 on silver. The main risk to our scenario is the resurgence of DM sovereign risk (starting with UK?).
� Our positioning rules are adjusted as follows:� Remain OW above 1295, targeting 1367 and even 1428� Go Neutral again between 1200 and 1295� Turn UW if the spot breaks below 1200� Go OW again below 1070
FinLight Research | www.finlightresearch.com

49
COMMODITY
Base Metals: .
� We remain UW on base metals on continuing excess supply.
� Industrial metals have remained range bounded over the last few weeks. From our point of view, lowerprices are still needed to oblige producers to cut production and to rebalance oversuppliedmarkets.
� From a longer-term point of view, we believe that metals prices are headed for multi-year declinesas the current China-driven super-cycle appears to have peaked
� In base metals, we see limited further upside potential for copper, as it appears to be one of the mostoversupplied markets.
Agriculture:
� The S&P GSCI Agri TR Index posted another big loss in July. Grains were hurt by surprisingly strongofficial estimates for US crops.
� Corn futures, for instance, hit a seven-year low after the US Department of Agriculture hiked by 7.1bushels per acre, the estimate for the average domestic yield this year – a figure far above marketexpectations.
� We choose to remain Neutral on Agris, as we have no conviction at this stage and given biguncertainties around forecasts for 2016-17
FinLight Research | www.finlightresearch.com

50
Crude – A Fundamental View
� US inventories remain well above the last five years range.
� Without an OPEC commitment to reduce production, supply is going to be biased higher
� Higher supply and weaker demand would naturally lead to higher inventories and lower oil prices
FinLight Research | www.finlightresearch.com
51
Crude – Market Positioning
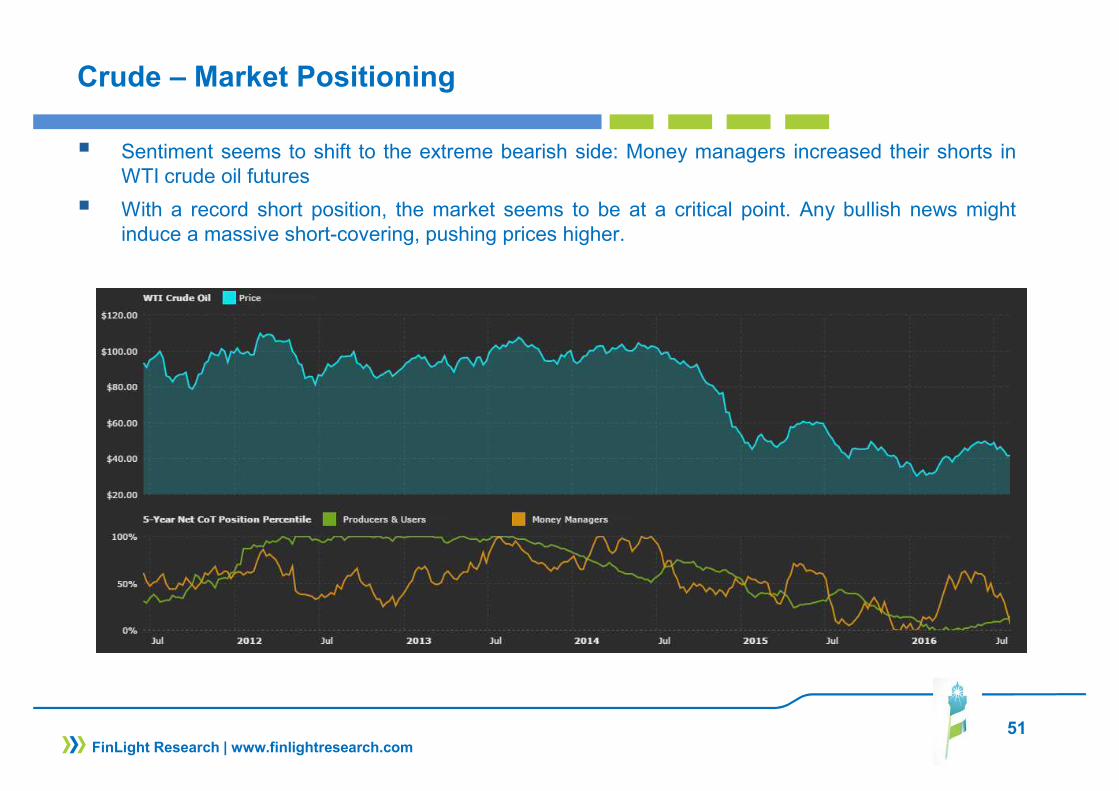
� Sentiment seems to shift to the extreme bearish side: Money managers increased their shorts inWTI crude oil futures
� With a record short position, the market seems to be at a critical point. Any bullish news mightinduce a massive short-covering, pushing prices higher.
FinLight Research | www.finlightresearch.com

52
Crude – Tech. Perspective
� In its recent move to $50, the WTI appeared as overbought.
� Another retracement lower should be expected from here. It will likely search for the $30-35 area.
� This view will be invalidated if the trendline from the highs of mid-2014 is broken to the upside. $46-47 is the invalidation level to watch.
FinLight Research | www.finlightresearch.com

53
Crude – Tech. Perspective
� More precisely, and according toour positioning rules (please seeour previous reports), we’veturned from Neutral to UW asthe WTI broke below thetrendline across the lowssince Jan. ‘16.
� Our tactical rules areunchanged:� Move to Neutral as soon as
the spot reintegrates thechannel drawn from Jan.‘16
� Remain UW below thetrendline resistance(currently around $47)
� Move to OW above thechannel ceil or below $29.
FinLight Research | www.finlightresearch.com

54
Precious Metals – A Relative-Value View
� The gold miners (representedby the HUI Index) to bullionratio shows that the metalhas been outperformingequities since 2006.
� With the recent rebound ingold prices (from Jan. ’16),the gold minersoutperformance has beenimpressive.
� But given the higherproduction costs and thelower miners profitability, wedon’t expect, thisoutperformance tocontinue, nor the ratio toreturn to its historicalaverage..
FinLight Research | www.finlightresearch.com
HUI Index
GOLD Index
HUI to Gold Ratio
Source: quandl.com

55
Silver – Market Positioning
� According to the CFTC Commitment of Traders report, Money managers have a record long positionin silver.
� This crowded long positioning in precious metals should be watched closely. Any negativeprice action would be exacerbated by investors trying to get out of their longs to reduce risk.
FinLight Research | www.finlightresearch.com
56
ALTERNATIVE STRATEGIES
� In July, market concerns over the strength of the US economy and Brexit impact eased, inducing a rebound in risk assets and fueling directional hedge fund strategies
� The HFRI Fund Weighted Composite Index posted gains of 1.7% in July. Gains were led by driven by Equity Hedge (+2.4% MoM) and Event-Driven (+2.1% MoM) strategies, as equity recovered Brexit losses, and credit and arbitrage deal spreads tightened
� CTAs realized most of their gains in the last week of July after Fed/BoJ meetings. The strategy was up 1.2% over the month.
� CTAs gained on their shorts in crude oil and agris, their longs in precious metals and equities.� On the negative side, systems faced losses on their fixed income portfolios.
� Global Macro funds made money from the surge in the U.S. dollar, as they hold substantial long exposure to the USD against G10 currencies.
� But, at the end of the month and after the FOMC meeting, their accumulated performance was completely erased, as the US Dollar reversed its course.
FinLight Research | www.finlightresearch.com

57
ALTERNATIVE STRATEGIES
� We believe that diversifying portfolios with an increased allocation to alternatives is particularly attractive at this stage of the cycle, given the current macroeconomic and interest rate uncertainties.
� Within the hedge fund universe, we continue to prefer strategies with moderate market directionality (“risk diversifiers” type) such as L/S Equity Market Neutral, Global Macro and CTAs. The reason behind that is that we continue to consider traditional asset classes as richly valued.
� We reiterate our OW rating on :� Equity Market Neutrals both for their “intelligent” beta and their alpha contribution. � CTAs: We keep particularly a clear OW stance on CTAs as a diversifier in portfolios and a hedge
against future stress. Furthermore, we expect new trends to emerge from here…
� Global Macro: We like this strategy as a diversifier and tail hedge. We have a slight preference for macro funds with a focus on Forex and Fixed-income…
� Vol. Arb strategy (HFRI RV: Volatility Index: +1.6% MoM, +3.0% Ytd) and prefer funds that trade volatility globally (all assets / all regions).
FinLight Research | www.finlightresearch.com

58
Cross-asset Volatility
� Volatility across asset classes has reset to its lows, during the summer.
� We do not expect such low levels to persist for long. A pick-up in volatility is probably imminent.
� We favor long vols on S&P500 and Gold
� It’s worth noting that low volatility (combined with major coming policy events) is not a particularly supportive environment for Global Macro strategies.
FinLight Research | www.finlightresearch.com

Bottom Line: Global Asset Allocation
� In July, market concerns over the US economy and the Brexitimpact eased, inducing a risk-on environment. the S&P 500 has made new all-time highs, the VIX has fallen, bonds started to sell off, and cyclicals have outperformed defensives.
� Precious metals remain firmly in a bullish trend, supported by a mixture of Fed hold-on posture, NIRP policies, and global uncertainties. Gold outperformance is rarely good news for real growth
� Our biggest concerns relate to the lack of earning growth (earnings recovery keeps getting pushed further into the future), the need for more business confidence, and corporate investment.
� The market remains expensive and needs increased earnings to move higher.
� A key concern at this stage remains the lack of diversification as most safe assets appear too stretched
� Central banks continue their irrational game, with the hope to levitate financial asset prices long enough to allow fundamentals to catch up.
� At this stage, investors appear more afraid of missing out on a rally than getting caught in a selloff
� We make minor adjustments to our asset allocation this month, except on Energy where we’ve turned UW.
� We summarize our views as follows �
59FinLight Research | www.finlightresearch.com

60
Disclaimer
FinLight Research | www.finlightresearch.com
This writing is for informational purposes only and does not constitute an
offer to sell, a solicitation to buy, or a recommendation regarding any
securities transaction, or as an offer to provide advisory or other services
by FinLight Research in any jurisdiction in which such offer, solicitation,
purchase or sale would be unlawful under the securities laws of such
jurisdiction. The information contained in this writing should not be
construed as financial or investment advice on any subject matter.
FinLight Research expressly disclaims all liability in respect to actions
taken based on any or all of the information on this writing.

About Us…
� FinLight Research is a research-centric company focused on Asset Allocation from a top-down perspective, on Portfolio Construction, and all related quantitative aspects and risk management issues.
� Our expertise expands along 3 axes:
� Asset Allocation with risk control and/or risk budgeting techniques
� Allocation to alternative investments : Hedge funds, rule-based strategies (momentum, value, carry, volatility), real assets (real estate, infrastructure, farmland, timberland and natural resources). Private equity and venture capital should be the next step…
� Allocation with a factorial approach built on the understanding (profiling) of the risk/return drivers of the different asset classes
� FinLight Research is an innovation-oriented company. We target to fill the gap between the academic research and the investment community, especially on real assets and alternatives. We survey on a continuous basis the academic literature for interesting published and working papers related to quantitative investing, non-linear profiling, asset allocation, real assets...
61FinLight Research | www.finlightresearch.com

Our Standard Offer
Provide tailor-made quantitative analysis of your
portfolios in terms of asset allocation, risk profiling and risk contribution
Provide tailor-made quantitative analysis of your
portfolios in terms of asset allocation, risk profiling and risk contribution
•Risk Profiling
Offer a turnkey 3-step factor-based process in GAA
with factor selection, risk budgeting and
dynamic portfolio protection
Offer a turnkey 3-step factor-based process in GAA
with factor selection, risk budgeting and
dynamic portfolio protection
•Factor-based GAA Process
Provide assistance with alternative
investments (including real
assets) in terms of profiling, and
integration in a GAA
Provide assistance with alternative
investments (including real
assets) in terms of profiling, and
integration in a GAA
•Alternative Investments
Provide assistance with asset
allocation and related risk control
and/or risk budgeting techniques
Provide assistance with asset
allocation and related risk control
and/or risk budgeting techniques
•Global Asset Allocation (GAA)
62FinLight Research | www.finlightresearch.com