Finlayson Caribou Herd - Yukon · Finlayson Caribou Herd Late-Winter Population Survey, 2007...
25
Finlayson Caribou Herd Late-Winter Population Survey, 2007 Prepared by Jan Adamczewski* Rob Florkiewicz Rick Farnell ** Carol Foster Katherina Egli Fish and Wildlife Branch
Transcript of Finlayson Caribou Herd - Yukon · Finlayson Caribou Herd Late-Winter Population Survey, 2007...

Finlayson Caribou Herd Late-Winter Population Survey, 2007
Prepared by
Jan Adamczewski* Rob Florkiewicz Rick Farnell ** Carol Foster
Katherina Egli
Fish and Wildlife Branch

Finlayson Caribou Herd Late-Winter Population Survey, 2007
Fish and Wildlife Branch
SR-10-01
ACKNOWLEDGEMENTS
Financial support from Yukon Zinc made possible Rick Farnell’s involvement in the survey. Adam Roth (Yukon Environment’s Geomatics unit) provided patient and skillful support in developing the maps for this report. We would like to thank Dorothy Dick, Kathlene Suza, Robertson Dick and Conservation Officer T.J. Grantham for their capable help with helicopter survey flying. Our thanks to pilots Denny Denison, Gerd Mannsperger, Andy Robertson and Bill Karman for their experience and skills in flying on this survey. * Current address: Jan Adamczewski
Department of Environment and Natural Resources Government of the Northwest Territories **Rick Farnell, Consulting Biologist, Yukon Zinc Corporation © 2010 Yukon Department of Environment Copies available from:
Yukon Department of Environment Fish and Wildlife Branch, V-5A Box 2703, Whitehorse, Yukon Y1A 2C6 Phone (867) 667-5721, Fax (867) 393-6263 Email: [email protected]
Also available online at www.environmentyukon.gov.yk.ca Suggested citation: ADAMCZEWSKI, J., R. FLORKIEWICZ, R. FARNELL, C. FOSTER, AND K. EGLI. 2010. Finlayson caribou herd
late-winter population survey, 2007. Yukon Fish and Wildlife Branch Report SR-10-01. Whitehorse, Yukon, Canada.

SUMMARY The survey was done
We estimated that the Finlayson herd had 3,077 +/- 5.6% caribou; 62.9% cows, 13.6% ere were 21.7 calves for every 100 cows, and 36.6 bulls for every 100 cows.
The survey results show that there were 1,000 fewer animals in the Finlayson caribou herd than in 1999, and the herd was almost half the size that it was in 1990, at the conclusion of 6 years of wolf control.
Nearly two-thirds of the caribou were found near Finlayson Lake, with smaller numbers near Caribou Lakes. In all previous late-winter surveys the opposite had been true. This shift in distribution may have been the result of above-
ibou Lakes area and less than normal snow
Weod
March 10 - 15, 2007.
calves, 9.8% young bulls nd 13.2% mature bulls. Th a
normal snow depth in the Cardepth near Finlayson Lake.
used the same survey methods that had been used in previous counts of the herd. Survey crews were experienced and flying conditions were very goso we were very satisfied with the survey conditions.

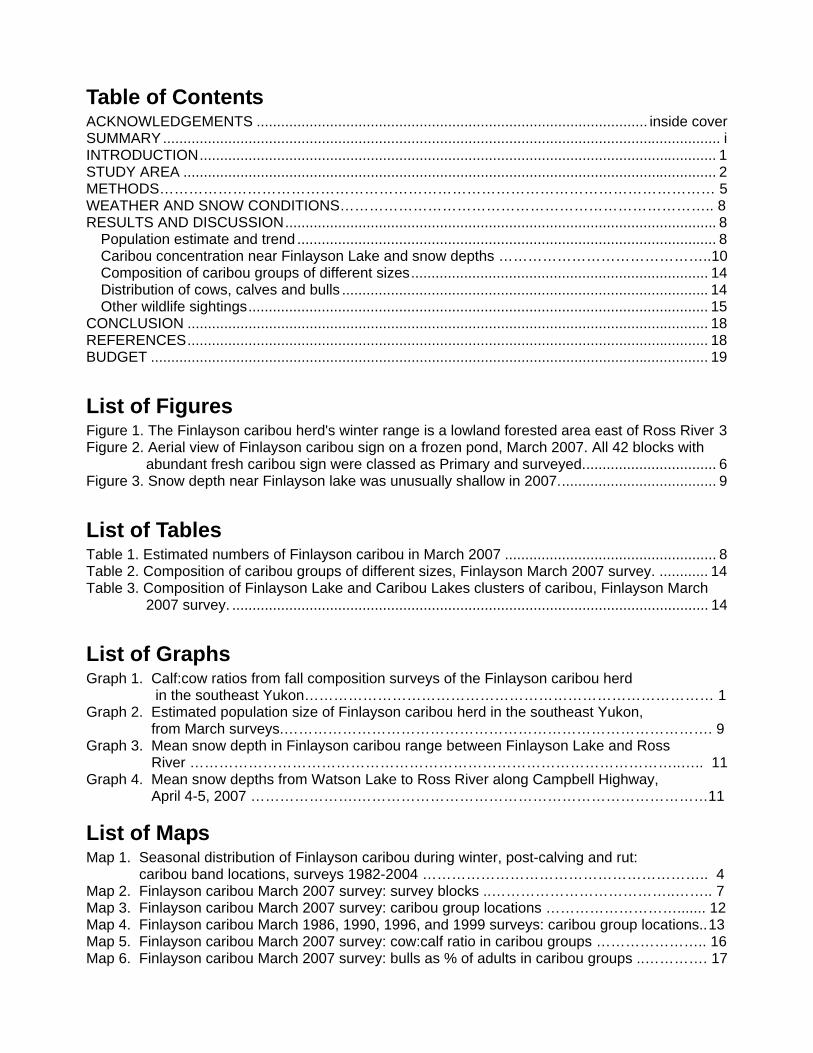
Table of Contents ACKNOWLEDGEMENTS ................................................................................................ inside cover SUMMARY......................................................................................................................................... i INTRODUCTION............................................................................................................................... 1 STUDY AREA ................................................................................................................................... 2 METHODS…………………………………………………………………………………………………… 5 WEATHER AND SNOW CONDITIONS………………………………………………………………….. 8 RESULTS AND DISCUSSION.......................................................................................................... 8
Population estimate and trend ....................................................................................................... 8 Caribou concentration near Finlayson Lake and snow depths ……………………………………..10 Composition of caribou groups of different sizes......................................................................... 14 Distribution of cows, calves and bulls .......................................................................................... 14 Other wildlife sightings................................................................................................................. 15
CONCLUSION ................................................................................................................................ 18 REFERENCES................................................................................................................................ 18 BUDGET ......................................................................................................................................... 19
List of Figures
Figure 1. The Finlayson caribou herd's winter range is a lowland forested area east of Ross River 3 Figure 2. Aerial view of Finlayson caribou sign on a frozen pond, March 2007. All 42 blocks with
abundant fresh caribou sign were classed as Primary and surveyed................................. 6 Figure 3. Snow depth near Finlayson lake was unusually shallow in 2007....................................... 9
List of Tables
Table 1. Estimated numbers of Finlayson caribou in March 2007 .................................................... 8 Table 2. Composition of caribou groups of different sizes, Finlayson March 2007 survey. ............ 14 Table 3. Composition of Finlayson Lake and Caribou Lakes clusters of caribou, Finlayson March
2007 survey. ..................................................................................................................... 14
List of Graphs
Graph 1. Calf:cow ratios from fall composition surveys of the Finlayson caribou herd in the southeast Yukon………………………………………………………………………… 1 Graph 2. Estimated population size of Finlayson caribou herd in the southeast Yukon, from March surveys.……………………………………………………………………………. 9 Graph 3. Mean snow depth in Finlayson caribou range between Finlayson Lake and Ross River ………………………………………………………………………………………..….. 11 Graph 4. Mean snow depths from Watson Lake to Ross River along Campbell Highway, April 4-5, 2007 ………………….………………………………………………………………11
List of Maps
Map 1. Seasonal distribution of Finlayson caribou during winter, post-calving and rut: caribou band locations, surveys 1982-2004 ………………………………………………….. 4 Map 2. Finlayson caribou March 2007 survey: survey blocks ..………………………………..…….. 7 Map 3. Finlayson caribou March 2007 survey: caribou group locations ………………………....... 12 Map 4. Finlayson caribou March 1986, 1990, 1996, and 1999 surveys: caribou group locations.. 13 Map 5. Finlayson caribou March 2007 survey: cow:calf ratio in caribou groups ………………….. 16 Map 6. Finlayson caribou March 2007 survey: bulls as % of adults in caribou groups ..…………. 17


Finlayson Caribou March 2007 Survey Page 1
INTRODUCTION This report describes the results of a late-winter population survey of the
Finlayson caribou herd, a population of woodland caribou found east of Ross River in the southeast Yukon. The survey was done due to concerns over the herd’s status; fall surveys from 1999 to 20061 showed poor calf numbers that suggested a declining herd.
0
10
20
30
40
50
60
70
198
2
198
3
198
4
198
5
198
6
198
7
198
8
198
9
199
0
199
1
199
2
199
3
199
4
199
5
199
6
199
7
199
8
199
9
200
0
200
1
200
2
200
3
200
4
200
5
200
6
200
7
Graph 1. Calf:Cow Ratio from Fall Composition Surveys of the Finlayson Caribou Herd in the Southeast Yukon, 1982-2006
Cal
ves:
100
Co
ws
YearW olf Control
26 calves: 100 cows (stable herd)
The Finlayson caribou herd has been an important resource for the Kaska
people, hunted and greatly valued, long before any surveys or studies by biologists. The construction of the Campbell Highway in the 1960s greatly increased access to the main Finlayson caribou winter range (Map 1) in addition to increasing hunting opportunities during the fall. In the early 1980s the herd was thought to be declining rapidly, in part due to a non-sustainable hunter harvest. A program of aerial wolf control was carried out annually from 1983 to 1989, with wolf numbers in Finlayson range reduced by about 85% from the pre-control estimate of 245 wolves. The Finlayson caribou herd grew from about 2000 animals in 1982 to nearly 6,000 in 1990. After wolf control ended in 1989, however, wolf numbers quickly rebounded and since about 1991 the caribou herd 1 Fall surveys of caribou herds such as the Finlayson herd do not estimate the herd’s size; they are meant to provide a cross-section of the herd – the proportions of calves, cows and bulls. Calf survival varies from year to year and the fall calf:cow ratio is an indicator of the herd’s trend that year (stable, increasing, or decreasing).

Finlayson Caribou March 2007 Survey Page 2
has declined. The Finlayson herd was last estimated in March 1999 at 4,130 most years since then annual fall calf numbers have been
below 20 per 100 cows (Graph 1). A fall calf:cow ratio of about 26 calves per 100 re
tly
STUDY AREA The Finlayson caribou herd’s summer and fall ranges are primarily on
alpine plateaus south of Finlayson Lake (Figure 1, Map 1). However, approximately one-third of the herd uses a widely-scattered group of alpine blocks north of the Campbell Highway, ranging nearly to the border with the Northwest Territories. The herd’s winter range is a lowland forested area east of Ross River, where there are abundant ground lichens under relatively open black spruce, white spruce, and lodgepole pine forests. These lichens are the primary winter food for caribou. This winter range lies north of the Pelly Mountains, which create a snow- and rain-shadow effect by intercepting the predominant weather systems from the southwest. The low snow cover and abundant ground lichens in the main Finlayson winter range are typical of Yukon woodland caribou winter ranges.
The Finlayson caribou winter range outlined in Map 1 covers an area of
6,671 km2. Caribou in this herd and in many other Yukon herds are counted in the late winter because they are spatially most concentrated at that time. By late March, the caribou are usually aggregated in a fraction of this winter range; the total area of blocks flown in March 2007 was 1,790 km2, about one-quarter of the total. The ranges used by caribou in the summer and fall cover a much greater area (See Map 1); the costs of a fall survey over this large expanse would be much higher than for a late winter survey.
caribou +/- 16.9%. In
cows is thought in Yukon to be generally consistent with a stable herd, one wherecruitment of young balances naturally occurring mortality. Ratios consistenbelow 20:100, as in the Finlayson herd from 1999 to 2006, are indicative of declining herds.

Figure 1. The Finlayson caribou herd's winter range is a lowland forested area east of Ross River
Finlayson Caribou March 2007 Survey Page 3

Finlayson Caribou March 2007 Survey Page 4
Map 1. SeasoroI DistriJution ofFonIayKwn CIIfiIou doing~. JIOS!:..calvillg "lid ru::: cari>ou 000.:\ locations, """""Y5 1982..200(
. . ~ . . . .. . . . . -:: • • • ' · 10
• • • !1 . "
" · ' 00
Finlayson Caribou March 2007 Survey Page 5
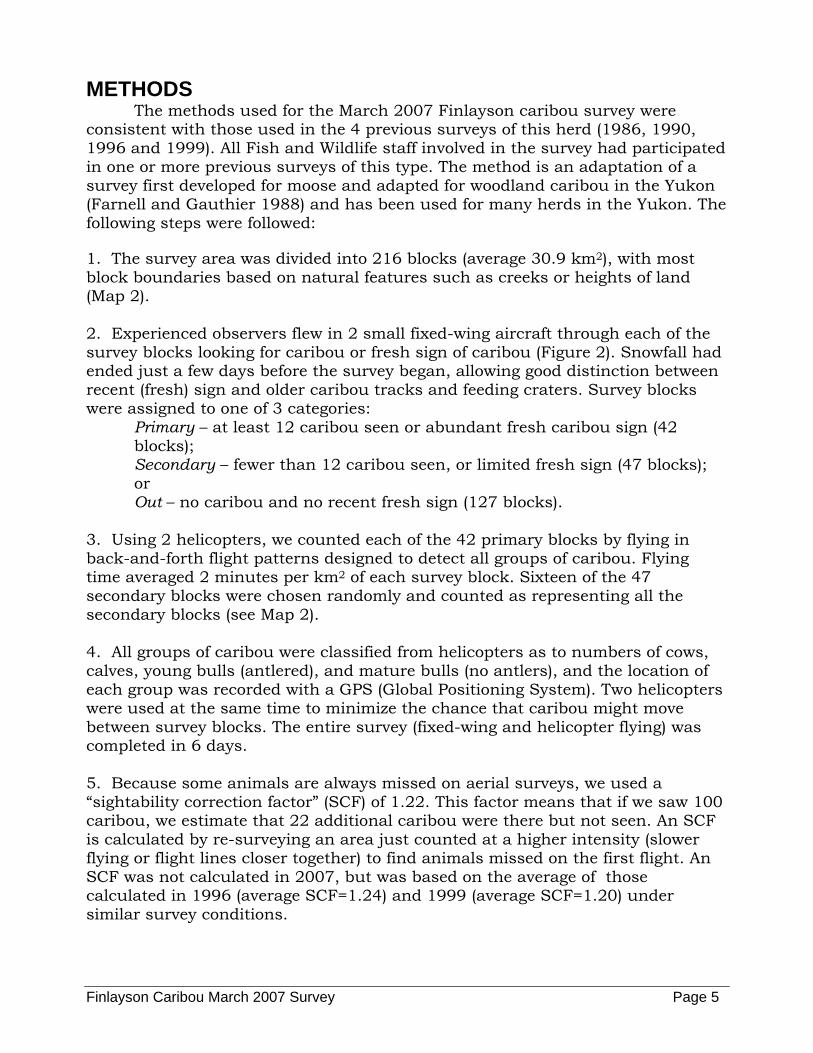
METHODS The methods used for the March 2007 Finlayson caribou survey were
consistent with those used in the 4 previous surveys of this herd (1986, 1990, 1996 and 1999). All Fish and Wildlife staff involved in the survey had participated in one or more previous surveys of this type. The method is an adaptation of a survey first developed for moose and adapted for woodland caribou in the Yukon (Farnell and Gauthier 1988) and has been used for many herds in the Yukon. The following steps were followed: 1. The survey area was divided into 216 blocks (average 30.9 km2), with most block boundaries based on natural features such as creeks or heights of land (Map 2). 2. Experienced observers flew in 2 small fixed-wing aircraft through each of the survey blocks looking for caribou or fresh sign of caribou (Figure 2). Snowfall had ended just a few days before the survey began, allowing good distinction between recent (fresh) sign and older caribou tracks and feeding craters. Survey blocks were assigned to one of 3 categories:
Primary – at least 12 caribou seen or abundant fresh caribou sign (42 blocks); Secondary – fewer than 12 caribou seen, or limited fresh sign (47 blocks); or Out – no caribou and no recent fresh sign (127 blocks).
3. Using 2 helicopters, we counted each of the 42 primary blocks by flying in back-and-forth flight patterns designed to detect all groups of caribou. Flying time averaged 2 minutes per km2 of each survey block. Sixteen of the 47 secondary blocks were chosen randomly and counted as representing all the secondary blocks (see Map 2). 4. All groups of caribou were classified from helicopters as to numbers of cows, calves, young bulls (antlered), and mature bulls (no antlers), and the location of each group was recorded with a GPS (Global Positioning System). Two helicopters were used at the same time to minimize the chance that caribou might move between survey blocks. The entire survey (fixed-wing and helicopter flying) was completed in 6 days. 5. Because some animals are always missed on aerial surveys, we used a “sightability correction factor” (SCF) of 1.22. This factor means that if we saw 100 caribou, we estimate that 22 additional caribou were there but not seen. An SCF is calculated by re-surveying an area just counted at a higher intensity (slower flying or flight lines closer together) to find animals missed on the first flight. An SCF was not calculated in 2007, but was based on the average of those calculated in 1996 (average SCF=1.24) and 1999 (average SCF=1.20) under similar survey conditions.

Finlayson Caribou March 2007 Survey Page 6
6. A computercalcul
program was used to give an estimate of total population size. The re
ion estimate; the variance is a measure of the
ations were fairly simple: all the caribou seen in the primary blocks weadded up, which accounted for more than 93 % of the total. The much lower numbers of caribou seen in the 16 secondary blocks were treated as though the same overall numbers of cows, calves and bulls had been found in the other 29 secondary blocks, taking into account the relative area of each block. The combined total from the primary and secondary blocks was multiplied by 1.22 to account for caribou not seen during the survey. The computer program calculates variance around the populata
uncertainty in the survey result.
Figure 2. Aerial view of Finlayson caribou sign on a frozen pond, March 2007. All 42 blocks with abundant fresh caribou sign were classed as Primary and surveyed.

Finlayson Caribou March 2007 Survey Page 7
RO
SS
RIV
ER
Fin
lay
s L
ak
Fo
rtin
La
ke
on
e
Mc
Ev
oy
La
ke
RIVER
PE
LL
Y
ROAD
CA
NO
LR
oss
Riv
er
RO
BER
T
CA
MP
BE
LL
HIG
HW
AY
Pe
ll
yL
ak
es
Slat
e R
apid
s
Ca
r ib
ou
La
kes
63
1
9
4
58
16
97
2
49
43
60
19
78
201
83
14
52
35
46
48
70
57
90
69
45
80
38
167
8164
9823
161
76
62
166
36
198
56
92
37
58
12
75
192
111
25
65
173
50
22
202
189
71
84
93
193
51
53
206
66
44
113
21
63
79
2461
15
100
116
194
91
73
108
54
123
160
15
205
59
67
148
31
200
55 107
185
42
85
195
179
9634
154
68
26
170
82
159
47
10
7
18
135
143
168
13
29
127
40
139
162
112
95
33
199
129
134
17
186
157
77
142
105
156
128
11
27
145
155
19718
8
110
138
190 19
6
126
115
122
187
140
203
163
180
20
86
94
109
183
137
7412
5
41 39
172
176
132
182
191
124
32
158
136
133
181
88
184
120
144
147
130
15
117
301
8714
1
121
178
174
164
89
171
165
303
118
114
146
177
204
175
119
305
131
169
15
72
28
30
211
106
99
207
2
101
102
150
104
212
149
208
103
209
1
210
214
213
304
300
302
3
130°
45'0
"W
130°
45'0
"W
°15'
0"W
130°
30'0
"W
130
131°
0'0"
W
131°
0'0"
W
131°
15'0
"W
131°
15'0
"W
131°
30'0
"W
131°
30'0
"W
131°
45'0
"W
131°
45'0
"W
132°
0'0"
W
132°
0'0"
W
132°
15'0
"W
0"W
132°
30'0
"W
62°0'0"N 61°45'0"N 61°30'0"N
130°
0'0"
W
130
130°
15'0
"W°3
0'0"
W
62°0'0"N 61°45'0"N 61°30'0"N
132°
15'
©nt
Yuk
on20
07 E
nviro
nme
Env
ironm
Geo
ma
tien
tcs
Map
ID: E
NV.
059.
003
Sca
le 1
:500
,000
Are
a of
Inte
rest
05
1015
2025
30
Kilo
met
res
Prim
ary
- H
igh
Den
sity
(All
Sur
veye
d)S
econ
dary
- L
ow D
ensi
ty(S
urve
yed)
Sec
onda
ry -
Low
Den
sity
(Not
Sur
veye
d)O
ut -
No
Rec
ent C
arib
ouS
ign
(Not
Sur
veye
d)
Sur
vey
Uni
t Str
ata
Ma
p 2
lays
on
Car
ibo
u M
arch
200
7rv
ey:
Su
rve
y B
lock
s.
Fin
Su

Finlayson Caribou March 2007 Survey Page 8
WEATHER AND SNOW CONDITIONS Weather during the 6 days of the survey was generally good, with sunny
skies, scattered clouds, or high overcast conditions. Occasionally there was some low fog or cloud cover in the mornings, which delayed the start of the day’s flying. Temperatures were -10 to -15 oC in the early mornings, and were usually a few degrees above freezing in the afternoons. There were a few localized snow squalls but no extended snowfall. Light conditions were generally good and allowed us to assess whether caribou sign was fresh or older, although there were some periods when broken cloud or overcast made the light conditions on the ground flatter, without sharp edges on the shadows. Snow cover on the ground was continuous and averaged 40–50 cm deep, which was normal or slightly above normal for the region at that time of year. There were several snowfalls in the region at the end of February and beginning of March, which allowed us to separate recent caribou feeding craters and tracks from older caribou sign. Flying time on each day of the survey ranged between 4 and 7.5 hours.
RESULTS AND DISCUSSION
Population estimate and trend
The estimated number of caribou in the Finlayson herd in March 2007 was 3,077 +/- 5.6% at the 90% confidence level (Table 1). About two-thirds of these were cows, with calves (13.6%), young bulls (9.8%), mature bulls (5.7%) and unclassified caribou (0.4%) making up the other third of the herd. The calf:cow ratio of 21.7:100 was similar to the October 2006 calf:cow ratio of 18.0:100, and the bull:cow ratio of 36.6:100 was similar to the October 2006 ratio of 39.0:100.
Table 1. Estimated numbers of Finlayson caribou in March 2007
Survey Component: Number of Caribou
Total Caribou
Cows
Calves
Young Bulls
Mature Bulls
Not Classified
Area of blocks
Number of caribou in primary blocks (42) – All counted
2,346 1,578 344 239 174 11 1,360 km2
Number of caribou in secondary blocks counted (16 of 47)
60 3 0 3 54 0 429.5 km2
Estimate of caribou in all secondary blocks (47)
176 9 0 9 159 0 1,261.7 km2
Total number of caribou (not corrected for caribou not seen)
2,522 1,587 344 248 333 11 2,622.5 km2
Population estimate (corrected for caribou not seen)
3,077 +/- 5.6%
1,935 420 302 406 13 2,622.5 km2
Calves:100 Cows 21.7:100 Bulls:100 Cows 36.6:100
The results of this survey confirmed the decline expected from fall calf:cow ratios from 1999 to 2006. There has been a continual decline since 1990, and bout 1,000 caribou fewer than the March 1999 estimate of 4,130 +/- 16.9% a
(Graph 4).

Finlayson Caribou March 2007 Survey Page 9
0 1 19
1 19
1000
2000
3000
4000
5000
6000
7000
8000
Herd in the Southeast Yukon, from March Surveys
Nu
mb
er
of
Car
ibo
u5,950 +/- 17.7%
4,537 +/- 11.9%4,130 +/- 16.9%
3,077 +/- 5.6%3,067 +/- 13.5%
2,000 (estimate only; no survey)
19
82
98
3
84
19
85
98
6
87
19
88
19
89
99
0
19
91
19
92
19
93
99
4
19
95
19
96
99
7
19
98
19
99
20
00
00
1
20
02
20
03
20
04
00
5
20
06
20
07
Year
1 1 1 2 2
ze of Finlayson CaribouGraph 4. Estimated Population Si
W olf Control
Figure 3. Snow depth near Finlayson lake was unusually shallow in 2007.
Graph 2. Estimated Population Size ofthe Southeast Yukon, from
Finalyson Caribou Herd in March Surveys.

Finlayson Caribou March 2007 Survey Page 10
Caribou conce
Well over half the caribou were seen in 10 survey blocks surrounding Finlayson Lake (Map 3). A lesser concentration of caribou was found in a series of blocks just south of the Campbell Highway in the Caribou Lakes area, and there were a few groups north of the Pelly River and in the Slate Rapids area. The caribou distribution seen in this survey differed substantially from the distribution found during surveys in March 1986, 1990, 1996, and 1999 (Map 4), when most caribou wintered south of the Pelly River and the Campbell Highway (near Caribou Lakes), with very few caribou near Finlayson Lake.
To assess whether the altered distribution of caribou in 2007 might be
related to snow conditions, on April 4 and 5 we did a series of snow depth measurements at the same sites late-winter snow depth had been measured annually in the 1980s (R. Farnell, unpublished data). At each of 8 sites just off the Campbell Highway, beginning near Finlayson Lake and ending near Ross River, snow depth was recorded on a meter stick 10 times with 3 paces between measurements. Snow depth was also measured at 5 more sites along the Campbell Highway towards Watson Lake, to assess snow cover east and south of the Finlayson winter range; we often noted that snow-banks along the sides of the road increased east and south of Finlayson Lake, towards Frances Lake and Watson Lake.
Snow depth across the Finlayson caribou winter range varied between 30 and 50 cm in the 1980s and in 2007 (Graph 3). In the 1980s, snow depth was usually greatest near Finlayson Lake, then decreased towards Caribou Lakes and Ross River. In 2007, however, the snow was deepest at Caribou Lakes and may have contributed to the shift of caribou towards Finlayson Lake.
Along the Campbell Highway, snow was substantially deeper south of the
main east-west line of the Pelly Mountains than in the Finlayson range (Graph 4), demonstrating the snow shadow effect of the Pelly Mountains.
ntration near Finlayson Lake and snow depths

Finlayson Caribou March 2007 Survey Page 11
0
10
20
30
40
50
60
70
between Finlayson Lake and Ross River
Km 250 Km 263 Km 280 Km 282 Km 296 Km 315 Km 362 Km 354
Range Graph 2. Mean Snow Depth in Finlayson Caribou
Mean 1983,84,88,892007
h (
cm)
Mea
n S
no
w D
ept
Fin
lays
on
La
ke a
ir-s
trip
Car
ibo
u L
akes
ne
ar
Ro
ss
Riv
er
Location along Campbell Hwy between Finlayson Lake and Ross River
0
20
40
60
80
100
120
Wat
son
Lk 2
Wat
son
Lk1
Km 1
00 C
amp
Km 1
70 C
amp
Km 2
07 C
amp
Km 2
50 C
amp
Km 2
63 C
amp
Km 2
80 C
amp
Km 2
82 C
amp
Km 2
96 C
amp
Km 3
15 C
amp
Km 3
62 C
amp
Km 3
54 C
amp
Mea
n S
no
w D
epth
(cm
)
Location along Campbell Hwy between Watson Lk & Ross River
Wa
tso
n L
ak
e
Fra
nc
es
La
ke
Fin
lay
so
n L
ak
e
Car
ibo
u L
ak
es
ne
ar
Ro
ss
Riv
er
Graph 3. Mean Snow Depths From Watson Lake to Ross Riveralong Campbell Hwy, April 4-5, 2007
Graph 3. Mean Snow Depth in Finlayson Caribou Range between Finlayson Lake and Ross River
Graph 4. Mean Snow Depths From Watson Lake to Ross River along Campbell Hwy, April 4-5, 2007

Finlayson Caribou March 2007 Survey Page 12
i ~, """," - "
J"! ~ "I ! ! ! • , ./
i \ ! . .
" " '{ .. ,
I --l. ;:
• .. ! -I , !
I !
! , .' , ! •
! , ! 13: J "'~ OJ ' . . " I . , .
! '5 ' . . • • . -h.' 'llnill ! "r.l; tJl Ji al
! Ll, '111m . . ,
n-ld ! , . . " • i
.... . ~ , • l • ,
-, """'." '"""'''

Finlayson Caribou March 2007 Survey Page 13
·. " ,
"
-
, ell S !! .l! - ~ ~ ~~
, ~ Ii . ••••
i :l l~i " • ji
=

Finlayson Caribou March 2007 Survey Page 14
Composition of caribou groups of different sizes
Caribou were found in groups ranging in size from 1 to 43. We assessed the average composition (proportions of cows, calves, and bulls) of caribou groups in size classes 1-5, 6-10, 11-20, and 21-43 (Table 2). Cows were, on average, more than half the group in each size class, but the proportion of cows was greatest in the biggest groups (72.4%) and least in the smallest groups (56.6%). The calves:100 cows ratio was greatest in the smallest groups (28.6), second-highest in the largest groups (23.6) and lowest in groups of 11-20 (18.3). Young bulls were found in similar proportions in all groups sizes, while mature bulls were rare in the largest groups (1.4%) and most common in the smallest groups (17.9%). Of the 228 mature bulls counted, 198 (86.8%) were in all-bull groups.
Table 2. Composition of caribou groups of different sizes, Finlayson March 2007 Survey.
Caribou Group Size
No. Groups
No. Cows
Average % Cows
No. Calves
Average % Calves
No. Young Bulls
Average % Young Bulls
No. Mature Bulls
Average % Mature Bulls
Calves: 100 Cows
Bulls: 100 Cows
1-5 65 133 56.6 38 16.2 18 7.7 42 17.9 28.6 45.1 6-10 85 424 63.5 94 14.1 69 10.3 80 12.0 22.2 35.1 11-20 67 638 66.1 117 12.1 107 11.1 98 10.2 18.3 32.1 21-43 22 466 72.4 110 17.1 58 9.0 9 1.4 23.6 14.4
Distribution of cows, calves and bulls
Because about two-thirds of the caribou counted on the March 2007 survey were clustered near Finlayson Lake, we compared the proportions of cows, calves and bulls found in 10 primary survey blocks near Finlayson Lake with the proportions found in 9 primary blocks near Caribou Lakes (Table 3). There were more than 5 times as many caribou in the Finlayson Lake cluster compared to the Caribou Lakes cluster, with similar high proportions of cows in both areas. There were few mature bulls in either area, particularly near Finlayson Lake, and the calves: 100 cows ratio was higher near Finlayson Lake (22.3) than near Caribou Lakes (17.7).
Table 3. Composition of Finlayson Lake and Caribou Lakes clusters of caribou, Finlayson March 2007 survey.
Caribou Cluster
No. Caribou
No. Cows
% Cows
No. Calves
% Calves
No. Young Bulls
% Young Bulls
No. Mature Bulls
% Mature Bulls
Calves: 100 Cows
Bulls: 100 Cows
Finlayson Lake
1,645* 1,191 72.8 265 16.1 166 10.1 23 1.4 22.3 15.9
Caribou Lakes
305 215 70.5 38 12.5 36 11.8 16 5.2 17.7 19.5
Finlayson Lake Group: 10 Primaries – Blocks 154, 155,156,158,159,160,161,163,165,166. Caribou Lakes Group: 9 Primaries – Blocks 78,128,129,134,135,136,137,138,139. * 11 unclassified caribou omitted.

Finlayson Caribou March 2007 Survey Page 15
We mapped the calf:cow ratio in caribou groups of different sizes seen durin
hey are und are often classified as secondary. Because only a percentage of the
oups will
f cows calve , and young ulls the p imary s Segre attern have issue n pa t Marc surv t he F ell, r
b ed d ). M ch 07 s m b cow tio e f l a o s a anc at ign nt
rega ns w m ed. T ten cy ard he lf:c rati n th main nce tio
intering caribou near Finlayson Lake, particularly in larger groups, is intriguing. It is difficult to know whether this pattern reflects higher caribou calf survival in
a tendency for cows with calves to aggregate in tha
ity is considered low by Yukon-wide standards, and is uch lower than the 228 moose per 1,000 km2 found for an area east of the Liard
rime m ose w ter h bita A dif rent he estim e o oos ght es d if s vey a a stra t s a n o . n o w t in n o d’s
rt e se a pr ys (w es, ose ca u) th arib are cli g t red ion s car co de d on io tes m ( nel l. 96, es al. 3).
rvey, and some
g the survey (Map 5) to look for spatial patterns and found that large groups with higher calf:cow ratios tended to be most common near Finlayson Lake. We also mapped the percentage of bulls among adult (non-calf) caribou in caribou groups of different sizes (Map 6) and found a strong segregation of bull-only groups north and east of the Pelly River.
The segregation of bulls (particularly mature bulls) away from the main
cow-calf concentrations of the herd is consistent with observations from earlier March surveys of this herd (R. Farnell, R. Florkiewicz, unpublished data). Because bull groups tend to be smaller, the survey blocks in which tfosecondary blocks are counted, some key blocks with bull-only caribou grbe missed, by chance, which would not likely happen with the main aggregations o , s b in r block
rd (R. the sissur
. gation R. Flo of the no s
p sbeen aunputo th
n i s h eys of hisurvey,ome
arnilaritye th
kiewicull:ifica
z, ra
bull lishall 200
ata6 bu
In the artio pr
20videdl:cow r
agg tio ere iss
he den tow hig r ca ow os i e co ntra n ofw
the Finlayson Lake area in winter, or t region, with calf:cow ratios mostly reflecting calf mortality earlier in the
year on alpine ranges.
Other wildlife sightings
We saw 245 moose in the 1,789.5 km2 of primary and secondary blocks surveyed for caribou, for an estimated density of 137 moose per 1,000 km2 over the entire area. Most of the moose were found in regenerating burns. This estimate of moose densmRiver in November 2006 (Westover et al. 2007). However, the survey blocks flown on this survey were all in prime caribou winter habitat, which is unlikely to be p o in a t. fe (hig
tificaose
r) ion ofithin
at blockhe F
f m had blayso
e denseen b carib
ity mised ou her
have rmoose
ulter moos
thee sign
ur The
areumbe
ndr of m
range is impo ant b cau , in two- ey s tem olv mo and ribowhere predat
e cn ra
ou on
deoose
ninFar
he pl et a
at19
rate Hay
on et
ibou200
uld
pen
One great grey owl was also seen on the caribou su(uncounted) flocks of ptarmigan.

Finlayson Caribou March 2007 Survey Page 16
RO
SS
RIV
ER
Fin
lay
so
nL
ak
e
Mc L
Ev
oy
ak
e
RIVER
PE
LL
Y
ROAD
CA
NO
L
Ro
ssR
iver
RO
BE
RT
Pe
La
C
ll
yk
es
AM
PB
ELL
HIG
HW
AY
Sla
te R
ap
ids
Ca
r ib
La
keo
us
130°
45
'0"W
130°
45'
0"W
W
130
°30'
0"W
0'0
"W
131°
0'0
"W13
0°0
'0"W
15'
0"W
62°0'0"N 61°45'0"N 61°30'0"N
130°
15'
0"W
130°
130°
30'
0"13
1°13
1°3
0'0"
W
131°
3
131°
"W13
2°3
131°
15'
0"W
131°
15'
0"W
0'0"
W
45'
0"W
131°
45
'0
132
°0'0
"W
132
°0'0
"W
132°
15'
0"W
132°
15'
0"W
0'0"
W
62°0'0"N 61°45'0"N 61°30'0"N
©2
00
7 E
nvi
ron
me
nt Y
uko
n
Env
ironm
ent
Ge
om
atic
s
Ma
p I
D: E
NV
.05
9.0
06
Are
a o
fIn
tere
st
Sca
le 1
:50
0,0
00
05
1015
2025
30
Kilo
me
tre
s
Map
5. F
inla
yso
n C
arib
ou
Mar
ch 2
007
Su
rvey
:C
ow
: C
alf
Rat
io in
Car
ibo
u G
rou
ps
Cal
ves:
10
0 C
ows
51 -
100
0 -
10
11 -
20
21 -
30
31 -
50
Ban
d S
ize
! (21
- 4
3
11 -
20
!(6
- 10
! (
1 -
5!(
Prim
ary
(All
Su
rve
yed
)
Sec
onda
ry(S
urv
eye
d)
Sec
onda
ry(N
ot S
urv
eye
d)
Ou
t(N
ot S
urv
eye
d)
Sur
vey
Un
it S
tra
ta
Not
e: A
ll-bu
ll gr
oup
s ar
e o
mitt
ed
fro
m t
his
anal
ysis

Finlayson Caribou March 2007 Survey Page 17
RO
SS
RIV
ER
Fin
l ay
so
nL
ak
e
Mc
Ev
oy
La
ke
RIVER
PE
LL
Y
Pe
ll
yL
ak
es
ROAD
CA
NO
L
Ros
sR
iver
RO
BE
RT
CA
MP
BE
LL
HIG
HW
AY
Sla
te R
api
ds
Ca
r ib
ou
La
ke
s
13
0°4
5'0
"W
130
°45
'0"W
130
°0'0
"W
130
°15
'0"W
130°
15'
0"W
130°
30'
0"W
130°
30'
0"W
131
°0'0
"W
131°
0'0
"W
131
°15
'0"W
131
°15
'0"W
131
°30
'0"W
131°
30'
0"W
131°
45'
0"W
131°
45'
0"W
132
°0'0
"W
132
°0'0
"W
132°
15'
0"W
132°
15'
0"W
132°
30'
0"W
62°0'0"N
62°0'0"N
61°45'0"N
61°45'0"N
61°30'0"N
61°30'0"N
©20
07
Env
iron
me
nt Y
uko
n
Env
ironm
ent
Geo
mat
ics
Ma
p ID
: E
NV.
059
.00
7
Sca
le 1
:50
0,0
00
05
1015
2025
30
Kilo
met
res
Map
6. F
inla
yso
n C
arib
ou
Mar
ch 2
007
Su
rvey
:B
ulls
as
% o
f Ad
ults
in C
arib
ou
Gro
up
s
% B
ulls
100
01 -
33
34 -
66
67 -
99
Ban
d S
ize
! (21
- 4
3
11 -
20
!(6
- 10
! (
1 -
5!(
Prim
ary
(All
Su
rve
yed
)
Sec
onda
ry(S
urv
eye
d)
Sec
onda
ry(N
ot S
urve
yed
)
Ou
t(N
ot S
urve
yed
)
Sur
vey
Un
it S
tra
ta
Are
a o
fIn
tere
st

Finlayson Caribou March 2007 Survey Page 18
CONCLUSION
The Finlayson caribou herd was estimated to be 3,077 caribou +/- 5.6% in March 2007.The Finlayson caribou herd declined by about 1,000 animals since March 1999. The observed decline had been expected because of the poor calf recruitment in most years during that period. The 2007 survey marked the continued decline in numbers since 1990. There can be no sustainable hunter harvest from a herd showing a steady decline in numbers.
Nearly 2/3 of the herd was clustered near Finlayson Lake. In 1986, 1990,
1996, and 1999 the bulk of the herd was found near Caribou Lakes. The shift in distribution may have been in part due to deeper-than-normal snow near Caribou Lakes in 2007. Mature bulls were mostly found in bull-only groups north and west of the Pelly River, while the main body of the herd was in cow-dominated groups near the Campbell Highway.
REFERENCES HAYES, R. D., R. FARNELL, R. M. P. WARD, J. CAREY, M. DEHN, G. W. KUZYK, A. M.
BAER, C. L. GARDNER, AND M. O’DONOGHUE. 2003. Experimental reduction of wolves in the Yukon: ungulate responses and management implications. Wildlife Monographs Number 152: 35 pp.
FARNELL, R., N. BARICHELLO, K. EGLI, AND G. KUZYK. 1996. Population ecology of two
woodland caribou herds in the southern Yukon. Rangifer Special Issue Number 9: 63-72.
FARNELL, R., AND D. A. GAUTHIER. 1988. Utility of the random quadrat sampling
census technique for woodland caribou in Yukon. Proceedings of the 3rd North American Caribou Workshop. Alaska Department of Fish and Game, Wildlife Technical Bulletin Number 8: 119-132. Juneau, Alaska, USA.
WESTOVER, S., R. WARD, S. BARKER, AND T. POWELL. 2007. Summary of the Liard
East early-winter 2006 moose survey, 4-12 November 2006. Yukon Fish and Wildlife Branch unpublished report, Whitehorse, Yukon. 21 pp.

Finlayson Caribou March 2007 Survey Page 19
BUDGET
$ 3,066 Jet B fuel - helicopters; Watson Lake 12 x $120.00 [drum]
day; 2 observers did not want payment) $ 150
Staff hotel bills and meals in Ross River $ 5,195
Item Cost ($) Helicopter 1 (27.5 hours @ $824/hr, no fuel) $22,666 Helicopter 2 (25.8 hours @ $960/hr, no fuel) $24,768 Fixed-wing 1 (Cessna 206, 6.5 hours @ $307/hr, no fuel) $ 1,995 Fixed-wing 2 (Bushhawk, 9.1 hours @ $337/hr, no fuel)
+ 12 x $254.36 [fuel] $ 4,492 Jet B fuel - helicopters; Whitehorse 27 x $120.00 [drum]
+ 27 x $188.86 [fuel] $ 8,339 Avgas fuel - fixed-wings; Whitehorse 7 x $120.00 [drum]
+ 7 x 270.66 [fuel] $ 2,734 Community observer flying ($150.00/
Total $73,405