FiniteElementModelingofaPiezoelectricComposite ...downloads.hindawi.com/archive/2012/921361.pdf ·...
12
International Scholarly Research Network ISRN Materials Science Volume 2012, Article ID 921361, 11 pages doi:10.5402/2012/921361 Research Article Finite Element Modeling of a Piezoelectric Composite Beam and Comparative Performance Study of Piezoelectric Materials for Voltage Generation Action Nechibvute, 1 Albert Chawanda, 1 and Pearson Luhanga 2 1 Physics Department, Midlands State University, Private Bag 9055, Gweru, Zimbabwe 2 Physics Department, University of Botswana, Private Bag 0022, Gaborone, Botswana Correspondence should be addressed to Action Nechibvute, [email protected] Received 27 February 2012; Accepted 8 May 2012 Academic Editors: D. P. de Souza and A. V. Dos Santos Copyright © 2012 Action Nechibvute et al. This is an open access article distributed under the Creative Commons Attribution License, which permits unrestricted use, distribution, and reproduction in any medium, provided the original work is properly cited. A comparative study of the traditional PZT ceramics and new single crystals is critical in selecting the best material and optimization of transducer design for applications such as conversion of ambient vibrations into useful electrical energy. However, due to material and fabrication costs and the need for rapid prototyping while optimizing transducer design, primary comparisons can be based on simulation. In this paper, the COMSOL Multiphysics finite element package was used to study the direct piezoelectric effect when an external load is applied at the free end of a piezoelectric composite beam. The primary output parameters such as electric potential and electric field were studied as a function of the input strain and stress. The modeling is presented for the relatively new single crystal lead magnesium niobate-lead titanate (PMN32) and three different lead zirconate titanate ceramics (PZT-5A, PZT-5H, and PZT-4). Material performance was assessed by using a common geometry and identical excitation conditions for the different piezoelectric materials. For each material, there are three analyses performed, namely, static, eigenfrequency, and transient/time-dependent analysis. Comparative results clearly suggest that the new crystal material PMN32 is capable of outperforming presently useing piezoelectric ceramics for voltage generation. 1. Introduction Piezoelectric materials have the novel ability of transferring from electrical to mechanical energy and vice-versa. This property is observable in many crystalline materials such as lead zirconate (PZT) ceramics where the phenomenon has found practical use in sensors and actuators [1–3]. Recently, the direct piezoelectric effect has been applied in energy har- vesting where mechanical deformation on the piezoelectric material caused by ambient vibrations is converted to useful electrical energy [4–6]. The electrical energy is used to power ultralow power electronics such as wireless sensor nodes and implantable biomedical devices [5–7]. The challenge facing piezoelectric energy harvesting is the low power output of the energy generators. One way of improving the direct piezoelectric effect and subsequently the energy harvesting capabilities of piezoelectric generators is the development of single crystal materials with high voltage generation abilities under low mechanical excitation compared to traditional PZT ceramics [8]. Understanding the direct piezoelectric performance of the PZT ceramic compared to new single crystal material such as PMN32 is very critical in the selection of the best material for a particular application. A detailed comparative study of different material performances is pri- marily inhibited by high material and fabrication costs and hence simulations in virtual design environments are re- quired [9–11]. Finite element modeling (FEM) is an enabling tool that can allow detailed analysis of models and can predict the behaviour of electromechanical structures under real world conditions while enabling faster and cheaper prototype development [12, 13]. In this study, we model the direct piezoelectric effect on a composite beam consisting of a stainless steel substrate sandwiched between two piezo- electric layers using the commercial FEM software package
Transcript of FiniteElementModelingofaPiezoelectricComposite ...downloads.hindawi.com/archive/2012/921361.pdf ·...
International Scholarly Research NetworkISRN Materials ScienceVolume 2012, Article ID 921361, 11 pagesdoi:10.5402/2012/921361
Research Article
Finite Element Modeling of a Piezoelectric CompositeBeam and Comparative Performance Study of PiezoelectricMaterials for Voltage Generation
Action Nechibvute,1 Albert Chawanda,1 and Pearson Luhanga2
1 Physics Department, Midlands State University, Private Bag 9055, Gweru, Zimbabwe2 Physics Department, University of Botswana, Private Bag 0022, Gaborone, Botswana
Correspondence should be addressed to Action Nechibvute, [email protected]
Received 27 February 2012; Accepted 8 May 2012
Academic Editors: D. P. de Souza and A. V. Dos Santos
Copyright © 2012 Action Nechibvute et al. This is an open access article distributed under the Creative Commons AttributionLicense, which permits unrestricted use, distribution, and reproduction in any medium, provided the original work is properlycited.
A comparative study of the traditional PZT ceramics and new single crystals is critical in selecting the best material andoptimization of transducer design for applications such as conversion of ambient vibrations into useful electrical energy. However,due to material and fabrication costs and the need for rapid prototyping while optimizing transducer design, primary comparisonscan be based on simulation. In this paper, the COMSOL Multiphysics finite element package was used to study the directpiezoelectric effect when an external load is applied at the free end of a piezoelectric composite beam. The primary outputparameters such as electric potential and electric field were studied as a function of the input strain and stress. The modelingis presented for the relatively new single crystal lead magnesium niobate-lead titanate (PMN32) and three different lead zirconatetitanate ceramics (PZT-5A, PZT-5H, and PZT-4). Material performance was assessed by using a common geometry and identicalexcitation conditions for the different piezoelectric materials. For each material, there are three analyses performed, namely, static,eigenfrequency, and transient/time-dependent analysis. Comparative results clearly suggest that the new crystal material PMN32is capable of outperforming presently useing piezoelectric ceramics for voltage generation.
1. Introduction
Piezoelectric materials have the novel ability of transferringfrom electrical to mechanical energy and vice-versa. Thisproperty is observable in many crystalline materials such aslead zirconate (PZT) ceramics where the phenomenon hasfound practical use in sensors and actuators [1–3]. Recently,the direct piezoelectric effect has been applied in energy har-vesting where mechanical deformation on the piezoelectricmaterial caused by ambient vibrations is converted to usefulelectrical energy [4–6]. The electrical energy is used to powerultralow power electronics such as wireless sensor nodes andimplantable biomedical devices [5–7]. The challenge facingpiezoelectric energy harvesting is the low power output ofthe energy generators. One way of improving the directpiezoelectric effect and subsequently the energy harvestingcapabilities of piezoelectric generators is the development of
single crystal materials with high voltage generation abilitiesunder low mechanical excitation compared to traditionalPZT ceramics [8]. Understanding the direct piezoelectricperformance of the PZT ceramic compared to new singlecrystal material such as PMN32 is very critical in the selectionof the best material for a particular application. A detailedcomparative study of different material performances is pri-marily inhibited by high material and fabrication costs andhence simulations in virtual design environments are re-quired [9–11]. Finite element modeling (FEM) is an enablingtool that can allow detailed analysis of models and canpredict the behaviour of electromechanical structures underreal world conditions while enabling faster and cheaperprototype development [12, 13]. In this study, we model thedirect piezoelectric effect on a composite beam consistingof a stainless steel substrate sandwiched between two piezo-electric layers using the commercial FEM software package

2 ISRN Materials Science
Table 1: Dimensions of the composite beam.
Layer Length (mm) Width (mm) Thickness (mm)
Top piezoelectric 25 7.5 0.1
Middle stainless steel 25 7.5 0.05
Bottom piezoelectric 15 7.5 0.1
x
yF
PiezoelectricStainless steel
Figure 1: Cantilever composite beam.
0.010.0080.0060.0040.002
0−0.002−0.004−0.006
−0.01−0.012
00.
002
0.00
40.
006
0.00
80.
010.
012
0.01
40.
016
0.01
80.
020.
022
0.02
40.
026
1.6
1.4
1.2
1
0.8
0.6
0.4
0.2
0
eigfreq smpps(1)= 237.503744 Surface: total displacement (m)Deformation: displacement
−0.008
Mode1
Min: 0
Max: 1.775 e−4
×10−4
(a)
00.
002
0.00
40.
006
0.00
80.
010.
012
0.01
40.
016
0.01
80.
020.
022
0.02
40.
026
54.543.532.521.510.50
Surface: total displacement (m)Deformation: displacement
Mode2
Min: 0
0.010.0080.0060.0040.002
0−0.002−0.004−0.006
−0.01−0.012
−0.008
×10−5eigfreq smpps(2) = 1117.151144 Max: 5.207 e−5
(b)
00.
002
0.00
40.
006
0.00
80.
010.
012
0.01
40.
016
0.01
80.
020.
022
0.02
40.
026
1.6
1.4
1.2
1
0.8
0.6
0.4
0.2
0
Surface: total displacement (m)
Deformation: displacement
Mode3
Min: 0
0.010.0080.0060.0040.002
0−0.002−0.004−0.006
−0.01−0.012
−0.008
×10−5Max: 1.688 e−5eigfreq smpps(3) = 2991.352491
(c)
Mode4
00.
002
0.00
40.
006
0.00
80.
010.
012
0.01
40.
016
0.01
80.
020.
022
0.02
40.
026 Min: 0
8
7
6
5
4
3
2
1
0
Surface: total displacement (m)Deformation: displacement
90.01
0.0080.0060.0040.002
0−0.002−0.004−0.006
−0.01−0.012
−0.008
×10−6Max: 9.606 e−6eigfreq smpps(4) = 5945.001334
(d)
00.
002
0.00
40.
006
0.00
80.
010.
012
0.01
40.
016
0.01
80.
020.
022
0.02
40.
026 Min: 0
54.543.532.521.510.50
Surface: total displacement (m)Deformation: displacement
Mode 5
eigfreq smpps(5) = 9627.396607 Max: 5.386 e−6
×10−6
0.010.0080.0060.0040.002
0−0.002−0.004−0.006
−0.01−0.012
−0.008
(e)
Mode6
00.
002
0.00
40.
006
0.00
80.
010.
012
0.01
40.
016
0.01
80.
020.
022
0.02
40.
026 Min: 0
3.5
3
2.5
2
1.5
1
0.5
0
Surface: total displacement (m)Deformation: displacement
eigfreq smpps(6) = 14705.579508 Max: 3.706 e−6×10⁻⁶
0.010.0080.0060.0040.002
0−0.002−0.004−0.006
−0.01−0.012
−0.008
(f)
Figure 2: The first six deformation modes of the composite piezoelectric, using PZT-5A.
Table 2: Summary of static analysis results.
Displacement(mm)
Von Mises stress(MPa)
Strain ×103 Electric potential(V)
Electric field norm(MV/m)
Electric energy density(J/m3)
PZT-5A 0.6434 38.33 0.5455 15.8335 0.6627 1508.2
PZT-5H 0.625 39.96 0.5455 12.702 0.5225 1748.524
PZT-4 0.5 37.85 0.4129 14.9615 0.6146 1098.351
PMN32 1.59 38.26 1.382 18.0223 0.5399 3785.961
ISRN Materials Science 3
PZT-5A
0
0.5
1
1.5
2
2.5
3
3.5
60
80
100
120
140
160
180
200
180 230 280 330
Dis
plac
emen
t (m
m)
v.M
. str
ess
(MPa
)
Frequency (Hz)
(a)
PZT-5H
0
0.5
1
1.5
2
2.5
3
3.5
60
80
100
120
140
160
180
180 230 280 330
Dis
plac
emen
t (m
m)
v.M
. str
ess
(MPa
)
Frequency (Hz)
(b)
PZT-4
0
0.5
1
1.5
2
2.5
60
70
80
90
100
110
120
130
140
150
200 250 300 350
Dis
plac
emen
t (m
m)
v.M
. str
ess
(MPa
)
v.M. stressDisplacement
Frequency (Hz)
(c)
PMN32
0
2
4
6
8
10
40
60
80
100
120
140
160
180
200
100 150 200 250
Dis
plac
emen
t (m
m)
v.M
. str
ess
(MPa
)
v.M. stressDisplacement
Frequency (Hz)
(d)
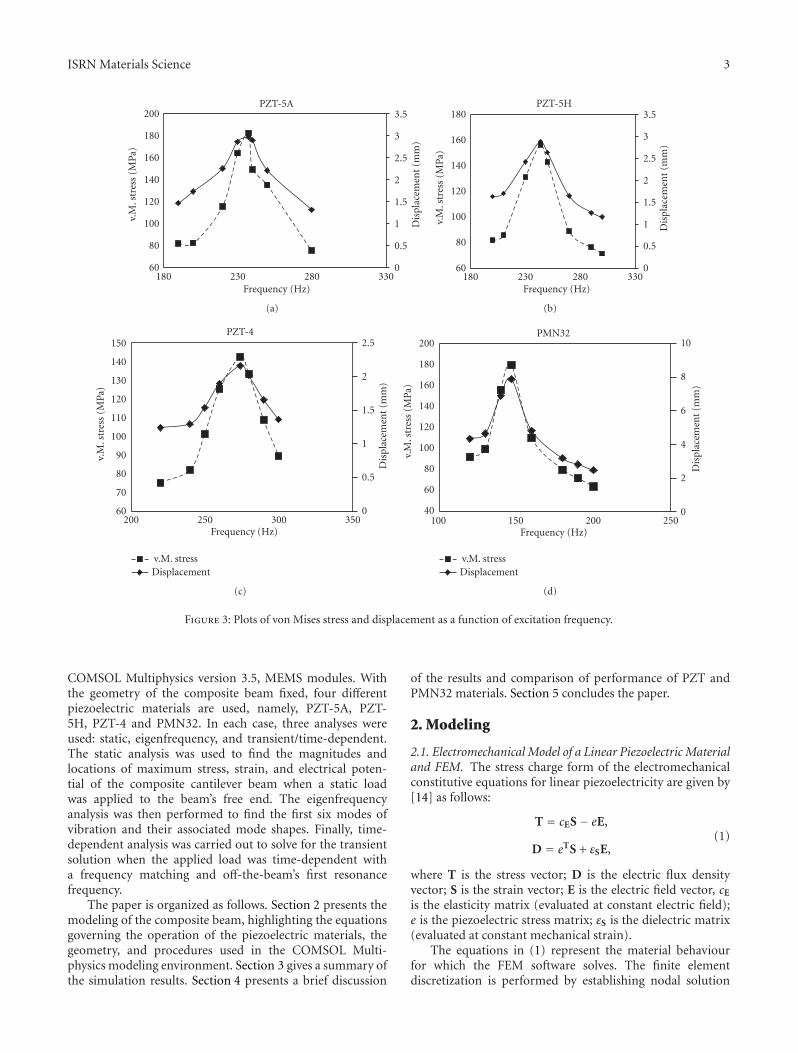
Figure 3: Plots of von Mises stress and displacement as a function of excitation frequency.
COMSOL Multiphysics version 3.5, MEMS modules. Withthe geometry of the composite beam fixed, four differentpiezoelectric materials are used, namely, PZT-5A, PZT-5H, PZT-4 and PMN32. In each case, three analyses wereused: static, eigenfrequency, and transient/time-dependent.The static analysis was used to find the magnitudes andlocations of maximum stress, strain, and electrical poten-tial of the composite cantilever beam when a static loadwas applied to the beam’s free end. The eigenfrequencyanalysis was then performed to find the first six modes ofvibration and their associated mode shapes. Finally, time-dependent analysis was carried out to solve for the transientsolution when the applied load was time-dependent witha frequency matching and off-the-beam’s first resonancefrequency.
The paper is organized as follows. Section 2 presents themodeling of the composite beam, highlighting the equationsgoverning the operation of the piezoelectric materials, thegeometry, and procedures used in the COMSOL Multi-physics modeling environment. Section 3 gives a summary ofthe simulation results. Section 4 presents a brief discussion
of the results and comparison of performance of PZT andPMN32 materials. Section 5 concludes the paper.
2. Modeling
2.1. Electromechanical Model of a Linear Piezoelectric Materialand FEM. The stress charge form of the electromechanicalconstitutive equations for linear piezoelectricity are given by[14] as follows:
T = cES− eE,
D = eTS + εSE,(1)
where T is the stress vector; D is the electric flux densityvector; S is the strain vector; E is the electric field vector, cE
is the elasticity matrix (evaluated at constant electric field);e is the piezoelectric stress matrix; εS is the dielectric matrix(evaluated at constant mechanical strain).
The equations in (1) represent the material behaviourfor which the FEM software solves. The finite elementdiscretization is performed by establishing nodal solution

4 ISRN Materials Science
40
60
80
100
120
140
160
180
200
180 230 280
E-fi
eld
nor
m (
MV
/m)
v.M
. str
ess
(MPa
)
0
0.5
1
1.5
2
2.5
3
3.5PZT-5A
Frequency (Hz)
(a)
0
0.5
1
1.5
2
60
80
100
120
140
160
180
180 230 280 330
v.M
. str
ess
(MPa
)
PZT-5H
E-fi
eld
nor
m (
MV
/m)
Frequency (Hz)
(b)
60
80
100
120
140
160
180
180 230 280 330
v.M
. str
ess
(MPa
)
v.M. stressE-field norm
0
0.5
1
1.5
2
E-fi
eld
nor
m (
MV
/m)
PZT-4
Frequency (Hz)
(c)
PMN32
00.20.40.60.811.21.41.61.82
50
70
90
110
130
150
170
190
100 150 200 250
v.M
. str
ess
(MPa
)
E-fi
eld
nor
m (
MV
/m)
v.M. stressE-field norm
Frequency (Hz)
(d)
Figure 4: Plots of von Mises stress and electric field norm as afunction of excitation frequency.
variables and the element shape functions over an elementdomain which approximates the following solution [15]:
uc = NTu · u,
Vc = NTV ·V ,
(2)
where uc is the displacement within element domain in thex, y, z directions, Vc is the electrical potential within elementdomain, Nu is the matrix of displacement shape functions,NV is the vector of the electrical potential shape function, uis the vector of nodal displacements, and V is the vector ofnodal electrical potential. Using (2), the strain S and electricfield E are thus related to the displacements and potentials by(3) and (4), respectively. Consider
S = Bu · u, (3)
E = −BV ·V , (4)
where
Bu =
⎡⎢⎢⎢⎢⎢⎢⎢⎢⎢⎢⎢⎣
∂
∂x0 0
∂
∂y0
∂
∂z
0∂
∂y0
∂
∂x
∂
∂z0
0 0∂
∂z0
∂
∂y
∂
∂x
⎤⎥⎥⎥⎥⎥⎥⎥⎥⎥⎥⎥⎦
T
,
BV =[∂
∂x
∂
∂y
∂
∂z
]T
.
(5)
Upon the application of the variational principle and thefinite element discretization, the coupled finite elementmatrix equation is[M 00 0
][uV
]+
[C 00 0
][uV
]+
[K Kz
KTz Kd
][uV
]=[FL
],
(6)
where M is the structural mass given by M = ∫ ρNuNTu dv; K
is the structural stiffness given by K = ∫ BTu cBudv; Kz is the
piezoelectric coupling matrix given by Kz = − ∫ BTu eBVdv;
Kd is the dielectric conductivity given by K = ∫ BTVεBVdv; C
is the structural damping matrix; ρ is the mass density; F isthe structural load vector (a vector of nodal forces, surfaceforces, and body forces); L is the electrical load vector (avector of nodal, surface, and body charges). (The integrationis over the whole element.)
2.2. Geometry and Modeling Definition in COMSOL Multi-physics. The composite beam and its associated dimensionsare shown in Figure 1 and Table 1, respectively. Through-out the modeling experiments in COMSOL Multiphysics-MEMS modules, the geometry and the dimensions shownin Figure 1 were not changed; only different piezoelectricmaterials were changed one type at a time. The materialproperties of the different piezoelectric materials are shownin Appendix A.
ISRN Materials Science 5
30
40
50
60
70
80
90
100
180 230 280 330
Ele
ctri
c po
ten
tial
(V
)
0
0.5
1
1.5
2
2.5
Stra
in (×1
03)
PZT-5A
Frequency (Hz)
(a)
30
40
50
60
70
80
180 230 280 330
Ele
ctri
c po
ten
tial
(V
)
0
0.5
1
1.5
2
2.5
Stra
in (×1
03)
PZT-5H
Frequency (Hz)
(b)
00.20.40.60.811.21.41.61.8
40455055606570758085
200 250 300 350
Ele
ctri
c po
ten
tial
(V
)
Electric potentialStrain
Stra
in (×1
03)
PZT-4
Frequency (Hz)
(c)
0
1
2
3
4
5
6
7
30405060708090
100110120
100 150 200 250
Ele
ctri
c po
ten
tial
(V
)
Electric potentialStrain
Stra
in (×1
03)
PMN32
Frequency (Hz)
(d)
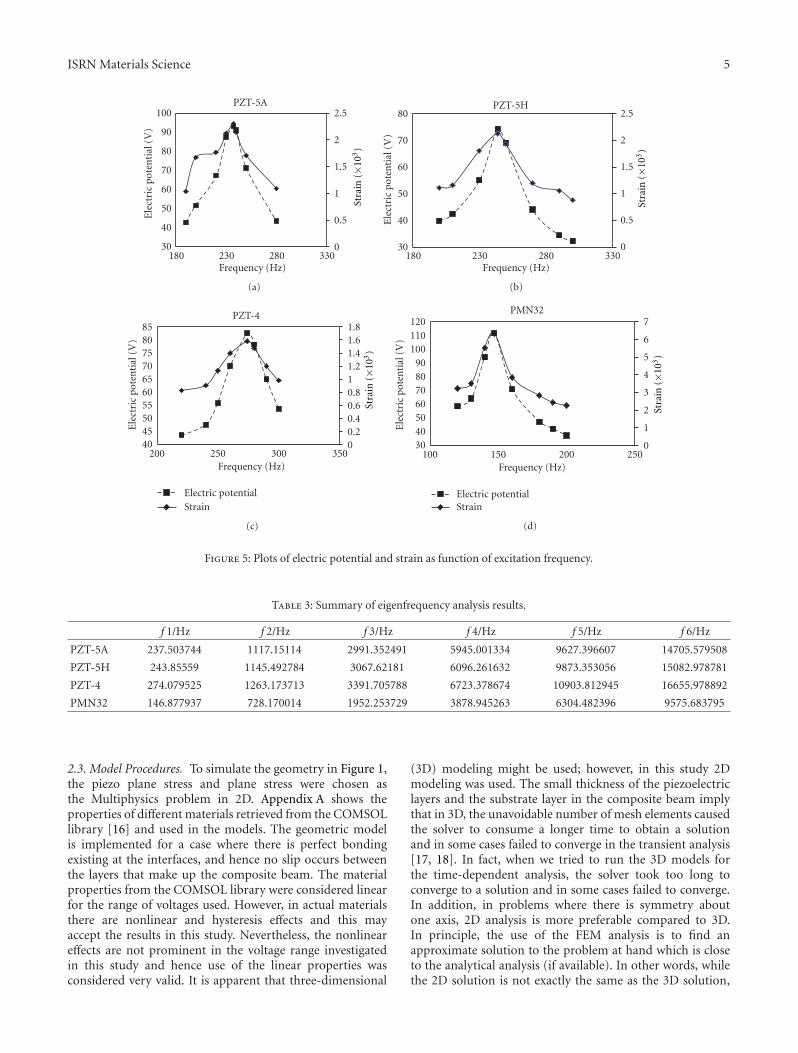
Figure 5: Plots of electric potential and strain as function of excitation frequency.
Table 3: Summary of eigenfrequency analysis results.
f 1/Hz f 2/Hz f 3/Hz f 4/Hz f 5/Hz f 6/Hz
PZT-5A 237.503744 1117.15114 2991.352491 5945.001334 9627.396607 14705.579508
PZT-5H 243.85559 1145.492784 3067.62181 6096.261632 9873.353056 15082.978781
PZT-4 274.079525 1263.173713 3391.705788 6723.378674 10903.812945 16655.978892
PMN32 146.877937 728.170014 1952.253729 3878.945263 6304.482396 9575.683795
2.3. Model Procedures. To simulate the geometry in Figure 1,the piezo plane stress and plane stress were chosen asthe Multiphysics problem in 2D. Appendix A shows theproperties of different materials retrieved from the COMSOLlibrary [16] and used in the models. The geometric modelis implemented for a case where there is perfect bondingexisting at the interfaces, and hence no slip occurs betweenthe layers that make up the composite beam. The materialproperties from the COMSOL library were considered linearfor the range of voltages used. However, in actual materialsthere are nonlinear and hysteresis effects and this mayaccept the results in this study. Nevertheless, the nonlineareffects are not prominent in the voltage range investigatedin this study and hence use of the linear properties wasconsidered very valid. It is apparent that three-dimensional
(3D) modeling might be used; however, in this study 2Dmodeling was used. The small thickness of the piezoelectriclayers and the substrate layer in the composite beam implythat in 3D, the unavoidable number of mesh elements causedthe solver to consume a longer time to obtain a solutionand in some cases failed to converge in the transient analysis[17, 18]. In fact, when we tried to run the 3D models forthe time-dependent analysis, the solver took too long toconverge to a solution and in some cases failed to converge.In addition, in problems where there is symmetry aboutone axis, 2D analysis is more preferable compared to 3D.In principle, the use of the FEM analysis is to find anapproximate solution to the problem at hand which is closeto the analytical analysis (if available). In other words, whilethe 2D solution is not exactly the same as the 3D solution,

6 ISRN Materials Science
PZ
T-5
AP
ZT
-5H
PZ
T-4
PM
N32
×10−3
3
2
1
0
−1
−2
−30 0.01 0.02 0.03 0.04 0.05 0.06 0.07
Time
2.5
2
1.5
1
0.5
00 0.01 0.02 0.03 0.04 0.05 0.06 0.07 0 0.01 0.02 0.03 0.04 0.05 0.06 0.07
×10−3
Firs
t pr
inci
pal s
trai
n
Time Time
Electric potential (V)100
80604020
0−20−40−60−80−100
Ele
ctri
c po
ten
tial
(V
)
×10−3
3
2
1
0
−1
−2
−30 0.01 0.02 0.03 0.04 0.05 0.06 0.07
Time
1.81.61.41.2
10.80.60.40.2
0
2
0 0.01 0.02 0.03 0.04 0.05 0.06 0.07
Time
×10−3
Firs
t pr
inci
pal s
trai
n
80
60
40
20
−20
−40
−60
−80
0
0 0.01 0.02 0.03 0.04 0.05 0.06 0.07
Time
Ele
ctri
c po
ten
tial
(V
)
-dis
plac
emen
t (m
)γ
-dis
plac
emen
t (m
)γ
-displacement (m)γ
-displacement (m)γ Electric potential (V)
Electric potential (V)2.5
21.5
10.5
0−0.5−1
−1.5−2
−2.5
Time
×10−3
-dis
plac
emen
t (m
)γ
-displacement (m)γ
0
0.00
5
0.01
0.01
5
0.02
0.02
5
0.03
0.03
5
0.04
0.04
5
0.05
0.05
5
Time
0
0.00
5
0.01
0.01
5
0.02
0.02
5
0.03
0.03
5
0.04
0.04
5
0.05
0.05
5
Time
0
0.00
5
0.01
0.01
5
0.02
0.02
5
0.03
0.03
5
0.04
0.04
5
0.05
0.05
5
×10−3
1.61.41.2
10.80.60.40.2
0
Firs
t pr
inci
pal s
trai
n
10080604020
0−20−40−60−80−100
Ele
ctri
c po
ten
tial
(V
)
First principal strain
First principal strain
First principal strain
First principal strain86420
−2−4−6−8
0
0.01
0.02
0.03
0.04
0.05
0.06
0.07
0.08
0.09 0.
1
0.11
-dis
plac
emen
t (m
)γ
-displacement (m)γ×10−3
76543210
Time
0
0.01
0.02
0.03
0.04
0.05
0.06
0.07
0.08
0.09 0.
1
0.11
Time
Firs
t pr
inci
pal s
trai
n
×10−3
100
50
0
−50
−100
0
0.01
0.02
0.03
0.04
0.05
0.06
0.07
0.08
0.09 0.
1
0.11
Time
Ele
ctri
c po
ten
tial
(V
)
Electric potential (V)
Figure 6: Displacement, strain and electric potential profiles for the different material models (at first resonance frequency).
it reasonably approximates to the 3D solution and in turn avery close approximate to the analytical solution. Critical tofinding a solution that is very close to the analytical solutionis the elements meshing size. It is for this reason that theresults of 2D analysis would be more accurate than the resultsof 3D analysis, in which one can use a very fine meshing size,whereas one can only use a coarse mesh in the 3D analysisto avoid having a tremendous number of elements that theFEM software could not solve. In the static analysis, thebeam’s free end is subjected to an arbitrarily chosen externalload of load FX = 0 and FY = −105 N/m2. Inertial anddamping effects are ignored. In the eigenfrequency analysis,the external load was removed and the model was submitted
for analysis enabling the first six modes of vibration andtheir associated frequencies to be realized. Time-dependentanalysis was performed to find the transient response to aharmonic load with the same amplitude as the static load(i.e., a harmonic load FX = 0 and FY = −105 sin(2π f t)). Theexcitation frequency ( f ) was set to the first natural frequencyfound in the eigenfrequency analysis. In order to find the off-resonance performance of the composite beam, the analysiswas also performed with the excitation frequencies belowand above the first resonance values. Damping is veryimportant in the analysis of time-dependent in order to getresults that are as close to the real world as possible. Thetransient analysis model in COMSOL Multiphysics uses the
ISRN Materials Science 7
0.05
0
50
0
−50
0.02
0.01
Electric potential (V)
PZT-5A
80
60
40
20
0
−20
−40
−60
−80
Max: 92.913
Min: −91.684
0.05
0
50
0
−50
0.02
0.01
(a)
0.05
0
50
0
−50
0.02
0.01
Electric potential (V)
60
40
20
0
−20
−40
−60
Max: 74.405
Min: −74.06PZT-5H
(b)
0.040.02
50
0
−50
0.02
0.01
Electric potential (V)
80
60
40
20
0
−20
−40
−60
−80
Max: 82.41
Min: −82.621
0
PZT-4
(c)
0.05
0.1
50
100
0
0.02
0.01
Electric potential (V)
100
50
0
−50
−100
Max: 111.802
Min: −111.683
0
PMN32
−50
−100
(d)
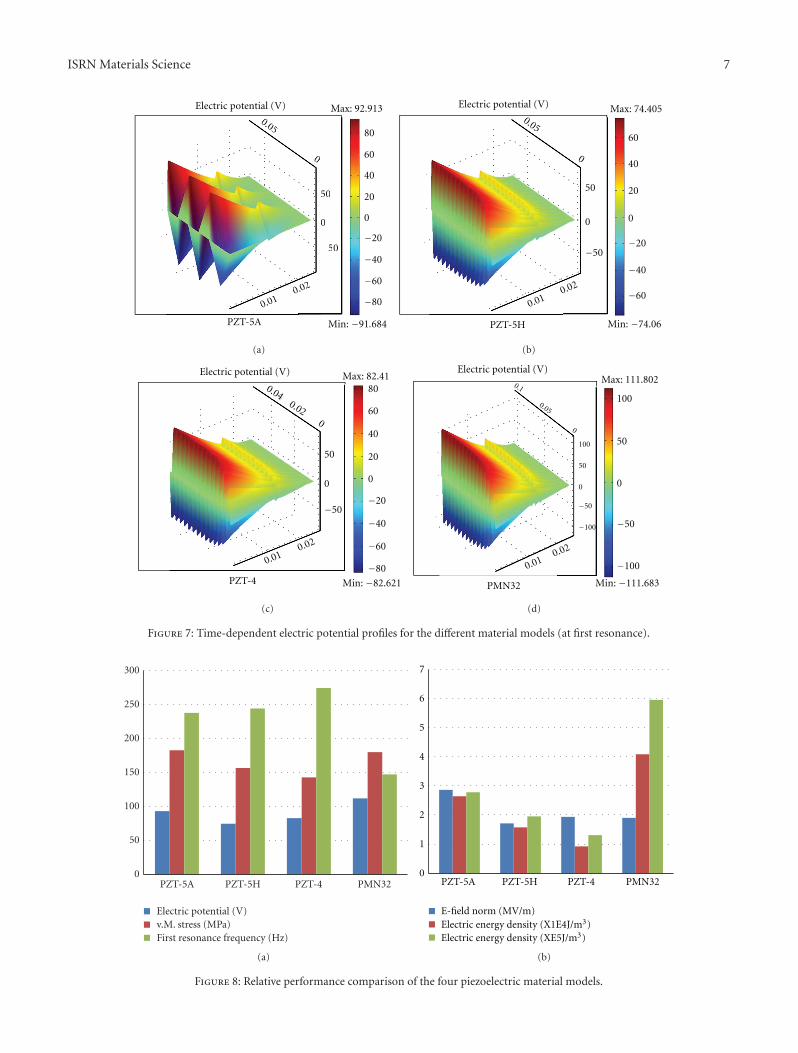
Figure 7: Time-dependent electric potential profiles for the different material models (at first resonance).
0
50
100
150
200
250
300
PZT-5A PZT-5H PZT-4 PMN32
Electric potential (V)v.M. stress (MPa)First resonance frequency (Hz)
(a)
0
1
2
3
4
5
6
7
E-field norm (MV/m)
PZT-5A PZT-5H PZT-4 PMN32
Electric energy density (X1E4J/m3)Electric energy density (XE5J/m3)
(b)
Figure 8: Relative performance comparison of the four piezoelectric material models.

8 ISRN Materials Science
Displacement First principal strain Electric potential
00.
002
0.00
40.
006
0.00
80.
010.
012
0.01
40.
016
0.01
80.
020.
022
0.02
40.
026
0.0120.01
0.0080.0060.0040.002
0−0.002−0.004−0.006−0.008−0.01−0.012
×10−4
6
5
4
3
2
1
0
Surface: total displacement (m)
Deformation: displacement
PZ
T-5
A
Max: 6.434e−4
54.543.532.521.510.5
Max: 5.455e−4
Min: 1.201e−6
×10−4
00.
002
0.00
40.
006
0.00
80.
010.
012
0.01
40.
016
0.01
80.
020.
022
0.02
40.
026
0.0120.01
0.0080.0060.0040.002
0−0.002−0.004−0.006−0.008−0.01−0.012
Surface: first principal strain
Deformation: displacement
Surface: Electric potential (V)Deformation: displacement
15
10
5
0
−5
−10
−15
00.
002
0.00
40.
006
0.00
80.
010.
012
0.01
40.
016
0.01
80.
020.
022
0.02
40.
026
0.0120.01
0.0080.0060.0040.002
0−0.002−0.004−0.006−0.008−0.01−0.012
Max: 15.835
Min: −15.832
0.010.0080.0060.0040.002
0−0.002−0.004−0.006−0.008−0.01−0.012
00.
002
0.00
40.
006
0.00
80.
010.
012
0.01
40.
016
0.01
80.
020.
022
0.02
40.
026
6
5
4
3
2
1
0
Max: 6.25e−4
×10−4
PZ
T-5
H
0.01
0.005
0
−0.005
−0.01
0
0.00
5
0.01
0.01
5
0.02
0.02
5
54.543.532.521.510.5
Max: 5.455e−4
Min: 1.063e−6
×10−4
0.010.0080.0060.0040.002
0−0.002−0.004−0.006−0.008−0.01−0.012
00.
002
0.00
40.
006
0.00
80.
010.
012
0.01
40.
016
0.01
80.
020.
022
0.02
40.
026
10
5
0
−5
−10
Max: 12.704
Min: −12.7
0.01
0.005
0
−0.005
−0.01
0
0.00
5
0.01
0.01
5
0.02
0.02
5
×10−4
PZ
T-4
Max: 5.006e−4
Min: 0
54.543.532.521.510.50
0.01
0.005
0
−0.005
−0.01
0
0.00
5
0.01
0.01
5
0.02
0.02
5
Max: 4.129e−4
Min: 9.451e−7
43.532.521.510.5
×10−4
0.01
0.005
0
−0.005
−0.010
0.00
5
0.01
0.01
5
0.02
0.02
5
Max: 14.959
Min: −14.964
10
5
0
−5
−10
0.010.0080.0060.0040.002
0−0.002−0.004−0.006−0.008−0.01−0.012
00.
002
0.00
40.
006
0.00
80.
010.
012
0.01
40.
016
0.01
80.
020.
022
0.02
40.
026
PM
N32
×10−3
1.41.210.80.60.40.20
Max: 1.59e−3
Min: 0
0.010.0080.0060.0040.002
0−0.002−0.004−0.006−0.008−0.01−0.012
00.
002
0.00
40.
006
0.00
80.
010.
012
0.01
40.
016
0.01
80.
020.
022
0.02
40.
026
Max: 1.382e−3
Min: 5.105e−7
1.2
1
0.8
0.6
0.4
0.2
×10−3
0.01
0.005
0
−0.005
−0.01
0
0.00
5
0.01
0.01
5
0.02
0.02
515
10
5
0−5
−10
−15
Max: 18.116
Min: −18.033
Figure 9: Static analysis profiles for different piezoelectric material models.
Rayleigh damping given by C = αdMM+βdKK , where C is thedamping matrix, M is the mass matrix, and K is the stiffnessmatrix [16]. Throughout the transient analysis modeling,the damping coefficients αdM and βdK were set at 94.25 and0.0001, respectively.
The piezoelectric beam was meshed using the COMSOLMultiphysics standard meshing tool at 11160 triangularelements and 65118 degrees of freedom. The optimalmesh density was determined by gradually increasing themesh density starting with a coarse mesh and finding thecorresponding final results. By following this method, it was
found that as the mesh density increases the final resultschange as well by a considerable value. At the mesh density of11160 elements, it was found that any increasing in the meshdensity had very small impact on the final results (a meshdensity of about 65000 elements changes the final results by∼0.01%).
3. Results Summary
See Figures 2, 3, 4, 5, 6, and 7 and Tables 2 and 3
ISRN Materials Science 9
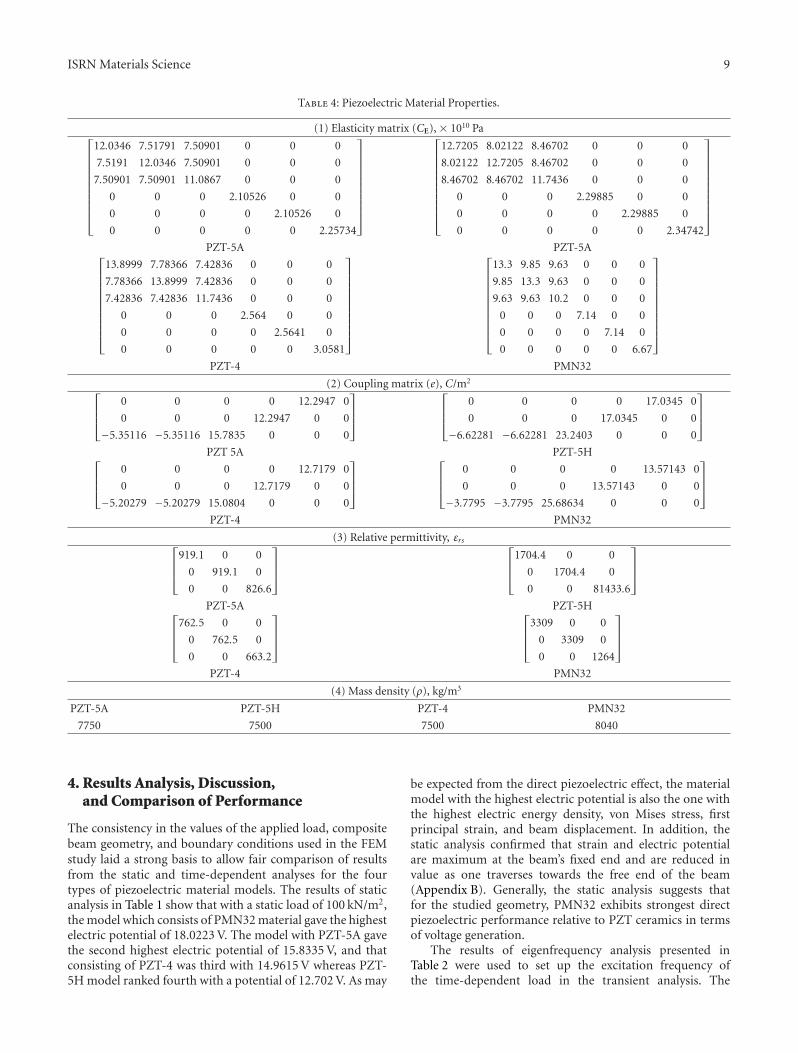
Table 4: Piezoelectric Material Properties.
(1) Elasticity matrix (CE), × 1010 Pa⎡⎢⎢⎢⎢⎢⎢⎢⎢⎢⎢⎣
12.0346 7.51791 7.50901 0 0 0
7.5191 12.0346 7.50901 0 0 0
7.50901 7.50901 11.0867 0 0 0
0 0 0 2.10526 0 0
0 0 0 0 2.10526 0
0 0 0 0 0 2.25734
⎤⎥⎥⎥⎥⎥⎥⎥⎥⎥⎥⎦
⎡⎢⎢⎢⎢⎢⎢⎢⎢⎢⎢⎣
12.7205 8.02122 8.46702 0 0 0
8.02122 12.7205 8.46702 0 0 0
8.46702 8.46702 11.7436 0 0 0
0 0 0 2.29885 0 0
0 0 0 0 2.29885 0
0 0 0 0 0 2.34742
⎤⎥⎥⎥⎥⎥⎥⎥⎥⎥⎥⎦
PZT-5A PZT-5A⎡⎢⎢⎢⎢⎢⎢⎢⎢⎢⎢⎣
13.8999 7.78366 7.42836 0 0 0
7.78366 13.8999 7.42836 0 0 0
7.42836 7.42836 11.7436 0 0 0
0 0 0 2.564 0 0
0 0 0 0 2.5641 0
0 0 0 0 0 3.0581
⎤⎥⎥⎥⎥⎥⎥⎥⎥⎥⎥⎦
⎡⎢⎢⎢⎢⎢⎢⎢⎢⎢⎢⎣
13.3 9.85 9.63 0 0 0
9.85 13.3 9.63 0 0 0
9.63 9.63 10.2 0 0 0
0 0 0 7.14 0 0
0 0 0 0 7.14 0
0 0 0 0 0 6.67
⎤⎥⎥⎥⎥⎥⎥⎥⎥⎥⎥⎦
PZT-4 PMN32
(2) Coupling matrix (e), C/m2
⎡⎢⎢⎣
0 0 0 0 12.2947 0
0 0 0 12.2947 0 0
−5.35116 −5.35116 15.7835 0 0 0
⎤⎥⎥⎦
⎡⎢⎢⎣
0 0 0 0 17.0345 0
0 0 0 17.0345 0 0
−6.62281 −6.62281 23.2403 0 0 0
⎤⎥⎥⎦
PZT 5A PZT-5H⎡⎢⎢⎣
0 0 0 0 12.7179 0
0 0 0 12.7179 0 0
−5.20279 −5.20279 15.0804 0 0 0
⎤⎥⎥⎦
⎡⎢⎢⎣
0 0 0 0 13.57143 0
0 0 0 13.57143 0 0
−3.7795 −3.7795 25.68634 0 0 0
⎤⎥⎥⎦
PZT-4 PMN32
(3) Relative permittivity, εrs⎡⎢⎢⎣
919.1 0 0
0 919.1 0
0 0 826.6
⎤⎥⎥⎦
⎡⎢⎢⎣
1704.4 0 0
0 1704.4 0
0 0 81433.6
⎤⎥⎥⎦
PZT-5A PZT-5H⎡⎢⎢⎣
762.5 0 0
0 762.5 0
0 0 663.2
⎤⎥⎥⎦
⎡⎢⎢⎣
3309 0 0
0 3309 0
0 0 1264
⎤⎥⎥⎦
PZT-4 PMN32
(4) Mass density (ρ), kg/m3
PZT-5A PZT-5H PZT-4 PMN32
7750 7500 7500 8040
4. Results Analysis, Discussion,and Comparison of Performance
The consistency in the values of the applied load, compositebeam geometry, and boundary conditions used in the FEMstudy laid a strong basis to allow fair comparison of resultsfrom the static and time-dependent analyses for the fourtypes of piezoelectric material models. The results of staticanalysis in Table 1 show that with a static load of 100 kN/m2,the model which consists of PMN32 material gave the highestelectric potential of 18.0223 V. The model with PZT-5A gavethe second highest electric potential of 15.8335 V, and thatconsisting of PZT-4 was third with 14.9615 V whereas PZT-5H model ranked fourth with a potential of 12.702 V. As may
be expected from the direct piezoelectric effect, the materialmodel with the highest electric potential is also the one withthe highest electric energy density, von Mises stress, firstprincipal strain, and beam displacement. In addition, thestatic analysis confirmed that strain and electric potentialare maximum at the beam’s fixed end and are reduced invalue as one traverses towards the free end of the beam(Appendix B). Generally, the static analysis suggests thatfor the studied geometry, PMN32 exhibits strongest directpiezoelectric performance relative to PZT ceramics in termsof voltage generation.
The results of eigenfrequency analysis presented inTable 2 were used to set up the excitation frequency ofthe time-dependent load in the transient analysis. The

10 ISRN Materials Science
eigenfrequency analysis reveals that the PZT-4 materialmodel has the highest first resonance frequency of 274.08 Hz,followed by PZT-5H with 243.86 Hz and PZT-5A with237.50 Hz, and PMN32 material model has the lowest firstresonance frequency of 146.88 Hz. Guided by the valuesof the first resonance frequencies, time-dependent analysisusing the same magnitude for the dynamic load wasperformed for the different material models and the plotsin Figures 3–5 show the strong frequency dependence ofthe key electrical and mechanical parameters in the directpiezoelectric property of the materials. Time-dependentresults show that stress, strain, electric field, and elec-trical potential are at their maximum values at the firstresonance; the values of these quantities decrease as theexcitation frequency deviates from the resonance frequency.The model which consists of PM32 material gave thehighest electric potential of 111.7425 V, followed by PZT-5A with 92.982 V, and that consisting of PZT-4 was thirdhighest with 82.51, and PZT-5H model gave the lowestpotential of 74.2325 V. Figure 7 shows the electric potentialdistribution along the composite beam’s top surface. Fromthe figure, it is observed that the electric potential is thehighest at the beam’s fixed end and changes from maximumto minimum with respect to time. This is in excellentagreement with expectation from the direct piezoelectricityrelationship: the maximum electric potential exists at thearea that has maximum strain. The relative performancecomparison is presented in Figure 8. These results confirmthe superior performance of PMN32 over PZT ceramicsas has been reported by the work of other researchers[10, 19, 20].
5. Conclusion
In this paper, FEM using the commercial COMSOL Multi-physics package was used to study performance of a compos-ite piezoelectric beam. For both static and time-dependentmechanical excitations, simulation results have shown thatPM32 has the highest greatest voltage generation ability.PZT-5A was a close second, followed by PZT-4 in the thirdrank while PZT-5H ranked forth with the lowest electricpotential. In addition to the largest values of the electricalpotential, the PMN32 material model also gave the highestaverage values of electric field, electric energy density, stress,strain, and displacement. On the other hand, PMN32 mate-rial model has the lowest first resonance frequency of com-pared to the PZT models. For future research, the strongpiezoelectric effect demonstrated by PMN32 needs to befurther studied, particularly in the context of vibration toelectric power generation to enable optimization of thematerial properties and design geometry of the cantileverdevice.
Appendices
A. Piezoelectric Material Properties(See Table 4)
For more details see Table 4.
B. Static Analysis Profiles for DifferentPiezoelectric Material Models (See Figure 9)
For more details see Figure 9.
References
[1] P. Muralt, “Ferroelectric thin films for micro-sensors andactuators: a review,” Journal of Micromechanics and Microengi-neering, vol. 10, no. 2, pp. 136–146, 2000.
[2] C. Niezrecki, D. Brei, S. Balakrishnan, and A. Moskalik,“Piezoelectric actuation: state of the art,” Shock and VibrationDigest, vol. 33, no. 4, pp. 269–280, 2001.
[3] J. F. Tressler, S. Alkoy, and R. E. Newnham, “Piezoelectric sen-sors and sensor materials,” Journal of Electroceramics, vol. 2,no. 4, pp. 257–272, 1998.
[4] S. R. Anton and H. A. Sodano, “A review of power harvestingusing piezoelectric materials (2003–2006),” Smart Materialsand Structures, vol. 16, no. 3, pp. R1–R21, 2007.
[5] K. A. Cook-Chennault, N. Thambi, and A. M. Sastry, “Power-ing MEMS portable devices-a review of non-regenerative andregenerative power supply systems with special emphasis onpiezoelectric energy harvesting systems,” Smart Materials andStructures, vol. 17, no. 4, Article ID 043001, 2008.
[6] S. P. Beeby, M. J. Tudor, and N. M. White, “Energy harvestingvibration sources for microsystems applications,” Measure-ment Science and Technology, vol. 17, no. 12, pp. R175–R195,2006.
[7] M. P. Buric, G. Kusic, W. Clark, and T. Johnson, “Piezo-electricenergy harvesting for wireless sensor networks,” in Proceedingsof the IEEE Annual Wireless and Microwave Conference (WAN-ICON ’06), pp. 1–5, December 2006.
[8] M. Guyomar and D. Lallart, “Recent progress in piezoelectricconversion and energy harvesting using nonlinear electronicinterfaces and issues in small scale implementation,” Micro-machines, vol. 2, no. 2, pp. 274–294, 2011.
[9] P. Marin-Franch, S. Cochran, and K. Kirk, “Progress towardsultrasound applications of new single crystal materials,” Jour-nal of Materials Science, vol. 15, no. 11, pp. 715–720, 2004.
[10] L. A. Ivan, M. Rakotondrabe, J. Agnus et al., “Comparativematerial study between PZT ceramic and newer crystallinePMN-PT and PZN-PT materials for composite bimorph actu-ators,” Reviews on Advanced Materials Science, vol. 24, no. 1-2,pp. 1–9, 2010.
[11] E. Aksel and J. L. Jones, “Advances in lead-free piezoelectricmaterials for sensors and actuators,” Sensors, vol. 10, no. 3, pp.1935–1954, 2010.
[12] H. Allik and T. J. R. Hughes, “Finite element method forpiezoelectric vibration,” International Journal for NumericalMethods in Engineering, vol. 2, no. 2, pp. 151–157, 1970.
[13] A. Benjeddou, “Advances in piezoelectric finite element mod-eling of adaptive structural elements: a survey,” Computers andStructures, vol. 76, no. 1, pp. 347–363, 2000.
[14] IRE, Standard on piezoelectric crystals: Determination of theelastic, piezoelectric and dielectric constant, 58 IRE 14, 1962.
[15] D. Popovici, F. Constantinescu, M. Maricaru, F. I. Hantila,M. Nitescu, and A. Gheorghe, “Modeling and simulation ofpiezoelectric devices,” in Modeling and Simulation, G. Petroneand G. Cammarata, Eds., pp. 472–500, Intech, Rijeka, Croatia,2008.
[16] COMSOL Multiphysics, version 3.5 Release Documentation,http://www.comsol.com/.

ISRN Materials Science 11
[17] V. Piefort, Finite element modeling of piezoelectric active struc-tures [Ph.D. thesis], University of Brussels, Brussels, Belgium,2001.
[18] M. Emam, Finite element analysis of composite piezoelectricbeam using Comsol [M.S. thesis], Drexel University, Philadel-phia, Pa, USA, 2008.
[19] S. R. Anton, Multifunctional piezoelectric energy harvestingconcepts [Ph.D. thesis], Virginia Polytechnic Institute and StateUniversity, Blacksburg, Va, USA, 2011.
[20] C. Green, K. M. Mossi, and R. G. Bryant, “Scavenging Energyfrom piezoelectric materials for wirelss sensor applications,”in Proceedings of ASME International Mechanical EngineeringCongress and Exposition (IMCE ’05), pp. 5–11, Orlando, Fla,USA, November 2005.

Submit your manuscripts athttp://www.hindawi.com
ScientificaHindawi Publishing Corporationhttp://www.hindawi.com Volume 2014
CorrosionInternational Journal of
Hindawi Publishing Corporationhttp://www.hindawi.com Volume 2014
Polymer ScienceInternational Journal of
Hindawi Publishing Corporationhttp://www.hindawi.com Volume 2014
Hindawi Publishing Corporationhttp://www.hindawi.com Volume 2014
CeramicsJournal of
Hindawi Publishing Corporationhttp://www.hindawi.com Volume 2014
CompositesJournal of
NanoparticlesJournal of
Hindawi Publishing Corporationhttp://www.hindawi.com Volume 2014
Hindawi Publishing Corporationhttp://www.hindawi.com Volume 2014
International Journal of
Biomaterials
Hindawi Publishing Corporationhttp://www.hindawi.com Volume 2014
NanoscienceJournal of
TextilesHindawi Publishing Corporation http://www.hindawi.com Volume 2014
Journal of
NanotechnologyHindawi Publishing Corporationhttp://www.hindawi.com Volume 2014
Journal of
CrystallographyJournal of
Hindawi Publishing Corporationhttp://www.hindawi.com Volume 2014
The Scientific World JournalHindawi Publishing Corporation http://www.hindawi.com Volume 2014
Hindawi Publishing Corporationhttp://www.hindawi.com Volume 2014
CoatingsJournal of
Advances in
Materials Science and EngineeringHindawi Publishing Corporationhttp://www.hindawi.com Volume 2014
Smart Materials Research
Hindawi Publishing Corporationhttp://www.hindawi.com Volume 2014
Hindawi Publishing Corporationhttp://www.hindawi.com Volume 2014
MetallurgyJournal of
Hindawi Publishing Corporationhttp://www.hindawi.com Volume 2014
BioMed Research International
MaterialsJournal of
Hindawi Publishing Corporationhttp://www.hindawi.com Volume 2014
Nano
materials
Hindawi Publishing Corporationhttp://www.hindawi.com Volume 2014
Journal ofNanomaterials