
FINITE ELEMENT STUDY OF UNSTIFFENED EXTENDED SINGLE …
136
FINITE ELEMENT STUDY OF UNSTIFFENED EXTENDED SINGLE PLATE SHEAR CONNECTIONS By Ahmad Abou-Zidan Submitted in partial fulfilment of the requirements for the degree of Master of Applied Science at Dalhousie University Halifax, Nova Scotia April 2014 © Copyright by Ahmad Abou-Zidan, 2014
Transcript of FINITE ELEMENT STUDY OF UNSTIFFENED EXTENDED SINGLE …

FINITE ELEMENT STUDY OF UNSTIFFENED EXTENDED SINGLE PLATE
SHEAR CONNECTIONS
By
Ahmad Abou-Zidan
Submitted in partial fulfilment of the requirements
for the degree of Master of Applied Science
at
Dalhousie University
Halifax, Nova Scotia
April 2014
© Copyright by Ahmad Abou-Zidan, 2014

ii
DEDICATION
This work is dedicated to
My Parents, Galal Abou-Zidan and Rulla Aboushahla,
For their endless love, support and encouragement

iii
TABLE OF CONTENTS
List of Tables ................................................................................................ vii
List of Figures .............................................................................................. viii
Abstract ......................................................................................................... xii
List of Abbreviations and Symbols Used .................................................... xiii
Acknowledgements...................................................................................... xvi
CHAPTER 1 Introduction ............................................................................ 1
1.1 Background of Research ........................................................................................... 1
1.2 Shear Tab Connection Behaviour ............................................................................. 2
1.3 Extended Shear Tab Connections ............................................................................. 4
1.4 Objectives and Scope ................................................................................................ 5
1.5 Outline of Research................................................................................................... 6
CHAPTER 2 Literature Review ................................................................... 7
2.1 Previous Research ..................................................................................................... 7
2.2 Eccentrically Loaded Bolt Groups .......................................................................... 13
2.3 Single Plate Design Procedure in Standards ........................................................... 16
2.3.1 CSA S16-09 ..................................................................................................... 16
2.3.2 AISC Manual 2011 .......................................................................................... 17

iv
2.4 Concluding Remarks ............................................................................................... 18
CHAPTER 3 Finite Element Model ...........................................................19
3.1 General .................................................................................................................... 19
3.2 Element Selection ................................................................................................... 19
3.3 Mesh Refinement .................................................................................................... 22
3.4 Boundary Conditions .............................................................................................. 26
3.5 Material Properties .................................................................................................. 29
3.6 Loading Analysis .................................................................................................... 31
3.7 Failure Criteria ........................................................................................................ 34
CHAPTER 4 Validation of the Finite Element Model ...............................38
4.1 Introduction ............................................................................................................. 38
4.2 Validation of the Finite Element Model ................................................................. 42
4.2.1 Three-bolt CST Connection ............................................................................. 42
4.2.2 Five-bolt CST Connection ............................................................................... 46
4.2.3 Three-bolt EST Connection ............................................................................. 48
4.2.4 Six-bolt EST Connection ................................................................................. 51
4.3 Summary ................................................................................................................. 52
CHAPTER 5 Parametric Study ..................................................................54
5.1 Introduction ............................................................................................................. 54

v
5.2 Web Slenderness Ratio of the Supporting Column ................................................ 58
5.3 Distance ‘a’ ............................................................................................................. 68
5.4 Plate Thickness ....................................................................................................... 72
5.5 Double-Row of Bolts .............................................................................................. 79
5.6 Beam Lateral Restraint ........................................................................................... 86
5.7 Beam Length-to-Depth Ratio .................................................................................. 91
5.8 Number of Bolts ...................................................................................................... 95
5.9 Evaluation of Available Effective Eccentricity Equations ................................... 104
CHAPTER 6 Summary and Conclusion ..................................................106
6.1 Summary ............................................................................................................... 106
6.2 Conclusion ............................................................................................................ 106
6.2.1 Web Slenderness Ratio of the Supporting Column ....................................... 106
6.2.2 Distance ‘a’ .................................................................................................... 107
6.2.3 Plate Thickness .............................................................................................. 107
6.2.4 Double-Row of Bolts ..................................................................................... 107
6.2.5 Lateral Restraint ............................................................................................. 108
6.2.6 Beam Length-to-Depth Ratio ......................................................................... 108
6.2.7 Number of Bolts ............................................................................................. 108
6.2.8 Evaluation of AISC manual 2011 .................................................................. 108

vi
6.3 Recommendations for Future Work...................................................................... 109
REFERENCES ............................................................................................110
APPENDIX A ..............................................................................................113
APPENDIX B ..............................................................................................115

vii
List of Tables
Table 2.1 Design values for conventional single plate shear connections ........................ 17
Table 3.1 Element type summary ..................................................................................... 22
Table 4.1 Details of finite element verification model ..................................................... 42
Table 4.2 Summary of validation of FE model................................................................. 53
Table 5.1 Details of finite element simulations ................................................................ 56
Table 5.2 Details of beam/column sections ...................................................................... 57
Table 5.3 Shear stress, MPa, distribution across 3 bolts for simulations 1 to 5 ............... 64
Table 5.4 Summary of effect of web slenderness ............................................................. 67
Table 5.5 Shear stress, MPa, distribution across 3 bolts for simulations 3, 6, 7, 8 and 9 . 70
Table 5.6 Summary of effect of distance‘a’...................................................................... 72
Table 5.7 Shear stress, MPa, distribution across 3 bolts for simulations 3, 10, 11 and 12 77
Table 5.8 Summary of effect of plate thickness ............................................................... 79
Table 5.9 Shear stress, MPa, distribution across 3 bolts for simulations 3, 13 and 14 ..... 85
Table 5.10 Summary of effect of single and double-row bolts ......................................... 86
Table 5.11 Shear stress distribution for beam length-to-depth ratio ................................. 93
Table 5.12 Summary of effect of beam length-to-depth ratio .......................................... 95
Table 5.13 Summary of effect of number of bolts .......................................................... 100

viii
List of Figures
Figure 1.1 Standard shear tab connection ........................................................................... 3
Figure 1.2 CST and EST framing into the supporting girder ............................................. 4
Figure 2.1 Illustration for instantaneous center of rotation method.................................. 15
Figure 3.1 Three-dimensional structural solid finite elements ......................................... 20
Figure 3.2 Beam end rotation of SOLID185 and SOLID186 ........................................... 21
Figure 3.3 Pretension surface for CST connection ........................................................... 22
Figure 3.4 FE mesh with maximum element width of 9.5 mm ........................................ 23
Figure 3.6 FE mesh with maximum element width of 2.4 mm ........................................ 24
Figure 3.7 Bolt mesh ......................................................................................................... 24
Figure 3.8 Mesh configuration for CST verification model (Astaneh et al. 1989) ........... 25
Figure 3.9 Shear versus rotation at bolt line for fine and very fine mesh densities .......... 26
Figure 3.10 Assembled extended shear tab connection .................................................... 28
Figure 3.11 EST connection illustrating loading appication and beam far end support .. 28
Figure 3.12 Mesh and boundary conditions at simply supported end of beam for EST
connections ....................................................................................................................... 29
Figure 3.13 Stress-strain curve for 350W steel (Ashakul 2004) ....................................... 30
Figure 3.14 Stress-strain curve for A325 high strength bolts (Rahman et al. 2003) ........ 31
Figure 3.15 Distributed pressure loading including stiffeners .......................................... 32
Figure 3.16 Twisting rotation for shear tab ...................................................................... 36
Figure 3.17 Connection rotations ...................................................................................... 37
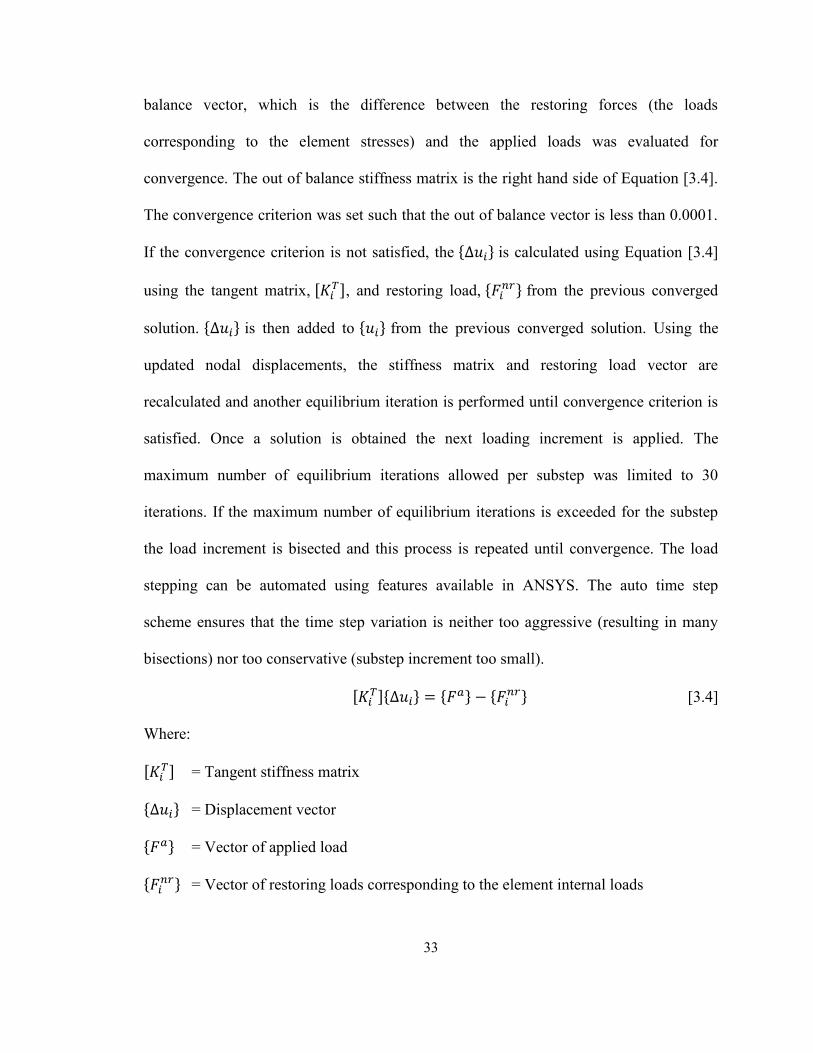
Figure 4.1 FE mesh configuration for the 3-bolt CST connection tested by Astaneh et al.
(1989) ................................................................................................................................ 39
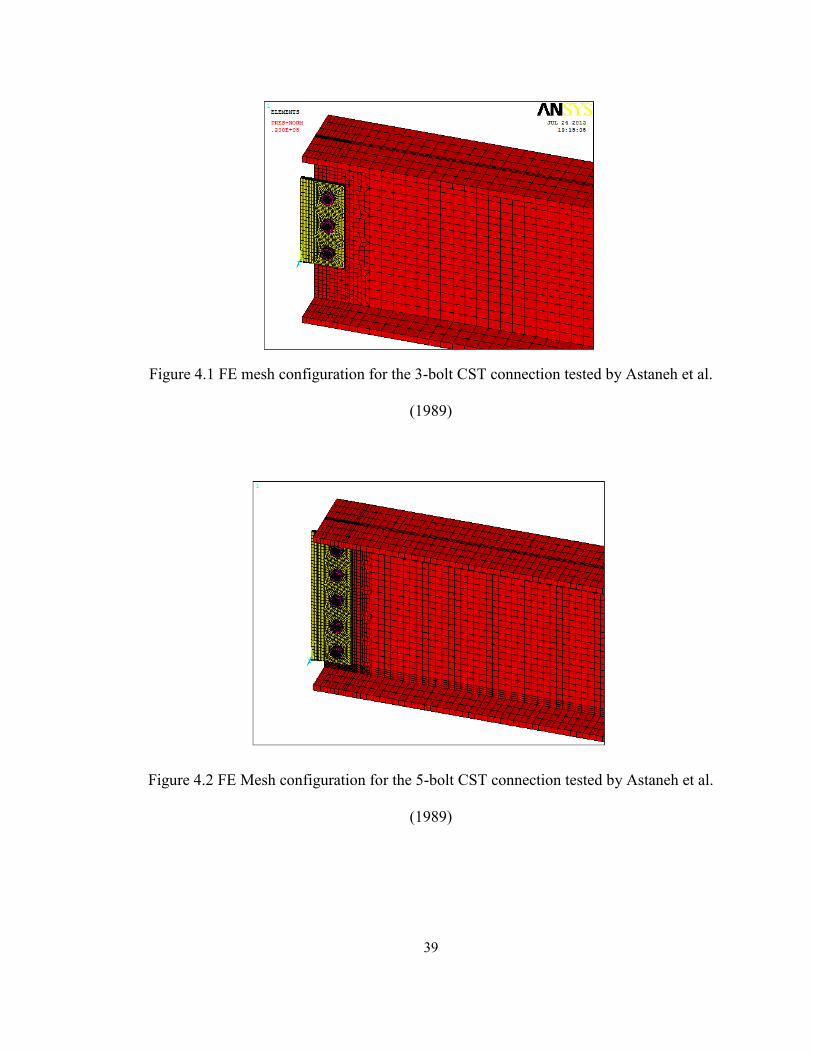
Figure 4.2 FE Mesh configuration for the 5-bolt CST connection tested by Astaneh et al.
(1989) ................................................................................................................................ 39

ix
Figure 4.3 FE mesh configuration for the 3-bolt EST connection tested by Sherman and
Ghorbanpoor (2002).......................................................................................................... 40
Figure 4.4 FE mesh configuration for the 6-bolt EST connection tested by Sherman and
Ghorbanpoor (2002).......................................................................................................... 40
Figure 4.5 Boundary conditions and load application for the 5-bolt CST connection tested
by Astaneh et al. (1989) .................................................................................................... 41
Figure 4.6 Boundary conditions and load application for the 3-bolt EST connection tested
by Sherman and Ghorbanpoor (2002)............................................................................... 41
Figure 4.7 Comparison of connection shear versus beam end rotation of 3-bolt CST
connection Astaneh et al. (1989) ...................................................................................... 43
Figure 4.8 Moment at weld line of 3-bolt CST connection .............................................. 44
Figure 4.9 Shear stress versus connection shear of 3-bolt CST connection Astaneh et al.
(1989) ................................................................................................................................ 45
Figure 4.10 Determination of point of inflection from ANSYS ....................................... 46
Figure 4.11 Comparison of connection shear versus beam end rotation of 5-bolt CST
connection by Astaneh et al. (1989) ................................................................................. 47
Figure 4.12 Shear stress versus connection shear of 5-bolt CST connection (Astaneh et al.
1989) ................................................................................................................................. 48
Figure 4.13 Comparison of connection shear versus beam end rotation of 3-bolt EST
connection by Sherman and Ghorbanpoor (2002) ............................................................ 49
Figure 4.14 Shear stress versus connection shear for validation study for 3-bolt EST
connection ......................................................................................................................... 50
Figure 4.15 Comparison of connection shear versus beam end rotation of 6-bolt EST
connection by Sherman and Ghorbanpoor (2002) ............................................................ 51
Figure 4.16 Shear stress versus connection shear for validation study for 6-bolt EST
connection ......................................................................................................................... 52
Figure 5.1 Typical EST connection for parametric study ................................................. 55
Figure 5.2 Symbols for typical beam/column crossection ................................................ 55
Figure 5.3 Stress-strain relationship for W-sections and shear tab in parametric study ... 57
Figure 5.4 Stress-strain relationship for A325 bolts in parametric study ......................... 57

x
Figure 5.5 Connection shear vs. web rotation for varying web slenderness ..................... 59
Figure 5.6 Column web rotation deformation for h/w=53.5 ............................................. 60
Figure 5.7 Column web von Mises stress distribution for h/w=53.5 ................................ 60
Figure 5.8 Connection shear versus beam end rotation for varying web slenderness ...... 61
Figure 5.9 Shear stress versus connection shear for simulation 3 .................................... 62
Figure 5.10 Horizontal shear stress versus connection shear for simulation 3 ................. 63
Figure 5.11 Distance of point of inflection to weld line for varying web slenderness ..... 65
Figure 5.12 Slenderness ratio versus measured eb ............................................................ 66
Figure 5.13 Shear vs. web rotation for varying distance ‘a’ ............................................. 69
Figure 5.14 Shear versus beam end rotation for varying distance ‘a’ .............................. 69
Figure 5.15 Distance of point of inflection to weld line for varying distance ‘a’ ............. 71
Figure 5.16 Distance ‘a’ versus FE measured eb .............................................................. 71
Figure 5.17 Shear versus vertical displacement for varying plate thickness .................... 73
Figure 5.18 Location of shear tab deflection measurment ................................................ 73
Figure 5.19 Connection shear versus shear tab rotation for varying plate thickness ........ 74
Figure 5.20 Connection shear versus shear stress for simulation 10 ................................ 75
Figure 5.21 Connection shear versus shear stress for simulation 11 ................................ 76
Figure 5.22 Connection shear versus shear stress for simulation 12 ................................ 76
Figure 5.23 Distance of point of inflection to weld line for varying plate thickness ....... 78
Figure 5.24 EST with double vertical bolt rows ............................................................... 80
Figure 5.25 Shear versus beam end rotation for double bolt row ..................................... 81
Figure 5.26 Connections shear versus Shear stress fluctuation for simulation 13 ............ 82
Figure 5.27 Von Mises stress, Pa, distribution for simulation 13 at 420 kN .................... 82
Figure 5.28 Connection shear versus horizontal shear stress for simulation 13 ............... 83
Figure 5.29 Connections shear versus shear stress fluctuation for simulation 14 ............ 84

xi
Figure 5.30 Distance of point of inflection to weld line for double vertical row ............. 86
Figure 5.31 Shear tab twist for simulation 15 ................................................................... 87
Figure 5.32 Beam lateral restraint locations ..................................................................... 88
Figure 5.33 Beam end rotation for lateral restraint parameter .......................................... 89
Figure 5.34 Connection shear versus rotational twist of shear tab ................................... 90
Figure 5.35 Lateral torsional buckling demonstarted in simulation 16 ............................ 91
Figure 5.36 Shear versus beam end rotation for length to depth ratio parameter ............. 92
Figure 5.37 Shear stress versus connection shear for simulation 18 (5 m beam) ............. 92
Figure 5.38 Shear stress versus connection shear for simulation 19 (7 m beam) ............. 93
Figure 5.39 Distance of point of inflection to weld line for varying beam length-to-depth
ratios .................................................................................................................................. 94
Figure 5.40 length-to-depth ratio versus measured eb ...................................................... 94
Figure 5.41 Coneection shear versus beam end rotation for number of bolt parameter ... 96
Figure 5.42 Shear stress versus connection shear for simulation 20 (4-bolt EST) ........... 97
Figure 5.43 Shear stress versus connection shear for simulation 21 (5-bolt EST) ........... 98
Figure 5.44 Shear stress versus connection shear for simulation 22 (6-bolt EST) .......... 98
Figure 5.45 Distance of point of inflection to weld line for number of bolt parameter .... 99
Figure 5.46 Number of bolts versus measured eb ........................................................... 100
Figure 5.47 Bolt movement for 3-bolt EST connection ................................................. 102
Figure 5.48 Bolt movement for 4-bolt EST connection ................................................. 102
Figure 5.49 Bolt movement for 5-bolt EST connection ................................................. 103
Figure 5.50 Bolt movement for 6-bolt EST connection ................................................. 103
Figure 5.51 Effective bolt eccentricity, eb, for all EST connections governed by bolt
fracture ............................................................................................................................ 105

xii
Abstract
Steel shear tabs are commonly used in beam-to-girder and beam-to-column connections
where a vertical plate is welded to the column or girder web, and bolt connected to the web
of the in-framing beam. The extended shear tab (EST) is one increasingly popular option
when it is necessary to bring the bolt line outside of shop applied coatings or encasement.
The effect of greater eccentricity resulting from extending the bolt line needs to be accounted
for in design.
The current Canadian steel design standard CSA S16-09 does not contain guidelines for
design of EST connections. The AISC Manual 2011 provides a design procedure for EST
connections based on the bolt effective eccentricity. The effective eccentricity values based
on this method have been shown to be overly conservative in some cases, which ultimately
leads to underestimation of the connection capacity
This research presents results of a numerical study on the behaviour amd strength of EST
connections using finite element modelling. The model is verified with experimental
results reported in literature. The parameters studied include the web slenderness ratio of
supporting column, distance ‘a’, plate thickness, double-row of bolts, beam lateral
restraint, beam length-to-depth ratio and number of bolts. The effects of these parameters
on the behaviour and bolt shear strength are presented and discussed. Results are also
used to assess the effectiveness of the AISC design provisions. It shows that in general,
the AISC 2011 design procedure is overly conservative in predicting bolt shear for
parameters studied. The overall underestimation on the capacity is around 60 to 65%
when compared with finite element results. The finite element determined eccentricity is
markedly lower than the AISC specified value. If the AISC 2011 design procedure is
used but in combination with the finite element determined effective eccentricity, the
estimate on bolt shear strength can be improved by approximately 30% for EST
coonetions with 3 and 4 bolts. But for higher number of bolts, the AISC design procedure
seems to provide adequate bolt strength estimate.

xiii
List of Abbreviations and Symbols Used
Ab: Bolt cross-sectional area
AISC: American Institute of Steel Construction
a: Distance between weld and bolt line
C: Number of effective bolts
CISC: Canadian Institute of Steel Construction
C.G: Cener of gravity of bolt group
CST: Conventional shear tab
C’: Coefficient from Part 7 for the moment only case
d: Beam depth
db: Bolt diameter
dp: Plate depth
EST: Extended shear tab
e: Bolt eccentricity
eb,AISC: Bolt eccentricity from AISC 2011
eb,FE: Bolt eccentricity from FE model
eweld: Weld eccentricity
Fa: Vector of applied load
FE: Finite element
Fin: Restoring load
Fu: Ultimate connection shear from FE model
Fu,AISC: Ultimate connection capacity from AISC 2011 design procedure

xiv
Fu,FE: Bolt shear including bolt group reduction factor based on eb,FE
Fv: Nominal bolt shear strength from AISC Table J3.2
fy: Plate yield stress
h: Plate height
h/w: Column web slenderness ratio
ICR: Instantaneous center of rotation
Kit: Tangent matrix
L: Beam length
Leh: Horizontal edge distance
Lp: Plate length
L/D: Beam length-to-depth ratio
lev: Vertical edge distance
n: Number of bolts
R: Bolt shear at a deformation Δ
Rult: Maximum bolt shear at maximum bolt deformation
S: Beam section modulus
SSL: Short-slotted bolt hole
STD: Standard bolt hole
tmax: Maximum plate thickness
tp: Plate thickness
tw: Beam web thickness
Vt: Shear force to cause twist failure
Zpl: Plastic section modulus of shear tab

xv
εe: Engineering strain
εtrue: True strain
θbeam: Beam end rotation
θtab: Shear tabe rotation
θtwist: Plate twist
θweb: Column web rotation
σe: Engineering stress
σt: True stress
Δ: Bolt deformation

xvi
Acknowledgements
I would like to give sincere gratitude to my research advisor, Dr. Yi Liu, who provided
valuable guidance throughout the course of this research. I will never forget her generous
contributions, understanding and encouragement as I overcome all the obstacles in the
completion of this research.
My thanks also go to my thesis committee members Dr. Farid Taheri and Dr. Stephen
Corbin for their time spent on reviewing this thesis. I would like to express my thanks to
the faculty and staff of the Department of Civil and Resource Engineering for their
support.
Lastly, I would like to thank my friends and family, most importantly, my parents who
provided me with unparalleled support and inspiration.

1
CHAPTER 1 Introduction
1.1 Background of Research
In steel construction, connections are used to connect either beams to girders or beams to
columns. Connection design is one crucial design component and often more complex
than the associated members design. Depending on the level of restraint developed by the
connections, they can be categorized into three main types, including rigid, simple and
semi-rigid connections. The connection type will affect the distribution of internal forces
throughout the structure. A simple connection assumes that the ends of beams and girders
are free to rotate in the plane of loading. This allows for the transfer of shear but prevents
the buildup of bending moment in the connection. Rigid connections assume that there is
no relative rotation between the two connecting members. This allows for the transfer of
both shear and bending moment. A semi-rigid connection provides a restraint somewhere
in between the simple and rigid connection and thus the shear and bending moment being
transferred is dependent on the stiffness of the connection. It should be pointed out that
the assumed connection type may not truly reflect the behaviour of the connection in
reality. For instance, simple connections may still develop small end moments, which
will be transferred to the supporting member. In some cases, as in double angle
connections, this moment is small and often ignored in design while in other cases such
as shear tab connections, this moment needs to be considered.

2
1.2 Shear Tab Connection Behaviour
Shear tab connections are also known as single plate connections, which consist of a
single rectangular steel plate with pre-punched holes. Figure 1.1 shows a schematic view
of a shear tab connection. Shear tabs are often used to frame beams into supporting girder
webs or column webs or flanges. The steel plate is often shop-welded to the supporting
member and field bolted to the supported beam. It is a simple, inexpensive and popular
shear connection for light to moderate end shears. As shown in Figure 1.1, the connection
detail leads to an offset between the vertical weld and the centroid of the bolt group. This
distance between the weld line and bolt line is referred to as “a”. At low load levels, the
shear tab is quite stiff. This results in the development of some moment in the connection
and the beam, which is equivalent to an eccentric load on the bolts and welds. This
eccentricity is based on the location of the point of inflection. As the load on the beam
increases and the shear tab begins to yield, the inflection point moves toward the support.
The effective bolt eccentricity, eb, is defined as the distance between the point of
inflection in the beam to the bolt line at failure as seen in Figure 1.1. The bolts in shear
tab connections should therefore, be designed to resist shear from the supported beam and
an eccentric moment equal to the product of the connection shear and e.

3
Figure 1.1 Standard shear tab connection
The behaviour and strength of shear tab connections has been studied for the past three
decades. The results have shown that the end moments developed depend on many
geometric and material properties such as the thickness of the plate; the number, size and
arrangement of bolts, and the flexibility of the supporting member. However, majority of
the research has been focused on the shear tab connections with “a” ≤ 90mm. These
connections are referred to as conventional shear tab connections. The design guidelines
and recommendations based on these research were then only applicable to shear tab
connections with “a” ≤ 90mm.

4
1.3 Extended Shear Tab Connections
In recent shear tab application, shear tabs with long distance “a” (> 90mm) are used when
it is desired to extend the bolt line outside the supporting member’s flange. Extending the
shear tab beyond the supporting member’s flange eliminates the need to cope the
supported beam. Additionally, the extension eases erection, as more space is available to
fit bolt wrenches for fastening bolts. The extension results in quickening the erection and
fabrication processes, which in turn leads to reduction in costs. To distinguish from the
conventional shear tab (CST), the shear tab with an a-distance greater than 90 mm is
referred to as extended shear tab (EST). Figure 1.2 illustrates both the CST and EST
connection.
Figure 1.2 CST and EST framing into the supporting girder
Compared with the conventional shear tab connections, the previous research on the
extended shear tab connections is limited and experimental studies and the test results are
scarce in the reported literature. The few available studies have shown that geometric and

5
material factors influential for conventional shear tab connection will also affect the
behaviour of extended shear tab connection. But the longer shear tabs in ESTs will result
in different effective eccentricity and failure modes that were not observed in CSTs, and
ultimately affect the capacity. For design practice, the current Canadian steel design
standard S16-09 (2010) does not contain guidelines for the design of ESTs. The AISC
manual 2011 just included a new section on the design of ESTs but the accuracy of the
provision needs to be evaluated with more studies.
1.4 Objectives and Scope
This study is therefore motivated to investigate the behaviour and strength of extended
shear tab connections. A numerical study based on finite element modeling is used in this
investigation. The model is verified using available test results reported in the literature.
A parametric study using the verified model is subsequently conducted to study the
effects of several parameters on the behaviour and strength of the connections. The
detailed objectives of this research are:
1. to conduct a comprehensive literature review on research relevant to the behaviour
and strength of extended shear tabs and collect available test results.
2. to develop a finite element model for the extended shear tab connections.
3. to validate the finite element model using experimental results from available
literature.
4. to conduct a parametric study to investigate the effect of parameters including
supporting member stiffness, distance “a”, plate thickness, double-row of bolt

6
arrangement, lateral restraint of the beam, beam length-to-depth ratio and number of
bolts on the behaviour and strength of extended sher tab connections.
5. to examine the accuracy of provisions suggested in the AISC manual 2011 on the
design of extended shear tab connections and make recommendations as appropriate.
1.5 Outline of Research
This thesis commences with a review of previous research conducted on extended shear
tab connections in Chapter 2. Chapter 3 describes the development of the finite element
model. The verification of the model with available test results is presented in Chapter 4.
Chapter 5 summarizes and discusses the results of parametric study using the finite
element model. Chapter 6 provides the summary, conclusions and recommendations from
this research.

7
CHAPTER 2 Literature Review
The research on shear tab connections dated back in 1960s with earlier research being
focused on the conventional shear tab connections. In 2000s the research in extended
shear tab connections began to attract attention as this type of connections became
popular in practice. It should be pointed out that several failure modes of shear tab
connections might be possible depending on geometric and material properties of the
connection. Previous research on CSTs revealed that in addition of the shear failure of the
bolts, yielding of the tab, fracture of the tab, bearing failure of the beam web or shear tab,
and fracture of welds need also be checked as other limit states. Since this study focuses
on the bolt shear capacity of the connection, the following literature review summarizes
the results more pertinent to bolt shear strength.
2.1 Previous Research
Lipson (1968) tested 85 conventional shear tab connections. The number of bolts was
varied from 2 to 6 and the ‘a’ distance was kept at 45 mm (1.75 in) or 65 mm (2.5 in).
Moment-rotation curves obtained from test results have shown that single plate
connections with two bolts experienced long yielding at a constant connection moment,
and as the number of bolts increased the moment increased at a decreasing rate. It was
also shown that the flexibility of the connection was entirely due to the bolt displacement
in the bolt holes where significant deformations were observed. The center of rotation
was found to coincide with the centroid of the bolt group. Some of the single plate shear

8
connections failed under load by means of cracking in the plate below the bottom bolt,
cracking of the weld or cracking in the tension edge of the plate.
Richard et al. (1980) conducted five full-scale beam tests on three, five and seven bolted
CST connections. One end of the beam was bolted to a shear tab that was in turn welded
to the flange of the supporting column and the other end of the beam rested on a roller
support. A concentrated load was applied at mid-span of the beam. The location of the
point of inflection as a function of the applied load was experimentally determined. The
researchers concluded that the effective eccentricity is a function of number and size of
the bolt and the section modulus of the beam.
Young and Disque (1981) developed a set of design tables for the design of CSTs based
on results obtained by Richard et al. (1980). The tables were developed with the
assumption the connection support is fixed. The eccentricity, e, can be determined
through a simple quotient shown below in Equation [2.1]. The e(s)0.4 value is obtained
from a table according to the L/D, n and bolt size. The (S)0.4 value is obtained from
another set of tables according to the size of the beam section.
4.0
4.0)(
S
See [2.1]
Richard et al. (1982) conducted research on conventional single plate connections with
slotted holes. It was suspected that connection moment would significantly lessen with
the use of slotted holes. Fifteen full-scale specimens were tested using 22 mm (7/8-in)

9
nominal diameter A307 bolts. The bolts were snug-tightened using a wrench in some, and
were simply finger-tightened in others. The results showed that the eccentricity, e, was
virtually zero for all finger-tightened tests when compared to connections with snug-
tightened bolts. It can also be seen from the test results that for the same number of bolts,
higher beam length-to-depth ratios resulted in larger eccentricities.
Hormby et al. (1984) conducted eight full-scale tests using a 9.75 m (32 ft) long W24x55
steel section connected to a rigid support at one end with a 9.5 mm (3/8 in) plate and
simply supported on a roller on the other end. The experimental eccentricity test results
for slotted holes compared well with the predicted design curve eccentricities developed
by Richard et al. (1980). It was concluded that the design curve developed by Richard et
al. (1980) can be used to determine eccentricities for single plate connections with slotted
holes.
Astaneh et al. (1989) tested five full-scale beam-to-column single plate CST connections.
It was found that the strength of shear tabs was a function of the stiffness of the
supporting member whether being a beam or a column. Shear tabs connected to column
flanges were more so restrained from end rotation than when connected to the web of a
girder. This resulted in different effective eccentricities on the bolts. Eccentricities were
found to be a function of the number of bolts. Shear tabs on flexible supports have larger
bolt eccentricities and therefore lower resistances. However, as the number of bolts
increases to seven, the effective eccentricities are the same for both rigid and flexible

10
supports. Astaneh et al. (1989) proposed an analytical solution, expressed in Equations
[2.2] and [2.3], for determining the effective eccentricity for bolts.
for rotationally rigid support:
ammne )25)(1( [2.2]
for rotationally flexible support:
aammne )25)(1( [2.3]
The authors developed a design procedure for single plate shear connections. The
procedure ensures that ductile yielding of plate precedes the brittle fracture of bolts, tab
and welds. The design procedure developed by Astaneh et al. (1989) was adopted by the
Canadian steel design standard S16-09 for conventional shear tab connection design.
Porter and Astaneh (1990) conducted experimental testing of conventional shear tab
connections in short slotted holes. Four CST connections with 3, 5, 7 and 9 bolts in
slotted holes were tested. The researchers recommended the following equations for CST
connections with short-slotted holes.
an
e 3
2 for a rigid support with short slotted holes [2.4]
aan
e 3
2 for a flexible support with short slotted holes [2.5]

11
The design equations recommended by Astaneh et al. (1989) and Porter and Astaneh
(1990) were adopted in the AISC Manual of steel construction, Load and Resistance
Factor Design (1994) single plate shear connection design procedure.
Sherman and Ghorbanpoor (2002) tested full-scale connection specimens to develop a
design procedure for extended shear tabs welded to the webs of supporting girders or
columns. This was the first reported literature on EST connections. They concluded that
for three and five-bolt connections, the calculated connection ultimate capacities based on
measured eccentricities correlated better with experimental results than capacities
calculated using the eccentricity values of the AISC 1994 equations for CST connections.
As the number of bolts increases to six and eight, the AISC eccentricity equations
predicted the experimental eccentricities much closer. Therefore, Sherman and
Ghorbanpoor recommended Equation [2.6] and [2.7] for determining the effective bolt
eccentricity for EST connections where eb is in inches.
, in for n ≤ 6 [2.6]
, in for n > 6 [2.7]
They also indentified two additional limit states that may govern the design of
unstiffened extended shear tab connections framing into column webs. A bending failure
of the column web support and twisting failure of the shear tab were identified. The
twisting of the shear tab is caused due to the eccentricity of the shear force to the centroid
of the shear tab as the beam web is connected to one side of the extended shear tab. The
twisting shear stress becomes increasingly pronounced as the shear tab becomes longer

12
and deeper. When the beam at connection location is not laterally braced, the twisting of
the shear tab may lead to failure. They proposed the following equation to estimate the
capacity for the twisting failure of shear tab.
yppt ftdV 3.0 [2.8]
Where
Vt = Maximum allowable shear force
yf = Shear tab yield stress
pd = Shear tab depth
pt = Shear tab thickness
Ashakul (2004) conducted a finite element (FE) analysis on both CST and EST
connections using software ABAQUS. Several parameters were considered such as the a-
distance, plate thickness, and double-row bolt connections. It was concluded that the
eccentricity was not a function of the a-distance and those connections that did not satisfy
the plate ductility criteria would result in significant moments. Additionally, it was found
that force redistribution takes place for double-row connections. However, redistribution
did not occur when plates were thick, resulting in bolts of the farther row from the
supporting member fracturing, whereas the other row resisting much less force.
Creech (2005) conducted ten full scale conventional single plate connections and results
were used to quantify the effective eccentricity. The ten specimens included flexible and
rigid support conditions and STD and SSL holes. A key observation made by Creech was

13
that eccentricity can be neglected for connections with more than three bolts if the 20%
bolt strength reduction factor is included in the nominal bolt shear strength. The AISC
Specification (2005) incorporates the 20% reduction factor to the nominal bolt shear
strength to account for non-uniform load distributions in connections.
Rahman et al. (2007) showed that the finite element modeling can be used to simulate the
behaviour of EST connections. The model developed provided results in good agreement
with the experimental results. The authors pointed out that the details of the connection
such as boundary conditions, load application, coefficient of friction between surfaces,
and pretension of bolts should be accurately modeled to produce satisfactory results.
However, no parametric study was conducted using the model.
2.2 Eccentrically Loaded Bolt Groups
When the bolt group is subjected to an eccentric load, the bolts must be designed to resist
the combined effect of the direct shear and induced moment. There are two main analysis
methods for design, i.e., the elastic method and the instantaneous center of rotation (ICR)
method. The elastic method is more simplified but may be excessively conservative
because it neglects ductility of the bolt group and the potential for load redistribution.
The ICR method is more accurate but calculations are more tedious and requires
iterations to the solution.
In the elastic method, the eccentrically applied load in a single plate shear connection is
resolved into a direct shear, P, acting through the center of gravity (C.G) of the bolt group

14
and a moment, P*e, where e is measured from the C.G of the bolt group to the load P.
The magnitude of force in each bolt is then the result of the load P plus the couple P*e.
The moment is assumed to cause the plate to rotate about the C.G of the bolt group. Each
bolt is assumed to resist an equal share of the direct shear and a share of the eccentric
moment proportional to its distance from the C.G. The amount of rotation or strain at a
particular bolt is proportional to its distance from the C.G. This means that stress is the
greatest at the bolt furthest from the C.G of the bolt group since stress is proportional to
strain in the elastic range. There are two key assumptions in the elastic method. Firstly,
the elastic method assumes a linear relationship between the loads and deformations in
the bolts. Additionally, this method assumes that the yield stress is not exceeded when the
ultimate load on the connection is reached.
In the instantaneous center of rotation method, the combined effect of rotation and
translation is equivalent to a rotation about a point defined as the ICR. This concept was
first introduced by Yarimci and Slutter (1963) based on riveted connections and the
material was assumed elastic. The ICR is located a certain distance e’ from the center of
gravity (C.G) of the bolt group as shown in Figure 2.1. The ICR falls on a horizontal line
through the center of gravity of the bolt group and is found by trial and error. The bolt
deformations are assumed to vary in proportion to their distance from the ICR. Based on
experimental data the maximum bolt deformation is set to be 8.6 mm (0.34 in). The
nominal shear strength of the bolt group is the sum of the individual strengths of all bolts.
The individual resistance of each bolt is assumed to act on a line perpendicular to ray
passing through the ICR and the centroid of that individual bolt. The correct location of

15
the ICR is determined when the three equations of equilibrium are satisfied (∑
∑ ∑ ). This method no longer assumes a linear relationship between the
load and bolt deformation as was assumed in the elastic method.
Figure 2.1 Illustration for instantaneous center of rotation method
For calculating the shear of a bolt at any given deformation, Crawford and Kulak (1968)
proposed the Equation [2.9] as follows:
55.010 )1( eRR ult [2.9]
where
R = Nominal shear strength of one bolt at a deformation ∆, kips
Rult = Ultimate shear strength of one bolt, kips
∆ = Total deformation, including shear bearing and bending
deformations in the bolt and bearing deformation of the connection
elements, in

16
Equation [2.9] developed by Crawford and Kulak (1968) and the ICR method developed
by Yarimci and Slutter (1963) are the basis of procedures in the current AISC 2011, Steel
Construction Manual for design of EST connections. A set of tables entitled ‘Coefficients
C for Eccentrically Loaded Bolt Groups’ are the expansion of these concepts. The
coefficient C, known as the number of effective bolts, is extracted from these tables
depending on the bolt pattern, bolt spacing, eccentricity and angle of inclined loading.
This coefficient predicts the number of ‘effective’ bolts in the single plate shear
connection.
2.3 Single Plate Design Procedure in Standards
As mentioned, early research on the ultimate capacity was focused on conventional shear
tab connections. The design standards of North America were developed based largely on
empirical interpretation of experimental results on specimens satisfying certain geometric
restraints. The following sections present design methods specified in the Canadian steel
design standard CSA S16.09 (2010) and AISC manual 2011. These methods are used in
the later calculation in Chapter 5.
2.3.1 CSA S16-09
The Canadian steel design standard S16-09 does not provide an explicit design provision
for CST connections. Instead, it provides a factored load resistance table for CST
connections satisfying specific plate geometry and bolt configurations. The table is based
on the test results and design recommendations suggested by Astaneh et al. (1989). The
table is only applicable for CST connections with an “a” distance of 75 mm between the

17
bolt line and the weld line. There are currently no guidelines for the design of EST
connections in the CSA S16-09.
2.3.2 AISC Manual 2011
The design method for CSTs in the earlier edition of AISC manual 2005 was based on the
work by Astaneh et al. (1989) and Creech (2005) where the bolt eccentricity is implicitly
considered by reducing the nominal bolt group shear strength by 20%. However, the
nominal bolt shear strength was increased by 10% in the AISC specification 2010, so
overlooking the bolt group eccentricity was no longer suitable. The main changes made
to the CST design procedure were based on research done by Muir and Thornton (2011).
In this edition, design values of the effective eccentricity for conventional single plate
shear connections are no longer ignored. The eccentricity values for CST connections are
listed in Table 2.1. They are dependent on the number of bolts and the hole type (STD or
SSLT).
Table 2.1 Design values for conventional single plate shear connections
n Hole Type e, in Maximum tp or tw,
in
2 to 5 SSLT a/2 None
STD a/2 db/2+(1/16)
6 to 12 SSLT a/2 db/2+(1/16)
STD a db/2-(1/16)
For the design of extended shear tab connections, no limitations are placed on the number
of rows or the number of bolts used in the connection. Most importantly the distance
from the weld line to the bolt line closest to the support is not limited. The AISC manual

18
2011 EST design procedure states that the bolt eccentricity is to be taken equal to the
distance from the weld line to the bolt line (distance ‘a’). The EST connections needs to
be checked for plate shear yielding, shear rupture, block shear rupture and plate buckling.
2.4 Concluding Remarks
The literature review shows that most of available research has been conducted to study
the behaviour of conventional shear tab connections. The research on extended shear tab
connections only began in 2000s which led to limited technical and scientific information
available. Moreover, the design procedures developed were largely based on previous
research results for shear tab connections with certain geometric and material properties
and thus the validity of these procedures applied to other situations is questionable. The
finite element modeling has been shown to be an effective tool to investigate a wide
range of parameters and results can be used to supplement the test data. However, the
parameters considered in previous finite element studies are limited. Additionally, there
is little data on the effect of the lateral support on the twisting on EST connections. More
information on the beahaviour and strength of extended shear tab connections as affected
by influential parameters is needed.

19
CHAPTER 3 Finite Element Model
3.1 General
The numerical simulations were conducted using the finite element software ANSYS
13.0 (2010). ANSYS is capable of simulating the nonlinear structural response
incorporating various geometric and material characteristics. The finite element model
developed in this study consists of a beam framing into the web of a supporting column
with a single plate shear connection. The following sections describe the element
selection, finite element mesh, material properties, boundary conditions, load application,
and analysis technique. The finite element model was verified with experimental results
on CSTs obtained by Astaneh et al. (1989) and on ESTs obtained by Sherman and
Ghorbanpoor (2002).
3.2 Element Selection
Several finite elements were investigated in determining which elements can most
efficiently simulate the nonlinear structural response of the connection. The aim was to
generate a model that can achieve a balance between running time and structural response
accuracy. The first order SOLID185 and second order SOLID186 finite elements were
examined. The SOLID185 is a three-dimensional eight-node structural solid with three
translational degrees of freedom per node, suitable for modeling large rotation and large
strain nonlinearities. The high order SOLID186 finite element is similar to SOLID185
except that it is a 20-node solid with three translational degrees of freedom per node.

20
They are shown in Figure 3.1. The SOLID186 exhibits quadratic displacement behaviour
and is able to capture the stresses and strains more accurately in vicinities of high stress
concentrations. However, the use of SOLID186 increases the simulation time
significantly due to the quadratic displacement behaviour and number of nodes. The 3-
bolt CST connection tested by Astaneh et al. (1989) was simulated using both SOLID185
and SOLID186. Figure 3.2 illustrates the shear versus beam end rotation of the
connection using the two elements. It can be seen that the beam rotation response
obtained using both elements were identical. The total computing time for the first order
SOLID185 was approximately 3 hours and for the SOLID186 was 7 hours. Therefore, the
SOLID185 elements were used in the model.
Figure 3.1 Three-dimensional structural solid finite elements

21
Figure 3.2 Beam end rotation of SOLID185 and SOLID186
Targe170 and Conta174 are surface to surface contact elements which overlay solid
elements to simulate the physical transfer of force through contact and friction between
the two bodies. Targe170 and Conta174 are 4-node quadrilateral element. Contact
elements were used on the adjacent surfaces of the shear tab and beam web, the bolt
shank and shear tab holes, the bolt shank and web holes, the bolt head and shear tab and
finally the nut and beam web surfaces. The PRETS179 element was used to define the
pretension section within the meshed high strength bolts. This element has one
translational degree of freedom. The pretension force was applied normal to the cross-
section of the bolt shank (in the z-direction). Figure 3.3 illustrates the pretension surface
for a 3-bolt CST connection. A summary of the various elements used in the analysis is
provided in Table 3.1.
0
50
100
150
200
250
300
350
400
450
500
0 0.02 0.04 0.06 0.08
Sh
ear
(kN
)
Beam end rotation (rad)
SOLID185
SOLID186

22
Figure 3.3 Pretension surface for CST connection
Table 3.1 Element type summary
Element Name Number of Nodes Degrees of Freedom
SOLID185 8 UX,UY,UZ
SOLID186 20 UX,UY,UZ
TARGE170 8 UX,UY,UZ
CONTA174 8 UX,UY,UZ
PRETS179 3 User Defined
3.3 Mesh Refinement
Since the behaviour of the shear tab connection rather than the global behaviour of the
beam is the focus of the study, the mesh density for the shear tab is more important.

23
Therefore, a mesh density study was carried out for the shear tab. The 3-bolt connection
tested by Astaneh et al. (1989) was modelled with three different shear tab mesh
densities. The mesh densities had a maximum element width of 9.5, 4.8 and 2.4 mm
Figures 3.4, 3.5 and 3.6 illustrate the three meshes. The shear tab was restrained from
translations in the x, y and z-directions along the weld line.
Figure 3.4 FE mesh with maximum element width of 9.5 mm
Figure 3.5 FE mesh with maximum element width of 4.8 mm

24
Figure 3.6 FE mesh with maximum element width of 2.4 mm
To ensure smooth contact between the bolt shank and the holes, the bolt had the same
mesh size as the plate. The bolt, bolt head and nut were modelled as one solid body as
shown in Figure 3.7. Additionally, a 2 mm gap was provided between the bolt shank and
the holes in the shear tab and beam web. This was to mimic the true geometry of the
shear connection where the punched holes are commonly 2 mm bigger in diameter than
the bolts. The contact elements, Targe170 and Conta174, were used to simulate the
physical transfer of force through contact and friction between the two bodies.
Figure 3.7 Bolt mesh

25
Two mesh sizes were implemented for the beam. In the vicinity of the bolts a fine mesh
was needed to capture the high stress concentrations with element dimensions of 9.5 mm
by 10mm. Away from the bolt line, the mesh dimension increased to 17 mm by 19 mm.
The beam flange was modelled with 6 elements across the width of the beam. Figure 3.8
illustrates the mesh configuration of the beam and the connection.
Figure 3.8 Mesh configuration for CST verification model (Astaneh et al. 1989)
The supporting member, column, has the same mesh configuration as the shear tab. This
allows for the nodes along the end of the shear tab to be merged with the nodes of the
supporting member.
The connection shear versus shear tab rotation along the bolt line was produced for the
three single plate mesh densities. As shown in Figure 3.9, it can be seen that the 9.5mm

26
element mesh produces almost the same result as the two other finer mesh. However, the
finer meshes allow the contacts to be simulated more smoothly and effectively.
Additionally, the finer meshes graphs flatten once maximum shear is reached. The 2.4
and 4.8 element widths produced identical results. However the computation time for the
mesh with 2.4mm element width resulted in a longer computation time. Therefore, the
4.8 mm mesh density is used in all simulations, for both the validation study of the FE
model and in the parametric study.
Figure 3.9 Shear versus rotation at bolt line for fine and very fine mesh densities
3.4 Boundary Conditions
Boundary conditions assumed for the FE model to verify with test results were modelled
to be consistent with the experimental setup (Astaneh et al. 1989; Sherman and
Ghorbanpoor 2002). In the test setup of Astaneh et al. (1989), the beam was subjected to
0
50
100
150
200
250
300
350
400
450
500
0.000 0.005 0.010 0.015 0.020 0.025
Shea
r (k
N)
Shear tab rotation (rad)
2.4 mm element width
4.8 mm element width
9.5 mm element width

27
a single point load at its midpsan. At two end supports, the shear tab was weld connected
to the center of the flange of the supporting column which was fixed to concrete walls.
This setup resulted in a relatively rigid connection along the weld line for the shear tab.
Therefore, the shear tab was modelled to be restrained against translation in the x, y and
z-directions along the weld line. Using the symmetric state of loading, only half of the
beam was modelled and the mid-span nodes were restrained from translation in the x-
direction. Furthermore, the top and bottom flanges were restrained along the length of the
beam to prevent lateral torsional buckling.
For the subsequent parametric study and EST validation study (Sherman and
Ghorbanpoor 2002), the supporting column was modeled and the shear tab is connected
to the centerline of the web of the column. The supporting member (column) is assumed
to be fixed at two ends where all nodes ends are restrained against translations in the x, y
and z-directions. The beam top flange along the length of the beam was restrained in the
lateral direction (z-direction) to prevent lateral torsional buckling unless otherwise stated.
In the EST validation study the load was offset from center to simulate a shear and end
rotation equivalent to a beam subjected to a uniformly distributed load. The full beam
length was modelled and the support at the far end was restrained against translations in
the x, y and z-directions to idealize a simply supported member. Figure 3.10 and 3.11
below illustrates the fully assembled EST connection mesh detail at the beam-to-column
web and the overall setup of the beam including the loading and far end boundary
condition. Figure 3.12 shows the mesh and applied boundary condition at the simply
supported end of the beam for the EST validation and parametric study.

28
Figure 3.10 Assembled extended shear tab connection
Figure 3.11 EST connection illustrating loading appication and beam far end support

29
Figure 3.12 Mesh and boundary conditions at simply supported end of beam for EST
connections
3.5 Material Properties
An isotropic multi-linear material model was used for the beam, supporting member and
the shear tab. This material model consists of an elasto-plastic strain relationship with a
strain hardening portion. The modulus of elasticity, E, is taken as 200,000 MPa with a
Poisson ratio of 0.3 for all structural steel. The stress-strain curve for the tab, beam and
supporting member is shown in Figure 3.13. It is noted that a yield stress of 250 MPa was
used to verify the finite element model with experimental results (Astaneh et al. 1989;
Sherman and Ghorbanpoor 2002). In the case of the parametric study, the material model
assumed a yield stress of 350 MPa for the tab, beam material and supporting member. As
for the high strength bolts, the stress strain relationship is shown in Figure 3.14. An

30
ultimate strength of 945 MPa for the high strength A325 bolts was used for the validation
models.
The stress-strain relationships were converted into true stress and strain as required in
ANSYS (2010). The true stress, , and true strain, , were calculated from
engineering stress and engineering strain using Equations [3.2] and [3.3].
[3.2]
[3.3]
Figure 3.13 Stress-strain curve for 350W steel (Ashakul 2004)
0.00175, 350
0.0488, 441 0.223, 600
0
100
200
300
400
500
600
700
0 0.05 0.1 0.15 0.2 0.25
En
gin
eeri
ng s
tres
s (M
Pa)
Engineering strain (mm/mm)

31
Figure 3.14 Stress-strain curve for A325 high strength bolts (Rahman et al. 2003)
3.6 Loading Analysis
Loading was applied in two main load steps. The first load step involved the
pretensioning of the bolts to simulate the snug-tightened condition. Although ASTM
standard A325M (2013) provides a definition of “the snug-tightened condition”, it does
not specify a minimum applied pretension force, only that the two bodies are visually in
firm contact. The snug-tightened condition is simulated by applying a pretensioning force
value of 50 kN per bolt based on recommendations by Kulak and Grondin (2010). The
purpose of the pretension force was to establish firm contact between all adjacent
surfaces such as contact between the shear tab and beam web, the bolt head and shear tab,
bolt nut and beam web. The pretension force clamps the beam web together with the
shear tab and induces a tensile force in the bolts.
0.0031, 620
0.013,945
0
100
200
300
400
500
600
700
800
900
1000
0 0.005 0.01 0.015
En
gin
eeri
ng s
tres
s (M
Pa)
Engineering strain (mm/mm)

32
The second load step was the application of the transverse loading. In experimental
testing, a concentrated load was applied at beam midspan. If this loading was applied as a
concentrated load on a single node, excessive element deformation would result which
may lead to wrong solution of the model. Alternately, the concentrated transverse load
was applied as a distributed pressure load on a small area on the top flange in order to
prevent local failure during the finite element analysis. In addition, stiffeners are
modelled underneath the pressure loading on both sides of the beam web to increase the
web buckling capacity and ensure the failure occurring in the connection. The mesh
configuration of the stiffeners is similar to that of the beam to allow for nodal merging.
Figure 3.15 shows the pressure loading and the stiffener underneath the flange.
Figure 3.15 Distributed pressure loading including stiffeners
A nonlinear static analysis using the full Newton-Raphson method was employed. During
each load substep, a number of equilibrium iterations were performed where the out-of-
33
balance vector, which is the difference between the restoring forces (the loads
corresponding to the element stresses) and the applied loads was evaluated for
convergence. The out of balance stiffness matrix is the right hand side of Equation [3.4].
The convergence criterion was set such that the out of balance vector is less than 0.0001.
If the convergence criterion is not satisfied, the { } is calculated using Equation [3.4]
using the tangent matrix, [ ], and restoring load, {
} from the previous converged
solution. { } is then added to { } from the previous converged solution. Using the
updated nodal displacements, the stiffness matrix and restoring load vector are
recalculated and another equilibrium iteration is performed until convergence criterion is
satisfied. Once a solution is obtained the next loading increment is applied. The
maximum number of equilibrium iterations allowed per substep was limited to 30
iterations. If the maximum number of equilibrium iterations is exceeded for the substep
the load increment is bisected and this process is repeated until convergence. The load
stepping can be automated using features available in ANSYS. The auto time step
scheme ensures that the time step variation is neither too aggressive (resulting in many
bisections) nor too conservative (substep increment too small).
[ ]{ } { } {
} [3.4]
Where:
[ ] = Tangent stiffness matrix
{ } = Displacement vector
{ } = Vector of applied load
{ } = Vector of restoring loads corresponding to the element internal loads

34
The augmented Lagrangian method was selected as the contact algorithm for solving the
contact problem since the augmented Lagrangian method usually leads to better
conditioning and is less sensitive to the magnitude of the contact stiffness coefficient
(ANSYS 2010). For the augmented Lagrangian method a normal contact stiffness factor
is required. The amount of penetration between the contact and the target surface depends
on this factor. A higher stiffness factor reduces the amount of penetration between the
two adjacent surfaces but could lead to convergence difficulties. A lower stiffness factor
could lead to a certain amount of penetration and result in an inaccurate solution. A
normal stiffness factor of 1.0 specified in ANSYS was used.
Moreover, as the bolt shank surface and bolt hole surface are initially not in contact,
adjustments to the initial contact conditions is required, otherwise warning messages of
“zero or negative pivot” or “excessively large displacements” would terminate the
analysis. ANSYS can automatically bring two surfaces into contact by initiating the
“close gap” option in the initial contact adjustment controls.
3.7 Failure Criteria
As reported in the literature, the limit states that govern CST connections are bolt shear,
plate shear yielding, plate bearing and plate shear fracture. EST connections can
additionally be governed by web failure of the supporting member and twisting of the
shear tab. Not all limit states are monitored in this study, a justification for the exclusion
of certain limit states is given in the following.

35
Plate bearing - the bearing stress on the plate is a means to achieve ductility in the
connection; this limit state does not result in the failure of the connection. Although the
bearing of the bolts on the shear tab is visible in the finite element simulation, it is
difficult to assess at which load bearing failure has occurred. Therefore, this limit state is
not considered in this study.
Plate shear rupture - shear rupture of the plate was not reported as being a recurring
failure mode provided that sufficient bolt spacing and edge distance is provided.
The limit states of interest in this study are bolt shear rupture, plate shear yielding, the
web failure of supporting member and twisting of shear tab. The monitoring of these
limit states is discussed as follows.
Bolt shear rupture is monitored by the fluctuation of shear stress along the centerline of
all the bolts in the connection. Bolt shear rupture is deemed to have occurred once the
shear stress of any one bolt showed irreversible decrease. The finite element simulation
does not have the capability of physically fracturing the bolt; instead it redistributes the
applied load to the remaining bolts in the connection. As the load is gradually applied an
increase in shear stress can be detected along the centerline of the bolt. Once the bolt
reaches its maximum strength, a decrease in shear stress is detected in the following
substep. Additionally, as a result of the redistribution of force in the connection, an
increase in the shear stress along the centerline of the second bolt will be detected at the
same substep. A decrease in this stress will occur immediately thereafter and this process

36
will repeat for all remaining bolts.
Twisting of the shear tab is monitored by observing the relative rotation, twist, between
the either sides of the top flange. Figure 3.16 below illustrates the twisting of the plate.
Figure 3.16 Twisting rotation for shear tab
The web failure limit state can be characterized using the shear versus web rotation curve
along the weld line web, where the shear tab frames into the supporting member. If the
shear vs. web rotation curve indicates significantly high values for rotation in the
supporting member for a small increase in load, then a web mechanism failure is
identified as the critical failure mode. The shear yielding of the plate can be defined by
generating a shear versus shear tab rotation tab along the line of bolts. The weld rupture

37
limit state is monitored by generating a moment at weld line versus beam end rotation
beam. The weld-moment can be calculated as the summation of all the x-component
element forces along the weld line multiplied by the respective vertical distance of each
node to the centerline of the shear tab. Figure 3.17 illustrates different rotation angles that
are used in the failure monitoring.
Figure 3.17 Connection rotations
In summary, the failure modes that were considered in the parametric study are the bolt
shear rupture, plate yielding, weld fracture, tab twisting and the supporting member web
failure.

38
CHAPTER 4 Validation of the Finite Element Model
4.1 Introduction
The finite element model developed in Chapter 3 is validated using the experimental
results obtained by Astaneh et al. (1989) on CST connections and by Sherman and
Ghorbanpoor (2002) on EST connections. The details of the four models are presented in
Table 4.1. The dimensions reported in the published literature were in imperial units and
they have been converted to SI units for consistency in this report. All bolts are 20 mm
(3/4 in) A325 type high strength bolts. The mesh for the CST and EST connections are
shown in Figures 4.1, 4.2, 4.3 and 4.4. As discussed earlier, the shear tab in the CST
connection was assumed fixed in the finite element model whereas the shear tab in the
EST connection model is framed into the column web, which is a more flexible support.
The CST connections were modelled using half symmetry as load symmetry was present,
whereas the full beam was modelled in the EST connections as load symmetry did not
exist. Figures 4.5 and 4.6 illustrate the load location and boundary condition applied for
the CST and EST validation models, respectively.
39
Figure 4.1 FE mesh configuration for the 3-bolt CST connection tested by Astaneh et al.
(1989)
Figure 4.2 FE Mesh configuration for the 5-bolt CST connection tested by Astaneh et al.
(1989)

40
Figure 4.3 FE mesh configuration for the 3-bolt EST connection tested by Sherman and
Ghorbanpoor (2002)
Figure 4.4 FE mesh configuration for the 6-bolt EST connection tested by Sherman and
Ghorbanpoor (2002)

41
Figure 4.5 Boundary conditions and load application for the 5-bolt CST connection tested
by Astaneh et al. (1989)
Figure 4.6 Boundary conditions and load application for the 3-bolt EST connection tested
by Sherman and Ghorbanpoor (2002)

42
Table 4.1 Details of finite element verification model
Test
Supported member Bolts Shear tab Weld-
bolt
distance
(mm)
Reference Size
Span
(m) Type Num.
t
(mm)
Lp
(mm)
dp
(mm) Type
1 W18x55 3 A36 3 9.5 108.0 228.6 A36 69.9 Astaneh et al.
(1989) 2 W18x55 3 A36 5 9.5 108.0 381 A36 69.9
3 W12x87 9 Gr.50 3 9.5 212.3 228.6 A36 174.2 Sherman and
Ghorbanpoor
(2002) 4 W24x146 10 Gr.50 6 12.7 292.1 457.2 A36 254.0
4.2 Validation of the Finite Element Model
4.2.1 Three-bolt CST Connection
Figure 4.7 compares the beam behaviour where the shear vs. beam end rotation is plotted.
The shear force is equal to the applied force for the CST simulation. It shows that the
model agrees reasonably well with the experimental behaviour in the linear portion. The
test results showed that the beam remained elastic up to a shear force of 262 kN with a
beam rotation of 0.0163 rad. At this point the beam midspan began to yield. The ANSYS
simulation predicts a similar beam behaviour up to the experimental yield point.
However, the ANSYS solution deviates slightly from the experimental data in the post
yielding region where the finite element simulation experienced a larger rotation at a
given load level. This disparity may be attributed to the difference in the material
properties between the model and the test specimen. Astaneh et al. (1989) only specified
the beam steel to be A36 but did not provide the detailed stress-strain curves. The stress-
strain relationship in the finite element simulation was assumed to be elastic perfectly
plastic with a strain hardeing phase typical of the A36 steel.

43
Figure 4.7 Comparison of connection shear versus beam end rotation of 3-bolt CST
connection Astaneh et al. (1989)
Figure 4.8 shows the moment at the weld line in the connection. The moment along weld
line is calculated as the summation of the nodal x-direction reaction force multiplied by
the nodes’ respective distance to the center of the shear plate. The maximum moment
reached was 43.7 kN-m whereas the maximum moment recorded by Astaneh et al. (1989)
was 39.5 kN-m (350 kips). This results in a 9% difference between the experimental test
and numerical model.
0
50
100
150
200
250
300
350
400
450
0.00 0.02 0.04 0.06 0.08 0.10 0.12
Sh
ear
(kN
)
Beam end rotation (Rad)
3 bolt CST connection
Astaneh et al. (1989)

44
Figure 4.8 Moment at weld line of 3-bolt CST connection
Bolt fracture is predicted by observing the fluctuation of bolt shear stresses. As shown in
Figure 4.9, an irreversible decrease in shear stress of the top bolt (Bolt 1) is detected at a
shear load of 368 kN and a bolt shear stress of 385 MPa. The connection is deemed to fail
by bolt fracture of the top bolt at 368 kN. An increase in shear stress is observed in the
remaining bolts in the connection thereafter indicating that the remaining bolts pick up
the load but a stress drop is observed immediately thereafter. The 3-bolt CST connection
tested by Astaneh et al. (1989) was reported to have failed by bolt fracture at 418 kN (94
kips). There is a 12% difference between the experimental test and the FE model. This
difference is acceptable as nominal bolt shear strength was assumed.
0.033, 43.7
0
10
20
30
40
50
0 0.02 0.04 0.06 0.08 0.1 0.12
Mo
men
t a
lon
g w
eld
lin
e
(kN
m)
Beam end rotation (rad)

45
Figure 4.9 Shear stress versus connection shear of 3-bolt CST connection Astaneh et al.
(1989)
The finite element bolt eccentricity at failure was determined to be 40 mm whereas the
experimental value was 44 mm. The determination of inflection point is explained in
Figure 4.10. Nodes, n1, n2, n3 and n4 represent nodes along the centerline of the beam
flange. The strain changes from positive (i.e tension) to negative (i.e. compression) in the
bottom flange when approaching the support. A linear interpolation is done between the
two adjacent nodes with opposite signs to determine the location of the inflection point.
368
385
0
50
100
150
200
250
300
350
400
450
0 50 100 150 200 250 300 350 400 450
Sh
ear
stre
ss (
MP
a)
Shear (kN)
Bolt 1
Bolt 2
Bolt 3
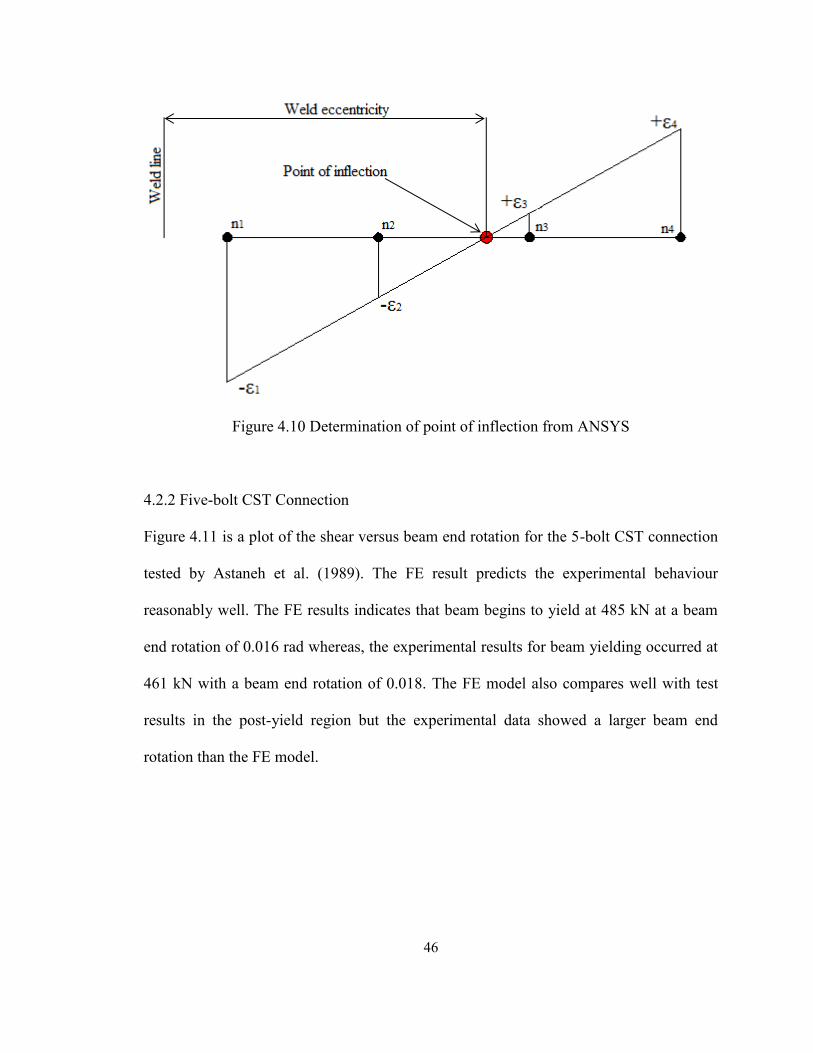
46
Figure 4.10 Determination of point of inflection from ANSYS
4.2.2 Five-bolt CST Connection
Figure 4.11 is a plot of the shear versus beam end rotation for the 5-bolt CST connection
tested by Astaneh et al. (1989). The FE result predicts the experimental behaviour
reasonably well. The FE results indicates that beam begins to yield at 485 kN at a beam
end rotation of 0.016 rad whereas, the experimental results for beam yielding occurred at
461 kN with a beam end rotation of 0.018. The FE model also compares well with test
results in the post-yield region but the experimental data showed a larger beam end
rotation than the FE model.

47
Figure 4.11 Comparison of connection shear versus beam end rotation of 5-bolt CST
connection by Astaneh et al. (1989)
Figure 4.12 is a plot of the connection shear versus the shear stress across all five bolts
for the 5-bolt CST connection. The dotted line in Figure 4.12 depicts the maximum shear
stress and corresponding failure load for bolt 1. The 5-bolt CST connections failed by
bolt fracture of the top bolt (Bolt 1) at a shear load of 578 kN. The shear stress of the top
bolt at failure was 419 MPa. The experimental failure was by bolt fracture and occurred
at a load of 608 kN (137 kips). There is a 5% difference between the FE and experimental
result.
0
100
200
300
400
500
600
700
0 0.01 0.02 0.03 0.04 0.05 0.06
Sh
ear
(kN
)
Beam end rotation (rad)
5 bolt CST connection
Astaneh et al. (1989)

48
Figure 4.12 Shear stress versus connection shear of 5-bolt CST connection (Astaneh et al.
1989)
The finite element bolt eccentricity at failure was determined to be 50 mm whereas the
experimental value was 32 mm.
4.2.3 Three-bolt EST Connection
Figure 4.13 compares the shear versus beam end rotation response for the 3-bolt EST
connection by Sherman and Ghorbanpoor (2002). In this case, the shear force in the
connection is calculated as the difference between the total applied load and the
summation of the nodal y-direction reaction forces at the simply supported far end. Both
the finite element simulation and the test results indicate a linear behaviour with similar
stiffness.
578
419
0
50
100
150
200
250
300
350
400
450
0 200 400 600 800 1000
Sh
ear
stre
ss (
MP
a)
Shear (kN)
Bolt 1
Bolt 2
Bolt 3
Bolt 4
Bolt 5

49
Figure 4.13 Comparison of connection shear versus beam end rotation of 3-bolt EST
connection by Sherman and Ghorbanpoor (2002)
Figure 4.14 below illustrates the fluctuation of shear stress acting across the face of each
bolt. The shear stress values were obtained from nodes along the centerline of the three
bolts. The bolt group is deemed to have failed when the connection shear force reached
250 kN. As shown in Figure 4.14, the shear stress of the top bolt (Bolt 1) reached its
maximum value of 473 MPa at the shear connection load of 250 kN. The shear stress
decreases thereafter as more load is applied and the additional load is resisted by the
other two bolts, as shown by the increase in shear stress for bolts 2 and 3. The ultimate
load reported by Sherman and Ghorbanpoor (2002) is 261 kN (58.6 kips) which results in
a 5% difference from the FE solution.
0
50
100
150
200
250
300
350
0 0.005 0.01 0.015 0.02
Sh
ear
(kN
)
Beam end rotation (rad)
3 bolt EST connection
Sherman and
Ghorbanpoor (2002)
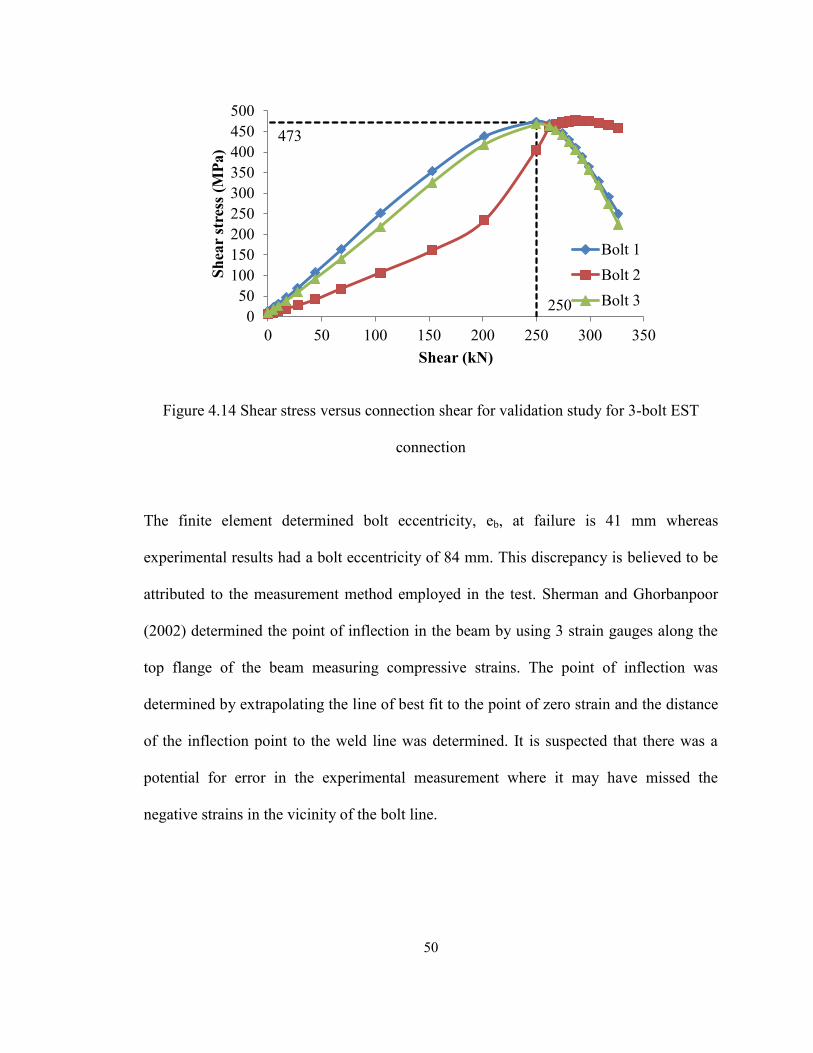
50
Figure 4.14 Shear stress versus connection shear for validation study for 3-bolt EST
connection
The finite element determined bolt eccentricity, eb, at failure is 41 mm whereas
experimental results had a bolt eccentricity of 84 mm. This discrepancy is believed to be
attributed to the measurement method employed in the test. Sherman and Ghorbanpoor
(2002) determined the point of inflection in the beam by using 3 strain gauges along the
top flange of the beam measuring compressive strains. The point of inflection was
determined by extrapolating the line of best fit to the point of zero strain and the distance
of the inflection point to the weld line was determined. It is suspected that there was a
potential for error in the experimental measurement where it may have missed the
negative strains in the vicinity of the bolt line.
250
473
0
50
100
150
200
250
300
350
400
450
500
0 50 100 150 200 250 300 350
Sh
ear
stre
ss (
MP
a)
Shear (kN)
Bolt 1
Bolt 2
Bolt 3

51
4.2.4 Six-bolt EST Connection
Figure 4.15 compares the connection shear versus beam end rotation response for the 6-
bolt EST connection. The beam showed elastic beahviour during testing. The FE model
compares well with the experimental data.
Figure 4.15 Comparison of connection shear versus beam end rotation of 6-bolt EST
connection by Sherman and Ghorbanpoor (2002)
Figure 4.16 below illustrates the fluctuation of shear stress acting across the face of each
bolt for the 6-bolt EST connection. The bolt group is deemed to have failed when the
connection shear force reached 583 kN. As shown in Figure 4.16, the shear stress of the
top bolt (Bolt 1) reached its maximum value of 462 MPa at the shear connection load of
583 kN. The ultimate load reported by Sherman and Ghorbanpoor (2002) is 605 kN (136
kips). This results in a difference of 4% between the FE model and the experimental test.
0
100
200
300
400
500
600
700
0.000 0.002 0.004 0.006 0.008 0.010 0.012
Sh
ear
(kN
)
Beam end rotation (rad)
6 bolt EST
connection
Sherman and
Ghorbanpoor (2002)

52
The researchers reported a bolt fracture failure mode similar to that predicted by the FE
model.
Figure 4.16 Shear stress versus connection shear for validation study for 6-bolt EST
connection
The finite element determined bolt eccentricity at failure is 82 mm whereas the
experimental value is 127 mm.
4.3 Summary
In this Chapter, the finite element model presented in Chapeter 3 was validated using the
experimental test results from Astaneh et al. (1989) and Sherman and Ghorbanpoor
(2002). The ultimate load capacity of the single plate shear connections were reasonably
predicted by the numerical model. The model was also capable of simulating the
behaviour of the connection to an acceptable degree of accuracy. Table 4.5 summarizes
583
462
0
50
100
150
200
250
300
350
400
450
500
0 200 400 600 800
Sh
ear
stre
ss (
MP
a)
Shear (kN)
Bolt 1Bolt 2Bolt 3Bolt 4Bolt 5Bolt 6

53
the test results with the FE model. The differences between the finite element ultimate
capacity and test values are 5% and 12% for the 3-bolt CST and 5-bolt CST connections,
respectively and 5% and 4% for the 3-bolt and 6-bolt EST connections respectively.
Table 4.2 Summary of validation of FE model
Type Bolts
Failure Mode Ultimate
load (kN) Ansys /
Experiment Source
Test Ansys Test Ansys
CST
3 Bolt fracture Bolt
fracture 418 368 0.95
Astaneh et al.
(1989) 5 Bolt fracture
Bolt
fracture 608 578 0.88
EST
3
Bolt fracture
/ Bolt
bearing
Bolt
fracture 261 250 0.95 Sherman and
Ghorbanpoor
(2002) 6 Bolt fracture
Bolt
fracture 605 583 0.96

54
CHAPTER 5 Parametric Study
5.1 Introduction
A parametric study is conducted on EST connections using the FE model developed in
Chapter 3. The parameters investigated include the web slenderness ratio of the
supporting column, distance ‘a’, plate thickness, double bolt rows, beam lateral restraint,
beam length-to-depth ratio and number of bolts. Figure 5.1 illustrates a typical EST
connection used in the parameteric study. All supported beam sections are kept as
W530x74. Supporting columns are all W460x144 except for simulations 1, 2, 4 and 5
where column section is varied for web thickness. Table 5.1 and Table 5.2 lists the details
for all FE simulations where the symbols are depicted in Figures 5.1 and 5.2. The
highlighted simulation 3 in Table 5.1 is the control simulation for all varying parameters.
Cells highlighted in grey indicate the parameters being varied from the control
simulation.
An elasto-plastic material model with a strain hardening phase was employed for all W-
sections and shear tab where a yield stress of 350 MPa and a modulus of elasticity of
200,000 MPa are assumed as shown in Figure 5.3. All bolts are ¾ in A325 type high
strength bolts. The stress-strain graph for the high strength bolts can be referred to in
Figure 5.4 where a modulus of elasticity of 200,000 MPa and an ultimate load of 945
MPa are assumed.

55
Figure 5.1 Typical EST connection for parametric study
Figure 5.2 Symbols for typical beam/column crossection

56
Table 5.1 Details of finite element simulations
Simulation Web
slenderness
Distance ‘a’
(mm)
Plate
thickness
(mm)
Number of
vertical rows
Beam lateral
restraint
Beam
L/d ratio
Number of
bolts in a
single row
1 11.1
162
10
Single
Full lateral restraint
17
3
2 20.8
3 31.5
4 40.8
5 53.5
6
31.5
172
7 182
8 200
9 250
10
162
8
11 6
12 12
13 10 Double
14 12 Double
15
10 Single
Mid-span restraint
16 Endpoint restraint
17 Mid-span and
endpoint restraint
18
Full lateral restraint
9.5
19 13
20
17
4
21 5
22 6
56

57
Table 5.2 Details of beam/column sections
Figure 5.3 Stress-strain relationship for W-sections and shear tab in parametric study
Figure 5.4 Stress-strain relationship for A325 bolts in parametric study
0.00175,
350
0.0488, 441 0.223, 600
0
100
200
300
400
500
600
700
0 0.05 0.1 0.15 0.2 0.25
En
gin
eeri
ng s
tres
s (M
Pa)
Engineering strain (mm/mm)
0.0031, 620
0.013,945
0
200
400
600
800
1000
0 0.005 0.01 0.015
En
gin
eeri
ng s
tres
s (M
Pa)
Engineering strain (mm/mm)
W section d b t h w
Beam 530x74 529 166 13.6 502 9.7
Column
460x464 567 305 69.6 428 38.6
460x235 501 287 36.6 428 20.6
460x144 472 283 22.1 428 13.6
460x89 463 192 17.7 428 10.5
460x60 455 153 13.3 428 8

58
5.2 Web Slenderness Ratio of the Supporting Column
The web slenderness of the supporting column is varied by changing the web thickness
while maintaining the web depth. This ensures that the column flange confining effect on
the web rotation remained the same for all simulations. The web slenderness ratio, h/w, is
varied from 11.1 to 53.5 with simulation 1 having the lowest slenderness ratio and
simulation 5 having the highest slenderness ratio.
Figure 5.5 shows the connection shear versus web rotation for all tested slenderness
ratios. It shows that an increase in web slenderness resulted in a reduction in connection
shear capacity and also a change in connection behavior. At a low web slenderness
indicating a thick web (simulation 1), the response remained almost linear up to the
ultimate load. As the slenderness increases (web becomes thinner), the responses showed
evident non-linearity and the onset of this nonlinearity began increasingly earlier in the
loading history. The nonlinear behaviour is characterized by yielding in the web. An
increase in web slenderness results in an increase in web rotation for the same load level.

59
Figure 5.5 Connection shear vs. web rotation for varying web slenderness
Figure 5.6 is a depiction of the nonlinear web rotation that is experienced by slender webs
of columns. The plot is of simulation 5 with an h/w ratio of 53.5. The column flanges are
excluded for clarity. The high slenderness results in a deformation in the column web
where the top and bottom portions of web experience pulling and pushing actions
resulting in tensile forces at the top and compressive forces at the bottom. The manner of
deformation also indicates that the tensile forces are greater than the compressive forces
since the pulling deformation is more significant than the pushing deformation. Figure
5.7 illustrates the von Mises stress in Pascals for the column web where the stress in the
top portion of the web is much higher than that in the bottom portion.
0
50
100
150
200
250
300
350
400
450
0.00 0.05 0.10 0.15 0.20 0.25 0.30
Sh
ear
(kN
)
Web rotation (rad)
h/w - 11.1h/w - 20.8h/w - 31.5h/w - 40.8h/w - 53.5

60
Figure 5.6 Column web rotation deformation for h/w=53.5
Figure 5.7 Column web von Mises stress distribution for h/w=53.5

61
Figure 5.8 shows the connection shear vs. beam end rotation responses for the five web
slenderness ratios. The initial phase of all 5 models had the same stiffness. At
approximately 260 kN the beam sections began to yield. Post yield stiffness is higher for
connections with a lower slenderness ratio (thicker column web) than connections with a
high slenderness ratio (thinner column web). The column web thickness only affects the
beam rotation after the yielding of the beam section.
Figure 5.8 Connection shear versus beam end rotation for varying web slenderness
The connection shear strength is determined using the shear stress in the bolts. The
connection is deemed to fail once the shear stress of any one of the bolts showed an
irreversible drop in magnitude with an increase of external applied load. Figure 5.9 plots
the shear stress versus connection shear for simulation 3 where bolt 1, 2, and 3 indicates
the top, middle, and bottom bolt. Similar plots for simulations 1, 2, 4 and 5 are presented
0
50
100
150
200
250
300
350
400
450
0.00 0.05 0.10 0.15 0.20
Sh
ear
(kN
)
Beam end rotation (rad)
h/w - 11.1h/w - 20.8h/w - 31.5h/w - 40.8h/w - 53.5

62
in Appendix A. Figure 5.9 shows that the shear stress in the bottom bolt increases with
load until the shear stress reaches 457 MPa. Afterwards, the shear stress begins to
decrease in the bottom bolt. Hence, the EST connection fails by bolt fracture of the
bottom bolt at a load of 368 kN as illustrated in the figure. From the same figure the
middle bolt also experiences a decrease in shear stress however the decrease occurs after
the decrease is observed in the bottom bolt.
Figure 5.9 Shear stress versus connection shear for simulation 3
In Figure 5.9, bolt 1 shows a dip in shear stress at the connection shear of 260 kN but
followed by an increase. The 260 kN coincides with the beam yield point shown in
Figure 5.8. At this point, the horizontal shear stress component of the top bolt began to
decrease due to the yielding of the beam and rotation of the web. The resulted total shear
stress therefore showed reduction but fracture did not occur in the top bolt. The variation
of horizontal shear stress is illustrated in Figure 5.10 for all three bolts. Prior to yielding
368
457
260 0
50
100
150
200
250
300
350
400
450
500
0 50 100 150 200 250 300 350 400 450
Sh
ear
Str
ess
(MP
a)
Shear (kN)
Bolt 1
Bolt 2
Bolt 3

63
of the beam web, rotations are relatively small, the horizontal shear force in the top bolt is
directed away from the support and in the bottom bolt is directed towards the support.
Once yielding commences, the web rotations become larger, the horizontal shear stresses
in the top bolt decreases and ultimately changes direction to direct towards the support.
The dotted black line in the figure represents the shear force level at which beam yielding
is reached. To the left of the dotted line, the horizontal shear force is positive (directed
away from the support) and increasing for bolt 1. After beam yield, the horizontal shear
stress of the top bolt decreases and eventually changes its direction to be directed towards
the support.
Figure 5.10 Horizontal shear stress versus connection shear for simulation 3
Table 5.3 lists the shear stress distribution across all three bolts for simulations 1 to 5 at
ultimate load. The table confirms that the connection ultimate capacity decreases with the
increase in slenderness. The shear stress is more evenly distributed among the three bolts
-500
-400
-300
-200
-100
0
100
200
300
400
500
0 100 200 300 400
Hori
zon
tal
shea
r st
ress
(M
Pa)
Shear (kN)
Bolt 1
Bolt 2
Bolt 3

64
for thicker column webs. Simulations 1, 2, 3, 4 and 5 have a shear stress standard
deviation of 4, 5, 7, 14 and 36 MPa, respectively.
The outer bolts resist most of the shear due to the high geometric nonlinearity in the EST
connection. The top and bottom bolts mainly resist the horizontal shear stresses due to
rotations and middle bolt resists more of the vertical shear. As the column web becomes
stiffer, less web rotation is experienced, hence resulting in a more evenly distributed
shear stress.
Table 5.3 Shear stress, MPa, distribution across 3 bolts for simulations 1 to 5
Simulation 1 2 3 4 5
Top Bolt 456 452 451 444 440
Middle Bolt 453 448 443 429 397
Bottom Bolt 445 457 457 457 456
Standard Deviation 4 5 7 14 36
Ultimate Load (kN) 377 376 368 330 208
Figure 5.11 illustrates the movement of the inflection point in the beam as the load
increases where the y axis indicates the weld line and black line indicates the bolt line. It
shows that the point of zero moment follows a similar trend for all simulations. In the low
load region, the increase in the load causes the inflection point to move toward the
support (weld line), which is understandable since at the zero load, the inflection point is
considered infinitely away from the support. However, as the load increases, the
inflection point moves away from the support. A larger range in movement is noticed for
simulation 1 with a low slenderness ratio (i.e. higher support stiffness) than with
simulations with a higher slenderness ratio. The bolt effective eccentricity is defined as
the distance from the inflection point at ultimate to the bolt line. According to the figure,

65
the column web slenderness has an effect on the bolt effective eccentricity. The higher
the web slenderness, the greater the bolt effective eccentricity.
Figure 5.11 Distance of point of inflection to weld line for varying web slenderness
Figure 5.12 shows the column web slenderness ratio versus the effective bolt eccentricity,
eb, at ultimate. A more or less linear increase in eb is realized with an increase in web
slenderness. This indicates that as the support becomes more flexible, the effective
eccentricity becomes larger.
0
50
100
150
200
250
300
350
400
0 100 200 300 400 500 600 700
Sh
ear
(kN
)
Distance of point of inflection to weld line (mm)
h/w - 11.1
h/w - 20.8
h/w - 31.5
h/w - 40.8
h/w - 53.5
Bolt Line

66
Figure 5.12 Slenderness ratio versus measured eb
The AISC manual 2011 states that the bolt effective eccentricity, eb, is to be taken equal
to the distance ‘a’. Table 5.4 lists the predicted eb from both the finite element simulations
and the AISC recommendation together with the finite element and AISC ultimate load.
In the table, Fu,FE is the bolt shear capacity calculated using the effective bolt eccentricity,
eb,FE, obtained from the FE simulation whereas Fu,AISC and Fu,CISC are the ultimate
capacities calculated using the distance ‘a’ as the effective bolt eccentricity. The Fu,FE and
Fu,AISC are are calculated using procedures recommended in AISC manual 2011.
Whereas, Fu,CISC is calculated using the tables for eccentrically loaded bolts in the CISC
manual. The Fu,AISC and Fu,CISC ultimate bolt capacities were the same as they were both
based on the ICR procedure. Fu is the ultimate load at which bolt failure occurs based on
the FE analysis. Table 5.4 shows that the Fu/Fu,AISC ratio ranged from 0.37 for the stiffer
supports (thicker web) to 0.67 for the more slender supports (thinner web). This suggests
that the eb recommended in AISC manual 2011 is overly conservative. On the other hand,
using the procedure specified in AISC but with eb values obtained from the FE
0
20
40
60
80
100
120
0 10 20 30 40 50 60Eff
ecti
ve
bolt
ecc
entr
icit
y
(mm
)
Column web slenderness ratio
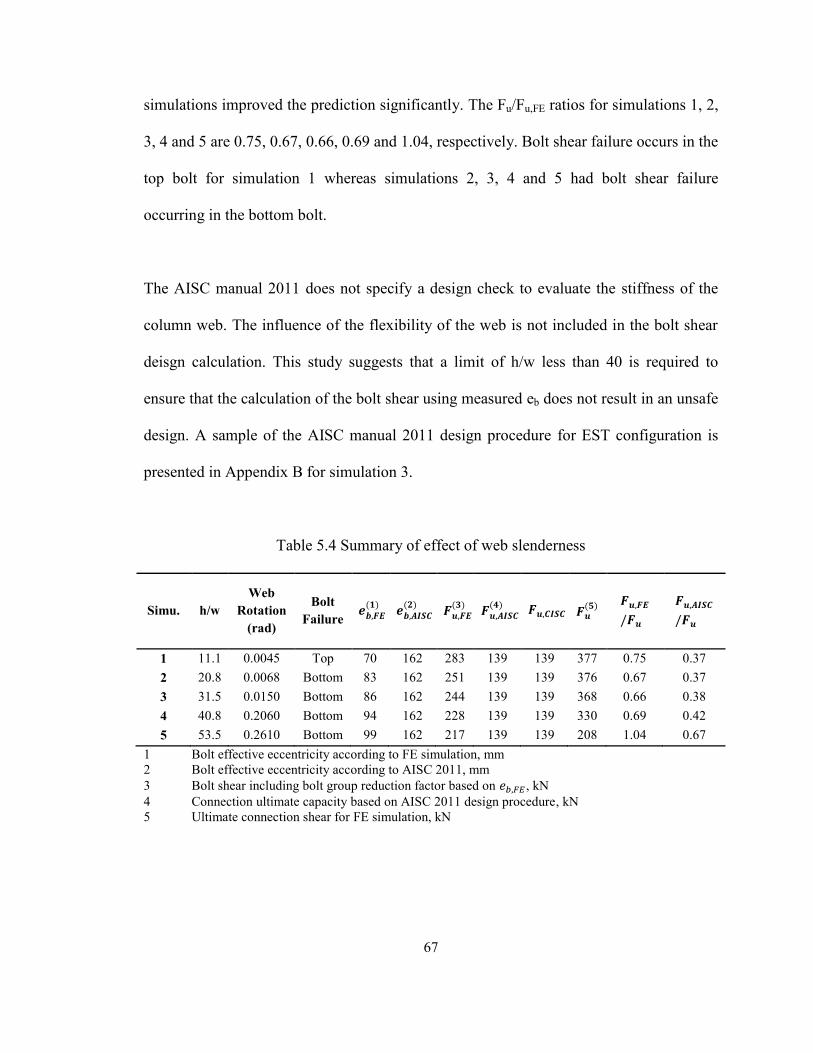
67
simulations improved the prediction significantly. The Fu/Fu,FE ratios for simulations 1, 2,
3, 4 and 5 are 0.75, 0.67, 0.66, 0.69 and 1.04, respectively. Bolt shear failure occurs in the
top bolt for simulation 1 whereas simulations 2, 3, 4 and 5 had bolt shear failure
occurring in the bottom bolt.
The AISC manual 2011 does not specify a design check to evaluate the stiffness of the
column web. The influence of the flexibility of the web is not included in the bolt shear
deisgn calculation. This study suggests that a limit of h/w less than 40 is required to
ensure that the calculation of the bolt shear using measured eb does not result in an unsafe
design. A sample of the AISC manual 2011 design procedure for EST configuration is
presented in Appendix B for simulation 3.
Table 5.4 Summary of effect of web slenderness
Simu. h/w
Web
Rotation
(rad)
Bolt
Failure
1 11.1 0.0045 Top 70 162 283 139 139 377 0.75 0.37
2 20.8 0.0068 Bottom 83 162 251 139 139 376 0.67 0.37
3 31.5 0.0150 Bottom 86 162 244 139 139 368 0.66 0.38
4 40.8 0.2060 Bottom 94 162 228 139 139 330 0.69 0.42
5 53.5 0.2610 Bottom 99 162 217 139 139 208 1.04 0.67
1 Bolt effective eccentricity according to FE simulation, mm
2 Bolt effective eccentricity according to AISC 2011, mm
3 Bolt shear including bolt group reduction factor based on , kN
4 Connection ultimate capacity based on AISC 2011 design procedure, kN
5 Ultimate connection shear for FE simulation, kN

68
5.3 Distance ‘a’
Five different ‘a’ distances are selected to investigate the effect of varying length of plate
on the behaviour and ultimate load of EST connections. Simulations 3, 6, 7, 8 and 9 have
‘a’ distances of 162, 172, 182, 200 and 250 mm, respectively. The distance ‘a’ is the
distance between the bolt line and weld line.
Figure 5.13 and Figure 5.14 compare the connection shear versus column web rotation
responses and connection shear versus the beam end rotation responses for all five
simulations. Both figures show that for studied distance ‘a’ up to 182 mm, the increase in
this distance does not affect the overall beam behaviour. However, for distance “a” in the
range of 200 to 250 mm, an increase in the distance results in an onset of yielding in the
web occurring much earlier in the loading history. On the other hand, the linear
behaviour of the beam end rotation remains practically identical for all distances.
However, as the distance increases, the beam has less ability to sustain end rotation after
yielding and at distance “a” of 250 mm, no post yielding rotation can be observed.

69
Figure 5.13 Shear vs. web rotation for varying distance ‘a’
Figure 5.14 Shear versus beam end rotation for varying distance ‘a’
Table 5.5 lists the shear stress for all the bolts at failure, the ultimate connection capacity
and the standard deviations of stresses for the three bolts. Simulations 3, 6, 7, 8 and 9
0
50
100
150
200
250
300
350
0.00 0.02 0.04 0.06 0.08 0.10
Sh
ear
(kN
)
Web rotation (rad)
'a' - 162 mm
'a' - 172 mm
'a' - 182 mm
'a' - 200 mm
'a' - 250 mm
0
50
100
150
200
250
300
350
0.00 0.02 0.04 0.06 0.08 0.10 0.12
Sh
ear
(kN
)
Beam end rotation (rad)
'a' - 162mm
'a' - 172mm
'a' - 182mm
'a' - 200mm
'a' - 250mm

70
achieved ultimate loads of 368, 352, 348, 297 and 209 kN, respectively. The bolt shear
stress was more evenly distributed for shorter connection lengths than longer ones. The
standard deviation across the three bolts for simulations 3, 6, 7, 8 and 9 were 7, 7, 18, 24
and 64 MPa respectively. The increase in distance ‘a’ resulted in a reduction in the bolt
shear capacity.
Table 5.5 Shear stress, MPa, distribution across 3 bolts for simulations 3, 6, 7, 8 and 9
As expected, an increase in distance ‘a’ results in a greater distance between the point of
inflection to the weld line due to the geometric offset of the bolt group, as shown in
Figure 5.15. The movement of the beam inflection point with the increase in the load
followed a similar path as discussed previously. The inflection point moves towards the
support and then reverses direction away from the support. It is realized that the bolt
effective eccentricity, eb, increases with the increase in the ‘a’ distance. At failure the eb
values for simulations 3, 6, 7, 8 and 9 are 86, 96, 101, 104 and 105 mm.
Simulation 3 6 7 8 9
Distance ‘a’ (mm) 162 172 182 200 250
Top Bolt 451 449 419 412 344
Middle Bolt 443 443 445 450 451
Bottom Bolt 457 457 456 457 458
Standard Deviation 7 7 18 24 64
Ultimate Load (kN) 368 352 348 297 209

71
Figure 5.15 Distance of point of inflection to weld line for varying distance ‘a’
Figure 5.16 is a graph of the distance ‘a’ versus the measured effective bolt eccentricity,
eb, at failure. It shows that the eb increases with an increase in distance ‘a’ up to a
maximum bolt eccentricity value of 105 mm.
Figure 5.16 Distance ‘a’ versus FE measured eb
0
50
100
150
200
250
300
350
400
0 100 200 300 400 500
Sh
ear
(kN
)
Distance of point of inflection to weld line (mm)
'a' - 162 mm
'a' - 172 mm
'a' - 182 mm
'a' - 200 mm
'a' - 250 mm
'a' - 162 mm Bolt line
'a' - 172 mm Bolt line
'a' - 182 mm Bolt line
'a' - 200 mm Bolt line
'a' - 250 mm Bolt line
84
89
94
99
104
109
160 180 200 220 240 260Eff
ecti
ve
bolt
ecc
entr
icit
y (
mm
)
Distance 'a' (mm)

72
Table 5.6 lists the predicted eb and ultimate loads from both the FE simulations and the
AISC recommendation. It shows that the AISC design procedure is conservative in
estimating the effective bolt eccentricity, which results in underestimating the connection
shear capacity with an average of Fu,AISC/Fu ratio of 0.38. The calculated bolt shear
capacity using FE effective bolt eccentricities compares better with the FE ultimate loads,
having an average Fu,FE/Fu ratio of 0.73 which is approximately twice the shear load
predicted by the standard.
Table 5.6 Summary of effect of distance‘a’
Simu. ‘a’
Distance
Bolt
Failure
3 162 Bottom 86 162 244 139 368 0.66 0.38
6 172 Bottom 96 172 223 131 352 0.63 0.37
7 182 Bottom 101 182 213 123 348 0.64 0.35
8 200 Bottom 104 200 209 113 297 0.70 0.38
9 250 Bottom 105 250 208 91 209 1.00 0.43
1 Bolt effective eccentricity according to FE simulation, mm
2 Bolt effective eccentricity according to AISC 2011, mm
3 Bolt shear including bolt group reduction factor based on , kN
4 Connection ultimate capacity based on AISC 2011 design procedure, kN
5 Ultimate connection shear for FE simulation, kN
5.4 Plate Thickness
Four different shear tab thicknesses are selected to investigate the effect of varying the
plate thickness on the behaviour and ultimate load of EST connections. Simulations 3, 10,
11 and 12 have plate thicknesses of 10, 8, 6 and 12 mm respectively. Figure 5.17 plots
the connection shear versus vertical deflection of the shear tab. The deflection was
measured at the bottom of the shear tab as illustrated in Figure 5.18. Figure 5.17 shows
that the onset of nonlinearity for the 6 mm plate commences at much lower load and

73
attained a significantly lower capacity than the other three plate thicknesses. For the other
three plate thickness, as the plate thickness increases, the vertical displacement decreases.
Figure 5.17 Shear versus vertical displacement for varying plate thickness
Figure 5.18 Location of shear tab deflection measurment
0
50
100
150
200
250
300
350
400
0 10 20 30 40 50
Sh
ear
(kN
)
Vertical displacement (mm)
10 mm
8 mm
6 mm
12 mm

74
Figure 5.19 is a plot of the connection shear versus shear tab rotation for four plate
thicknesses. Once again it can be seen that onset of nonlinear behaviour commences
earlier for simulation 11 with the 6 mm plate. For simulation 11, the shear tab rotation
plot flattens at 275 kN whereas simulations 3, 10 and 11 with the thicker plates, are
capable of resisting higher shear loads.
Figure 5.19 Connection shear versus shear tab rotation for varying plate thickness
Figures 5.20, 5.21 and 5.22 are plots of the connection shear versus the shear stress
across all three bolts for simulations 10, 11 and 12, respectively. Similar to the shear
stress plot for simulation 3 (Figure 5.9), simulation 10 demonstrates a drop in shear stress
in the bottom bolt after fracture at a connection shear load of 351 kN. The dotted line in
Figure 5.20 depicts the maximum shear stress and corresponding failure load for bolt 3.
0
50
100
150
200
250
300
350
400
0.00 0.02 0.04 0.06 0.08 0.10 0.12 0.14
Sh
ear
(kN
)
Shear tab rotation (rad)
12 mm
10 mm
8 mm
6 mm

75
For simulation 11 shown in Figure 5.21 the shear stress does not reach shear stress levels
large enough to cause bolt fracture. Instead an instability of the plate occurs at the 275 kN
marked by the dotted line in Figure 5.21. After this point the shear stress fluctuates
erratically with load indicating an instability. At the 275 kN the shear versus vertical
deflection plot for simulation 11 in Figure 5.17 flattens signifying plate yielding. Hence,
the reduced thickness of simulation 9 resulted in a plate shear yielding failure at 275 kN.
Simulation 12 with the 12 mm thick plate reached bolt fracture at 371 kN with a
maximum shear stress of 457 MPa as illustrated in Figure 5.22.
Figure 5.20 Connection shear versus shear stress for simulation 10
(plate thickness = 8 mm)
351
448
0
50
100
150
200
250
300
350
400
450
500
0 50 100 150 200 250 300 350 400
Sh
ear
Str
ess
(MP
a)
Shear (kN)
Bolt 1
Bolt 2
Bolt 3

76
Figure 5.21 Connection shear versus shear stress for simulation 11
(plate thickness = 6 mm)
Figure 5.22 Connection shear versus shear stress for simulation 12
(plate thickness = 12 mm)
275 0
50
100
150
200
250
300
350
400
0 50 100 150 200 250 300 350
Sh
ear
Str
ess
(MP
a)
Shear (kN)
Bolt 1
Bolt 2
Bolt 3
374
457
0
50
100
150
200
250
300
350
400
450
500
0 100 200 300 400 500
Shea
r st
ress
(M
Pa)
Shear (kN)
Bolt 1
Bolt 2
Bolt 3

77
Table 5.7 lists the shear stress for all bolts at ultimate load for simulations 3, 10 and 12.
The shear stress standard deviation for simulation 3, 10 and 12 were 7, 19 and 6 MPa,
respectively. As theplate thickness increases, the distribution of shear stress in three bolts
becomes more even.
Table 5.7 Shear stress, MPa, distribution across 3 bolts for simulations 3, 10, 11 and 12
Figure 5.23 illustrates the movement of the point of inflection for simulation 3, 10, 11
and 12. As shown, the change in plate thickness does not influence the overall movement
trend of the inflection point. Furthermore, the inflection point of simulation 11 does not
reverse direction away from the bolt line as in simulations 3, 10 and 12 since the shear
yielding governed the connection capacity prior to bolt shear failure.
Simulation 3 10 11 12
Plate thickness
(mm) 10 8 6 12
Top Bolt 451 426 - 454
Middle Bolt 443 409 - 445
Bottom Bolt 457 448 - 457
Standard Deviation 7 19 - 6
Ultimate Load (kN) 368 351 275 374
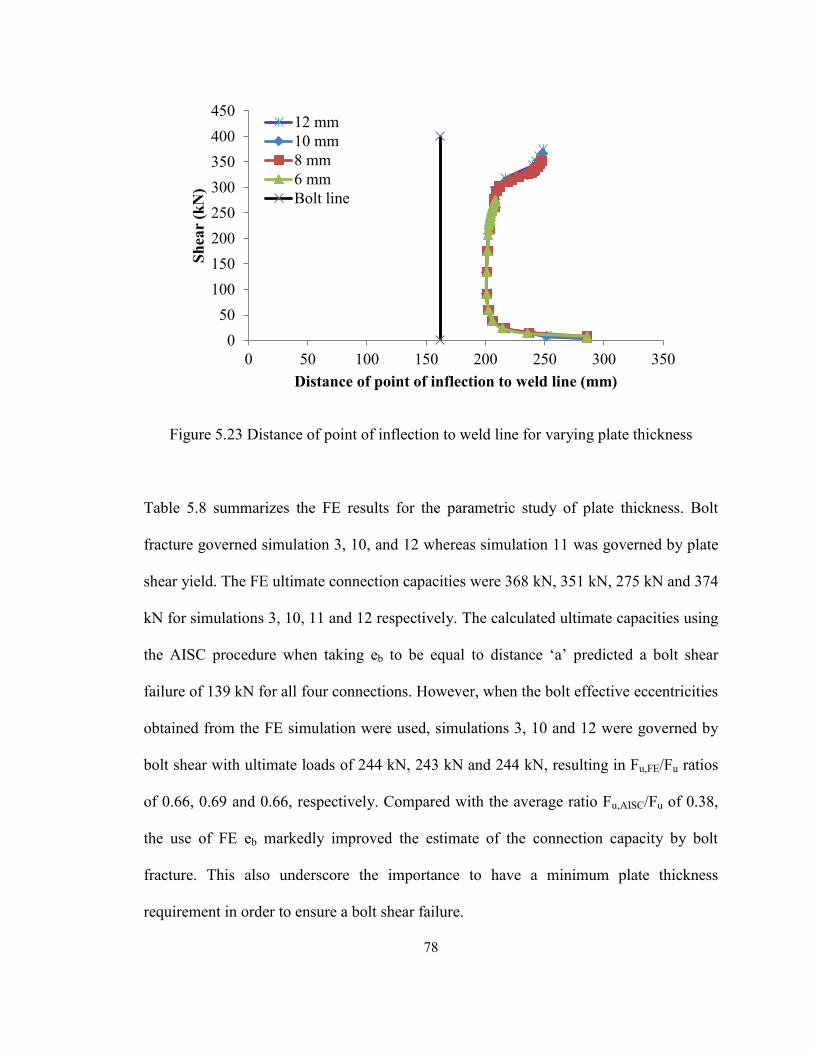
78
Figure 5.23 Distance of point of inflection to weld line for varying plate thickness
Table 5.8 summarizes the FE results for the parametric study of plate thickness. Bolt
fracture governed simulation 3, 10, and 12 whereas simulation 11 was governed by plate
shear yield. The FE ultimate connection capacities were 368 kN, 351 kN, 275 kN and 374
kN for simulations 3, 10, 11 and 12 respectively. The calculated ultimate capacities using
the AISC procedure when taking eb to be equal to distance ‘a’ predicted a bolt shear
failure of 139 kN for all four connections. However, when the bolt effective eccentricities
obtained from the FE simulation were used, simulations 3, 10 and 12 were governed by
bolt shear with ultimate loads of 244 kN, 243 kN and 244 kN, resulting in Fu,FE/Fu ratios
of 0.66, 0.69 and 0.66, respectively. Compared with the average ratio Fu,AISC/Fu of 0.38,
the use of FE eb markedly improved the estimate of the connection capacity by bolt
fracture. This also underscore the importance to have a minimum plate thickness
requirement in order to ensure a bolt shear failure.
0
50
100
150
200
250
300
350
400
450
0 50 100 150 200 250 300 350
Sh
ear
(kN
)
Distance of point of inflection to weld line (mm)
12 mm
10 mm
8 mm
6 mm
Bolt line

79
For simulation 11, the AISC manual 2011 predicted bolt shear to be the governing limit
state at 139 kN. The plate shear yielding limit state according to the AISC Specification
(2010) yields a value of 290 kN for plate yielding. The finite element simulation
predicted plate yield at 275 kN, which is within 5% of the AISC value.
Table 5.8 Summary of effect of plate thickness
Sim.
Plate
thickness
(mm)
Vertical
deflection
(mm)
Failure
3 10 34 Bolt
fracture 86 162 244 139 368 0.66 0.38
10 8 41 Bolt
fracture 87 162 243 139 351 0.69 0.39
11 6 36 Plate
yield - - - 139/290 275 - -
12 12 24 Bolt
fracture 86 162 244 139 371 0.66 0.38
1 Bolt effective eccentricity according to FE simulation, mm
2 Bolt effective eccentricity according to AISC 2011, mm
3 Bolt shear including bolt group reduction factor based on , kN
4 Connection ultimate capacity based on AISC 2011 design procedure, kN
5 Ultimate connection shear for FE simulation, kN
5.5 Double-Row of Bolts
A single plate shear connection with two vertical bolt rows was investigated. Figure 5.24
identifies rows 1 and 2 in the connection. The distance between the first row of bolts and
the weld line remained 162 mm as in simulation 3.

80
Figure 5.24 EST with double vertical bolt rows
Figure 5.25 illustrates the connection shear versus the beam end rotation for simulations
3, 13, and 14. Simulation 3 has one single row and simulation 13 with two rows but both
have a plate thickness of 10 mm. Simulation 14 has two rows of bolts but with a plate
thickness of 12 mm. Beams in simulations 3, 13 and 14 all yield at approximately 260 kN
marked by the dotted black line. The double-row connection shows beam behaviour
similar to that of simulation 3 but attains greater beam end rotation. In the case of double-
row connection, the use of a thicker plate (simulation 14) results in a higher connection
load and a greater post-yield rotation than the thinner plate (simulation 13).

81
Figure 5.25 Shear versus beam end rotation for double bolt row
Figure 5.26 illustrates the shear stress distribution for the double-row connection for
simulation 13. It is evident that in general, the bolts in row 1 resist more shear than bolts
in row 2. Additionally, in a single line of bolts the topmost bolt initially carries more of
the shear than the bolts in the middle or bottom of the row. The FE model failed to
converge at 420 kN shear load marked by the dotted black line in the Figure 5.26. At this
point shear stresses are not high enough to cause a bolt shear failure. At the 420 kN load,
the shear tab rotation became excessive resulting in high stress concentrations between
the EST and column web. Figure 5.27 is the von Mises stress distribution at 420 kN for
the shear tab from FE results. The large rotation results in a high stress concentration
along the top left corner of the shear tab. The high stress traces along the entire column
web.
260
0
100
200
300
400
500
600
0.00 0.05 0.10 0.15 0.20 0.25
Sh
ear
(kN
)
Beam end rotation (rad)
Single row - 10 mm plate
Double row - 10 mm plate
Double row - 12 mm plate

82
Figure 5.26 Connections shear versus Shear stress fluctuation for simulation 13
Figure 5.27 Von Mises stress, Pa, distribution for simulation 13 at 420 kN
0
50
100
150
200
250
300
350
400
450
0 100 200 300 400 500
Sh
ear
Str
ess
(MP
a)
Shear (kN)
Row 1 Top
Row 1 Middle
Row 1 Bottom
Row 2 Top
Row 2 Middle
Row 2 Bottom

83
Figure 5.28 below is a plot of the horizontal shear stress component versus connection
shear for simulation 13. It shows that the top and bottom bolts resist horizontal shear
forces due to the shear tab rotation for both rows. The middle bolts experience a small
positive shear force which suggests that the center of rotation does not lie exactly at mid-
depth of the shear tab. In addition, the second row of bolts appears to attained slightly
higher horizontal shear stress. Referring to Figure 5.26 which shows that the first row of
bolts attained much greater total shear stress prior to the yielding of beam web, this
indicates that the most vertical shear stress is resisted by the first row of bolts before
yielding. Force redistribution is evident when at failure the second row of bolts picks up
the load significantly.
Figure 5.28 Connection shear versus horizontal shear stress for simulation 13
The fluctuation of the shear stress for simulation 14 is illustrated in Figure 5.29. A similar
variation trend to simulation 13 is observed but a close examination shows that the
-400
-300
-200
-100
0
100
200
300
0 100 200 300 400 500
Hori
zon
tal
Sh
ear
Str
ess
(MP
a)
Shear (kN)
Row 1 Top
Row 1 Middle
Row 1 Bottom
Row 2 Top
Row 2 Middle
Row 2 Bottom

84
connection failed by bolt shear failure at 488 kN. It suggests that when the connection
becomes stiffer using more rows of bolts, the plate thickness needs to be increased to
ensure a bolt shear failure.
Figure 5.29 Connections shear versus shear stress fluctuation for simulation 14
The shear stress variation across each bolt at failure is summarized in Table 5.9 for the
single row and double row connections. It is evident that the single-row bolts attain shear
stress higher than the double-row connection. The bolts in row 1 in a double row
arrangement resist more shear than bolts in row 2. Comparing simulation 13 and 14, it
shows that the use of a thicker plate enables failure at a higher load caused by bolt failure
and a thinner plate results in a failure load 14% lower. The bolt strength is not fully
utilized.
488 0
50
100
150
200
250
300
350
400
450
500
0 100 200 300 400 500 600
Sh
ear
stre
ss (
MP
a)
Shear (kN)
Row 1 Top bolt
Row 1 Middle bolt
Row 1 Bottom bolt
Row 2 Top bolt
Row 2 Middle bolt
Row 2 Bottom bolt
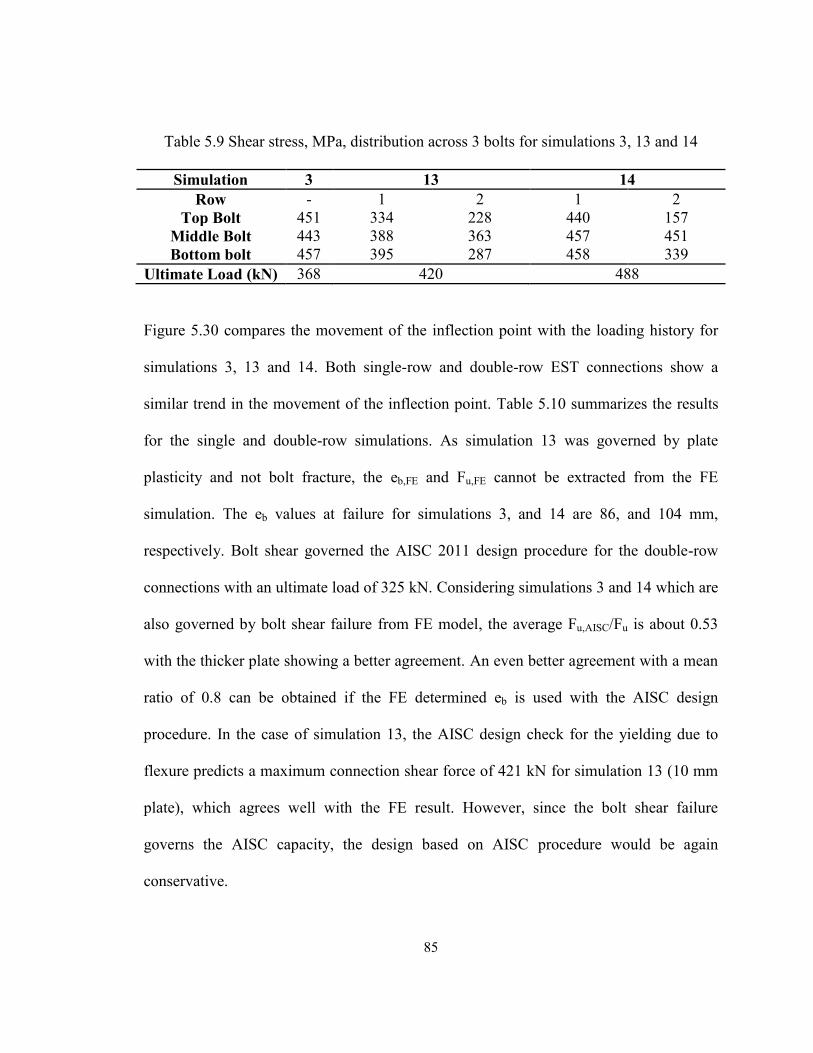
85
Table 5.9 Shear stress, MPa, distribution across 3 bolts for simulations 3, 13 and 14
Simulation 3 13 14
Row - 1 2 1 2
Top Bolt 451 334 228 440 157
Middle Bolt 443 388 363 457 451
Bottom bolt 457 395 287 458 339
Ultimate Load (kN) 368 420 488
Figure 5.30 compares the movement of the inflection point with the loading history for
simulations 3, 13 and 14. Both single-row and double-row EST connections show a
similar trend in the movement of the inflection point. Table 5.10 summarizes the results
for the single and double-row simulations. As simulation 13 was governed by plate
plasticity and not bolt fracture, the eb,FE and Fu,FE cannot be extracted from the FE
simulation. The eb values at failure for simulations 3, and 14 are 86, and 104 mm,
respectively. Bolt shear governed the AISC 2011 design procedure for the double-row
connections with an ultimate load of 325 kN. Considering simulations 3 and 14 which are
also governed by bolt shear failure from FE model, the average Fu,AISC/Fu is about 0.53
with the thicker plate showing a better agreement. An even better agreement with a mean
ratio of 0.8 can be obtained if the FE determined eb is used with the AISC design
procedure. In the case of simulation 13, the AISC design check for the yielding due to
flexure predicts a maximum connection shear force of 421 kN for simulation 13 (10 mm
plate), which agrees well with the FE result. However, since the bolt shear failure
governs the AISC capacity, the design based on AISC procedure would be again
conservative.

86
Figure 5.30 Distance of point of inflection to weld line for double vertical row
Table 5.10 Summary of effect of single and double-row bolts
Simu. Failure
3 Bolt
fracture 86 162 246 139 368 0.67 0.38
13 Plate
yield - 162 -
325/
421 420 - 0.77
14 Bolt
fracture 104 162 454 325 488 0.93 0.67
1 Bolt effective eccentricity according to FE simulation, mm
2 Bolt effective eccentricity according to AISC 2011, mm
3 Bolt shear including bolt group reduction factor based on , kN
4 Connection ultimate capacity based on AISC 2011 design procedure, kN
5 Ultimate connection shear for FE simulation, kN
5.6 Beam Lateral Restraint
A potential failure mode for unstiffened EST is the twisting of the plate. As discussed in
Chapter II, twisting is due to the offset of the shear force to the centroid of the shear tab
0
100
200
300
400
500
600
0 50 100 150 200 250 300 350
Sh
ear
(kN
)
Distance of point of inflection to weld line (mm)
Single row - 10 mm plate
Double row - 10 mm plate
Double row - 12 mm plate
First bolt row

87
as the beam web is only connected to one side of the EST. The twisting of the plate will
result in the twisting of the beam web, which in turn cause the beam flange to twist as
well. Figure 5.31 illustrates the twisting of the shear tab when no lateral end restraint is
provided where the legend is the lateral deflection in meters.
Figure 5.31 Shear tab twist for simulation 15
In this section, the effect of lateral restraint provided at the beam top flange on the
capacity of the EST connection is studied. Four different beam lateral restraint cases are
examined. The beam in simulation 3 was fully laterally restrained. Simulation 15 was
laterally braced at the midspan. Simulation 16 was laterally braced at the end points and
simulation 17 was restrained at both midspan and endpoints. Figure 5.32 shows the
different beam restraint simulated in the FEM.

88
(a) Simulation 3
(b) Simulation 15
(c) Simulation 16
(d) Simulation 17
Figure 5.32 Beam lateral restraint locations

89
Figure 5.33 illustrates the beam behaviour for each of the four simulations. Simulation 3
with the fully laterally supported beam began to yield at 260 kN whereas the other
simulations predict yielding of the beam at 220 kN.
Figure 5.33 Beam end rotation for lateral restraint parameter
Figure 5.34 shows the connection shear versus the shear tab rotational twist for all cases.
It can be seen that the inclusion of a lateral restraint at the end of the beam effectively
controls the lateral twisting of the shear tab as shown in simulations 3, 16 and 17. The
exclusion of the end restraint as in simulation 15 influences the connection behaviour and
ultimately the connection capacity. The connection shear versus rotational twist curve for
simulation 15 levels off at a load of 245 kN whereas simulations 3, 16 and 17 continue to
resist higher load with no sign of a rotational twist failure. Simulations 3 and 17 were
governed by the shear failure of the bolt. Simulation 16 attained a lower ultimate load
0
50
100
150
200
250
300
350
0.00 0.02 0.04 0.06 0.08 0.10 0.12 0.14
Sh
ear
(kN
)
Beam end rotation (rad)
Fully lateral restraint
Midpoint restraint
Endpoint restraint
Midpoint and endpoint restraint

90
than simulations 3 and 17. Since simulation 16 was laterally restrained at the end points
only, the beam experienced a substantial lateral deflection at mid-span due to lateral
instability of the beam. This deflection has attributed to the reduction of the connection
capacity. Simulation 16 failed by lateral torsional buckling of the beam prior to reaching
the bolt shear strength. The FE predicted ultimate loads of 368, 263 and 322 kN for
simulations 3, 16 and 17, respectively. Figure 5.35 illustrates the lateral torsional
buckling at midspan of the beam.
Figure 5.34 Connection shear versus rotational twist of shear tab
0
50
100
150
200
250
300
350
0 0.02 0.04 0.06 0.08 0.1 0.12 0.14
Sh
ear
(kN
)
Twist (rad)
Full lateral restraintMidpoint restraintEndpoint restraintMidpoint and endpoint restraints

91
Figure 5.35 Lateral torsional buckling demonstarted in simulation 16
For simulation 15 where the lateral restraint is not provided at the tab location, the
connection failed by tab twist at 245 kN. This value is in line with theoretical value of
240 kN obtained from Equation [2.8] proposed by Sherman and Ghorbanpoor (2002).
5.7 Beam Length-to-Depth Ratio
The length to depth ratio, L/D, was varied to examine the slenderness of the beam on the
connection capacity. The length of the beam is varied while the beam depth is
maintained. For simulations 3, 18, and 19, the beam lengths are 9 m, 5 m and 7 m,
respectively. Figure 5.36 shows a comparison of the beam end rotation of FE models.
Simulations 18, 19 and 3 contained both a linear and nonlinear portion along the loading
history of the FE models. Naturally, beams with a longer span resulted in larger rotations
at the ends. At failure, simulations 18, 19 and 3 had end rotations of 0.118, 0.135, and
0.150 rad, respectively.

92
Figure 5.36 Shear versus beam end rotation for length to depth ratio parameter
Figures 5.37 and 5.38 illustrate the shear stress distribution for simulations 18 and 19.
Bolt shear failure governed both cases. The bolt shear failure occurs at 400 kN and 392
kN for the 5 m and 7 m beams, respectively. A decrease in the bolt group shear capacity
is observed with the increase in beam length.
Figure 5.37 Shear stress versus connection shear for simulation 18 (5 m beam)
0
50
100
150
200
250
300
350
400
450
0 0.02 0.04 0.06 0.08 0.1 0.12 0.14 0.16
Sh
ear
(kN
)
Beam end rotation (rad)
5 m
7 m
9 m
400
456
050
100150200250300350400450500
0 100 200 300 400 500
Sh
ear
Str
ess
(MP
a)
Shear (kN)
Bolt 1
Bolt 2
Bolt 3

93
Figure 5.38 Shear stress versus connection shear for simulation 19 (7 m beam)
Table 5.11 lists the shear stress values at ultimate load for each of the simulations. The
table shows that the shear stress is distributed across all three bolts in a similar manner
and the maximum shear stress occurs in the bottom bolt at failure for all simulations.
Table 5.11 Shear stress distribution for beam length-to-depth ratio
Simulation 18 19 3
Beam Length (m) 5 7 9
Top Bolt 432 448 451
Middle Bolt 433 438 443
Bottom Bolt 456 457 457
Standard Deviation 13 9 7
Ultimate Load (kN) 400 392 368
Figure 5.39 plots the movement of the inflection point versus connection shear load. The
fluctuation follows a similar trend as in the previous parameters; movement of the
inflection point towards the support until the beam yield region in which the inflection
point reverses direction and moves away from the support. Although following slightly
392
457
0
50
100
150
200
250
300
350
400
450
500
0 100 200 300 400 500
Sh
ear
Str
ess
(MP
a)
Shear (kN)
Bolt 1
Bolt 2
Bolt 3

94
different paths, the effective bolt eccentricities at ultimate are close for all three
simulations.
Figure 5.39 Distance of point of inflection to weld line for varying beam length-to-depth
ratios
Figure 5.40 shows the L/D ratio versus the measured effective bolt eccentricity, eb, at
failure. For the given beam slenderness, the eb increases in an approximately linear
manner with the increase in the beam slenderness.
Figure 5.40 length-to-depth ratio versus measured eb
0
100
200
300
400
500
0 100 200 300 400
Sh
ear
(kN
)
Distance between inflection point and weld line
(mm)
5 m
7 m
9 m
Bolt Line
74
76
78
80
82
84
86
88
0 5 10 15 20
Eff
ecti
ve
bolt
ecc
entr
icit
y
(mm
)
Length to depth ratio

95
The ultimate bolt shear capacity using the AISC manual 2011 design procedure are
compared with that obtained using the measured eb from the FE analysis in Table 5.12.
The FE ultimate connection capacities are 368 kN, 400 kN and 392 kN for simulations 3,
18, and 19, respectively. The AISC design procedure predicted bolt shear failure at 139
kN. The AISC method does not take the beam rotational stiffness into consideration when
determing the connections ultimate capacity. The use of the measured eb better predicted
the bolt shear capacity than using distance ‘a’ as the eccentricity. The FE measured e
underestimated bolt shear by 35% whereas the AISC procedure underestimated the
capacity by 65%.
Table 5.12 Summary of effect of beam length-to-depth ratio
Simu.
No.
L
(m)
Beam end
rotation
(rad)
(mm)
(mm)
(kN)
(kN)
(kN)
3 9 0.150 86 162 244 139 368 0.66 0.38
18 5 0.118 76 162 270 139 400 0.66 0.34
19 7 0.135 83 162 253 139 392 0.65 0.35
1 Bolt effective eccentricity according to FE simulation, mm
2 Bolt effective eccentricity according to AISC 2011, mm
3 Bolt shear including bolt group reduction factor based on , kN
4 Connection ultimate capacity based on AISC 2011 design procedure, kN
5 Ultimate connection shear for FE simulation, kN
5.8 Number of Bolts
This section studies the effect of number of bolts on the distribution of forces and the
influence it has on the ultimate capacity of the connection. The connections consisting of
three, four, five and six 20 mm, A325 high strength bolts in a single row are studied. The
bolt spacing and the horizontal and vertical edge distances are maintained for all

96
simulations according to AISC Specification 2010. The shear tab height for the 3, 4, 5
and 6 bolted connections were 229, 305, 381, 457 mm, respectively.
Figure 5.41 illustrates the beam end rotation for the 3, 4, 5 and 6 bolted connections. All
connections have the same stiffness in the linear portion of the graph. Once the beam
enters the nonlinear portion, connections with a greater number of bolts have a higher
post yield stiffness.
Figure 5.41 Coneection shear versus beam end rotation for number of bolt parameter
The shear stress plot of all bolts for the 4, 5 and 6 bolted connections are presented in
Figures 5.42 to 5.44. All connections were governed by bolt failure. The connection
capacity increases as the number of bolt increases. The 4, 5 and 6 bolted connections
reached failure at 457, 474 and 505 kN respectively. The percentage increase of the
connection capacities for the 4, 5 and 6 bolted connections in comparison with the 3
bolted connection are 24%, 29%, 37%. The 4-bolt EST connection was govern by bolt
0
100
200
300
400
500
600
0 0.05 0.1 0.15 0.2 0.25
Sh
ear
(kN
)
Beam end rotation (rad)
3 bolt EST
4 bolt EST
5 bolt EST
6 bolt EST

97
fracture of the bottom bolt, similar to the 3 bolted connection presented earlier. However,
bolt shear failure for the 5 and 6 bolted connections occurred in the topmost bolt.
Figure 5.42 Shear stress versus connection shear for simulation 20 (4-bolt EST)
457
457 0
50
100
150
200
250
300
350
400
450
500
0 100 200 300 400 500
Sh
ear
Str
ess
(MP
a)
Shear (kN)
Bolt 1
Bolt 2
Bolt 3
Bolt 4

98
Figure 5.43 Shear stress versus connection shear for simulation 21 (5-bolt EST)
Figure 5.44 Shear stress versus connection shear for simulation 22 (6-bolt EST)
457
474 0
50
100
150
200
250
300
350
400
450
500
0 100 200 300 400 500 600
Sh
ear
Str
ess
(MP
a)
Shear (kN)
Bolt 1
Bolt 2
Bolt 3
Bolt 4
Bolt 5
505
457
0
50
100
150
200
250
300
350
400
450
500
0 100 200 300 400 500 600
Sh
ear
Str
ess
(MP
a)
Shear (kN)
Bolt 1Bolt 2Bolt 3Bolt 4Bolt 5Bolt 6

99
The movement of the inflection point for the four simulations is presented in Figure 5.45.
A similar observation can be made in the movement of the point of zero moment in
general. At failure, as the number of bolts increases, the effective bolt eccentricty
increases where the effective bolt eccentricity, eb, was 86 mm, 90 mm, 94 mm, 114 mm
for the 3, 4, 5 and 6 bolted connections. This is reasonable since the more bolts in a
connection, the stiffer the connection and thus the bigger eccentricity.
Figure 5.45 Distance of point of inflection to weld line for number of bolt parameter
Figure 5.46 below is a graph of the measured effective bolt eccentricity, eb, versus the
number of bolts in the connection. It shows that a more or less linear relationship is
observed between the increase in effective bolt eccentricity, eb, and the increase in the
number of bolts. The eccentricity eb increases as the number of bolts in the connection
increases, which leads to an increased moment applied to the bolt group. However, the
added capacity due to more bolts is still achieved.
0
100
200
300
400
500
600
0 100 200 300 400
Sh
ear
(kN
)
Distance between inflection point and weld line (mm)
3-bolt EST4-bolt EST5-bolt EST6-bolt ESTBolt Line

100
Figure 5.46 Number of bolts versus measured eb
The bolt group shear strength was the governing limit state for all four simulations as
predicted by AISC manual 2011. Table 5.13 summarizes the FE ultimate capacity and the
AISC predicted capacity for each simulation. The AISC manual 2011 underestimates the
3, 4 and 5 bolted connections by 62%, 45%, and 31%, respectively when compared with
FE results. The AISC manual 2011 predicted the 6 bolted connection capacity within 2%
of FE results. When the FE measured eb was used, the bolt capacities were more
accurately predicted for the 3 and 4 bolted connection with improved predicted-to-FE
ratio of 0.67 and 0.85, respectively. However, the FE measured eb used in AISC
procedure over predicted the capacity of the 5 and 6 bolted connections, resulting in
Fu,fe/Fu ratios greater than 1.
Table 5.13 Summary of effect of number of bolts
0
20
40
60
80
100
120
0 2 4 6 8Eff
ecti
ve
bolt
ecc
entr
icit
y
(mm
)
Number of bolts
Simu.
No.
Number
of bolts
(mm)
(mm)
(kN)
(kN)
3 3 86 162 244 139 368 0.66 0.38
20 4 90 162 389 250 457 0.85 0.55
21 5 94 162 538 375 474 1.13 0.79
22 6 114 162 641 517 505 1.27 1.02

101
This discrepancy may be explained as follows. The AISC manual 2011 design procedure
is based on the instantaneaous center of rotation method described in Chapter 2. This
method assumes that the center of rotation in line with the centroid of the bolt group.
However, according to FE results, the center of rotation for the five and six bolted
connections occurs closer to the bottom bolt resulting in added stress in the top bolt
causing shear failure. Figures 5.47 to 5.50 illustrate the bolt movement for the 3, 4, 5 and
6 bolted EST connections obtained from FE analysis. The Y-axis represents the initial
bolt line location. The circles represent the initial and final bolt location at failure. It can
be seen that the center of bolt rotation lies much closer to the bottom bolt (where the
dotted black line crosses the Y-axis) for the 5 and 6 bolted connections but close to the
middle bolt for 3 and 4 bolted connections. AISC manual 2011 method assumes the
dotted black line passes through the origin, a concentric rotation about the vertical
centroid of the bolt group. This method fails to recognize the higher stresses generated in
the topmost bolts due to the shift of the center of rotation, especially in the case of high
number of bolts (>4). Thus, for 3 and 4 bolted EST connections, using FE measured eb in
combination with AISC manual 2011 method improves the bolt shear strength estimate.
But for 5 and 6 bolted EST connections, using FE measured eb in combination with AISC
manual 2011 method overestimates the connection shear capacity. The conservative
estimate of eccentricity by AISC design procedure, on the other hand, seems to provide
reasonably accurate bolt shear strength estimate.

102
Figure 5.47 Bolt movement for 3-bolt EST connection
Figure 5.48 Bolt movement for 4-bolt EST connection
-120
-100
-80
-60
-40
-20
0
20
40
60
80
100
-10 -5 0 5 10 15
Y-c
oord
inate
(m
m)
X-coordinate (mm)
Bolt 1
Bolt 2
Bolt 3
-150
-100
-50
0
50
100
150
-15 -10 -5 0 5 10 15 20
Y-c
oord
inate
(m
m)
X-coordinate (mm)
Bolt 1
Bolt 2
Bolt 3
Bolt 4

103
Figure 5.49 Bolt movement for 5-bolt EST connection
Figure 5.50 Bolt movement for 6-bolt EST connection
-200
-150
-100
-50
0
50
100
150
200
-20 -10 0 10 20 30 40
Y-c
oord
inate
(m
m)
X-coordinate (mm)
Bolt 1Bolt 2Bolt 3Bolt 4Bolt 5
-250
-200
-150
-100
-50
0
50
100
150
200
250
-20 0 20 40 60
Y-c
oord
inate
(m
m)
X-coordinate (mm)
Bolt 1Bolt 2Bolt 3Bolt 4Bolt 5

104
5.9 Evaluation of Available Effective Eccentricity Equations
The only exsiting effective eccentricity equation for EST connections is proposed by
Sherman and Ghorbanpoor (2002) for EST connections with 6 or less bolts. The
recommended equation is shown in Equation [5.2]. The effective bolt eccentricity, eb,
measured in inches, is solely dependant on the number of bolts, n, in the connection with
a maximum upper limit of distance ‘a’.
, in for n ≤ 6 [5.2]
The effective eccentricity for 3 bolted EST connections obtained from this study is
compared with values ontained using this equation and AISC manual 2011 values in
Figure 5.41. The solid blue line in the figure indicates the eb value suggested by the AISC
manual 2011, which is 162 mm for the given parameters. The red line represents eb
recommended by Sherman and Ghorbanpoor (2002), which is 76.2 mm. The dots in
green are the measured eccentricities at bolt failure extracted from the FE model. A total
of nine 3-bolt EST connection simulations were used. It can be seen that the measured
bolt eccentricities are much smaller than the value suggested by the AISC 2011 design
procedure. The equation proposed by Sherman and Ghorbanpoor (2002) seems to provide
a lower bound value of the effective bolt eccentricity. The purple crosses marked in
Figure 5.51 were obtained by back-calculating the effective bolt eccentricities using the
FE ultimate loads if AISC 2011 method is used. The average of the eccentricities
obtained from the back-calculation of the FE ultimate load is represented as a solid purple
line, which is around 47 mm.

105
Figure 5.51 Effective bolt eccentricity, eb, for all EST connections governed by bolt
fracture
As for the 4-bolt, 5-bolt, and 6-bolt EST connections, the AISC 2011 design procedure
suggests a bolt eccentricity of 162 mm for all cases. The equation by Sherman and
Ghorbanpoor (2002) yields a bolt eccentricity of 102 mm, 127 mm, and 152 mm,
respectively. The FE analyses predicted bolt eccentricities of 90 mm, 94 mm, 114 mm for
the 4-bolt, 5-bolt and 6-bolt EST connections.
0
20
40
60
80
100
120
140
160
180
0 5 10
Eff
ecti
ve
bolt
ecc
entr
icit
y,
eb, (m
m)
FE measured
eccentricities
Shear stress analysis
AISC 2011
Sherman and
Ghorbanpoor (2002)
Shear stress analysis
mean average

106
CHAPTER 6 Summary and Conclusion
6.1 Summary
The purpose of this study was to investigate the behaviour and strength of unstiffened
extended single plate shear connections focusing on the bolt shear strength. A finite
element model was developed in ANSYS to simulate the EST connection behaviour in a
typical beam to column web connection situation. The FE element model was verified
using experimental test results obtained from Astaneh et al. (1989) on CST connections
and from Sherman and Ghorbanpoor (2002) on EST connections. A parametric study was
subsequently carried out to study effects of seven parameters on the strength of EST
connections. The behaviour in the from of connection shear vs. beam end rotation
responses is discussed; the effective eccentricity obtained from FE model is presented
and the validity of AISC manual 2011 design procedure is assessed.
6.2 Conclusion
6.2.1 Web Slenderness Ratio of the Supporting Column
An increase in the slenderness of the web, h/w, results in a increase in the effective
eccentricity for the bolt group and a reduction in the shear capacity of the connection.
Columns with a low web slenderness (i.e. stiffer support) had more evenly distributed
shear stresses. A minimum h/w ratio should be placed to avoid the web yielding.

107
6.2.2 Distance ‘a’
An increase in distance “a” results in an increase in the bolt eccentricity and hence a
decrease in the connection strength. However, the rate of the increase in the effective
eccentricity decreases and it seems that the maximum effective bolt eccentricity levels off
at 105 mm.
6.2.3 Plate Thickness
For the studied thickness, an increase in the plate thickness results in an increase in the
connection shear strength and also more even distribution in the shear stress among all
bolts. The failure of the connection using a thin plate may be governed by plate yielding
rather than bolt fracture as in the case of thicker plate.
6.2.4 Double-Row of Bolts
A sufficiently thick plate needs to be used with double-row bolts to ensure bolt shear
failure. When a thin plate (10 mm) is used, the failure of connections using double-row
bolts was governed by the tensile yielding of the shear tab due to flexure at the top of the
shear tab whereas when a thicker plate (12 mm) is used, the failure of connection is
governed by bolt shear. However, the AISC manual 2011 design procedure predicted bolt
fracture to be the governing limit state for both cases. A minimum plate thickness
requirement should be developed for multi-row bolt arrangement.

108
6.2.5 Lateral Restraint
The presence of a lateral restraint at the beam end effectively controls the twisting of the
EST. Excluding the end restraint can significantly decrease the connection capacity. A
35% decrease in connection capacity for the 3-bolt EST connection is observed when end
restraint was absent.
6.2.6 Beam Length-to-Depth Ratio
The beam end rotation increases with the increase in length-to-depth ratio of the beam.
The increased beam end rotation results in an increase in the effective eccentricity and a
reduction in the connection capacity.
6.2.7 Number of Bolts
An increase in number of bolts results in an increase in the FE measured bolt eccentricity.
However, the connection capacity increase is realized with the increase in the number of
bolt. The instantaneous center of rotation for the 3 and 4-bolt EST connections occurred
close to the centroid of the bolt group whereas this location for the 5 and 6-bolt EST
connections occured close to the bottom bolt resulting in increased stresses on the top
bolts.
6.2.8 Evaluation of AISC manual 2011
In general, the AISC design procedure only permits 34% to 42% of the available 3-bolt
connection capacity and 55% of the available 4-bolt connection capacity when compared
with finite element results.. This conservatism is due to the large values used in the AISC

109
bolt eccentricity. When the finite element determined eccentricity is used in combination
with AISC design procedure, the prediction of bolt shear capacity of the connection can
be improved by about 30%. In the case of 5 and 6-bolt connections, the AISC procedure
predict the capacity within 12 and 2% of the finite element results, respectively. It
suggests that the AISC procedure is more accurate for the use of EST connections with
higher number of bolts.
6.3 Recommendations for Future Work
Extended single plate shear connection simulation by finite element modeling allows the
study of various parameters without the need of costly physical experimental studies. The
following are recommendations for further research.
Additional studies on the effect of double and triple bolt rows on the single plate
behaviour.
This series of FE modeling focused on single plate shear connections to flexible
column supports. Additional work should be done to flexible girder supports.
Assess the influence of larger bolt diameters on the bolt eccentricity and
connection capacity.
Investigate stiffened extended single plate shear connections, where the shear tab
is stiffened with a plate that is welded between the column flanges.
110
REFERENCES
ANSYS (2010), User Manual, Version 13.0, ANSYS, Inc., SAS IP, Inc.
CISC (2010), Handbook of Steel Constructions, 10th ed., Canadian Institute of Steel
Construction
AISC (1994), Manual of Steel Constrcution LRFD, Vol. II, 2nd ed., American Institue of
Steel Construction, Chicago, IL.
AISC (2005), Steel Construction Manual, 13th ed., American Institute of Steel
Construction, Chicago, IL.
AISC (2010), Specification for Structural Steel Buildings, ANSI/AISC 360-10, American
Institute of Steel Construction, Chicago, IL.
AISC (2011), Steel Construction Manual, 14th ed., American Institute of Steel
Construction, Chicago, IL.
Ashakul, A. (2004), “Finite Element Analysis of Single Plate Shear Connections,” Doctor
of Philosophy Dissertation, Virginia Polytechnic Institute and State University,
Blacksburg, Virginia.
Astaneh, A., Call, S.M. and McMullin, K.M. (1989), “Design of Single Plate Shear
Connections,” Engineering Journal, American Institute of Steel Construction,
Vol. 26, No. 1.
Astaneh, A. and Porter, K.A. (1990), “Design of Single Plate Connections with Snnug-
Tight Bolts in Short Slotted Holes,” Report No. UCB/SEMM-90/23, Department
of Civil Engineering, University of California, Berkeley.

111
ASTM (2013),”Specification for Structural Bolts, Steel, Heat Treated 830MPa Minimum
Tensile Strength,” ASTM International, WestConshohocken, PA, 2013, DOI:
10.1520/C0033-03
Crawford, S.F and Kulak, G.L. (1968), “Behavior of Eccentrically Loaded Bolted
Connections,” Studies in Structural Engineering, No. 4, Departmentof Civil
Engineering, Nova Scotia Technical College, Halifax, NS.
Creech, D. (2005), “Behavior of Single Plate Shear Connections with Rigid and Flexible
Supports,” Master of Science Thesis, North Carolina State University, Raleigh,
NC.
Hormby, D.E, Richard, R. M., and Kriegh, J. D. (1984). “Single-Plate Framing
Connections with Grade 50 steel and Composite Construction,” Engineering
Journal, American Institute of Steel Construction, Vol. 21, No. 3.
Kulak, G.L. and Grondin, G.Y. (2010), “Limit States Design in Structural Steel,”
Canadian Institute of Steel Construction
Lipson, S.L., (1968), “Single-Angle and Single-Plate Beam Framing Connections,”
Canadian Structural Engineering Conference, Toronto, ON, Canada, pp. 141-162
Muir, L.S. and Thornton, W.A. (2011), “The Development of a New Design Procedure
for Conventional Single-Plate Shear Connections,” Engineering Journal,
American Institute of Steel Construction, Vol. 48, No. 2.
Rahman, A., Mahamid, M., Amro, A. and Ghorbanpoor, A. (2003), “3D FE Model of
Extended Shear Tab Connections,” 16th
Engineering Mechanics Conference,
ASCE, Seattle
Rahman, A., Mahamid, M., Amro, A. and Ghorbanpoor, A. (2007), “The Analyses of
Extended Shear Tab Steel Connections, Part I: The Unstiffened Connections,”
Engineering Journal, American Institute of Steel Construction, Vol 44, No.2.

112
Richard, R. M., Gillett, P. E., Kriegh, J. D., and Lewis, B. A. (1980), “The Analysis and
Design of Single-Plate Framing Connections,” Engineering Journal, American
Institute of Steel Construction, Vol. 17, No. 2.
Richard, R. M., Kriegh, J. D., and Hormby, D. E. (1982), “Design of Single Plate
Framing Connections with A307 Bolts,” Engineering Journal, American Institute
of Steel Construction, Vol 19, No. 4.
Sherman, D.R., and Ghorbanpoor, A. (2002), “Design of Extended Shear Tabs” Research
Report RR3095, American Institute of Steel Construction, Inc., Chicago, IL.
Yarimci, E. and Slutter, R.G. (1963), “Results of Tests on Riveted Connections,” Report
No. 200.63.401.1, Fritz Engineering Laboratory, Lehigh, Betlehem, Pa.
Young, N. W., and Disque, R. O. (1981), “Design Aids for Single Plate Framing
Connections,” Engineering Journal, American Institute of Steel Construction,
Fourth Quarter, 129-148.

113
APPENDIX A
Figure A.1 Shear stress versus connection shear for simulation 1
Figure A.2 Shear stress versus connection shear for simulation 2
377 0
50
100
150
200
250
300
350
400
450
500
0 100 200 300 400 500
Sh
ear
Str
ess
(MP
a)
Shear (kN)
Bolt 1
Bolt 2
Bolt 3
376 0
50
100
150
200
250
300
350
400
450
500
0 100 200 300 400 500
Sh
ear
Str
ess
(MP
a)
Shear (kN)
Bolt 1
Bolt 2
Bolt 3

114
Figure A.3 Shear stress versus connection shear for simulation 4
Figure A.4 Shear stress versus connection shear for simulation 5
330 0
50
100
150
200
250
300
350
400
450
500
0 100 200 300 400 500
Sh
ear
Str
ess
(MP
a)
Shear (kN)
Bolt 1
Bolt 2
Bolt 3
0
50
100
150
200
250
300
350
400
450
500
0 50 100 150 200 250 300
Sh
ear
Str
ess
(MP
a)
Shear (kN)
Bolt 1
Bolt 2
Bolt 3

115
APPENDIX B
Appendix B contains an sample calculation of how the critical limit state according to
AISC manual 2011 design procedure was determined for the extended single plate
configuration. The calculations presented are for simulation 3. The limit states considered
in the calculations for each connection are:
1. Bolt shear.
2. Bolt bearing.
3. Plate shear yielding.
4. Plate shear rupture.
5. Plate block shear.
6. Shear yielding, shear buckling and yielding due to flexure of plate.
7. Plate buckling.
The material resistance factor, φ, is excluded from all calculations.
Example Calculation: Simulation 3
1) Bolt shear:
Rn=C*Fv*Ab (AISC 2011 Eqn J3-1)
Ab = 0.442 in2 (Table 7-1)
Fu = 137 ksi
Fv = 0.563fu = 77.2 ksi

116
eb = 6.37 in
C = 0.918 (Interpolation in Table 7-6)
Rn = C*fv*Ab
= 0.918*77.2kips*0.442in2
= 31.3 kips
= 139 kN
2) Bolt Bearing:
Rn=C*lesser of (1.2*Lc*t*Fu,2.4*db*t*Fu) (AISC 2011 Eqn J3-6a)
Lc = 1.5-(13/16)/2 in = 1.09 in
tplate = 0.394 in
Fu = 87.0 ksi
db = 0.75 in
C = 0.918
1.2*Lc*t*Fu = 44.8 kips governs
2.4*db*t*Fu = 61.7 kips
Rn = 0.918*44.8 kips = 41.1 kips
= 183 kN

117
3) Plate shear yielding:
Rn=0.6*Fy*Agv (AISC 2011 Eqn J4-3)
Fy = 50.8 ksi
dplate = 9 in
tplate = 0.394 in
Agv = 9 in *0.394 in = 3.54 in2
Rn = 0.6*50.8 ksi*3.54in2 = 108 kips
= 480 kN
4) Plate shear rupture:
Rn=0.6*Fu*Anv (AISC 2011 Eqn J4-4)
Fu = 87.0 ksi
dplate = 9 in
tplate = 0.394 in
dbolt = 0.75 in
n = 3 bolts
Anv = tplate*(L-n(dbolt+1/8))) = 0.394*(9-3*(0.75+1/8))
= 2.51 in2
Rn = 0.6*87 ksi * 2.51in2 = 131 kips

118
= 582 kN
5) Plate block shear
Rn= UbsFuAnt+ lesser of (0.6FuAnv,0.6FyAgv) (AISC 2011 Eqn J4-5)
Fy = 50.8 ksi
Fu = 87.0 ksi
tplate = 0.394 in2
dbolt = 0.75 in
Ubs = 0.5
Ant = tplate*(1.5-(dbolt/2+(1/16)))
= 0.394in*(1.5in-(0.75in/2+(1/16in))) = 0.42 in2
Agv = 0.394in*(9in-1.5in) = 2.96in2
Anv = tplate*(7.5-2.5*(dbolt+1/8))
= 0.394in*(7.5in-2.5*(0.75in+1/8in)) = 2.09in2
0.6FuAnv= 0.6*87 ksi*2.09 in = 109.1 kips
0.6FyAgv= 0.6*50.8 ksi*2.96 in = 90.2 kips governs
Rn = 0.5*87.0 ksi*0.42 in2+90.2 kips
= 108.5 kips

119
= 482 kN
6) Shear yielding, shear buckling and yielding due to flexure of plate.
(
)
(
)
(AISC 2011 Eqn 10-5)
Fy = 50.8 ksi
Dplate = 9 in
Tplate = 0.394 in
Zplate = (0.394in)*(9 in)2/4 = 7.98 in
3
Mc = FyZpl = 50.8ksi*7.98in3 = 405 kips
Vc = 31.3 kips
E = 6.37 in
Mr = Vr kips * 6.37 in = 6.37Vr kip-in
Solve for Vr:
(Vr/(31.3kips))2 + (Vr * 6.37 in/405kips)
2 = 1
0.001021Vr2 + 0.000247Vr
2 = 1
0.001268Vr2 = 1
Vr = 34.08 kips
7) Plate Buckling

120
√
√ (
)
ho = 9 in
c = 6.374 in
Fy = 50.8 ksi
tplate = 0.394 in
λ = 0.506 < 0.7 There plate buckling doesn’t govern