Finite Element Method Applications in Bulk Forming*
23
Finite Element Method Applications in Bulk Forming* Soo-Ik Oh, John Walters, and Wei-Tsu Wu METALWORKING, with its thousands of years of history, is one of the oldest and most important materials processing technologies. Dur- ing the last 30 years, with the continuous improve- ment of computing technology and the finite element method (FEM) as well as the competition for a lower-cost and better-quality product, metal- working has evolved rapidly. This article gives a summary of overall development of the FEM and its contribution to the materials forming indus- try. Because significant efforts were carried out with great success by many universities and research institutes with a similar objective and application, this article is focused on the overall philosophy and evolution of the FEM for solving bulk forming issues. The program used to demon- strate this success is the commercial code named DEFORM (Scientific Forming Technologies Corp.). A number of examples of the application of FEM to various bulk forming processes are also summarized. This article provides an overview of FEM applications. In this section, a number of appli- cations of FEM are presented in the order they would be used in a typical manufacturing pro- cess sequence: primary materials processing, hot forging and cold forming, and product assembly. Material fracture and die stress anal- ysis are covered, and optimization of the design of forming processes is also reviewed. Historical Overview Lee and Kobayashi first introduced the rigid- plastic formulation in the 1970s (Ref 1). This for- mulation neglects the elastic response of deforma- tion calculations. In the late 1970s and early 1980s, a processing science program (Ref 2) funded by the United States Air Force was per- formed at the Battelle Memorial Institute Colum- bus Laboratories to develop a process model for the forging of dual-property titanium engine disks. These disks are required to have excellent creep and high stress-rupture properties in the rim and high fatigue strength in the bore region. A FEM- based code, ALPID (Ref 3), was developed under this program. Thermo-viscoplastic FEM analyses (Ref 4) were also performed to investigate the tem- perature variation during hot-die disk-forging pro- cesses. The flow stress of thermo-rigid- viscoplastic material is a function of temperature, strain, and strain rate. Approximately five aero- space manufacturers pioneered the use of the code. Based on the same foundation, DEFORM was developed for two-dimensional applications in 1986. Due to the large deformation in the metal- forming application, the updated Lagrangian method always suffers from mesh distortion and consequently requires many remeshings to com- plete one simulation. Two-dimensional metal- forming procedures became practical for industrial use when automated remeshing became available in 1990 (Ref 5). In the beginning of the 1980s, the PDP11 and the CDC/IBM mainframe computers were used. In the mid-1980s, the VAX workstation became the dominant machine for running the simulations. In the late 1980s, UNIX workstations became the primary comput- ing facility. Unfortunately, the majority of the metalwork- ing processes are three-dimensional (3-D), where a two-dimensional (2-D) approach cannot approx- imate reality satisfactorily. The initial 3-D code development began in the mid-1980s (Ref 6). One simulation with backward extrusion in a square container was reported to take 152 central processing unit (CPU) hours on a VAX-11/750. In addition to the need for remeshing, a more com- plicated process was estimated to take several weeks. Due to the lack of computing speed in the 1980s for 3-D applications, the actual develop- ment was delayed until the 1990s (Ref 7). Since then, many ideas to develop a practical 3-D numerical tool were evaluated and tested. The suc- cessful ones were finally implemented. After the mid-1990s, significant computing speed improve- ment was seen in personal computer (PC) technol- ogy, coupled with a lower price as compared to UNIX-based machines. For this reason, the PC has become the dominant computing platform. Due to the competition for better product quality at a lower production cost, process modeling grad- ually became a necessity rather than a research and development tool in the production environment. Although FEM programs were initially deve- loped for metalworking processes, it was soon realized that metalworking is just one of the many operations before the part is finally installed. Prior to forging, the billet is made by primary forming processes, such as cogging or bar rolling from a cast ingot. After forging, the part is heat treated, rough machined, and finish machined. The microstructure of the part continuously evolves together with the shape. The residual stress within the part and the asso- ciated distortion are also changing with time. To really understand product behavior during the service, it is essential to connect all the missing links, not only the metalworking. In the mid-1990s, a small business innovative research program was awarded by the U.S. Air Force and the U.S. Navy to develop a capability for heat treatment and machining (Ref 8). To track the residual-stress distribution, elastoplas- tic and elastoviscoplastic formulations were used. Microstructural evolution, including phase transformation and grain-size evolution, was implemented. Distortion during heat treat- ment and material removal during machining processes can thus be predicted. During the 1990s, most efforts were focused on the development of the FEM for computer- aided engineering applications. However, the engineer’s experience still plays a major role in achieving a solution to either solving a pro- duction problem or reaching a better process design. The FEM solution-convergence speed depends highly on the engineer’s experience, and the interpretation of the results requires complete understanding of the process. As the computing power continues to improve, optimi- zation using systematic search becomes more and more attractive (Ref 9). In the following sections, a brief overview of the methodologies and some selected represen- tative applications focusing on the bulk forming process are given. *Reprinted from ASM Handbook, Volume 14A, Metalworking: Bulk Forming, p 617–639 ASM Handbook, Volume 22B, Metals Process Simulation D.U. Furrer and S.L. Semiatin, editors Copyright # 2010, ASM International ® All rights reserved. www.asminternational.org
Transcript of Finite Element Method Applications in Bulk Forming*

Finite Element Method Applications inBulk Forming*Soo-Ik Oh, John Walters, and Wei-Tsu Wu
METALWORKING, with its thousands ofyears of history, is one of the oldest and mostimportantmaterials processing technologies.Dur-ing the last 30 years, with the continuous improve-ment of computing technology and the finiteelement method (FEM) as well as the competitionfor a lower-cost and better-quality product, metal-working has evolved rapidly. This article gives asummary of overall development of the FEMand its contribution to thematerials forming indus-try. Because significant efforts were carried outwith great success by many universities andresearch institutes with a similar objective andapplication, this article is focused on the overallphilosophy and evolution of the FEM for solvingbulk forming issues. The program used to demon-strate this success is the commercial code namedDEFORM (Scientific Forming TechnologiesCorp.). A number of examples of the applicationof FEM to various bulk forming processes are alsosummarized.This article provides an overview of FEM
applications. In this section, a number of appli-cations of FEM are presented in the order theywould be used in a typical manufacturing pro-cess sequence: primary materials processing,hot forging and cold forming, and productassembly. Material fracture and die stress anal-ysis are covered, and optimization of the designof forming processes is also reviewed.
Historical Overview
Lee and Kobayashi first introduced the rigid-plastic formulation in the 1970s (Ref 1). This for-mulation neglects the elastic response of deforma-tion calculations. In the late 1970s and early1980s, a processing science program (Ref 2)funded by the United States Air Force was per-formed at the Battelle Memorial Institute Colum-bus Laboratories to develop a process model forthe forging of dual-property titaniumengine disks.These disks are required to have excellent creepand high stress-rupture properties in the rim andhigh fatigue strength in the bore region. A FEM-
based code, ALPID (Ref 3), was developed underthis program. Thermo-viscoplastic FEM analyses(Ref4)werealsoperformed to investigate the tem-perature variation during hot-die disk-forging pro-cesses. The flow stress of thermo-rigid-viscoplastic material is a function of temperature,strain, and strain rate. Approximately five aero-spacemanufacturers pioneered theuseof the code.Based on the same foundation, DEFORM wasdeveloped for two-dimensional applications in1986. Due to the large deformation in the metal-forming application, the updated Lagrangianmethod always suffers from mesh distortion andconsequently requires many remeshings to com-plete one simulation. Two-dimensional metal-forming procedures became practical forindustrial use when automated remeshing becameavailable in 1990 (Ref 5). In the beginning of the1980s, the PDP11 and the CDC/IBM mainframecomputers were used. In the mid-1980s, theVAX workstation became the dominant machinefor running the simulations. In the late 1980s,UNIX workstations became the primary comput-ing facility.Unfortunately, the majority of the metalwork-
ing processes are three-dimensional (3-D), wherea two-dimensional (2-D) approach cannot approx-imate reality satisfactorily. The initial 3-D codedevelopment began in the mid-1980s (Ref 6).One simulation with backward extrusion in asquare container was reported to take 152 centralprocessing unit (CPU) hours on a VAX-11/750.In addition to the need for remeshing, amore com-plicated process was estimated to take severalweeks. Due to the lack of computing speed in the1980s for 3-D applications, the actual develop-ment was delayed until the 1990s (Ref 7). Sincethen, many ideas to develop a practical 3-Dnumerical toolwere evaluated and tested. The suc-cessful ones were finally implemented. After themid-1990s, significant computing speed improve-mentwas seen in personal computer (PC) technol-ogy, coupled with a lower price as compared toUNIX-based machines. For this reason, the PChas become the dominant computing platform.Due to the competition for better product quality
at a lower production cost, processmodeling grad-uallybecameanecessity rather thana researchanddevelopment tool in the production environment.Although FEM programs were initially deve-
loped for metalworking processes, it was soonrealized that metalworking is just one of themany operations before the part is finallyinstalled. Prior to forging, the billet is madeby primary forming processes, such as coggingor bar rolling from a cast ingot. After forging,the part is heat treated, rough machined, andfinish machined. The microstructure of the partcontinuously evolves together with the shape.The residual stress within the part and the asso-ciated distortion are also changing with time.To really understand product behavior duringthe service, it is essential to connect all themissing links, not only the metalworking. Inthe mid-1990s, a small business innovativeresearch program was awarded by the U.S. AirForce and the U.S. Navy to develop a capabilityfor heat treatment and machining (Ref 8). Totrack the residual-stress distribution, elastoplas-tic and elastoviscoplastic formulations wereused. Microstructural evolution, includingphase transformation and grain-size evolution,was implemented. Distortion during heat treat-ment and material removal during machiningprocesses can thus be predicted.During the 1990s, most efforts were focused
on the development of the FEM for computer-aided engineering applications. However, theengineer’s experience still plays a major rolein achieving a solution to either solving a pro-duction problem or reaching a better processdesign. The FEM solution-convergence speeddepends highly on the engineer’s experience,and the interpretation of the results requirescomplete understanding of the process. As thecomputing power continues to improve, optimi-zation using systematic search becomes moreand more attractive (Ref 9).In the following sections, a brief overview of
the methodologies and some selected represen-tative applications focusing on the bulk formingprocess are given.
*Reprinted from ASM Handbook, Volume 14A, Metalworking: Bulk Forming, p 617–639
ASM Handbook, Volume 22B, Metals Process Simulation
D.U. Furrer and S.L. Semiatin, editors
Copyright # 2010, ASM International®
All rights reserved.
www.asminternational.org
Methodologies
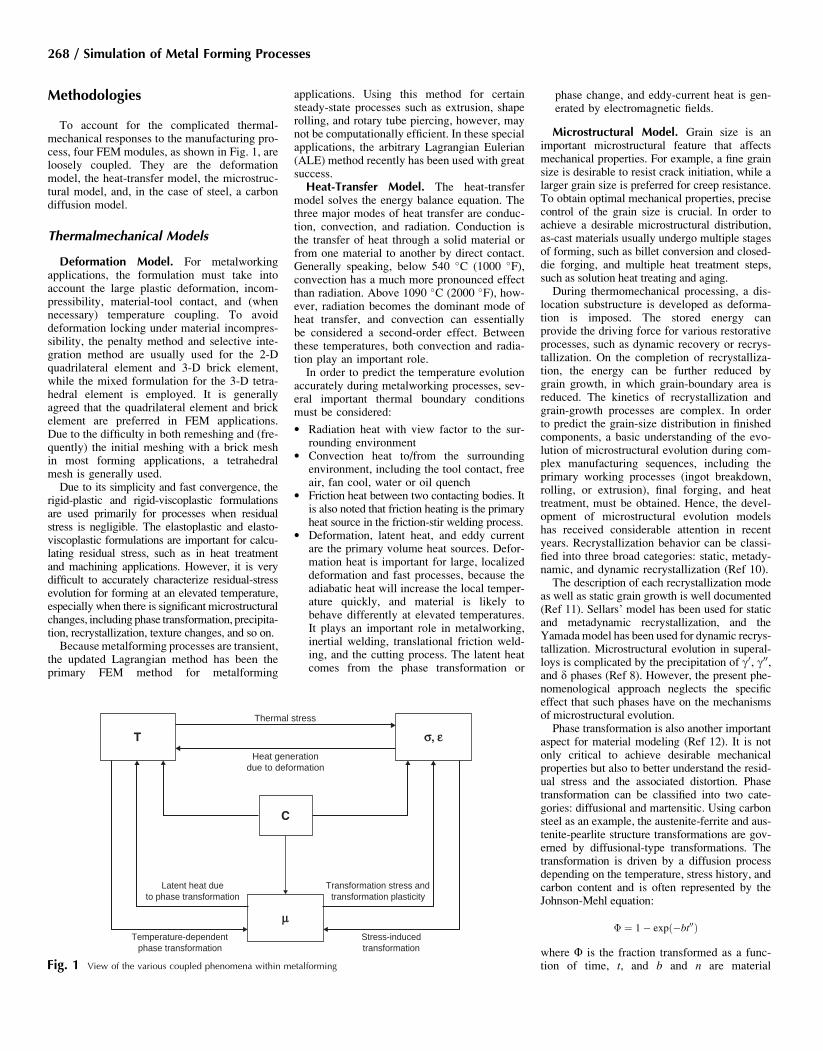
To account for the complicated thermal-mechanical responses to the manufacturing pro-cess, four FEM modules, as shown in Fig. 1, areloosely coupled. They are the deformationmodel, the heat-transfer model, the microstruc-tural model, and, in the case of steel, a carbondiffusion model.
Thermalmechanical Models
Deformation Model. For metalworkingapplications, the formulation must take intoaccount the large plastic deformation, incom-pressibility, material-tool contact, and (whennecessary) temperature coupling. To avoiddeformation locking under material incompres-sibility, the penalty method and selective inte-gration method are usually used for the 2-Dquadrilateral element and 3-D brick element,while the mixed formulation for the 3-D tetra-hedral element is employed. It is generallyagreed that the quadrilateral element and brickelement are preferred in FEM applications.Due to the difficulty in both remeshing and (fre-quently) the initial meshing with a brick meshin most forming applications, a tetrahedralmesh is generally used.Due to its simplicity and fast convergence, the
rigid-plastic and rigid-viscoplastic formulationsare used primarily for processes when residualstress is negligible. The elastoplastic and elasto-viscoplastic formulations are important for calcu-lating residual stress, such as in heat treatmentand machining applications. However, it is verydifficult to accurately characterize residual-stressevolution for forming at an elevated temperature,especially when there is significant microstructuralchanges, including phase transformation, precipita-tion, recrystallization, texture changes, and so on.Because metalforming processes are transient,
the updated Lagrangian method has been theprimary FEM method for metalforming
applications. Using this method for certainsteady-state processes such as extrusion, shaperolling, and rotary tube piercing, however, maynot be computationally efficient. In these specialapplications, the arbitrary Lagrangian Eulerian(ALE) method recently has been used with greatsuccess.Heat-Transfer Model. The heat-transfer
model solves the energy balance equation. Thethree major modes of heat transfer are conduc-tion, convection, and radiation. Conduction isthe transfer of heat through a solid material orfrom one material to another by direct contact.Generally speaking, below 540 �C (1000 �F),convection has a much more pronounced effectthan radiation. Above 1090 �C (2000 �F), how-ever, radiation becomes the dominant mode ofheat transfer, and convection can essentiallybe considered a second-order effect. Betweenthese temperatures, both convection and radia-tion play an important role.In order to predict the temperature evolution
accurately during metalworking processes, sev-eral important thermal boundary conditionsmust be considered:
� Radiation heat with view factor to the sur-rounding environment
� Convection heat to/from the surroundingenvironment, including the tool contact, freeair, fan cool, water or oil quench
� Friction heat between two contacting bodies. Itis also noted that friction heating is the primaryheat source in the friction-stir welding process.
� Deformation, latent heat, and eddy currentare the primary volume heat sources. Defor-mation heat is important for large, localizeddeformation and fast processes, because theadiabatic heat will increase the local temper-ature quickly, and material is likely tobehave differently at elevated temperatures.It plays an important role in metalworking,inertial welding, translational friction weld-ing, and the cutting process. The latent heatcomes from the phase transformation or
phase change, and eddy-current heat is gen-erated by electromagnetic fields.
Microstructural Model. Grain size is animportant microstructural feature that affectsmechanical properties. For example, a fine grainsize is desirable to resist crack initiation, while alarger grain size is preferred for creep resistance.To obtain optimal mechanical properties, precisecontrol of the grain size is crucial. In order toachieve a desirable microstructural distribution,as-cast materials usually undergo multiple stagesof forming, such as billet conversion and closed-die forging, and multiple heat treatment steps,such as solution heat treating and aging.During thermomechanical processing, a dis-
location substructure is developed as deforma-tion is imposed. The stored energy canprovide the driving force for various restorativeprocesses, such as dynamic recovery or recrys-tallization. On the completion of recrystalliza-tion, the energy can be further reduced bygrain growth, in which grain-boundary area isreduced. The kinetics of recrystallization andgrain-growth processes are complex. In orderto predict the grain-size distribution in finishedcomponents, a basic understanding of the evo-lution of microstructural evolution during com-plex manufacturing sequences, including theprimary working processes (ingot breakdown,rolling, or extrusion), final forging, and heattreatment, must be obtained. Hence, the devel-opment of microstructural evolution modelshas received considerable attention in recentyears. Recrystallization behavior can be classi-fied into three broad categories: static, metady-namic, and dynamic recrystallization (Ref 10).The description of each recrystallization mode
as well as static grain growth is well documented(Ref 11). Sellars’ model has been used for staticand metadynamic recrystallization, and theYamadamodel has been used for dynamic recrys-tallization. Microstructural evolution in superal-loys is complicated by the precipitation of g0, g00,and d phases (Ref 8). However, the present phe-nomenological approach neglects the specificeffect that such phases have on the mechanismsof microstructural evolution.Phase transformation is also another important
aspect for material modeling (Ref 12). It is notonly critical to achieve desirable mechanicalproperties but also to better understand the resid-ual stress and the associated distortion. Phasetransformation can be classified into two cate-gories: diffusional and martensitic. Using carbonsteel as an example, the austenite-ferrite and aus-tenite-pearlite structure transformations are gov-erned by diffusional-type transformations. Thetransformation is driven by a diffusion processdepending on the temperature, stress history, andcarbon content and is often represented by theJohnson-Mehl equation:
� ¼ 1� expð�bt00Þ
where F is the fraction transformed as a func-tion of time, t, and b and n are material
Thermal stress
Heat generationdue to deformation
C
s, e
m
T
Temperature-dependentphase transformation
Stress-inducedtransformation
Latent heat dueto phase transformation
Transformation stress andtransformation plasticity
Fig. 1 View of the various coupled phenomena within metalforming
268 / Simulation of Metal Forming Processes

coefficients. The diffusionless transformationfrom austenite to martensite usually dependson temperature, stress, and carbon content.
Primary Materials ProcessingApplications
Cogging
Ingot conversion, also known as cogging, is oneof the most common processes used to breakdown the coarse, cast micro-structure of superal-loy ingots. As shown in Fig. 2, the ingot is heldby a pair of manipulators at one of the two endsand is forged between two dies during the conver-sion process. The primary objective of the conver-sion process is to produce a fine grain structure forsubsequent secondary forging operations. Inessence, the process consists of multiple open-die forging (and reheating) operations in whichthe ingot diameter is reduced and its length isincreased. Excessive furnace heating may pro-mote undesirable grain growth. On the other hand,insufficient heating or excessive forging timemayresult in cracking. Control of the forging tempera-ture, the amount of deformation, the forging time,and the precipitation of second phases is espe-cially important for producing a desirable grainstructure. Modeling the microstructural evolutionof the ingot during the cogging process has beenof great interest in recent years.In the following example (Ref 13), the billet
material was assumed to be nickel alloy 718 withan initial grain size of 250 mm (10 mils) (ASTM1). The workpiece was taken to be octagonal incross section (with a breadth of 380 mm, or 15in., across the flat faces) and 2 m (7 ft) in length.Typical industrial processing conditions wereapplied. One deformation sequence comprisingfour passes without reheating was simulated.Figure 3(a) shows the average grain size at
the end of the fourth pass, as predicted byFEM. Predicted microstructures at approxi-mately one-quarter of the workpiece length areshown in Fig. 3(b) to (e). After four passes,the simulation predicted that recrystallizationwould be rather inhomogeneous, and a numberof dead zones would have developed near the
surface. These trends are consistent with indus-trial observations.
Rotary Tube Piercing
Tube piercing modeling (Ref 14) illustratesthe use of the ALE technique. The rotary pierc-ing of a solid bar into a seamless tube, alsoknown as the Mannesmann process, is a veryfast rolling process. In the process, the pre-heated billet is cross rolled between two bar-rel-shaped rolls at a high speed, as shown in
Fig. 4. The updated Lagrangian approach wasfirst used in the investigation. Due to the domi-nantly rotational velocity field, the time-stepsize is limited to a small value, and the wholepart must be modeled for better solution accu-racy. It therefore increases the computingeffort. To reduce the CPU time, a new methodwith the Eulerian approach was developed.Geometry updating is carried out in the feedingdirection, while the nodal coordinates in thehoop direction remain unchanged. With thisapproach and the rotational symmetry treatment,
Fig. 2 Meshes used for finite element method simula-tion of the cogging process
2.5390
2.3299
2.1207
1.9116
1.7025
1.4933
1.2842
1.0751
0.8659
0.6568
0.4477
×10E2
(a)
(c)(b) (d) (e)
Fig. 3 Finite element method-predicted average grain size. (a) On the free surface after the final pass or within theworkpiece after pass number (b) 1, (c) 2, (d) 3, or (e) 4
Roll
Workpiece
Plug
z0
a
dp
dr
hdw
α
θ
θ
Fig. 4 Schematic illustration of rotary tube piercing process
Finite Element Method Applications in Bulk Forming / 269
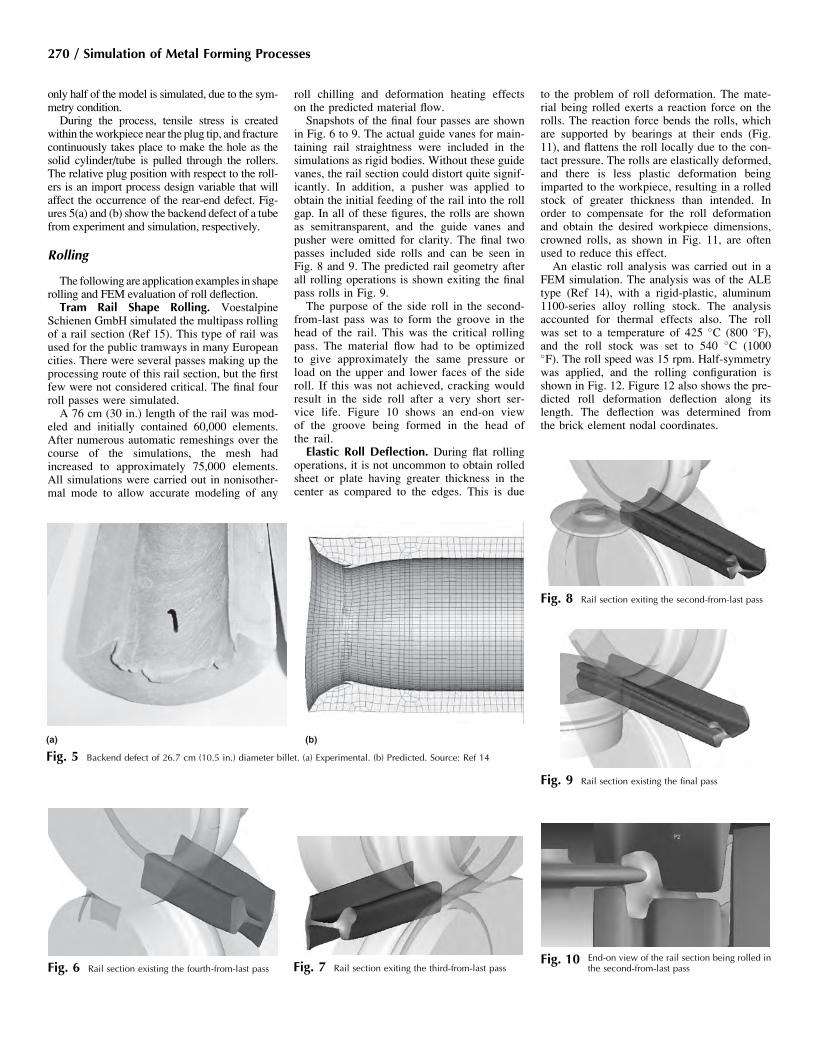
only half of the model is simulated, due to the sym-metry condition.During the process, tensile stress is created
within theworkpiece near the plug tip, and fracturecontinuously takes place to make the hole as thesolid cylinder/tube is pulled through the rollers.The relative plug position with respect to the roll-ers is an import process design variable that willaffect the occurrence of the rear-end defect. Fig-ures 5(a) and (b) show the backend defect of a tubefrom experiment and simulation, respectively.
Rolling
The following are application examples in shaperolling and FEM evaluation of roll deflection.Tram Rail Shape Rolling. Voestalpine
Schienen GmbH simulated the multipass rollingof a rail section (Ref 15). This type of rail wasused for the public tramways in many Europeancities. There were several passes making up theprocessing route of this rail section, but the firstfew were not considered critical. The final fourroll passes were simulated.A 76 cm (30 in.) length of the rail was mod-
eled and initially contained 60,000 elements.After numerous automatic remeshings over thecourse of the simulations, the mesh hadincreased to approximately 75,000 elements.All simulations were carried out in nonisother-mal mode to allow accurate modeling of any
roll chilling and deformation heating effectson the predicted material flow.Snapshots of the final four passes are shown
in Fig. 6 to 9. The actual guide vanes for main-taining rail straightness were included in thesimulations as rigid bodies. Without these guidevanes, the rail section could distort quite signif-icantly. In addition, a pusher was applied toobtain the initial feeding of the rail into the rollgap. In all of these figures, the rolls are shownas semitransparent, and the guide vanes andpusher were omitted for clarity. The final twopasses included side rolls and can be seen inFig. 8 and 9. The predicted rail geometry afterall rolling operations is shown exiting the finalpass rolls in Fig. 9.The purpose of the side roll in the second-
from-last pass was to form the groove in thehead of the rail. This was the critical rollingpass. The material flow had to be optimizedto give approximately the same pressure orload on the upper and lower faces of the sideroll. If this was not achieved, cracking wouldresult in the side roll after a very short ser-vice life. Figure 10 shows an end-on viewof the groove being formed in the head ofthe rail.Elastic Roll Deflection. During flat rolling
operations, it is not uncommon to obtain rolledsheet or plate having greater thickness in thecenter as compared to the edges. This is due
to the problem of roll deformation. The mate-rial being rolled exerts a reaction force on therolls. The reaction force bends the rolls, whichare supported by bearings at their ends (Fig.11), and flattens the roll locally due to the con-tact pressure. The rolls are elastically deformed,and there is less plastic deformation beingimparted to the workpiece, resulting in a rolledstock of greater thickness than intended. Inorder to compensate for the roll deformationand obtain the desired workpiece dimensions,crowned rolls, as shown in Fig. 11, are oftenused to reduce this effect.An elastic roll analysis was carried out in a
FEM simulation. The analysis was of the ALEtype (Ref 14), with a rigid-plastic, aluminum1100-series alloy rolling stock. The analysisaccounted for thermal effects also. The rollwas set to a temperature of 425 �C (800 �F),and the roll stock was set to 540 �C (1000�F). The roll speed was 15 rpm. Half-symmetrywas applied, and the rolling configuration isshown in Fig. 12. Figure 12 also shows the pre-dicted roll deformation deflection along itslength. The deflection was determined fromthe brick element nodal coordinates.
(a) (b)
Fig. 5 Backend defect of 26.7 cm (10.5 in.) diameter billet. (a) Experimental. (b) Predicted. Source: Ref 14
Fig. 7 Rail section exiting the third-from-last passFig. 10 End-on view of the rail section being rolled in
the second-from-last passFig. 6 Rail section existing the fourth-from-last pass
Fig. 8 Rail section exiting the second-from-last pass
Fig. 9 Rail section existing the final pass
270 / Simulation of Metal Forming Processes

The predicted elastic roll stress is shown inFig. 13. The roll is shown sectioned, havingbeen sliced at half-length with contours of y-component stress. The stress at point P1 (Fig.13) evolves and converges to a steady state, asillustrated in this figure.
Shape Drawing
While material being formed always followsthe path of least resistance, that path is not alwaysintuitive. Process simulation is a powerful tool inthe prediction of material flow, especially in 3-D
processes. One such process is shape drawing.When drawing a shape, there are several potentialdefects. These include die underfill, bending, duc-tile fracture, peeling at the die entry, and neckingafter the die exit. To illustrate the capability, adrawing process was analyzed using three inputshapes into a shaped-draw die. The process is per-formed at room temperature. The goal of this pro-cess is to draw a shape that matches the exit crosssection of the die. The first simulation used around input material. The result was an underfillon the outside features (Fig. 14). This did not sat-isfy the final shape requirements of this case. Thesecond simulation used a larger-diameter roundinput. The result was unstable flow, resulting inpeeling (Fig. 15). Peeling is an undesirable effectwhere material is scraped off the wire into longslivers before entering the input port of the drawdie. Because material follows the path of leastresistance, it was clear that the round input stockwas less than optimal. Finally, a shaped inputwas simulated with good results (Fig. 16). Thehex-shaped initial shape placed more materialwhere it was required to fill the exit cross section.In a process such as drawing, it is difficult to deter-mine whether the input shape will yield a success-ful output, because the material has severalcompeting directions to flow. Several processparameters, such as friction and temperature, canaffect this result. Simulation can give insight intosuch a process before prototyping a die set.
Hot Forging Applications
Billet-Heating Processes
Billet heating is an important process in hotforging and heat treatment. The heating timeand heat rate are the typical control processparameters. Cracking can occur when an exces-sive heating rate is used. Long heating timewastes energy and may result in poor micro-structural properties. Insufficient heating timecan result in high forming load, poor material
Fig. 11 Crowned rolls (left) to compensate for bending, and uncrowned rolls (right) that may lead to thickness vari-ation in rolled stock
p1
p2
1.1043
1.1042
1.1041
1.1040
1.1039
1.1038Y-c
oord
inat
e
1.1037
1.1036
1.1035–15 –10 –5 0
Z-coordinate p2p1
5 10 15
Fig. 12 Arbitrary Lagrangian Eulerian elastic roll analysis. Rolling configuration (left) shows the half-symmetry setup.Nodal coordinates of the brick meshed roll along the line p1–p2 represent roll bending deflection (right)
Point tracking
Str
ess
(y/th
eta)
, ksi
0.000
–0.400
–0.800
–1.20
–1.60
–2.000.000 7.57 15.1
Time, s
22.7
P 1
30.3 37.9
Fig. 13 Roll sectioned at its midlength showing theinitial y stress component. After a short dura-
tion, the arbitrary Lagrangian Eulerian stress is predicted(from the point-tracking curve)
Fig. 14 Drawing the initial round input shape resulted in an underfill on the outside features. The die contact can beseen through the transparent die by dark areas representing die contact (left). A cross-sectional slice also
clearly shows the underfill (right)
Finite Element Method Applications in Bulk Forming / 271

flow, and fracture. It is therefore important tounderstand the temperature evolution withinthe workpiece during the heating process. Themost frequently used heating methods areinduction heating and furnace heating.In addition to thermal, mechanical, and micro-
structural models, an electromagnetic model is
needed to analyze the induction heating process.The electromagnetic model is first conducted tocompute the magnetic field intensity and theeddy-current density. The heat generation basedon the ohmic loss is then used to compute thetemperature field. Microstructural and deforma-tion information can be computed if necessary.This method has been successfully applied to
heating titanium billets and induction hardeningof steel bearings (Ref 16). A scanning inductionprocess (Ref 17, 18) is given to illustrate themethodology. In this process, approximately300 mm (12 in.) of a 440 mm (17 in.) long,23 mm (0.9 in.) diameter SAE 1055 steel shaftis induction hardened by moving it through asystem comprising a two-turn 20 kHz inductionheating coil and a water quench ring.The FEM model used in the simulation is
shown in Fig. 17. Induction heating was appliedfrom the start of the simulation, but there wasno cooling or relative movement between theinduction unit and the workpiece for the first2 s. Subsequently, the heating/cooling assemblymoved a distance of 300 mm (12 in.) upwardwith a constant speed of 10 mm/s (0.4 in./s).The workpiece was then allowed to cool toroom temperature, specified as 20 �C (70 �F).In practice, the shaft moves, and the inductionunit remains stationary; however, in the simula-tion, it remained fixed, and the coil and quenchring moved upward.A power of 15 kW was assumed for heating
the workpiece, operating at a frequency of 20kHz in order to concentrate the heating at thesurface. A heat-transfer cooling window, repre-senting the quench ring, was specified a temper-ature of 20 �C (70 �F) and a convectioncoefficient of 20 kW/m2 � K, which are repre-sentative of a water quench. The predicted tem-perature field is shown in Fig. 18. It is noted
that the shaft surface temperature is highest(represented by the square symbol) near the coils.Downward along the shaft surface, the tempera-ture reaches its lowest point due to the waterquench. Further down, the temperature increasedagain due to heat conduction from the hotterinterior.Full details of the overall methodology for induc-
tion heating/hardening are contained in Ref 16.For furnace heating, radiation heat dominates
the temperature distribution of the workpiece.Radiative heat energy emitted by a body dependson the emissivity of the body surface. This emis-sivity depends on thematerial type and the surfacecondition, and its value ranges from 0 to 1. Forexample, the emissivity of a black body (absorbsall energy incident on it) is 1, while the emissivityof aluminum and carbon steel is 0.1 and 0.4,respectively. If multiple bodies are involved, thenet radiant exchange between the bodies dependson the geometry and orientation of the parts aswell as the relative distance between the bodies.This net radiant exchange between the multiplebodies is represented by the view factor, F1–2.Modeling radiation with view factor is imperativeto achieve accurate simulation results for high-temperature heating and cooling processes.As an example of this dependence on part
geometry and orientation, the heating of nine bil-lets (15 cm diameter by 30 cm high, or 6 in. diam-eter by 12 in. high) in a 1095 �C (2000 �F)furnace was modeled (Fig. 19). The billets wereloaded in three rows and spaced 8 cm (3 in.)apart from each other. From the predicted tem-perature distribution in the billets, the effect ofradiation shadowing can easily be seen. Theinfluence of shadowing can be analyzed throughthe use of a radiation view factor in the Stephan-Boltzmann equation. The slower heating rate ofthe center billet can be seen by comparing a plot
Fig. 15 A larger-diameter wire resulted in unstableflow and subsequent peeling
Fig. 16 A hex-shaped input stock resulted in good diecontact (top) and no underfill (bottom)
OPERATION 1 Step-15.044
3.937
2.830
1.722Hei
ght (×
101 )
0.615
–0.493–2.553 –1.014 0.525 2.065
Radius (×101)
3.604
Fig. 17 Mesh illustration of workpiece and heating coils
272 / Simulation of Metal Forming Processes

of temperature versus time for a point sampledwith this effect on and off (Fig. 20). If view factorradiation had not been considered in the simula-tion, all of the billets would have heated thesame. Because view factor was incorporated,the difference in temperature between the billetsin the corner and in the center of the loading pat-tern was realistically predicted.
Axle-Beam Forging
A major commercial vehicle part manufac-turer discovered a problem with an axle-beam
forging. A forming lap or fold defect was evidenton the finish-forged product, as seen in Fig. 21.History and experience guided the designers toconcentrate their efforts on the blocker and fin-isher stages of manufacture. However, changesto these did not eliminate the lap.The manufacturing process was simulated.
Four discrete operations were involved: roll for-mer, bender, blocker, and finisher operations, asseen in Fig. 22. Because the material behaviorcan be highly temperature sensitive in a hotforming process, all stages of the process weremodeled with full thermal coupling. Also
included were intermediate operations, such astransfer times from the furnace to the pressand times when the forging was resting on rela-tively cool dies. In this approach, surface chill-ing of the workpiece was accounted for.The simulation results highlighted the fold
occurring during the bender operation, as seen inFig. 23. The defect was carried through to the fin-ish-forged axle beam. After reviewing the simula-tion result, the designers were able to locate thedefect on the actual part, as seen in Fig. 24. Thedesigners modified the pads on the bottom die torevise material flow and eliminate the lap.In addition to overcoming the forming defect,
the bender die-pad modifications resulted in areduced forging load in the bender, blocker, andfinisher operations. The production trials correlatedvery well with the simulations, which also pre-dicted lower forging loads with the modified pads.After forging is completed and the flash is
removed, the axle beam is heat treated to providemechanical properties required for its service life.The axle beams are heat treated in batches andare supported on their pads; that is, they are heattreated upside down relative to the orientation onthe truck. Distortion during the quenching opera-tion is undesirable. In any case, distortion doesoccur due to the volume increase associated withthe austenite-to-martensite phase transformation.Figure 25 illustrates the comparison between theas-forged and asquenched axle-beam predictions,both at room temperature. The as-forged part isshown in the foreground, and the same part afterquenching is shown in the background. Both areat room temperature. Note how the heat treatedbeam is noticeably longer than the original forging.
Knee-Joint Forging
The forging industry continues to expand withthe rest of innovation and often finds new andinteresting applications. One such application isthe medical implant industry. In this case, an arti-ficial knee implant is considered. The orthopedicsurgeon can remove the patella (kneecap), shavethe heads of the femur and tibia, and implant theprosthesis. Special bone cement is used for suit-able adhesion, and the implants can be seen intheir locations in Fig. 26.An analysis was carried out on the hot
forging operations of the tibial part of the Ti-6A1-4V knee-joint prosthetic device. In thiscase, there were three operations: blocker, fin-isher, and restrike operation. Each of the threeoperations consisted of a furnace heat, formingoperation, and flash trim. Different friction con-ditions were applied for the extruded part andthe coined portion of the prosthesis. This wasimportant because, in practice, only theextruded part of the dies is lubricated; thecoined section is formed dry. Figure 27 showsthe tibial part at the end of the blocker, finisher,and restrike simulations.Furnace temperatures were specified as 940 �C
(1725 �F) for the blocker and 925 �C(1700 �F) for the finisher and restrike operations.
Title : DEFORM SIMULATION
Database : DL.DB
2.887OPERATION 1 Step 254 Temperature
Obj 1 (×10E2)A = 1.000B = 2.000C = 3.000D = 4.000E = 5.000F = 6.000G = 7.000H = 8.000I = 9.000
Obj 3 (×10E2)
Object 10.2137E029.2701E02Object 2
Object 3
0.0000E020.0000E02
0.0000E02
A = 1.000B = 2.000C = 3.000D = 4.000E = 5.000F = 6.000G = 7.000H = 8.000I = 9.000
Obj 2 (×10E2)A = 1.000B = 2.000C = 3.000D = 4.000E = 5.000F = 6.000G = 7.000H = 8.000I = 9.000
Step 254 of 480Mon Sep 7 14:18:28 1998
SFTC DEFORM-2D POST 6.0 (Beta) 1998
2.668
2.449
2.230Hei
ght (×
102 )
2.010
1.791–5.212 –2.548 0.117 2.782
Radius (×101)
5.446
Waterjacket
quench
H
Fig. 18 Steady-state temperature distribution in workpiece 25.4 s into the simulation
Temperature F
2000
1940
1810
1750
1880
Fig. 19 Temperature of nine billets (eight are shown) in a 1095 �C (2000 �F) furnance. Note that the proximitybetween the parts affects the temperature
Finite Element Method Applications in Bulk Forming / 273

A rigid-plastic workpiece and rigid dies wereused in this analysis. After the blocker-operationsimulation, the workpiece was trimmed, asshown in Fig. 28.
The surface curvature weighting was set highin this analysis. As a consequence, the tighterradii of the webs and ribs received a finer elementsize, whereas the larger, flatter surfaces were
assigned coarser elements. This is illustratedclearly in Fig. 29.
Cold Forming Applications
Cold-Formed Copper Welding Tip
Multiple folds were observed during the pro-duction of a copper welding electrode, as seenin Fig. 30. The cause of the defects was notentirely understood. The entire forming processwas simulated to gain a better understanding ofwhy the folds were developing (Ref 19).The actual part underwent a total of five
operations to form the finished electrode:
Fig. 21 Noticeable fold on a finished axle-beamforging
2000
1800
1600
1400
1200
1000
800
600
400
200
00 15 30 45 60 75 90 105 120
Time, min
Tem
pera
ture
, °F
Corner maximum
Center maximum
Corner minimum
Center minimum
Fig. 20 Temperature plot comparing a point on a billet considering and not considering view factor radiation effects
Fig. 22 The four operations in the process are initial perform in the forming rolls, after bending (shown in bottomdie), after blocker operation (shown in bottom die), and the finished axle beam after flash removal
Fold
Fig. 23 Simulation predicted the fold occurring duringthe bender operation, as shown
Fig. 24 Once the fold location was established fromsimulation, the defect was identified on the
actual axle beam after bending (location shown by chalk)
Fig. 26 After surgery, the femoral and tibial prostheticparts are in position, securely adhered with
bone cement
Fig. 25 The as-forged shape is shown in the front(lighter color), with the heat treated shape
behind (sliced and darker color). The phase transforma-tion was the key reason for this distortion
274 / Simulation of Metal Forming Processes
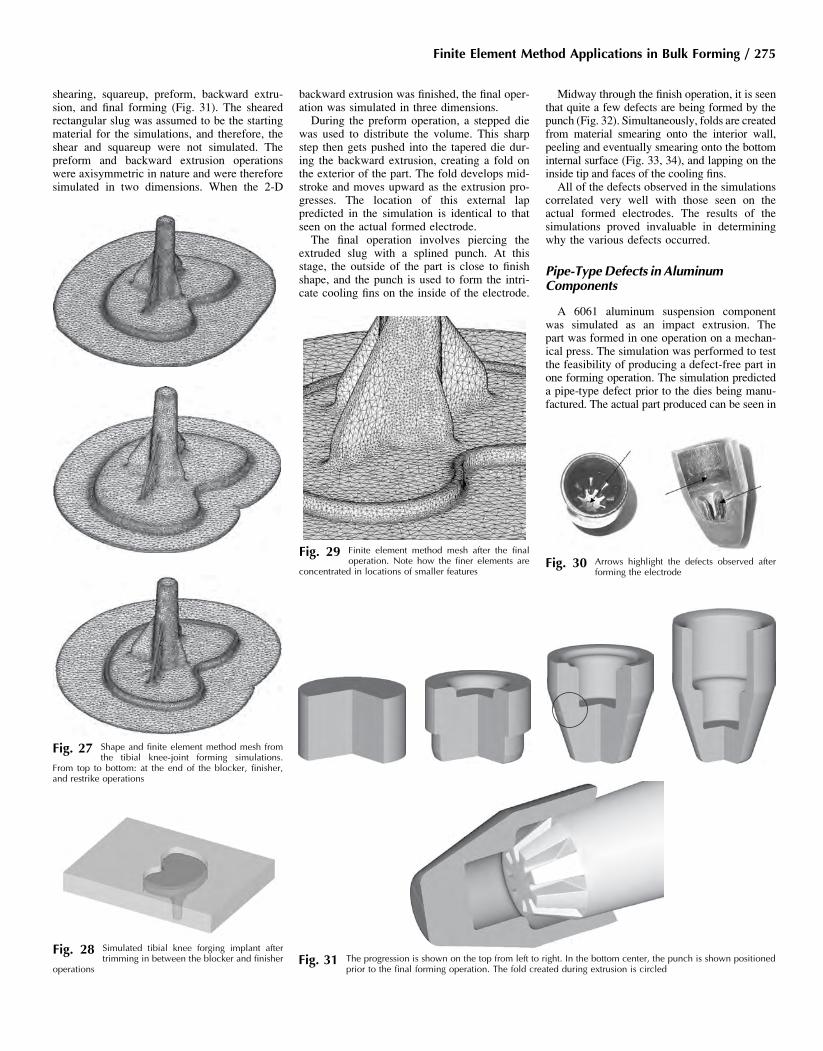
shearing, squareup, preform, backward extru-sion, and final forming (Fig. 31). The shearedrectangular slug was assumed to be the startingmaterial for the simulations, and therefore, theshear and squareup were not simulated. Thepreform and backward extrusion operationswere axisymmetric in nature and were thereforesimulated in two dimensions. When the 2-D
backward extrusion was finished, the final oper-ation was simulated in three dimensions.During the preform operation, a stepped die
was used to distribute the volume. This sharpstep then gets pushed into the tapered die dur-ing the backward extrusion, creating a fold onthe exterior of the part. The fold develops mid-stroke and moves upward as the extrusion pro-gresses. The location of this external lappredicted in the simulation is identical to thatseen on the actual formed electrode.The final operation involves piercing the
extruded slug with a splined punch. At thisstage, the outside of the part is close to finishshape, and the punch is used to form the intri-cate cooling fins on the inside of the electrode.
Midway through the finish operation, it is seenthat quite a few defects are being formed by thepunch (Fig. 32). Simultaneously, folds are createdfrom material smearing onto the interior wall,peeling and eventually smearing onto the bottominternal surface (Fig. 33, 34), and lapping on theinside tip and faces of the cooling fins.All of the defects observed in the simulations
correlated very well with those seen on theactual formed electrodes. The results of thesimulations proved invaluable in determiningwhy the various defects occurred.
Pipe-TypeDefects in AluminumComponents
A 6061 aluminum suspension componentwas simulated as an impact extrusion. Thepart was formed in one operation on a mechan-ical press. The simulation was performed to testthe feasibility of producing a defect-free part inone forming operation. The simulation predicteda pipe-type defect prior to the dies being manu-factured. The actual part produced can be seen in
Fig. 27 Shape and finite element method mesh fromthe tibial knee-joint forming simulations.
From top to bottom: at the end of the blocker, finisher,and restrike operations
Fig. 28 Simulated tibial knee forging implant aftertrimming in between the blocker and finisher
operations
Fig. 29 Finite element method mesh after the finaloperation. Note how the finer elements are
concentrated in locations of smaller featuresFig. 30 Arrows highlight the defects observed after
forming the electrode
Fig. 31 The progression is shown on the top from left to right. In the bottom center, the punch is shown positionedprior to the final forming operation. The fold created during extrusion is circled
Finite Element Method Applications in Bulk Forming / 275

Fig. 35. This piping or “suck” defect occurs due tovolume deficiency. As the section between thepunch and die becomes thin, an inadequate vol-ume of material is available to feed the extrusion.When this occurs, longitudinal tensile stressesform under the nose of the punch. At that time,surface material is pulled into a cavity as it forms.This defect is shown in Fig. 36.Another casewhere a pipe-type defect occurs is
in the forward extrusion of a pressure valve (Fig.37). Although the process is 3-D, the problemwas successfully simulated assuming plane-straindeformation (Ref 20) during the late 1980s. In thefollowing discussion, a true 3-D model was used.The material for the pressure valve is alu-
minum alloy 6062. Because of symmetry,only one-fourth of the part was simulated.For better resolution of the defect, more ele-
ments were placed near the center of thepart. The predicted part geometry at differentstages of the extrusion process is shown inFig. 38. From these figures, the defect startsat the center of the part and propagates inthe transverse direction where the part isbeing extruded. This behavior is seen in theflow lines of the extrusion process (Fig.39). A striking similarity between the pre-dicted flow lines (Fig. 39) and the actualpart (Fig. 37) can also be observed.
Fastener Forming
In the development of metalforming pro-cesses, designers balance many complex para-meters to accomplish a workable progression
design. These parameters include the numberof intended operations, required volumetric dis-placements, final part geometry, starting mate-rial size, available forming equipment, and thematerial behavior of the workpiece. Frequently,variations have existed between the designer’sconcept of the progression and the actual shoptrial. When unexpected metal flow occurs, apart with underfill, excessive loads, die break-age, laps, or other production problems canresult.
Fig. 32 Early stage of tooth forming. At this stage, theinitial defect formations are clear
Fig. 33 As the teeth continue to form, the smearing ofthe material above the teeth is visible Fig. 34 Material peeling down as the teeth are formed
Fig. 35 Aluminum impact extrusion
Fig. 36 Predicted geometry at different stages of the extrusion process
Fig. 37 Pressure valve extrusion showing pipe-typedefect in the center
Fig. 38 Predicted geometry at different stages of theextrusion process Fig. 39 Flow lines of the pressure valve extrusion
276 / Simulation of Metal Forming Processes

In one case (Ref 21), a fastener manufacturernoted a small defect during the shop trial of anautomotive part (Fig. 40). The forming processwas simulated, and the simulation reproducedthis superficial defect and helped the manufac-turer to understand the root cause. Additionally,the simulation (Fig. 41) revealed a severe lapthat had originally been overlooked. When thetrial parts were cut up, this defect was presentas predicted. In this case, the cause of the lapwas apparent from the simulation. Each stationof a redesigned process was analyzed prior toshop trials. This approach resulted in a lap-freepart (Fig. 41).
Bevel-Gear Forging
Bevel gears are important components in theautomotive industry, such as in transmission dif-ferentials. Many of these components are forgedat a hot temperature to minimize the amount ofload required to form the part. This creates a partas seen in Fig. 42.There has been some interest in forming these
parts at room temperature for a better net shapeand an improved surface finish. To study this asa 2-D process, an axisymmetric assumption isused. One tooth is isolated, and the circumferen-tial flow is neglected. The radius of the tooth wasspecified to consider the volume of the actualpart. The flow is seen in Fig. 43 in the case wherethe top and bottom die move together at the samespeed. The flownet result can be compared to dif-ferent movement conditions, such as when onlythe top die moves downward, as seen in Fig. 44,or in the case where only the bottom die moves,as seen in Fig. 45. Note that the filling of thematerial occurs well in the cases where the diesmoved together and in the case where the bottommoves upward, but there was folding predicted inthe case where only the top die moved down-ward. In each case, there is a marked differencein the grain orientation after forging, which canbe seen from the flow lines. A similar study wasperformed as a comparison of simulation to plas-ticine deformation, and it was shown that thesimulation was very accurate in predicting thematerial flow (Ref 22).
Fracture Prediction
Chevron Cracks
Forward extrusion is a process used exten-sively in the automotive manufacturing industry.
Certain extruded components, such as axleshafts, are considered critical for safe operationof the vehicle and must be free of defects. Dur-ing the mid-1960s, automotive companiesencountered severe axleshaft breakage problems.In addition to the obvious visible external
Fig. 41 The top four images show a lap formation on the inside diameter of the head region on a cold-formed auto-motive part. The bottom four images show the redesign with no lap
Fig. 43 Two-dimensional flownet of a single tooth in a bevel-gear forming process. The top and bottom dies movetogether
Fig. 42 Hot forging of a bevel gear from a round billet to the final shape
Fig. 40 Fastener showing a lap
Finite Element Method Applications in Bulk Forming / 277

defects, internal chevron cracks were also pres-ent (Ref 23). The problem was so serious that anumber of manufacturers adopted 100% ultra-sonic testing procedures, with automatic rejec-tion of suspect shafts.To avoid 100% inspection, in the early 1970s,
the Chrysler Corporation developed conserva-tive guidelines for forward extrusion in conicaldies, guaranteeing chevron-free parts (Ref 23).Upper-bound methodologies were used to deter-mine the conditions under which chevrons wouldform. Based on die-cone angle, process reduc-tion, and friction conditions, Avitzur derivedmathematical expressions to describe the centralbursting phenomenon during the wire drawing orextrusion of a non-strain-hardening material(Ref 24). To validate this work, experimentswere carried out at Lehigh University on AISI1024 plain carbon steel bars. Drawing was car-ried out in dies having an 8� semicone angle,with greater than 22% reduction, that is, in thesafe region of Avitzur’s curves. No central burstswere reported (Ref 24).
Avitzur derived similar criteria for centralbursting in strain-hardening materials (Ref 25)that were later validated by Zimerman andAvitzur (Ref 26). Experimental results areshown (Fig. 46) where it is clear that no centralbursting occurred in the safe zone. This workalso illustrates the die angles and drawingforces where central bursting occurs. Thisis overlaid on a schematic of the drawing condi-tions providing sound flow, dead-zone forma-tion, and shaving (Fig. 47) (Ref 26).DaimlerChrysler implemented Avitzur’s curvesin the early 1970s, and the chevron crackingproblems were no longer troublesome.More recently, work has been carried out
using FEM in conjunction with ductile fracturecriteria to determine the occurrence of centralbursting. The parameter damage is a cumulativemeasure of the deformation under tensile stressand has been associated with chevron cracking.Researchers have evaluated seven differentdamage or ductile fracture criteria (Ref 27).The various criteria express ductile fracture as
a function of the plastic deformation of themate-rial, taking into account the geometry, damagevalue, stresses, and strain within the workpiece.When the maximum damage value (MDV) of thematerial exceeds the critical damage value(CDV), crack formation is expected.A specific damage model proposed by Cock-
croft and Latham states that fracture occurswhen the cumulative energy density due to themaximum tensile stress exceeds a certain value.This criterion has provided good agreement atpredicting the location of the MDV. The Cock-croft and Latham criterion is shown as followsin both dimensional and nondimensional forms:
Zefs�de ¼ Ca
Zes�
sde ¼ Cb
where s*is the principal (maximum tensile)stress, s is the effective stress, de is the incre-ment of effective strain, and Ca and Cb are con-stant values.Under ideal drawing or extrusion conditions,
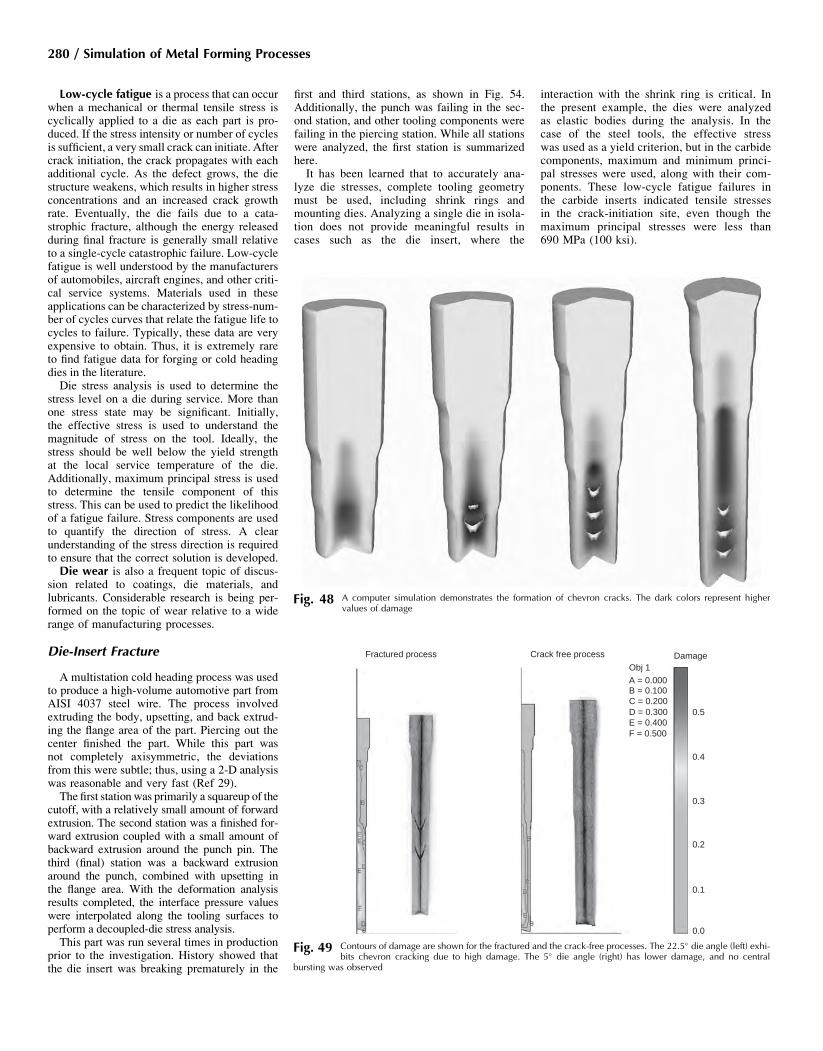
the strain distribution across the componentcross section would be uniform. However, theoccurrence of subsurface redundant deformationcauses the strain distribution to become nonuni-form. The amount of redundant deformationincreases with increasing die angle and cancause extremely high tensile stresses. Theseinternal tensile stresses can in turn lead to micro-voiding and ultimately to cracking (Ref 28). Ifthe die angle/draw reduction combination cannotmaintain compressive axial stresses in the drawncomponent, the center portion will be stretched,and the tensile stress may increase to a levelwhere bursting occurs (Fig. 48). In the first form-ing operation for a component, the stresses in thecomponent may be high, but the damage willstill be quite low because the damage accumu-lates with deformation. For this reason, fracturedoes not generally occur until the second or thirddraw or extrusion operation. A triple extrusion(last image in Fig. 48) was simulated to demon-strate this phenomenon. It is clear that in thiscase, chevrons do not form until the thirdreduction.One method to determine the CDV of a
material is to perform poorly lubricated com-pression and notched tension tests until crack-ing is detected. After testing, simulations canbe performed, matching the geometry and pro-cess conditions of the experimental tests, to cal-culate damage values. The predicted MDV atthe instant of fracture is a good representationof the CDV of the material. Because the crackis not visible until after it has formed in the ten-sile test, a higher estimation of the CDV islikely. Averaging the CDVs calculated fromthe compression and notched tensile tests is areasonable approach.A comparison was made between two auto-
motive shaft designs manufactured using a
Fig. 45 Two-dimensional flownet of a single tooth in a bevel-gear forming process. The bottom die moves in anupward direction
Fig. 44 Two-dimensional flownet of a single tooth in a bevel-gear forming process. Only the top die moves in adownward direction
278 / Simulation of Metal Forming Processes

double extrusion. The only parameter changedwas the die semicone angle for the minor diam-eter. Five-hundred steel shafts (AISI 1024)were produced with a nominal 22.5� extrusiondie angle, and 500 were produced with a 5�die angle. Chevron cracks were observed on1.2% of the shafts made from the 22.5� die,but none were observed in the product pro-duced using the 5� angle.Process simulation was used to analyze both
processes. The simulation indicated a higher dam-age value for the product extruded with the 22.5�die angle than for the parts produced with the 5�angle. The high damage value correlated wellwith the location of the chevron cracks (Fig. 49).When damage levels are very high, fracture
will occur consistently. When processes are wellbelow the ductility limit, fractures are notexpected to occur. A narrow range exists inbetween these two regions where the chance ofcracking is probabilistic and a higher damageprediction can be interpreted as a greater chanceof fracture. Because the damage is cumulative innature, the prior working history of the wire orworkpiece is an important factor to be consid-ered for the likelihood of fracture occurrence.
Fracture during Cold Forming
During an initial trial of a cylindrical cold-formed part (Fig. 50), the manufacturerobserved a severe fracture originating in the
inside diameter of the part after the secondoperation. There was also a die underfill inthe area of the fracture. The defect wasobserved after the end of the forming opera-tion, as shown in Fig. 51. As seen in Fig. 51,the flowlines during the two operations showthe grain orientation of the part after forming.Also seen in Fig. 51 are the underfill at boththe inner and outer diameters. A plot of dam-age versus time is shown in Fig. 52, wherethe separation and contact of the sampledpoints have been highlighted in the plot. Itcan be noted that the damage at point 2 remains0 during the first operation and starts toincrease in the second operation. As shown inFig. 51, in the second operation, point 2 origi-nally resides underneath the punch. The pointcontacts the punch and moves outward as thepunch moves downward. As the material isbackward extruded, this point moves upwardand loses contact with the punch. The separa-tion between the material and the punch formsan underfill on the part inside diameter surface.The predicted damage value continues toincrease, as shown in Fig. 52, when point2 passed the punch corner, backward extruded,and separated from the punch. At point 1, thedamage increases when the material is back-ward extruded and separated from the bottomdie. The damage value at point 1 is signifi-cantly lower than point 2.In order to manufacture this part,
subsequent analysis revealed that the damage
factor could be reduced. Analysis was usedin conjunction with shop trials to eliminatethe fracture and die underfill in this part(Fig. 53).
Die Stress Analysis
Four Common Modes of Die Failure
The four common modes of die failure arecatastrophic fracture, plastic deformation, low-cycle fatigue, and wear.Catastrophic failure occurs when a die is
loaded to stress levels that exceed the ultimatestrength at temperature of the die material. Thiscan occur due to gross overloading of the diestructure, inadequate support to transmit theload to an adjoining component, or a stress con-centration at a sharp feature. Dies that fail inthis mode can release enormous amounts ofenergy, resulting in a serious safety hazard.Plastic deformation occurs when the stress
on a die exceeds the yield strength at theoperating temperature. Plastic deformation canoccur as a localized effect or a widespread con-dition. Examples of a localized effect are roll-ing the corner of a punch or the initialyielding in a stress concentration prior to afatigue failure. In these cases, the overall diedimensions do not change. Large-scale yieldingoccurs when a bolster plate is dished or theentire inside diameter of a shrink ring becomesoversized.
90r (%)
80
70
60
50
Per
cent
red
uctio
n in
are
a
40
30
20
10
00 10 20 30
NO CB CB
Many tests in this regionproduced no central bursting.
40
Semi-cone angle
50 60 70 80 90
Central bursting criterionβ = 0.0
m = 1.00.50.0
Fig. 46 Comparison of theoretical data and results
DIEDIE
Dra
win
g fo
rce
Sound flow Dead zoneformation
Shaving
Deadzone
Central burstformation
Tool angle
DIE
0 σσ1σσ∗1 σcrt
DIE
Fig. 47 Effect of tool angle and mode of flow on drawing force
Finite Element Method Applications in Bulk Forming / 279
Low-cycle fatigue is a process that can occurwhen a mechanical or thermal tensile stress iscyclically applied to a die as each part is pro-duced. If the stress intensity or number of cyclesis sufficient, a very small crack can initiate. Aftercrack initiation, the crack propagates with eachadditional cycle. As the defect grows, the diestructure weakens, which results in higher stressconcentrations and an increased crack growthrate. Eventually, the die fails due to a cata-strophic fracture, although the energy releasedduring final fracture is generally small relativeto a single-cycle catastrophic failure. Low-cyclefatigue is well understood by the manufacturersof automobiles, aircraft engines, and other criti-cal service systems. Materials used in theseapplications can be characterized by stress-num-ber of cycles curves that relate the fatigue life tocycles to failure. Typically, these data are veryexpensive to obtain. Thus, it is extremely rareto find fatigue data for forging or cold headingdies in the literature.Die stress analysis is used to determine the
stress level on a die during service. More thanone stress state may be significant. Initially,the effective stress is used to understand themagnitude of stress on the tool. Ideally, thestress should be well below the yield strengthat the local service temperature of the die.Additionally, maximum principal stress is usedto determine the tensile component of thisstress. This can be used to predict the likelihoodof a fatigue failure. Stress components are usedto quantify the direction of stress. A clearunderstanding of the stress direction is requiredto ensure that the correct solution is developed.Die wear is also a frequent topic of discus-
sion related to coatings, die materials, andlubricants. Considerable research is being per-formed on the topic of wear relative to a widerange of manufacturing processes.
Die-Insert Fracture
A multistation cold heading process was usedto produce a high-volume automotive part fromAISI 4037 steel wire. The process involvedextruding the body, upsetting, and back extrud-ing the flange area of the part. Piercing out thecenter finished the part. While this part wasnot completely axisymmetric, the deviationsfrom this were subtle; thus, using a 2-D analysiswas reasonable and very fast (Ref 29).The first station was primarily a squareup of the
cutoff, with a relatively small amount of forwardextrusion. The second station was a finished for-ward extrusion coupled with a small amount ofbackward extrusion around the punch pin. Thethird (final) station was a backward extrusionaround the punch, combined with upsetting inthe flange area. With the deformation analysisresults completed, the interface pressure valueswere interpolated along the tooling surfaces toperform a decoupled-die stress analysis.This part was run several times in production
prior to the investigation. History showed thatthe die insert was breaking prematurely in the
first and third stations, as shown in Fig. 54.Additionally, the punch was failing in the sec-ond station, and other tooling components werefailing in the piercing station. While all stationswere analyzed, the first station is summarizedhere.It has been learned that to accurately ana-
lyze die stresses, complete tooling geometrymust be used, including shrink rings andmounting dies. Analyzing a single die in isola-tion does not provide meaningful results incases such as the die insert, where the
interaction with the shrink ring is critical. Inthe present example, the dies were analyzedas elastic bodies during the analysis. In thecase of the steel tools, the effective stresswas used as a yield criterion, but in the carbidecomponents, maximum and minimum princi-pal stresses were used, along with their com-ponents. These low-cycle fatigue failures inthe carbide inserts indicated tensile stressesin the crack-initiation site, even though themaximum principal stresses were less than690 MPa (100 ksi).
Fig. 48 A computer simulation demonstrates the formation of chevron cracks. The dark colors represent highervalues of damage
Fractured process Crack free process DamageObj 1A = 0.000
0.5
0.4
0.3
0.2
0.1
0.0
B = 0.100C = 0.200D = 0.300E = 0.400F = 0.500
Fig. 49 Contours of damage are shown for the fractured and the crack-free processes. The 22.5� die angle (left) exhi-bits chevron cracking due to high damage. The 5� die angle (right) has lower damage, and no central
bursting was observed
280 / Simulation of Metal Forming Processes

Results for the first station tooling assemblycan be seen in Fig. 55 and 56. This assemblyshows the punch (D40), the insert (D70), andthe shrink ring/sleeve assembly (S7 and M300).The ring/sleeve assembly did not indicate anyoverstress condition and performed well in fieldservice. The insert did indicate a positive maxi-mum principal stress in the region where thefracture was observed. The principal stress direc-tion was predominantly axial. After carefullystudying the simulations, it was decided torun a simulation with a two-piece insert, asshown in Fig. 57. The analysis indicated a signif-icantly lower stress in the region of the fracture.The tooling was modified based on the simu-
lation results. The insert in the first stationwas split into two components. This resultedin a 550% life improvement. Other tooling
modifications resulted in similar improvementsin other stations of the process.Secondary effects influenced tool life on
the other components as a result of the afore-mentioned modifications. For instance, tool-ing components that were not modified ineach station also showed substantial improve-ments, most of which were above a 150%increase. The net result, based on historicaldata, showed a 43% reduction in overall tool-ing costs and a 54% reduction in downtimeassociated with tooling problems on thisproduct.
Turbine Spool Die Failure
A company was experiencing a dimensionalproblem with a hot-forged turbine disk (Ref30, 31), as shown in Fig. 58. The forging wasundersized on a number of features on an insidediameter. After an investigation of potentialcauses, the dies were thoroughly inspected.The inside diameter of a die liner and the out-side container were oversized. This was some-what surprising, because the outside diameterof the forging was in tolerance.
A stress analysis indicated that the effectivestress exceeded the yield strength at tempera-ture in the region where the die had yielded(Fig. 59). A range of redesign options wasdeveloped and analyzed. The redesign thatwas selected involved a thicker die wall (Fig.60). Criteria for the redesign included cost, easeof assembly, and structural integrity. It was crit-ical that the die wall possessed sufficientstrength to avoid plastically deforming duringthe forging operation.This design was successful in that the dimen-
sional deviations were eliminated and there wasa significant reduction in die maintenance cost.The root cause of this problem was large-scaleplastic deformation. This case is interestingbecause the original symptom of a problemwas a dimensional deviation in the forging.Because this die material was quite ductile, nofracture was observed. In fact, the inside fea-tures were actually forged within tolerance,but the outside was forged oversized. Duringthe ejection process, the part was essentiallyextruded, moving the dimensional deviationfrom the outside of the forging to the inside,as shown in Fig. 61.
Fracture
Underfill on I.D.
Fig. 50 Photograph of the actual part. Note the severefracture (dark area) and die underfill (below
dark area) on the inside diameter (ID)
Punch
Die
P.2
P.2 P.2
P.1
P.1
P.1
Fig. 51 Flowlines for the forming of the component. Note that the free surfaces are very clear on both the inner andouter diameters
Fig. 53 After the redesign, the inside diameter is freeof defects
0.3
Point 2
Point 2
Point 1
SeparationSeparation
Recontact
End of 1stoperation
Point 1
0.25
0.2
0.15
Dam
age
(NA
)
0.1
0.05
00 0.02 0.04 0.06 0.08
Time, s
0.1 0.12 0.14 0.16
Fig. 52 Point tracking the damage factor of two points on the surface of the component
Finite Element Method Applications in Bulk Forming / 281

Product Assembly
Staked Fastener Installation
The development of complex forming pro-cesses, such as self-penetrating fasteners, stakedstuds, and rivets, involves complexities over andabove traditional forming operations due to theinteractions of multiple plastic deforming bodies.In such cases, fastener installation is influenced byplastic strain (work hardening) induced duringprior cold forming operations. Therefore, it isnot practical to perform installation trials withmachined blanks. The Fabristeel Corporationused computer simulation to develop their self-piercing mechanically staked fasteners for sheetmetal parts (Fig. 62). The patented drawform studwas fully developed using simulation. The devel-opment process included forming the stud, theinstallation process itself (Fig. 63), and a pullouttest (Fig. 64). Based on damage values in thesheet, the original design was modified to preventfracture in the panel.
Breakaway Lock Development
Recently, process simulation has been usedto develop an aluminum breakaway padlock(Fig. 65). Pull strength was a critical require-ment for the intended application. Unlike a typ-ical keyed padlock, this lock was developed tobe a one-time-use item.The lock was developed so that during installa-
tion, the bolt is torqued down until the head shearsoff at an undersized (recessed) diameter. At theinstallation, the end of the bolt should plasticallydeform the shackle, resulting in a permanentinstallation. The grade of aluminum, heat treat-ment, and geometry of the lock were the primarydesign variables. Common aluminum alloys wereanalyzed, including 6061 and 6062, as were dif-ferent heat treatments for the shackle, bolt, andbody. Shackle diameters of 5 and 6 mm (0.20and 0.24 in.) weremodeled to determine the effectof diameter on the pull strength.The lock shackle was modeled as a rigid-
plastic material, and for this portion of the anal-ysis, the bolt was considered rigid. The bolt wastwisted and subsequently pushed into theshackle (rotated and translated inward) untilthe tip of the bolt was fully engaged. The
localized deformation can be seen in Fig. 66,where effective strain is displayed in theshackle.The first question for this lock design was the
mode of failure. Localized plastic deformationat the tip of the bolt could occur, as seen inFig. 67, allowing the shackle to become dis-lodged. Alternatively, the shackle could unbendor neck, allowing the free end to be pulled outof the lock body. Because the deformation inboth the bolt and the shackle was needed toaccurately predict the failure, both were ana-lyzed as plastic objects.Pull tests were performed by assigning a con-
stant (upward) velocity to a rigid object placedinside of the shackle. The bottom of the lockbody was fixed using boundary conditions.The contact between the bolt and the shacklewas considered, as was the interaction betweenthe shackle and the lock body.It was shown from the simulations that both
deformation modes (tip deformation and shackleunbending) occurred during this process. At thestart of the pull test, the tip of the bolt plasticallydeformed, as seen in Fig. 67. After this initialdeformation, however, the bolt remained struc-turally sound, and the shackle started to unbend.The unbending continued until the free end ofthe shackle pulled free from the lock base, asseen in Fig. 68. This bending was the primarymode of failure observed in all of the simulatedpull tests, and it matched prototype testsconducted.The failuremode and pull strengthwere studied
for each design, as seen in Fig. 69.When using thesame-diameter shackle, the lockmade from 6061-T6 material demonstrated a higher pull strength
than the lock made from 6062. Likewise, for thesame material, the simulations showed that thelarger the shackle diameter, the higher the pullstrength. After this study, 6061-T6 material anda 6 mm (0.24 in.) diameter shackle were selectedfor the final lock design.The trend in pull strength that was observed
in the pull tests was quite intuitive. Simulationwas not only able to confirm the trend, but itwas also able to determine the amount of loadthat each lock could withstand.The ability to determine how the lock would
fail was the real strength of the FEM simula-tions in this example. Depending on the shacklematerial and diameter, it was conceivable thatsome locks would fail due to bolt tip deforma-tion, while others would fail due to shackleunbending. Simulation was able to determinethat for the materials and diameters studied,all locks would fail the same way.
Solid-State Welding Process
Inertia welding is a solid-state welding pro-cess in which the energy required for welding isobtained from a rotating flywheel. The fric-tional heat developed between the two joiningsurfaces rubbing against each other under axialload produces the joint (Ref 32, 33). One of thetwo components is attached to a rotating fly-wheel, while the other component remains sta-tionary. During the process, the rotatingcomponent is pushed against the fixed one,causing heat generation through contact frictionand consequent rise in the interface tempera-ture. As the temperature increases, the materialstarts to soften and deform. At the final stage,
Fig. 54 The failure mode of the die insert in the firststation was a low-cycle fatigue fracture, as
shown
Stress-Max Principal
200
0.0
–200
Fig. 55 The contours of maximum principal stress on the original design are shown, with the dark colors represent-ing tension and the light colors representing compression. The tensile stress on the inside of the shrink ring is
expected. The tensile stress at the inside corner of the die insert was problematic. This is coincident with the location ofthe low-cycle fatigue fracture
282 / Simulation of Metal Forming Processes
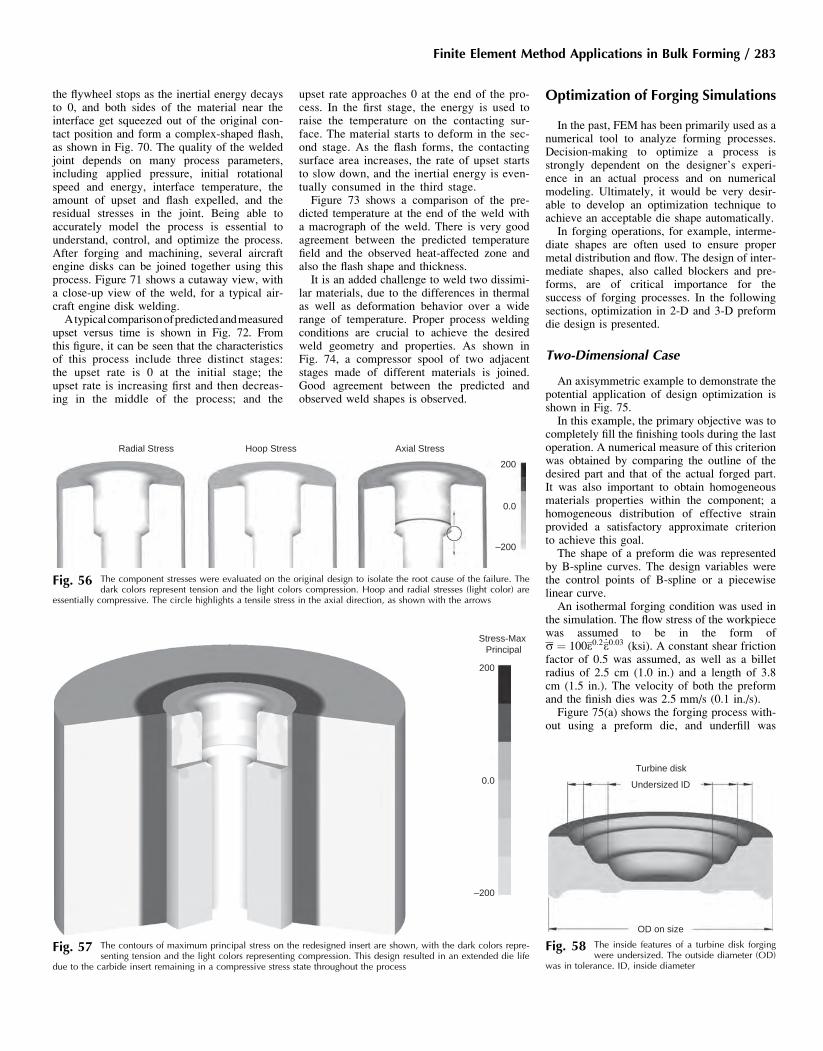
the flywheel stops as the inertial energy decaysto 0, and both sides of the material near theinterface get squeezed out of the original con-tact position and form a complex-shaped flash,as shown in Fig. 70. The quality of the weldedjoint depends on many process parameters,including applied pressure, initial rotationalspeed and energy, interface temperature, theamount of upset and flash expelled, and theresidual stresses in the joint. Being able toaccurately model the process is essential tounderstand, control, and optimize the process.After forging and machining, several aircraftengine disks can be joined together using thisprocess. Figure 71 shows a cutaway view, witha close-up view of the weld, for a typical air-craft engine disk welding.Atypicalcomparisonofpredictedandmeasured
upset versus time is shown in Fig. 72. Fromthis figure, it can be seen that the characteristicsof this process include three distinct stages:the upset rate is 0 at the initial stage; theupset rate is increasing first and then decreas-ing in the middle of the process; and the
upset rate approaches 0 at the end of the pro-cess. In the first stage, the energy is used toraise the temperature on the contacting sur-face. The material starts to deform in the sec-ond stage. As the flash forms, the contactingsurface area increases, the rate of upset startsto slow down, and the inertial energy is even-tually consumed in the third stage.Figure 73 shows a comparison of the pre-
dicted temperature at the end of the weld witha macrograph of the weld. There is very goodagreement between the predicted temperaturefield and the observed heat-affected zone andalso the flash shape and thickness.It is an added challenge to weld two dissimi-
lar materials, due to the differences in thermalas well as deformation behavior over a widerange of temperature. Proper process weldingconditions are crucial to achieve the desiredweld geometry and properties. As shown inFig. 74, a compressor spool of two adjacentstages made of different materials is joined.Good agreement between the predicted andobserved weld shapes is observed.
Optimization of Forging Simulations
In the past, FEM has been primarily used as anumerical tool to analyze forming processes.Decision-making to optimize a process isstrongly dependent on the designer’s experi-ence in an actual process and on numericalmodeling. Ultimately, it would be very desir-able to develop an optimization technique toachieve an acceptable die shape automatically.In forging operations, for example, interme-
diate shapes are often used to ensure propermetal distribution and flow. The design of inter-mediate shapes, also called blockers and pre-forms, are of critical importance for thesuccess of forging processes. In the followingsections, optimization in 2-D and 3-D preformdie design is presented.
Two-Dimensional Case
An axisymmetric example to demonstrate thepotential application of design optimization isshown in Fig. 75.In this example, the primary objective was to
completely fill the finishing tools during the lastoperation. A numerical measure of this criterionwas obtained by comparing the outline of thedesired part and that of the actual forged part.It was also important to obtain homogeneousmaterials properties within the component; ahomogeneous distribution of effective strainprovided a satisfactory approximate criterionto achieve this goal.The shape of a preform die was represented
by B-spline curves. The design variables werethe control points of B-spline or a piecewiselinear curve.An isothermal forging condition was used in
the simulation. The flow stress of the workpiecewas assumed to be in the form ofs ¼ 100e0:2 _e0:03 (ksi). A constant shear frictionfactor of 0.5 was assumed, as well as a billetradius of 2.5 cm (1.0 in.) and a length of 3.8cm (1.5 in.). The velocity of both the preformand the finish dies was 2.5 mm/s (0.1 in./s).Figure 75(a) shows the forging process with-
out using a preform die, and underfill was
Radial Stress Hoop Stress Axial Stress
200
0.0
–200
Fig. 56 The component stresses were evaluated on the original design to isolate the root cause of the failure. Thedark colors represent tension and the light colors compression. Hoop and radial stresses (light color) are
essentially compressive. The circle highlights a tensile stress in the axial direction, as shown with the arrows
Stress-Max Principal
200
0.0
–200
Fig. 57 The contours of maximum principal stress on the redesigned insert are shown, with the dark colors repre-senting tension and the light colors representing compression. This design resulted in an extended die life
due to the carbide insert remaining in a compressive stress state throughout the process
Turbine disk
Undersized ID
OD on size
Fig. 58 The inside features of a turbine disk forgingwere undersized. The outside diameter (OD)
was in tolerance. ID, inside diameter
Finite Element Method Applications in Bulk Forming / 283

predicted, as indicated by the arrows. The ini-tial guess of the preform die shape prior to thefinal forging is shown in Fig. 75(b). As indi-cated in the same figure, an underfill problemremained. Through the optimization iterations,the preform die shape evolved, as shown inFig. 75(c). It took approximately seven itera-tions to resolve the underfill problem and toobtain the homogenized strain distribution, asshown in Fig. 75(d) Figures 75(e) to (g) showthe distribution of effective plastic strain with-out preform die, with initial preform die, andwith optimized preform die, respectively. Itcan be seen that the distribution of effectivestrain became more uniform through the itera-tive optimization process.
Three-Dimensional Case
Most forming processes are, in fact, 3-D.Tooling geometry is most likely prepared usingcommercially available computer-aided design(CAD) systems. In the CAD systems, nonuniformrational B-spline surface is a very popular way ofrepresenting the complex tooling geometry. In theFEM model, the geometry is generally repre-sented by a set of polygons. At the current stage,the stereolithography (STL) representation isused as a vehicle between CAD and FEM totransfer the geometry definition. Parametricdesign and feature-based representation, whichmay be available in the CAD system (dependenton the methodology of the CAD system) duringthe designing process, are unfortunately lost atthe end of the STL transformation. The FEM canonly be used as a numerical tool to evaluate thegiven tooling design. Although the CAD andFEM can conceptually be used as a black boxand integrated by a closed-loop optimization pro-cedure, numerous 3-D FEM simulations will beneeded to evaluate the sensitivity of design para-meters. The procedure can be extremely computa-tional, demanding, and impractical for daily use.Unlike the 2-D approach, being able to generatea reasonable initial design in order to facilitatethe design process has been the near-termobjective.In a recent approach, preform design based
on the so-called filtering method was used todetermine an initial preform shape. For a givenfinal part configuration, there are three steps togenerate an initial preform shape (Ref 34–37):
1. Digitizing process: The final part geometry isimported into the system as a triangulated sur-face, in STL or other format. The digitizingprocedure is first performed to convert the tri-angulated surface into a point cloud array.
2. Filtering process: The resulting surface willbe passed through a filtering procedure toproduce a smoothed shape. In the filteringprocedure, the geometric domain will beconverted into a frequency domain by usinga Fourier transformation (Ref 38–40). Byusing the filtering function, high-frequencyregions (sharp corners, edges, or small
Stress-Effective
200
100
0.0
Fig. 60 Analysis of new design using the same scale. The effective stress levels are much lower throughout the diewall. While high stresses were calculated in the workpiece contact zone, this design possessed sufficient
strength to avoid large-scale plastic deformation
ID forged on sizeOD forged oversized
ID undersized
OD on size
Fig. 61 The original observation was undersized features on the inside diameter (ID) of the forging. In fact, the out-side diameter (OD) was forged oversized, as shown on the left. A swaging operation was inadvertently per-
formed while ejecting the part, as shown on the right. This resulted in the initial investigation focusing on the top die(punch)
Stress-Effective
200
100
0.0
Fig. 59 Analysis of original design. Contours of effective stress depict a very high stress level (darkest contour)through the die wall in the contact zone. This stress in the die wall exceeded the yield strength of the die
material at the operating temperature, resulting in plastic deformation
284 / Simulation of Metal Forming Processes

geometric details of a surface) will beremoved. An inverse Fourier transformationwill then be applied to obtain a smoothedsurface.
3. Trimming process: The trimming procedureis used to control the boundary shape of asmoothed shape, so as to obtain a realisticinitial preform shape.
An aluminum structural part, as shown inFig. 76(a), is used to illustrate the aforemen-
tioned procedure. The overall dimensions ofthe part are 61.5 by 16.5 by 9.1 cm (24.2 by6.5 by 3.6 in.). The filtered smoothed shape isshown in Fig. 76(b). After trimming, thedesigned initial preform is shown in Fig. 76(c).In order to improve and eventually automate
the design modification procedure, a systematicmethod to evaluate the material flow based onthe FEM result must be developed. Becausethe material flow history is known from theFEM simulation, the defect location can be
traced, and modifications can be made accord-ingly. To illustrate the overall procedure, theforging of the example part was simulated, asshown in Fig. 77.In this simulation, only the upper part was
simulated due to symmetry. Aluminum 6061was selected as a workpiece material. The ini-tial temperature was assumed to be 480 �C(900 �F) for the workpiece and 205 �C (400 �F)for the die. The total die stroke from the initialcontact to the final position was 3.612 cm(1.422 in.). A flash thickness of 2.5 mm (0.1in.) was used. The estimated maximum loadwas 6300 klbf. As shown in Fig. 77, the flashshape was not uniform in the areas indicated byarrows, and underfill was predicted, indicatedby dashed lines.To identify the region where modification
was necessary, an ideal forged component withflash was defined first in order to compare withthe simulation result. At the present stage, theideal final forged part is defined in such a waythat it has uniform flash width and does nothave underfill condition. By comparing theideal forged shape and the predicted shape atthe reference step, the location of the underfilldefect and the amount of additional volumecan be identified. The material flow historyinformation from a FEM simulation can beused to modify the preform shape by addingvolume (if material is not sufficient) or byremoving volume (if excessive flash was
Fig. 64 After the forming and installation are com-pleted, the pull test is simulated. This figure
shows the process as the stud is breaking out of the plate.Experimental values matched the simulation resultswithin 5%
Shackle
Lock body
Bolt
Fig. 65 Aluminum breakaway lock. Courtesy of Her-cules Industries
Fig. 63 Installation of the drawform stud. The plastic strain is shown as the shaded color
Fig. 62 Front (left) and back (right) view of an installed stud
Fig. 66 Plastic deformation (dark area is higher strain)after the installation
Fig. 67 Plastic deformation of the bolt at the start ofthe pull test
Finite Element Method Applications in Bulk Forming / 285
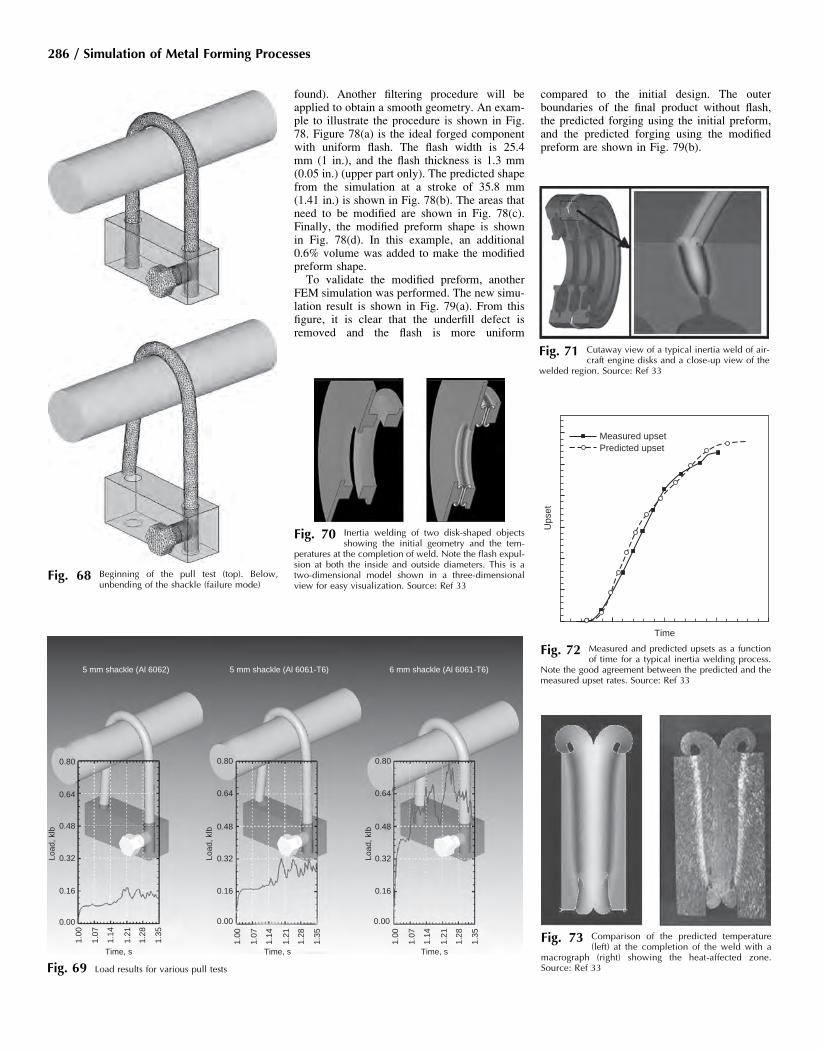
found). Another filtering procedure will beapplied to obtain a smooth geometry. An exam-ple to illustrate the procedure is shown in Fig.78. Figure 78(a) is the ideal forged componentwith uniform flash. The flash width is 25.4mm (1 in.), and the flash thickness is 1.3 mm(0.05 in.) (upper part only). The predicted shapefrom the simulation at a stroke of 35.8 mm(1.41 in.) is shown in Fig. 78(b). The areas thatneed to be modified are shown in Fig. 78(c).Finally, the modified preform shape is shownin Fig. 78(d). In this example, an additional0.6% volume was added to make the modifiedpreform shape.To validate the modified preform, another
FEM simulation was performed. The new simu-lation result is shown in Fig. 79(a). From thisfigure, it is clear that the underfill defect isremoved and the flash is more uniform
compared to the initial design. The outerboundaries of the final product without flash,the predicted forging using the initial preform,and the predicted forging using the modifiedpreform are shown in Fig. 79(b).
5 mm shackle (Al 6062) 5 mm shackle (Al 6061-T6) 6 mm shackle (Al 6061-T6)
Load
, klb
Load
, klb
Load
, klb
0.80
0.64
0.48
0.32
0.16
0.00
1.07
1.21
1.14
1.28
1.00
1.35
1.07
1.21
1.14
1.28
1.00
1.35
1.07
1.21
1.14
1.28
1.00
1.35
0.00 0.00
0.16 0.16
0.32 0.32
0.48 0.48
0.64
0.80 0.80
0.64
Time, sTime, sTime, s
Fig. 69 Load results for various pull tests
Fig. 68 Beginning of the pull test (top). Below,unbending of the shackle (failure mode)
Fig. 70 Inertia welding of two disk-shaped objectsshowing the initial geometry and the tem-
peratures at the completion of weld. Note the flash expul-sion at both the inside and outside diameters. This is atwo-dimensional model shown in a three-dimensionalview for easy visualization. Source: Ref 33
Fig. 71 Cutaway view of a typical inertia weld of air-craft engine disks and a close-up view of the
welded region. Source: Ref 33
Fig. 73 Comparison of the predicted temperature(left) at the completion of the weld with a
macrograph (right) showing the heat-affected zone.Source: Ref 33
Measured upsetPredicted upset
Ups
et
Time
Fig. 72 Measured and predicted upsets as a functionof time for a typical inertia welding process.
Note the good agreement between the predicted and themeasured upset rates. Source: Ref 33
286 / Simulation of Metal Forming Processes

Conclusion
Growing together with computing power,FEM has evolved rapidly and is making greatcontributions to conventional metalworkingtechnologies. The thousand-years-old technol-ogy has quickly evolved in the last 20 years insuch a way that the FEM method is now rou-tinely and successfully used in a wide rangeof bulk forming applications, including materialflow, defect prediction, microstructure/propertypredictions, heat transfer, forming equipmentresponse to the workpiece, die stress and deflec-tion, and so on. With continuous improvement
in computing resources and demand fromindustry, it is expected that future developmentswill likely be in the following areas:
� Optimization: Currently, FEM users play animportant role in solving a specific processdesign by performing sensitivity analysis ofmultiple FEM models. Convergence speed ishighly dependent on the user’s understandingof the FEM model and the actual process. Itis believed that optimization techniques willbe extremely helpful in finding an optimalsolution systematically and quickly on thecomputer. Currently, optimization has beenused with success in conjunction with FEMto determine not only the heat-transfer coeffi-cient but also the material parameters andfriction factor, the interface heat-transfercoefficient between two contact bodies (Ref41) and in the preform design to remove theunderfill flow defect in 2-D application (Ref9). In order to carry out the 3-D optimalshape design, a closer integration of com-puter-aided design/computer-aided engineer-ing (FEM) is necessary and is expected inthe near future. For a true optimal productand process design, the costs that are asso-ciated with the production process, such astooling, material, equipment, heating (whennecessary), inspection, and inventory, shouldalso be characterized and considered in themodel.
� Computer modeling of microstructural fea-tures: Much work has been carried out to pre-dict microstructural features, such as grainsize and phase transformation, in the past byusing phenomenological approaches. Textureis another important microstructural featurethat will affect mechanical properties. Crys-tal-plasticity modeling has made excellentprogress in predicting texture (Ref 42). Asthe computing environment continues to
(a)
(b)
(c)
Fig. 76 Example of the design of initial preform.(a) Final product shape. (b) Filtered smoothed
shape. (c) Designed initial preform shape
Finishdie
(a) (b)
(c) (d)
(e)
(g)
(f)
Billet
Underfill Underfill
74
1
23
B
B
E
B
min. max.
0.09002.9159
ABCDEFG
=======
0.00.50001.00001.50002.00002.50003.0000
B
CC
C
C
D
D
D
D
D
E
E
B
CC
C
C
E
D
D
D
DD
EE
B
B
F min. max.
0.11242.5764
ABCDEFG
B
B
BB
C C C
C
D
DD
DD
EE
E
min. max.
0.27112.4893
ABCDEFG
=======
0.00.50001.00001.50002.00002.50003.0000
=======
0.00.50001.00001.50002.00002.50003.0000
Fig. 75 An example of optimal preform design in two-dimensional application. (a) Final forging shape without preformdie. (b) Initial preform and final forging shape. (c) Evolved preform die shapes during optimization iteration. (d)
Optimal preform and final forging shape. (e) Effective plastic strain distribution without preform die. (f) Effective plastic straindistribution with initial preform die. (g) Effective plastic strain distribution with optimized preform die
Fig. 74 Comparison of actual (left) with predicted (right)weld shape during the inertiawelding of two dis-
similar materials, as would occur in a compressor spool withtwo adjacent stages made of different materials. Due to dif-fering material characteristics on the two sides of the weldinterface, modeling is crucial in determining the right weldgeometry and parameters. Source: Ref 33
Finite Element Method Applications in Bulk Forming / 287

improve, the crystal-plasticity method cou-pled with the FEM code (CPFEM) todescribe the texture/anisotropy evolution dur-ing the forming process will become realisticand practical. The texture model can be fur-ther integrated with the microstructural modelso that transformation, grain-size evolution,and grain-size effects can be taken intoaccount throughout the various stages of ther-mal-mechanical processes. The frameworkestablished for CPFEM and the predictedcrystallographic texture will also facilitatefurther investigations of mechanical proper-ties, fracture, and life prediction.
With the continuously improving understand-ing of material response to thermal-mechanicalchanges and proven success in metalformingapplications, it is believed that FEM will makesignificant contributions to the postformingoperations, such as heat treatment and machin-ing. In due time, it should be possible to ana-lyze the entire manufacturing process, fromthe cast ingot, open-die forging, closed-dieforging, heat treatment, and machining. Thiswill allow designers to include residual stressand grain flow in their product design andapplication analysis. The benefits from thisshould include reduced product life-cycle costand increased safety margins on critical servicecomponents.
ACKNOWLEDGMENTS
In the past 20 years, many of our colleagueshave worked on this subject and made processsimulation successful not only for academicresearch but also for practical industrial use. Itis not possible to properly thank everyonewho has made significant contributions to theFEM methodology for metalforming applica-tions. The authors would like to thank andacknowledge Professor T. Altan at The OhioState University and Drs. S.L. Semiatin at theU.S. Air Force Research Laboratory, S. Srivatsaat General Electric Aircraft Engine, andK. Sawamiphakdi at The Timken Company.We thank them for their work and continuousguidance, support, and encouragement. Theauthors would also like to thank the entire stafffrom Scientific Forming Technologies Corpora-tion for their enthusiasm and diligent work tomeet all the technical challenges throughoutthe years. The authors would also like to thankMr. Jeffrey Fluhrer for editing this manuscript.
REFERENCES
1. C.H. Lee and S. Kobayashi, New Solutionsto Rigid-Plastic Deformation ProblemUsing a Matrix Method, J. Eng. Ind.(Trans. ASME), Vol 95, 1973, p 865
2. G.D. Lahoti and T. Altan, “Research toDevelop Process Models for Producing aDual Property Titanium Alloy CompressorDisk,” Interim Annual Report, AFML-TR-79-4156, Battelle Columbus Laboratories,Dec 1979
3. S.I. Oh, Finite Element Analysis of MetalForming Problems with Arbitrarily ShapedDies, Int. J. Mech. Sci., Vol 24, p 479
4. N. Rebelo and S. Kobayashi, A CoupledAnalysis of Viscoplastic Deformation andHeat Transfer, Parts I and II, Int. J. Mech.Sci., Vol 22, 1980, p 699, 707
5. W.T. Wu, S.I. Oh, T. Altan, and R. Miller,“Automated Mesh Generation for FormingSimulation—I,” ASME International Compu-ters in EngineeringConference, 5–9Aug 1990
6. J.J. Park and S.I. Oh, “Three DimensionalFinite Element Analysis of Metal FormingProcesses,” NAMRC XV, 27–29 May1987 (Bethlehem, PA)
7. G. Li, W.T. Wu, and J.P. Tang, “DEFORM-3D—A General Purpose 3-D Finite ElementCode for the Analysis of Metal Forming Pro-cesses,” presented at the Metal Forming Pro-cess Simulation in Industry InternationalConference and Workshop, 28–30 Sept 1994(Baden-Baden, Germany)
8. W.T. Wu, G. Li, J.P. Tang, S. Srivatsa,R. Shankar, R. Wallis, P. Ramasundaram,and J. Gayda, “A Process Modeling Systemfor Heat Treatment of High TemperatureStructural Materials,” AFRL-ML-WP-TR-2001–4105, June 2001
9. J. Oh, J. Yang, W.T. Wu, and H. Delgado,“Finite Element Method Applied to 2-Dand 3-D Forging Design Optimization,”NumiForm 2004, 13–17 June 2004(Columbus, OH)
10. C.M. Sellars and J.A. Whiteman, Recrys-tallization and Grain Growth in Hot Roll-ing, Met. Sci., Vol 13, 1979, p 187–194
11. G. Shen, S.L. Semiatin, and R. Shivpuri,Modeling Microstructure Development dur-ing the Forging of Waspaloy, Metall. Mater.Trans. A, Vol 26, 1995, p 1795–1803
12. K. Arimoto, G. Li, A. Arvind, and W.T.Wu, “The Modeling of Heat Treating Pro-cess,” ASM 18th Heat Treating Confer-ence, 12–15 Oct 1998 (Chicago, IL),ASM International
13. D. Huang, W.T. Wu, D. Lambert, and S.L.Semiatin, Computer Simulation of Micro-structure Evolution During Hot Forging ofWaspaloy and Nickel Alloy 718, Micro-structure Modeling and Prediction DuringThermomechanical Processing, TMS,2001, p 137–147
14. J. Yang, G. Li, W.T. Wu, K. Sawami-phakdi, and D. Jin, “Process Modeling forRotary Tube Piercing Application,” Materi-als Science and Technology 2004, 26–29Sept 2004 (New Orleans, LA)
15. D. Lambert, P.R. Jepson, and H. Pihlainen,Process Simulation Development for Indus-trial Rolling Applications, Modeling, Con-trol, and Optimization in Ferrous andNonferrous Industry, Materials Scienceand Technology 2003, 9–12 Nov 2003(Chicago, IL), p 529–543
16. K. Sawamiphakdi, C. Ramos, T.J. Fave-nyesi, R.H. Klundt, and G.D. Lahoti,“Finite Element Modeling of InductionHardening Process,” The First InternationalConference on Numerical Modeling andComputer Applications on Thermal Pro-cess of Automobile Components, 27–29Jan 2003 (Bangkok, Thailand)
17. D. Lambert, W.T. Wu, K. Arimoto, andJ. Ni, “Computer Simulation of InductionHardening Process Using Coupled FiniteElement and Boundary Element Methods,”ASM 18th Heat Treating Conference and
(a)
(b)
(3)
(1)(2)
Fig. 79 Simulation result using the modified preformdesign. (a) Deformed shape. (b) Outer bound-
aries of (1) final product without flash, (2) predictedforging using the initial design, and (3) predicted forgingusing the modified design
(a) (b)
(c) (d)
Fig. 78 Example of the preform modification scheme.(a) Ideal forged component with uniform flash.
(b) Predicted shape from the simulation result. (c) Areas thatneed to be modified. (d) Modified preform shape
Fig. 77 Simulation result using the initial preformdesign/deformed shape
288 / Simulation of Metal Forming Processes
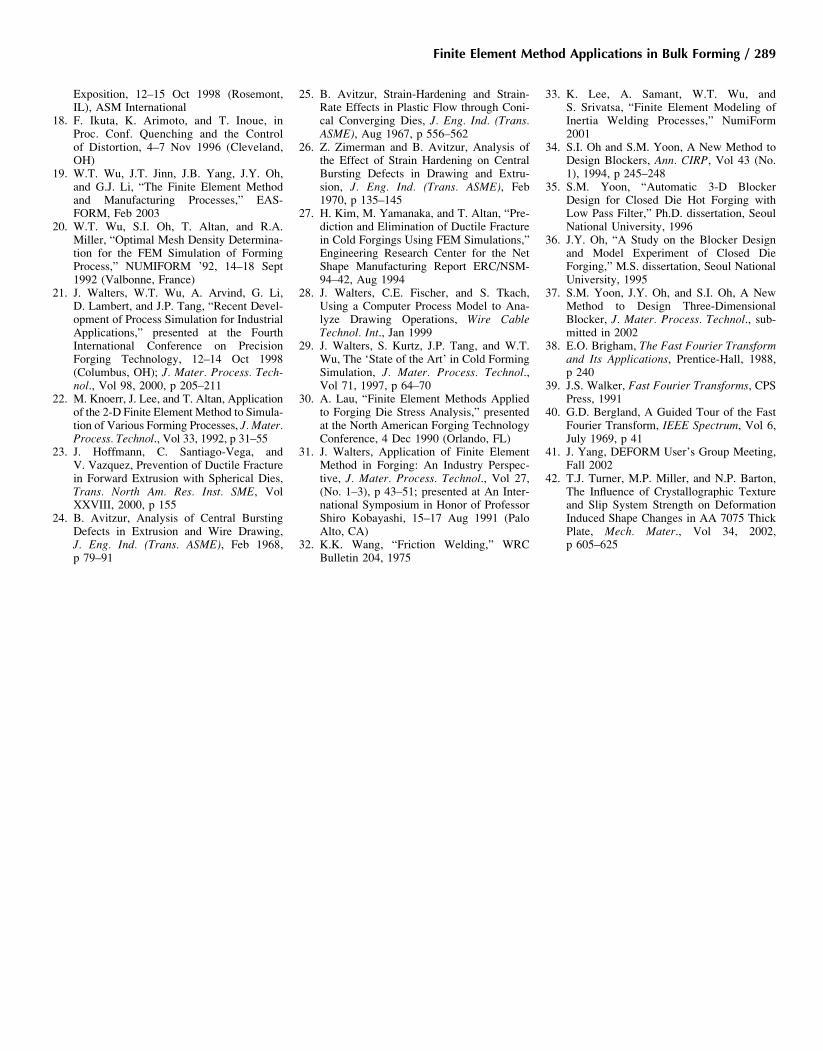
Exposition, 12–15 Oct 1998 (Rosemont,IL), ASM International
18. F. Ikuta, K. Arimoto, and T. Inoue, inProc. Conf. Quenching and the Controlof Distortion, 4–7 Nov 1996 (Cleveland,OH)
19. W.T. Wu, J.T. Jinn, J.B. Yang, J.Y. Oh,and G.J. Li, “The Finite Element Methodand Manufacturing Processes,” EAS-FORM, Feb 2003
20. W.T. Wu, S.I. Oh, T. Altan, and R.A.Miller, “Optimal Mesh Density Determina-tion for the FEM Simulation of FormingProcess,” NUMIFORM ’92, 14–18 Sept1992 (Valbonne, France)
21. J. Walters, W.T. Wu, A. Arvind, G. Li,D. Lambert, and J.P. Tang, “Recent Devel-opment of Process Simulation for IndustrialApplications,” presented at the FourthInternational Conference on PrecisionForging Technology, 12–14 Oct 1998(Columbus, OH); J. Mater. Process. Tech-nol., Vol 98, 2000, p 205–211
22. M. Knoerr, J. Lee, and T. Altan, Applicationof the 2-D Finite Element Method to Simula-tion of Various Forming Processes, J. Mater.Process. Technol., Vol 33, 1992, p 31–55
23. J. Hoffmann, C. Santiago-Vega, andV. Vazquez, Prevention of Ductile Fracturein Forward Extrusion with Spherical Dies,Trans. North Am. Res. Inst. SME, VolXXVIII, 2000, p 155
24. B. Avitzur, Analysis of Central BurstingDefects in Extrusion and Wire Drawing,J. Eng. Ind. (Trans. ASME), Feb 1968,p 79–91
25. B. Avitzur, Strain-Hardening and Strain-Rate Effects in Plastic Flow through Coni-cal Converging Dies, J. Eng. Ind. (Trans.ASME), Aug 1967, p 556–562
26. Z. Zimerman and B. Avitzur, Analysis ofthe Effect of Strain Hardening on CentralBursting Defects in Drawing and Extru-sion, J. Eng. Ind. (Trans. ASME), Feb1970, p 135–145
27. H. Kim, M. Yamanaka, and T. Altan, “Pre-diction and Elimination of Ductile Fracturein Cold Forgings Using FEM Simulations,”Engineering Research Center for the NetShape Manufacturing Report ERC/NSM-94–42, Aug 1994
28. J. Walters, C.E. Fischer, and S. Tkach,Using a Computer Process Model to Ana-lyze Drawing Operations, Wire CableTechnol. Int., Jan 1999
29. J. Walters, S. Kurtz, J.P. Tang, and W.T.Wu, The ‘State of the Art’ in Cold FormingSimulation, J. Mater. Process. Technol.,Vol 71, 1997, p 64–70
30. A. Lau, “Finite Element Methods Appliedto Forging Die Stress Analysis,” presentedat the North American Forging TechnologyConference, 4 Dec 1990 (Orlando, FL)
31. J. Walters, Application of Finite ElementMethod in Forging: An Industry Perspec-tive, J. Mater. Process. Technol., Vol 27,(No. 1–3), p 43–51; presented at An Inter-national Symposium in Honor of ProfessorShiro Kobayashi, 15–17 Aug 1991 (PaloAlto, CA)
32. K.K. Wang, “Friction Welding,” WRCBulletin 204, 1975
33. K. Lee, A. Samant, W.T. Wu, andS. Srivatsa, “Finite Element Modeling ofInertia Welding Processes,” NumiForm2001
34. S.I. Oh and S.M. Yoon, A New Method toDesign Blockers, Ann. CIRP, Vol 43 (No.1), 1994, p 245–248
35. S.M. Yoon, “Automatic 3-D BlockerDesign for Closed Die Hot Forging withLow Pass Filter,” Ph.D. dissertation, SeoulNational University, 1996
36. J.Y. Oh, “A Study on the Blocker Designand Model Experiment of Closed DieForging,” M.S. dissertation, Seoul NationalUniversity, 1995
37. S.M. Yoon, J.Y. Oh, and S.I. Oh, A NewMethod to Design Three-DimensionalBlocker, J. Mater. Process. Technol., sub-mitted in 2002
38. E.O. Brigham, The Fast Fourier Transformand Its Applications, Prentice-Hall, 1988,p 240
39. J.S. Walker, Fast Fourier Transforms, CPSPress, 1991
40. G.D. Bergland, A Guided Tour of the FastFourier Transform, IEEE Spectrum, Vol 6,July 1969, p 41
41. J. Yang, DEFORM User’s Group Meeting,Fall 2002
42. T.J. Turner, M.P. Miller, and N.P. Barton,The Influence of Crystallographic Textureand Slip System Strength on DeformationInduced Shape Changes in AA 7075 ThickPlate, Mech. Mater., Vol 34, 2002,p 605–625
Finite Element Method Applications in Bulk Forming / 289