Finite element analysis of blood flow and heat transfer in an image-based human finger
8
Computers in Biology and Medicine 38 (2008) 555 – 562 www.intl.elsevierhealth.com/journals/cobm Finite element analysis of blood flow and heat transfer in an image-based human finger Ying He a , c , ∗ , Hao Liu b , Ryutaro Himeno a , Junko Sunaga a , Nobunori Kakusho a , HideoYokota a a Computational Biomechanics Unit, RIKEN, 2-1 Hirosawa, Wako-shi, Saitama 351-0198, Japan b Faculty of Engineering, Chiba University, 1-33Yayoi-cho, Inage-ku, Chiba 263-8522, Japan c Department of Modern Mechanics, University of Science and Technology of China, Mail Box 4, Hefei, Anhui 230027, PR China Received 18 May 2006; accepted 1 February 2008 Abstract The human finger is said to be the extension of the brain and can convey the information on mechanical, thermal, and tissue damaging. The quantitative prediction of blood flow rate and heat generation are of great importance for diagnosing blood circulation illness and for the noninvasive measurement of blood glucose. In this study, we developed a coupled thermofluid model to simulate blood flow in large vessels and living tissue. The finite element (FE) model to analyze the blood perfusion and heat transport in the human finger was developed based on the transport theory in porous media. With regard to the blood flow in the large arteries and veins, the systemic blood circulation in the upper limb was modeled based on the one-dimensional flow in an elastic tube. The blood pressure and velocity in each vessel were first computed and the corresponding values for the large vessels in the finger were subsequently transferred to the FE model as the boundary conditions. The realistic geometric model for the human finger was constructed based on the MRI image data. After computing the capillary pressure and blood velocity in the tissue, the temperatures in the large vessels and the tissue of the finger were computed simultaneously by numerically solving the energy equation in porous media. The computed blood flow in tissues is in agreement with the anatomical structure and the measurement. It is believed that this analysis model will have extensive applications in the prediction of peripheral blood flow, temperature variation, and mass transport. 2008 Elsevier Ltd. All rights reserved. Keywords: Porous media; Blood perfusion; Finite element method; One-dimensional blood flow; Human finger; Image-based model; MR images 1. Introduction Blood circulation performs an important function—to carry oxygen to the tissues and to remove carbon dioxide and other metabolites from the tissues. Thus, blood circulation plays a crucial role in thermoregulation and mass transport. The quan- titative prediction of the relationship between hemodynamics and heat and mass transfer is of great interest, because it is re- lated to human thermal comfort, drug delivery, and noninvasive measurement. For example, Cho et. al. [1] proposed a noninva- sive method for measuring glucose, where glucose is derived by measuring heat generation, blood flow rate, and hemoglobin oxygenation in a person’s fingertip. ∗ Corresponding author at: Department of Modern Mechanics, University of Science and Technology of China, Mail Box 4, Hefei, Anhui 230027, PR China. Tel./fax: +86 551 3602477. E-mail address: [email protected] (Y. He). 0010-4825/$ - see front matter 2008 Elsevier Ltd. All rights reserved. doi:10.1016/j.compbiomed.2008.02.002 Biological tissues contain blood and the surrounding mate- rials where blood is perfused to tissues via capillary network. The energy transport in tissues includes conduction in tissues, convection between blood and tissues, perfusion through mi- crovascular beds, and metabolic heat generation. Among these, the heat transfer between blood and tissues could be of the greatest importance. The use of Pennes [2] bioheat equation is the most common method available to describe blood per- fusion in the tissue. However, this method cannot explain the convection between large vessels and tissues but only explain the uniform perfusion of blood to tissues. Further, in another method, the spatial variations in the ar- terial, venous, and tissue temperatures are considered, and it includes three equations that represent the heat transfer in ar- teries, veins, and tissues. This method was first presented by Keller and Seiler [3] and has been developed and used by many other researchers [4–8]. These models are frequently applied in describing the whole body thermal system.
Transcript of Finite element analysis of blood flow and heat transfer in an image-based human finger
Computers in Biology and Medicine 38 (2008) 555–562www.intl.elsevierhealth.com/journals/cobm
Finite element analysis of blood flow and heat transfer in animage-based human finger
Ying Hea,c,∗, Hao Liub, Ryutaro Himenoa, Junko Sunagaa, Nobunori Kakushoa, Hideo Yokotaa
aComputational Biomechanics Unit, RIKEN, 2-1 Hirosawa, Wako-shi, Saitama 351-0198, JapanbFaculty of Engineering, Chiba University, 1-33 Yayoi-cho, Inage-ku, Chiba 263-8522, Japan
cDepartment of Modern Mechanics, University of Science and Technology of China, Mail Box 4, Hefei, Anhui 230027, PR China
Received 18 May 2006; accepted 1 February 2008
Abstract
The human finger is said to be the extension of the brain and can convey the information on mechanical, thermal, and tissue damaging.The quantitative prediction of blood flow rate and heat generation are of great importance for diagnosing blood circulation illness and for thenoninvasive measurement of blood glucose. In this study, we developed a coupled thermofluid model to simulate blood flow in large vessels andliving tissue. The finite element (FE) model to analyze the blood perfusion and heat transport in the human finger was developed based on thetransport theory in porous media. With regard to the blood flow in the large arteries and veins, the systemic blood circulation in the upper limbwas modeled based on the one-dimensional flow in an elastic tube. The blood pressure and velocity in each vessel were first computed and thecorresponding values for the large vessels in the finger were subsequently transferred to the FE model as the boundary conditions. The realisticgeometric model for the human finger was constructed based on the MRI image data. After computing the capillary pressure and blood velocityin the tissue, the temperatures in the large vessels and the tissue of the finger were computed simultaneously by numerically solving the energyequation in porous media. The computed blood flow in tissues is in agreement with the anatomical structure and the measurement. It is believedthat this analysis model will have extensive applications in the prediction of peripheral blood flow, temperature variation, and mass transport.� 2008 Elsevier Ltd. All rights reserved.
Keywords: Porous media; Blood perfusion; Finite element method; One-dimensional blood flow; Human finger; Image-based model; MR images
1. Introduction
Blood circulation performs an important function—to carryoxygen to the tissues and to remove carbon dioxide and othermetabolites from the tissues. Thus, blood circulation plays acrucial role in thermoregulation and mass transport. The quan-titative prediction of the relationship between hemodynamicsand heat and mass transfer is of great interest, because it is re-lated to human thermal comfort, drug delivery, and noninvasivemeasurement. For example, Cho et. al. [1] proposed a noninva-sive method for measuring glucose, where glucose is derivedby measuring heat generation, blood flow rate, and hemoglobinoxygenation in a person’s fingertip.
∗ Corresponding author at: Department of Modern Mechanics, Universityof Science and Technology of China, Mail Box 4, Hefei, Anhui 230027, PRChina. Tel./fax: +86 551 3602477.
E-mail address: [email protected] (Y. He).
0010-4825/$ - see front matter � 2008 Elsevier Ltd. All rights reserved.doi:10.1016/j.compbiomed.2008.02.002
Biological tissues contain blood and the surrounding mate-rials where blood is perfused to tissues via capillary network.The energy transport in tissues includes conduction in tissues,convection between blood and tissues, perfusion through mi-crovascular beds, and metabolic heat generation. Among these,the heat transfer between blood and tissues could be of thegreatest importance. The use of Pennes [2] bioheat equationis the most common method available to describe blood per-fusion in the tissue. However, this method cannot explain theconvection between large vessels and tissues but only explainthe uniform perfusion of blood to tissues.
Further, in another method, the spatial variations in the ar-terial, venous, and tissue temperatures are considered, and itincludes three equations that represent the heat transfer in ar-teries, veins, and tissues. This method was first presented byKeller and Seiler [3] and has been developed and used by manyother researchers [4–8]. These models are frequently applied indescribing the whole body thermal system.
556 Y. He et al. / Computers in Biology and Medicine 38 (2008) 555–562
Researchers also intend to analyze heat transfer in livingtissues by modeling the detailed countercurrent microvascu-lar network. Chen and Homes [9] presented a bioheat transfermodel that accounts for the thermally significant blood vessels.They treated the blood vessels as two groups—large vesselsand small vessels. Each vessel is treated separately in the for-mer group, whereas all vessels are treated as a part of a con-tinuum in the latter group. The thermal contributions of thesmall blood vessels were considered from the equilibration ofblood temperature, convection of the flowing blood, and thesmall temperature fluctuations of the nearly equilibrated blood.Weinbaum and Jiji [10] proposed an alternative model that ac-counts for the thermal effect of the directionality of the bloodvessels and the characteristic geometry of the blood vessel ar-rangement. The vascular structure in the periphery was treatedindividually rather than as continuum media in their three-layermodel. Brinck and Werner [11] presented a three-dimensionalthermal and vascular model in which the convective heat ex-change between the feeder vessels and tissue was computed bythe values for the Nusselt number, and the temperatures in andnear individual vessels were predicted. The thermally signifi-cant vessels were treated individually according to their distri-bution characteristics in different tissue layers.
From these modeling studies, it is evident that investigationof the thermal effects of large blood vessels and small vesselsis the most important aspect. However, due to the high densityand complex arrangement of microvessels, little informationabout vascular geometry can be obtained and the applicationsof the vascular models are limited for small volumes of tissue.Thus, it is of great importance to develop an easy-to-use modelfor describing the blood flow in different sizes of vessels.
On the other hand, a blood-perfused biological tissue can bedescribed as a porous medium in which the fluid phase rep-resents the blood and the surrounding tissue is represented bythe solid phase. The theory of porous media for heat trans-fer in living tissues may be the most appropriate since it candescribe the perfused blood with fewer assumptions as com-pared to other bioheat model [12]. Wulff [13] first dealt withthe living tissue as a porous medium and utilized the convec-tive term, including the Darcy velocity, to replace the bloodperfusion term in the bioheat equation. Xuan and Roetzel [14]used the transport theory through porous media to model thetissue–blood system. The blood and tissue were considered tobe in a non-equilibrium state and two energy equations wereused to express heat transfer in the blood phase and solid phase.The advantage of this model is that it includes the exact bloodperfusion in tissues, blood dispersion, and effective tissue con-ductivity and is considered to be appropriate for modeling ablood-perfused tissue. However, the flow in large blood ves-sels differs from the filtration flow through tissues and may beconsidered separately.
Mesh generation based on the realistic geometric model isalso of significance in performing thermal analysis in the livingtissue. Geometrical modeling and mesh generation based onmedical images (CT or MR images) are widely used in biofluidmechanics and biomechanics analysis [15,16]. The conven-tional steps to construct a computational model are image
processing, geometrical modeling, and mesh generation. Al-though the techniques in medical imaging and geometricalmodeling need to be integrated, the image-based modelingtechnique provides a rapid and valid method to model thethermofluid and mechanics problems in living tissues.
The purpose of this study is to model blood–tissue heat trans-fer according to the different characteristics of blood flow inlarge vessels and tissues. The systemic blood circulation in theupper limb has been modeled based on the one-dimensionalflow in an elastic tube, and the finite element (FE) model basedon the heat transport in porous media was developed to ana-lyze the blood perfusion and heat transport in the human finger.Further, the realistic geometric model for the human finger wasconstructed on the basis of MR image data. After computing thecapillary pressure and blood velocity in the tissue, the temper-atures of the large vessels and the finger tissue were computedsimultaneously by numerically solving the energy equation inthe porous media.
2. Modeling blood flow dynamics and heat transfer intissues
The basic insight in modeling blood flow is that the use ofdifferent models to simulate blood flow in large vessels (Thediameter is larger than or equal to 1 mm) and in microvessels.A non-linear one-dimensional flow model in an elastic tube isused to express blood flow in large vessels, whereas blood flowperfused in tissues is considered as the fluid phase in the porousmedia. The unified energy equation is used to model the heattransfer in large vessels and tissues.
2.1. Blood flow dynamics
The blood flow in large vessels has been modeled to bea one-dimensional flow in an elastic tube, and the gov-erning equations, including continuity and momentum, areexpressed as
�A
�t+ �q
�x= 0, (1)
�q
�t+ �
�x
(q2
A
)+ A
�
�P
�x= −2��r
�
q
A, (2)
where x is the distance from the heart, t is the time, A is thecross-sectional area of the blood vessel, q is the blood flowrate, P is the transmural pressure, � is the blood density, � isthe kinematic viscosity, � is the boundary-layer thickness, andr is the radius of the blood vessel.
The pressure–area relationship for the arteries and veins isas follows:
P(x, t) − P0 = 4
3
Eh
r0
(1 −
√A0
A
), (3)
p − p0 = kp
[1 −
(A
A0
)−3/2]
, (4)
Y. He et al. / Computers in Biology and Medicine 38 (2008) 555–562 557
where E is Young’s modulus, h is the wall thickness of theblood vessel, and kp is the coefficient that is proportional to thebending stiffness of the tube wall.
A periodic flow wave was assigned at the inlet boundary, anda constant pressure was assigned at the outlet. With regard tothe bifurcation conditions and the junction conditions betweentwo equivalent tubes, it is assumed that there is no leakage ofblood at the bifurcations, the inflow and outflow are balanced,and the pressure is continuous.
The two-step Lax–Wendroff method has been widely usedin analyzing blood flow of one-dimensional model [17–19]. Inorder to compute the blood flow rate and the variation of cross-sectional area, He et al. [20] employed the same scheme as thatin Zagzoule et al. [19]. The detailed numerical method can befound in the literature [20].
2.2. Darcy model and energy equation for biological tissues
The Darcy model is considered to be the earliest flow trans-port model in porous media and is expressed as
∇P = − �
Kv, (5)
where K is the permeability of the tissues, � is the viscosity,and v is the Darcy velocity.
Considering the continuity equation and momentum equa-tion, the dimensionless pressure in porous media is expressed as
�2P ∗
�x∗2 + �2P ∗
�y∗2 = 0. (6)
The dimensionless velocity is expressed as
u∗ = −Da Re�P ∗
�x∗ , (7)
v∗ = −Da Re�P ∗
�y∗ , (8)
where Da is the Darcy number and is expressed as
Da = K
D2 . (9)
According to the energy equation for the local equilibrium statebetween solid tissues and blood flow [23], the dimensionlessenergy equation can be expressed as follows:
�T ∗
�t∗+ �
[u∗ �T ∗
�x∗ + v∗ �T ∗
�y∗
]= 1
Pem
[�2T ∗
�x∗2 + �2T ∗
�y∗2
]
+ 1
Pem
q∗m, (10)
where Pem, �, and q∗m are expressed as follows:
Pem = U∞D
�m
, (11)
� = (�c)b
(�c)m, (12)
q∗m = qmD2
(Ta − T∞)km
. (13)
BloodCirculation
Model
PressureDistribution ofblood in tissues
Velocities ofBlood inTissues
Temperaturesin large vessels
and tissue
Pressure
Velocity
FE model
Fig. 1. Flow chart of the computational method.
Eq. (10) can be suitably applied for heat transport in bothlarge vessels and tissues. When it is applied to the heat transportin large vessels, both � and attain a value of 1.
Eqs. (6)–(8) and (10) have been discretized using the finiteelement method (FEM), and the finite element equation hasbeen developed using the Galerkin weighted residual method.First, the conjugate gradient (CG) method was employed tosolve Eq. (6). The value of the pressure in the large vesselswas obtained from the blood flow model and was assigned asthe boundary condition of Eq. (6). Second, the blood flow ve-locities in the tissues were computed. The slip condition wasemployed at the large vessel wall. Finally, the temperaturesin large vessels and tissues were computed simultaneously. Aconstant blood temperature condition was assigned to an in-let of a large artery in the finger. The heat transfer at theskin surface is due to heat convection, radiation, and evapo-ration. The flowchart of the computational method is shownin Fig. 1.
3. Geometrical modeling for the human finger from MRimages
Since we use a one-dimensional flow model to describe theblood flow in arteries and veins, the data for the initial cross-sectional area and the length of the blood vessel are required.The dimensions of larger vessels are from the data in litera-ture [17] and [18] where the data are obtained by anatomicalmeasurements. Since there are few available data for the di-mensions of smaller vessels, the data for this part in our modelare from the deduced data by Sheng et al. [17].
3.1. MR image acquisition
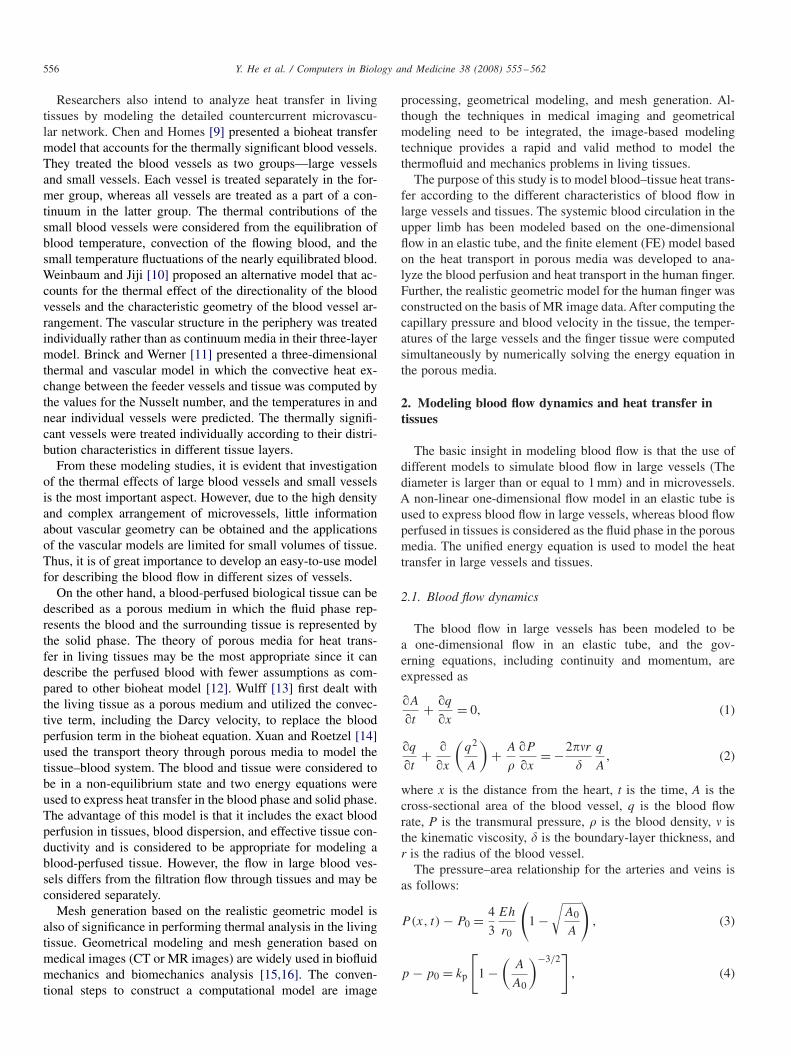
The original images were acquired for a volunteer’s finger.A hand-fitted supporter made of silicon rubber was producedin order to fix the volunteer’s hand before taking images. A1.5-T scanner (Excelart, Toshiba Medical Systems) was usedwith different sequence for taking the images of blood flowand different tissues. The image resolution is 128 × 128 and256 × 256, respectively, and the slice thickness was set to be1.5 mm. A circular coil whose diameter fitted the length ofthe volunteer’s finger was employed. Fig. 2a and b are theoriginal MR images of the finger in the vertical and lateraldirections, and Fig. 2c is the MR image of the blood flow inthe finger.
558 Y. He et al. / Computers in Biology and Medicine 38 (2008) 555–562
Fig. 2. (a) Original MR image of the human finger in the vertical direction; (b) original MR image of the human finger in the lateral direction; and (c) originalMR image of the blood flow in the human finger.
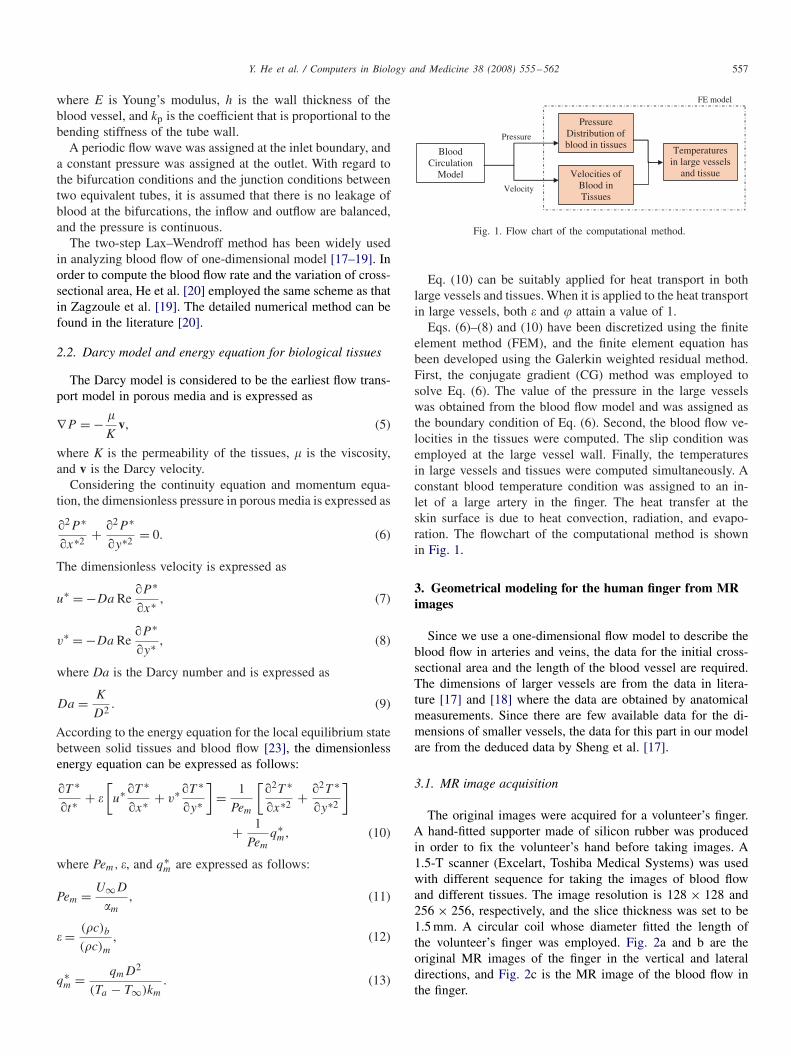
Fig. 3. The images of the human finger after image processing: (a) in thevertical direction and (b) in the lateral direction.
Table 1The text file of the MR image
0 0 0 0 0 0 0 16 260 0 0 0 0 4 23 40 540 0 0 0 5 24 46 59 670 0 0 4 21 43 63 72 680 0 2 17 33 57 69 72 62
3.2. Edge detection
In order to obtain the boundary of the finger, the originalimages were firstly processed by enhancing contrast and arith-metic subtracting through an image analysis program ScionImage [21]. Hence, an image only with the information of theobjected finger was acquired. Fig. 3a and b show the processedresults. Scion Image [21] has the function to export the imageas a text file, thus, the processed image can be exported as atext file where the brightness of each pixel in the image is ex-pressed in a matrix by color indices from 0 to 255. Table 1shows one part of the text file of the image in which the num-bers represent the brightness of every pixel. The area where thebrightness number is 0 represents the area outside the fingerand the area where the brightness number is not zero repre-sents the finger. The finger area can be known by identifyingthe pixels whose color indices are not zero.
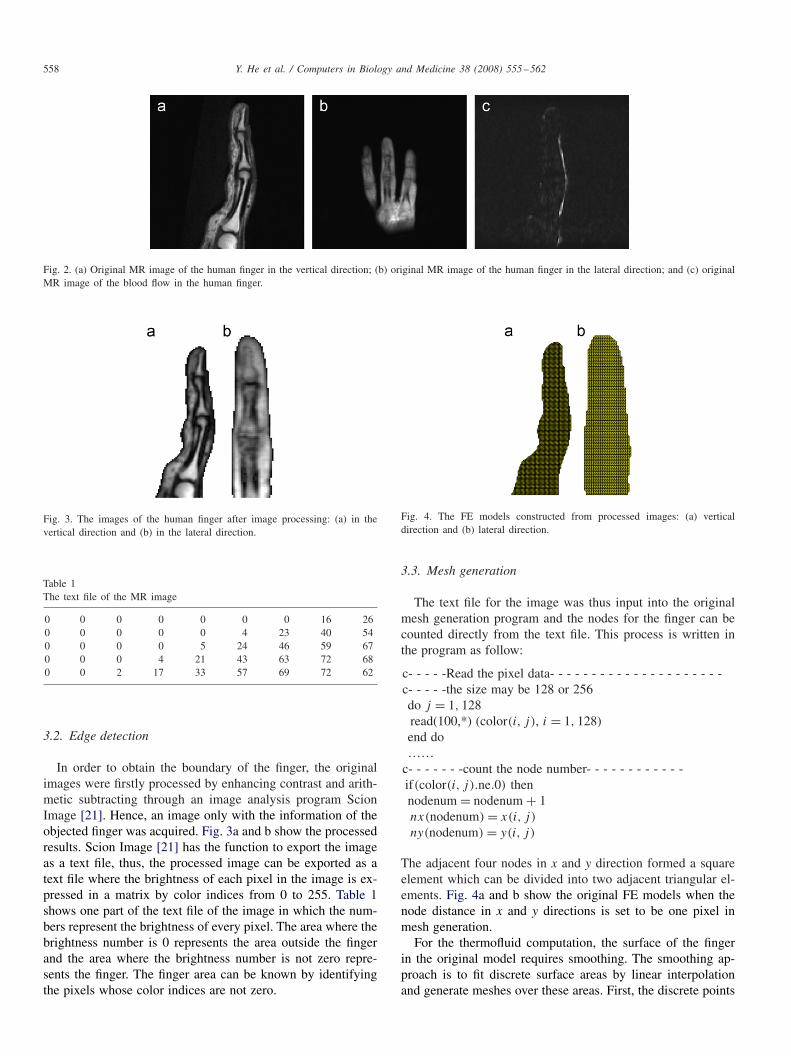
Fig. 4. The FE models constructed from processed images: (a) verticaldirection and (b) lateral direction.
3.3. Mesh generation
The text file for the image was thus input into the originalmesh generation program and the nodes for the finger can becounted directly from the text file. This process is written inthe program as follow:
c- - - - -Read the pixel data- - - - - - - - - - - - - - - - - - - - -c- - - - -the size may be 128 or 256do j = 1, 128read(100,*) (color(i, j), i = 1, 128)end do……
c- - - - - - -count the node number- - - - - - - - - - - -if(color(i, j).ne.0) thennodenum = nodenum + 1nx(nodenum) = x(i, j)
ny(nodenum) = y(i, j)
The adjacent four nodes in x and y direction formed a squareelement which can be divided into two adjacent triangular el-ements. Fig. 4a and b show the original FE models when thenode distance in x and y directions is set to be one pixel inmesh generation.
For the thermofluid computation, the surface of the fingerin the original model requires smoothing. The smoothing ap-proach is to fit discrete surface areas by linear interpolationand generate meshes over these areas. First, the discrete points
Y. He et al. / Computers in Biology and Medicine 38 (2008) 555–562 559
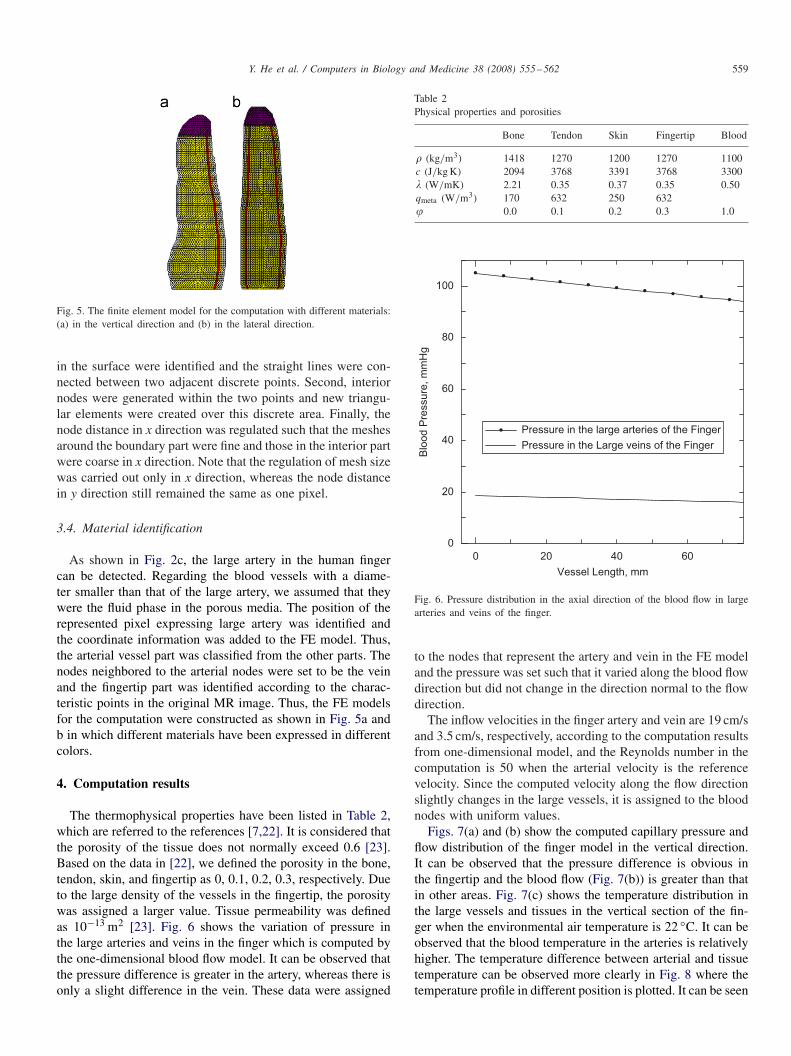
Fig. 5. The finite element model for the computation with different materials:(a) in the vertical direction and (b) in the lateral direction.
in the surface were identified and the straight lines were con-nected between two adjacent discrete points. Second, interiornodes were generated within the two points and new triangu-lar elements were created over this discrete area. Finally, thenode distance in x direction was regulated such that the meshesaround the boundary part were fine and those in the interior partwere coarse in x direction. Note that the regulation of mesh sizewas carried out only in x direction, whereas the node distancein y direction still remained the same as one pixel.
3.4. Material identification
As shown in Fig. 2c, the large artery in the human fingercan be detected. Regarding the blood vessels with a diame-ter smaller than that of the large artery, we assumed that theywere the fluid phase in the porous media. The position of therepresented pixel expressing large artery was identified andthe coordinate information was added to the FE model. Thus,the arterial vessel part was classified from the other parts. Thenodes neighbored to the arterial nodes were set to be the veinand the fingertip part was identified according to the charac-teristic points in the original MR image. Thus, the FE modelsfor the computation were constructed as shown in Fig. 5a andb in which different materials have been expressed in differentcolors.
4. Computation results
The thermophysical properties have been listed in Table 2,which are referred to the references [7,22]. It is considered thatthe porosity of the tissue does not normally exceed 0.6 [23].Based on the data in [22], we defined the porosity in the bone,tendon, skin, and fingertip as 0, 0.1, 0.2, 0.3, respectively. Dueto the large density of the vessels in the fingertip, the porositywas assigned a larger value. Tissue permeability was definedas 10−13 m2 [23]. Fig. 6 shows the variation of pressure inthe large arteries and veins in the finger which is computed bythe one-dimensional blood flow model. It can be observed thatthe pressure difference is greater in the artery, whereas there isonly a slight difference in the vein. These data were assigned
Table 2Physical properties and porosities
Bone Tendon Skin Fingertip Blood
� (kg/m3) 1418 1270 1200 1270 1100c (J/kg K) 2094 3768 3391 3768 3300 (W/mK) 2.21 0.35 0.37 0.35 0.50qmeta (W/m3) 170 632 250 632 0.0 0.1 0.2 0.3 1.0
0 20 40 600
20
40
60
80
100
Blo
od P
ress
ure,
mm
Hg
Vessel Length, mm
Pressure in the large arteries of the FingerPressure in the Large veins of the Finger
Fig. 6. Pressure distribution in the axial direction of the blood flow in largearteries and veins of the finger.
to the nodes that represent the artery and vein in the FE modeland the pressure was set such that it varied along the blood flowdirection but did not change in the direction normal to the flowdirection.
The inflow velocities in the finger artery and vein are 19 cm/sand 3.5 cm/s, respectively, according to the computation resultsfrom one-dimensional model, and the Reynolds number in thecomputation is 50 when the arterial velocity is the referencevelocity. Since the computed velocity along the flow directionslightly changes in the large vessels, it is assigned to the bloodnodes with uniform values.
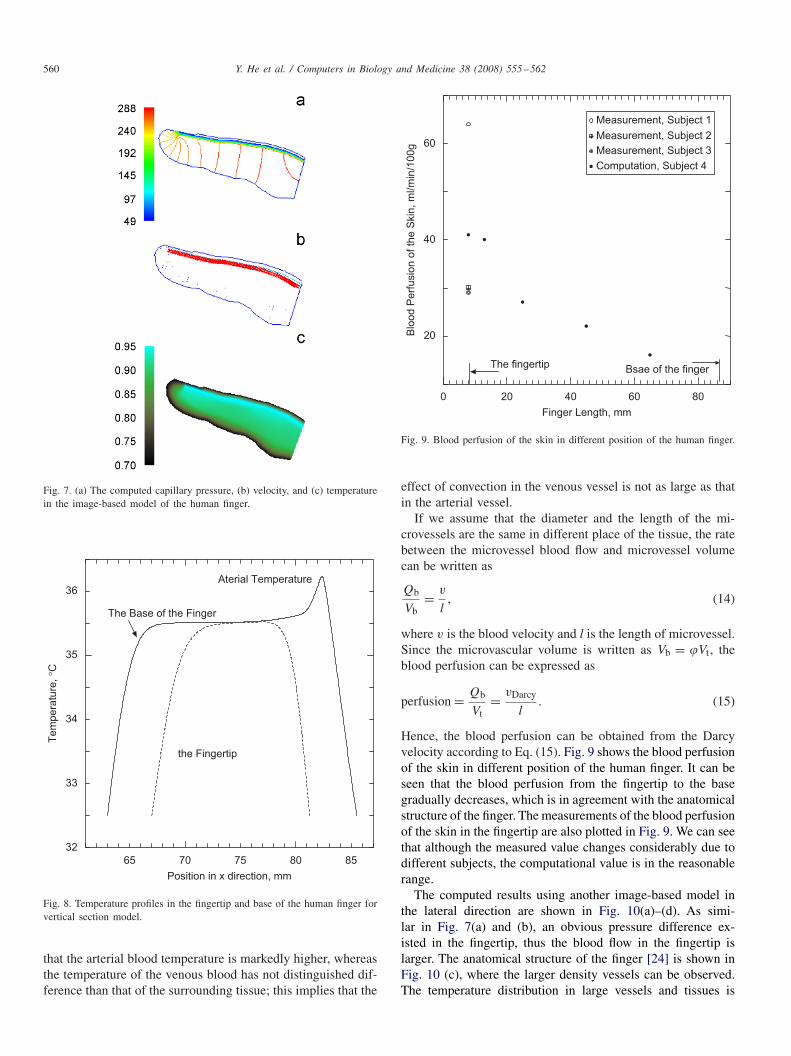
Figs. 7(a) and (b) show the computed capillary pressure andflow distribution of the finger model in the vertical direction.It can be observed that the pressure difference is obvious inthe fingertip and the blood flow (Fig. 7(b)) is greater than thatin other areas. Fig. 7(c) shows the temperature distribution inthe large vessels and tissues in the vertical section of the fin-ger when the environmental air temperature is 22 ◦C. It can beobserved that the blood temperature in the arteries is relativelyhigher. The temperature difference between arterial and tissuetemperature can be observed more clearly in Fig. 8 where thetemperature profile in different position is plotted. It can be seen
560 Y. He et al. / Computers in Biology and Medicine 38 (2008) 555–562
Fig. 7. (a) The computed capillary pressure, (b) velocity, and (c) temperaturein the image-based model of the human finger.
65 70 75 80 8532
33
34
35
36
Position in x direction, mm
Tem
pera
ture
, °C
Aterial Temperature
The Base of the Finger
the Fingertip
Fig. 8. Temperature profiles in the fingertip and base of the human finger forvertical section model.
that the arterial blood temperature is markedly higher, whereasthe temperature of the venous blood has not distinguished dif-ference than that of the surrounding tissue; this implies that the
0 20 40 60 80
20
40
60
Finger Length, mmB
lood
Per
fusi
on o
f the
Ski
n, m
l/min
/100
g
Measurement, Subject 1Measurement, Subject 2Measurement, Subject 3Computation, Subject 4
Bsae of the fingerThe fingertip
Fig. 9. Blood perfusion of the skin in different position of the human finger.
effect of convection in the venous vessel is not as large as thatin the arterial vessel.
If we assume that the diameter and the length of the mi-crovessels are the same in different place of the tissue, the ratebetween the microvessel blood flow and microvessel volumecan be written as
Qb
Vb= v
l, (14)
where v is the blood velocity and l is the length of microvessel.Since the microvascular volume is written as Vb = Vt , theblood perfusion can be expressed as
perfusion = Qb
Vt= vDarcy
l. (15)
Hence, the blood perfusion can be obtained from the Darcyvelocity according to Eq. (15). Fig. 9 shows the blood perfusionof the skin in different position of the human finger. It can beseen that the blood perfusion from the fingertip to the basegradually decreases, which is in agreement with the anatomicalstructure of the finger. The measurements of the blood perfusionof the skin in the fingertip are also plotted in Fig. 9. We can seethat although the measured value changes considerably due todifferent subjects, the computational value is in the reasonablerange.
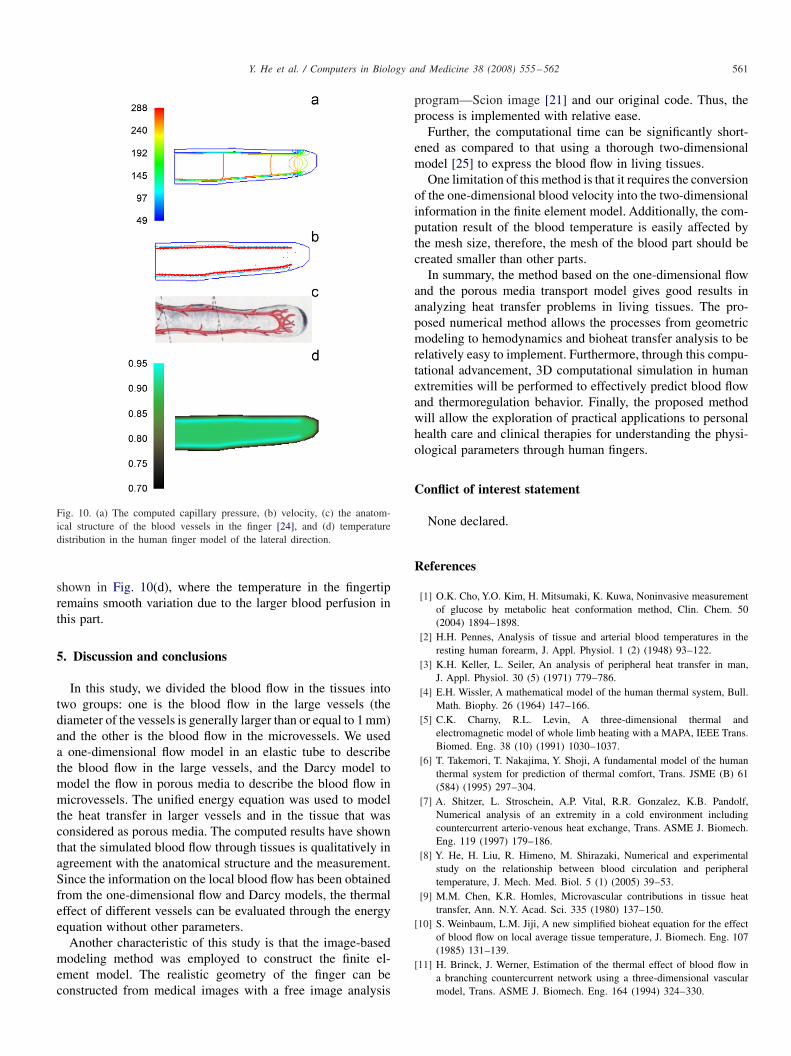
The computed results using another image-based model inthe lateral direction are shown in Fig. 10(a)–(d). As simi-lar in Fig. 7(a) and (b), an obvious pressure difference ex-isted in the fingertip, thus the blood flow in the fingertip islarger. The anatomical structure of the finger [24] is shown inFig. 10 (c), where the larger density vessels can be observed.The temperature distribution in large vessels and tissues is
Y. He et al. / Computers in Biology and Medicine 38 (2008) 555–562 561
Fig. 10. (a) The computed capillary pressure, (b) velocity, (c) the anatom-ical structure of the blood vessels in the finger [24], and (d) temperaturedistribution in the human finger model of the lateral direction.
shown in Fig. 10(d), where the temperature in the fingertipremains smooth variation due to the larger blood perfusion inthis part.
5. Discussion and conclusions
In this study, we divided the blood flow in the tissues intotwo groups: one is the blood flow in the large vessels (thediameter of the vessels is generally larger than or equal to 1 mm)and the other is the blood flow in the microvessels. We useda one-dimensional flow model in an elastic tube to describethe blood flow in the large vessels, and the Darcy model tomodel the flow in porous media to describe the blood flow inmicrovessels. The unified energy equation was used to modelthe heat transfer in larger vessels and in the tissue that wasconsidered as porous media. The computed results have shownthat the simulated blood flow through tissues is qualitatively inagreement with the anatomical structure and the measurement.Since the information on the local blood flow has been obtainedfrom the one-dimensional flow and Darcy models, the thermaleffect of different vessels can be evaluated through the energyequation without other parameters.
Another characteristic of this study is that the image-basedmodeling method was employed to construct the finite el-ement model. The realistic geometry of the finger can beconstructed from medical images with a free image analysis
program—Scion image [21] and our original code. Thus, theprocess is implemented with relative ease.
Further, the computational time can be significantly short-ened as compared to that using a thorough two-dimensionalmodel [25] to express the blood flow in living tissues.
One limitation of this method is that it requires the conversionof the one-dimensional blood velocity into the two-dimensionalinformation in the finite element model. Additionally, the com-putation result of the blood temperature is easily affected bythe mesh size, therefore, the mesh of the blood part should becreated smaller than other parts.
In summary, the method based on the one-dimensional flowand the porous media transport model gives good results inanalyzing heat transfer problems in living tissues. The pro-posed numerical method allows the processes from geometricmodeling to hemodynamics and bioheat transfer analysis to berelatively easy to implement. Furthermore, through this compu-tational advancement, 3D computational simulation in humanextremities will be performed to effectively predict blood flowand thermoregulation behavior. Finally, the proposed methodwill allow the exploration of practical applications to personalhealth care and clinical therapies for understanding the physi-ological parameters through human fingers.
Conflict of interest statement
None declared.
References
[1] O.K. Cho, Y.O. Kim, H. Mitsumaki, K. Kuwa, Noninvasive measurementof glucose by metabolic heat conformation method, Clin. Chem. 50(2004) 1894–1898.
[2] H.H. Pennes, Analysis of tissue and arterial blood temperatures in theresting human forearm, J. Appl. Physiol. 1 (2) (1948) 93–122.
[3] K.H. Keller, L. Seiler, An analysis of peripheral heat transfer in man,J. Appl. Physiol. 30 (5) (1971) 779–786.
[4] E.H. Wissler, A mathematical model of the human thermal system, Bull.Math. Biophy. 26 (1964) 147–166.
[5] C.K. Charny, R.L. Levin, A three-dimensional thermal andelectromagnetic model of whole limb heating with a MAPA, IEEE Trans.Biomed. Eng. 38 (10) (1991) 1030–1037.
[6] T. Takemori, T. Nakajima, Y. Shoji, A fundamental model of the humanthermal system for prediction of thermal comfort, Trans. JSME (B) 61(584) (1995) 297–304.
[7] A. Shitzer, L. Stroschein, A.P. Vital, R.R. Gonzalez, K.B. Pandolf,Numerical analysis of an extremity in a cold environment includingcountercurrent arterio-venous heat exchange, Trans. ASME J. Biomech.Eng. 119 (1997) 179–186.
[8] Y. He, H. Liu, R. Himeno, M. Shirazaki, Numerical and experimentalstudy on the relationship between blood circulation and peripheraltemperature, J. Mech. Med. Biol. 5 (1) (2005) 39–53.
[9] M.M. Chen, K.R. Homles, Microvascular contributions in tissue heattransfer, Ann. N.Y. Acad. Sci. 335 (1980) 137–150.
[10] S. Weinbaum, L.M. Jiji, A new simplified bioheat equation for the effectof blood flow on local average tissue temperature, J. Biomech. Eng. 107(1985) 131–139.
[11] H. Brinck, J. Werner, Estimation of the thermal effect of blood flow ina branching countercurrent network using a three-dimensional vascularmodel, Trans. ASME J. Biomech. Eng. 164 (1994) 324–330.
562 Y. He et al. / Computers in Biology and Medicine 38 (2008) 555–562
[12] A.R.A. Khaled, K. Vafai, The role of porous media in modeling flowand heat transfer in biological tissues, Int. J. Heat Mass Transfer 46(2003) 4989–5003.
[13] W. Wulff, The energy conservation equation for living tissue, IEEETrans. Biomed. Eng. 1974, 494–495.
[14] Y.M. Xuan, W. Roetzel, Bioequation of the human thermal system,Chem. Eng. Technol. 20 (1997) 269–276.
[15] Image-based biomechanics, Trans. JSME (A) 70(697) (2004) (specialissue) (Japanese).
[16] J.R. Cebral, R. Löhner, From medical images to anatomically accuratefinite element grids, Int. J. Numer. Meth. Eng. 51 (2001) 985–1008.
[17] C. Sheng, S.N. Sarwal, K.C. Watts, A.E. Marble, Computationalsimulation of blood flow in human systemic circulation incorporatingan external force field, Med. Biol. Eng. Comput. 33 (1995) 8–17.
[18] M.S. Olufsen, C.S. Peskin, W.Y. Kim, E.R. Pedersen, A. Nadim,J. Larsen, Numerical simulation and experimental validation of bloodflow in arteries with structured-tree outflow conditions, Ann. Biomed.Eng. 28 (2000) 1281–1299.
[19] M. Zagzoule, J. Marc-Vergnes, A global mathematical model of thecerebral circulation in man, J. Biomech. 19 (12) (1986) 1015–1022.
[20] Y. He, H. Liu, R. Himeno, A one-dimensional thermo-fluid model ofblood circulation in the human upper limb, Int. Heat Mass Transfer 47(2004) 2735–2745.
[21] 〈http://www.scioncorp.com/〉.[22] H.S. Kou, T.C. Shih, W.L. Lin, Effect of the directional blood flow on
thermal dose distribution during thermal therapy: an application of aGreen’s function based on the porous model, Phys. Med. Biol. 48 (2003)1577–1589.
[23] D.A. Nield, A. Bejan, Convection in Porous Media, second ed., Springer,Berlin, 1998.
[24] K. Hirasawa, Anatomy: Angiology. Neurology, 1982, vol. 2, KaneharaCo. Ltd., p. 66 (in Japanese).
[25] Y. He, M. Shirazaki, R. Himeno, A finite element model for determiningthe effects of blood flow on the finger temperature distribution, in:Proceedings of the Sixth ASME-JSME Thermal Joint Conference,Hawaii, TED-AJ03-166, 2003.
Y. He received her B.E. (1989) and M.E. (1992) degrees from Dalian Univer-sity of Technology, China, and the D.E. degree (1999) from The University ofTokyo, Japan. She works as a professor of Department of Modern Mechan-ics, University of Science and Technology of China. Her research interestsinclude numerical and experimental studies of blood flow and heat transferin living tissues.
H. Liu received his B.S. degree (1985) from Dalian University of Technology,China, and completed his M.S.E. (1989) and Ph.D. (1992) from YokohamaNational University, Japan. He is a professor of the Department of Electronicsand Mechanical Engineering in Chiba University. His research interests focuson computational fluid dynamics, biological fluid dynamics, physiologicalfluid dynamics, and image-based modeling of cardiovascular arterial vessels.
R. Himeno received his B.E. (1977) and M.E. (1979) degrees from KyotoUniversity and received the D.E. degree (1989) from The University ofTokyo. He is the unit leader of the Computational Biomechanics Unit andthe director of the Advanced Center for Computing and Communication,RIKEN. His current interests include computational biomechanics simulationand structure-fluid coupled simulation.
J. Sunaga received her B.A. (2003) and M.A. (2005) degrees from NihonUniversity, Japan. She works as a contract researcher at the ComputationalCell Biomechanics team of V-CAD system program RIKEN. Her interest isexperimental analysis on the internal structure of biological sample.
N. Kakusho received his B.A. (1995) and M.A. (1997) degrees from NihonUniversity, Japan. He works as a contract researcher at the ComputationalBiomechanics Unit, RIKEN. He is interested in analyzing the internal structureof biological sample.
H. Yokota received his B.A. (1991) and M.A. (1993) degrees from NihonUniversity and received the D.E. degree (1999) from The University ofTokyo. He is the team leader of the Bio-research Infrastructure ConstructionTeam and the contract researcher of the Computational Biomechanics Unit,RIKEN. His current interests include computational biomechanics simulationand structure modeling for industrial product and biological sample.