Fingrid Oyj, Investor Presentation December 2014
73
Finland's Transmission System Operator December 2014
-
Upload
fingrid-oyj -
Category
Economy & Finance
-
view
355 -
download
4
Transcript of Fingrid Oyj, Investor Presentation December 2014

Finland's Transmission System Operator
December 2014
Disclaimer
These materials have been prepared based upon information that Fingrid Oyj believes to be reliable. Market data presented is based on the
information and belief of Fingrid Oyj's management and has not been independently verified. Certain data in this presentation was obtained from
various external data sources and Fingrid Oyj has not verified such data with independent sources. Such data involves risks and uncertainties and is
subject to change based on various factors. Fingrid Oyj makes no representation or warranty, express or implied, as to the accuracy or completeness
of the information contained in these materials and accordingly, Fingrid Oyj accepts no responsibility or liability (in negligence or otherwise) for the
information contained herein.
These materials may contain forward-looking statements. These forward-looking statements are based on management’s current expectations and
beliefs, as well as a number of assumptions concerning future events. These statements are subject to risks, uncertainties, assumptions and other
important factors, many of which are outside management’s control, that could cause actual results to differ materially from the results discussed in
the forward-looking statements. You should not place undue reliance on these forward-looking statements, which speak only as of the date of this
presentation.
Fingrid Oyj assumes no obligation to, and expressly disclaims any obligation to, update or revise any forward-looking statements, whether as a result
of new information, future events or otherwise.
The circulation of these materials may, in certain countries, be subject to specific regulation and the person(s) in possession of this presentation
should observe such restrictions.
Nothing in these materials shall constitute or form part of any legal agreement, or any offer to sell or the solicitation of any offer to buy any securities
or notes issued under Fingrid Oyj's commercial paper or medium term note programs.
2
12.12.2014
Executive summary 3
Company overview 7
Operations 17
Operating environment 45
Financials 54
Ratings 70
Executive summary
3
12.12.2014

Fingrid is the sole transmission system operator (TSO) in Finland
Fingrid transmits in
its own network
approximately 75%
of electricity
consumed in Finland
Fingrid manages
cross-border
connections between
Finland and Russia,
Sweden, Norway and
Estonia
Fingrid continuously
ensures power
system production
and consumption
balance in Finland
4
12.12.2014

Fingrid's network the covers entire of Finland
Revenue: MEUR 543
Net profit: MEUR 86
Total assets: MEUR 2 182
Total debt: MEUR 1 293
Personnel: 287
14 300 km of power lines
113 substations
935 MW of reserve power
Note: All figures in 2013
Note: All figures in 2013
5
12.12.2014

Key investment considerations
Efficiency Fingrid is one of the most cost efficient TSOs worldwide
Ownership The Finnish state owns 53% and Finnish financial institutions 47%
Regulation Finland has a stable and predictable cost plus regulatory model
Operating model Construction and maintenance of the network is outsourced
Rating Fingrid benefits from A+/A1/A ratings from the three main agencies
Fingrid provides a solid long term investment in a stable operating environment
Financials Continuously improved operating profitability in past three years
6
12.12.2014

Company overview
Executive summary 3
Company overview 7
Operations 17
Operating environment 45
Financials 54
Ratings 70
7
12.12.2014

Fingrid delivers. Responsibly
• VisionForerunner in transmission system operation
• MissionWe work for the benefit of our customers and
the Finnish society:
– We transmit electricity reliably
– We promote the electricity market actively
– We develop the transmission system
with a long time span
• Values
– Transparency
– Impartiality
– Efficiency
– Responsibility
8
12.12.2014

Balanced vision for the benefit of customers and society
9
12.12.2014

Fingrid's performance measurement metrics
10
12.12.2014

Fingrid operates in a matrix organisation structure
Fully implemented matrix structure ensures efficient strategy implementation and personnel engagement
Executive management team
is highly regarded in the
Finnish business community
77% of Fingrid's personnel
holds an academic degree*
* Full-time and permanent at the end of 2013
11
12.12.2014

For the benefit of customers and society – key operational targets
Operational targets are centered around cost competitiveness and customer service
19%
Finland + Sweden 225 TWh/a
Finland 84 TWh/a
Outages caused by faults in the grid Congestion hours between Finland and Sweden 2013
€/MWh
Customer satisfaction
0
2
4
6
8
10
2006 2007 2008 2009 2010 2011 2012 2013
456789
10
2004 2006 2008 2009 2010 2011 2012 2013
0
10
20
Min Fingrid Average Max
ENTSO-E tariff comparison 2013
European
peersGra
de
min
/ y
ear
/
connection p
oin
t
Functioning electricity marketReliable electricity
Affordable tariffsHigh quality services
12
12.12.2014

Responsibility is part of our values, strategy and everything we do
• Fingrid's corporate responsibility
management is founded on the
company's strategy– Focus on materiality
– Systematic and target-oriented approach
– Engagement of the personnel
• We report on responsibility as part of the
annual report. – We give as clear and comparable image
as possible of the main impact our operations
– We apply the international Global Reporting Initiative (GRI) reporting guidelines
Huutokoski - Alapitkä transmission line
Our operations and corporate responsibility is guided by the company's Code of Conduct
13
12.12.2014

Fingrid has achieved its core strategic goals in 2011 - 2014
2011 2014
Fingrid has a proven track record of continuously executing its defined strategy
MEUR 91 (full year 2013)
Efficiency High benchmark study rankings High benchmark study rankings
Investments On schedule and budget On schedule and budget
Net profit * MEUR 33
* IFRS
Dividend MEUR 7
Tariff Below regulatory allowed
MEUR 82 (paid in 2014)
Maximum regulatory allowed+ > 60%
14
12.12.2014

18,8 %
33,3 %
33,3 %
Legal structure
Finextra Oy eSett Oy
Nord Pool Spot AS
Porvoon Alueverkko
Oy
100 %
Fingrid Oyj
Peak load capacity and guarantee
of origin service and other services
not part of the grid service
operations
Balance settlement process on
behalf of Nordic TSOs
Power market operations for day-
ahead and intraday markets
Regional electricity distribution
15
12.12.2014
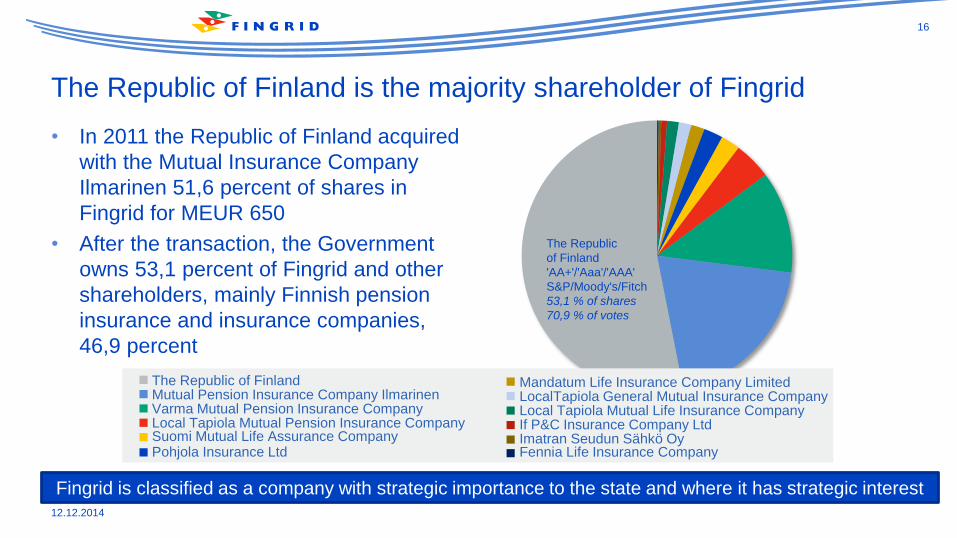
The Republic
of Finland
'AA+'/'Aaa'/'AAA'
S&P/Moody's/Fitch
53,1 % of shares
70,9 % of votes
• In 2011 the Republic of Finland acquired
with the Mutual Insurance Company
Ilmarinen 51,6 percent of shares in
Fingrid for MEUR 650
• After the transaction, the Government
owns 53,1 percent of Fingrid and other
shareholders, mainly Finnish pension
insurance and insurance companies,
46,9 percent
Fennia Life Insurance CompanyImatran Seudun Sähkö OyIf P&C Insurance Company LtdLocal Tapiola Mutual Life Insurance CompanyLocalTapiola General Mutual Insurance CompanyMandatum Life Insurance Company Limited
Pohjola Insurance LtdSuomi Mutual Life Assurance CompanyLocal Tapiola Mutual Pension Insurance CompanyVarma Mutual Pension Insurance CompanyMutual Pension Insurance Company IlmarinenThe Republic of Finland
Fingrid is classified as a company with strategic importance to the state and where it has strategic interest
The Republic of Finland is the majority shareholder of Fingrid
16
12.12.2014

Operations
Description of operationsExecutive summary 3
Company overview 7
Operations 17
Description of operations 17
Efficiency of operations 25
Earnings model 31
Tariffs 35
Capex 41
Operating environment 45
Financials 54
Ratings 70
17
12.12.2014

Fingrid owns and operates the transmission network in Finland
Approximately 75% of
electricity consumed in
Finland is transmitted via
Fingrid's network
Fingrid's 400 kV power lines form the backbone of the transmission network in Finland
Fingrid is a part of ENTSO-E,
European Network of
Transmission System
Operators for Electricity.
18
12.12.2014

Transmission network client base consists of approximately 120 entities
• Customers comprise mainly of electricity
producers, process industry and
distribution network companies
• Fingrid is obliged to provide its
customers a network connection point
• A grid service agreement with customers
will be renewed by 2016
• Credit quality of customer base is strong
Ten largest customers account for 61 percent of the transmission network client base
Top 10 customers by revenue
Caruna;17%
EPV Alueverkko; 9%
UPM Sähkönsiirto; 8%
Elenia; 7%
Stora Enso; 5%Helen;
5%
Teollisuuden Voima;
3%
Savon Voima verkko;
3%
Porvoon Alueverkko; 2%
Tampereen Sähköverkko; 2%
Others; 39%
19
12.12.2014

Fingrid continuously maintains production and consumption balance
• Fingrid fulfills responsibility to maintain real time balance in all market conditions
• Holders of electricity production and loads can submit bids to the balancing market concerning their capacity
• Fingrid has created a common Nordic balancing market together with other TSOs in the region
• Fingrid's core task is to ensure network functionality with automatic and manual reserves in imbalance situations
Fingrid procures the needed amount of reserve capacity to maintain the balance of the power system
State of the power system
Source: http//www.fingrid.fi
20
12.12.2014

Fingrid has a coupling to the electricity market through the balancing market
Real time
activation
(of the reserves)
Hours beforeDay ahead
Balancing
(reserve)
market
Electricity exchange System operator
Delivery
Financial products
Futures/ Forwards/
Options
10 years
ahead
ELBASELSPOT
Today and
tomorrow:
"1 hour before
operating hour"
Physical products
"Tomorrow"
Imbalance
power
Physical products
Fingrid acts as the single buyer for electricity during the hour of delivery
”This week
and the next
weeks”
Past time
Imbalance
settlement after
delivery
Well ahead
21
12.12.2014

Fingrid is responsible for the imbalance power settlement after delivery
• Each party operating in the electricity
market is financially responsible for an
hourly power balance between its
electricity production and consumption.
Fingrid balances the differences between
estimated and actual production and
consumption
• After the actual power production or
consumption has taken place, Fingrid
settles the imbalance with market parties
• A joint service company eSett, owned by
TSOs in Finland, Sweden and Norway, is
established for balance settlement
Establishment of eSett – a joint service company
Imbalance settlement in Finland, Sweden and Norway will be done by eSett, a joint service company
12/18/2013 11:15 AM - Current News, Electricity Market, Power System
With the establishment of the joint service company eSett Oy, the
Transmission System Operator Fingrid, Statnett and Svenska Kraftnät
have taken a big step towards the establishment of a Nordic balance
settlement. The new company has the objective of providing balance
settlement services to participants of electricity markets in Finland,
Norway and Sweden from the second half of 2015 dependent on
regulatory changes and a subsequent preparation period for the market
players. The company aims to lower the entry barriers for the market
parties in Finland, Norway and Sweden through equal and shared
settlement rules. This will increase competition in the electricity markets
in these countries, reduce long term costs for the market parties and
pave the way for the establishment of a Nordic end-user market.
Source: http//www.fingrid.fi
22
12.12.2014

Fingrid's back up power plant portfolio
400 kV power line
Substation
Fingrid's own reserve
power plant
Reserve power plant,
contracted capacity
Planned 400 kV power line
Fingrid's own back up power plants ensure reliable activation of reserves in disturbance situations
Fingrid owns an assortment of backup power plants
• Fingrid owns 935 MW of back up power
plants and leases further 295 MW. All
power plants can be activated within few
minutes
• Back up power plants are not used for
commercial operations in wholesale
market but solely in network disturbance
situations
• Fingrid's own power plants are included
to the regulatory asset base
• The total capacity of back up power
plants comfortably exceeds the capacity
of the largest power plant in the network
23
12.12.2014

Reliability of the Finnish power system
• The power system has to withstand a
fault in any individual component (N-1)
• The main reasons for disturbances have
been lightning and other weather related
incidents (storms)
• Major part of the disturbances are
cleared with automatic reclosure
schemes without any manual switching
operations
• The average duration of the connection
point outages is usually a couple of
minutes per year
Transmission reliability
The reliability of the Finnish power system is top class
24
12.12.2014

Operations
Efficiency of operationsExecutive summary 3
Company overview 7
Operations 17
Description of operations 17
Efficiency of operations 25
Earnings model 31
Tariffs 35
Capex 41
Operating environment 45
Financials 54
Ratings 70
25
12.12.2014

Key efficiency drivers
Outsourced
operating model
Highly centralised
operations
Single IT platform for
asset management
(being implemented)
Fingrid's excellence in ITAMS and ITOMS benchmark studies reflect highly efficient operating model
26
12.12.2014

Outsourced network construction and maintenance
• Core feature of Fingrid's operating model
is outsourcing
• Network construction and maintenance
as well as substation and secondary
equipment maintenance is outsourced
• Regional maintenance is tendered
among external service providers
• Fingrid's network is currently maintained
by six service providers operating in the
Nordic region
High operational efficiency is achieved through comprehensive outsourcing
Network maintenance is outsourced
27
12.12.2014

Fingrid uses qualified suppliers only
• A defined qualification process* for
equipment suppliers, service providers
and contractors
• An evaluation process of new suppliers
is done annually
• Only qualified suppliers in Fingrid's
supplier register are invited to bid for
outsourced works
• Sustainability audits are conducted
among suppliers
• Suppliers must comply with Fingrid's
Supplier Code of Conduct
Prequalification of suppliers ensures efficient tendering process of outsourced works
Hyvinkää – Hikiä transmission line construction site
Note: * In accordance with the EU based public procurement legislation for the sector
28
12.12.2014

Fingrid is implementing a new enterprise asset management platform
• Increasing operative efficiency
– Increasing proactivity in calculations,
monitoring and maintenance
• Single source for power system
information
– Improving information access and
usability within stakeholders
• Adding cost aspect to operation and
power system components
– Enhanced business planning through
cost operational analytics
• System utilization and further
development (2015- )
A single asset management platform will further strengthen Fingrid's operational excellence
For a quick overview of the ELVIS asset management solution see video at:
http://www.youtube.com key in BMM99tIYFBw
Fingrid's conductors would reach around the globe 2,5 x
29
12.12.2014

Fingrid's efficient operations are highly recognized
• Excellent results from international
benchmark studies
• Fingrid has continuously been one of the
top performing companies in the
International Transmission Operations
and Maintenance Study (ITOMS)
• Fingrid ranked second best in the latest
International Transmission Asset
Management Study (ITAMS)
• Fingrid was "exceptionally efficient" in
2013 in a study done for the Council of
European Energy Regulators (CEER)
• In 2013 Fingrid's asset management
again received Publicly Available
Specification PAS 55 certificate
Fingrid holds the PAS 55 certificate and as achieved excellent success in ITAMS and ITOMS studies
PAS 55 is the British Standards Institution's (BSI) Publicly Available
Specification for the optimized management of physical assets - it
provides clear definitions and a 28-point requirements specification for
establishing and verifying a joined-up, optimized and whole-life
management system for all types of physical assets. Now internationally
recognized, PAS 55 is proving to be an essential, objective definition of
what is required to demonstrate competence, establish improvement
priorities and make better, clearer connections between strategic
organizational plans and the actual day-to-day work and asset realities.
Source: http//:pas55.net
Publicly Available Specification (PAS)
30
12.12.2014

Operations
Earnings modelExecutive summary 3
Company overview 7
Operations 17
Description of operations 17
Efficiency of operations 25
Earnings model 31
Tariffs 35
Capex 41
Operating environment 45
Financials 54
Ratings 70
31
12.12.2014

Fingrid's allowed return is driven by regulated WACC and asset base
Fingrid aims to equal adjusted profit and allowed return
EBIT
Incentives
Taxes
Adjusted profit
Regulated replacement value
of asset base
WACC
Allowed return
=
≥
=
x
Other
AdjustmentsInterest
expenses are
excluded in the
regulatory P&L
Incentives not
having material
impact on
adjusted profit
32
12.12.2014

Calculation of WACC in the regulatory period 2012-2015
The core parameter defining yearly WACC is the yield of the Republic of Finland's 10 year bond
Cost of equity
Cost of debt
WACC (post tax)
Parameter Value to be applied
Real risk-free rate (Rr) Interest of 10-year Finnish
government bond* less
inflation component
Inflation component 1,0%
Asset beta (βdebt free) 0,4
Market risk premium
(Rm- Rf)
5,0%
Liquidity premium (LP) 0,5%
Capital structure
(D/E)
60/40
Risk premium of debt (DP) 1,0%
Tax rate (t) 20% (from 2014)
* Average of May in the previous year
CE= Rr + βdebt free x (1+ (1- t) x D/E) x (Rm - Rf) + LP
CE= Finnish 10y bond - 1% + 0,4 x (1 + (1-20%) x 60/40) x 5% + 0,5%
CE = Finnish 10y bond + 3,9%
CD= Rr + DP
CD= Finnish 10y bond - 1% + 1%
CD= Finnish 10y bond
WACCpost-tax = CE x 40/100 + CD x (1- t) x 60/100
WACCpost-tax = (Finnish 10y bond + 3,9%) x 40/100 +
(Finnish 10y bond x (1-20%) x 60/100
WACCpost-tax = Finnish 10y bond x 0,88 + 1,56%
33
12.12.2014

Calculating the reasonable return in euros: WACC x adjusted capital
• Reasonable return in euros is calculated
as follows:
R post-tax= WACCpost-tax x (D+E )
E = adjusted amount of equity
D = adjusted amount of interest-bearing debt
• Adjusted assets equal to the sum of
adjusted amount of equity and debt
• The equalisation item in the equity
section of balance sheet balances
adjusted assets with adjusted equity and
liabilities
Balance sheet values of electricity network assets are converted to replacement value to calculate return
Calculating adjusted balance sheet
Adjusted assets Adjusted liabilities
Regulated replacement
value of the electricity
network
Other
Inventories
Trade receivables
Interest bearing debt
Other
Adjusted equity
Equity
Equalisation item of
adjusted balance sheet
34
12.12.2014

Operations
TariffsExecutive summary 3
Company overview 7
Operations 17
Description of operations 17
Efficiency of operations 25
Earnings model 31
Tariffs 35
Capex 41
Operating environment 45
Financials 54
Ratings 70
35
12.12.2014

Grid service tariff is applied on both consumption and production
Tariffs EUR/MWh 2015
Consumption, winter period 4,10
Consumption, other times 2,05
Use of grid, output from grid 0,9
Use of grid, input into grid 0,9
Winter period: 1.11.-31.3.
Other seasons: 1.4.-31.10.
Tariffs are seasonally adjusted and charged on consumption and use of grid
Fingrid defines the tariff
structure, which is
approved by the Energy
Authority
Fingrid's operating environment
36
12.12.2014

The cost of reserves is recovered in tariffs
Frequency controlled
normal operation
reserve
100%
Automatic frequency
restoration reserve
100%
Frequency controlled
disturbance reserve
10%
Fast disturbance
reserve
10%
Frequency controlled
disturbance reserve
90%
Fast disturbance
reserve
90%
The cost of reserves is recovered in the tariffs for balancing operations and transmission
Grid service tariffBalance service tariff
12/12/2014
37
12.12.2014

0
20
40
60
80
100
120
140
160
Ind
ex (
19
98
=1
00
)
Nominal tariff development Real tariff development
Development of grid service tariff in 1998 - 2015
Tariffs have been increased because of the strategic goal to reach maximum allowed return 2014 onwards
+ 8%
2014
+ 15%
2013
- 2%
2015
+ 30%
2012
Tariff decrease to
return excess
allowed profit
recovered in 2014
38
12.12.2014
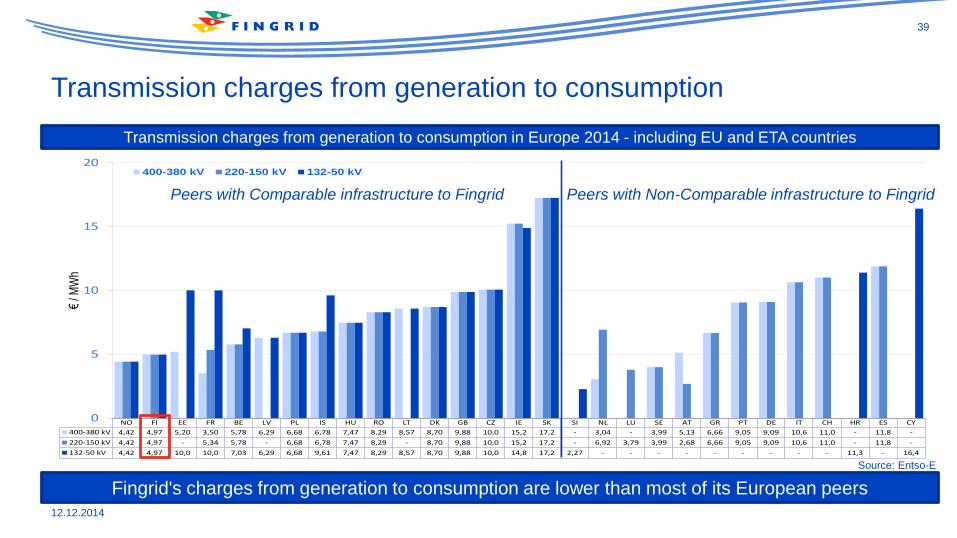
NO FI EE FR BE LV PL IS HU RO LT DK GB CZ IE SK SI NL LU SE AT GR PT DE IT CH HR ES CY
400-380 kV 4,42 4,97 5,20 3,50 5,78 6,29 6,68 6,78 7,47 8,29 8,57 8,70 9,88 10,0 15,2 17,2 - 3,04 - 3,99 5,13 6,66 9,05 9,09 10,6 11,0 - 11,8 -
220-150 kV 4,42 4,97 - 5,34 5,78 - 6,68 6,78 7,47 8,29 - 8,70 9,88 10,0 15,2 17,2 - 6,92 3,79 3,99 2,68 6,66 9,05 9,09 10,6 11,0 - 11,8 -
132-50 kV 4,42 4,97 10,0 10,0 7,03 6,29 6,68 9,61 7,47 8,29 8,57 8,70 9,88 10,0 14,8 17,2 2,27 - - - - - - - - - 11,3 - 16,4
0
5
10
15
20
€/ M
Wh
400-380 kV 220-150 kV 132-50 kV
Peers with Comparable infrastructure to Fingrid Peers with Non-Comparable infrastructure to Fingrid
Source: Entso-E
Transmission charges from generation to consumption in Europe 2014 - including EU and ETA countries
Fingrid's charges from generation to consumption are lower than most of its European peers
Transmission charges from generation to consumption
39
12.12.2014

Breakdown of end user electricity bill in Finland
Electricity procurement; 34%
Distribution; 28%
Value added tax;19%
Electricity taxes; 11%
Electricity sales;6%
Transmission;2%
Source: Energy Authority
Total 15,47 cents/kWh
in 1 January 2013
Fingrid's share of consumer price is approximately two percent
40
12.12.2014

Operations
CapexExecutive summary 3
Company overview 7
Operations 17
Description of operations 17
Efficiency of operations 25
Earnings model 31
Tariffs 35
Capex 41
Operating environment 45
Financials 54
Ratings 70
41
12.12.2014

Investments are based on ten year grid development plans
• Grid development plans are prepared
at three levels i.e. European, regional
and national
• Fingrid decides on investments based
on customers' needs, transmission
system security and network capacity
• Fingrid's network construction is
contracted with fixed price contracts
• Before network construction
commences all environmental and
planning permits are in place
All Fingrid's investment projects have been done in schedule and budget
Keminmaa – Petäjäskoski transmission line
42
12.12.2014

Flexible and long term capital investment strategy
Yllikkälä
Ulvila
Forssa
Hirvisuo
Lieto
Keminmaa
Hiki
ä
Huutokoski
Pyhänselkä
Koria
Petäjävesi
400 kV main grid
400 kV under construction
main grid base line scenarios2009
2010
2011
2012
2013
2014
2015
2016
2017
2018
2019
2020
2021
2022
2023
2024
Fenno-Skan 2 DC connection to Sweden
Forssa reserve power plant
Yllikkälä - Huutokoski B 400 kV
Hyvinkää - Hikiä 400 kV
Estlink 2 DC connection to Estonia
Ulvila - Kristinestad 400 kV
Hikiä - Forssa 400+110 kV -yhteys
Hirvisuo - Pyhänselkä 400 kV
Lieto - Forssa 400+110 kV
Hikiä - Orimattila - Koria 400 kV
Reinforcement of Helsinki region network
Reinforcement of north-south connections
Keminmaa - Pyhänselkä 400 kV
3rd AC interconnection to Sweden
Grid connection of nuclear and wind power
EIA / Preliminary design
Detailed planning and permits
Implementation
Planning horizon for investments exceeds ten years
90 % of new power lines will
be constructed along or next
to an existing right of way
Note: Click to view National ten year grid development plan Finland 2012
43
12.12.2014

Investments in 2000 - 2024
67%
33%
New investments
Replacementinvestment
0
50
100
150
200
250
300
ME
UR
Completed or in construction Planned investments
Investments in 2014-2024
amount to approximately
EUR 1 billion
Investments are driven by network aging, market development and connecting new production capacity
44
12.12.2014

Operating environment
Executive summary 3
Company overview 7
Operations 17
Operating environment 45
Financials 54
Ratings 70
45
12.12.2014

Fingrid's operating environment in three geographical levels
Europe
• Vision: integrated electricity market working on one European grid
• Strong changes in the generation fleet (nuclear, renewables, gas)
• Electricity market from Helsinki to Lisbon 2014
• Structural bottlenecks will remain in the grid – licensing main obstacle
Baltic Sea region
• Transmission capacity between the Nordic region and Continental Europe will double by 2020
• Stronger connection between the Nordic region, Baltic sates and Poland
• More active role of Russia via new interconnections from the Baltic states
Finland
• Energy and climate strategy: self-sufficiency via nuclear and renewables
• Share of price elastic generation decreases
• Modest growth in electricity demand: electrification and savings
• Role of cross-border connections increases
46
12.12.2014

Towards a highly developed electricity market in Europe
• Improving efficiency and competitiveness
of the power sector
– efficient market price
– cross-border trade
– efficient dispatching via "the invisible
hand"
• Delivering benefits for end-users and
trust to market players
• Contributing to the security of supply
• Reaching the 20-20-20 goals of EU:
better environment, more renewables
Market coupling
Electricity market from Helsinki to Lisbon in 2014
47
12.12.2014

Hydro power is the main energy source in the Nordic region
• Significant hydro power generation
capacity in Norway and Sweden
drive the electricity price in Finland
• Nuclear power generation is an
important base load power
generation source in Sweden and
Finland
• Coal is the main fossil fuel used in
Nordic countries
• Renewable power generation consist
of hydro power, biomass fired
cogeneration and wind power
Nordic electricity price is driven by hydrological conditions in Scandinavia
48
12.12.2014

Finland is well connected to Baltic Sea power market
• Finland is a net importer of electricity
mainly from Scandinavia
• Finland is expected to remain as a net
importer of electricity mainly because of
the delay of 1600 MW green field nuclear
power plant project (OL3)
• If cross border transmission capacity is
constrained, the Finnish area price
diverges from the Nordic electricity price
Finland is a net importer of electricity mainly from Scandinavia
49
12.12.2014

Cross border transmission between Finland and Russia
• Over 30 years a continuous flow 1300
MW from Russia due to low price
• Imports from Russia are currently low
– Russia now has capacity payment of
around EUR 25/MWh on exports to
Finland
– Rising power generation costs in Russia
• Towards more efficient trade
– Increased cooperation between power
exchanges
– Two way transmission with Russia
possible since December 2014
– Common rules between EU and Russia
Finland's cross border transmission with Russia is driven by power market development in EU and Russia
0
2
4
6
8
10
12
14
2006 2007 2008 2009 2010 2011 2012 2013
Annual electricity export from Russia to Finland (TWh)
50
12.12.2014

The Baltic Sea region* forms a single market area
• In 2013 a single price area between
Finland and Sweden existed 78 percent
of the time and 23 percent of the time
between all the Nordic countries
• Congestion income for the TSOs is
generated when cross border
transmission capacity is constrained.
Congestion income is split between
TSOs and used for developing further
cross border transmission capacity
Uniformity of spot-prices in the Nordic region (% of time)
* Finland, Sweden, Norway, Denmark, Poland, Estonia, Latvia, Lithuania
Congestion income is used for developing further cross border transmission capacity
0%
10%
20%
30%
40%
50%
60%
70%
80%
90%
100%
2008 2009 2010 2011 2012 2013
Finland-Sweden Nordic countries
51
12.12.2014

Electricity consumption in Finland
Energy intensive industry is a major consumer in Finland
24%
10%
8%
5%28%
22%
3%
Wood processing industry Metal processing industry
Chemical industry Other industries
Housing and agriculture Services and construction
Transmission losses
Fingrid continuously maintains production
and consumption balance
Source: Finnish Energy Industries
Electricity production was 68 TWh in
Finland in 2013. Electricity imports
accounted 16 TWh or 19% of total
consumption
Consumption in 2013
52
12.12.2014

National transmission system operators
Market structure and business areas in the Baltic Sea area
Power generation is unregulated whereas transmission and distribution is regulated by national authorities
Producers
in Nordic
region
Finnish industry customers
Retailers
Nordic
wholesale
market Retail
marketRetail customers
Finnish electricity distribution companies
53
12.12.2014

Financials
Financial performance
Executive summary 3
Company overview 7
Operations 17
Operating environment 45
Financials 54
Financial performance 54
Financing 64
Ratings 70
54
12.12.2014

Main economic drivers of transmission network operations
Investments
Allowed
return
Volume Tariff
WACC
Regulatory
asset base
Clients
x
x
Market
integration
Land
ownersSuppliers Financiers OwnersPersonnel
Tax
authorities
-
Grid service revenue
Expenses
Congestion
Hydrological
situation
Temperature
Failures Reserves
Loss power
Cross border
transmission
Financial
marketsFinancial
expenses
Electricity
price
Finnish
government
bond yield
55
12.12.2014
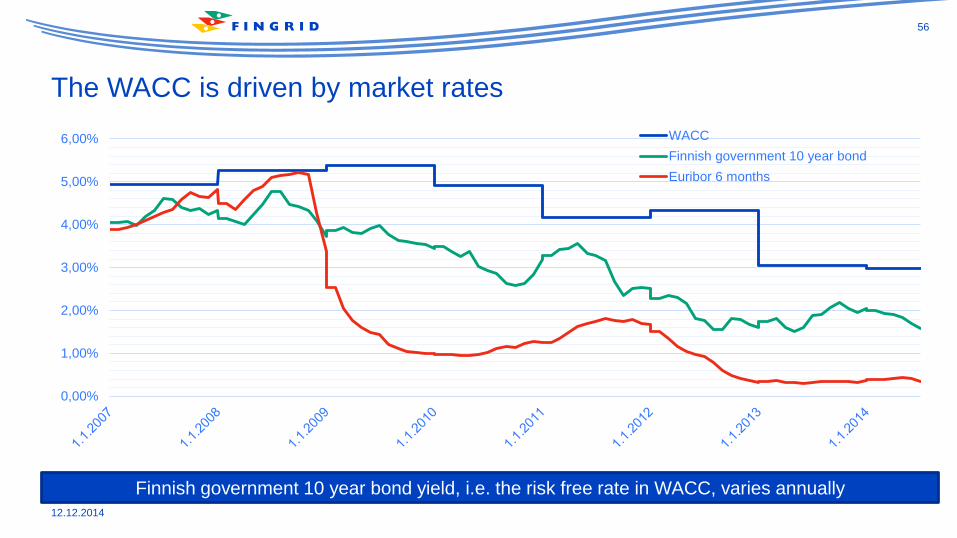
The WACC is driven by market rates
Finnish government 10 year bond yield, i.e. the risk free rate in WACC, varies annually
0,00%
1,00%
2,00%
3,00%
4,00%
5,00%
6,00% WACC
Finnish government 10 year bond
Euribor 6 months
56
12.12.2014

MEUR 321; 59 %
MEUR 159; 29 %
MEUR 23; 4 %
MEUR 13; 2 %
MEUR 31; 6 %
547 526
0
100
200
300
400
500
600
Grid servicerevenue
Sales ofimbalance
power
Congestionincome
Cross-borderincome
Other Revenue 2013 Revenue 2012
ME
UR
Revenue breakdown in 2013 + 4,0%
57
12.12.2014

MEUR 121; 28 %
MEUR 82; 19 %
MEUR 62; 15 %
MEUR 58; 14 %
MEUR 23; 5 %
MEUR 20; 5 %
MEUR 60; 14 %
425 419
0
100
200
300
400
500
Purchase ofimbalance
power
Depreciation Cost ofreserves
Cost of lossenergy
Personnelcosts
Maintenancecosts
Other Costs 2013 Costs 2012
ME
UR
Cost breakdownCost breakdown 2013 + 1,4%
58
12.12.2014

Operating profit in 2013
547
270
2382
58
115 950
100
200
300
400
500
600
Turnover Raw materialsand
consumables
Employeebenefits
expenses
Depreciation Other operatingexpenses
Operating profit2013
Operating profit2012
ME
UR
+ 22%
59
12.12.2014

Fingrid Oyj consolidated profit and loss (IFRS)
• Turnover has
increased in
because of tariff
increases 2010-
2013
• Employee
expenses
continuously at
low level due to
outsourced
operating model
Strong improvement in the operating profit both in absolute and percentage terms since 2011
2013 2012 2011 2010
TURNOVER 547 526 441 463
Raw materials and consumables used -270 -267 -242 -254
Employee benefits expenses -23 -22 -20 -20
Depreciation -82 -76 -68 -67
Other operating expenses -58 -66 -55 -48
OPERATING PROFIT (EBIT) 115 95 57 74
EBIT-% 21 % 18 % 13 % 16 %
Finance income and costs -29 -7 -23 -18
PROFIT BEFORE TAXES 87 88 34 56
Income taxes 3 -21 -1 -15
PROFIT FOR THE FINANCIAL YEAR 91 67 33 42
Other comprehensive income * -5 6 -33 31
TOTAL COMPREHENSIVE INCOME 86 73 -209 73
* Other comprehensive income consists of cash flow hedges, translation reserves and available-for-sale financial assets.
IFRS profit and loss 2010 – 2013 in MEUR
60
12.12.2014

Fingrid Oyj consolidated assets (IFRS)
• Tangible asset
increase in 2010
– 2013 has been
driven by
investments
Tangible asset increase is driven by a defined long term investment plan
2013 2012 2011 2010
Intangible assets 181 179 178 178
Tangible assets 1 623 1 485 1 420 1 253
Investments (associated companies and available for sale) 11 9 8 8
Receivables 60 103 77 90
NON-CURRENT ASSETS 1 875 1 776 1 683 1 529
Inventories 11 10 7 6
Derivative instruments 2 4 14 295
Trade receivables and other receivables 76 88 65 58
Financial assets recognised in income statement at fair value 195 207 202 218
Cash and cash equivalents 22 6 1 4
CURRENT ASSETS 307 316 289 286
TOTAL ASSETS 2 182 2 092 1 972 1 815
IFRS assets 2010 – 2013 in MEUR
61
12.12.2014
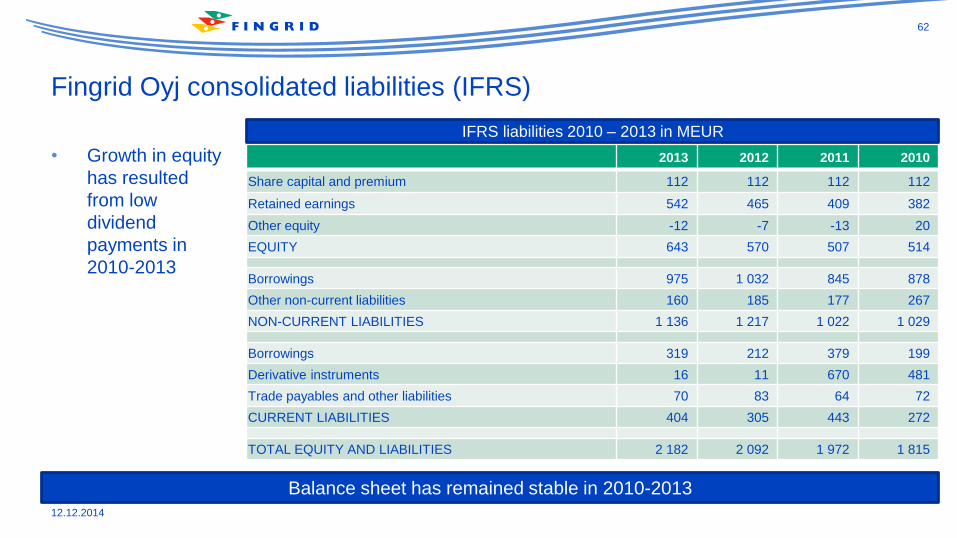
Fingrid Oyj consolidated liabilities (IFRS)
• Growth in equity
has resulted
from low
dividend
payments in
2010-2013
Balance sheet has remained stable in 2010-2013
2013 2012 2011 2010
Share capital and premium 112 112 112 112
Retained earnings 542 465 409 382
Other equity -12 -7 -13 20
EQUITY 643 570 507 514
Borrowings 975 1 032 845 878
Other non-current liabilities 160 185 177 267
NON-CURRENT LIABILITIES 1 136 1 217 1 022 1 029
Borrowings 319 212 379 199
Derivative instruments 16 11 670 481
Trade payables and other liabilities 70 83 64 72
CURRENT LIABILITIES 404 305 443 272
TOTAL EQUITY AND LIABILITIES 2 182 2 092 1 972 1 815
IFRS liabilities 2010 – 2013 in MEUR
62
12.12.2014

Fingrid Oyj consolidated cash flow (IFRS)
• Operating cash
flow has covered
approximately
two thirds of the
investment cash
flow in 2010-
2013
Operating cash flow has been mainly utilized to finance investments in 2010-2013
2013 2012 2011 2010
Cash flow from operations 202 181 130 138
Change in working capital -43 -37 -34 -24
Net cash flow from operations 159 145 96 115
Net cash flow from investments -226 -146 -244 -127
Net borrowings 84 22 138 37
Dividends paid -13 -11 -7 -7
Net cash flow from financing activities 71 11 131 30
Net change in cash and cash eqv. 3 10 -18 18
Cash and cash equivalents 1 Jan 214 204 222 204
Cash and cash equivalents 31 Dec 217 214 204 222
IFRS cash flow 2010 – 2013 in MEUR
63
12.12.2014

Financials
Financing
Executive summary 3
Company overview 7
Operations 17
Operating environment 45
Financials 54
Financial performance 54
Financing 64
Ratings 70
64
12.12.2014

Fingrid's core financial objectives
Fingrid applies conservative financial policy which are reflective of its high rating
12/12/2014
Efficient operations
• We ensure efficient operating model and operating principles as well as sufficient and high quality information for decision making
• We plan investments mindful of the company's financial situation
• We focus on operating costs in our daily operations and develop awareness of financial aspects across organisation
High credit rating and sufficient debt service capacity
• We create strong financial position by diversification of funding sources and maturity profile while ensuring sufficient liquidity position
• We strengthen Fingrid's public profile with transparent reporting and consistent dialogue with investors, financiers and credit rating agencies
• We ensure sufficient debt service capacity by systematically forecasting financial performance
Reasonable return to the shareholders
• We maintain regulated profit at the maximum allowed level
• We impact to the definition and level of reasonable regulated return
• We manage risks related to the operations, asset base and financing with risk management processes as well as with derivatives, guarantees and insurances
65
12.12.2014

Dividend policy was redefined in June 2014
• The guiding principle is to distribute
substantially all of the parent company
profit as dividend
• Prevailing conditions and investment
needs are always considered before
taking decision on dividend to be paid
Dividend policy aims is to ensure reasonable return and take into account company's financial targets
Dividend policy
"Fingrid Oyj's Board of Directors has unanimously approved Fingrid Oyj's
dividend policy on 6.6.2014.
The purpose of Fingrid's dividend policy is on one hand to ensure that the
shareholders receive a reasonable return on their invested capital and on
the other hand to maintain the company’s financial position at a level that
enables long-term implementation of the strategy and supports operative
flexibility.
The guiding principle for Fingrid's dividend policy is to distribute
substantially all of the parent company profit as dividend. When making
the decision, however, the economic conditions, the company's near term
investment and development needs as well as any prevailing financial
targets of the company are always taken into account."
Source: Fingrid stock exchange release 6 June 2014
66
12.12.2014

Fingrid debt programme overview
• Long standing presence in the capital and money markets since 1998:
- EMTN Programme, MEUR 1,500
- ECP Programme, MEUR 600
- CP Programme, MEUR 150
• Fingrid's core relationship banks are the dealers of the EMTN Programme
• MEUR 250 Revolving Credit Facility (RCF) provided by the dealers. The facility
supports the company's liquidity reserve and is undrawn
• Long-term bilateral loans are provided by the European Investment Bank (EIB) and
Nordic Investment Bank (NIB)
Fingrid is a seasoned issuer on international private and public debt capital markets
67
12.12.2014
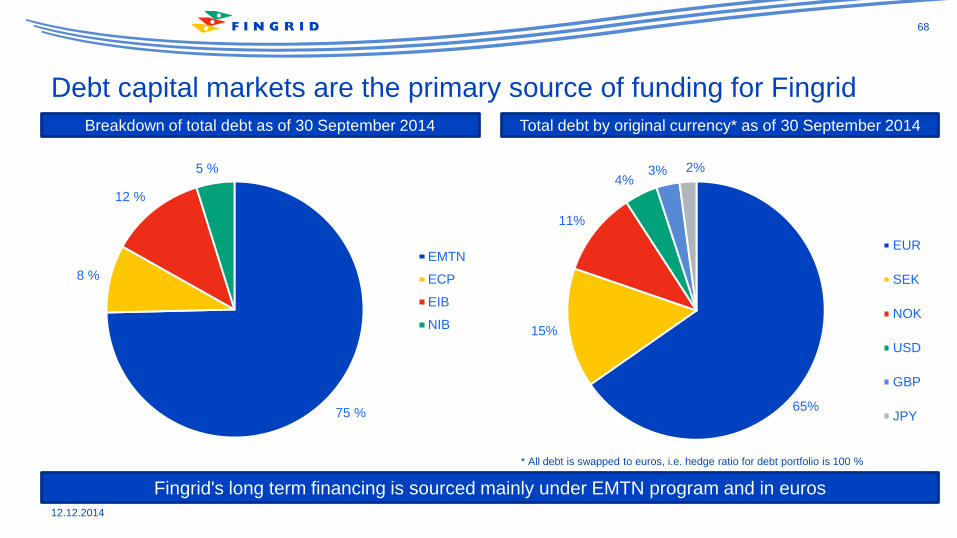
Debt capital markets are the primary source of funding for Fingrid
Fingrid's long term financing is sourced mainly under EMTN program and in euros
Total debt by original currency* as of 30 September 2014
* All debt is swapped to euros, i.e. hedge ratio for debt portfolio is 100 %
Breakdown of total debt as of 30 September 2014
75 %
8 %
12 %
5 %
EMTN
ECP
EIB
NIB
65%
15%
11%
4%3% 2%
EUR
SEK
NOK
USD
GBP
JPY
68
12.12.2014

Fingrid's debt maturity profile extends until 2029
• Fingrid aims to maintain a well distributed debt
maturity profile
• Short term debt consisted of MEUR 105 of
ECP issuance, MEUR 126 of EMTN private
placement maturities and MEUR 4 of NIB loan
amortizations
• Fingrid issued a MEUR 300 Eurobond in 2012
to international investors
• In 2014 Fingrid issued two 15 year private
placements of MEUR 110 in total to institutional
debt investors
• Long term debt maturity on any single year
cannot exceed 30 percent of total debt
Debt maturity profile is well distributed
Debt maturity profile as of 30 September 2014
% of MEUR
Short term debt 19% of total MEUR 235
Long term debt 81% of total MEUR 1 014
Total gross debt MEUR 1 249
0
50
100
150
200
250
300
350
ME
UR
EMTN ECP EIB NIB
69
12.12.2014

Executive summary 3
Company overview 7
Operations 17
Operating environment 45
Financials 54
Ratings 70
Ratings
70
12.12.2014

Fingrid has high credit ratings and stable outlook
Fingrid's credit ratings
S&P Moody's Fitch
Date 14.10.2014 9.12.2014 6.11.2014
Outlook Stable Stable Stable
Issuer rating A+ A1 A
Senior unsecured debt A+ A1 A+
Short – term A -1 P-1 F1
Uplift from state ownership 1 notch 1 notch No uplift
71
12.12.2014

Key rating factors according to the rating agencies
• Moody's
(1) The low business risk profile of its regulated electricity transmission network operations
(2) The well-established, stable and transparent regulatory framework, which supports good visibility of cash flows
(3) The support of the majority owner, the Finnish government
• Standard & Poor's
(1) Company's excellent business risk profile and significant financial risk profile
(2) A "high" likelihood that Finland would provide timely and sufficient extraordinary support to Fingrid the event of financial
distress.
• Fitch
(1) Fingrid's credit profile benefits from its monopoly position, low business risk and a highly supportive regulatory framework
(2) The Stable Outlook reflects Fitch's expectation that, after the peak of investment spending in 2013, leverage will decline to
within the guidance for an 'A' rating. Furthermore Fingrid benefits from ample liquidity to meet immediate funding needs
Fingrid's low business risk profile and supportive regulatory framework are key credit strengths
72
12.12.2014

Powering Finland.