FINGERPRINT ENHANCEMENT BY DIRECTIONAL FILTERING by …
94
FINGERPRINT ENHANCEMENT BY DIRECTIONAL FILTERING by SREYA CHAKRABORTY Presented to the Faculty of the Graduate School of The University of Texas at Arlington in Partial Fulfillment of the Requirements for the Degree of MASTER OF SCIENCE IN ELECTRICAL ENGINEERING THE UNIVERSITY OF TEXAS AT ARLINGTON DECEMBER 2011
Transcript of FINGERPRINT ENHANCEMENT BY DIRECTIONAL FILTERING by …

FINGERPRINT ENHANCEMENT BY DIRECTIONAL FILTERING
by
SREYA CHAKRABORTY
Presented to the Faculty of the Graduate School of
The University of Texas at Arlington in Partial Fulfillment
of the Requirements
for the Degree of
MASTER OF SCIENCE IN ELECTRICAL ENGINEERING
THE UNIVERSITY OF TEXAS AT ARLINGTON
DECEMBER 2011

ii
ACKNOWLEDGEMENTS
It is a pleasure to thank many people who made this thesis possible.
This work would not have been possible without the support from Prof. Dr. K.R.Rao whose
guidance, I chose this topic. I would like to gratefully acknowledge the supervision of my advisor
Dr. K.R.Rao who has been abundantly helpful and has assisted me in numerous ways. I
specially thank him for his infinite patience. The discussions I have had with him are invaluable.
I would like to thank Dr. A. Davis and Dr. M. Manry for being a part of my thesis committee. I
would also like to extend my gratitude to A.M.Raic�evic and B.M. Popovic.
My final words go to my family. I want to thank my family, whose love and guidance is with me
in whatever I pursue.
On a different note, many people have been a part of my graduate education and I am highly
grateful to all of them.
November 7, 2011

iii
ABSTRACT
FINGERPRINT ENHANCEMENT
BY DIRECTIONAL
FILTERING
Sreya Chakraborty, MS
The University of Texas at Arlington, 2011
Supervising Professor: Kamisetty Rao
Although inkless methods for taking fingerprint impressions are now available, these methods
still suffer from the positional shifting caused by the skin elasticity. The non cooperative attitude
of suspects or criminals also leads to smearing in parts of the fingerprint impressions. Thus a
substantial amount of research reported in the literature on fingerprint identification is devoted to
image enhancement techniques.
The important step in fingerprint matching is the reliable fingerprint recognition. Automatic
Fingerprint Recognition System relies on the input fingerprint for feature extraction. Hence, the
effectiveness of feature extraction relies heavily on the quality of input fingerprint images. In this
thesis adaptive filtering in frequency domain in order to enhance fingerprint image is proposed.
Several stages of processing take place when an Automated Fingerprint Identification System
(AFIS) is used to match an unknown fingerprint [2].
1) The fingerprint is first enhanced to remove noisy and any irrelevant information.

iv
2) The enhanced image is then encoded into a form suitable for comparison with the records
held in the database. The encoded data consists of various key information of the fingerprint
image like its minutiae.
3) Matching is then performed by comparing the encoded record against those held in the
database.
4) Verification stage is performed wherein a fingerprint expert visually compares the unknown
print with the candidates’ fingerprints.
In this thesis Gabor filter is used for fingerprint enhancement technique. Because of its
frequency selective and orientation selective properties it proves to be useful for fingerprint
enhancement. The primary advantage of the approach is improved translation and rotation
invariance.

v
TABLE OF CONTENTS
ACKNOWLEDGEMENTS ............................................................................................................. ii
ABSTRACT .................................................................................................................................. iii
LIST OF ILLUSTRATIONS......................................................................................................... viii
LIST OF ACRONYMS .................................................................................................................. xi
Chapter Page
1. INTRODUCTION ......................................................................................................... 1
1.1 Background ............................................................................................... 1
1.2 Accuracy and Security ............................................................................... 1
1.3 Biometrics categories ............................................................................... 1
1.3.1 Physical biometrics .................................................................... 2
1.3.2 Behavioral biometrics ................................................................ 5
1.4 Multimodal systems ............................................................................... 8
2. RELATED WORK........................................................................................................ 9
2.1 Fingerprint ..................................................................................................... 9
2.2 Previous Work ............................................................................................. 11
2.3 Research Scope .......................................................................................... 16
2.4 Reader’s Guide ........................................................................................... 17
3. FINGERPRINT IMAGE REPRESENTATION ............................................................ 19
3.1 Fingerprint Representation ......................................................................... 19
3.1.1 Image-based representation ................................................ 21

vi
3.1.2 Global Ridge Pattern .............................................................. 22
3.1.3 Local Ridge Detail .................................................................. 22
3.1.4 Intra-ridge Detail ................................................................... 24
3.2 Minutiae-Based Fingerprint Recognition ............................................... 25
3.3 Fingerprint Image Enhancement .......................................................... 26
3.4 Minutiae Extraction ................................................................................ 28
3.4.1 Binarization-based Minutiae Extraction.................................. 29
4. REVIEW OF THE AUTOMATIC FINGERPRINT IDENTIFICATION SYSTEM ......... 33
4.1 Capture Devices .......................................................................................... 33
4.1.1 Scanning ..................................................................................... 33
4.1.2 Optical ......................................................................................... 34
4.1.3 Capacitance ................................................................................ 36
4.1.4 Thermal ....................................................................................... 36
4.1.5 Pressure ...................................................................................... 37
4.1.6 Ultrasound ................................................................................... 38
4.2 Scanning a Fingerprint ............................................................................... 39
4.3 Steps for fingerprint enhancement .............................................................. 40
4.4 Normalization .............................................................................................. 40
4.5 LRO (Local Ridge Orientation) ................................................................... 42
4.6 LRF (Local Ridge Frequency) ..................................................................... 44
4.7 Algorithm for fingerprint enhancement ........................................................ 44
5. FINGERPRINT IMAGE ENHANCEMENT ................................................................. 46
5.1 Image Enhancement ................................................................................... 46
5.1.1 Orientation Estimation and Verification ..................................... 48
5.1.2 Predicting ridge orientations using minutiae triplets ................. 50

vii
5.2 Orientation method used in this thesis ...................................................... 52
5.2.1 LRO (Local Ridge Orientation) .................................................... 53
5.2.2 Algorithm for estimating LRO at a point ...................................... 53
5.3 Gabor Filter ................................................................................................. 55
5.4 Results ........................................................................................................ 61
5.5 Histogram .................................................................................................... 68
5.6 Histogram equalization ................................................................................ 68
5.7 Verification ................................................................................................... 68
5.8 Conclusions ................................................................................................. 69
APPENDIX
A. GABOR FILTER......................................................................................................... 70
REFERENCES ............................................................................................................................ 75
BIOGRAPHICAL INFORMATION ……………………........ ......................................................... 83

viii
LIST OF ILLUSTRATIONS
Figure Page
1.1 Facial recognition ...................................................................................................................2
1.2 Commercial three dimensional scanner ..................................................................................3
1.3 Iris pattern ..............................................................................................................................4
1.4 Fingerprint ...............................................................................................................................5
1.5 Gait cycle ................................................................................................................................6
1.6 Handwriting sample .................................................................................................................7
1.7 Multimodal system ...................................................................................................................8
2.1 Feature at various level in fingerprint (a) Grayscale image (b) level 1 feature (orientation field) (c) level 2 feature (ridge skeleton) (d) level 3 feature (ridge contour, pore and dot) ......................................................................... 10
2.2 Fingerprint representation schemes (a) Grayscale image [47] (b) phase
image [48] (c) skeleton image ................................................................................... 11 2.3 Deducing the orientation field from minutiae distribution. (a) A single
minutiae triplet. (b) Forming triplets across the minutiae distribution. (c) Estimated orientation field using minutiae triplet information ..................................... 11
2.4 (a) Whorl (b) Left loop (c) Right loop .................................................................................... 14
2.5 Continuous phase for a whorl pattern (a) continuous phase given by �2 � �2 (b) Continuous phase modulo 2� (c) Gray scale image given by cos ��2 � �2 (d) Gradient of the continuous phase ................................................... 16
3.1 Sample fingerprints with their associated shapes ............................................................... 20 3.2 Sample fingerprints, with core points marked with a square, and delta points
marked with a triangle ................................................................................................ 21 3.3 (a) Bifurcation (b) Termination ........................................................................................ 23 3.4 Some of the common minutiae types .................................................................................. 24
ix
3.5 Pore and ridge edge contour ................................................................................................ 25 3.6 a) Good quality fingerprint image (b) Poor quality fingerprint image ................................. 27 3.7 (a) The window used for analyzing the surrounding pixel intensity (b) the
window oriented along the local ridge direction .......................................................... 31 4.1 Fingerprint scanner .............................................................................................................. 34 4.2 General layout of an optical fingerprint scanner, reproduced from [Atmel
Corporation 2001] ........................................................................................................ 35 4.3 Depiction of a capacitance scanner .................................................................................... 36 4.4 Operation of ultrasound scanner, sound waves return a partial echo at each
change in material, from Ultra-Scan ........................................................................... 38 4.5 Scanned image .................................................................................................................... 39 4.6 A flowchart of the proposed fingerprint enhancement algorithm ......................................... 40 4.7 Normalized image ................................................................................................................ 42 4.8 Orientation field image ......................................................................................................... 43 4.9 Algorithm for fingerprint enhancement ................................................................................ 45 5.1 Original fingerprint ............................................................................................................... 46 5.2 Various stages in the enhancement process ....................................................................... 47 5.3 Six ridge patterns and their orientations calculated by Kirsch(1st row),
Robinson(2nd row), Sobel(3rd row), and Prewitt operators(4th row) ......................... 49 5.4 (a) A fingerprint ridge flows with ideal corresponding histogram. (b) Six
directions for histograms examination . ....................................................................... 49 5.5 (a) Minutiae distribution of a fingerprint. (b) Examples of a good quality triplet
(blue) with Lavg = 112:66, θdiff = 5, Q = 237:63 and a bad quality triplet (red) with Lavg = 217, _diff = 26, Q = 67:55. (c) Estimated orientation map .............................................................................................................................. 52
5.6 Projections of a window of fingerprint image data. The projections which
exhibit the greatest variation correspond to the orientation of the ridges within the window (here). Eight projection are shown here . ....................................... 54
5.7 One dimensional Gabor filter .............................................................................................. 56 5.8 Joint localization of a signal in time and frequency domain ................................................. 58

x
5.9 Two dimensional Gabor filters ............................................................................................ 59 5.10 Image 1(a) Original image (b) Gabor filtered image (c) Histogram of the
original image (d) Histogram of the Gabor filtered image (e) Histogram equalized of the Gabor filtered image ......................................................................... 61
5.11 Image 2(a) Original image (b) Gabor filtered image (c) Histogram of the
original image (d) Histogram of the Gabor filtered image (e) Histogram equalized of the Gabor filtered image ......................................................................... 62
5.12 Image 3(a) Original image (b) Gabor filtered image (c) Histogram of the
original image (d) Histogram of the Gabor filtered image (e) Histogram equalized of the Gabor filtered image ......................................................................... 63
5.13 Image 4(a) Original image (b) Gabor filtered image (c) Histogram of the
original image (d) Histogram of the Gabor filtered image (e) Histogram equalized of the Gabor filtered image ......................................................................... 64
5.14 Image 5(a) Original image (b) Gabor filtered image (c) Histogram of the
original image (d) Histogram of the Gabor filtered image (e) Histogram equalized of the Gabor filtered image ......................................................................... 65
5.15 Image 6(a) Original image (b) Gabor filtered image (c) Histogram of the
original image (d) Histogram of the Gabor filtered image (e) Histogram equalized of the Gabor filtered image ......................................................................... 66
5.16 Image 7(a) Original image (b) Gabor filtered image (c) Histogram of the
original image (d) Histogram of the Gabor filtered image (e) Histogram equalized of the Gabor filtered image ......................................................................... 67

xi
LIST OF ACRONYMS
AFIS – Automatic Fingerprint Identification System
ANSI – American National Standards Institute
DB – Data Base
DMF – Directional Median Filter
DPI – Dots Per Inch
ESID – Electro-Static Discharge
FBI – Federal Bureau of Investigation
FFT – Fast Fourier Transform
FM – Frequency Modulation
FTIR – Frustrated Total Internal Reflection
FVC – Fingerprint Verification Competition
JPEG – Joint Photographic Experts Group
LRF – Local Ridge Frequency
LRO – Local Ridge Orientation
NIST – National Institute of Standards and Technology
PAMI – Pattern Analysis and Machine Intelligence
SEIR – Surface Enhanced Internal Reflection
SFINGE – Synthetic Fingerprint Generator
TAR – True Accept Rate
WSQ – Wavelet Scalar Quantization

1
CHAPTER 1
INTRODUCTION
1.1 Background
Biometrics is the science of verifying the identity of an individual through physiological
measurements or behavioral traits. Since biometric identifiers are associated permanently with
the user they are more reliable than token or knowledge based authentication methods.
Biometrics offers several advantages over traditional security measures. Some of them are
presented below
1.2 Accuracy and Security
Biometrics based security systems are far most secure and accurate than traditional password
or token based security systems. For example a password based security system has always
the threat of being stolen and accessed by the unauthorized user. Furthermore the traditional
security systems are always prone to accuracy as compared to biometrics which is more
accurate.
One individual, Multiple IDs: Traditional security systems face the problem that they don’t give
solution to the problem of individuals having multiple IDs, e.g. a person having multiple
passports to enter a foreign country. Thanks to biometrics!!! They give us a system in which an
individual cannot possess multiple IDs and cannot change his ID throughout his life time. Each
individual is identified through a unique biometric identity throughout the world.
1.3 Biometrics categories
Biometrics can be categorized in various categories as follow.

2
1.3.1 Physical biometrics
This biometrics involves measurement of physical characteristics of individuals. The most
prominent of these include
� Face
� Hand geometry
� Iris scans
� Fingerprints
1.3.1.1 Face
There has been significant achievement in face recognition system in past few years.
Due to these advancements this problem appears to be eventually technologically feasible and
economically realistic. In addition, current research involves developing more robust
approaches that accounts for changes in lighting, expression, and aging, where potential
variations for a given person are illustrated in Fig 1-1. Also, other problem areas being
investigated include dealing with glasses, facial hair, and makeup.
Fig 1-1 Facial recognition [66]
1.3.1.2 Hand geometry
Hand geometry is one of the most basic biometrics in use today. A two- dimensional
system can be implemented with a simple document scanner or digital camera, as these

3
systems only measure the distances between various points on the hand. Meanwhile, a three
dimensional system provides more information and greater reliability. These systems, however,
require a more expensive collection device than the inexpensive scanners that can be used in a
two-dimensional system. An example of a commercial three-dimensional scanner is shown in
Fig 1-2.
Fig 1-2 Commercial three dimensional scanner [66]
The primary advantage of hand geometry systems is that they are simple and inexpensive to
use. Also, poor weather and individual anomalies such as dry skin or cuts along the hand do not
appear to negatively affect the system. The geometry of the hand, however, is not a very
distinctive quality. In addition, wearing jewelry or other items on the fingers may adversely affect
the system’s performance.
1.3.1.3 Iris
Iris recognition Fig 1-3 has taken on greater interest in recent years. As this technology
advances, purchasing these systems has become more affordable. These systems are

4
attractive because the pattern variability of the iris among different persons is extremely large.
Thus, these systems can be used on a larger scale with a small possibility of incorrectly
matching an imposter. Also, the iris is well protected from the environment and remains stable
over time. In terms of localizing the iris from a face, its distinct shape allows for precise and
reliable isolation. Fig 1-3 shows the unique iris pattern data extracted from a sample input.
Fig 1-3 Iris pattern [84]
1.3.1.4 Fingerprint
Fingerprint features are very important in fingerprint recognition process. Fingerprint
features are generally categorized into three levels (Fig 1-4 )
1. Level 1 features mainly refer to ridge orientation field and features derived from it, i.e.,
singular points and pattern type.
2. Level 2 features refer to ridge skeleton and features derived from it, i.e., ridge

5
bifurcations and endings.
3. Level 3 features include ridge contours, position, and shape of sweat pores and incipient
ridges.
Fig 1-4 Fingerprint
1.3.2 Behavioral biometrics
This category of biometrics is temporal in nature. They are evolved during the life time of an
individual. It involves measuring the way in which an individual performs certain tasks.
Behavioral biometrics include
• Gait
• Handwriting
• Speech
• Signature
Now let discuss some the behavioral biometrics in a little detail
1.3.2.1 Gait
Gait-based recognition involves identifying a person’s walking style. Although these
systems are currently very limited, there is a significant amount of research being conducted in
this area. Furthermore, studies have shown that gait changes over time and is also affected by

6
clothes, footwear, walking surfaces, and other conditions. Figure below outlines the various
stages of a gait cycle (Fig 1-5).
Fig 1-5 Gait cycle [85]
1.3.2.2 Handwriting
Signature verification, for example, has had a long, rich history. The use of signatures
has some well known advantages: they are a natural and familiar way of confirming identity,
have already achieved acceptance for legal purposes, and their capture is less invasive than
most other biometric schemes [70]. Still, each individual has only one true signature Fig 1-6 —a

7
severe limitation when it comes to certain security applications. As a result, researchers have
recently begun to examine using arbitrary handwritten phrases, recasting the problem as one of
computing cryptographic keys or biometric hashes (e.g., [71]).
Fig 1-6 Handwriting sample
1.3.2.3 Speech
Voice, as one of the modalities, is especially important in applications such as
telephony dialog systems where it is the natural communication means and, besides the dialing
keyboard, the only one available. Speaker recognition technology analyzing and modeling the
speaker’s voice prints has been a major research effort for the past decades and is reaching
maturity.
1.3.2.4 Signature
Signature characteristics are absolutely unique to an individual and virtually impossible
to duplicate. Therefore, signature still remains one of the most powerful human identifiers today.

8
In dynamic signature verification, multiple biometric characteristics of a signature in question are
scrutinized and compared against a reference signature kept on file to make a conclusion that
measures the confidence of the signature's genuineness. If several genuine reference
signatures are available, the measure of the stability of the particular feature is developed and
used to estimate the probability of deviations observed in the questionable signature.
1.4 Multimodal systems
Multimodal systems (Fig 1-7) employ more than one biometric recognition technique to arrive at
a final decision. These systems may be necessary to ensure accurate performance. Combining
several biometrics in one system allows for improved performance as each individual biometric
has its own strengths and weaknesses. Using more than one biometric also provides more
diversity in cases where it is not possible to obtain a particular characteristic for a person at a
given time. Although acquiring more measurements increases the cost and computational
requirements, the extra data allows for much greater performance.
Fig 1-7 Multimodal system

9
CHAPTER 2
RELATED WORK
Security, in general terms, is concerned with the protection of some kind of asset. The level of
security protecting these assets is relative to that provided by other (similar) systems, and to the
ease with which an attacker can gain access to the asset. The introduction of biometric systems
as an alternative to traditional security systems is seen as attractive by many, because of the
potential for greater precision. The ability to use a characteristic of the user as a means of
identification or authentication is seen as a benefit in terms of both security and usability.
However the use of biometric systems introduces new risks both to the system and the user.
Biometric characteristics as used in biometric systems are typically consistent elements of what
a person is, and hence cannot be easily altered or replaced. Therefore the theft of such a
characteristic, especially if it is used as a key to a secure environment, is potentially
devastating. Various previous works related to security and systems are mentioned in this
chapter.
2.1 Fingerprint
Extensive research has been done on fingerprints. Two of the fundamentally important
conclusions that have risen from research are:
(1) a person's fingerprint will not naturally change structure about one year after birth and
(2) the fingerprints of individuals are unique. Even the fingerprints in twins are not the same. In
practice two humans with the same fingerprint have never been found.
Fingerprint features are generally categorized into three levels (Fig 2-1):

10
1. Level 1 features mainly refer to ridge orientation field and features derived from it, i.e.,
singular points and pattern type.
2. Level 2 features refer to ridge skeleton and features derived from it, i.e., ridge bifurcations
and endings.
3. Level 3 features include ridge contours, position, and shape of sweat pores and incipient
ridges.
Most fingerprint matching systems are based on four types of fingerprint representation
schemes: grayscale image , phase image, skeleton image, and minutiae
The gray scale image (fig.2.2(a)) has the highest amount of information and features at all
levels are represented. Compared to grayscale image, phase image (Fig 2-2(b)) and skeleton
image (Fig 2-2(c)) lose all Level 3 features and compared with phase image and skeleton
image, the minutiae template further loses some Level 2 information, such as ridge path
between minutiae.
Fig 2-1 Feature at various level in fingerprint (a) Grayscale image (b) level 1 feature (orientation field) (c) level 2 feature (ridge skeleton) (d) level 3 feature (ridge contour,
pore and dot) [53]

11
2.2 Previous Work
2.2 Previous work The methods of Hill [54] and Ross et al [55] first reconstructs a skeleton image from minutiae,
which is then converted into the grayscale image. In [54], the orientation field is generated
based on singular points according to the model in [56]. A line drawing algorithm is used to
generate a sequence of splines passing through the minutiae.
Fig 2-3 Deducing the orientation field from minutiae distribution. (a) A single minutiae triplet. (b) Forming triplets across the minutiae distribution. (c) Estimated orientation field using minutiae
triplet information [55]
In [55], the orientation field is estimated using selected minutiae triplets in the template.
Streamlines are then traced starting from minutiae and border points. Linear integral convolution
Fig 2-2 Fingerprint representation schemes (a) Grayscale image [47] (b) phase image [48] (c) skeleton image[49],[50] (d) minutiae [51],[52]

12
is used to impart texture-like appearance to the ridges. Finally, the image is smoothed to obtain
wider ridges.
Consider a pixel P(x,y) located inside the triangular region defined by a triplet.
Let ��� � ������� , ��, � � 1,2,3 be the Euclidean distances of this pixel from the entire ith vertex.
The orientation of the pixel P, θθ��, is then estimated as [55]
The angle θ1 (θ3) corresponds to the orientation of the vertex that is nearest to (farthest from)
the pixel P(x,y). Thus, the orientation at P(x,y) is estimated as a weighted sum of all the three
orientations with a higher weight assigned to the orientation of the closest vertex. The result of
the generated orientation map is shown in Fig 2-3.
Averaging orientation map: To obtain a smooth transition in orientations, the estimated
orientation map is convolved with a 3 x 3 local averaging filter.
This reconstruction algorithm [55] can only generate a partial fingerprint. In addition, streamlines
that terminate due to distance constraint between adjacent streamlines will generate spurious
minutiae. The validity of this reconstruction algorithm was tested by matching 2,000
reconstructed fingerprints against the 2,000 original fingerprints in NIST SD4. A rank-1
identification rate of 23 percent was reported.
Cappelli et al [57] proposed a technique to directly reconstruct the grayscale image from
minutiae. The orientation field is estimated by fitting a modified model initially proposed in [58] to
the minutiae directions. Gabor filtering [65] is iteratively performed starting from minutiae on an
image initialized by the local minutiae pattern. A rendering step is performed to make the
reconstructed fingerprint image appear more realistic. The efficacy of this reconstruction

13
algorithm was assessed by attacking nine fingerprint matching algorithms. An average True
Accept Rate (TAR) of 81.49 percent at 0 percent False Accept Rate (FAR) was obtained in
matching 120 reconstructed finger-prints against the 120 original fingerprints in FVC2002 DB1.
However, this algorithm also generates many spurious minutiae in the reconstructed
fingerprints.
Fingerprint reconstruction from minutiae (hereinafter simply referred to as fingerprint
reconstruction) is very similar to fingerprint synthesis except that the goals and the inputs of the
two techniques are different. The goal of fingerprint reconstruction is to obtain an artificial
fingerprint that resembles the original fingerprint as much as possible, while the goal of
fingerprint synthesis is to generate any artificial fingerprint that is as realistic as possible. For
fingerprint reconstruction, the minutiae from a given fingerprint must be provided, while for
fingerprint synthesis, no input is needed (except for a statistical model of fingerprint learned
from many real fingerprint images).
The well-known SFINGE [69] fingerprint synthesis method of Cappelli et al performs Gabor
filtering on a seed image according to the orientation and frequency images; minutiae
automatically emerge during the filtering procedure. Some intraclass variations, such as spatial
transformation, touching area, nonlinear distortion, ridge dilation/shrinking, and noise, are
simulated to generate realistic impressions of the master fingerprint. One main limitation of
SFINGE is that minutiae cannot be controlled. As a result, SFINGE may generate problematic
fingerprints that contain too few minutiae or very long ridges. It is well known that the distribution
of minutiae in fingerprints is not random and fingerprints of different pattern types have different
minutiae distributions [55]. The minutiae distribution of fingerprints generated by SFINGE may
not conform to such distributions since these minutiae are automatically generated during the
image filtering process. Similar fingerprint synthesis methods have also been proposed in [60].
The reaction-diffusion technique described in [62] can also be used for synthesizing fingerprints.

14
Bicz [61] described a fingerprint synthesis technique based on the 2D FM model. The phase of
the FM model consists of the continuous component and the spiral component, which
corresponds to minutiae. A fingerprint is synthesized by first generating each component
separately and then combining them. Separation of the continuous phase and the spiral phase
makes minutiae controllable. However, the most important step, generating the continuous
phase component, was not described in [61]. According to the demo software provided by the
author, only a partial fingerprint (around the core) can be generated and the orientation field of
each of the four fingerprint pattern types (whorl, left loop, right loop, and arch (Fig 2-4) is fixed.
(a) (b)
(c)
Fig 2-4 (a) Whorl (b) Left loop (c) Right loop

15
Feng, and Jain [53] proposed a novel approach to fingerprint reconstruction from minutiae
template which first reconstructs a phase image from the minutiae template and then converts
the phase image into the grayscale image. The advantages of this approach over existing
approaches to fingerprint reconstruction [54], [55], [57] are: 1) A complete fingerprint can be
reconstructed and 2) the reconstructed fingerprint contains very few spurious minutiae. The
proposed reconstruction algorithm has been quantitatively assessed by matching reconstructed
fingerprints against the corresponding original fingerprints (termed as type-I attack) and against
different impressions of the original fingerprints (termed as type-II attack) using a commercial
fingerprint SDK, Neurotechnology VeriFinger 4.2. Type-I attack was found to have a high
chance of deceiving the fingerprint recognition system in both the verification and identification
experiments. Type-II attack also has a significantly higher acceptance rate than that of impostor
match. A TAR of 94.13 percent at a FAR of 0 percent has been observed in the verification
experiment conducted on FVC2002 DB1, and 99.70 percent rank-1 identification rate has been
observed in the identification experiment conducted on the NIST SD4 database.
The continuous phase does not contain any rotational component and the integral of its gradient
around any simple closed path is zero. For example, the continuous phase given by
����, � � �� � �
corresponds to a grayscale image cos( ψ!�x, y ) that looks like a whorl pattern (see Fig 2-5).
Its gradient (instantaneous frequency) is cosθ and sinθ, where θ is the angle in the polar
coordinate system.

16
Generally, a fingerprint based biometric system is considered as highly secure, and is
equivalent to a long password. However with decreasing number of features on a small
fingerprint and the non-exact matching nature, the security strength of partial fingerprint
recognition reduces. Fingerprint recognition is being widely applied in the personal identification
for the purpose of high degree of security. However, some fingerprint images captured in
various applications are poor in quality, which corrupts the accuracy of fingerprint recognition.
Consequently, fingerprint image enhancement is usually the first step in most automatic
fingerprint identification systems (AFISs).
2.3 Research Scope
Fingerprint image enhancement is a common and critical step in fingerprint recognition systems.
To enhance the images, most of the existing enhancement algorithms use filtering techniques
that can be categorized as isotropic and anisotropic according to the filter kernel. Isotropic
filtering can properly preserve features on the input images but can hardly improve the quality of
the images. On the other hand, anisotropic filtering can effectively remove noises from the
image but only when a reliable orientation is provided.
It is obvious that fingerprints are the most widely applied biometric identifiers. With the help of
high performance computers, Automatic Fingerprint Identification Systems (AFIS) have
Fig 2-5 Continuous phase for a whorl pattern (a) continuous phase given by �$% � &% (b) Continuous phase modulo 2' (c) Gray scale image given by
()* ��$% � &% (d) Gradient of the continuous phase[53]

17
gradually replaced human experts in fingerprint recognition as well as classification. However,
fingerprint images contain noises caused by factors such as dirt, grease, moisture, and poor
quality of input devices and are one of the noisiest image types, according to O’Gorman [11].
Therefore, fingerprint enhancement has become a necessary and common step after image
acquisition and before feature extraction in the AFIS.
Various ridge frequency and minutiae types should be used to reconstruct images that are even
more consistent with the original fingerprints. The acceptance rate reported in various papers
for fingerprint enhancement can be further improved by reducing the image quality around the
spurious minutiae. To reduce the risk of attacks using reconstructed fingerprints, robust
fingerprint template security [63] and spoof detection techniques [64] should be developed.
In this thesis by applying a bank of Gabor filters [65] on input fingerprint images, orientation field
from a set of filtered images can be estimated. Automatic fingerprint matching depends on the
comparison of these local ridge characteristics and their relationships leading to personal
identification.
2.4 Reader’s Guide
The remainder of the document is structured as follows:
Chapter 2: Various previous works related to security and systems are mentioned in this
chapter
Chapter 3: In this chapter various fingerprint representations are introduced and general review
of image enhancement, feature extraction, and matching techniques that are used in fingerprint
recognition systems are provided.

18
Chapter 4: The following sections describe the components and algorithms that make up a
typical fingerprint recognition system
Chapter 5: Image enhancement techniques may be grouped as either subjective enhancement
or objective enhancement. This chapter gives a detailed knowledge about the technique.

19
CHAPTER 3
FINGERPRINT IMAGE REPRESENTATION
In this chapter various fingerprint representations are introduced and general review of image
enhancement, feature extraction, and matching techniques that are used in fingerprint
recognition systems are provided. A fingerprint is the impression resulting from the friction
ridges on the outer surface of the skin on a finger or thumb. While an in depth analysis of the
way that fingerprints are formed is not within the scope of this thesis, it is commonly assumed
within fingerprint biometric circles that no two people have the same fingerprints. A corollary to
this assumption is that given a fingerprint, the information contained within is sufficient to
uniquely identify a single individual. The validity of these assumptions is also outside the scope
of this thesis. The ridges and interleaving valleys that constitute a fingerprint create two levels of
detail that can be observed. The high level detail is the overall shape that is formed by the
ridges.
3.1 Fingerprint Representation
There are mainly three different kinds of fingerprint representations that are used in fingerprint
recognition systems and each has its own advantages and drawbacks.
When observing the patterns that the ridges of a fingerprint form together, Sir Edward Henry
[54] created a classification of fingerprints into five classes. These classes are, arch, tented
arch, left loop, right loop and whorl. Samples of these fingerprint shapes can be seen in Fig 3-1.

20
Fig 3-1 Sample fingerprints with their associated shapes [54]
There are two main features that define the shape of a fingerprint. These are cores and deltas
(also collectively known as macro-singularities). A core is often described as a point where a
single ridge line turns through 180 degrees. Similarly, a delta is described as a point where
three ridge lines form a triangle. It can be seen in Fig 3-2 where the cores and deltas are
marked. These core and delta points characterize the overall shape. Arches can be easily
identified through the lack of any delta or core points. Also, whorls can be easily identified
through the presence of two core and two delta points. Differentiating the right loop, left loop
and tented arch is slightly more difficult, as all three have one core and one delta point.

21
Fig 3-2 Sample fingerprints, with core points marked with a square, and delta points marked with a triangle [54]
3.1.1 Image-based representation
In image based representation, the fingerprint image itself is used as a template. There is no
need for a specific feature extracting algorithm, and the raw intensity pixel values
are directly used. This representation retains the most information about a fingerprint since
fewer assumptions are made about the application. However, a fingerprint recognition system
that uses the image-based representation requires tremendous storage space.
For example, a 0.8mm×1.0mm (400 ×500 pixels) fingerprint is obtained by a scanner at 500
dots per inch (DPI) with 8 bits gray-scale resolution. The resulting fingerprint image is 400 -500 - 8 �0.2 Mbytes. A system with large amount of fingerprint data may have

22
difficulty storing all the templates. For example, FBI has collected more than 200
million fingerprints since 1924 which require more than 250 terabytes storage
space [10]. Traditional compression techniques, such as JPEG [46] tend to lose the
highest frequency details, which contain discriminating information and the blocking
artifacts also affect the performance of automatic fingerprint recognition systems. FBI
recommends a compression method based on WSQ (Wavelet Scalar Quantization) [10], which
can preserve the discriminating information without blocking artifacts while achieving a high
compression ratio (around 20:1). However, it still requires about 20 Kbytes to store a
compressed fingerprint image.
3.1.2 Global Ridge Pattern
This representation relies on the ridge structure, global landmarks and ridge pattern
characteristic, such as the singular points, ridge orientation map, and the ridge frequency map.
This representation is sensitive to the quality of the fingerprint images [11]. However, the
discriminative abilities of this representation are limited due to absence of singular points.
3.1.3 Local Ridge Detail
This is the most widely used and studied fingerprint representation. Local ridge
details are the discontinuities of local ridge structure referred to as minutiae. Sir Francis
Galton (1822-1922) was the first person who observed the structures and permanence of
minutiae. Therefore, minutiae are also called “Galton details”. They are used by forensic
exports to match two fingerprints.
There are about 150 different types of minutiae [11] categorized based on their configuration.
Among these minutia types, “ridge ending” and “ridge bifurcation” are the most used, since all
other types of minutiae can be seen as the combinations of “ridge endings” and “ridge
bifurcations”.
23
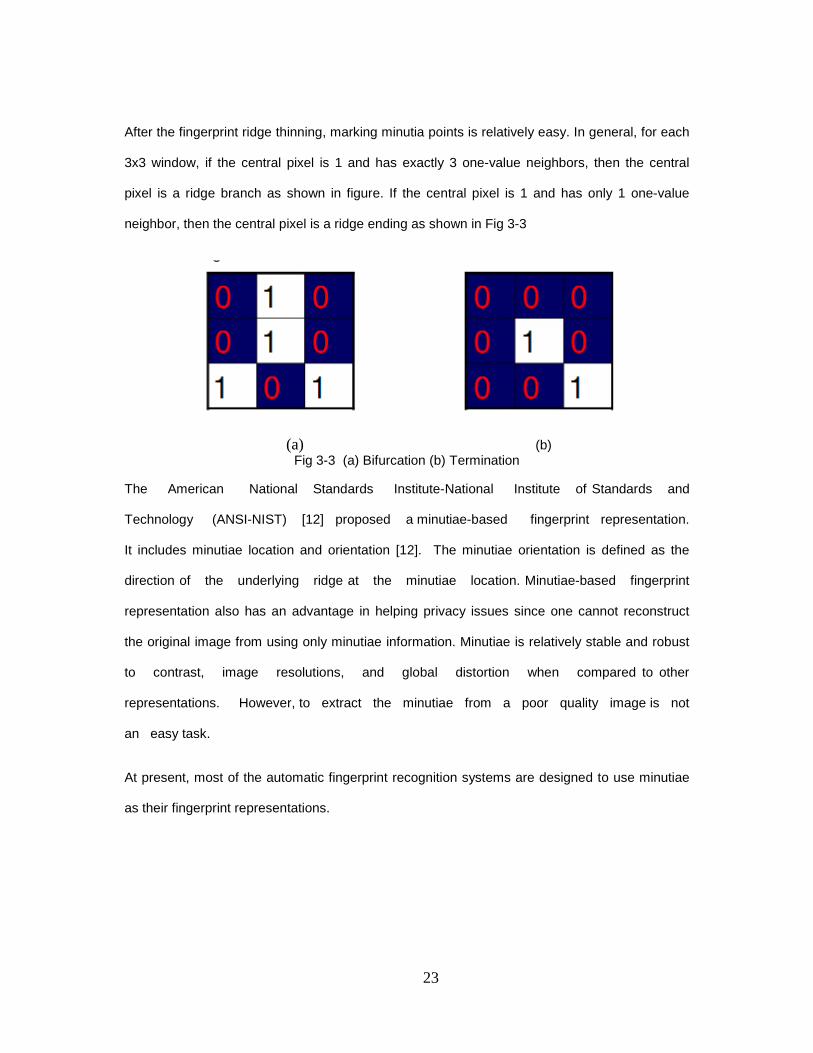
After the fingerprint ridge thinning, marking minutia points is relatively easy. In general, for each
3x3 window, if the central pixel is 1 and has exactly 3 one-value neighbors, then the central
pixel is a ridge branch as shown in figure. If the central pixel is 1 and has only 1 one-value
neighbor, then the central pixel is a ridge ending as shown in Fig 3-3
(a) (b) Fig 3-3 (a) Bifurcation (b) Termination
The American National Standards Institute-National Institute of Standards and
Technology (ANSI-NIST) [12] proposed a minutiae-based fingerprint representation.
It includes minutiae location and orientation [12]. The minutiae orientation is defined as the
direction of the underlying ridge at the minutiae location. Minutiae-based fingerprint
representation also has an advantage in helping privacy issues since one cannot reconstruct
the original image from using only minutiae information. Minutiae is relatively stable and robust
to contrast, image resolutions, and global distortion when compared to other
representations. However, to extract the minutiae from a poor quality image is not
an easy task.
At present, most of the automatic fingerprint recognition systems are designed to use minutiae
as their fingerprint representations.

24
Fig 3-4 Some of the common minutiae types [59]
Some of the minutiae types are described in Fig 3-4[59]
3.1.4 Intra-ridge Detail
On every ridge of the finger epidermis, there are many tiny sweat pores (Fig 3-5). Pores are
considered to be highly distinctive in terms of their numbers, positions, and shapes.
However, extracting pores is feasible only in high-resolution fingerprint images (for example
1000 DPI) and with good image quality. Therefore, this kind of representation is not practical for
most applications.

25
Fig 3-5 Pore and ridge edge contour
3.2 Minutiae-Based Fingerprint Recognition
Minutiae-based fingerprint representation [75] to design the systems due to the advantages of
wide accessibility and stability has been described in Section 3.1.3. Minutiae-based fingerprint
representation and matching are widely used by both machine and human experts.
Minutiae representation has several advantages compared to other fingerprint
representations (Section 3.1.3). Minutiae have been (historically) used as key features in
fingerprint recognition tasks. Its configuration is highly distinctive and several theoretical models
[13, 14, and 15] use it to provide an approximation of the individuality of fingerprints. Minutiae-
based systems are more accurate than correlation based systems [16] and the template
size of minutiae-based fingerprint representation is small. Forensic experts use this
representation which has now become part of several standards [12, 17] for exchange of
information between different systems across the world.
pore
Ridge Edge

26
3.3 Fingerprint Image Enhancement
Fingerprint image quality is an important factor in the performance of minutiae extraction and
matching algorithms. A good quality fingerprint image (Fig 3-6(a)) [59] has high contrast
between ridges and valleys. A poor (Fig 3-6(b)) [59] quality fingerprint image is low in contrast,
noisy, broken, or smudgy, causing spurious and missing minutiae. Poor quality can be due to
cuts, creases, or bruises on the surface of finger tip, excessively wet or dry skin condition,
uncooperative attitude of subjects, damaged and unclean scanner devices, low quality
fingers (elderly people, manual workers), and other factors.
The goal of an enhancement algorithm is to improve the clarity (contrast) of the ridge structures
in a fingerprint. General-purpose image enhancement techniques are not very useful due
to the non-stationary nature of a fingerprint image. However, techniques such as gray-level
smoothing, contrast stretching, histogram equalization, and Wiener filtering [18, 19, and 20] can
be used as preprocessing steps before a sophisticated fingerprint enhancement algorithm is
applied.
Techniques that use single filter convolutions on the entire image are not suitable. Usually, a
fingerprint image is divided into sub regions and then a filter whose parameters are pre-tuned
according to the region’s characteristics is applied. Each local region of a fingerprint can be
seen as a surface wave of a particular wave (ridge) orientation (perpendicular to the flow
direction) and frequency. Several types of contextual filters in both spatial and frequency
domains have been proposed in the literature [67]. The purpose of the filters is to fill
small gaps (low-pass effect) in the direction of a ridge and to increase the
discrimination (band-pass effect) between ridges and valleys in the direction orthogonal to the
ridge [68]. O’Gorman and Nikerson [67] were the first to propose the use of contextual filtering.

Fig 3-6 a) Good quality fingerprint image (b) Poor quality fingerprint image [59]
Recently, Greenberg et al [20] proposed the use of an anisotropic filter that
parameters to the structure of the underlying
[21] proposed to convolve a fingerprint image with an anisotropic filter to remove Gaussian
noise and then apply directional median filters (DMF)
On visual inspection, enhancement r
obtained by Greenberg et al [20].
Anisotropic filters remove Gaussian noise and smoothen the fingerprint image along the local
ridge direction.
The standard rectangular-shaped median filters produce artifacts in fingerprint images. Wu
[21] use directional median filters whose shapes vary by their direction
27
(a) (b)
) Good quality fingerprint image (b) Poor quality fingerprint image [59]
[20] proposed the use of an anisotropic filter that
the structure of the underlying sub region. Wu, Shi, and Govindaraju
[21] proposed to convolve a fingerprint image with an anisotropic filter to remove Gaussian
noise and then apply directional median filters (DMF) [80] to remove impulse noise.
On visual inspection, enhancement results of Wu et al [21] appear to be superior to those
al [20].
Anisotropic filters remove Gaussian noise and smoothen the fingerprint image along the local
shaped median filters produce artifacts in fingerprint images. Wu
[21] use directional median filters whose shapes vary by their direction.
) Good quality fingerprint image (b) Poor quality fingerprint image [59]
[20] proposed the use of an anisotropic filter that adapts its
. Wu, Shi, and Govindaraju
[21] proposed to convolve a fingerprint image with an anisotropic filter to remove Gaussian
noise.
to be superior to those
Anisotropic filters remove Gaussian noise and smoothen the fingerprint image along the local
shaped median filters produce artifacts in fingerprint images. Wu et al

28
Note that the shape of the filter changes along with its direction.
Sherlock, Monro, and Millard [2] proposed a fingerprint enhancement method in the Fourier
domain. In this approach, a fingerprint image is convolved with pre-computed filters which
results in a set of filtered images. The enhanced fingerprint image is constructed by selecting
each pixel from the filtered image whose orientation is the closest to that of the
original pixel. However, their assumption of constant ridge frequency limits the performance of
the approach. Willis and Myers [23] presented an FFT [9] based fingerprint enhancement
method. Instead of explicitly computing the local ridge direction and frequency, enhancement is
achieved by multiplying the Fourier transforms of the block by magnitude of power, k (1.4 in
[23]). Chikkerur [24] proposed an algorithm based on short time Fourier transform
(STFT), and a probabilistic approximation of dominant ridge orientation and frequency was
used instead of the maximum response of the Fourier spectrum to remove impulse
noise (small gaps on bridge or dots in valleys). The ridge orientation image, ridge frequency
image, and foreground region image are generated simultaneously while performing the STFT
analysis.
A wavelet-based method is proposed by Hsieh et al [25]. It uses both local ridge orientation
and global texture information. Fingerprint image is first wavelet-decomposed into
“approximation” and “detail” sub-images. A series of texture filters and a directional
compensation process based on a voting technique are applied on those sub-images. The
enhanced fingerprint image is then obtained by the reconstructing process of wavelet transform.
3.4 Minutiae Extraction
The reliability of minutiae features (see Section 3.1.3) plays a key role in automatic fingerprint
recognition. Generally, the minutiae representation of a fingerprint consists of simply a list of
minutia points associated with their spatial coordinates and orientation. Some methods also
include the types [26, 27, 28, and 29] and quality [28, 30, and 31] of minutiae in the

29
representation. Minutiae extraction algorithms are of two types: [59] (i) binarization-based
extraction and (ii) gray-scale based extraction.
3.4.1 Binarization-based Minutiae Extraction
Most of the proposed minutiae extraction methods are binarization-based approaches. They
require conversion of the gray-scale fingerprint image (8 bits per pixel, 256 gray
levels) into a binary form (1 bit per pixel, black or white). Various binarization techniques have
been presented in the image processing literature [33, 32]. One intuitive approach is to use a
global threshold (th) and assign each pixel a value as follows:
1 if I (x, y) > th
IB (x, y) =
0 if I (x, y) <= th
where I (x, y) is the intensity value of the pixel at (x, y) in a gray-scale image.
Otsu’s method [35] describes a technique to obtain the global threshold (th) from a statistical
viewpoint. Dong and Yu [34] use a data clustering approach which is equivalent to
Otsu’s method [35] but is more efficient. The contrast variation in a fingerprint image
makes it impossible to find an optimal global threshold. Adaptive techniques are preferred in
general but they fail on poor quality images.
Several methods have been proposed to utilize the flow texture of a fingerprint image in
binarization tasks. Stock and Swonger [36] observed that the average local intensity of a ridge
line along its flow direction is highest and used it in binarization. Ratha, Chen and Jain [37] use
a 16 × 16 window centered and oriented along the local ridge direction on each
pixel. Ridge lines are recognized as peaks of the gray-level profile of pixel intensities
projected on the central segment of the window. Coetzee and Botha [38] use a local
binarization technique. The area between two edges of a local block is blob-
colored and then logical ORed with the result of local binarization of the same local block to

30
produce the final binarized image. Garris et al [30] and Watson et al [31] propose a directional
binarization technique. In this approach, each pixel is examined successively and assigned to
black (0) or white (1). By consulting the intrinsic orientation map, a pixel is assigned to white
if there is no detectable ridge flow for the local block. If the flow is well defined
in the pixel’s local block, then an orientated window (7 × 9) is used to analyze the
neighboring pixel intensity of the pixel (Fig 3-7). The rows of the window are aligned with the
local ridge and the central row sum is compared against the average row sum of the entire
window. A pixel is white if the central row sum is less than the window’s average row sum;
otherwise, it is black. Other fingerprint binarization methods can be found in [39, 40, 41, 42, 43,
and 44].
Usually, the binarization-based minutiae extraction methods apply a thinning algorithm after the
binarization step to obtain the skeletons of fingerprint ridges. Once a binary skeleton of a
fingerprint is obtained, minutiae extraction becomes a trivial task. It is assumed that the
foreground and background pixel values of a fingerprint skeleton are 1 and 0, respectively.

31
Fig 3-7 (a) The window used for analyzing the surrounding pixel intensity (b) the window oriented along the local ridge direction [59]
Minutia can be detected by examining the 8-neighborhood of a ridge skeleton pixel at
(x, y).
Many thinning approaches [86] have been proposed. However, thinning tends to introduce
hair-like artifacts along the one-pixel wide skeleton, which leads to detection of spurious
minutiae. Various techniques [37, 45] are introduced between the stages of binarization
and thinning to improve the quality of binarized fingerprint images by filling holes,
smoothing ridges, and removing small gaps and other artifacts.
Several approaches have been also proposed to extract minutiae directly from the binarized
fingerprint image to avoid the computationally intensive thinning process. Weber
[101] proposed a method that extracts minutiae from the thick binary ridges using

32
a rule based ridge tracking algorithm. Garris et al [28] (see also Watson [100]) use a series of
pixel patterns to detect minutiae on binraized fingerprint images. A method based on chaincode
is proposed by Govindaraju et al [97]. It is a lossless representation of an object contour and is
widely used in document analysis and recognition research [67]. It is generated by tracing the
exterior contours of a binary object counterclockwise (clockwise for interior contours) and stored
in contour lists. In the contour list, each contour element contains the x, y coordinates of the
pixel, the direction of the contour into the pixel, and curvature information. The chaincode
representation of fingerprint ridge contours provides several advantages in minutia detection:
• It is a lossless representation, thus, most of fingerprint information is retained.
• It is easy to remove small objects and holes from the ridge contours. Therefore, the
number of spurious minutiae is few.
• It works directly on binarized image and eliminates the need for thinning.
• Minutiae are the significant turns in the ridge contour.

33
CHAPTER 4
REVIEW OF THE AUTOMATIC FINGERPRINT IDENTIFICATION SYSTEM
The following sections describe the components and algorithms that make up a typical
fingerprint recognition system. While individual systems will not necessarily do things the way
they are described here, the basic principles are described and examples are given wherever
possible. Note that this is not always possible, due to the proprietary nature of the technology
and algorithms involved. Also, there are two main system methodologies for fingerprint
matching, those that utilize minutiae matching, and those that use pattern matching on the
overall ridge structure.
4.1 Capture Devices
The following sections describe the function of each component of a fingerprint capture device.
4.1.1 Scanning
For fingerprints there are a number of alternative data capture devices (Fig 4-1). These include
optical scanners, silicon based capacitance and thermal sensors, pressure based sensor and
ultrasound devices. The main objective of a fingerprint scanner, regardless of the method it
uses, is to provide the system with an image of the fingerprint that is as accurate as possible.
For most applications, the image is produced at a resolution of 500 dpi using an 8-bit gray-
scale. The following sections describe how each of the different kinds of fingerprint scanners
works.

34
Fig 4-1 Fingerprint scanner
4.1.2 Optical
Optical devices [22, 54] are one of the more common fingerprint scanning devices. They are
based on the reflection changes that occur when a light source interacts with the ridge lines of a
fingerprint. This is most commonly achieved through the use of Frustrated Total Internal
Reflection (FTIR). The light source shines onto a special reflection surface, which reflects the
light differently depending on the pressure applied to it. A light sensor is used to capture the
'image' of the fingerprint. Fig 4-2 depicts the general layout of a typical optical scanner. Due to
the involvement of pressure, this type of scanner returns different quality images depending on
the pressure applied to the reflective surface (by the fingerprint).
If too little pressure is applied, the sensors may not be able to create an image at all.
Alternatively, if too much pressure is applied, the skin in between the fingerprint ridges will also
be in contact with the reflective surface, causing a lack of definition between ridges and valleys.
Optical scanners are also affected by dirty fingerprints, which can also result in unusable
images.

35
Due to the required placements of the light source, reflective surface and light sensors, optical
scanners are typically physically large components. However some companies have developed
improved methods to reduce the size of the component. An example of this is the Surface
Enhanced Irregular Reflection (SEIR) [81] technology patented by SecuGen Corporation.
Another weakness of optical scanners is that they must be cleaned regularly, to avoid dust; dirt
and oil build up on the reflective surface. Also, optical scanners are the most vulnerable to
physical replay attacks. This is where the latent print of the previous user is used to gain access
to the system. This can theoretically be achieved in some scanners simply by shining an
external light at the correct angle.
Optical models generally claim that they cannot be fooled by a 2-dimensional image of a
fingerprint; however a simple 3D model (e.g. latex rubber or similar product) is often sufficient.
Fig 4-2 General layout of an optical fingerprint scanner, reproduced from [Atmel Corporation 2001] [54]

36
4.1.3 Capacitance
Capacitive fingerprint scanners [22, 54] create images of a fingerprint through the use of
rectangular arrays of capacitors. The capacitors are located under a very thin protective layer
that must be thick enough to protect the capacitors, but also thin enough so it does not obscure
the readings. When a finger is placed on the scanner, the capacitors measure the capacitance
difference generated by the different distances between the capacitors and the ridge lines and
furrows. This concept is depicted in Fig 4-3. One disadvantage of using this method is that the
capacitance difference is significantly affected by moisture. Hence, fingers that are too wet, oily
or dry will generate low quality or unusable images. Also, the capacitors themselves are
vulnerable to Electro-Static Discharge (ESD) and external electric fields. As a result the
grounding of capacitance scanners is very important to prevent damage to the capacitors. One
major advantage of capacitance scanners is their reduced size. Scanners using this method
have been produced small enough to fit on PCM/CIA cards, and hence are convenient for use
in small portable devices such as laptop computers and mobile phones.
Fig 4-3 Depiction of a capacitance scanner [54]
4.1.4 Thermal
Thermal fingerprint scanners [22, 54] work in a manner similar to capacitance scanners.
However, instead of measuring the difference in temperature between the ridges and valleys of
the fingerprint (which are too small to measure effectively), the fingerprint image is generated by
converting the temperature differential on a sensor. For example, before a fingerprint is placed

37
on the scanner, all the thermal sensors are at equilibrium with the air temperature around the
scanner. Then when a fingerprint is placed on the sensor, those points where a ridge is in
contact will cause a change in temperature in the sensor for that point. However, those points
where there is a valley will still be measuring the local air temperature; hence those points have
no temperature differential, and are not activated.
The major drawback of this method is that the temperature difference disappears after less than
a tenth of a second as the finger and the sensors reach equilibrium. As a result, the image is
only available for a short period of time. This means that a user has a very short amount of time
to position his/her finger appropriately, before the image is gone. In order to counter this, Atmel
Corporation, a major producer of thermal fingerprint scanners has developed and patented a
sweeping technique. This technique works by sweeping a finger over the sensor array, which
takes the images from different times over the sweep (in a manner that is not affected by the
sweeping speed) and reconstructs the total fingerprint image from these images using a
proprietary and private algorithm. This allows the scanner to be reduced to approximately 1/5
the size of a normal square array scanner and eliminates the problem of the temperature
equalization, as the sweeping motion ensures that any one sensor is constantly changing
between finger temperature (ridge) and air temperature (valley).
4.1.5 Pressure
Purely pressure-based scanners [22, 54] that utilize silicon chips to convert pressure to an
electrical signal have been developed. Due to the natural pressure that is applied when a finger
is placed on a scanner, this is probably the most intuitive method to use. However, as these
scanners generally have low sensitivity, which is further lowered when a protective layer is
added; the resulting images have quite low detail. As a result, no known systems utilize this
method.

38
4.1.6 Ultrasound
Ultrasound scanners [22, 54] are the least common commercial option for fingerprint scanners.
They operate by using acoustic energy that is partially reflected at each interface between
different materials. The time between the reflections can be accurately measured to determine
the depth at which the reflection occurred (see Fig 4-4). The advantage of using ultrasound is
that the images returned are uncontaminated by any dirt or grease on the surface on which the
finger rests, or on the finger itself (from [Ultra-Scan Corporation]). This, according to the
manufacturer, results in higher quality images than is possible with optical systems. It also
renders a physical replay attack (using a latent print) conceptually impossible as a latent print
should not reflect sounds waves.
Fig 4-4 Operation of ultrasound scanner, sound waves return a partial echo at each change in material, from Ultra-Scan [54]

39
However, despite these advantages, ultrasound scanners have a number of major drawbacks.
Firstly, they are a large device (approximately 15 x 15 x 20 cm), preventing integration into
small or portable components. In addition they are noisy (due to internal mechanical
components), expensive and slow, with a single scan (at the highest quality setting) taking up to
4.60 seconds, according to [Ultra-Scan Corporation].
4.2 Scanning a Fingerprint
Many of the algorithms require a linear scan of the fingerprint image. Scanning is achieved by
moving a fixed size window across the picture in a grid-like pattern. This can be seen in the Fig
4-5. However, it is possible that areas of interest do not lie squarely in the one of the windows.
To account for this the window is then shifted just vertically, just horizontally, and then vertically
and horizontally by half the window size and the grid scan is completed again. Therefore, it
takes four scans of the image to do the linear scan. This is not a problem because it is used for
the preprocessing of a fingerprint image (which occurs only once) and is done in a linear
manner.
Fig 4-5 Scanned image

40
4.3 Steps for fingerprint enhancement
Fig 4-6 A flowchart of the proposed fingerprint enhancement algorithm [3]
The flowchart of the fingerprint enhancement algorithm is shown in Fig 4-6[3]
1) The image is first normalized to have desired mean and variance
2) It is then divided into non-overlapping blocks
3) Dominant ridge orientation is determined for each block
4) They are then smoothed and subsequently the block direction image is formed
5) Average ridge distance for the whole input image is determined
6) Directional filtering is used to enhance the image (Fig 4-6)
4.4 Normalization
Normalization is used to standardize the intensity values in an image by adjusting the range of
grey-level values so that it lies within a desired range of values.
The mean and variance of a gray level fingerprint image I are:

41
0�1 � 12 3 3 1��, 4
567
89:
567
�6:
;<=�1 � 12 3 3�1��, 4 > 0�1
567
89:
567
�6:
Let N(i; j) represent the normalized grey-level value at pixel (i, j). The normalized
image is defined as
0: � ?@ABC�D��,8 6E�D F@AB �G 1��, 4 >M
N(i,j) =
0: > ?@ABC�D��,8 6E�D F@AB otherwise
where M0 and VAR0 are the desired mean and variance respectively. Normalization is pixel-wise
operation. It does not change the clarity of the ridge and furrow structures.
The main purpose of normalization is (Fig 4-7)
1) To have images with similar characteristics
2) To remove the effect of the sensor noise.
3) To reduce the variation in gray level values along ridges and valleys.

42
Fig 4-7 Normalized image [7]
4.5 LRO (Local Ridge Orientation) (Fig 4-8):
The orientation field O is defined as a PxQ image where O(i,j) represents the local ridge
orientation at pixel(i,j).[1]
There are a number of techniques to calculate orientation fields; Local mean square estimation
based on gradient has been used.
1. The input image is first divided into a number of non-overlapping blocks
2. For each pixel p of the block the x and y components of the gradient, Gx and Gy
respectively, are calculated.
Gx=Hp/Hx
Gy= Hp/Hy
KGM,N GM,OPQ � K∑ �GN > GO ∑ 2GNGOSS PQ

43
3. The average gradient ф direction and dominant local orientation for the block are given
by
12 tan67 ∑ 2GNS GO∑ �GN S > GO
O�i, j � ф � Π/2
Additional low pass filtering is done in order to eliminate the wrongly estimated ridge.
Fig 4-8 Orientation field image

44
4.6 LRF (Local Ridge Frequency) [1]
1) Project gray values of all the pixels located in each block along a direction orthogonal to
the local orientation computed above. The projection forms 1D wave with the local
extrema corresponding to the ridges and valleys.
2) L(i,j) is the average number of pixels between two consecutive peaks in 1D wave. The
frequency f(i,j) is calculated as:
f (i,j)=1/L(i,j)
4.7 Algorithm for fingerprint enhancement: [1], [3]
1) The fast Fourier transform (FFT) (Fig 4-9) [9] of the fingerprint image is computed. Fast
Fourier transform is a discrete Fourier transform algorithm which reduces the number of
computations [Fig. 4.9] needed for N points from 2N2 to 2Nlog2N.
2) Fourier transform of the filter components Pi depends upon the orientation values. Each
directional filter Pi is point by point multiplied by F, obtaining n filtered image transforms
PFi, i=1, 2,…..., n.
3) Inverse FFT is calculated for each PFi resulting in n filtered images Ii, i=1,2,…..,n
(spatial domain).Inverse FFT is calculated which is exactly the reverse process of FFT
4) The filtered image is then formed by selecting, for each pixel position, the pixel value
from the pre-filtered image whose direction of filtering corresponds most closely to the
actual ridge orientation at that position.
The sinusoidal shaped waves of ridges and valleys vary slowly in a local constant orientation.
Therefore a bandpass filter tuned to the corresponding frequency and orientation can effectively
remove the noise and preserve the true ridge and valley structures.
For directional filtering, Gabor filter is proposed: [1], [4]

45
Fig 4-9 Algorithm for fingerprint enhancement [1]
----
----
----
----
----
----
----
----
----
----
----
----
---

46
CHAPTER 5
FINGERPRINT IMAGE ENHANCEMENT
Fig 5-1 Original fingerprint [83]
5.1 Image Enhancement
Original image is shown in Fig 5-1. Image enhancement [83] operation improves the quality of
the image and it can be used to improve the image contrast and brightness characteristics,
reduce its noise content, and/or sharpen its details. Image enhancement techniques may be
grouped as either subjective enhancement or objective enhancement. Subjective enhancement
technique may be repeatedly applied in various forms until the observer feels that the image
yields the details necessary for particular application. Objective image enhancement corrects an
image for known degradations. Here distortions are known and enhancement is not applied

47
arbitrarily. This enhancement is not repeatedly applied but applied once based on the
measurements taken from the system. Image enhancement falls into two broad categories:
Spatial domain technique and Frequency domain technique. Spatial domain refers to the image
plane itself, where approaches in this category are based on direct manipulation of pixels in an
image. Also, spatial domain refers to the aggregate of pixels composing an image.
They operate directly on these pixels. Frequency domain processing techniques are based on
modifying the Fourier transform of an image. The original image is processed and various
stages are shown in Fig 5-2.
Fig 5-2 Various stages in the enhancement process

48
Image enhancement means "making an image more vivid for human vision". Fingerprint
recognition has been used in identifying individuals for a long time and it is the most popular
method in biometric authentication at present. Consequently, no single standard method of
enhancement can be said to be "the best". Besides that, the nature of each image in terms of
distribution of pixel values will change from one area to another. Minutiae, typically including
termination and bifurcation, are characteristic features of fingerprints that determine their
uniqueness. In fingerprint recognition systems, valid minutiae can be hidden and spurious
minutiae can be produced due to the low quality of fingerprint image. So, fingerprint
enhancement is often required to enhance the quality of fingerprint image [3, 20]. Contrast of
an image is determined by its dynamic range, which is defined as a ratio between the brightest
and the darkest pixel intensities. Contrast enhancement techniques have various application
areas for enhancing visual quality of low contrast images [72, 73].
5.1.1 Orientation Estimation and Verification
Several methods of orientation estimation have been proposed including matched-filter based
approach [16], high-frequency power method [67], and the simplest and most frequently
adopted gradient-based approach [3, 4]. The associated orientations calculated by the gradient-
based approach with different operators (Kirsch, Robinson, Sobel, and Prewitt [76]) are also
shown in Fig 5-3. The top row of the Fig 5-3 shows six relatively clean ridge patterns (high
contrast) where (a) and (b) contain minutiae (ridge bifurcation and ridge ending), (c) and (d)
contain singular points (delta and core point), and the other two are noisy regions. Fig 5-3(e)
shows a circle -like pattern with a white circle having a black dot inside, and (f) looks like a grid
pattern with orthogonal ridge flows overlapping. It is observed that these four gradient operators
generate relatively consistent block orientations. However, only the orientations of patterns (a)
and (b) are reliable, and the other four are not. Actually, patterns (c) to (f) should not be
assigned any orientation since no orientation can properly represent these ridge flows.

49
Fig 5-3 Six ridge patterns and their orientations calculated by Kirsch(1st row), Robinson(2nd row), Sobel(3rd row), and Prewitt operators(4th row) [77]
Ideally, the intensity value of the orientation orthogonal to ridge flows can be modeled as a
sinusoidal plane wave (see Fig 5-4(a)). The width of the sinusoidal frequency can be considered
as the ridge frequency. This approach works under an assumption that a reliable ridge
orientation is already given. However, the previously mentioned algorithms will generate a ridge
orientation no matter how the image quality is. A noisy region may lead to a wrong ridge
orientation and a wrong ridge frequency. In such a case, applying an anisotropic filter on this
noisy region can hardly improve the quality of the image but introduces more false ridges and
features.
Fig 5-4 (a) A fingerprint ridge flows with ideal corresponding histogram. (b) Six directions for histograms examination [77].
A good orientation estimation algorithm should not only properly calculate flow orientation, but
also prevent assigning an orientation to noisy blocks or blocks containing singular points.

50
5.1.2 Predicting ridge orientations using minutiae triplets
Orientation of an image has been estimated in various ways. The orientation of a minutia is an
indication of the local ridge direction since the fingerprint is a smoothly changing oriented
texture pattern. Therefore, by observing the orientation of a group of minutiae one can
‘interpolate’ the underlying local ridge information. The proposed algorithm utilizes a set of three
minutiae points (minutiae triplet) to predict the orientation of a triangular fingerprint region
defined by the triplet. In the formulation, a minutia is represented as a three-tuple value, (x, y,
θ), where (x, y) is its spatial location and θ is its orientation. The algorithm [75] for generating
the orientation map has four main stages: (i) triplet generation; (ii) orientation prediction; (iii)
triplet pruning; and (iv) orientation smoothing.
1. Triplet generation:
Consider a minutiae template, M, of a fingerprint containing N minutiae points given by,
M = {m1,m2,…..mN} where mi= {xi,yi, θi}. A set of 3 minutiae points {mi}i=1,2,3,
characterized by a triangle with sides {Li}i=1,2,3 and interior angles {Φi}i=1,2,3
(a) Lmin≤ Li≤ Lmax , for all i=1,2,3. This ensures that the perimeter of the triangle
traverses a compact region, thus, avoiding the large global variability observed in
the fingerprints of most classes.
(b) θdif ≤ θmin where θdif = maxi=1,2,3 (θi- θmed) and θmed is the median of { θi}i=1,2,3. This
ensures that the orientations of component minutiae points are within a small
interval.
(c) θi ≤ θmin , for all i=1,2,3. This ensures that “narrow" triangles subtending a very small
area are avoided.
In the experiment performed [75] the values assumed are Lmax=300, θtotal =30:.

51
2. Orientation prediction: Consider a pixel P(x, y) located inside the triangular region
defined by the triplet, T. Let di = dist {mi, P}, be the Euclidean distance of this pixel from
all the three vertices such that d1 < d2 < d3. The orientation of the pixel, O(x, y), is then
computed as,
Y��, � � �Z�7 � � � �Z [7 � � �7 � � � �Z [ � �7�7 � � � �Z [Z
The angle θ7 (θZ) corresponds to the orientation of the vertex that is nearest to (farthest
from) the pixel P(x, y). Thus, O(x, y) is computed as a weighted sum of all the three
orientations with a higher weight being assigned to the orientation of the closest vertex.
The generated orientation map is shown in Fig 5-5. The orientations of ridges and,
thus, of associated minutiae in whorls change rapidly over a small area (e.g. at the core
region). Therefore, if triplets covering a large area are selected in the case of whorls,
then an accurate prediction may not be rendered. However, in the case of arches,
larger triplets provide good results since such rapid variations are not observed. The
triplet generation procedure described above is more conservative and is observed to
work well for all classes of fingerprints.
3. Triplet pruning: In a fingerprint image, minutiae tend to appear in clusters. For instance,
the regions near the core and delta have dense minutiae activity. It is therefore possible
for a triplet to reside inside the triangular region of another triplet or overlap with it. In
such cases, rather than consolidating the orientation information predicted by multiple
triplets, the information predicted only by a single good quality triplet is utilized. The
quality, Q, of each selected triplet is measured by examining the average length of the
sides of the triangle (Lavg), the orientations of component minutiae points with respect to
the median (θdiff ), and is computed as,

52
Q= (Lmax - Lavg ) ω1 + (\]^_6\`ab
\`ab cdef) ω2
Here, ω1 and ω2 are the weights associated with each term (ω1 = 0:4 and ω2 = 0:6, in
the experiments). This ensures that a triplet having minutiae of similar orientations and
traversing a relatively compact region is assigned a higher Q value ( Fig 5-5 (b)). A
good quality triangle will lead to a better estimation of the orientation of the underlying
ridges according to the algorithm. The orientation at discrete points (every 13th pixel) in
the fingerprint region is computed. Hence, for a 512 x 512 image, a 39 x 39 orientation
map is generated.
Fig 5-5 (a) Minutiae distribution of a fingerprint. (b) Examples of a good quality triplet (blue)
with Lavg = 112:66, θdiff = 5, Q = 237:63 and a bad quality triplet (red) with Lavg = 217, _diff = 26, Q = 67:55. (c) Estimated orientation map[75]
4. Averaging the orientation map: To obtain a smooth transition in orientations, the
predicted orientation map is convolved with a 3 x 3 local averaging filter.
5.2 Orientation method used in this thesis
The method used in this thesis for estimating the orientation of the image has been
described in detail.

53
5.2.1 LRO (Local Ridge Orientation)
The value of LRO at each pixel (i.e. the orientation image) is required as parametric input to the
filter. Since determining LRO reliably can be computationally demanding, it may not be feasible
to estimate LRO directly for every pixel. The approach is to determine LRO at a square grid
spaced (say) 16 pixels apart, and obtain intermediate values by interpolation. An alternative,
equally acceptable approach is to use a faster but perhaps less reliable algorithm to estimate
orientation at every pixel position and to smooth the resultant orientation image [74]. Either
approach can of course be used in conjunction with the filter.
Other researchers have worked with LRO values determined as one of four [79] or eight [78]
possible orientations. The algorithm, which determines LRO as one of 16 orientations θi = iΠ/16,
i = 0,1,2,…,15, i.e. to a precision of + Π/32, follows.
5.2.2 Algorithm for estimating LRO at a point
A window of size 32 by 32 pixels is centered at the point where the LRO is to be found. This
window is rotated to 16 different orientations, θi = iΠ/16, for i = 0, 1, 2… 15. At each orientation a
projection along the y-axis of the window is formed:
Ph�x � 7Z ∑ WhZ7O9: �x, y x= 0, 1, 2… 31
where W i(x,y) is the data inside the window at angle θi.
When the window is aligned with its x-axis perpendicular to the ridges, one expects maximum
variation of the projection, since ridges are crossed as x varies. Alignment of the x- axis along
the ridges should lead to minimum variation. This is illustrated in Fig 5-6.

54
A second order Butterworth band pass filter removes the noise from the projections. The total
variation Vi of each filtered projection is evaluated as:
;� � 3jG�a�� � 1 > G�a�� jZ7
f9:
where
G�a � kkl �Ph��
The LRO estimate is given by imaxΠ/l6, where Vimax is the maximum of the 16 variations. This
algorithm produces the correct value except in the noisiest regions. A simple model has been
developed describing the behavior of LRO, and incorrect estimates can be dealt with by
reference to this model.
Fig 5-6 Projections of a window of fingerprint image data. The projections which exhibit the greatest variation correspond to the orientation of the ridges within the window (here). Eight
projection are shown here [2].

55
5.3 Gabor Filter
In this section the Gabor filter is reviewed. The Gabor filter was originally introduced by Dennis
Gabor. The one-dimensional Gabor filter [65] is defined as the multiplication of a cosine/sine
(even/odd) wave with Gaussian windows (see Fig 5-7), as follows,
equation 1:
mn�� � 1√2�p �exp K>�
2p P . cos�2s� t:
eqation 2:
mu�� � 1√2�p �exp v>�
2p w . sin�2s� t:
where ω0 defines the centre frequency (i.e., the frequency in which the filter yields the greatest
response) and σ is the spread of the Gaussian window. The power spectrum of the Gabor filter
is given by the sum of two Gaussians centred at ±ω0
j|G�ω |j � expK>2π σ �ω >ω: P � exp K>2π σ �ω �ω: P This can be reasoned as follows. The power spectrum of a sine wave has two impulses
located at ±ω0 and the power spectrum of Gaussian is a (non-normalized) Gaussian.
Multiplication in the temporal (spatial) domain is equivalent to convolution in the
frequency domain [82].
The uncertainty principle states that the product of the spread (i.e., uncertainty) of a signal in the
time and frequency domains must exceed or equal a fixed constant,
∆t∆f y c

56
Fig 5-7 One dimensional Gabor filter [65]
where c is a constant, t and f represent the measure of the spread of the signal in the time
and frequency domains, respectively (see Fig 5-8). The implication of this principle is that the
accuracy with which one can measure a signal in one domain limits the attainable accuracy of
the measurement in the other domain. Gabor demonstrated that the complex Gabor filter given
by,
equation 3:
g�� � g{�� � jg|��
substituting equation 1 and equation 2 in equation 3:
m�� � 7√ }~ �exp �6fF
~F� . cos�2s�t: � 4 7√ }~ �exp K6fF
~F P . sin�2s� t:
Since exp[jθ] = cosθ + jsinθ
g�� � 1
√2Πσ �exp v>� 2σ2
w . expjK�2s�t: P

57
attains the optimal (lower bound) compromise between the localization in the time and
frequency domains; notice that the Gaussian function is an instance of a Gabor filter with
center frequency ω0= 0. Note that the constituent real-valued Gabor elementary functions
(i.e., the even and odd parts taken separately) do not as widely believed minimize the joint
uncertainty. Furthermore, the selection of a different localization measure may result in a
different class of “optimal” function altogether casting doubt on the primacy of the Gabor
function often cited in the literature.
Daugman extended the Gabor filter to two- dimensions (see Fig 5-9), as follows,
ge��, y � 1
2πσfσy exp v> 12
��2σf � y2
σy�w . K cos�2πωf0� � 2πωy0y P
go��, y � 1
2πσfσy exp v> 12
��2σf � y2
σy�w . Ksin�2πωf0� � 2πωy0y P
where (ωf0,ωy0) defines the center frequency and (σ�,σy) the (potentially asymmetric) spread
of the Gaussian window.
For the purpose of extracting optical flow, Heeger [87] utilized the three-dimensional
(space-time) Gabor filter,

58
Fig 5-8 Joint localization of a signal in time and frequency domain [65]
where(ωx0,ωy0,ωt0) defines the center frequency and (σx ,σy,σt) defines the (potentially
asymmetric) spread of the Gaussian window.
Heeger demonstrated that the three-dimensional (similarly for the two-dimensional case) Gabor
filter can be built from one-dimensional separable components. Considering the two-
dimensional Gabor filter let k be the size of the two-dimensional convolution kernel and n be the
size of an image (in pixels). The complexity of the non-separable convolution of the Gabor filter
is reduced from O�k,n 2 to O (kn2).
An application of Gabor filters is in local time-frequency analysis of signals, specifically, a
fixed windowed Fourier transform, referred to as the Gabor transform. A difficulty with the
Gabor transform is that it is linearly independent but highly non-orthogonal and as such cannot
be easily inverted. As a result of non-orthogonality, the functions, r(n), used for reconstructing
the discrete signal, f(n), are highly distinct from the Gabor functions used to recover the

59
coefficients of the representation (i.e., the analysis step), where the coefficients indicate how
much of its corresponding reconstruction filter, r (n), is to be added, formally,
f�n � ∑ cii ri�n reconstruction step
where
ci � ∑ f�n i gi�n analysis step
If the Gabor transform is indeed orthogonal (such as the Fourier transform), then
gi�n � ri�n
Fig 5-9 Two dimensional Gabor filters [65]

60
Gabor filters optimally capture both local orientation and frequency information from a fingerprint
image. By tuning a Gabor filter to specific frequency and direction, the local frequency and
orientation information can be obtained .
An even symmetric Gabor filter has the following general form in the spatial domain:
m��, �; G, [ � exp �67 vf�F
H��F � ��FH��F w� cos�2�G�� equation 1
�� � ����[ � ����[ equation 2
�� � ����[ > ����[ equation 3
where f is the frequency of the sinusoidal plane wave along the direction θ from the x axis and
Hx and Hy are the space constants of the Gaussian envelop along the x and y axes respectively.
The filtering is performed in the spatial domain with a mask size of 32x32. The frequency f is the
average ridge frequency (1/K), where K is the average inter ridge distance. The average inter
ridge distance is approximately 10 pixels in a 500 dpi fingerprint image. Hence, f = 1/10. Sixteen
different orientations are examined.
In this thesis the Gabor filter is applied to the original image after it is normalized and orientation
is performed.

61
5.4 Results
(a) (b)
(c) (d)
(e)
Fig 5-10 Image 1(a) Original image (b) Gabor filtered image (c) Histogram of the original image (d) Histogram of the Gabor filtered image (e) Histogram equalized of the Gabor filtered image
No.
of P
ixel
s
Intensity Intensity
No.
of P
ixel
s

62
(a) (b)
(c) (d)
(e)
Fig 5-11 Image 2(a) Original image (b) Gabor filtered image (c) Histogram of the original image (d) Histogram of the Gabor filtered image (e) Histogram equalized of the Gabor filtered image
Intensity
No.
of P
ixel
s
Intensity
No.
of P
ixel
s

63
(a) (b)
(c) (d)
(e)
Fig 5-12 Image 3(a) Original image (b) Gabor filtered image (c) Histogram of the original image (d) Histogram of the Gabor filtered image (e) Histogram equalized of the Gabor filtered image
Intensity
No.
of P
ixel
s
No.
of P
ixel
s
Intensity

64
(a) (b)
(c) (d)
(e)
Fig 5-13 Image 4(a) Original image (b) Gabor filtered image (c) Histogram of the original image (d) Histogram of the Gabor filtered image (e) Histogram equalized of the Gabor filtered image
No.
of P
ixel
s
No.
of P
ixel
s
Intensity Intensity

65
(a) (b)
(c) (d)
(e)
Fig 5-14 Image 5(a) Original image (b) Gabor filtered image (c) Histogram of the original image (d) Histogram of the Gabor filtered image (e) Histogram equalized of the Gabor filtered image
Intensity
No.
of P
ixel
s
No.
of P
ixel
s
Intensity

66
Fig 5-15 Image 6(a) Original image (b) Gabor filtered image (c) Histogram of the original image (d) Histogram of the Gabor filtered image (e) Histogram equalized of the Gabor filtered image
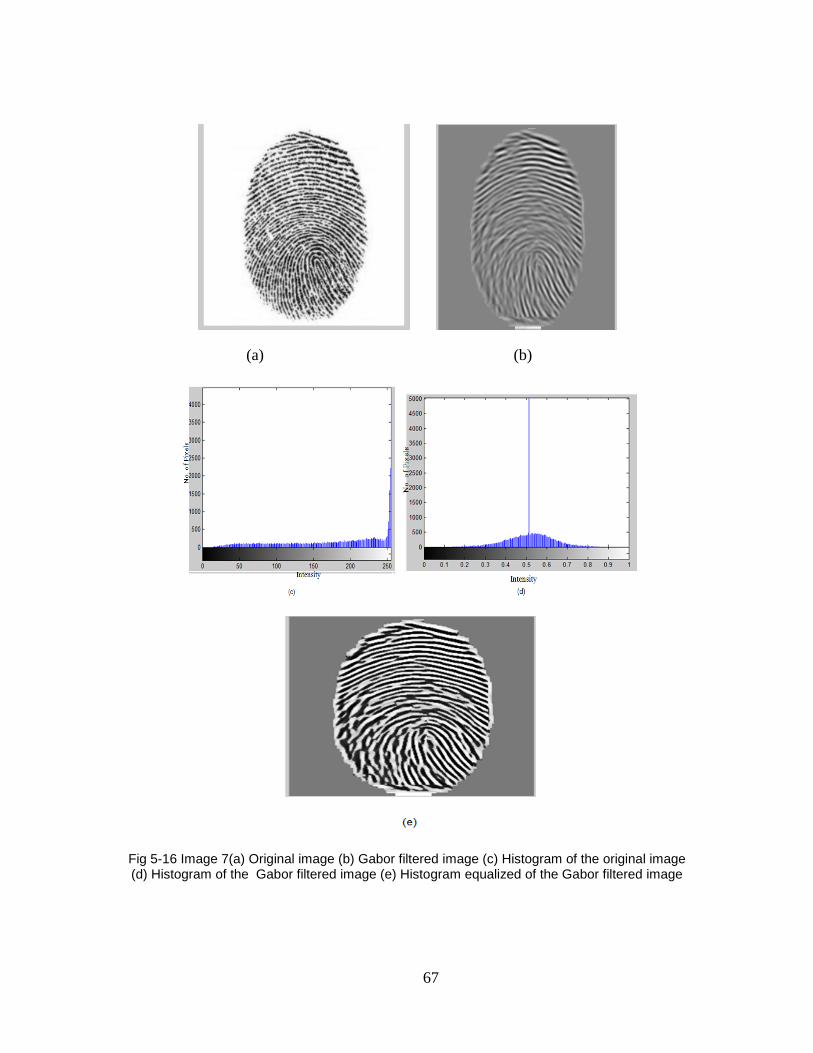
67
(a) (b)
Fig 5-16 Image 7(a) Original image (b) Gabor filtered image (c) Histogram of the original image (d) Histogram of the Gabor filtered image (e) Histogram equalized of the Gabor filtered image

68
5.5 Histogram
Contrast of an image is determined by its dynamic range, which is defined as a ratio between
the brightest and the darkest pixel intensities. Contrast enhancement techniques had various
application areas for enhancing visual quality of low contrast images. Original and final image
histograms are shown in Fig 5-120c and Fig 5-120d respectively.
5.6 Histogram equalization
Histogram equalization is a general process used to enhance the contrast of images by
transforming its intensity values. The spread of the histogram over the entire intensity is
increasing the contrast and the average intensity level in the histogram of the equalized image
is higher (lighter) than the original. Histogram equalization has been applied to the enhanced
image as shown in Fig 5-120e.
5.7 Verification
For comparison, the images are shown: enhanced with the STFT method [24]
(MATLABcodeavailablefromhttp://www.cubs.buffalo.edu/code
Table 1: Comparison of number of minutiae for various enhancement approaches
Fig. A
Without enhancement 188
STFT 132
Gabor filter 118
A – Automatically extracted minutiae

69
5.8 Conclusions
In this thesis Gabor filter is used for fingerprint enhancement technique. Because of its
frequency selective and orientation selective properties it proves to be useful for fingerprint
enhancement. A window of size 32 by 32 pixels is centered at the point where the LRO is to be
found. This window is rotated to 16 different orientations. The projections which exhibit the
greatest variation corresponds to the orientation of the ridges within the window. The primary
advantage of the approach is improved translation and rotation invariance. Future work would
involve making the fingerprint enhancement technique more efficient.

70
APPENDIX A
GABOR FILTER

71
An even symmetric Gabor filter has the following general form in the spatial domain:
m��, �; G, [ � exp �67 vf�F
H��F � ��FH��F w� cos�2�G�� equation A.1
�� � ����[ � ����[ equation A.2
�� � ����[ > ����[ equation A.3
where f is the frequency of the sinusoidal plane wave along the direction θ from the x axis and
Hx and y are the space constants of the Gaussian envelop along the x and y axes respectively.
The filtering is performed in the spatial domain with a mask size of 32x32. The frequency f is the
average ridge frequency (1/K), where K is the average inter ridge distance. The average inter
ridge distance is approximately 10 pixels in a 500 dpi fingerprint image. Hence, f = 1/10. Sixteen
different orientations are examined.

72
Fig A-1 The range of x and y goes from -15 to 15 to produce the Gabor kernel
x --->
y --
->

73
Fig A-2(a) block – 32x32 (b)FFT of block (c) Gabor Kernel – 32x32 (d)FFT of Gabor Kernel
We input different values of x and y from fig A.1 which varies from -15 to +15 and different
orientation values and substitute them in equation A.2 and A.3. Then after that we input those
values from equation A.2 and A.3 in equation A.1 to obtain Gabor kernels (32x32) (fig.A.2 (c)).
Then we convolve the Fourier image and Fourier filter bank (fig A.3).
Let I(x,y) be the image
Let g(x,y,f,theta) be the Gabor filter Let F(.) be the Fourier transform and Finv(.) be the inverse
Fourier transform. Let * be the convolution and . be pointwise multiplication.
I(x,y)*g(x,y,f,theta)=Finv(F(I(i,x)).F(g(x,y,f,theta)))=Gabor filtered image.
(a) block – 32x32 (c) Gabor Kernel – 32x32
(b)FFT of (d)FFT of Gabor Kernel

74
Fig A-3 Gabor filters of size 16 × 16 by 8 orientations and 5 Resolutions (real part).

75
REFERENCES
[1] A.M.Raic�evic and B.M. Popovic, “An effective and robust enhancement by adaptive filtering
domain”, SER.:ELEC.ENERG. vol.22, no. 1, pp.91-104, April 2009.
[2] B.G. Sherlock, D.M. Monro, and K. Millard, “Fingerprint enhancement by directional Fourier
filtering”, IEE Proc. Vision Image Signal Process., vol.141, no. 2, pp. 87-94, April 1994.
[3] L. Hong, Y.Wan, and A.K. Jain, “Fingerprint image enhancement: Algorithm and
performance evolution”, IEEE Trans. PAMI, vol. 20, no. 8, pp. 777-789, Aug. 1998.
[4] J.Yang, L. Lin, T. Jiang, and Y.Fan, “A modified Gabor filter design method for fingerprint
image enhancement”, Pattern Recognition Letters, vol. 24, no. 12, pp. 1805-1817, Jan.
2003.
[5] A.K. Jain and F. Farrokhnia, “Unsupervised texture segmentation using Gabor filters”,
Pattern Recognition, vol. 24, no. 12, pp. 1167-1186, May 1991.
[6] K. Karu and A.K. Jain, “Fingerprint classification”, Pattern Recognition, vol.29, no. 3, pp.
389-404, Mar. 1996.
[7] Fingerprint database , “http://www nist.gov/itl/iad/ig/sd27a.cfm”
[8] A.L Bovik, Handbook of Image and Video Processing. Elsevier, 2005.
[9] K.R.Rao, D.N.Kim and J.J.Hwang, “Fast Fourier transform: Algorithms and applications”,
Heidelberg, Germany: Springer 2010.
[10] C.M. Brislawn, et al, “The FBI compression standard for digitized fingerprint images”,
Proceedings of SPIE, vol. 2847, pp. 344– 355, Aug. 1996.
[11] A. K. Jain et al, “An identity authentication system using fingerprints”, Proc. IEEE, vol. 85,
no. 9, pp. 1365–1388, Sep. 1997.

76
[12] American National Standards Institute, “American national standard for information
systems-data format for the interchange of fingerprint information”, 1993. Doc#
ANSI/NIST-CSL 1-1993.
[13] H.C. Lee and R.E. Gaensslen, “Advances in fingerprint technology”, Elsevier, New York,
2nd edition, 2001.
[14] S. Pankanti, S. Prabhakar, and A. K. Jain, “On the individuality of finger print”, IEEE
Transaction on PAMI, vol. 24, no. 8, pp. 1010–1025, Aug. 2001.
[15] D. A. Stoney and J. I. Thornton, “A critical analysis of quantitative fingerprint individuality
models”, Journal of Forensic Sciences, vol. 31, no. 4, pp. 1187–1216, Oct. 1986.
[16] D. Maio, et al, “FVC2002: Second fingerprint verification competition”, International
Conference on Pattern Recognition (16th), vol. 3, pp. 811–814, Dec 2002.
[17] American National Standards Institute Common biometric exchange file format
(http://www.itl.nist.gov/div895/isis/bc/cbeff/).
[18] S. Chikkerur, C. Wu, and V. Govindaraju, “A systematic approach for feature extraction in
fingerprint images”, International Conference on Biometric Authentication, vol. 3072, pp. 1-
23, 2004.
[19] L. Hong, Y. Wang, and A. K. Jain, “Fingerprint image enhancement: Algorithm and
performance evaluation”, IEEE Transactions on PAMI, vol. 21, no. 4, pp.777–789, Aug.
1998.
[20] S.Greenberg, et al, “Fingerprint image enhancement using filtering techniques”,
International Conference on Pattern Recognition, vol. 3, pp. 326–329, Sep. 2000.
[21] C. Wu, Z. Shi, and V. Govindaraju, “Fingerprint image enhancement using directional
median filters”, Proceeding of SPIE, vol. 5404, pp. 66–75, Feb. 2004.
[22] Finger print Scanners, “http://360biometrics.com/faq/fingerprint_scanners.php#5”

77
[23] A. J. Willis and L. Myers, “A cost-effective fingerprint recognition system for use with
low-quality prints and damaged fingertips”, Pattern Recognition, vol. 34, no. 2, pp.255–270,
Feb. 2001.
[24] S. S. Chikkerur, “Online fingerprint verification”, Master’s thesis, The State University of
New York at Buffalo, 2005.
[25] C.-T. Hsieh, E. Lai, and Y.C. Wang, “An effective algorithm for fingerprint image
enhancement based on wavelet transform”, Pattern Recognition, vol. 36, no. 2, pp.303–
312, Feb. 2003.
[26] X. Jiang and W.Y. Yau, “Fingerprint minutiae matching based on the local and global
structures”, Int. Conf. on Pattern Recognition (15th), volume 2, pp. 1042–1045, Aug. 2000.
[27] D. Lee, K.Choi, and J. Kim, “A robust fingerprint matching algorithm using local alignment”
,16th International Conference on Pattern Recognition, vol. 3, pp. 803–806, Dec. 2002.
[28] S. Prabhakar, A.K. Jain, and S. Pankanti, “Learning fingerprint minutiae location and type”,
Pattern Recognition, vol. 36, no. 8, pp. 1847– 1857, Feb. 2003.
[29] D. P. Mital and E. K. Teoh, “An automated matching technique for fingerprint identification”,
First Int. Conf. on Knowledge-Based Intelligent Electronic Systems, vol.1, pp. 142–147,
Aug. 1997.
[30] M.D. Garris, et al, “User’s guide to NIST fingerprint image software (NFIS)”, Technical
Report NISTIR 6813, National Institute of Standards and Technology, 2002.
[31] C. I. Watson, et al, “User’s guide to NIST fingerprint image software 2 (NFIS2)”, Technical
report, National Institute of Standards and Technology, 2002.
[32] M. Sezgin and B. Sankur, “Survey over image thresholding techniques and quantitative
performance evaluation”, Journal of Electronic Imaging, vol.13, no. 1, pp. 146– 165, Jan.
2004.
[33] O.D. Trier and T. Taxt, “Evaluation of binarization methods for document images”, IEEE
Transactions on PAMI, vol. 17, no. 3, pp. 312–315, Mar 1995.

78
[34] L. Dong and G. Yu, “An optimization-based approach to image binarization”, The Fourth
International Conference on Computer and Information Technology, pp. 165–170, Sept.
2004.
[35] N. Otsu, “A threshold selection method from gray level histograms”, IEEE Transactions on
Systems, Man and Cybernetics, vol. 9, no. 1, pp. 62–66, Jan. 1979.
[36] M. Stock and C.W. Swonger, “Development and evaluation of a reader of fingerprint
minutiae”, Technical Report XM-2478-X1:13-17, Cornell Aeronautical Laboratory, 1969.
[37] N.K. Ratha, S.Y. Chen, and A.K. Jain, “Adaptive flow orientation-based feature extraction in
fingerprint images”, Pattern Recognition, vol. 28, no. 11, pp. 1657– 1672, Nov. 1995.
[38] L. Coetzee and E. C. Botha, “Fingerprint recognition in low quality images”, Pattern
Recognition, vol. 26, no. 10, pp. 1441-1460, Oct. 1993.
[39] B. Moayer and K. Fu, “A tree system approach for fingerprint pattern recognition”, IEEE
Transactions on PAMI, vol. 8, no. 3, pp.376–388, May 1986.
[40] M.R. Verma, A.K. Majumdar, and B.Chatterjee, “Edge detection in fingerprints”, Pattern
Recognition, vol. 20, no.7, pp.513–523, Feb. 1987.
[41] R. Snelick, et al, “Multimodal biometrics: issues in design and testing” ICMI ’03:
Proceedings of the 5th international conference on Multimodal interfaces, pp. 68–72, NY,
USA, Nov. 2003.
[42] C. Domeniconi, S. Tari and P. Liang, “Direct gray scale ridge reconstruction in
fingerprint images”, IEEE International Conference Acoustics Speech and Signal
Processing, vol. 5, pp. 2941-2944, May 1998.
[43] A.S. Abutaleb and M. Kamel, “A genetic algorithm for the estimation of ridges in
fingerprints”, IEEE Transactions on Image Processing, vol. 8, no. 8, pp. 1134–1138, Aug.
1999.
[44] M.Tico and P. Kuosmanen, “A topographic method for fingerprint segmentation”,
International Conference on Image Processing, vol. 1, pp. 36–40, Oct. 1999.

79
[45] X. Luo and J. Tian, “Knowledge based fingerprint image enhancement”, Proceedings of
International Conference on Pattern Recognition (15th), vol. 4, pp. 783–786, Sep. 2000.
[46] I. Moccagatta, M.Z. Coban and H.H. Chen, “Wavelet-based image coding: Comparison of
MPEG-4 and JPEG-2000”, Conference record of the thirty-third asilomar conference on
Signals, Systems, and Computers, vol. 2, pp. 1178-1182, Oct. 1999
[47] A.M. Bazen, et al, “A correlation-based fingerprint verification system”, Proceedings 11th
Annual Workshop Circuits Systems and Signal Processing, pp. 205-213, Nov. 2000.
[48] L.R. Thebaud, “Systems and methods with identity verification by comparison and
interpretation of skin patterns such as fingerprints,” US Patent No. 5909501, June
1999.
[49] J. Feng, Z. Ouyang, and A. Cai, “Fingerprint matching using ridges,” Pattern
Recognition, vol. 39, no. 11, pp. 2131-2140, Nov. 2006.
[50] M. Hara and H. Toyama, “Method and apparatus for matching streaked pattern image,” US
Patent No. 7,295,688, Nov. 2007.
[51] N.K. Ratha, et al, “Robust fingerprint authentication using local structural similarity”,
Fifth IEEE Workshop Applications on Applications of Computer Vision, pp. 29-34, Dec.
2000.
[52] A.M. Bazen and S.H. Gerez, “Fingerprint matching by thin-plate spline modelling of elastic
deformations”, Pattern Recognition, vol. 36, no. 8, pp. 1859-1867, Aug. 2003.
[53] J. Feng, and A. K. Jain, “Fingerprint reconstruction: From minutiae to phase”, IEEE
Transactions on PAMI, vol. 33, no. 2, pp. 209 – 223, Feb. 2011.
[54] C. Hill, “Risk of masquerade arising from the storage of biometrics”, Master’s Thesis,
Australian National University, 2001.
[55] A.Ross, J. Shah, and A.K.Jain, “From template to image: Reconstructing fingerprints from
minutiae points”, IEEE Trans. PAMI, vol. 29,no. 4, pp. 544-560, Apr. 2007.

80
[56] B.G.Sherlock and D.M.Monro, “A model for interpreting fingerprint topology”, Pattern
Recognition, vol.26, no.7, pp.1047-1055, July 1993.
[57] R. Cappelli, et al, “Fingerprint image reconstruction from standard templates”, IEEE
Trans. PAMI, vol. 29, no. 9, pp. 1489-1503, Sep. 2007.
[58] P.R. Vizcaya and L.A. Gerhardt, “A nonlinear orientation model for global description of
fingerprints,” Pattern Recognition, vol. 29, no. 7, pp. 1221-1231, Jul. 1996.
[59] T-Y. Jea, “Minutiae-based partial fingerprint recognition”, Master’s Thesis, University at
Buffalo, the State University of New York, Nov. 2005.
[60] S.O. Novikov and G.N.Glushchenko, “Fingerprint ridges structure generation models”, Proc.
SPIE Int’l Workshop Digital Image Processing and Computer Graphics, vol. 3346, pp. 270-
274, Oct. 1997.
[61] W. Bicz, “The idea of description (reconstruction) of fingerprints with mathematical
algorithms and history of the development of this idea at Optel”, Optel,
http://www.optel.pl/article/english/ idea.htm, 2003.
[62] A.Witkin and M.Kass, “Reaction-Diffusion textures”, ACM SIGGRAPH Computer Graphics,
vol. 25, no. 4, pp. 299-308, July 1991.
[63] K.Nandakumar, A.K.Jain and S.Pankanti, “Fingerprint-based fuzzy vault: Implementation
and performance,” IEEE Transactions on Information Forensics and security, vol.2, no. 4,
pp.744-757, Dec. 2007.
[64] K.A.Nixon and R.K.Rowe, “Multispectral fingerprint imaging for spoof detection”, Biometric
Technology for Human Identification II, A. K. Jain and N. K. Ratha, eds., vol. 5779, pp. 214-
225,SPIE, Mar. 2005
[65] K.G.Darpanis, “Gabor Filters”, York University, April 2007.
[66] A. Ullah, R. Khan and M. Shakeel, “Fingerprint recognition and password security system”,
Project, “http://www.scribd.com/doc/17264412/fingerprint-and-password-security-system-
thesis”, July 2009

81
[67] L. O’Gormann and J.V.Nickerson, “An approach to fingerprint filter design”, Pattern
Recognition, vol. 22, no. 1, pp.29–38, Jan. 1989.
[68] D. Maltoni et al, “Handbook of fingerprint recognition”, Springer, 2003.
[69] R. Cappelli, “Synthetic fingerprint generation”, in D. Maltoni, D. Maio, A.K. Jain and S.
Prabhakar, “Handbook of fingerprint recognition” 2nd Edition, Springer, London, 2009.
[70] M. C. Fairhurst, “Signature verification revisited: Promoting practical exploitation of
biometric technology”, Electronics & Communication Engineering Journal, vol. 9, no. 6, pp.
273–280, Dec. 1997.
[71] H. Feng and C.Wa, “Private Key generation from on-line handwritten signatures”,
Information Management and Computer Security, vol. 10, no. 4, pp.159–164, Oct. 2002.
[72] S. K. Mitra and G. L .Sicuranza, “Nonlinear image processing”, Academic Press, New York,
2000.
[73] G.Ramponi and G.L.Sicuranza, “Quadratic digital filters for image processing”, IEEE
Transactions on Acoustics, Speech and Signal processing, vol. 36, no. 6, pp. 937-939, June
1988.
[74] B.M. Mehtre and B. Chatterjee, “Segmentation of fingerprint images - a composite method”,
Pattern recognition, vol. 22, no. 4, pp. 381-385, 1989.
[75] A. Ross, J. Shah and A.K. Jain, “ Towards reconstructing fingerprints from minutiae points”,
Proc. of SPIE conference on biometric technology for human identification II, vol. 5779, pp.
66-80, March 2005.
[76] L. Shapiro and G. Stockman, “Computer vision”, Prentice Hall, New Jersey, 2001.
[77] L.-M. Liu and T-S. Dai, “A hybrid fingerprint enhancement algorithm”, International
Conference on Computer Engineering and Systems, pp. 57-62, 2009.
[78] B.M. Mehtre, “Fingerprint image analysis for automatic identification”, Machine Vision and
Applications, vol. 6, no. 2-3, pp. 124-139, March 1993.

82
[79] B. Moayer and K.S. Fu, “A syntactic approach to fingerprint pattern recognition”, Pattern
Recognition, vol. 7, no.1-2, pp. 1-23, June 1975.
[80] C.-T. Lu, K.-F. Tseng and C.-T. Chen, “Reduction of residual noise using directional
median filter”, IEEE International Conference on Computer Science and Automation
Engineering (CSAE), vol. 3, pp. 475 - 479 , June 2011.
[81] SEIR Optics Technology whitepaper, “http://www.secugen.com/company/ip.htm”
[82] A. V. Oppenheim and R. W. Schafer, “Discrete-Time signal processing”, Prentice Hall, 3rd
Edition, Aug. 2009.
[83] R.C. Gonzalez and R.E.Woods, “Digital image processing”, Prentice Hall, 3rd Edition, Aug.
2007.
[84] The Organization of the Retina and Visual System http://webvision.med.utah.edu/book/part-
i- foundations/gross-anatomy-of-the-ey
[85] Gait cycle -
http://www.orthoteers.com/%28S%28kfcgxubarh2xgq4vbmnwekp5%29%29/mainpage.aspx
?section=23
[86] L. Ji, et al, “ Binary fingerprint image thinning using template-based PCNNs” , IEEE Trans
on Systems, Man and Cybernatics. Part B Cybernatics, vol. 37, no. 5, pp. 1407-1413, Oct
2007.
[87] D. J. Heeger, “Optical flow using spatiotemporal filters”, International Journal of Computer
Vision, vol. 1, no. 4, pp. 279-302, 1987.

83
BIOGRAPHICAL INFORMATION
Sreya Chakraborty has completed her Masters in Electrical Engineering from University of
Texas at Arlington,USA . She did her undergraduate from Mumbai University, India. Her
research interest include Image Processing. She has received Graduate scholarship from the
Electrical department for the year 2010-2011 and also has been the recipient of Korea
scholarship for her work in the area at Masters level. She has also been the recipient of Ratan
Tata scholarship at her undergraduate level.