Finger Vein Authentication System
39
-
Upload
bugsbunny123 -
Category
Documents
-
view
39 -
download
2
description
Biometrics systems for individual identification have been developed for decades. Many methods have been proposed such as fingerprint, facial, iris, voice recognitions. However each method has its own disadvantages. Fingerprint identifying systems usually have low security. Fingerprint patterns are easy to be counterfeited because they are left everywhere whenever we touch a surface. Similarly facial and voice patterns can also be cloned easily. Iris scanning is uncomfortable because of producing a strong light to shine into subjects‘ eyes. A relatively new method that has been recommended by Hitachi Ltd can solve above problems and then can be applied in a wide area. It is to use finger veins for identifying individuals.
Transcript of Finger Vein Authentication System


Final year project
Finger vein authentication system
Student name: Trung Huynh
Student no: 393808
BSc Electronic Communication System
E-mail: [email protected]/[email protected]
Supervisor: Prof Larissa Panina
UNIVERSITY OF PLYMOUTH
Faculty of Technology
School of Computing, Communications & Electronics
Smeaton building
Drake Circus
Plymouth
United Kingdom
ABSTRACT
Biometrics systems for individual identification have been developed for decades. Many
methods have been proposed such as fingerprint, facial, iris, voice recognitions. However each
method has its own disadvantages. Fingerprint identifying systems usually have low security.
Fingerprint patterns are easy to be counterfeited because they are left everywhere whenever we
touch a surface. Similarly facial and voice patterns can also be cloned
easily. Iris scanning is uncomfortable because of producing a strong
light to shine into subjects‘ eyes. A relatively new method that has
been recommended by Hitachi Ltd can solve above problems and then
can be applied in a wide area. It is to use finger veins for identifying
individuals.
Vein images are taken by shining a near-infrared light through fingers.
Hence finger vein scanning procedures do not require physical
contact. Consequently it can be used in hospitals to identify patients
with its hygiene. In addition, vein patterns are very hard to be cloned
because the veins are inside our fingers. Finger vein recognition
systems can obtain very high security and accuracy if the algorithm in
use is good enough. Therefore they are suitable to be integrated in
ATMs (automatic teller machines) and other applications which require
high security.
Obviously finger vein security systems can be applied in many applications. As an
undergraduate student project, this is limited in a small scale which enables personal computer
authentication. The product has been tested with a small group of people and worked properly.
It still requires a deep test before commercialised in practice.
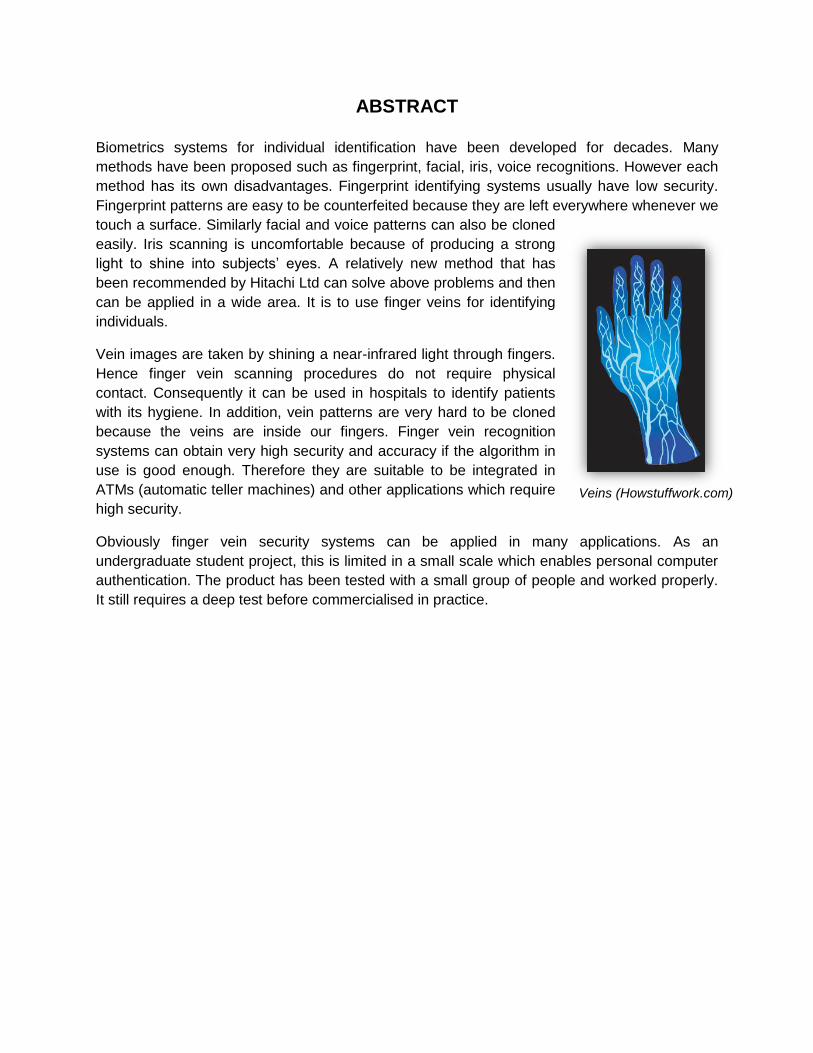
Veins (Howstuffwork.com)
TABLE OF CONTENTS
ABSTRACT ................................................................................................................................ 3
TABLE OF CONTENTS ............................................................................................................. 1
INTRODUCTION ....................................................................................................................... 1
OVERVIEW ............................................................................................................................... 2
FINGER VEIN SCANNER .......................................................................................................... 3
Near-Infrared source .............................................................................................................. 3
CCD Camera .......................................................................................................................... 4
Improvements ......................................................................................................................... 5
Other designs from Hitachi ..................................................................................................... 5
IMAGE PROCESSING ............................................................................................................... 7
Crop ....................................................................................................................................... 7
Auto-contrast .......................................................................................................................... 7
Smoothing .............................................................................................................................. 8
VEIN EXTRACTION..................................................................................................................10
Analysis .................................................................................................................................10
Algorithm ...............................................................................................................................12
Test and result .......................................................................................................................15
Flowchart and coding ............................................................................................................15
PATTERN MATCHING .............................................................................................................20
ENROLMENT SOFTWARE ......................................................................................................23
Matlab and VB.NET ...............................................................................................................23
Camera in VB.NET ................................................................................................................24
MS Access Database ............................................................................................................25
User interface ........................................................................................................................27
MANAGEMENT SOFTWARE ...................................................................................................29
Lock/unlock keyboard/mouse in Windows XP........................................................................29
Software UI ...........................................................................................................................30
CONCLUSION ..........................................................................................................................32
BIBLIOGRAPHY .......................................................................................................................33
APPENDICES ...........................................................................................................................35

INTRODUCTION
1
INTRODUCTION
The possibility of achieving personal identification based on the vein pattern is referred years
ago (13). A person‘s veins are completely unique. Twins do not have identical veins, and veins in
left hands of a person differ from those in his right hands. Their shapes also change very little as
a person ages. A finger vein authentication system is relatively simpler than systems using
fingerprint. The whole process has main procedures i.e. vein capturing, vein extracting, and
pattern matching.
When we shine near-infrared light through fingers, human tissues pass through most of the
infrared light while haemoglobin in our blood blocks them. Hence veins appear darker in the
picture. A normal digital camera needs to be filtered from visible light so that it can pass only the
infrared light. The vein image of each finger has different brightness and contrast. Consequently
we need some enhancement for the image so that the image quality is good enough for next
process.
After the image is enhanced, we extract veins out by detecting centre line using maximum
curvature points in image profiles (10). Vein width may vary when blood pressure or temperature
changes. However the centre line of the vein always stays stably. Extracted lines will be stored
in a database in enrolment procedure. While testing, the current extracted pattern will be
compared to those in the database using two dimensional filters (1) (2) to decide whether the
pattern is matched or not.
The project includes two software packages which use same database i.e. enrolment and
management. Enrolment software is used to enrol users to the database. Management is used
for users to lock and unlock computers. When a user is going to leave his computer, he uses
the management software to lock the computer. When he returns, he puts his finger which was
used for enrolment into the vein scanner. The management software will check if the vein
pattern which is captured from the scanner is matched to the one in the database. If the pattern
is matched, the computer will be unlocked.
The project has been built completely and worked properly in Windows XP Service Pack 2 OS.
It has been tested by Acer TravelMate 2201LC (Intel Celeron 2.6GHz) with a small number of
people and worked with most of them. Due to a cheap camera and infrared source in use, vein
images of few people are not clear enough. However this can be improved easily by using a
better camera and infrared sources.

OVERVIEW
2
OVERVIEW
The product is used for personal computer authentication. This includes one vein scanner and
two software packages which use the same database (figure 2). The vein scanner
communicates with the computer by a USB 2.0 interface (figure 1).
Figure 1 Hardware package
Figure 2 Software packages
The first software package is Enrolment. This program gets images which come from the vein
scanner, then extracts out centre lines of the vein images. This data and information of users
(first name, last name, etc.) will be stored in the database (figure 3).
The second software package is Management. This program enables the user to lock his
computer. Then it always checks if the user puts his finger in. The software will extract the veins
out and compare it to the one in the database. If they are matched to each other, the computer
will be unlocked.
Figure 3 Enrolment software
Figure 4 Management software
Both software packages are written by Visual Basic 2005 linking with Matlab. Matlab is used to
handle image processing functions such as vein extraction and pattern matching. Two packages
―talks‖ to each other through a Microsoft Access database. The database includes user
information i.e. user first name, user last name and user vein pattern.

FINGER VEIN SCANNER
3
FINGER VEIN SCANNER
The principle is that the infrared light with wavelength 700nm ~ 1000nm can pass through most
of human tissues while the haemoglobin in the blood can absorb the infrared light fully (3).
Therefore we need a near-infrared source with proper wavelength to shine through the finger.
An infrared-sensitive digital camera is placed underneath the finger to catch light which passed
through the finger. The scanner is sketched in figure 5.
Figure 5 Finger vein scanner sketch
Near-Infrared source
Infrared LEDs with 875nm, 850nm and 810nm wavelengths have been tested. The jumbos (high
power infrared source) with 810nm wavelength gave the best images of veins in most of cases.
The ELJ810-248B-EPIGAP-IR EMITTER, JUMBO 40DEG can be found on uk.farnell.com.
Some important technical specifications are listed below:
Wavelength, typ: 810nm
Power dissipation: 3W
Current, forward If: 260mA
Voltage, Vf max: 13V
Angle, viewing : 40o
Price: £14.20 (04/2008)
More technical information can be found in Appendix.
Because a jumbo is quite big, two jumbos are arranged in a series. The board is connected to a
16V power supply. The circuit arrangement is shown below:
Figure 6 810nm jumbo (14)
Figure 7 Jumbo board
16V
R R
if
Vf
VR

FINGER VEIN SCANNER
4
As described above, if is equal to 260mA and Vf is equal to 13V. Therefore:
VR = 16V – Vf = 16V – 13V = 3V
So 𝑅 =𝑉𝑓
𝑖𝑓=
3
0.26= 11.5Ω
In the real design, 12Ω resistors are chosen.
CCD Camera
The tested camera is 5.2M pixel infrared PC Camera (figure 8). The CCD camera responses to
both visible and infrared light. Technical information is shown below:
Interface: USB 2.0
Picture size: 640x480, 1280x960, 1600x1200, 2560x2048
Window capture size: 2304x1728
Video format: 24-bit RGB/I420
Transmission rate: (640x480) 30f/s (1280x960)
Signal-to-noise ratio: >48dB
Image focus: 3mm (macro lens) to infinity
Auto exposing, auto light control, auto colour
correction, auto white balance
As infrared photography, an infrared filter is used. The filter has to be able to block light with
wavelength less than 810nm. An Instrument Plastic Limited Optolite Infrared Filter was used.
The transmittance rate of the filter is shown in the figure below:
As shown in the figure 9, the transmittance rate with 810nm wavelength is about 85% while it
blocks most of light with wavelengths less than 750nm.
In addition, there is also a finger holder which is used to stabilise the finger. The distances
between the jumbo board and the holder, the holder and camera are adjusted for best image
quality.
Figure 8 CCD camera with infrared filter
Infrared
filter
Figure 9 Filter response (15)

FINGER VEIN SCANNER
5
Figure 10 Scanner device
Figure 11 A sample taken by the designed scanner
Improvements
Different 810nm wavelength infrared sources (e.g. L810-PD010-D51) which might give
better vein images can be found on http://www.techmark.nl from Japan or http://tech-
led.com from US. These are small LEDs which can be arranged in a series and then the
light will be scattered much better. Their price is also much cheaper.
The CCD camera in use is just a normal camera which is better replaced by an infrared-
sensitive camera. These cameras are designed specially to response better with infrared
light. There might not many such digital cameras, so we can use an analogue one with a
capture board. This requires more space and seems to be more suitable to big size
applications.
Other designs from Hitachi
Hitachi has developed many different scanner designs. Each design is manufactured for
different applications. Some of them are shown in the below figure:

FINGER VEIN SCANNER
6
Door entrance system
Wheel Vein Scanner
ATMs systems
Grip-type finger vein authentication system
PC authentication system
PC authentication system
Figure 12 Finger vein scanners (Hitachi Ltd.)

IMAGE PROCESSING
7
IMAGE PROCESSING
Input vein images from the scanner are dull and include much noise. Therefore they need to be
improved by two enhancement functions i.e. auto-contrast and smoothing. However before
enhanced, they have to be cropped to eliminate redundant parts:
Crop
Input images from the scanner have size 240x1801 and include unwanted areas which need to
be cut out. We will take only the central part which has the vertical position from 50 to 145. This
is easy to do in Matlab by a simple line:
Cropped_f = f(50:145,:,1) %f is the input image
The below figure shows an input image before and after cropped:
(a)
(b)
Figure 13(a) Input image before cropped (b) After cropped
Auto-contrast
This function finds out the optimal contrast for each image and then increases the difference
between veins and the background. The mechanic of auto-contrast is pretty simple. We just
need to rescale the colours of the image so that its minimum brightness becomes 0 and
maximum brightness becomes 255 (in our case). We now consider a cropped sample image
taken from the scanner and its histogram2:
(b)
Figure 14(a) Cropped sample (b) its histogram
Let say 𝑣𝑚𝑖𝑛 is the minimum brightness and 𝑣𝑚𝑎𝑥 is the maximum brightness in the image.
After auto-contrasted, a point with the brightness 𝑣 will become:
1 This will be set up in Enrolment and Management software which are written by Visual Basic 2005
2 The histogram of an image plots the number of pixels in that image (vertical axis) with a particular
brightness value (horizontal axis) (16).
Maximum
brightness
Minimum
brightness
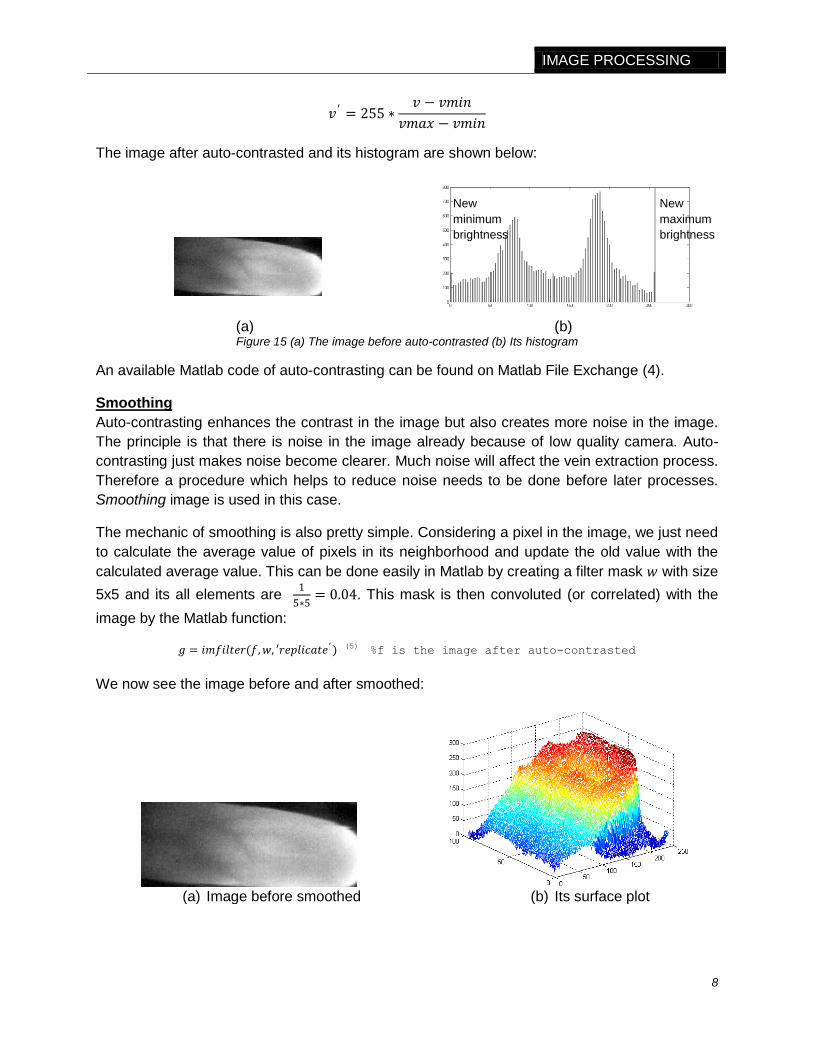
IMAGE PROCESSING
8
𝑣 ′ = 255 ∗𝑣 − 𝑣𝑚𝑖𝑛
𝑣𝑚𝑎𝑥 − 𝑣𝑚𝑖𝑛
The image after auto-contrasted and its histogram are shown below:
(a)
(b)
Figure 15 (a) The image before auto-contrasted (b) Its histogram
An available Matlab code of auto-contrasting can be found on Matlab File Exchange (4).
Smoothing
Auto-contrasting enhances the contrast in the image but also creates more noise in the image.
The principle is that there is noise in the image already because of low quality camera. Auto-
contrasting just makes noise become clearer. Much noise will affect the vein extraction process.
Therefore a procedure which helps to reduce noise needs to be done before later processes.
Smoothing image is used in this case.
The mechanic of smoothing is also pretty simple. Considering a pixel in the image, we just need
to calculate the average value of pixels in its neighborhood and update the old value with the
calculated average value. This can be done easily in Matlab by creating a filter mask 𝑤 with size
5x5 and its all elements are 1
5∗5= 0.04. This mask is then convoluted (or correlated) with the
image by the Matlab function:
𝑔 = 𝑖𝑚𝑓𝑖𝑙𝑡𝑒𝑟(𝑓,𝑤, ′𝑟𝑒𝑝𝑙𝑖𝑐𝑎𝑡𝑒′) (5) %f is the image after auto-contrasted
We now see the image before and after smoothed:
(a) Image before smoothed
(b) Its surface plot
New
maximum
brightness
New
minimum
brightness
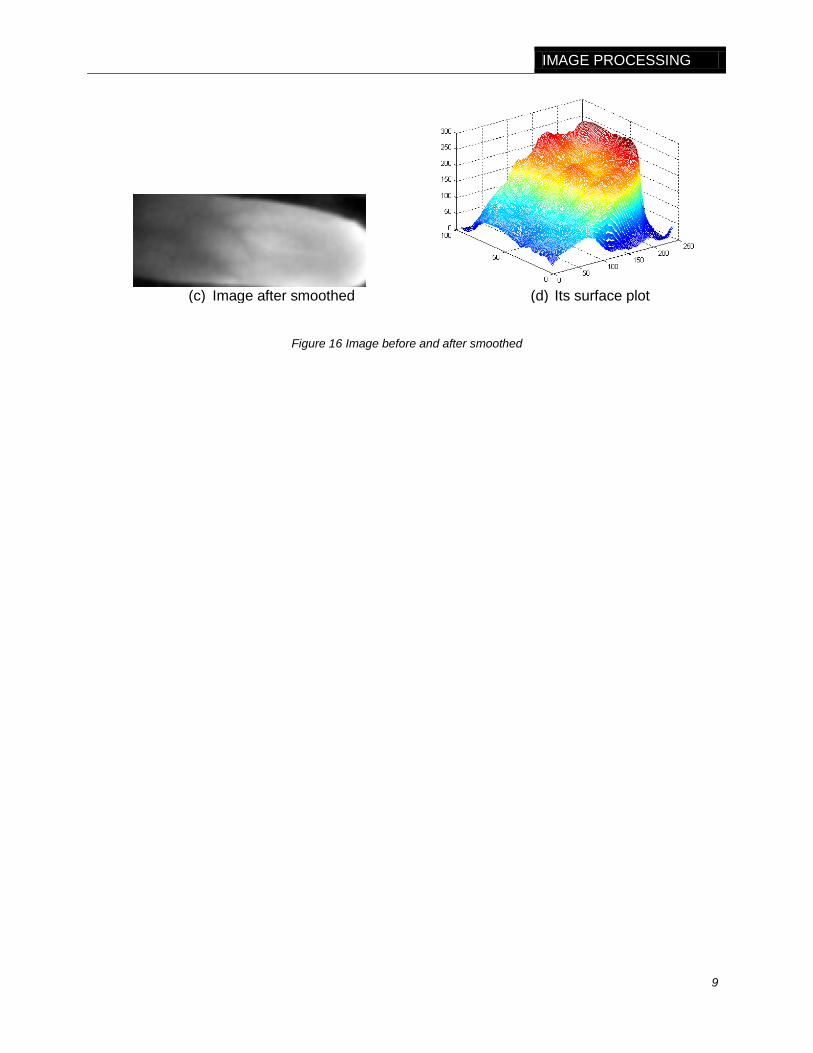
IMAGE PROCESSING
9
(c) Image after smoothed
(d) Its surface plot
Figure 16 Image before and after smoothed
VEIN EXTRACTION
10
VEIN EXTRACTION
It can be said that the vein scanner design and vein extraction module mainly decide the
accuracy of the whole system. The pattern matching is just a two dimensional filter. Therefore a
good algorithm for extraction module helps not only to achieve high accuracy but also to have
different vein scanner designs with the same accuracy.
Many methods have been proposed such as line-shaped features from images include using a
matched filter (2), mathematical morphology (6), connection of emphasized edge lines (7), ridge
line following for minutiae detection in grayscale fingerprint images (8), and repeating the line
tracking (1) (9). The project uses Maximum curvature points in image profiles method of N. Miura,
A. Nagasaka, and T. Miyatake (10) to extract veins.
The method can extract the centrelines of veins consistently without affection by fluctuations in
vein width and brightness. Hence it can gain a very high accuracy. Experimental result shows
that the equal error rate for personal identification was 0.0009% (10) which is much better than
other methods.
Analysis
The factors that affect to the accuracy of vein extraction include:
Veins with various widths and brightness are distributed in an image.
The widths and brightness of the veins may vary each trial.
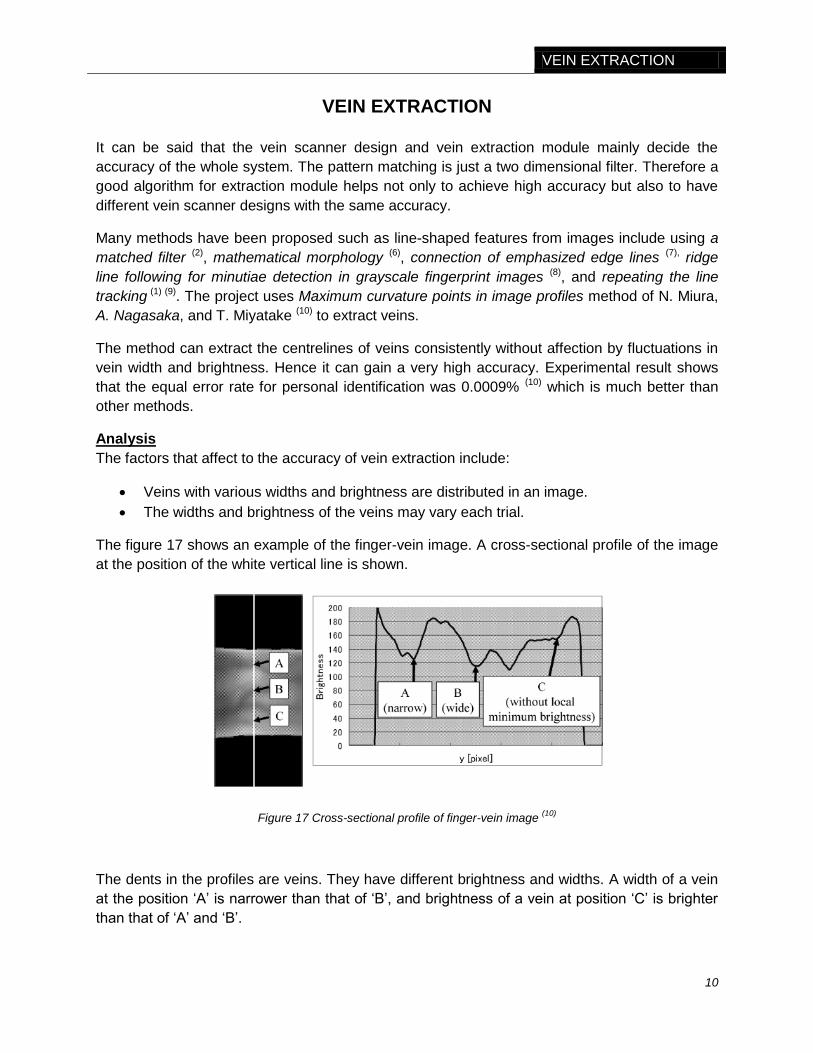
The figure 17 shows an example of the finger-vein image. A cross-sectional profile of the image
at the position of the white vertical line is shown.
Figure 17 Cross-sectional profile of finger-vein image (10)
The dents in the profiles are veins. They have different brightness and widths. A width of a vein
at the position ‗A‘ is narrower than that of ‗B‘, and brightness of a vein at position ‗C‘ is brighter
than that of ‗A‘ and ‗B‘.

VEIN EXTRACTION
11
In addition, brightness and widths of veins slightly vary in each trial because of fluctuations in
volume of blood flow in a finger caused by a physical condition, change in temperature, and so
on. The figure 18 shows an example like that:
Figure 18 Difference of width and brightness of veins in an image
The figure 18(a) shows a finger with sufficient blood and narrow veins. The figure 18(b) shows
another trial with less volume of blood and wider veins. By extracting the centre lines only, we
can achieve the same vein patterns for each trial.
To obtain centre lines in the image, we have to check profiles in four directions i.e. vertical,
horizontal primary oblique and secondary oblique (figure 19).
Figure 19 Direction of profile (10)

VEIN EXTRACTION
12
The cross-sectional profile around a vein appears like a dent. Therefore curvatures of profiles
are calculated to detect dents from profile. Finally each point is connected to adjacent points
over the whole finger image. This can help emphasize the veins and eliminate noises.
Algorithm
There are 3 steps in the algorithm:
Extraction of centre positions of veins
Connection of vein centres
Labelling the image
Let say 𝐹(𝑥,𝑦) is the intensity of a pixel (𝑥,𝑦).
[Step 1] Extraction of centre positions of veins
Assume 𝑃𝑓(𝑧) is a cross-sectional profile acquired from 𝐹(𝑥,𝑦) at vertical direction:
𝑃𝑓 𝑧 = 𝐹(𝑥, 𝑧)
where z is a position in a profile. A mapping function 𝑇𝑟𝑠 is defined as:
𝐹 𝑥, 𝑧 = 𝑇𝑟𝑠(𝑃𝑓 𝑧 )
In order to calculate the curvatures at position 𝑥, we calculate 𝐾𝑓(𝑥):
𝐾𝑓 𝑥 =
𝑑2𝑓 𝑥 𝑑𝑥2
1 + 𝑑𝑓 𝑥 𝑑𝑥
2
32
In computing, 𝑘(𝑧) can be calculated as (11):
𝑑− =1
𝑤
𝑦𝑖−1 − 𝑦𝑖𝑥𝑖−1 − 𝑥𝑖
0
𝑖=−𝑤+1
𝑑+ =1
𝑤
𝑦𝑖 − 𝑦𝑖+1
𝑥𝑖 − 𝑥𝑖+1
𝑤−1
𝑖=0
𝑑± =1
𝑤
𝑦𝑖 − 𝑦𝑖+1
𝑥𝑖 − 𝑥𝑖+1
𝑤/2
𝑖=−𝑤/2
𝑑2𝑦
𝑑2𝑧= 𝑑+ − 𝑑−
𝑑𝑦
𝑑𝑧= 𝑑±
VEIN EXTRACTION
13
𝑘 𝑧 =𝑑+ − 𝑑−
{1 + 𝑑±2}3/2
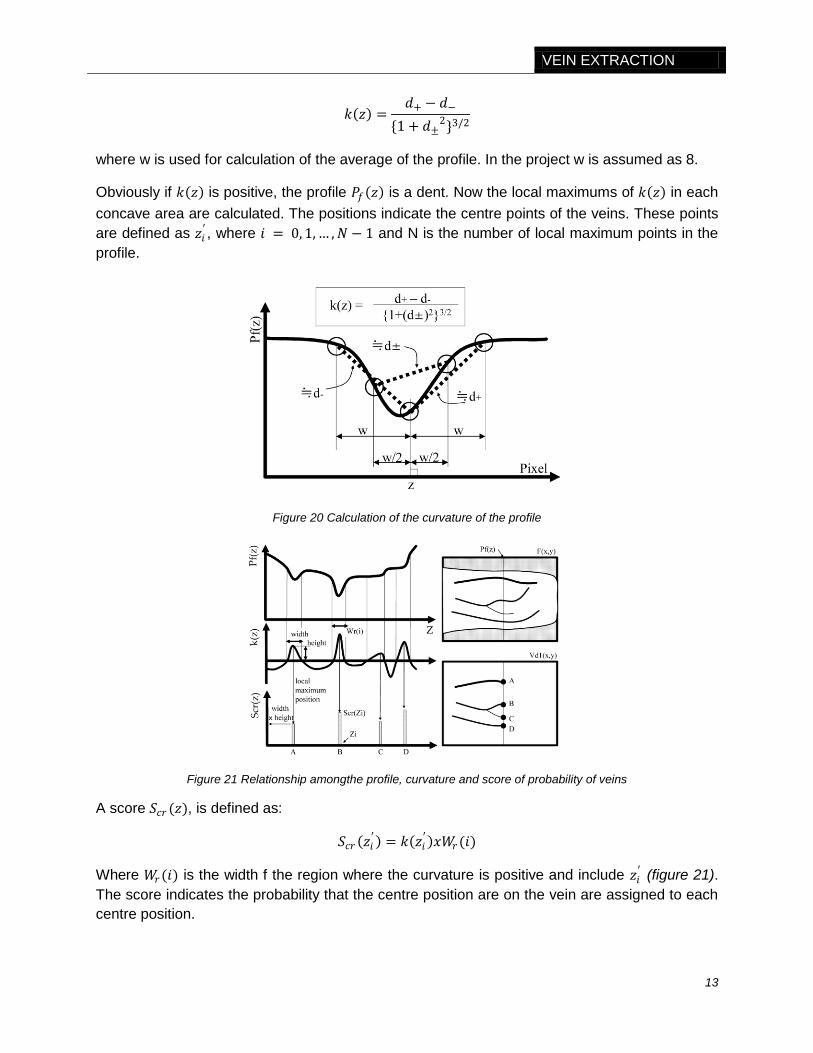
where w is used for calculation of the average of the profile. In the project w is assumed as 8.
Obviously if 𝑘 𝑧 is positive, the profile 𝑃𝑓 𝑧 is a dent. Now the local maximums of 𝑘 𝑧 in each
concave area are calculated. The positions indicate the centre points of the veins. These points
are defined as 𝑧𝑖′ , where 𝑖 = 0, 1,… ,𝑁 − 1 and N is the number of local maximum points in the
profile.
Figure 20 Calculation of the curvature of the profile
Figure 21 Relationship amongthe profile, curvature and score of probability of veins
A score 𝑆𝑐𝑟 (𝑧), is defined as:
𝑆𝑐𝑟 𝑧𝑖′ = 𝑘 𝑧𝑖
′ 𝑥𝑊𝑟(𝑖)
Where 𝑊𝑟(𝑖) is the width f the region where the curvature is positive and include 𝑧𝑖′ (figure 21).
The score indicates the probability that the centre position are on the vein are assigned to each
centre position.
VEIN EXTRACTION
14
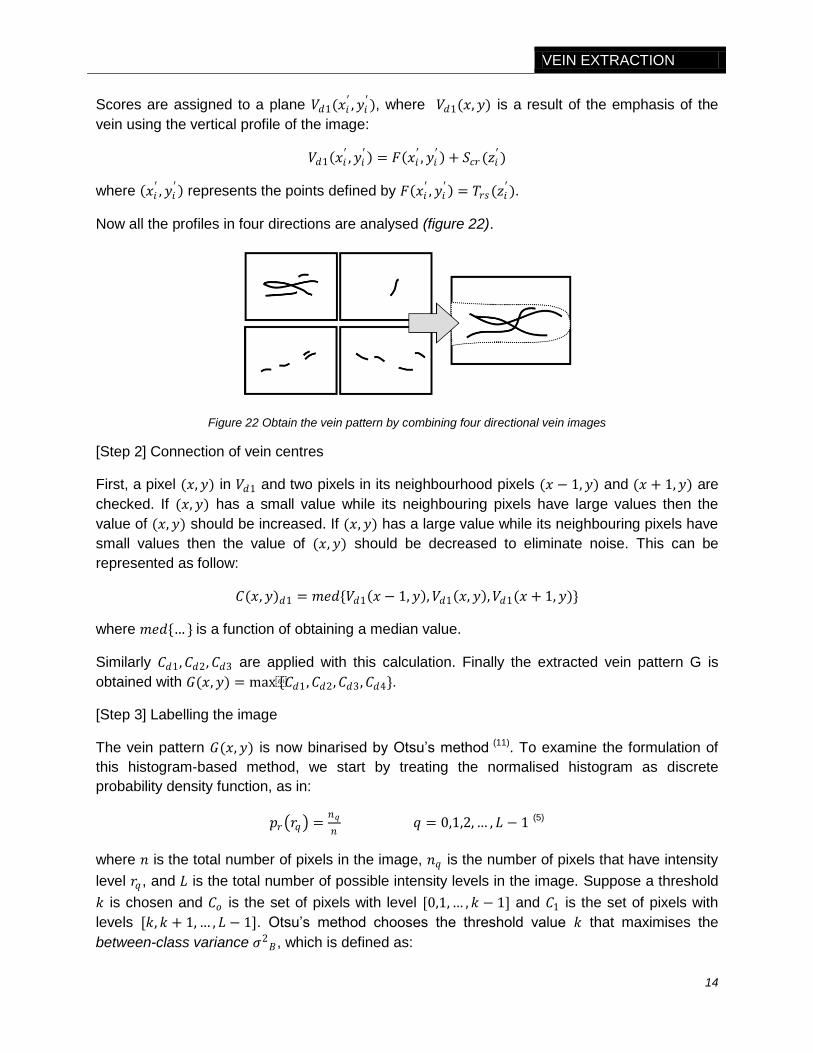
Scores are assigned to a plane 𝑉𝑑1(𝑥𝑖′ ,𝑦𝑖
′), where 𝑉𝑑1(𝑥,𝑦) is a result of the emphasis of the
vein using the vertical profile of the image:
𝑉𝑑1 𝑥𝑖′ ,𝑦𝑖
′ = 𝐹 𝑥𝑖′ ,𝑦𝑖
′ + 𝑆𝑐𝑟 (𝑧𝑖′)
where 𝑥𝑖′ ,𝑦𝑖
′ represents the points defined by 𝐹 𝑥𝑖′ ,𝑦𝑖
′ = 𝑇𝑟𝑠(𝑧𝑖′).
Now all the profiles in four directions are analysed (figure 22).
Figure 22 Obtain the vein pattern by combining four directional vein images
[Step 2] Connection of vein centres
First, a pixel (𝑥,𝑦) in 𝑉𝑑1 and two pixels in its neighbourhood pixels (𝑥 − 1,𝑦) and (𝑥 + 1,𝑦) are
checked. If (𝑥,𝑦) has a small value while its neighbouring pixels have large values then the
value of (𝑥,𝑦) should be increased. If (𝑥,𝑦) has a large value while its neighbouring pixels have
small values then the value of (𝑥,𝑦) should be decreased to eliminate noise. This can be
represented as follow:
𝐶(𝑥,𝑦)𝑑1 = 𝑚𝑒𝑑{𝑉𝑑1 𝑥 − 1,𝑦 ,𝑉𝑑1 𝑥, 𝑦 ,𝑉𝑑1(𝑥 + 1,𝑦)}
where 𝑚𝑒𝑑{… } is a function of obtaining a median value.
Similarly 𝐶𝑑1,𝐶𝑑2,𝐶𝑑3 are applied with this calculation. Finally the extracted vein pattern G is
obtained with 𝐺(𝑥,𝑦) = max{𝐶𝑑1 ,𝐶𝑑2,𝐶𝑑3 ,𝐶𝑑4}.
[Step 3] Labelling the image
The vein pattern 𝐺(𝑥,𝑦) is now binarised by Otsu‘s method (11). To examine the formulation of
this histogram-based method, we start by treating the normalised histogram as discrete
probability density function, as in:
𝑝𝑟 𝑟𝑞 =𝑛𝑞
𝑛 𝑞 = 0,1,2,… , 𝐿 − 1 (5)
where 𝑛 is the total number of pixels in the image, 𝑛𝑞 is the number of pixels that have intensity
level 𝑟𝑞 , and 𝐿 is the total number of possible intensity levels in the image. Suppose a threshold
𝑘 is chosen and 𝐶𝑜 is the set of pixels with level [0,1,… ,𝑘 − 1] and 𝐶1 is the set of pixels with
levels [𝑘,𝑘 + 1,… , 𝐿 − 1]. Otsu‘s method chooses the threshold value 𝑘 that maximises the
between-class variance 𝜎2𝐵, which is defined as:

VEIN EXTRACTION
15
𝜎2𝐵 = 𝜔𝑜(𝜇𝑜 − 𝜇𝑟)2 + 𝜔1(𝜇1 − 𝜇𝑟)2
where:
𝑤0 = 𝑝𝑞 𝑟𝑞
𝑘−1
𝑞=0
𝑤1 = 𝑝𝑞(𝑟𝑞)
𝐿−1
𝑞=𝑘
𝜇0 = 𝑞𝑝𝑞(𝑟𝑞)/𝜔0
𝑘−1
𝑞=0
𝜇1 = 𝑞𝑝𝑞(𝑟𝑞)/𝜔1
𝐿−1
𝑞=𝑘
𝜇𝑇 = 𝑞𝑝𝑞(𝑟𝑞)
𝐿−1
𝑞=0
Fortunately Matlab gives us a function called graythresh to calculate 𝑘. The calling syntax is:
T = graythresh(f)
where f is the input image.
Test and result
Experiment showed that the EER (equal error rate, where a false accept rate (FAR) equals a
false reject rate (FRR)) is 0.0009% (10) which is much better than other methods. Detail about
how the test was taken and the result can be found at (10).
Flowchart and coding
The flowchart for the whole vein extraction module is shown below:

VEIN EXTRACTION
16
Two function autocontrast and smooth have been referred above. The functions vextraction,
hextraction, o1extraction and o2extraction are respectively to extract vein pattern in vertical,
horizontal, primary oblique and secondary oblique directions. Combime function is used to
calculate max{𝐶𝑑1 ,𝐶𝑑2,𝐶𝑑3,𝐶𝑑4} and binarise function is to binarise the pattern by Otsu‘s
method.
The flowchart of vextraction function is show in below figure. Flowcharts for functions
hextraction, o1extraction and o2extraction are similar to this.
f = input image
f1 = crop(f)
f2 = autocontrast(f1)
f3 = smooth(f2)
c1 = vextraction(f3)
c2 = hextraction(f3)
c3 = o1extraction(f3)
c4 = o2extraction(f3)
v=combine(c1,c2,c3,c4
)
o = binarise(v)
Figure 23 Vein extraction flowchart
VEIN EXTRACTION
17
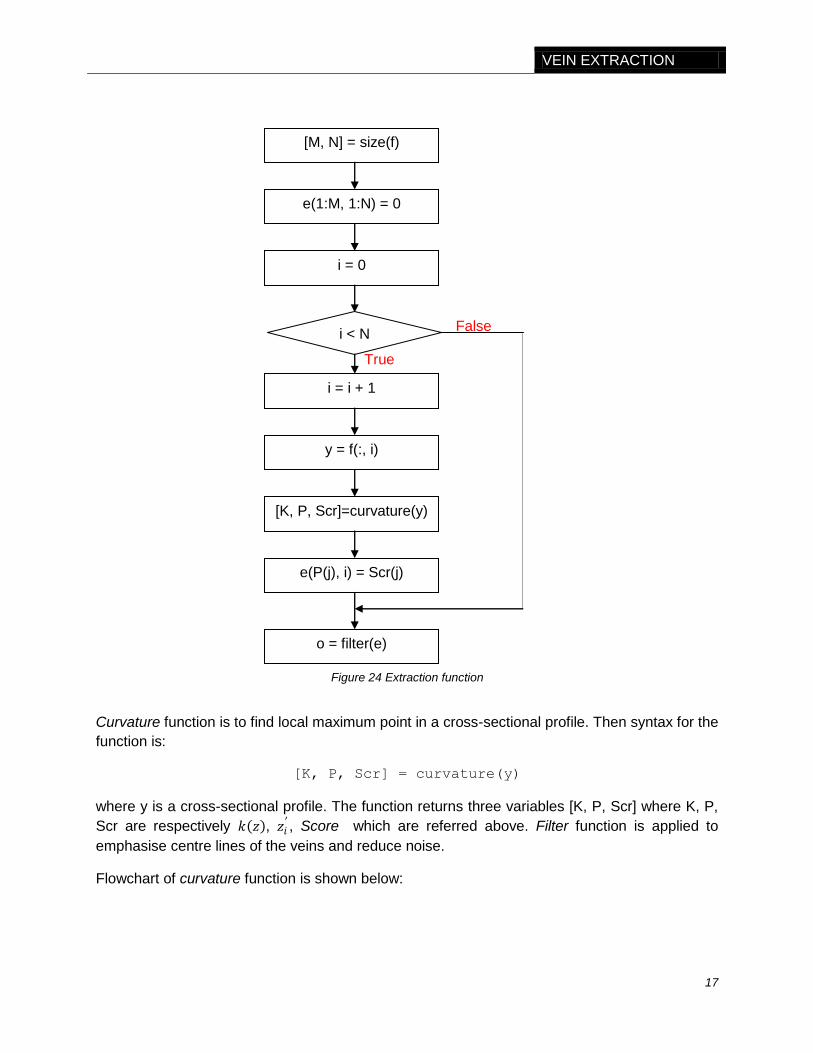
Curvature function is to find local maximum point in a cross-sectional profile. Then syntax for the
function is:
[K, P, Scr] = curvature(y)
where y is a cross-sectional profile. The function returns three variables [K, P, Scr] where K, P,
Scr are respectively 𝑘 𝑧 , 𝑧𝑖′ , Score which are referred above. Filter function is applied to
emphasise centre lines of the veins and reduce noise.
Flowchart of curvature function is shown below:
[M, N] = size(f)
e(1:M, 1:N) = 0
i = 0
i < N
i = i + 1
True
y = f(:, i)
[K, P, Scr]=curvature(y)
e(P(j), i) = Scr(j)
False
o = filter(e)
Figure 24 Extraction function

VEIN EXTRACTION
18
w = 8, n = length(y), pn = 0,
in_a_dent = false, i = w
i < n - w
i = i + 1
True
False
dm = (1/w)*(y(i) – y(i-w))
dp = (1/w)*(y(i+w) – y(i))
d = (1/w)*(y(i+w/2) – y(i-w/2))
K(i) = (dp – dm)/sqrt((1 + d^2)^3)
in_a_dent && k(i-1)<=0
&& k(i) > 0
in_a_dent = true, pn = pn + 1,
ds(pn) = i – 1, max = 0
True
False
in_a_dent = true
True
K(i) > max
False
max = K(i), p(pn) =i
False
True
K(i-1) > max &&
K(i) <= 0
In_a_dent = false, de(pn) = i,
Scr(pn) = (de(pn) – ds(pn)) * y(p(pn))
False
True
Figure 25 Curvature function flowchart

VEIN EXTRACTION
19
Codes in Mablab for all these functions are attached in the Appendices part.
ENROLMENT
20
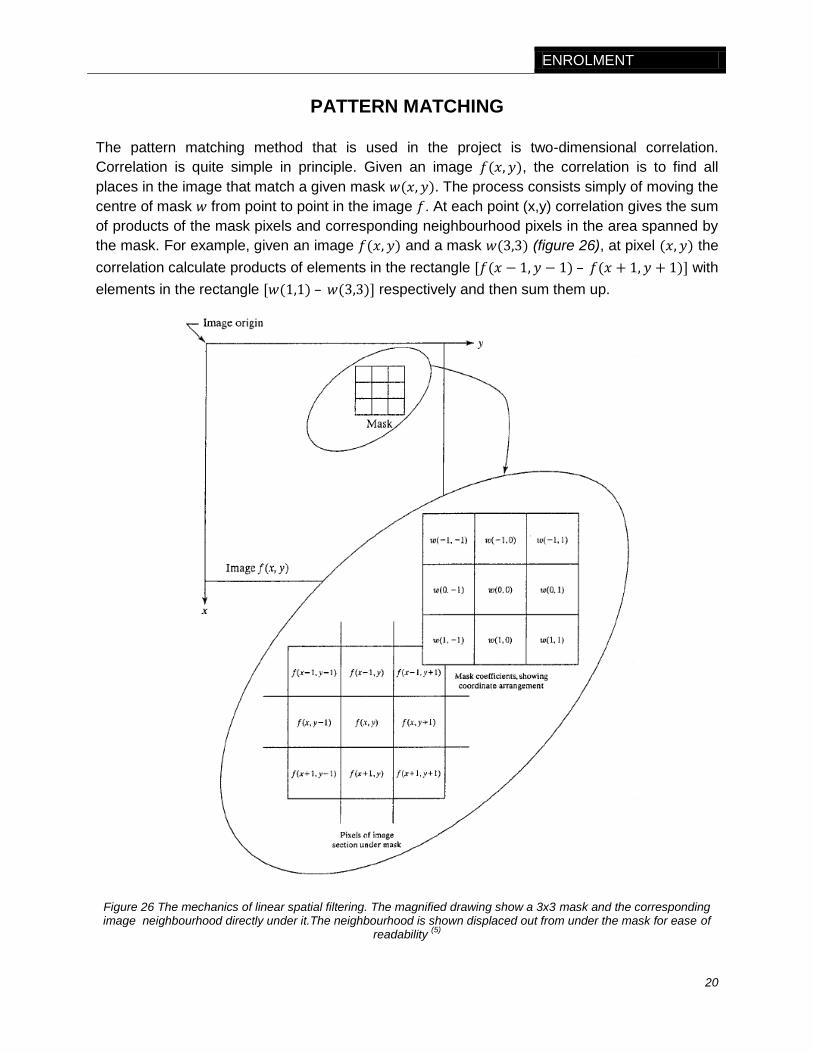
PATTERN MATCHING
The pattern matching method that is used in the project is two-dimensional correlation.
Correlation is quite simple in principle. Given an image 𝑓(𝑥,𝑦), the correlation is to find all
places in the image that match a given mask 𝑤(𝑥,𝑦). The process consists simply of moving the
centre of mask 𝑤 from point to point in the image 𝑓. At each point (x,y) correlation gives the sum
of products of the mask pixels and corresponding neighbourhood pixels in the area spanned by
the mask. For example, given an image 𝑓(𝑥,𝑦) and a mask 𝑤(3,3) (figure 26), at pixel (𝑥,𝑦) the
correlation calculate products of elements in the rectangle [𝑓(𝑥 − 1,𝑦 − 1) – 𝑓(𝑥 + 1,𝑦 + 1)] with
elements in the rectangle [𝑤(1,1) – 𝑤(3,3)] respectively and then sum them up.
Figure 26 The mechanics of linear spatial filtering. The magnified drawing show a 3x3 mask and the corresponding image neighbourhood directly under it.The neighbourhood is shown displaced out from under the mask for ease of
readability (5)

ENROLMENT
21
Assume the size of 𝑓 is 𝑀𝑥𝑁 and 𝑤 is also 𝑀𝑥𝑁. Normally the computational cost is 𝛩(𝑀2𝑥𝑁2)
which is quite high and will slow down the whole process. Another approach is to implement
correlation in frequency domain. Thank to Fast Fourier Transform (FFT), we can obtain a
correlation with only Θ(𝑀𝑥𝑁𝑥𝑙𝑜𝑔 𝑀𝑥𝑁 ). The principle is that the correlation in time domain can
be achieved by the product of the image and complex conjugate of the mask in frequency
domain. Letting ―∘‖ denotes correlation and ―*‖ denote complex conjugate, the correlation
theorem say:
𝑓(𝑥,𝑦) ∘ 𝑤 𝑥,𝑦 ⟺ 𝐹 𝑢, 𝑣 𝐻 ∗ (𝑢, 𝑣) (5)
Firstly FFT is used to convert 𝑓, 𝑤 into frequency domain as 𝐹, 𝑊. This step takes
𝛩(2𝑀𝑁 log 𝑀𝑁 ). Then the complex conjugate of W is calculated with 𝛩(𝑀𝑁). Afterwards the
product of 𝐹 and 𝑊∗ is calculated. This take a computational cost of 𝛩(4𝑀𝑁) (because of
complex numbers). Finally an IFFT is used to convert 𝐹𝑊∗ into time domain with a
computational cost of 𝛩(𝑀𝑁 log 𝑀𝑁 . The overall computational cost for the whole process is
𝛩(2𝑀𝑁 log 𝑀𝑁 ) which is much better to compare to 𝛩(𝑀2𝑥𝑁2) in the normal way. The
flowchart of correlation calculation in frequency domain is shown as follows:
Fortunately all those functions are available in Matlab. Therefore the correlation function can be
done in 5 lines:
function g= dftcorr(f, w)
[M, N] = size(f);
f = fft2(f); %convert to frequency domain
w = conj(fft2(w, M, N)); %calculate complex conjugate
g = real(ifft2(w.*f)); %convert to time domain
The above function returns an image 𝑐(𝑥,𝑦) of 𝑀𝑥𝑁. The maximum value of 𝑐(𝑥, 𝑦) is the
maximum number of matched pixels of two images 𝑓 and 𝑤. A function which returns the
number of dots (white pixels) in an image 𝑓 is defined as 𝜎(𝑓). In order to check if two patterns
are matched, we calculate two ratios:
𝐶
𝐹=
max(𝑐)
𝜎(𝑓)𝑥100%
𝐷
𝐹=
𝜎 𝑤 − 𝜎(𝑓)
𝜎 𝑓 𝑥100%
𝑊 ∗ 𝑊
𝐹
𝑤
𝑓
𝐹𝐹𝑇
𝐹𝐹𝑇
𝑐𝑜𝑟𝑟𝑒𝑙𝑎𝑡𝑖𝑜𝑛
𝑓𝑤 𝐹𝑊
∗
𝑀𝑈𝐿𝑇𝐼𝑃𝐿𝑌
𝐹 𝑥 𝑊 ∗
𝐼𝐹𝐹𝑇
𝑐𝑜𝑚𝑝𝑙𝑒𝑥 𝑐𝑜𝑛𝑗𝑢𝑔𝑎𝑡𝑒
Figure 27 Calculating correlation in frequency domain (17)
ENROLMENT
22
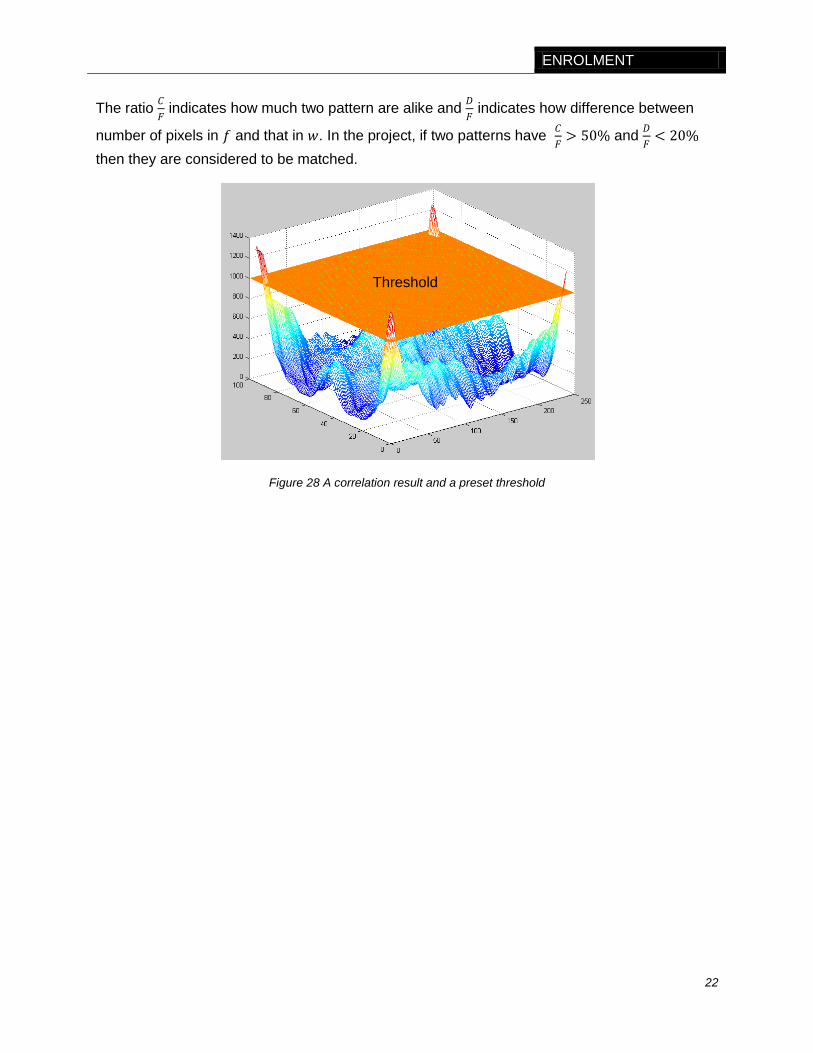
The ratio 𝐶
𝐹 indicates how much two pattern are alike and
𝐷
𝐹 indicates how difference between
number of pixels in 𝑓 and that in 𝑤. In the project, if two patterns have 𝐶
𝐹> 50% and
𝐷
𝐹< 20%
then they are considered to be matched.
Figure 28 A correlation result and a preset threshold
Threshold
ENROLMENT
23
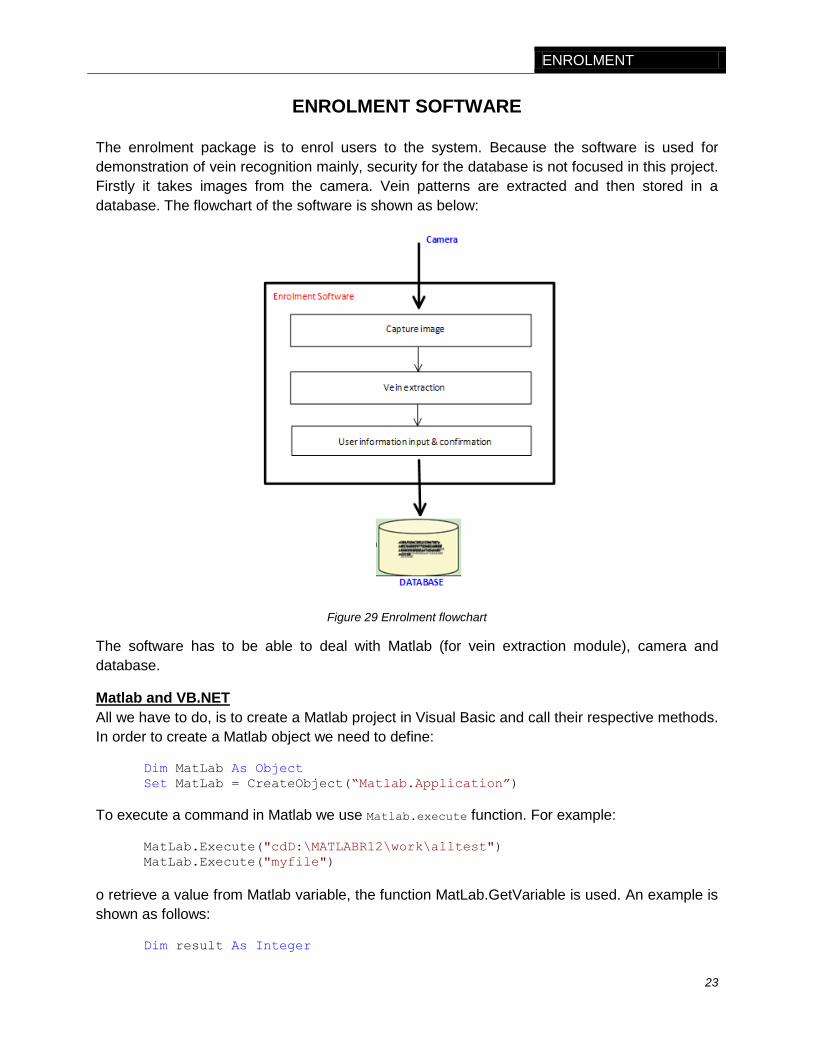
ENROLMENT SOFTWARE
The enrolment package is to enrol users to the system. Because the software is used for
demonstration of vein recognition mainly, security for the database is not focused in this project.
Firstly it takes images from the camera. Vein patterns are extracted and then stored in a
database. The flowchart of the software is shown as below:
Figure 29 Enrolment flowchart
The software has to be able to deal with Matlab (for vein extraction module), camera and
database.
Matlab and VB.NET
All we have to do, is to create a Matlab project in Visual Basic and call their respective methods.
In order to create a Matlab object we need to define:
Dim MatLab As Object
Set MatLab = CreateObject(“Matlab.Application”)
To execute a command in Matlab we use Matlab.execute function. For example:
MatLab.Execute("cdD:\MATLABR12\work\alltest")
MatLab.Execute("myfile")
o retrieve a value from Matlab variable, the function MatLab.GetVariable is used. An example is
shown as follows:
Dim result As Integer
ENROLMENT
24
MatLab.Execute("x = 1 + 2;")
result = MatLab.GetVariable("x", "base")
A notice is that Matlab is required on the running machine.
Camera in VB.NET
In order to handle webcam in VB.NET the AVICap class is used. Firstly we define constants:
Public Const WM_CAP_START = &H400S
Public Const ws_child As Integer = &H40000000
Public Const ws_visible As Integer = &H10000000
Public Const WM_USER As Short = 1024
Public Const wm_cap_driver_connect As Integer = WM_USER + 10
Public Const wm_cap_set_preview As Integer = WM_USER + 50
Public Const WM_CAP_EDIT_COPY = WM_CAP_START + 30
Public Const WM_CAP_SET_PREVIEWRATE As Integer = WM_USER + 52
Public Const WM_CAP_DRIVER_DISCONNECT As Integer = WM_USER + 11
Public Const WM_CAP_DLG_VIDEOFORMAT As Integer = WM_USER + 41
Public Const WM_CAP As Short = &H400S
Public Const WM_CAP_SET_SCALE As Integer = WM_CAP + 53
Public Const SWP_NOMOVE As Short = &H2S
Public Const SWP_NOSIZE As Short = 1
Public Const SWP_NOZORDER As Short = &H4S
Public Const HWND_BOTTOM As Short = 1
―Detail about the use of each of the constants listed above can be found in the Windows
Multimedia SDK Help Reference at: ms-
help://MS.VSCC.v80/MS.MSDN.v80/MS.WIN32COM.v10.en/multimed/htm/_win32_video_capture_re
ference.htm. We can also view the help files using the Help system that comes installed with
Visual Studio 2005‖. (12)
We now define functions which handle the webcam:
'Send specific messages to a window
Declare Function SendMessage Lib "user32" Alias "SendMessageA" (ByVal
hWnd As Integer, ByVal wMsg As Integer, ByVal wParam As Integer, ByVal
lParam As Integer) As Integer
'Creates a capture window
Declare Function capCreateCaptureWindow Lib "avicap32.dll" Alias
"capCreateCaptureWindowA" (ByVal a As String, ByVal b As Integer, ByVal
c As Short, ByVal d As Short, ByVal e As Short, ByVal f As Short, ByVal
g As Integer, ByVal h As Short) As Integer
'Destroy a specific window
Declare Function DestroyWindow Lib "user32" (ByVal hndw As Integer) As
Boolean
'Set the position of the window relative to the screen buffer
Declare Function SetWindowPos Lib "user32" Alias "SetWindowPos" (ByVal
hwnd As Integer, ByVal hWndInsertAfter As Integer, ByVal x As Integer,
ByVal y As Integer, ByVal cx As Integer, ByVal cy As Integer, ByVal
wFlags As Integer) As Integer

ENROLMENT
25
Now assume we have a PictureBox named Vein in Form2. The follow function enables the
webcam represents in the Picturebox:
Public Sub StartPreviewWindow()
Dim temp As Integer
hwdc = capCreateCaptureWindow("University of Plymouth", ws_child Or
ws_visible, 0, 0, 320, 200, Form2.Vein.Handle.ToInt32, 0)
If (hwdc <> 0) Then
'Connect to the driver
temp = SendMessage(hwdc, wm_cap_driver_connect, 1, 0)
'Set priview rate
temp = SendMessage(hwdc, WM_CAP_SET_PREVIEWRATE, 66, 0)
'Set preview scale
temp = SendMessage(hwdc, WM_CAP_SET_SCALE, True, 0)
'Start previewing the image from the camera
temp = SendMessage(hwdc, wm_cap_set_preview, 1, 0)
SetWindowPos(hwdc, HWND_BOTTOM, 0, 0, Form2.Vein.Width,
Form2.Vein.Height, SWP_NOMOVE Or SWP_NOZORDER)
startcap = True
Else
MsgBox("No Webcam found")
End If
End Sub
To capture the current image in the PictureBox we copy it to the clipboard:
'---copy the image to the clipboard---
SendMessage(hwdc, WM_CAP_EDIT_COPY, 0, 0)
Data from the clipboard may be saved into a file for further process. The follow function is used
to stop the webcam:
Public Sub StopPreviewWindow()
SendMessage(hwdc, WM_CAP_DRIVER_DISCONNECT, 0, 0)
DestroyWindow(hwdc)
End Sub
MS Access Database
The database is a MS Access file including 4 fields:
ID (primary key): user identification number
first_name (string): user first name
last_name (string): user last name
vein (long binary data): vein patterns
A data sample is shown in the below figure:

ENROLMENT
26
Figure 30 User database
To add a data source to the project, we use Data > Add New Data Source menu (figure 31).
Figure 31 Adding a source: Use the simple menu command shown to launch the Data Source Configuration Wizard and add a new data source to the project
(12)
When the wizard appears, we choose Database and click Next > New Connection. A popup
appears for us to configure the database:
Figure 32 Add connection popup
The data source is changed to Microsoft Access Database File. Database file name is indicated
where the MS Access file is created.

ENROLMENT
27
User interface
The software includes two forms. The main form lists information of all users in the database. A
button Add/Remove user is added for the administrator to modify the database (figure 33).
Figure 33 Enrolment's main form
When the admin clicks Add/Remove user button, the second form appears. The form includes a
Database Binding Navigator that we can use to navigate the database. Information of users
such as first name, last name, vein pattern are also shown in the form.
Figure 34 Database navigator

ENROLMENT
28
The form enables admins to modify, add or remove the user information. All changes will be
saved into the database file when save button is clicked.

MANAGEMENT
29
MANAGEMENT SOFTWARE
The management software enables the current user to lock/unlock his/her personal computer.
When a user leaves his/her computer, he/she may want to use the software to lock his/her
computer. When he/she comes back and wants to unlock the computer, he/she needs to put
his/her finger which was used in enrolment into the vein scanner. The software will check if the
vein of that finger is matched to the current user or not. If the vein is matched, the computer is
unlocked. Like enrolment software, the management software has to deal with MatLab, camera,
database and locking/unlocking the system. The below figure shows the flow chart of the
software:
Figure 35 Management software flowchart
Modules for dealing with Matlab, camera and database have been referred in the Enrolment
software part. In order to lock/unlock the system in Windows XP, the below code is applied.
Lock/unlock keyboard/mouse in Windows XP
The below code illustrates how to disable input from keyboard/mouse in Windows XP (13):
Imports System.Windows.Forms
Public Class WinControl
' This is the function used in order to block the keyboard and mouse:
Declare Function BlockInput Lib "User32" _
(ByVal fBlockIt As Boolean) As Boolean
Private Sub WaitThread(Byval _seconds as integer)
BlockInput(True)

MANAGEMENT
30
While (success = False And _
(DataTime.Now.Substract(now).Seconds _
< seconds Or seconds = 0 ))
Try
success = true
Catch
' Assuming window was not found
' and sleep for 100 miliseconds
System.Threading.Thread.Sleep(100)
End Try
End While
BlockInput(False)
End Sub
End Class
Software UI
When management software is run, an icon will appear in the system tray (figure 36). If we right-
click on the icon a menu will show up with five options:
Lock computer: computer will be locked if this is opted.
Show control panel: if this one is chosen, a popup window will appear for user to
observe what are happening.
Launch Enrollment: used to launch the enrolment software
Exit
Figure 36 Management software
When the computer is locked, a black screen will appear with a blink message (figure 37a). In
this state, inputs from keyboard/mouse are disabled. In order to unlock the computer, the user
put his/her finger which was used in enrolment into the scanner device. The software will extract
the vein pattern and compare to patterns in the database. If the pattern is matched, keyboard
and mouse are re-enabled.

MANAGEMENT
31
(a) Computer is locked
(b)Vein matched, the computer is unlocked
Figure 37
The control panel shows extracted vein pattern, ratios 𝐶
𝐹 and
𝐷
𝐹.
Figure 38 Management control panel
CONCLUSION
32
CONCLUSION
The final product has worked and satisfied individual identification by finger veins applied in
personal computer as proposed. The product has been tested with 10 people and worked
properly with 8 people. This accuracy is not high mainly due to poor quality of vein images
coming in from the camera. This can be improved by using a better near-infrared source and a
more sensitive camera. The arrangement of infrared LEDs can also be changed so that we can
have different designs of the vein scanner.
The project has demonstrated and proved the capability of personal identification based on vein
patterns. Although the scale is small, other applications can be extended by solutions which are
used in this project. For large applications, some modules should be done in hardware in order
to improve the speed of the whole system. If problems of accuracy and speed are solved there
is a huge market waiting for the system such as ATMs, cars, houses, cell phones, entrance
doors, etc.

33
BIBLIOGRAPHY
1. Automatic feature extraction from non-uniform finger vein image and its application to
personal identification. N. Miura, A. Nagasaka, and T.Miyatake. Nara, Japan : IAPR, 2002,
Vol. MVA2002.
2. Locating blood vessels in retina image by piece-wise threshold probing of a matched filter
response. A. Hoover, V. Kouznetsova, and M. Goldbaum. 3, s.l. : IEEE Tras. Med. Imaging,
2000, Vol. 19, pp. pp 203-210.
3. Multiscale Feature of Finger-Vein Patterns Based on Curvelets and Local Interconnection
Structure Neutral Network. Zhongbo Zhang, Siliang Ma, Xiao Han. Changchun : The 18th
International Conference on Pattern Recognition (ICPR '06), 2006. 0-7695-2521-0/06.
4. Roy, Divakar. Auto Contrast. Matlab Central. [Online] MatWork. [Cited: 04 04 2008.]
http://www.mathworks.com/matlabcentral/fileexchange/loadFile.do?objectId=10566&objectType
=file.
5. Rafael C. Gonzalez, Steven L. Eddins, Richard E. Woods. Digital Image Processing Using
Matlab. Tennessee, US : s.n.
6. Automatic segmentation and registration of retinal fluorescein angiograpies - Application to
diabetic retinopathy. T. Walter, J. Klein, P. Massin, and F. Zana. Copenhagen, Denmark : s.n.,
May 200. Vol. First international Workshop on Computer Assisted Fundus Image Analysis, pp.
pp 15-20.
7. Perceptual organization of thin networks with active contour functions applied to medical and
aerial images. P. Montesinos and L. Alquier. Veinne, Autriche : ICPR'96, 1996. pp. pp 647-
651.
8. Direct gray-scale minutiae detection in fingerprints. D. Maio and D. Maltoni. s.l. : IEEE
Trans. Pattern Anal. Mach. Intell., Jan 1997. Vol. 19, pp. 27-40.
9. An extraction of finger vein patterns based on multipoint interative line tracing. N. Miura, A.
Nagasaka and T.Miyatake. 2001. Proc. IEICE. Gen. Conf. 2001.
10. Extraction of finger-vein patterns using maximum curvature points in image profile. N.
Miura, A. Nagasaka, and T. Miyatake. 8, s.l. : IEICE TRANS. INF. & SYST, August 2007, Vols.
E90-D.
11. Nagao, M. Methods of image pattern recognition. s.l. : Corona publishing, 1983.
12. Lee, Wei-Meng. Tech your old webcam new tricks : Use video captures in your .NET
application. DEVX. [Online] [Cited: 16 Apr 2008.]
http://www.devx.com/dotnet/Article/30375/1763/page/1.
13. Optical trans-body imaging: feasibility of optical CT and functional imaging of living body.
Shimizu, K. 1992, Jpn of Medicina Philosophica 11, pp. 620-629.

34
14. ELJ810-248B — EPIGAP — IR EMITTER, JUMBO, 40DEG. Farnell UK. [Online] Farnell.
[Cited: 02 04 2008.] http://uk.farnell.com/1200326/optoelectronics/product.us0?sku=EPIGAP-
ELJ810-248B.
15. Limited, Instrument Plastic. Optolite IR Infrared Filter. Farnell. [Online] [Cited: 04 04
2008.] http://www.farnell.com/datasheets/7749.pdf.
16. Image histogram. Wikipedia. [Online] Wikimedia, 17 01 2008. [Cited: 04 04 2008.]
http://en.wikipedia.org/wiki/Image_histogram.
17. Reeve, Kit. Digital correlation. s.l. : University of Plymouth portal.
18. Sha, Zahra A. How to link Matlab to VB ? DSPRelated.com. [Online]
http://www.dsprelated.com/groups/matlab/show/1718.php.

35
APPENDICES