FINDINGS from UCC FACT Survey March, 2011 Results are based on the responses of 642 congregations....
64
FINDINGS from UCC FACT Survey March, 2011 Results are based on the responses of 642 congregations. Because the interfaith project is still underway, please do not publicly distribute these findings.
-
Upload
amberlynn-ada-anthony -
Category
Documents
-
view
216 -
download
0
Transcript of FINDINGS from UCC FACT Survey March, 2011 Results are based on the responses of 642 congregations....

FINDINGS from UCC FACT Survey
March, 2011
Results are based on the responses of 642 congregations. Because the interfaith project is still underway, please do not publicly distribute these findings.

Patterns of Weekend Worship
Sunday AM 1 service79%
Sunday evening
5%
Friday1% Saturday
3%
Sunday AM 3 or more services
1%Sunday AM 2
services11%

5-Year Changes in Worship
Changed a lot5%
Added different service
9%
Changed a little31%
No change36%
Changed somewhat
19%

Average Worship Attendance 2010
0%
5%
10%
15%
20%
25%
30%P
erce
nt
People in Attendance

Change in Attendance, 2005-2010
0
5
10
15
20
25
30Pe
rcen
t
2005 2010
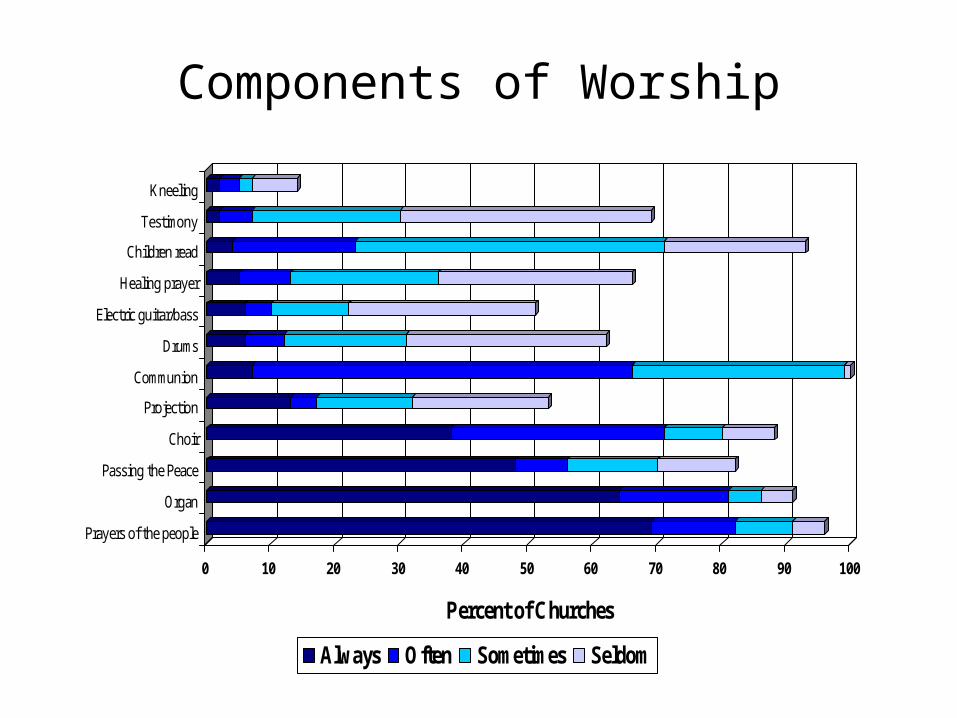
Components of Worship
0 10 20 30 40 50 60 70 80 90 100
Percent of Churches
Prayers of the people
Organ
Passing the Peace
Choir
Projection
Communion
Drums
Electric guitar/bass
Healing prayer
Children read
Testimony
Kneeling
Always Often Sometimes Seldom

Descriptions of Worship
0 10 20 30 40 50 60 70 80 90 100
Percent of Churches
Filled w/ God's presence
Thought-provoking
Joyful
Inspirational
Reverent
Innovative
Very Well Quite Well Somewhat Slightly

Clergy Rating of Worship
Excellent30%
OK15%
Needs improvement
2%
Solid, good53%

Programs and Activities of at least 65% of Congregations
0 10 20 30 40 50 60 70 80 90 100
Percent of Churches
Community services
Sunday school
Music program
Fellowship activities
Bible Studies
Women's ministry
Youth activities
Adult faith devel.
Children's programs
Specialty A lot of emphasis Some emphasis

Programs and Activities of Fewer than 65% of Congregations
0 10 20 30 40 50 60 70 80 90 100
Percent of Churches
Prayer groups
Men's ministry
Support groups
Children's choir
Young adult activities
Spiritual retreats
Parenting
Sports
Specialty A lot of emphasis Some emphasis

Ways Visitors are Contacted
0 10 20 30 40 50 60 70 80 90 100
Percent Using Each Method
By mail
By phone
By email
Send info
By visit
Rarely contact
Rarely have visitors

Mission Activities
0 10 20 30 40 50 60 70 80 90 100
Percent of Congregations Doing Each Activity
Collected $
Collected items
Hosted speaker
Sponsored US trip
Sponsored a child
Sponsored trip overseas
Sent long-term volunteers

How Congregations Distribute their Mission Donations
25 %
23%
51%
through UCCthrough other agenciesown projects
• 10% gave nothing through UCC; 5% gave all through UCC
• 22% gave nothing through other agencies, 1% gave all through other agencies
• 31% gave nothing through self-generated projects, 2% gave all through self-generated projects
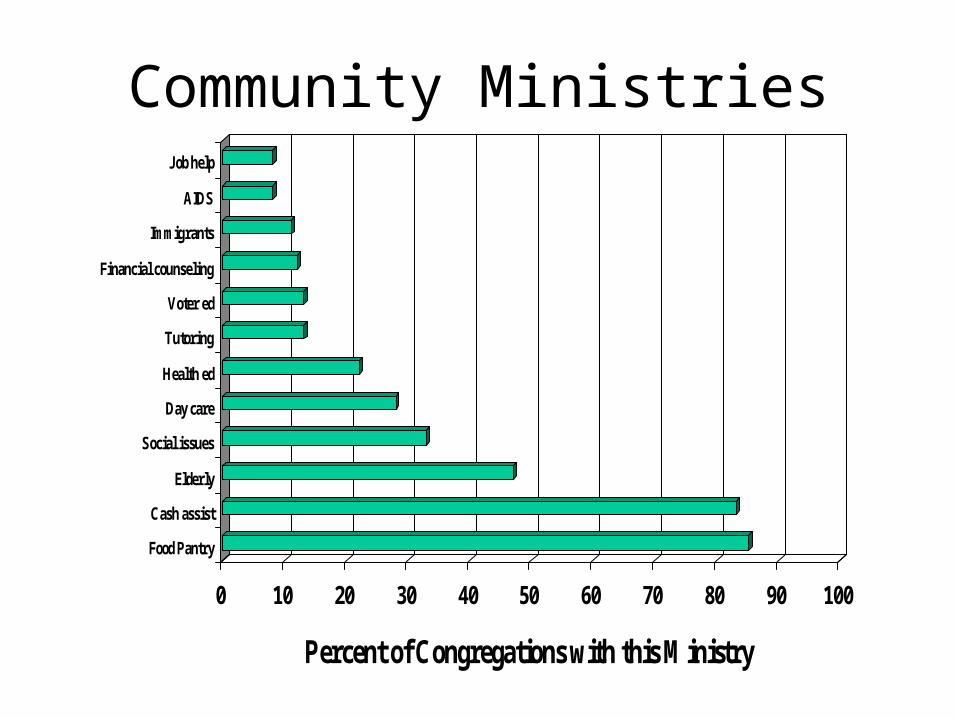
Community Ministries
0 10 20 30 40 50 60 70 80 90 100
Percent of Congregations with this Ministry
Food Pantry
Cash assist
Elderly
Social issues
Day care
Health ed
Tutoring
Voter ed
Financial counseling
Immigrants
AIDS
Job help

Emphasis on Religious Practices
0 10 20 30 40 50 60 70 80 90 100
Percent of Churches Emphasizing the Practice
Personal prayer
Personal Bible study
Family talk re faith
Tithing
Family devotions
Keeping Sabbath
No premarital sex
Fasting
Dietary restrictions
A lot Quite a bit Some A little

Use of Electronic Media
0 10 20 30 40 50 60 70 80 90 100
Percent Using Each
Web site
VANCO
Blogs
Podcasts
On-line giving
Other
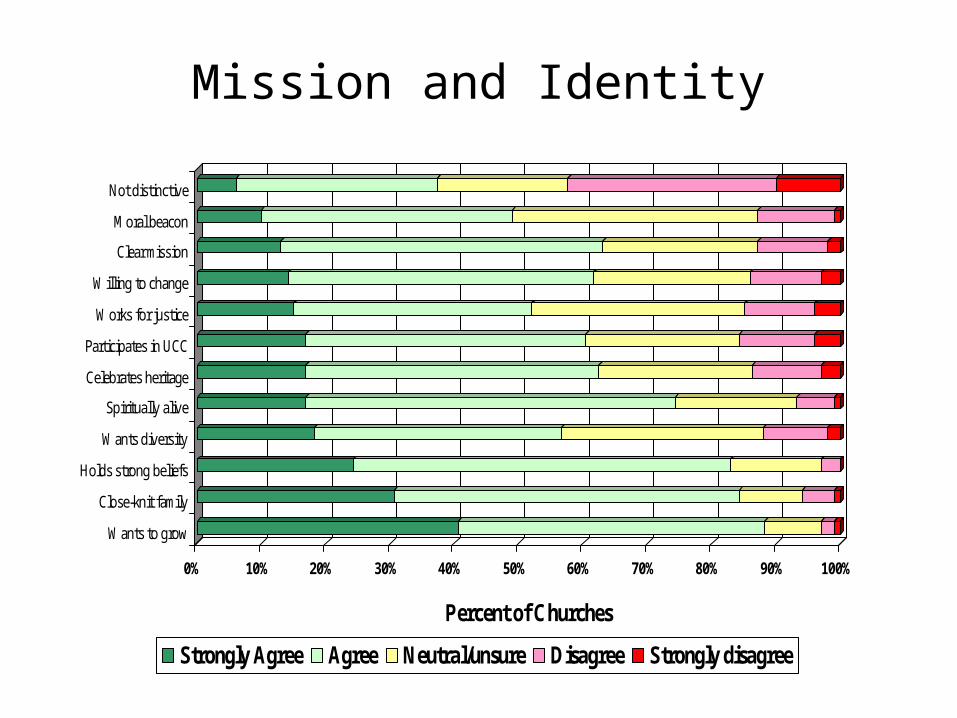
Mission and Identity
0% 10% 20% 30% 40% 50% 60% 70% 80% 90% 100%
Percent of Churches
Wants to grow
Close-knit family
Holds strong beliefs
Wants diversity
Spiritually alive
Celebrates heritage
Participates in UCC
Works for justice
Willing to change
Clear mission
Moral beacon
Not distinctive
Strongly Agree Agree Neutral/unsure Disagree Strongly disagree

Theological Outlook of Congregation
Somewhat liberal23%
Very liberal11%
Somewhat conservative
24%
Very conservative
4%
Moderate38%

Regular Participants in Religious Activities
0
5
10
15
20
25P
erce
nt o
f C
ongr
egat
ions
Number of Regular Participants

Percent of the Congregation that is White
0
5
10
15
20
25
30
35
Per
cent
of
Con
greg
atio
ns
Percent White

Percent of the Congregation Aged 65 or Over
0
5
10
15
20
25
Per
cent
of
Con
greg
atio
ns
Percent 65 or Over

Percent of the Congregation Aged 50 to 64
0
5
10
15
20
25
30
35
Per
cent
of
Con
greg
atio
ns
Percent 50 to 64

Percent of the Congregation Aged 35 to 49
05
10152025303540
Per
cent
of
Con
greg
atio
ns
Percent 35 to 49

Percent of the Congregation Aged 18 to 34
0
10
20
30
40
50
60
70
Per
cent
of
Con
greg
atio
ns
Percent Aged 18 to 34

Percent of the Congregation Aged 0 to 17
05
101520253035404550
Per
cent
of
Con
greg
atio
ns
Percent Aged 0 to 17

Percent of the Congregation that is Female
0
5
10
15
20
25
30
35
Per
cent
of
Con
greg
atio
ns
Percent Female

Percent of the Congregation who are College Graduates
0
5
10
15
20
25
30
Per
cent
of
Con
greg
atio
ns
Percent College Graduates

Percent of the Congregation who are New in Past Five Years
0
5
10
15
20
25
30
35
Per
cent
of
Con
greg
atio
ns
Percent New

Percent of the Congregation who are “Out” LGBT
0
10
20
30
40
50
60
Per
cent
of
Con
greg
atio
ns
Percent LGBT

Percent of the Congregation who are Lifelong UCC
0
5
10
15
20
25
Per
cent
of
Con
greg
atio
ns
Percent Lifelong UCC

Percent of the Congregation Who Live within 15 Minutes of Church
0
5
10
15
20
25
30
Per
cent
of
Con
greg
atio
ns
Percent Living within 15 Minutes of Church

People Associated with the Congregation
0
5
10
15
20
25P
erce
nt
Number of People

Clergy Leadership
Senior & Asso(s)17%
Co-pastors3%
No pastor2%
Solo pastor78%

Clergy Age and Gender
0
20
40
60
80
100
120
140
Num
ber
of C
lerg
y
20s 30s 40s 50s 60 to64
65 to69
70 andoverAge
Female Male

Clergy Employment Status
Full-time paid64%
Part-time paid34%
Part-time unpaid
1%
Full-time unpaid
1%

Clergy Educational Level
Masters/MDiv65%
PhD/DMin21%
Some College4%
High School1%
Bachelor's 9%

Clergy Race/Ethnicity
Not stated8%
Pacific Islander1%
White84%
Native American< 0.5%
African American
4%Biracial1%
Asian2%

Year of Call to This Church
02468
101214
Per
cent
Bef
ore
1980
1980
s
1990
-199
1
1992
-199
3
1994
-199
5
1996
-199
7
1998
-199
9
2000
2001
2002
2003
2004
2005
2006
2007
2008
2009
2010
Year Called

Time Spent in Ministry Tasks
0% 10% 20% 30% 40% 50% 60% 70% 80% 90% 100%
Percent
Worship
Pastoral care
Teaching
Administration
Setting vision
Community
Wider church
Youth/YA
Conflict
Small groups
Evangelism
Stewardship
Leader devel.
Great deal Quite a bit Some Very little
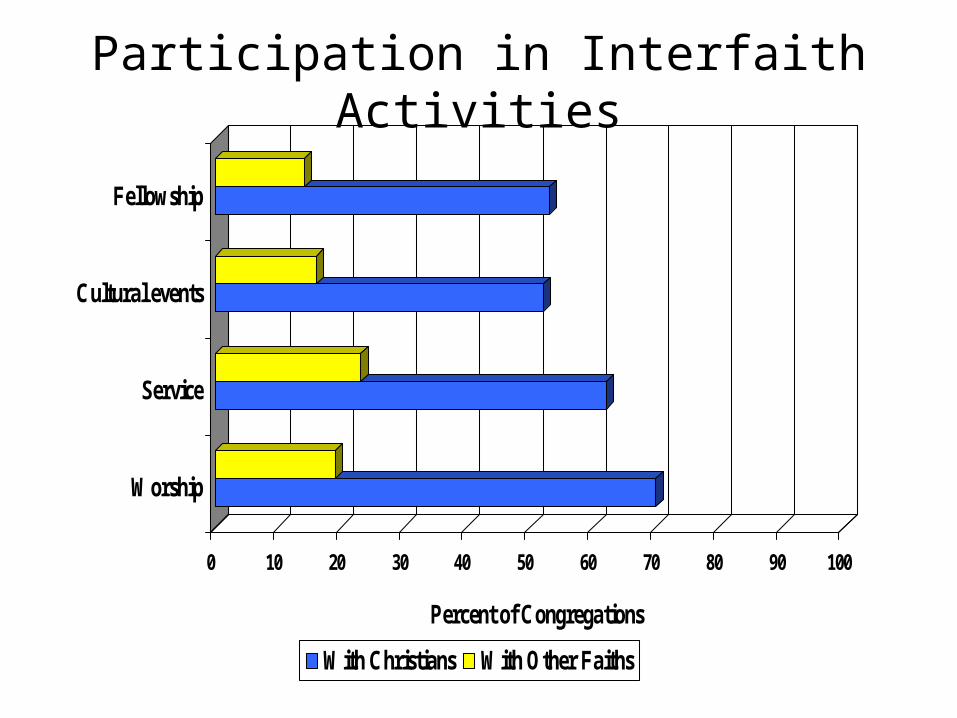
Participation in Interfaith Activities
0 10 20 30 40 50 60 70 80 90 100
Percent of Congregations
Worship
Service
Cultural events
Fellowship
With Christians With Other Faiths

Conflicts in Last 5 Years
0 10 20 30 40 50 60 70 80 90 100
Percent
Pastor's behavior
Program priorities
Facilit ies
Members' behavior
Pastor's leadership
General Synod
Worship
Finances
None Not serious

Conflicts in Last 5 Years
0 10 20 30 40 50 60 70 80 90 100
Percent
Pastor's leadership
Pastor's behavior
Finances
Members' behavior
Worship
Program priorities
General Synod
Facilit ies
Pastor left People withheld $ People left

Size of 2010 Budget
02468
101214
Per
cent
Les
s th
an 2
5K
25 t
o 50
K
50 t
o 75
K
75 t
o 10
0K
100
to 1
25K
125
to 1
50K
150
to 1
75K
175
to 2
00K
200
to 2
50K
250
to 3
00K
300
to 3
50K
350
to 4
00K
400
to 5
00K
500K
to
1M
Ove
r 1M
Budget in Thousands of Dollars

Percent of the Budget Spent on Staff
0
5
10
15
20
25
30
Per
cent
of
Con
greg
atio
ns
Percent Spent on Staff

Percent of the Budget Spent on Building Operations
05
10152025303540
Per
cent
of
Con
greg
atio
ns
Percent Spent on Building Operations

Percent of the Budget Spent on Program Support and Materials
0102030405060708090
Per
cent
of
Con
greg
atio
ns
Percent Spent on Program Support

Percent of the Budget Spent on Mission
0
10
20
30
40
50
60
70
Per
cent
of
Con
greg
atio
ns
Percent Spent on Mission

Percent of the Budget Spent on Other Expenditures
0
10
20
30
40
50
60
Per
cent
of
Con
greg
atio
ns
Percent Spent on Other Expenditures
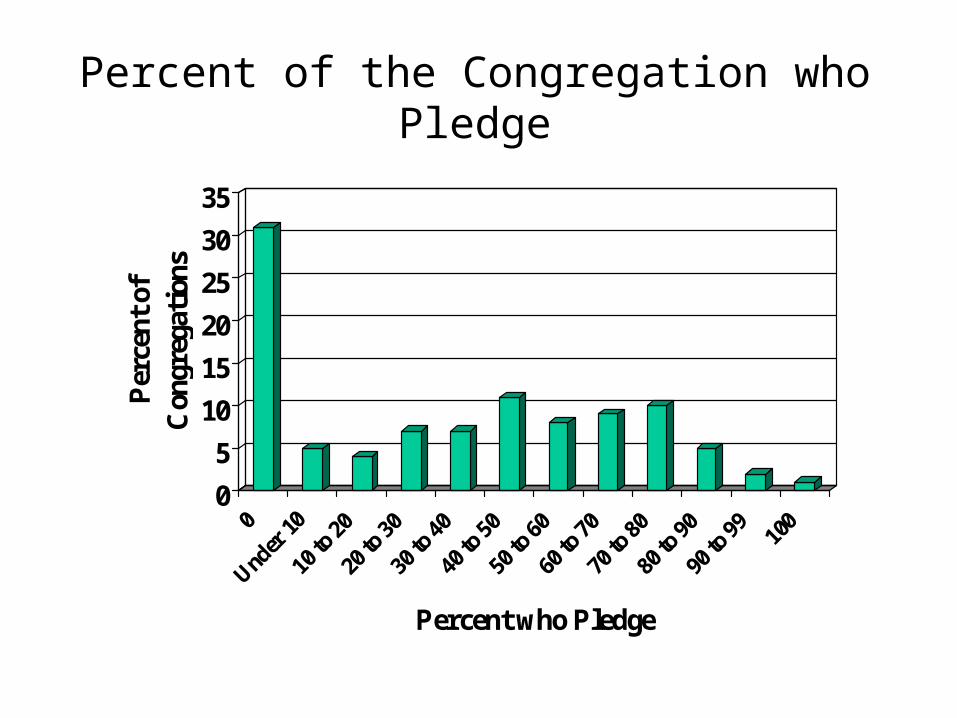
Percent of the Congregation who Pledge
0
5
10
15
20
25
30
35
Per
cent
of
Con
greg
atio
ns
Percent who Pledge

Percent of the Congregation who Pay Pledges in Full (of Pledgers)
0
5
10
15
20
25
30
Per
cent
of
Con
greg
atio
ns
Percent who Pay Pledge in Full

Change in Financial Health, 2005-2010
05
101520253035404550
Per
cent
Seriousdifficulty
Somedifficulty
Tight, butwe
manage
Good Excellent
20052010

Impact of 2008-09 Economic Crisis
05
1015202530354045
Per
cent
Incomedeclined a
lot
Declined alittle
Declinedbut
rebounded
Nosignificant
change
Income hasgrown

Ways the Economic Crisis Impacted Congregations
0 10 20 30 40 50 60 70 80 90 100
Percent Reporting Some Impact
$ from investments
$ for mission
Salary freeze
$ for building
Hiring freeze
Staff layoffs
Major Moderate Minor

Ways the Economic Crisis Impacted Congregations
0 20 40 60 80 100
Percent Reporting Some Impact
Members unemployed
Cash requests
Counseling requests
Housing requests
Major Moderate Minor

Participation in Vitality Training
0
5
10
15
20
25
30
35
40
45
Per
cent
Not at all A little Some Significant

Impact of Still-Speaking
0 10 20 30 40 50 60 70 80 90 100
Percent
No impact
Members learned re UCC
Members increased pride in UCC
A few new people attended
Aroused controversy
Many new people attended

Agreement with Vitality Components
0 10 20 30 40 50 60 70 80 90 100
Percent
Makes a real difference to members
Morale is high
Focused on wider community
Shared vision and goals
Excitement about future
Ready to try new
Strongly agree Agree

Agreement with “Our congregation is a vital congregation.”
Strongly Agree20%
Agree49%
Unsure or Mixed21%
Disagree8%
Strongly Disagree
2%

Ways the Congregation Changed in Last 5 Years
0 10 20 30 40 50 60 70 80 90 100
Percent
Spiritually
Fellowship
Affect members
Mission
Organizational
Stewardship
Evangelizing
Great deal stronger Moderately stronger A little stronger

Location of Church
Rural19%Older city
neighborhood11%
Older suburb10%
Newer suburb1%
Large town18%
Village/small town32%
Downtown city9%

UCC Region
Western15%
Plains16%
Great Lakes22%
New England21%
Middle Atlantic
20%
Southern6%

Sanctuary Seating Capacity
0
5
10
15
20
25
30
Per
cen
t o
f C
hu
rch
es
50 o
r le
ss
50-1
00
100-
150
150-
200
200-
250
250-
300
300-
400
400-
500
500-
750
750-
100
0
Ove
r 10
00
Sanctuary Seating Capacity

Year Organized
0
5
10
15
20
25
30
35
40P
erce
nt
of C
ongr
egat
ion
s
1700or
earlier
1701-1750
1751-1800
1801-1850
1851-1900
1901-1950
1951-2000
Since2000
Organization Date
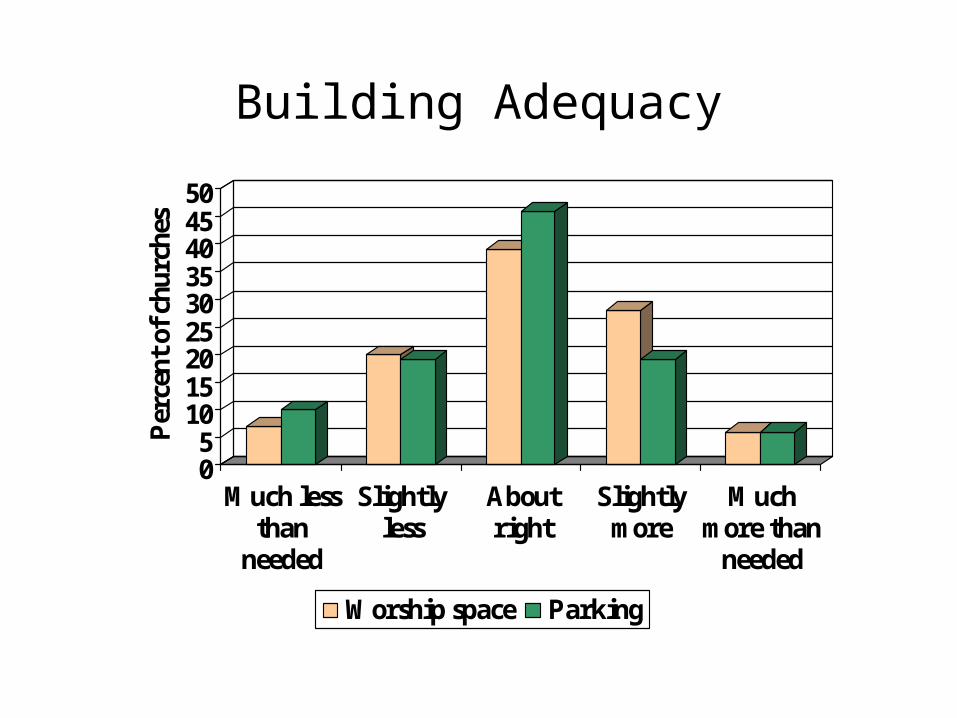
Building Adequacy
05
101520253035404550
Per
cent
of
chur
ches
Much lessthan
needed
Slightlyless
Aboutright
Slightlymore
Muchmore than
needed
Worship space Parking