Findings from a Pilot Study to Measure Financial Fraud in ...
72
longevity.stanford.edu FINDINGS FROM A PILOT STUDY TO MEASURE FINANCIAL FRAUD IN THE UNITED STATES A collaboration between the Stanford Center on Longevity and the FINRA Investor Education Foundation. February 2017 Marguerite DeLiema Gary Mottola Martha Deevy
Transcript of Findings from a Pilot Study to Measure Financial Fraud in ...
l o n g e v i t y . s t a n f o r d . e d u
F I N D I N G S F R O M A P I LOT ST U DY TO M E A S U R E F I N A N C I A L F R AU D I N T H E U N I T E D STAT E S
A collaboration between the Stanford Center on Longevity and the FINRA Investor Education Foundation.
February 2017Marguerite DeLiemaGary Mottola Martha Deevy

Findings from a Pilot Study to Measure Financial Fraud in the United States | 2017 1
ACKNOWLEDGEMENTS Survey development and administration was a joint effort between the Stanford Center on Longevity, the FINRA Investor Education Foundation, the Bureau of Justice Statistics, and Arc Research. The authors would like to thank the FINRA Investor Education Foundation for sponsoring the project, and Lynn Langton and Michael Planty from the Bureau of Justice Statistics for consultation on survey design. They would also like to thank Amy Nofziger from the AARP Foundation, as well as Melodye Kleinman and Anna Mills from the National Telemarketing Victim Call Center for recruiting participants to provide feedback on the survey. We are grateful to Joyce Cheng and Brett Dowling for their assistance with data analysis, and to Sasha Johnson-Freyd for formatting this report. Special thanks to Kendrick Sadler, Andrew Tuck, and Christopher Bumcrot from Arc Research for survey design and implementation. The authors would also like to acknowledge the expertise provided by participants who attended the Taxonomy of Fraud Working Group and The True Impact of Fraud: A Roundtable of Experts meetings in the years leading up to survey development.

Findings from a Pilot Study to Measure Financial Fraud in the United States | 2017 2
CONTENTS Acknowledgements .......................................................................................................................................... 1
Executive Summary .......................................................................................................................................... 3
Background ....................................................................................................................................................... 5
Developing the Survey Instrument ................................................................................................................. 6
Methods ............................................................................................................................................................. 8
Findings .............................................................................................................................................................. 9
Overall Frequency of Fraud ......................................................................................................................... 9
Demographic Characteristics of Victims and Non-Victims .................................................................... 10
Investment Fraud ........................................................................................................................................ 13
Consumer Products and Services Fraud .................................................................................................. 13
Employment Opportunity Fraud ............................................................................................................... 15
Prize and Lottery Fraud .............................................................................................................................. 15
Phantom Debt Collection Fraud ............................................................................................................... 16
Charity Fraud ............................................................................................................................................... 16
Relationship and Trust Fraud .................................................................................................................... 16
Losses ........................................................................................................................................................... 17
Fraud Solicitation and Payment Methods ............................................................................................... 19
Perpetrators ................................................................................................................................................ 21
Reporting ..................................................................................................................................................... 22
Emotional Costs and Financial Consequences ........................................................................................ 24
Survey Design Challenges and Recommendations .................................................................................... 25
Next Steps ........................................................................................................................................................ 28
References ....................................................................................................................................................... 29
Appendix A. Data Tables ................................................................................................................................ 30
Appendix B. Survey Questionnaire ............................................................................................................... 41
Findings from a Pilot Study to Measure Financial Fraud in the United States | 2017 3
EXECUTIVE SUMMARY Consumer financial fraud is a serious problem in our society. More than 1.2 million fraud complaints were made to law enforcement and federal agencies in 2015, and over half of the consumers filing complaints reported losing money (Consumer Sentinel Network, 2016). No socioeconomic or demographic group is immune to fraud victimization. Men and women, college students and retirees, rich and poor — all are all potential targets. Despite the billions of dollars lost to scams each year, the United States has yet to routinely administer a national survey to estimate the annual prevalence of financial fraud. Therefore, with support and assistance from the FINRA Investor Education Foundation (FINRA Foundation), the Stanford Center on Longevity (SCL) embarked on a project to create, test, and refine a survey instrument to measure the scope of the problem.
Survey development was based on a report published by SCL in 2015 — A Framework for a Taxonomy of Fraud — that defines and categorizes the many subtypes of fraud targeting individuals. The survey was tested with victims and non-victims, and administered to an online panel of 2,000 U.S. adults age 18 and older. Data was collected on the frequency and type of fraud victimization in the past year, the amount of the loss, fraud solicitation and transaction methods, perpetrator characteristics, reporting behaviors, and the emotional and financial impact of victimization. The survey measured seven major categories of fraud targeting individuals defined in the taxonomy:
1) Investment fraud
2) Consumer products and services fraud
3) Employment opportunity fraud
4) Prize and lottery fraud
5) Phantom debt collection fraud
6) Charity fraud
7) Relationship and trust fraud
Key findings from the pilot test were:
• Half of the survey respondents reported victimization by one or more major category of fraud in the past year. This is much higher than the Federal Trade Commission’s (FTC, 2013) estimate that 10.8% of U.S. adults were defrauded in 2011, and also higher than the National White Collar Crime Center’s (NWC3) prevalence rate of 16.7% (Huff et al., 2010).1
• Consumer products and services fraud was reported with the highest frequency — nearly 43% of the sample reported experiencing one or more of these types of scams.
• On average, fraud victims in the sample were nine years younger than respondents who did not report fraud — 40.9 years old compared to 49.7 years old — and the majority of victims were male. The FTC (2013) also found that consumers ages 45 to 54 were significantly more likely to be victims than those over age 55, but there were no significant differences in victimization rates by gender.
• The most common method of fraud solicitation was through the Internet (30%), and the most common method of payment was by credit card (32%). The FTC (2013) also found that one-third of self-report victims were solicited online (33%), but more than 56% paid by credit card.
1 These studies use random digit dialing to survey consumers over the phone. The types of fraud included in those questionnaires differ from the fraud types surveyed in this pilot study.

Findings from a Pilot Study to Measure Financial Fraud in the United States | 2017 4
• Also similar to the FTC (2013) report, typical losses from fraud were low. While 46% of the sample reported losses between $1 and $99, 30% of fraud victims reported losses between $100 and $499, and 21% reported losses of $500 or more. Eighteen percent paid money more than one time. These loss estimates are similar to findings reported in other surveys of the general population (e.g., Titus et al., 1995) but are less than the average amounts reported by consumers to complaint agencies (Consumer Sentinel Network, 2016).
• The majority of victims (52%) believe they were intentionally scammed or defrauded by the person or organization that took their money.
• As a direct result of fraud victimization, 35% reported that it was hard or somewhat hard for them to meet their monthly expenses or pay their bills.
• Only 14% of victims reported the incident to local law enforcement or a federal or state reporting agency. This figure is similar to the results of a survey conducted by the NWC3 in which 12% of households reported victimization to a criminal justice agency (Huff et al., 2010).
In addition to the surveyed frauds, participants were prompted to describe other incidents in their own words if none of the questions reflected their victimization experience. Findings from these open-ended responses were used to revise the survey instrument and develop additional screening questions. The revised consumer financial fraud survey is planned to be included as a module in the National Crime Victimization Survey managed by the Bureau of Justice Statistics. This module will enter the field for six months in 2017 and be administered to nearly 90,000 people age 18 years and older.

Findings from a Pilot Study to Measure Financial Fraud in the United States | 2017 5
BACKGROUND
THE CHALLENGE OF MEASURING FINANCIAL FRAUD
In 2015, the FINRA Foundation published a report on a survey of the emotional costs of financial fraud victimization. The results showed that victims experience significant stress, depression, loss of trust, and self-blame (FINRA Foundation, 2015). These outcomes are similar to what has been reported by victims of physical and sexual assault (Langton & Truman, 2014), yet fraud victimization is largely neglected in the criminology and victimology literature (Deem, 2000). Part of the problem is that fraud is difficult to define. What one person labels as poor customer service, another person might classify as fraud. Second, fraud schemes are constantly evolving, as are the methods of soliciting potential targets and obtaining their money. These issues, coupled with victims’ shame and confusion about what happened, present serious challenges for estimating the 1-year prevalence and cost of financial fraud.
The result is that an array of survey instruments and methodologies have been used to measure prevalence with virtually no standardization in sampling procedures and survey items. As described in our 2013 publication, The Scope of the Problem, key sources of fraud statistics originate from self-report surveys as well as consumer complaint and law enforcement data. Different sampling methods produce widely different estimates on the occurrence of fraud. For example, past-year prevalence findings from random sample surveys range from 4% (AARP, 2003b) to 17% (Huff et al., 2010). These data are hard to compare because surveys sample different age groups and are administered in different years, and survey questions ask about different types of fraud. Standardization is needed to examine how fraud prevalence changes from year to year and which groups are targeted. While survey methods are never entirely free of measurement error, we can achieve more reliable prevalence estimates using a validated instrument and a large, randomly selected sample.
GENESIS OF THE FRAUD STUDY
Beginning in 2011, SCL collaborated with government agencies and researchers seeking to understand fraud and its victims. This multistage endeavor culminated with a conference hosted by the FINRA Foundation and SCL in spring 2014. At The True Impact of Fraud: A Roundtable of Experts2, attendees discussed the limitations of current fraud estimates and advocated that a uniform classification system and survey instrument were needed to track fraud prevalence in the U.S.
As an outgrowth of that conference, a multidisciplinary group of fraud and measurement experts convened at a forum in 2015 to form the Taxonomy of Fraud Working Group,3 funded by the FINRA Foundation. The goal of this meeting was to develop a definition and organizational scheme for fraud that targets individuals. Attendees created an initial draft of a fraud taxonomy that was refined following numerous conference call meetings and a comprehensive review by a larger panel of experts from government, academia, and consumer advocacy groups. The revised fraud taxonomy was further tested for completeness using 300 consumer complaint cases from the FTC’s Consumer Sentinel Network database.
2 Conference proceedings from The True Impact of Fraud are available at http://fraudresearchcenter.org/2014/06/the-true-impact-of-fraud-a-roundtable-of-experts-washington-dc-2014/ 3 Framework for a Taxonomy of Fraud (2015) available at http://fraudresearchcenter.org/2015/07/framework-for-a-taxonomy-of-fraud/

Findings from a Pilot Study to Measure Financial Fraud in the United States | 2017 6
DEVELOPING THE SURVEY INSTRUMENT
DEFINING FINANCIAL FRAUD The ultimate goal of the taxonomy project was to meaningfully categorize the diversity of fraud schemes to inform survey development. An initial step was to provide a definition of financial fraud that could accommodate many different scam types. The definition needed to be broad enough to include fraud cases in which victims are threatened with negative consequences, such as arrest for failing to pay debts they do not actually owe, but also narrow enough to exclude negative consumer experiences that do not constitute fraud, such as overpaying for inferior quality goods. As such, we expanded an early definition by Titus, Heinzelmann, and Boyle (1995) and defined fraud as “Intentionally deceiving the victim by misrepresenting, concealing, or omitting facts about promised goods, services, or other benefits and consequences that are nonexistent, unnecessary, never intended to be provided, or deliberately distorted for the purpose of monetary gain” (Beals, DeLiema, & Deevy, 2015). Based on this definition, financial fraud involves intentional deception whereby perpetrators knowingly convince their targets to engage in transactions that no reasonable person would agree to if they had been told the truth.
The second step in constructing a useful organizational framework was to select a classification structure. The taxonomy was modeled after the international crime classification system proposed by the United Nations4 that incorporates four core principles: exhaustiveness, structure, mutual exclusiveness, and description. The fraud taxonomy is incident-based and organized into five hierarchical levels corresponding to the target of the fraud (i.e., a person or an organization), the expected benefit or outcome promised to the target (an investment, a service, a windfall of money, etc.), and the specific subtype of fraud. Each successive level in the taxonomy represents a finer degree of granularity, such that specific examples of fraud are embedded within broader subtypes, which are in turn embedded within even larger categories of fraud. Since it was published, the taxonomy has been used and expanded by researchers and consumer fraud organizations, including the Better Business Bureau, the Association for Certified Fraud Examiners, and others.5
SURVEY DEVELOPMENT
The Stanford Center on Longevity worked closely with researchers from the FINRA Foundation, the Bureau of Justice Statistics, and Arc Research to transform the taxonomy into a survey instrument. The team agreed on several key design concepts and measurement parameters. The first parameter was that the survey take less than 15 minutes to administer. This meant incorporating screening questions and skip patterns to reduce respondent burden. Second, because we aimed to estimate one-year prevalence rates, participants were told to focus on experiences that happened in the past 12 months.
We also decided to omit the words “fraud,” “scam,” and “victim” in the introduction to the survey and in the survey items. Previous research indicated that semantic context significantly impacts how participants respond to questions (Tourangeau, Rips & Rasinski, 2000). Researchers at SCL found that framing a fraud victimization survey in a criminal context significantly reduces fraud reporting rates, particularly among older participants (age 65+) and women (Beals et al., 2015). Therefore, in the present pilot study, participants read an introductory statement informing them that the purpose of the survey was to collect information on negative financial experiences in which someone convinced them to pay money by misrepresenting, lying about, or hiding information about something they promised they would receive. This survey framing incorporates the definition of fraud while avoiding sensitive words that might negatively impact disclosure among fraud victims.
4 Principles and Framework for an International Classification of Crimes for Statistical Purposes available at https://www.unodc.org/documents/data-and-analysis/statistics/crime/Report_crime_classification_2012.pdf 5 For example, the Taxonomy of Fraud for Microfinance (2015) available at https://fraud-doctor.com/2015/12/10/taxonomy-of-fraud-in-microfinance/

Findings from a Pilot Study to Measure Financial Fraud in the United States | 2017 7
The primary unit of analysis in the survey is the incident of fraud. To identify which fraud types are most common and for which groups, we collected data on each of the seven major categories of fraud targeting individuals. These are depicted in Level 2 of the taxonomy and include:
1) Investment fraud
2) Consumer products and services fraud
3) Employment opportunity fraud
4) Prize and lottery fraud
5) Phantom debt collection fraud
6) Charity fraud
7) Relationship and trust fraud
These seven categories were translated into screening questions for the online survey. Participants who did not experience any of these (non-victims) proceeded directly to the demographic and psychographic questions at the end of the survey. Participants who reported any of these fraud types in the past year (victims) were then asked more specific questions to determine the corresponding subtype of fraud within that particular category. These fraud subtypes correspond to levels 3, 4, and 5 of the taxonomy. For example, if a participant reported phantom debt collection fraud, he or she was subsequently asked what the false debt was for, such as unpaid taxes, medical services, student loans, or something else. The goal of these additional questions was to collect more precise estimates on common fraud schemes that target consumers.
After selecting the specific type of fraud, victims were asked questions about the perpetrator(s), the method of solicitation, the amount of money lost, the transaction setting, the methods used to transfer payment, their reporting decisions, and the emotional and financial impact of the incident. This information corresponds to “attribute tags” in the taxonomy, which are additional descriptive information that can be applied to specific incidents of fraud. Attributes are important for understanding the context of fraud and its jurisdictional and policy relevance (e.g., elder fraud, cyber fraud, mail fraud).
Participants could report more than one type of fraud that occurred during the past year. Experiencing multiple fraud types (polyvictimization) is common because consumers often have their contact information added to “mooch lists” or “sucker lists” that are sold to other fraudsters, thus resulting in more solicitations. To reduce response burden, polyvictims were only asked to provide descriptive (attribute) information about the incident they remembered the most details about.
The survey is intended to capture data on successful or completed fraud in the past year. As such, if a participant reported fraud but experienced no monetary loss or received a full refund, this person was re-categorized as a non-victim. Respondents who reported fraud but then claimed that the incident happened more than one year in the past were also re-categorized as non-victims.
For some fraud and attribute questions, participants could provide open-ended responses. There were no limits placed on the length of these responses. The open-ended responses revealed types of fraud that were missing from the survey, as well as areas where participants were confused about how to classify their experience.
In the following report, we present findings from a pilot test of the survey, administered to 2,000 U.S. adults online. Results are presented in aggregate and classified by the seven major categories of fraud listed above. In addition to reporting the frequency of different fraud types, we present data on the alleged perpetrators, losses, money transfer methods, reporting, and impact of fraud from the victims’ perspective. The report concludes with recommendations on how the survey can be improved and adapted for administration with the National Crime Victimization Survey (NCVS).
Findings from a Pilot Study to Measure Financial Fraud in the United States | 2017 8
METHODS SURVEY DEVELOPMENT AND ADMINISTRATION
Survey development was funded by the FINRA Investor Education Foundation and administered by Arc Research. Prior to administration, Arc Research conducted qualitative telephone interviews with 10 fraud victims and 10 non-victims to test the survey instrument. The purpose of these interviews was to understand how respondents interpreted the questions and how they drew from their personal experiences to answer them. Another goal was to test the logic of the skip patterns and to determine whether known victims answered the questions accurately based on the type of fraud they experienced. AARP Foundation and the National Telemarketing Victim Call Center assisted by helping to recruit participants who were independently verified as victims of fraud. Interview subjects were compensated with a $30 gift card.
The final survey was programmed by Online Survey Solutions using Confirmit. It was administered to a non-probability-based online panel (Survey Sampling International) of 2,000 adults age 18 and older residing in the United States. Participants were recruited based on age, sex, race/ethnicity, and regional quotas so that the sample would demographically represent the U.S. adult population according to the 2014 American Community Survey. Weights were constructed using Random Iterative Method (Rim) weighting methodology and were calculated based on annual household income and education.
The study was reviewed and approved by the Stanford University Institutional Review Board. All participants were presented with an online consent form to read and accept before they could continue to the survey questions. Those who did not consent were discontinued. Participants who started yet did not complete the survey were terminated (approximately 1/3 of total). Demographic information for these terminated cases was not collected. Four participants were dropped from the final analysis sample because they gave nonsensical free-response answers suggesting their data were unreliable.
The survey was administered between April 26, 2016, and May 3, 2016. Fraud rates refer to the weighted frequency of specific types of fraud that occurred within the previous year, so between April 26, 2015, and May 3, 2016. Median survey duration was 8.3 minutes for non-victims and 12.6 minutes for victims.
CHARACTERISTICS OF THE SAMPLE
The sample was 51% female and 49% male. On average, participants were 45 years old and ranged from 18 to 86 years old. Roughly 54% of the participants were married, 30% were single, 11% were separated/divorced, and 5% were widowed. Fifty-nine percent were non-Hispanic White, 20% were Hispanic, 12% were Black, 4% were Asian/Pacific Islander, and 5% reported “Other race/ethnicity.” Just under a quarter of the sample reported an annual household income of less than $25K, 23% reported between $25K and $50K, 18% reported between $50K and $75K, 12% reported between $75K and $100K, and 23% reported an annual household income of $100K or greater; 6% declined to report annual household income. One quarter of the sample had a high school education or less, 30% had some college education, 18% were college graduates, and 11% had a post-graduate degree. Fourteen percent did not graduate high school. Nearly 19% of participants lived in the Northeast, 20% lived in the Midwest, 37% lived in the South, and 23% lived in the West.
Findings from a Pilot Study to Measure Financial Fraud in the United States | 2017 9
FINDINGS The following report provides a summary of key findings, including the weighted one-year frequency of seven types of financial fraud and characteristics of fraud victims and non-victims. Statistics on solicitation and payment methods, financial losses, perpetrator characteristics, and the consequences of fraud victimization are also presented.
OVERALL FREQUENCY OF FRAUD
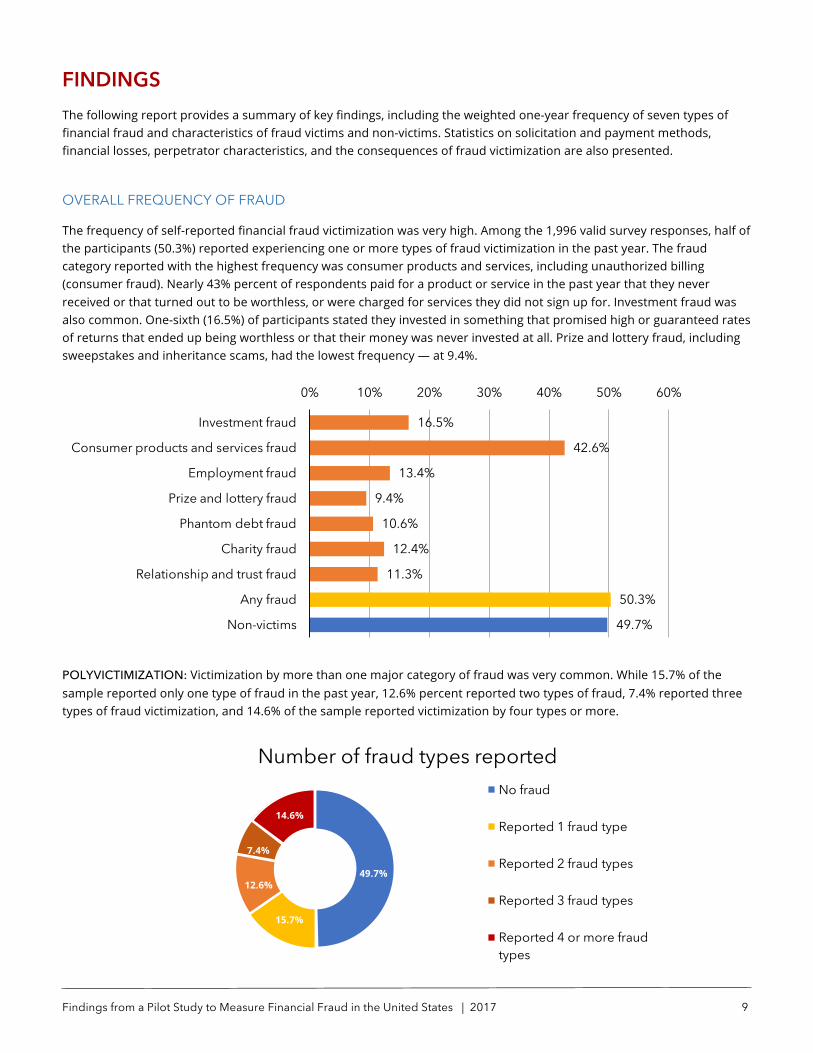
The frequency of self-reported financial fraud victimization was very high. Among the 1,996 valid survey responses, half of the participants (50.3%) reported experiencing one or more types of fraud victimization in the past year. The fraud category reported with the highest frequency was consumer products and services, including unauthorized billing (consumer fraud). Nearly 43% percent of respondents paid for a product or service in the past year that they never received or that turned out to be worthless, or were charged for services they did not sign up for. Investment fraud was also common. One-sixth (16.5%) of participants stated they invested in something that promised high or guaranteed rates of returns that ended up being worthless or that their money was never invested at all. Prize and lottery fraud, including sweepstakes and inheritance scams, had the lowest frequency — at 9.4%.
POLYVICTIMIZATION: Victimization by more than one major category of fraud was very common. While 15.7% of the sample reported only one type of fraud in the past year, 12.6% percent reported two types of fraud, 7.4% reported three types of fraud victimization, and 14.6% of the sample reported victimization by four types or more.
16.5%
42.6%
13.4%
9.4%
10.6%
12.4%
11.3%
50.3%
49.7%
0% 10% 20% 30% 40% 50% 60%
Investment fraud
Consumer products and services fraud
Employment fraud
Prize and lottery fraud
Phantom debt fraud
Charity fraud
Relationship and trust fraud
Any fraud
Non-victims
Number of fraud types reportedNo fraud
Reported 1 fraud type
Reported 2 fraud types
Reported 3 fraud types
Reported 4 or more fraud types
12.6% 49.7%
7.4%
14.6%
15.7%
49.7%

Findings from a Pilot Study to Measure Financial Fraud in the United States | 2017 10
DEMOGRAPHIC CHARACTERISTICS OF VICTIMS AND NON-VICTIMS
AGE: Contrary to popular assumptions and several research studies that seniors are the most common victims of fraud but consistent with findings in previous population surveys (FTC, 2008, 2013; Titus et al., 1995), non-victims were significantly older than victims in this pilot study. Across all fraud types, victims were 41 years old, on average, and non-victims were nearly 50 years old. Those reporting relationship and trust fraud, and prize and lottery fraud, were the youngest victims on average (around 35.4 years old), and consumer fraud victims — the largest fraud category — were the oldest (40.8 years old). These categories are not mutually exclusive, such that demographic characteristics of participants who reported multiple incidents of fraud (polyvictims) are included in each of those subtypes’ estimates.
Prior studies have reported that the average age of fraud victims is older than age 40; however, most of these studies sample from an older population. For example, AARP’s (2003a) telemarking victim study only included adults age 45 and older, and the FINRA Foundation’s (2013) study only recruited participants age 40 and older. Excluding young adults increases the average age of these samples. An alternative explanation for why victims are on average younger than non-victims is that older adults are less likely to acknowledge and report fraud in an online survey compared to younger adults (AARP 2011). Research using a longitudinal sample indicates that declines in cognition are associated with susceptibility to scams (Gamble et al., 2014). We examine the relationship between age and reporting fraud further on in the discussion of the report.
GENDER: Although differences were not statistically significant, over 50% of the fraud victims were male in all categories of fraud while the majority of non-victims were female.
0 10 20 30 40 50 60
Non-victimsInvestment fraud
Consumer products and services fraudEmployment fraud
Prize and lottery fraudPhantom debt collection fraud
Charity fraudRelationship and trust fraud
On average, victims are younger than non-victims
0% 20% 40% 60% 80% 100%
Non-victimsInvestment fraud
Consumer products and services fraudEmployment fraud
Prize and lottery fraudPhantom debt collection fraud
Charity fraudRelationship and trust fraud
Male versus female victims by fraud type
Male Female

Findings from a Pilot Study to Measure Financial Fraud in the United States | 2017 11
RACE & ETHNICITY: We found that victims in the survey were more racially and ethnically diverse than non-victims: Twenty-two percent were Hispanic and 14% were Black compared to 17% of non-victims who were Hispanic and 9% who were Black. Consumer products and services fraud, phantom debt collection fraud, and relationship and trust fraud had the highest proportion of Hispanics — 28% of the victims in each of these three categories. Prize and lottery fraud had the highest proportion of Black victims (23%). Asian respondents and respondents who reported mixed and other race/ethnicity had rates of victimization that were relatively proportional to the size of their race/ethnic group in the overall sample.
MARITAL STATUS: Marital status differed by fraud type. The majority of investment fraud victims were married (58%) compared to relationship and trust fraud where victims were typically single (46%), divorced (7%), separated (4%), or widowed (nearly 2%). The category of relationship and trust fraud includes “sweetheart scams” in which the victim is targeted when seeking a romantic partner. This might explain why many of the victims are single (46%) compared to other major fraud types. A higher proportion of prize and lottery fraud victims were also single (43%) compared to the other fraud types.
N=1980 (16 people did not report marital status)
0% 20% 40% 60% 80% 100%
Non-victims Investment fraud
Consumer products and services fraudEmployment fraud
Prize and lottery fraudPhantom debt collection fraud
Charity fraudRelationship and trust fraud
Race and ethnicity differences by fraud type
White Hispanic Black Asian Other race/ethnicity
0% 20% 40% 60% 80% 100%
Non-victimsInvestment fraud
Consumer products and services fraudEmployment fraud
Prize and lottery fraudPhantom debt collection fraud
Charity fraudRelationship and trust fraud
Marital status differences by fraud type
Married Single Separated Divorced Widowed/widower

Findings from a Pilot Study to Measure Financial Fraud in the United States | 2017 12
EDUCATION: Fraud victims had relatively similar education levels to non-victims overall, although there were differences by fraud type. The most educated group was investment fraud victims — 70% attended some college or were college graduates. On average, the group with the lowest education levels was prize and lottery fraud where only 47% attended or graduated from college.
Note: N=1990 (6 people did not report their education)
INCOME: Similar response patterns were found for annual household income. Sixty-seven percent of investment fraud victims reported annual household incomes over $50,000 per year compared to victims of relationship and trust fraud where only 47% had incomes of $50,000 or more. Prize and lottery fraud, phantom debt collection fraud, and employment opportunity fraud victims also had lower incomes, on average, compared to non-victims and victims of other fraud types.
Note: Percentages are calculated out of n=1876. One hundred and twenty participants (6%) selected “refuse to state” or “don’t know” when reporting annual household income.
0% 20% 40% 60% 80% 100%
Non-victimsInvestment fraud
Consumer products and services fraudEmployment fraud
Prize and lottery fraudPhantom debt collection fraud
Charity fraudRelationship and trust fraud
Educational differences by fraud type
High school or less Some college College +
0% 20% 40% 60% 80% 100%
Non-victimsInvestment fraud
Consumer products and services fraudEmployment fraud
Prize and lottery fraudPhantom debt collection fraud
Charity fraudRelationship and trust fraud
Income differences by fraud type
< $15,000 $15,000 - $25,000 $25,000 - $35,000 $35,000 - $50,000
$50,000 - $75,000 $75,000 - $100,000 $100,000 - $150,000 $150,000 +

Findings from a Pilot Study to Measure Financial Fraud in the United States | 2017 13
FRAUD TYPE 1: INVESTMENT FRAUD
Investment fraud occurs when a perpetrator knowingly misleads a person to invest in securities, commodities, real estate, or some other investment vehicle where the earnings are grossly misrepresented or the money is never invested at all. Sixteen and one half percent of the sample (95% confidence interval = 14.6% to 18.5%) reported investment fraud victimization in the past year, higher than the FINRA Foundation’s (2013) finding that 11% of people over age 40 were victims of investment fraud. The most frequent type of investment fraud reported was penny stocks (3.3%), followed by something that guaranteed a daily rate of return (2.8%). Forty-two percent of victims believed their investment was part of a Ponzi scheme where the only way they made money was from the funds of other investors. Another 21% were unsure. Eighty-six percent stated that they invested one time only, and 14% reported investing money two or more times.
FRAUD TYPE 2: CONSUMER PRODUCTS AND SERVICES FRAUD
Three separate screening questions inquired about the major subtypes of consumer products and services fraud, including (1) paying for nonexistent or worthless products, (2) paying for nonexistent or worthless services, and (3) unauthorized billing. The most frequently reported fraud type was nonexistent or worthless services with 25.9% of the sample reporting this type of fraud (95% Confidence Interval = 22.6% to 27.7%), followed by unauthorized billing (22.9% of the sample; 95% Confidence Interval = 20.5% to 25.5%) and nonexistent or worthless products (20.6%; 95% Confidence Interval = 18.2% to 23.0%). Just over 7% of all participants paid for a product or products they never received in the past year, and 13.4% paid for items that were worthless. Ten percent of the sample purchased a bogus weight-loss product that didn’t offer the results that were promised.
0.0% 0.5% 1.0% 1.5% 2.0% 2.5% 3.0% 3.5%
Penny stock
Real Estate Investment Trust (REIT)
Alternative energy company
Pre-IPO stock
Commodities
Investment that guaranteed a daily rate of return
Oil or gas exploration
Government or company bonds
Other type of investment
Types of investment fraud reported

Findings from a Pilot Study to Measure Financial Fraud in the United States | 2017 14
The most common types of bogus services were useless computer virus protection software or a software upgrade (9.3%) and unnecessary home or automobile repair (8.1%). Debt reduction, in which the perpetrator promised to help manage or pay off the respondent’s debt, had a frequency of 2.6%. Among these debt reduction service victims, the four most common types of debt were credit card debt (32.2%), personal loan debt (25.4%), student loan debt (23.7%), and medical debt (25.4%).
Unauthorized billing was a very common type of fraud reported in the survey; 11.6% of all participants stated that they were billed or charged for something they had previously agreed to pay for but then tried to cancel. Another 9.4% of respondents received bills or charges for things they had never ordered, never signed up to receive, or never agreed to pay for. Nearly 5% of participants reported unauthorized billing scams related to Internet access, website design, website hosting, or online advertising services, and 3.7% reported scams related to telephone, text, or mobile data services. Other participants reported bogus magazine subscription services (4.8%), “buyer’s club” memberships where the consumer was still charged after cancelling a service, typically following the end of a free trial period (5.9%), and credit monitoring services (1.7%).
0.0% 2.0% 4.0% 6.0% 8.0% 10.0% 12.0% 14.0% 16.0%
Immigration services
Advance-fee loan or credit
Credit repair
Debt reduction
Product paid for but never revieved
Home or vehicle repair
Computer virus protection software
Weightloss product
Worthless product
Other service
Types of consumer products and services fraud reported
0.0% 1.0% 2.0% 3.0% 4.0% 5.0% 6.0% 7.0%
Credit monitoring services
Other unauthorized charges
Telephone, text, or data services
Magazine subscriptions
Internet access/web design/web hosting/online advertising
Membership in a buyer's club
Types of unauthorized billing fraud reported

Findings from a Pilot Study to Measure Financial Fraud in the United States | 2017 15
FRAUD TYPE 3: EMPLOYMENT OPPORTUNITY FRAUD
Thirteen and one half percent of participants reported victimization by job or business opportunity fraud in the past year (95% Confidence Interval = 11.5% to 15.3%), where the expected benefit was employment or training/coaching to make their business more profitable. Perpetrators make money by convincing targets to pay deposits before they can get the job or require them to pay for the training materials or courses. The work opportunities generally require few skills or qualifications, and are advertised as being far more profitable than they actually are, assuming they even exist. In the present study, the frequency of work from home scams was 4.4%. Multilevel marketing scams, also called “pyramid schemes”, where the only way that the participant can make money is by recruiting other people to sell the product, was reported by 3.1% of the sample, and 2.4% reported scams involving paying someone to help launch a new career or grow their business online. Less frequent types of job scams were home assembly, nanny scams, and mystery shopping scams.
FRAUD TYPE 3: PRIZE AND LOTTERY FRAUD
Nine and one half percent of participants reported that they had been victimized by prize and lottery fraud in the past year (95% Confidence Interval = 7.6% to 11.2%). In these scams, victims are led to believe they won a sweepstakes, lottery, prize or grant, but before they can receive the winnings they must pay money to cover fictitious fees or taxes. Bogus sweepstakes were the most common scam reported (5.2%), followed by foreign lottery scams (1.8%), unclaimed inheritance scams (1.4%), helping a stranger get money out of a foreign country (0.8%), and other prizes (0.3%).
0.0% 1.0% 2.0% 3.0% 4.0% 5.0%
Working from home
Multilevel marketing
Payment for help launching a career online
Payment for training that was supposed to result in a guaranteed job
Other type of job
Types of business opportunity fraud reported
0.0% 1.0% 2.0% 3.0% 4.0% 5.0% 6.0%
Bogus sweepstakes
Foreign lottery
Unclaimed inheritance
Helping a stranger get money out of a foreign country
Other type of false monetary windfall
Most prize and lottery fraud victims were defrauded in a sweepstakes scam.

Findings from a Pilot Study to Measure Financial Fraud in the United States | 2017 16
FRAUD TYPE 4: PHANTOM DEBT COLLECTION FRAUD
The frequency of phantom debt collection fraud, in which a fictitious lender threatens the victim by telling him he must pay money to cover a debt he does not owe, was 10.6% (95% Confidence Interval = 8.8% to 12.3%). Perpetrators execute these schemes by impersonating prominent lending institutions, law firms, or government agencies, such as the IRS. Victims who reported phantom debt collection fraud were asked about the type of debt they were told they owed, which included a personal loan (2.2%), credit card debt (2.1%), medical debt (1.9%), student loan debt (1.2%), unpaid taxes (1.1%), mortgage debt (0.9%), and other (0.9%). More than 12% of these victims paid money more than one time in the past year to settle a debt they did not actually owe.
FRAUD TYPE 5: CHARITY FRAUD
Twelve and one half percent of respondents reported that they had donated money to a bogus charity or charitable cause in the past year (95% Confidence Interval = 10.5% to 14.3%). This includes donations solicited by mail, in person, and on crowdfunding websites. Fourteen percent of these victims donated more than one time during the previous year to a bogus charity.
FRAUD TYPE 6: RELATIONSHIP AND TRUST FRAUD
Slightly more than 11% of respondents reported victimization by relationship and trust fraud in that past year (95% Confidence Interval = 9.5% to 13.2%), and 17% of these individuals stated that they had been victims two or more times. In these scams, the perpetrator deceives the victim by pretending to be a relative, friend, or romantic interest, and then exploits the victim’s trust for financial gain. In sweetheart scams, perpetrators meet potential victims face-to-face or online. Over the course of weeks or several months, the perpetrator tricks the victim into believing they have a true romantic connection. Eventually the perpetrator asks the victim for money to help cover fabricated expenses such as medical treatments, personal debts, or traveling to meet the victim in person. Nearly 6% of respondents reported that they paid money to someone who pretended to be interested in them romantically. Another type of relationship and trust scam is when someone pretends to be the target’s friend or family member who is in need of financial help. In actuality, this person is an imposter who is trying to convince the target to send money. A current example is the “grandparent scam,” where the perpetrator claims to be a relative imprisoned in a foreign country who desperately needs funds to cover legal fees or bribes in order to be released. Five and one half percent of survey respondents reported losing money in this and similar imposter scams in the past year.
0.0% 0.5% 1.0% 1.5% 2.0% 2.5%
Mortgage debt
Unpaid taxes
Student loan debt
Health care or medical care debt
Credit card debt
A personal loan
Other type of phantom debt
Types of phantom debt victims were falsely told they owed.

Findings from a Pilot Study to Measure Financial Fraud in the United States | 2017 17
Victims of multiple frauds (polyvictims) were asked to select the incident they remembered the most detail about and then answered questions about how much they paid, how they were solicited, and who the perpetrator was. Victims of only one fraud type were only asked to report details about that particular incident. Polyvictims disproportionately selected consumer products and services fraud as the incident they remembered the most about (66%); subsequently, the majority of financial loss and perpetrator data is related to this fraud type. Individuals who reported not paying any money, or who subsequently were refunded the full amount, were not included in the following analyses.
LOSSES
Five hundred and eighty-seven victims reported a dollar value for how much money they ultimately paid. Among these individuals, average losses across all fraud types were $1,173 per victim, yet the median (the middle value) was only $99 per victim. Average losses are substantially higher than median losses because of several outliers in the sample. One victim paid $236,300 in an investment scheme, and several others reported paying between $30,000 and $45,000. Nearly half of all victims (45.7%) paid less than $100. Just over 30% paid between $100 and $499, 20.8% paid $500 or more, and 3.4% couldn’t remember how much they had paid or selected not to disclose that information.6
Eighty-two percent of victims paid money one time to the perpetrator, but 12.2% paid twice and 5.7% paid three times or more. Nearly forty-three percent of victims reported that they attempted to get their money back.
There were differences in the amounts paid based on fraud type. On average, investment fraud victims lost the most money. While 16.5% of individuals experienced investment fraud in the past year, only 23.9% of them selected this type of fraud as the incident they remember the most detail about. Those 83 people reported median losses of $300 with a range of $20 to $236,300. Twenty-four percent lost less than $100, another 24.0% lost between $100 and $499, 19.0% lost between $500 and $999, and 31.3% lost $1,000 or more. Forty-six and one half percent attempted to get their money back.
6 Victims were asked if they had ever received anything in return for the money they initially paid and, if so, to estimate the value of these products or services. Just over a quarter of victims got something in return or were provided a full or partial reimbursement from the person or company that accepted their initial payment. For the analysis, this value was subtracted from the total payment amount to determine how much each victim ultimately lost. If the result of this subtraction was equal to zero dollars, the participant was re-categorized as a non-victim for that particular fraud category because there were no financial losses in the end.
45.7%
30.1%
7.8%
10.0% 0.9%
1.4% 0.6% 0.1% 2.2%
1.2% Three quarters of victims lost less than $500
Between $1 and $99Between $100 and $499Between $500 to $999Between $1,000 to $4,999Between $5,000 to $9,999Between $10,000 to $49,999Between $50,000 to $99,999$100,000 or moreI can't remember how muchPrefer not to say

Findings from a Pilot Study to Measure Financial Fraud in the United States | 2017 18
In contrast, charity fraud victims paid the least amount of money on average. Out of the 12.4% of participants reporting charity fraud, only 17.4% of victims (45 people) selected it as the incident they remembered the most about. They reported median losses of $50, with a range of $2 to $45,000. The majority of these victims reported losses between $1 and $99 (63.0%), and 23.9% lost between $100 and $499. More than 21% of these victims donated money more than one time, and only 22.7% tried to get their donation back.
Of the more than 400 consumer products and services fraud victims who remembered the most details about this incident, 331 provided a dollar loss amount. After subtracting the value of anything they may have received in return from the seller or service provider, the median loss amount was $85, with a range of $1 to $30,000. Forty-one percent lost less than $99, and 33.4% lost between $100 and $499. Nearly 24% reported losses that exceeded $499.
The median loss for employment opportunity fraud (N=40) was $50 with a range of $1 to $2,375. Losses were largely less than $99 (30.9%), but 46.9% of victims lost between $100 and $499. More than a quarter of them were given a fake check as a form of payment for the “job”.
0%
10%
20%
30%
40%
50%
60%
70%
80%
90%
100%
Investment fraud
Products and services fraud
Employment fraud
Prize and lottery fraud
Phantom debt collection
fraud
Charity fraud Relationship and trust fraud
Financial losses by fraud type
$1 - $99 $100 - $499 $500 - $999$1,000 - $4,999 $5,000 - $9,999 $10,000 - $49,999$50,000 - $99,999 $100,000 + I can't remember how muchPrefer not to say

Findings from a Pilot Study to Measure Financial Fraud in the United States | 2017 19
FRAUD SOLICITATION AND PAYMENT METHODS
Victims were asked to report how they first learned about the product, service, investment, charity, or other fraudulent offer or promise. Similar to what has been discovered in other fraud studies (FTC, 2013), the Internet (30.0%) was the most common method of solicitation. Other popular methods of solicitation were face-to-face (18.9%), email (14.5%), mail (13.2%), and telephone (12.7%).
Although consumer product and services fraud victims, employment opportunity victims, and charity fraud victims were mainly solicited via the Internet (not including email), 40.0%of all prize and lottery fraud victims were solicited by someone over the phone, and 31.0% received a solicitation in the mail. Twenty-seven percent of phantom debt fraud victims were contacted by the person who took their money over the phone, and 27.0% received information in the mail.
Note: Victims could select more than one type of solicitation method.
The most common method of payment across all fraud types was credit cards (32.2%), followed by cash (23.8%), debit/ATM cards (23.2%), and personal check (10.0%). The one exception was relationship and trust fraud where the majority of victims paid in cash (70%). Less common forms of payment for fraud were mobile apps like Venmo, Square, PayPal, and Google Wallet (8.6%), prepaid cards (3.5%), money orders (3.2%), wiring funds (3.0%), and Bitcoin (1.1%).
0.0% 5.0% 10.0% 15.0% 20.0% 25.0% 30.0% 35.0%
Internet
In-person solicitation
Telephone
Text message
TV/radio advertisement
Sales presentation/seminar
Other solicitation
The Internet was the most common solicitation method

Findings from a Pilot Study to Measure Financial Fraud in the United States | 2017 20
Note: Survey respondents could choose more than one type of payment method.
The survey asked specifically about payment methods for unauthorized billing fraud, which is included within the category of consumer products and services fraud in this report. Specifically, unauthorized billing includes paying for bogus magazine subscriptions, Internet services, website hosting, buyer’s clubs and other unnecessary services that were never provided. Among the 457 survey participants who lost money in this type of fraud, most were charged on their credit card bill (54.2%).
Note: Percentages are calculated based on the number of respondents who reported unauthorized billing fraud (n=457).
0.0% 10.0% 20.0% 30.0% 40.0% 50.0% 60.0%
Credit card bill
Received bill in the mail
Cellular phone bill
Received bill via email
PayPal or other online account
Cable TV/Internet bill
Landline phone bill
Other
Most of unauthorized billing scams were charged to credit cards

Findings from a Pilot Study to Measure Financial Fraud in the United States | 2017 21
The survey asked respondents about the setting in which they paid money to the perpetrator(s). Nearly half reported that they had paid online, 23.6% paid the perpetrator directly, 11.7% provided payment information over the phone, 11.3% sent payments by mail, 10.4% paid in a store, and 3.6% reported that they paid in a different setting.
Paying online was most common in consumer products and services fraud (59.5%), and least common for relationship and trust fraud (18.0%). Relationship and trust fraud victims mainly paid the perpetrator directly (69.5%). Fifty-three percent of prize and lottery fraud victims sent their payment in the mail.
Note: Excludes victims who answered payment questions about unauthorized billing fraud.
PERPETRATORS
More than 57% of fraud victims had contact with the person who took their money, either over the phone, in person, or via email. Twelve and one half percent reported that the person, people, or organization that took their money claimed to be a government official or government agency representative of some kind. The highest proportion was in the instances of phantom debt collection fraud, where 35.9% of victims reported that the person who took their money claimed to be a government official or agency representative. Forty-seven percent of all fraud victims stated the perpetrator was male, and 19.3% stated that the perpetrator was female. One-third of the victims did not know the perpetrator’s gender or stated that it was not applicable (i.e., perpetrator was a company or charity rather than an individual).
Eighteen percent of all victims reported that they personally knew the perpetrator. Eleven percent of consumer products and services fraud victims personally knew the perpetrator compared to 64.2% of relationship and trust fraud victims and 28.8% of investment fraud victims. Only 6.4% of all victims stated the perpetrator was someone they knew through a religious, community, professional, or social organization, 3.4% said the perpetrator was a current or former spouse, 4.5% said it was a current or former romantic partner, 4.1% stated it was a relative, and 2.4% stated the perpetrator was a care provider.
0.0% 10.0% 20.0% 30.0% 40.0% 50.0% 60.0%
Online
Direct to person
Telephone
In store
Other payment setting
Most victims paid the perpetrator(s) online

Findings from a Pilot Study to Measure Financial Fraud in the United States | 2017 22
REPORTING
Data was collected on the proportion of fraud victims who reported the incident to authorities. Specifically, we aimed to calculate rates of reporting relative to rates of victimization. We also collected data on which organizations received these complaints and how satisfied victims were with their response. Only 60.7% of all victims told someone about the incident. They mostly told friends, family, and/or others in their community (52.5%). Fifteen percent of victims told their bank or credit card company, 6.3% reported the incident to law enforcement, and 9.0% reported it to a consumer protection agency or consumer organization. Another 3.8% complained directly to the person or organization that defrauded them or they wrote a negative review about that company online.
Note: Percentages were calculated based on the total number of fraud victims who reported they experienced a financial loss.
The overall rate of reporting to authorities (local law enforcement and/or consumer complaint agencies) was 14%. Sixty-five percent of the people who reported were male. There was a significantly positive correlation between reporting to a consumer protection agency and the amount of money that was lost (r=0.08 p=0.024). The agencies that received the most reports were the Better Business Bureau (5.3% of victims), State Attorney General Offices (2.9%), and the Consumer Financial Protection Bureau (2.2%).
Note: Percentages were calculated based on the total number of fraud victims who reported they experienced a financial loss.
0.0% 10.0% 20.0% 30.0% 40.0% 50.0% 60.0%
Other
Reported to law enforcement
Reported to consumer protection agency
Told bank/credit card company
Told family/friends/others in community
Most victims told friends and family about the incident but never reported to a complaint agency or law enforcement
0.0% 1.0% 2.0% 3.0% 4.0% 5.0% 6.0%
Better Business BureauState Attorney General's Office
Consumer Financial Protection BureauInternet Crime Complaint Center
Federal Trade CommissionUS Postal Inspection Service
Securities and Exchange CommissionFederal Bureau of Investigation
Financial Industry Regulatory Industry
The Better Business Bureau was the most popular organization to which victims reported fraud

Findings from a Pilot Study to Measure Financial Fraud in the United States | 2017 23
More than 300 victims (39.3%) decided not to tell anyone about the incident. The most commonly reported reasons were feeling that it would not do any good (32.6%), they hadn’t lost much money (30.8%), they felt embarrassed (22.1%), they felt that reporting was too inconvenient (16.6%), and they took care of it themselves (16.0%). Some victims did not know who to report the incident to (7.3%), and others didn’t want to bother the police (8.4%).
Note: Statistics were calculated with victims who did not tell anyone about the incident (n=304). They could select more than one reason for not telling anyone.
Approximately half of all victims (51.0%) stated that they felt the incident had been resolved. Among these respondents, 16.9% said it took one day or less to resolve, 22.9% said that it took longer than a day but less than a week, 19.1% stated that it took between seven and 30 days, and 16.7% stated it took between one and three months. Another 17.8% stated that it took longer than three months to resolve. Four hours was the median amount of time that victims spent working to resolve the incident.
0% 5% 10% 15% 20% 25% 30% 35%
Person responsible was a friend/relative
Didn't know how to contact an authority
Didn't find out until it was too late
Didn't know who to contact
Didn't want to bother the police
Didn't know I could report it
Couldn't provide much information
Took care of it myself
Too inconvenient
Embarrassed
Didn't lose much money
Didn't think it would do any good
Reasons why victims did not report fraud

Findings from a Pilot Study to Measure Financial Fraud in the United States | 2017 24
Note: Percentages were calculated based on total fraud victims who felt the incident had been resolved (n=390).
EMOTIONAL COSTS AND FINANCIAL CONSEQUENCES
We asked victims about the emotional and financial impact that the incident had on their lives. Fifty-two percent of all victims believed they were intentionally deceived or defrauded, but another quarter of them were not sure. Thirteen percent reported that as a direct result of the incident, they had difficulty meeting their monthly expenses or paying their bills.
0% 5% 10% 15% 20% 25%
Don't know/Don't remember
One year or more
Six months to less than one year
Three months to less than six months
One month to less than three months
At least a week, but less than one month (7-30 days)
More than a day, but less than a week (25 hours-6 days)
One day or less (1-24 hours)
Most incidents took less than a month to resolve

Findings from a Pilot Study to Measure Financial Fraud in the United States | 2017 25
Victims were asked to indicate whether they experienced any negative emotions or psychological problems for a month or more as a result of the incident. The most common feeling was anger (74.6%), followed by feeling like they couldn’t trust people (62.0%), feeling violated (57.1%), stressed (56.3%) and embarrassed (50.0%). In the free response field, multiple victims reported feeling “stupid,” “foolish,” “frustrated,” “used,” “cheated,” lied to,” “annoyed,” “mad,” “betrayed,” “confused,” “physically ill,” and even “suicidal.”
Note: Victims could select more than one emotional/physiological response to fraud.
More than half of the fraud victims (51.9%) stated that the incident was moderately or severely distressing. Eleven percent sought professional or medical help as a result of the incident, such as visiting a doctor or nurse (4.6%), seeking counseling/therapy (4.6%), and taking medication (3.5%).
0.0% 10.0% 20.0% 30.0% 40.0% 50.0% 60.0% 70.0% 80.0%
Difficulty sleeping
Unsafe
Sad/depressed
Worried/anxious
Vulnerable
Embarrassed
Stressed
Violated
Can't trust people
Angry
Feelings expressed by victims as a result of the fraud.
9.9%
38.3% 34.8%
17.1%
Greater than half of victims felt the incident was moderately or severely distressing.
Not at all distressingMildly distressingModerately distressingSeverely distressing

Findings from a Pilot Study to Measure Financial Fraud in the United States | 2017 26
SURVEY DESIGN CHALLENGES AND RECOMMENDATIONS CHALLENGES
Victimization rates in the online pilot test of the fraud prevalence survey were much higher than estimates reported in prior studies (e.g., FINRA, 2013; FTC, 2008, 2013; Huff et al., 2010; Titus et al., 1995), albeit these surveys used different sampling and administration methods. Our measurement approach was to use multiple close-ended questions describing specific types of fraud. Other studies that have used a single self-report item to determine overall fraud prevalence have produced smaller estimates (e.g., Holtfreter et al., 2006; Lichtenberg et al., 2016). Our method of assessment is meant to improve identification of victimization by cueing recall of specific incidents that may have occurred in the past year (Deevy & Beals, 2013).
One explanation for the higher victimization rates in this report is that the survey instrument has poor specificity. It captured true incidents of fraud victimization as well as bad customer service experiences and dissatisfaction with inferior quality products and services. We specifically designed the screening questions to not contain the words “scam,” “fraud,” or “victim” because in past research, framing the survey in a criminal justice context reduced disclosure by both women and adults age 65 and over (Beals et al., 2015). Rather, the stated purpose of the survey was to collect information about negative financial experiences in which someone convinced the participant to pay money by misrepresenting, lying about, or hiding information about something they promised he or she would receive. Thus, participants may have interpreted this to include situations in which they felt tricked into paying for something that was deceptively advertised, or where the quality was worse than they were led to believe. In many cases, we used participants’ open-ended descriptions of their experiences to recode whether they were victims or non-victims of a particular category of fraud; however, most respondents did not provide enough detailed information, in which case they were classified based on their original response to the survey item.
Poor specificity was particularly a problem in the consumer products and services fraud category. There was a high number of false positive responses to these items, whereby participants who were not fraud victims, based on their open-ended description of the incident, reported that they were. This suggests that respondents interpreted the initial screening questions very broadly, and may have endorsed these questions thinking they referred to poor customer service experiences, shipping/billing errors, and paying for products that were misleadingly advertised. These experiences are indeed frustrating and may result in financial loss but are not necessarily fraud. The screening questions in the NCVS module were therefore revised to minimize false positives and reduce over-reporting of fraud.
In the NCVS module, additional screening questions will be included that first ask participants about negative consumer experiences that may have led to financial loss but were not fraud. Immediately following these items will be questions that describe similar situations that are fraud. For example, to more accurately measure the prevalence of investment fraud, an initial screening question could ask, “In the past year, have you invested in anything that caused you to lose money or where the returns were less than you expected?” The question immediately following would explicitly ask about investment fraud victimization: “Has anyone convinced you to invest your money in something by promising high or guaranteed rates of returns, but the investment was worthless or you suspect your money was never invested at all?” As this example demonstrates, by first presenting a general question about recent losses in the stock market, participants can better differentiate unfortunate investment decisions where they had low or no returns from actual investment fraud where they were tricked into paying money that was never invested at all.
An inherent limitation of this survey, as with other surveys that estimate rates of victimization, is that it does not measure the intent of the perpetrator. Intent to deceive is important to the definition of fraud but it is not possible to determine whether the perpetrators deliberately deceived respondents and intended to give them nothing of value in return for money. We did find that 19.8% of the sample, more than half of the victims, believed they had been intentionally defrauded by the person, charity, or company that took their money. Although not all of these self-reported incidents met

Findings from a Pilot Study to Measure Financial Fraud in the United States | 2017 27
our specific definition of fraud, this is an important finding that indicates that many consumers feel cheated in the marketplace.
Another insight from this pilot study was that some participants reported one incident of fraud in multiple categories, suggesting that they had difficulty categorizing their experience. An example is the purchase of bogus insurance. This was sometimes reported as a worthless or unnecessary product, other times as an unnecessary service, and other times as unauthorized billing. Some participants reported it in all three categories. We were able to correct duplicate reporting errors by recoding the data using the participants’ open-ended descriptions of the incident; however, the high frequency of these errors suggests that more specific language or examples are needed to help victims label and classify their experience.
A final challenge in measuring fraud was minimizing reports by those who had been targeted by scams but did not actually lose money. Some participants reported paying money for a product, service, investment, or job when answering the initial screening questions (which categorized them as victims) but then received a full refund or something equal in value to what they initially paid. Because scam artists rarely provide refunds or give their targets what they promised, it’s very unlikely that these participants were actually fraud victims. Therefore, we suggest revising the fraud screening questions to ask respondents if they ultimately lost money in the incident, rather than asking them if they paid money.
COMPARISON TO PREVIOUS FRAUD SURVEYS
Although older adults are assumed to be more vulnerable to financial fraud than other age groups (Ross et al., 2014), we replicated previous findings from national fraud surveys and found that as age increases, self-reported fraud victimization decreases. According to the FTC’s prevalence surveys, self-reported rates of victimization are actually highest among middle-aged adults between ages 45 and 54 (Anderson, 2013). In the present study, the average age of fraud victims was 41 years old.
One explanation for why prevalence study findings do not align with experimental data on the vulnerability of older adults is that seniors may be less likely to report fraud compared to young and middle-aged adults in survey research, despite being victimized at higher rates. There are a number of reasons they may underreport victimization. First, reporting relies on subjective memory of past events, and aging is associated with declines in episodic memory (Craik, 1986). The most vulnerable elders with cognitive impairment were not recruited to participate in this and other surveys administered online and over the phone. Second, older adults have a tendency to minimize emotionally negative experiences (Charles & Carstensen, 2008). They may also choose to hide victimization because of shame, embarrassment, or a belief that they are partially to blame for being duped (Ganzini, McFarland, & Bloom, 1990). They also risk losing their financial independence to concerned friends and family members who might take over financial decision-making responsibilities to protect them from future exploitation.
To estimate the true prevalence of fraud, future research studies should consolidate data from multiple sources, such as general population surveys like the National Crime Victimization Survey (NCVS); consumer complaint data from the Better Business Bureau, Federal Trade Commission, State Attorneys General, and Internet Crime Complaint Center; and lists seized by law enforcement agencies that contain victims’ and targets’ contact information. Triangulating these diverse sources will overcome many of the limitations of phone and Internet surveys, potentially helping to resolve the debate about which age group is victimized at the highest rate.

Findings from a Pilot Study to Measure Financial Fraud in the United States | 2017 28
NEXT STEPS The Stanford Center on Longevity and the FINRA Foundation worked closely with the Bureau of Justice Statistics to develop this survey. Findings from the pilot study are being used to create a short fraud supplement that will be administered by phone and in person to households participating in the core NCVS, the principal source of crime statistics in the United States. The NCVS is administered by the U.S. Census Bureau and collects information from a randomly selected sample of 130,000 households each year. Questions focus on the frequency, characteristics, and consequences of criminal victimization. The survey informs policymakers and law enforcement about the prevalence and impact of different types of crime, as well as identifies which groups in the population are most at risk. The fraud module is scheduled to be in the field for six months starting in July 2017 and will be administered to nearly 90,000 NCVS participants ages 18 and older.
As illustrated by the fraud taxonomy, financial fraud encompasses a wide variety of scams that are tailored to target specific sociodemographic groups. Large-scale studies are needed to accurately estimate the likelihood of victimization by each of these unique fraud subtypes. Launching this survey with the NCVS will mark the first time that fraud will be measured with a sample size large enough to produce reliable estimates about the number of Americans affected by specific fraud types. Valid data of this kind will demonstrate to consumers, policymakers, and the private sector the cost and impact of financial fraud in the United States and point to where resources are needed to safeguard consumers.

Findings from a Pilot Study to Measure Financial Fraud in the United States | 2017 29
REFERENCES AARP (2003a). Off the hook: Reducing participation in telemarketing fraud. Conducted for the U.S. Department of Justice, Office of Justice Programs. Washington, DC.
AARP (2003b). 2003 consumer experience survey: Insights on consumer credit behavior, fraud and financial planning. Washington, DC.
AARP (2011). AARP Foundation National Fraud Victim Survey, Washington, DC: AARP. Anderson, K. B. (2004). Consumer fraud in the United States: An FTC survey. The Federal Trade Commission. Washington, DC.
Anderson, K. B. (2008). Consumer fraud in the United States, 2007: The second FTC survey. The Federal Trade Commission. Washington, DC.
Anderson, K. B. (2013). Consumer fraud in the United States, 2011: The third FTC survey. The Federal Trade Commission. Washington, DC.
Beals, M. E., Carr, D. C., Mottola, G. R., Deevy, M. J., & Carstensen, L. L. (2015). How Does Survey Context Impact Self-reported Fraud Victimization? The Gerontologist, gnv082.
Beals, M. E., DeLiema, M., & Deevy, M. J. (2015). Framework for a taxonomy of fraud. Stanford Center on Longevity. Stanford, CA.
Charles, S. T., & Carstensen, L. L. (2008). Unpleasant situations elicit different emotional responses in younger and older adults. Psychology and Aging, 23(3), 495-504.
Craik, F. I. M. (1986). A functional account of age differences in memory. In F. Klix & H. Hangendorf (Eds.), Human memory and cognitive capabilities: Mechanisms and performances (pp. 409-422). Amsterdam: Elsevier-North-Holland.
Deem, D. (2000). Notes from the field: Observations in working with the forgotten victims of personal financial crimes. Journal of Elder Abuse and Neglect, 12(2), 33-48.
Deevy, M. & Beals, M. (2013). The scope of the problem: An overview of fraud prevalence measurement. Stanford Center on Longevity. Stanford, CA.
Federal Trade Commission (2016). Consumer Sentinel Network Data Book, January – December 2015. Washington, DC.
FINRA Investor Education Foundation (2013). Financial fraud and fraud susceptibility in the United States. Research report from a 2012 survey. Washington, DC.
FINRA Investor Education Foundation (2015). The non-traditional costs of financial fraud: Report of survey findings. Washington, DC.
Gamble, K. J., Boyle, P., Yu, L., & Bennett, D. (2014). The causes and consequences of financial fraud among older Americans. Boston College Center for Retirement Research WP, 2014-13. Available at SSRN: https://ssrn.com/abstract=2523428.
Ganzini, L., McFarland, B., & Bloom, J. (1990). Victims of fraud: Comparing victims of white collar and violent crime. Bulletin of the American Academy of Psychiatric Law, 18(1), 55-63.
Holfreter, K., Reisig, M. D., & Blomberg, T. G. (2006). Consumer fraud victimization in Florida: An empirical study. St. Thomas Law Review, 18(3), 761-789.
Huff, R., Desilets, C., & Kane, J. (2010). The 2010 national public survey on white collar crime. National White Collar Crime Center.
Langton, L. & Truman, J. (2014). Socio-emotional impact of violent crime. U.S. Department of Justice. Office of Justice Programs, Bureau of Justice Statistics. Washington, DC.
Lichtenberg, P. A, Sugarman, M. A., Paulson, D., Ficker, L. J., & Rahman-Filipiak, A. (2016). Psychological and functional vulnerability predicts fraud cases in older adults: Results of a longitudinal study. Clinical Gerontologist, 39(1), 48-63.
Ross, M., Grossmann, I., & Schryer, E. (2014). Contrary to psychological and popular opinion, there is no compelling evidence that older adults are disproportionately victimized by consumer fraud. Perspectives on Psychological Science, 9(4), 427-442.
Stanford Center on Longevity (2013). The true impact of fraud: A roundtable of experts. Washington, DC.
Titus, R. M., Heinzelmann, F., & Boyle, J. M. (1995). Victimization of persons by fraud. Crime & Delinquency, 41(1), 54-72.
Tourangeau, R., Rips, L. J., & Rasinski, K. A. (2000). The psychology of survey response. Cambridge University Press. Cambridge, UK.
United Nations Office on Drugs and Crime (UNODC)/United Nations Economic Commission Europe (UNECE) (2012) Principles and framework for an international classification of crimes for statistical purpose. Report of the UNODC/UNECE Task Force on Crime Classification to the Conference of European Statisticians.

Findings from a Pilot Study to M
easure Financial Fraud in the United States | 2017
30
APPENDIX A. DATA TABLES
MeanAge(std.dev)
50.6(16.7)41.6(15.7)
39.0(13.9)41.7(15.5)
36.9(13.4)35.8(13.4)
37.1(13.6)37.4(13.9)
36.4(13.0)n
%n
%n
%n
%n
%n
%n
%n
%n
%Sex(M
ale)451
45.1%516
51.8%207
57.3%441
52.4%145
52.2%102
56.0%127
57.5%152
59.6%120
53.3%Race/EthnicityNon-H
ispanicWhite
65965.9%
54554.7%
18551.2%
46254.9%
14752.9%
8345.6%
10848.9%
13151.4%
10647.1%
Hispanic
13813.8%
20320.4%
9626.6%
17721.0%
6021.6%
4323.6%
6027.1%
6123.9%
6026.7%
Black112
11.2%138
13.9%42
11.6%112
13.3%39
14.0%38
20.9%34
15.4%37
14.5%34
15.1%Asian/PacificIslander
515.1%
494.9%
236.4%
425.0%
155.4%
105.5%
83.6%
145.5%
104.4%
Other
404.0%
616.1%
154.2%
485.7%
176.1%
84.4%
115.0%
124.7%
156.7%
MaritalStatusMarried
50650.6%
50650.8%
20456.5%
43752.0%
13448.2%
8747.8%
11552.0%
13753.7%
9944.0%
Single279
27.9%331
33.2%106
29.4%271
32.2%106
38.1%67
36.8%71
32.1%85
33.3%92
40.9%Separated
171.7%
191.9%
82.2%
172.0%
72.5%
52.7%
52.3%
62.4%
73.1%
Divorced
12912.9%
10110.1%
308.3%
8510.1%
227.9%
158.2%
188.1%
176.7%
219.3%
Widow
ed62
6.2%30
3.0%9
2.5%26
3.1%7
2.5%6
3.3%7
3.2%7
2.7%4
1.8%EducationHighschoolorless
28928.9%
25025.1%
7019.4%
20424.3%
7627.3%
6033.0%
5826.2%
6023.5%
7031.1%
Somecollege
30230.2%
30530.6%
10228.3%
26631.6%
8129.1%
4524.7%
6228.1%
6726.3%
6729.8%
Collegegraduate463
46.3%438
44.0%187
51.8%369
43.9%120
43.2%77
42.3%100
45.2%128
50.2%88
39.1%Annualhouseholdincom
e<$15,000
11011.0%
878.7%
215.8%
688.1%
269.4%
105.5%
156.8%
135.1%
2611.6%
=<$15,000<$25,000114
11.4%116
11.6%35
9.7%99
11.8%31
11.2%26
14.3%23
10.4%27
10.6%23
10.2%=<$25,000<$35,000
11711.7%
12212.2%
4011.1%
10212.1%
3512.6%
2312.6%
3515.8%
2710.6%
2812.4%
=<$35,000<$50,000133
13.3%144
14.5%42
11.6%120
14.3%40
14.4%28
15.4%30
13.6%45
17.6%33
14.7%=<$50,000<$75,000
18518.5%
17417.5%
7621.1%
15418.3%
4817.3%
3016.5%
4118.6%
4818.8%
3314.7%
=<$75,000<$100,000124
12.4%149
15.0%63
17.5%123
14.6%41
14.7%37
20.3%40
18.1%45
17.6%40
17.8%=<$100,000<$150,000
939.3%
10910.9%
5515.2%
9611.4%
3211.5%
168.8%
198.6%
3312.9%
2310.2%
=>$150,00048
4.8%51
5.1%15
4.2%41
4.9%12
4.3%5
2.7%8
3.6%9
3.5%6
2.7%Don'tknow
/Refuse76
7.6%44
4.4%14
3.9%38
4.5%13
4.7%7
3.8%10
4.5%8
3.1%13
5.8%
Table1.Dem
ographiccharacteristicsofvictimsandnon-victim
s
Note:Sam
plesizes(n)areunweighted,butpercentagesarecalculatedusingw
eights.Categoriesarenotmutuallyexclusive.Participantscouldreportm
ultipletypesofvictim
izationinwhichcasetheyareincludedinm
ultiplecategories
Phantom
debtcollection
fraud(n=211)Charityfraud
(n=247)
Relationshipandtrust
fraud(n=212)Non-victim
s(n=1,000)
Allvictims
(n=996)Investm
entfraud(n=347)
Consumer
productsandservicesfraud
(n=803)Em
ployment
fraud(n=265)
Prizeandlotteryfraud
(n=175)

Findings from a Pilot Study to Measure Financial Fraud in the United States | 2017 31
Table2.Past-yearfrequencyofeachfraudtype
n % 95%ConfidenceIntervalsInvestmentfraud 347 16.5% 14.6% 18.5%
Pennystock 72 3.3% Pre-IPOstock 28 1.4% Investmentthatguaranteedadailyrateofreturn 63 2.8% RealEstateInvestmentTrust(REIT) 43 2.3% Oilorgasexploration 18 0.9% Alternativeenergycompany 38 1.7% Governmentorcompanybonds 27 1.4% Commodities 28 1.3% Othertypeofinvestment 30 1.3%
Consumerproductsandservicesfraud 803 42.6% 39.6% 45.5% Productpaidforbutneverreceived 142 7.1% Worthlessproduct 242 13.4% Boguscomputervirusprotectionsoftware 162 9.3% Boguscreditrepair 43 1.9% Advance-feeloanorlineofcredit 37 1.7% Unnecessaryhomeorvehiclerepair 158 8.1% Bogusimmigrationservices 17 0.6% Bogusdebtreductionservices 59 2.6% Bogusweightlossproduct 181 10.1% Continuedbillingaftercancellingaservice 223 11.6% Unauthorizedbillingforitemneverordered 179 9.4% UnauthorizedbillingforInternetaccess/webdesign/webhosting/onlineadvertising 102 4.9% Unauthorizedbillingfortelephone,text,ordataservices 66 3.7% Unwantedmagazinesubscriptions 89 4.8% Boguscreditmonitoringservices 32 1.7% Membershipinabuyer'sclub 110 5.9% Otherunauthorizedcharges 35 1.8% Otherbogusservice 19 1.0%
Employmentfraud 265 13.4% 11.5% 15.3% Onlinecareertrainingscam 44 2.4% Work-from-homescam 85 4.4% Paymentfortrainingthatwassupposedtoresultinaguaranteedjob 48 2.0% Multilevelmarketingscheme 63 3.1% Othertypeofjob 25 1.5%

Findings from a Pilot Study to Measure Financial Fraud in the United States | 2017 32
Table2.Past-yearfrequencyofeachfraudtype(continued)
n % 95%ConfidenceIntervalsPrizeandlotteryfraud 175 9.4% 7.6% 11.2%
Foreignlotteryfraud 39 1.8% Sweepstakesscam 93 5.2% Unclaimedinheritancefraud 23 1.4% Helpingastrangergetmoneyoutofaforeigncountry 15 0.8% Othertypeofbogusfinancialwindfall 5 0.3%
Phantomdebtcollectionfraud 221 10.6% 8.8% 12.3%
Unpaidtaxes 19 1.1% Apersonalloan 39 2.2% Creditcarddebt 48 2.1% Mortgagedebt 20 0.9% Healthcareormedicalcaredebt 36 1.9% Studentloandebt 23 1.2% Othertypeofphantomdebt 26 0.9%
Charityfraud 247 12.4% 10.5% 14.3% Relationshipandtrustfraud 212 11.3% 9.5% 13.2%
Sweetheartscam 101 5.7% Relative/friendimposterscam 111 5.6%
Note:Samplesizes(n)arenotweightedandrepresenttheactualnumberofparticipantswhoreportedthatsubtype.Percentagesareweightedandarecaluclatedoutofthetotalsample.

Findings from a Pilot Study to M
easure Financial Fraud in the United States | 2017
33
Table 3. Solicitation m
ethod by fraud type
Solicitationmethod
n%
n%
n%
n%
n%
n%
n%
n%
Internet244
32.1%22
26.5%149
34.7%14
35.0%3
23.1%3
10.0%20
6.7%9
18.0%Em
ail116
15.3%15
18.1%65
15.2%10
25.0%5
38.5%4
13.3%4
8.9%4
8.0%Textm
essage54
7.1%9
10.8%24
5.6%4
10.0%0
0.0%3
10.0%1
6.7%8
16.0%Postalm
ail113
14.9%12
14.5%59
13.8%2
5.0%6
46.2%13
43.3%4
28.9%3
6.0%TVorradioadvertisem
ent62
8.2%4
4.8%37
8.6%7
17.5%0
0.0%2
6.7%3
4.4%4
8.0%Telephonecall
9512.5%
1619.3%
429.8%
37.5%
215.4%
930.0%
620.0%
918.0%
Salespresentation/seminar
364.7%
910.8%
133.0%
615.0%
17.7%
26.7%
34.4%
12.0%
Word-of-m
outh/face-to-121
15.9%17
20.5%65
15.2%5
12.5%0
0.0%3
10.0%7
6.7%16
32.0%Other
8010.5%
33.6%
5011.7%
00.0%
17.7%
13.3%
62.2%
612.0%
Note:Victim
scouldselectmorethanonesolicitationm
ethodsovaluesdonotsumto100%
.*Categoryexcludesunauthorizedbillingfraud.†Victim
swhoreportedm
orethanonecategoryoffraudwereaskedtoselectthefraudthatoccurredinthepastyearthatthey
remem
berthemostdetailabout.Therefore,sam
plesizeonlyincludesvictimsw
hoselectedthatparticularfraudcategoryandwhere
reportedlossesweregreaterthan$0.0aftersubtractinganyreturns.
Charityfraud†(n=45)
Relationshipandtrustfraud†(n=50)
Allvictims
†(n=759)
Investment
fraud†(n=83)
*Consumer
productsandservices
fraud†(n=429)
Employm
entfraud†(n=40)
Prizeandlotteryfraud†(n=13)
Phantom
debtcollectionfraud†(n=30)
37

Findings from a Pilot Study to M
easure Financial Fraud in the United States | 2017
34
Table 4. Payment setting and paym
ent method by fraud type
Paymentsetting
n%
n%
n%
n%
n%
n%
n%
n%
Online262
34.5%31
37.3%149
34.7%16
40.0%4
30.8%7
23.3%19
42.2%9
18.0%Mail
648.4%
1012.0%
245.6%
512.5%
538.5%
310.0%
817.8%
510.0%
Telephone60
7.9%11
13.3%21
4.9%5
12.5%1
7.7%10
33.3%5
11.1%1
2.0%Instore
628.2%
89.6%
327.5%
410.0%
17.7%
620.0%
24.4%
24.0%
Directtoperson114
15.0%15
18.1%49
11.4%6
15.0%1
7.7%0
0.0%9
20.0%23
46.0%Otherpaym
entsetting19
2.5%3
3.6%5
1.2%2
5.0%0
0.0%2
6.7%0
0.0%1
2.0%Paym
entmethod
Creditcard267
35.2%27
32.5%172
40.1%16
40.0%2
15.4%11
36.7%18
40.0%7
14.0%DebitorATM
18524.4%
2024.1%
11526.8%
922.5%
215.4%
620.0%
920.0%
714.0%
Cash169
22.3%21
25.3%69
16.1%10
25.0%3
23.1%5
16.7%11
24.4%30
60.0%Check
7610.0%
1518.1%
399.1%
37.5%
323.1%
620.0%
511.1%
48.0%
Paymentapp(PayPal,
Venmo,GoogleW
allet)67
8.8%7
8.4%35
8.2%6
15.0%1
7.7%4
13.3%7
15.6%1
2.0%
Moneyorder
293.8%
22.4%
153.5%
12.5%
215.4%
13.3%
36.7%
36.0%
Wiredfunds
263.4%
33.6%
133.0%
12.5%
17.7%
00.0%
00.0%
510.0%
Prepaidcard18
2.4%1
1.2%6
1.4%0
0.0%2
15.4%2
6.7%2
4.4%2
4.0%Bitcoin
91.2%
22.4%
30.7%
00.0%
17.7%
13.3%
00.0%
24.0%
Other32
4.2%4
4.8%13
3.0%1
2.5%1
7.7%2
6.7%0
0.0%2
4.0%
Charityfraud(n=45)
Relationshipandtrust
fraud(n=50)
Note:Victimscouldselectm
orethanonepaymentm
ethodsovaluesdonotsumto100%
.Percentagesarecalculatedoutofthetotalnum
berofvictimsw
ithintheparticularcategoryoffraud.
Allvictims
(n=759)Investm
entfraud(n=83)
Consumer
productsandservices
fraud(n=429)
Employm
entfraud(n=40)
Prizeandlottery
fraud(n=13)
Phantom
debtcollectionfraud(n=30)

Findings from a Pilot Study to M
easure Financial Fraud in the United States | 2017
35
Table 5. Financial losses by fraud type
Lossamount
n%
n%
n%
n%
n%
n%
n%
n%
Between$1and$99
34044.8%
2226.5%
20848.5%
1845.0%
538.5%
723.3%
2657.8%
1734.0%
Between$100and$499
22830.0%
2024.1%
13230.8%
1127.5%
646.2%
1446.7%
1328.9%
1836.0%
Between$500to$999
597.8%
1416.9%
317.2%
12.5%
00.0%
310.0%
36.7%
612.0%
Between$1,000to$4,999
759.9%
1315.7%
368.4%
410.0%
00.0%
516.7%
12.2%
48.0%
Between$5,000to$9,999
101.3%
56.0%
10.2%
25.0%
00.0%
00.0%
00.0%
24.0%
Between$10,000to$49,999
111.4%
44.8%
40.9%
00.0%
00.0%
13.3%
12.2%
00.0%
Between$50,000to$99,999
30.4%
22.4%
10.2%
00.0%
00.0%
00.0%
00.0%
00.0%
$100,000ormore
10.1%
11.2%
00.0%
00.0%
00.0%
00.0%
00.0%
00.0%
Ican'tremem
ber16
2.1%1
1.2%9
2.1%2
5.0%1
7.7%0
0.0%0
0.0%1
2.0%Prefernottosay
162.1%
11.2%
71.6%
25.0%
17.7%
00.0%
12.2%
24.0%
Refundattempts
Receivedafakecheckfrom
perpetratorthatbounced102
13.4%63
75.9%41
9.6%11
27.5%2
15.4%7
23.3%8
17.8%6
12.0%
Gotsomethinginreturnfor
whatw
aspaid200
26.4%28
33.7%116
27.0%16
40.0%2
15.4%10
33.3%4
8.9%9
18.0%
*Madeattem
ptstogetmoneyback
23030.3%
3845.8%
20247.1%
1435.0%
430.8%
826.7%
1226.7%
2244.0%
Numberofseparatepaym
entsPaidonetim
eonly615
81.0%66
79.5%361
84.1%33
82.5%13
100.0%20
66.7%37
82.2%35
70.0%Paidtw
otimes
9412.4%
1416.9%
4510.5%
512.5%
00.0%
723.3%
613.3%
816.0%
Paidthreeofmoretim
es50
6.6%3
3.6%23
5.4%2
5.0%0
0.0%3
10.0%2
4.4%7
14.0%
*Questionw
asaskedonlyifvictimreportedthatnothingofvaluew
asprovidedinreturnforpayment.
Investment
fraud(n=83)
Allvictims
(n=759)
Relationshipandtrust
fraud(n=50)
Charityfraud(n=45)
Phantom
debtcollectionfraud(n=30)
Prizeandlotteryfraud(n=13)
Employm
entfraud(n=40)
Consumer
productsandservices
fraud(n=429)

Findings from a Pilot Study to M
easure Financial Fraud in the United States | 2017
36
Table 6. Perpetrator characteristics by fraud type
Perpetratorcharacteristicsn
%n
%n
%n
%n
%n
%n
%n
%Male
359
47.3%
48
57.8%
188
43.8%
15
37.5%
861.5%
16
53.3%
25
55.6%
32
64.0%
Female
148
19.5%
20
24.1%
60
14.0%
15
37.5%
17.7%
826.7%
11
24.4%
16
32.0%
Don'tk
nowgender/n
ot
applica
ble
252
33.2%
15
18.1%
181
42.2%
10
25.0%
430.8%
620.0%
920.0%
24.0%
Hadco
ntactw
ithperpetra
tor
(face-to
-face,email,p
hone,
text,o
rmail)
445
58.6%
51
61.4%
250
58.3%
21
52.5%
969.2%
21
70.0%
17
37.8%
30
60.0%
Perpetratoridentity†Victim
knowsth
e
perpetra
torp
erso
nally
130
17.1%
22
26.5%
42
9.8%
13
32.5%
17.7%
620.0%
511.1%
30
60.0%
*Perpetratorbelongedtovictim
'sreligious,com
munity,professionalor
socialorganization
54
7.1%
11
13.3%
22
5.1%
615.0%
17.7%
26.7%
48.9%
612.0%
*Currentorformerspouse
21
2.8%
56.0%
34
7.9%
25.0%
00.0%
13.3%
12.2%
36.0%
*Currentorformer
romanticpartner
29
3.8%
33.6%
10
2.3%
12.5%
00.0%
13.3%
00.0%
14
28.0%
Familym
ember
39
5.1%
10
12.0%
10
2.3%
410.0%
17.7%
413.3%
12.2%
714.0%
*Caregiver17
2.2%
00.0%
81.9%
512.5%
00.0%
00.0%
36.7%
12.0%
*Noneoftheabove
42
5.5%
89.6%
14
3.3%
37.5%
00.0%
00.0%
12.2%
816.0%
Perpetra
torcla
imedto
bea
governmento
fficial
102
13.4%
20
24.1%
44
10.3%
10
25.0%
430.8%
11
36.7%
715.6%
48.0%
†Victim
sonlyansw
eredth
isquestio
nifth
eyre
porte
dth
eyhadco
ntactw
ithth
eperpetra
tor(s)
*Victim
sonlyansw
eredth
esequestio
nsifth
eyre
porte
dth
eyknewth
eperpetra
tor(s)p
erso
nally
Charityfraud(n=45)
Relationshipandtrust
fraud(n=50)Allvictim
s(n=759)
Investment
fraud(n=83)
Consumer
productsandservices
fraud(n=429)
Employm
entfraud(n=40)
Prizeandlotteryfraud(n=13)
Phantom
debtcollectionfraud(n=30)
*

Findings from a Pilot Study to M
easure Financial Fraud in the United States | 2017
37
Reportingdecisionsn
%n
%n
%n
%n
%n
%n
%n
%Toldfam
ily/friends/othersincom
munity
39051.4%
4351.8%
22151.5%
1947.5%
323.1%
1446.7%
2146.7%
2958.0%
Toldbank/creditcardcompany
13417.7%
1619.3%
8018.6%
820.0%
215.4%
516.7%
511.1%
24.0%
Reportedtolawenforcem
ent55
7.2%8
9.6%26
6.1%3
7.5%0
0.0%4
13.3%4
8.9%4
8.0%Reportedtoconsum
erprotectionagency
597.8%
1012.0%
358.2%
37.5%
17.7%
413.3%
12.2%
00.0%
FederalTradeCommission
(FTC)8
1.1%1
1.2%5
1.2%0
0.0%0
0.0%2
6.7%0
0.0%0
0.0%
ConsumerFinancial
ProtectionBureau(CFPB)15
2.0%2
2.4%10
2.3%0
0.0%0
0.0%2
6.7%1
2.2%0
0.0%
FederalBureauofInvestigation(FBI)
50.7%
11.2%
20.5%
00.0%
00.0%
13.3%
00.0%
00.0%
SecuritiesandExchangeCom
mission(SEC)
40.5%
11.2%
20.5%
00.0%
00.0%
13.3%
00.0%
00.0%
BetterBusinessBureau(BBB)39
5.1%6
7.2%24
5.6%2
5.0%1
7.7%0
0.0%1
2.2%0
0.0%InternetCrim
eComplaint
Center(IC3)8
1.1%1
1.2%5
1.2%1
2.5%0
0.0%0
0.0%0
0.0%0
0.0%
StateAttorneyGeneral'sOffice
182.4%
22.4%
102.3%
25.0%
00.0%
26.7%
12.2%
00.0%
USPostalInspectionService
(USPS)
40.5%
00.0%
20.5%
00.0%
00.0%
00.0%
12.2%
00.0%
FinancialIndustryRegulatoryAuthority(FIN
RA)4
0.5%0
0.0%3
0.7%0
0.0%0
0.0%1
3.3%0
0.0%0
0.0%
Otherstate/federalagency
00.0%
00.0%
20.5%
00.0%
00.0%
00.0%
00.0%
00.0%
Toldsomeoneelse
263.4%
11.2%
133.0%
12.5%
215.4%
26.7%
00.0%
12.0%
Charityfraud(n=45)
Relationshipandtrust
fraud(n=50)
Note:Victimsonlyansw
eredthesequestionsiftheytoldsomeoneabouttheincident(n=455outof759totalvictim
s).Theywereasked
toselectwhichagenciestheyreportedtoonlyiftheyreported(n=59victim
s).Victimsw
ereabletoselectmultipleoptions.
Allvictims
(n=759)Investm
entfraud(n=83)
Consumer
productsandservices
fraud(n=429)
Employm
entfraud(n=40)
Prizeandlottery
fraud(n=13)
Phantom
debtcollectionfraud(n=30)
Table 7. Reporting behaviors by fraud type

Findings from a Pilot Study to M
easure Financial Fraud in the United States | 2017
38
Table 8. Reasons for not reporting fraud victimization by fraud type
Whydidyounottellanyone?
n%
n%
n%
n%
n%
n%
n%
n%
Iwasem
barrassed72
9.5%5
6.0%40
9.3%2
5.0%1
7.7%2
6.7%6
13.3%7
14.0%Didn'tknow
Icouldreportit32
4.2%2
2.4%18
4.2%1
2.5%0
0.0%1
3.3%4
8.9%3
6.0%Didn'tknow
who
tocontact25
3.3%4
4.8%12
2.8%1
2.5%0
0.0%2
6.7%1
2.2%0
0.0%Didn'tknow
howtocontactan
authority21
2.8%0
0.0%14
3.3%1
2.5%1
7.7%1
3.3%1
2.2%0
0.0%
Didn'tlosemuchm
oney82
10.8%2
2.4%51
11.9%6
15.0%1
7.7%3
10.0%7
15.6%6
12.0%Tookcareofitm
yself55
7.2%8
9.6%35
8.2%1
2.5%1
7.7%1
3.3%4
8.9%2
4.0%Didn'tthinkitw
oulddoanygood
9212.1%
1315.7%
5011.7%
512.5%
17.7%
310.0%
511.1%
816.0%
Didn'twanttobotherthe
police/Notimportantenough
293.8%
22.4%
174.0%
00.0%
00.0%
13.3%
48.9%
36.0%
Didn'tfindoutuntillongafteranditw
astoolate22
2.9%3
3.6%9
2.1%2
5.0%0
0.0%3
10.0%1
2.2%2
4.0%
Couldn'tprovidemuch
informationaboutw
hathappened
283.7%
44.8%
133.0%
12.5%
215.4%
00.0%
511.1%
12.0%
Thepersonresponsiblewasa
friendorfamilym
emberandI
didn'twanttogetthem
introuble
81.1%
00.0%
30.7%
00.0%
00.0%
13.3%
12.2%
36.0%
Tooinconvenient48
6.3%1
1.2%35
8.2%2
5.0%0
0.0%2
6.7%3
6.7%2
4.0%Other
121.6%
11.2%
71.6%
00.0%
00.0%
13.3%
12.2%
24.0%
Charityfraud(n=45)
Relationshipandtrust
fraud(n=50)
Note:Victimsonlyansw
eredthesequestionsiftheydidnottellanyoneabouttheincident(n=304outof759totalvictims).Theyw
ereabletoselectm
ultiplereasonsfornotdisclosingtheincident.
Allvictims
(n=759)Investm
entfraud(n=83)
Consumer
productsandservices
fraud(n=429)
Employm
entfraud(n=40)
Prizeandlottery
fraud(n=13)
Phantom
debtcollectionfraud(n=30)

Findings from a Pilot Study to M
easure Financial Fraud in the United States | 2017
39
Howdistressingw
astheincident?
n%
n%
n%
n%
n%
n%
n%
n%
Notatalldistressing
7810.3%
1416.9%
4911.4%
37.5%
17.7%
310.0%
511.1%
24.0%
Mildlydistressing
28337.3%
2024.1%
17139.9%
1742.5%
430.8%
413.3%
2044.4%
2142.0%
Moderatelydistressing
26134.4%
3441.0%
13832.2%
1332.5%
430.8%
1653.3%
1533.3%
1530.0%
Severelydistressing137
18.1%15
18.1%71
16.6%7
17.5%4
30.8%7
23.3%5
11.1%12
24.0%*Psychological/physiologicalim
pact(monthorm
ore)Worried/anxious
32042.2%
4048.2%
16738.9%
1947.5%
646.2%
1343.3%
1840.0%
2346.0%
Angry556
73.3%57
68.7%309
72.0%28
70.0%11
84.6%26
86.7%31
68.9%40
80.0%Sad/depressed
28337.3%
3137.3%
15435.9%
1845.0%
538.5%
1136.7%
1737.8%
2142.0%
Vulnerable338
44.5%41
49.4%184
42.9%16
40.0%8
61.5%18
60.0%19
42.2%19
38.0%Violated
41054.0%
4453.0%
22853.1%
1742.5%
861.5%
1756.7%
2555.6%
2958.0%
Can'ttrustpeople475
62.6%59
71.1%247
57.6%26
65.0%12
92.3%20
66.7%31
68.9%33
66.0%Unsafe
22129.1%
2934.9%
12028.0%
1127.5%
430.8%
1136.7%
1431.1%
1224.0%
Embarrassed
38150.2%
4048.2%
20848.5%
2152.5%
969.2%
1343.3%
2760.0%
3060.0%
Difficultysleeping161
21.2%24
28.9%76
17.7%9
22.5%4
30.8%10
33.3%7
15.6%11
22.0%Stressed
42355.7%
5465.1%
22352.0%
2255.0%
861.5%
2170.0%
2146.7%
3060.0%
*Soughthelp72
9.5%13
15.7%32
7.5%7
17.5%1
7.7%5
16.7%2
4.4%8
16.0%Counseling/therapy
283.7%
44.8%
122.8%
25.0%
00.0%
413.3%
12.2%
48.0%
Medication
233.0%
33.6%
81.9%
37.5%
00.0%
13.3%
12.2%
510.0%
Visiteddoctor/nurse29
3.8%5
6.0%15
3.5%3
7.5%1
7.7%1
3.3%1
2.2%1
2.0%VisitedER/hospital/clinic
141.8%
44.8%
61.4%
12.5%
00.0%
00.0%
00.0%
24.0%
Asaresultofincident,hardorsom
ewhathardtom
eetmonthlypaym
ents/paybills266
35.0%42
50.6%127
29.6%17
42.5%6
46.2%14
46.7%11
24.4%25
50.0%
Feelintentionallyscammed
ordefrauded395
52.0%47
56.6%214
49.9%15
37.5%10
76.9%16
53.3%28
62.2%22
44.0%
*Victimscouldselectm
ultipleoptions.
Charityfraud(n=45)
Relationshipandtrust
fraud(n=50)Allvictim
s(n=759)
Investment
fraud(n=83)
Consumer
productsandservices
fraud(n=429)
Employm
entfraud(n=40)
Prizeandlottery
fraud(n=13)
Phantom
debtcollectionfraud(n=30)
Table 9. Emotional consequences of victim
ization by fraud

Findings from a Pilot Study to M
easure Financial Fraud in the United States | 2017
40
Table 10. Incident resolution by fraud type
n%
n%
n%
n%
n%
n%
n%
n%
Feeltheincidentisresolved398
52.4%51
61.4%225
52.4%16
40.0%9
69.2%18
60.0%25
55.6%21
42.0%†Tim
etoresolvetheincidentOnedayorless(1-24hours)
6416.1%
59.8%
4017.8%
16.3%
00.0%
413.3%
28.0%
419.0%
Morethanaday,butless
8220.6%
1427.5%
5022.2%
318.8%
00.0%
26.7%
14.0%
419.0%
Atleastaweek,butless
thanonemonth(7-30days)
7518.8%
1019.6%
4419.6%
212.5%
111.1%
413.3%
624.0%
29.5%
Onem
onthtolessthanthreem
onths69
17.3%12
23.5%33
14.7%6
37.5%2
22.2%3
10.0%5
20.0%2
9.5%
Threemonthstolessthan
sixmonths
4611.6%
59.8%
219.3%
318.8%
111.1%
516.7%
624.0%
29.5%
Sixmonthstolessthanone
year19
4.8%2
3.9%10
4.4%0
0.0%0
0.0%0
0.0%2
8.0%3
14.3%
Oneyearorm
ore10
2.5%2
3.9%7
3.1%0
0.0%0
0.0%0
0.0%0
0.0%1
4.8%Don'tknow
/Don't33
8.3%1
2.0%20
8.9%1
6.3%3
33.3%0
0.0%3
12.0%3
14.3%†M
ediannumberofhours
spentresolvingtheincident(std.dev.)
4(125.5)5(60.3)
3(37.2)4(14.4)
8(795.8)4.5(16.9)
5(29.9)4(43.5)
†Calculatedoutoftotalnumberofvictim
swithineachfraudcategoryw
hofeelincidentisresolved
Charityfraud(n=45)
Relationshipandtrust
fraud(n=50)Allvictim
s(n=759)
Investment
fraud(n=83)
Consumer
productsandservices
fraud(n=429)
Employm
entfraud(n=40)
Prizeandlottery
fraud(n=13)
Phantom
debtcollectionfraud(n=30)

Findings from a Pilot Study to Measure Financial Fraud in the United States | 2017 41
APPENDIX B. SURVEY QUESTIONNAIRE
Fraud Taxonomy Survey Programmed Version
Total Completes ............................. 2,000 Region (Qzip): New England ......................................... 92 Middle Atlantic ................................... 262 East North Central ............................... 295 West North Central ............................. 132 South Atlantic ..................................... 391 East South Central ............................... 118 West South Central ............................. 240 Mountain ............................................. 145 Pacific ................................................. 325 Age/Gender (Q.2a): Males: 18/24 ................................................... 134 25/34 ................................................... 177 35/44 ................................................... 167 45/54 ................................................... 177 55/64 ................................................... 156 65 or older ........................................... 161 Females: 18/24 ................................................... 128 25/34 ................................................... 174 35/44 ................................................... 168 45/54 ................................................... 183 55/64 ................................................... 168 65 or older ........................................... 207 Ethnicity (Q.4a): Hispanic .............................................. 342 White ................................................. 1248 African American ................................ 246 Asian/Hawaiian/Native ....................... 100 Native American ................................... 40 Other ..................................................... 64 User Group (Q.A12): Fraud ................................................. 9999 Not Fraud .......................................... 9999 LIVE ............................. Begin/End dates

Findings from a Pilot Study to Measure Financial Fraud in the United States | 2017 42
] # 1) You’re invited to participate in this research survey on negative financial experiences in which
someone convinced you to pay them money by misrepresenting, lying about, or hiding information about something they promised you would receive.
This survey will take about 10 minutes to complete. PARTICIPANT’S RIGHTS: If you have read this form and have decided to participate in this
survey click on the yes option below. The alternative is not to participate. Your individual privacy will be maintained in all published and written data resulting from this study.
CONTACT INFORMATION: If you are not satisfied with how this study is being conducted, or if
you have any concerns, complaints, or general questions about the research or your rights as a participant, please contact the Stanford Institutional Review Board (IRB) to speak to someone independent of the research team at (650)-723-2480 or toll free at 1-866-680-2906. You can also write to the Stanford IRB, Stanford University, 3000 El Camino Real, Five Palo Alto Square, 4th Floor, Palo Alto, CA 94306.
Yes, I agree to participate in the study described above .............................................. 1 No, I do NOT agree to participate in the study described above .................................. 2 [IF Q.1 = 2 (NOT), TERMINATE & SKIP TO QTERM]
# 1a) • Use the “>>” button on the bottom of each page to move through the survey.
• Answer every question to the best of your ability. There are no right or wrong answers; we are only interested in your opinion.
• Individual answers will be kept strictly confidential and used for marketing research purposes only.
• If you need help during the survey, click on the Survey Assistance link near the bottom left of your screen.
To start your survey, click on the ">>" button below.
# Qzip) What is your zip code?
[________________________________________] [EDIT: 0001-99998]
[CHECK CENSUS DIVISION QUOTAS, IF FULL, TERMINATE & SKIP TO QTERM]

Findings from a Pilot Study to Measure Financial Fraud in the United States | 2017 43
# 1A) So we can customize the survey for you, we have a few questions to ask. (copy Q.A3 from 5150305) # 1) What is your gender? Male .............................................................................................................................. 1 Female .......................................................................................................................... 2 (copy Q.A3a from 5150305 and make green changes) # 2) What is your age? [DROP DOWN MENU; PUNCH SHOULD MATCH AGE] [13 ............................................................................................................................... 13 14 ................................................................................................................................ 14 15 ................................................................................................................................ 15 16 ............................................................................................................................... 16 17 ................................................................................................................................ 17 18 ................................................................................................................................ 18 19 ................................................................................................................................ 19 20 ................................................................................................................................ 20 21 ................................................................................................................................ 21 22 ............................................................................................................................... 22 23 ................................................................................................................................ 23 24 ................................................................................................................................ 24 25 ................................................................................................................................ 25 26 ................................................................................................................................ 26 27 ................................................................................................................................ 27 28 ................................................................................................................................ 28 29 ................................................................................................................................ 29 30 ................................................................................................................................ 30 31 ................................................................................................................................ 31 32 ................................................................................................................................ 32 33 ................................................................................................................................ 33 34 ................................................................................................................................ 34 35 ................................................................................................................................ 35 36 ................................................................................................................................ 36 37 ................................................................................................................................ 37 38 ................................................................................................................................ 38 39 ................................................................................................................................ 39 40 ................................................................................................................................ 40 41 ................................................................................................................................ 41 42 ................................................................................................................................ 42 43 ................................................................................................................................ 43 44 ................................................................................................................................ 44 45 ................................................................................................................................ 45 46 ................................................................................................................................ 46 47 ................................................................................................................................ 47 48 ................................................................................................................................ 48

Findings from a Pilot Study to Measure Financial Fraud in the United States | 2017 44
49 ................................................................................................................................ 49 50 ................................................................................................................................ 50 51 ................................................................................................................................ 51 52 ................................................................................................................................ 52 53 ................................................................................................................................ 53 54 ................................................................................................................................ 54 55 ................................................................................................................................ 55 56 ................................................................................................................................ 56 57 ................................................................................................................................ 57 58 ................................................................................................................................ 58 59 ................................................................................................................................ 59 60 ................................................................................................................................ 60 61 ................................................................................................................................ 61 62 ................................................................................................................................ 62 63 ................................................................................................................................ 63 64 ................................................................................................................................ 64 65 ................................................................................................................................ 65 66 ................................................................................................................................ 66 67 ................................................................................................................................ 67 68 ................................................................................................................................ 68 69 ................................................................................................................................ 69 70 ................................................................................................................................ 70 71 ................................................................................................................................ 71 72 ................................................................................................................................ 72 73 ................................................................................................................................ 73 74 ................................................................................................................................ 74 75 ................................................................................................................................ 75 76 ................................................................................................................................ 76 77 ................................................................................................................................ 77 78 ................................................................................................................................ 78 79 ................................................................................................................................ 79 80 ................................................................................................................................ 80 81 ................................................................................................................................ 81 82 ................................................................................................................................ 82 83 ................................................................................................................................ 83 84 ................................................................................................................................ 84 85 ................................................................................................................................ 85 86 ................................................................................................................................ 86 87 ................................................................................................................................ 87 88 ................................................................................................................................ 88 89 ................................................................................................................................ 89 90 ................................................................................................................................ 90 91 ................................................................................................................................ 91 92 ................................................................................................................................ 92 93 ................................................................................................................................ 93 94 ................................................................................................................................ 94 95 ................................................................................................................................ 95 96 ................................................................................................................................ 96 97 ................................................................................................................................ 97 98 ................................................................................................................................ 98 99 ................................................................................................................................ 99 100 ............................................................................................................................ 100 101 ............................................................................................................................ 101

Findings from a Pilot Study to Measure Financial Fraud in the United States | 2017 45
102 ............................................................................................................................ 102 103 ............................................................................................................................ 103 104 ............................................................................................................................ 104 105 ............................................................................................................................ 105 106 ............................................................................................................................ 106 107 ............................................................................................................................ 107 108 ............................................................................................................................ 108 109 ............................................................................................................................ 109 110 ............................................................................................................................ 110 Prefer not to say ....................................................................................................... 999] [IF Q.A3a = 13-17, 999 (REF), TERMINATE & SKIP TO QTERM] (copy Q.A3b from 5150305 – take into account 65+ includes the new punches) # 2a) [BUILDER: CREATE GENDER/AGE NET FROM Q’s 1 & 2: Male 18-24 .................................................................................................................... 1 Male 25-34 .................................................................................................................... 2 Male 35-44 .................................................................................................................... 3 Male 45-54 ................................................................................................................... 4 Male 55-64 .................................................................................................................... 5 Male 65+ ....................................................................................................................... 6 Female 18-24 ................................................................................................................ 7 Female 25-34 ................................................................................................................ 8 Female 35-44 ................................................................................................................ 9 Female 45-54 ............................................................................................................. 10 Female 55-64 .............................................................................................................. 11 Female 65+ ................................................................................................................. 12 CHECK GENDER/AGE QUOTA, IF FULL, TERMINATE & SKIP TO QTERM] # 3) Are you Hispanic or Latino? Yes ................................................................................................................................ 1 No ................................................................................................................................. 2 Prefer not to say ............................................................................................................ 3 [IF Q.3 = 3 (REF), TERMINATE & SKIP TO QTERM] # 4) What is your race? (Select all that apply) [M] White/Caucasian ........................................................................................................... 1 Black/African American ............................................................................................... 2 Asian ............................................................................................................................. 3 Native Hawaiian/Pacific Islander ................................................................................. 4 Native American/Alaska Native ................................................................................... 5 Other (Please be specific) ............................................................................................. 6 [______________________________] Prefer not to say ............................................................................................................ 7 [IF Q.4 = 7 (REF), TERMINATE & SKIP TO QTERM]

Findings from a Pilot Study to Measure Financial Fraud in the United States | 2017 46
# 4a) [BUILDER: DEFINE ETHNICITY QUOTAS IF SINGLE PUNCH: --------------------------- IF Q.3 = 1 (YES), PUNCH CODE 1 IF Q.4 = 1 AND NO OTHER CODE, PUNCH CODE 2 IF Q.4 = 2 AND NO OTHER CODE, PUNCH CODE 3 IF Q.4 = 3 AND NO OTHER CODE, PUNCH CODE 4 IF Q.4 = 4 AND NO OTHER CODE, PUNCH CODE 4 IF Q.4 = 5 AND NO OTHER CODE, PUNCH CODE 5 IF Q.4 = 6 AND NO OTHER CODE, PUNCH CODE 6 IF MULTI PUNCH: -------------------------- IF MULTIPLE RESPONSE, PUNCH CODE 6 Hispanic ........................................................................................................................ 1 White/Caucasian ........................................................................................................... 2 Black/African American ............................................................................................... 3 Asian/ Native Hawaiian/Pacific Islander ...................................................................... 4 Native American/Alaska Native ................................................................................... 5 Other ............................................................................................................................. 6 CHECK ETHNICITY QUOTA, IF FULL, TERMINATE & SKIP TO QTERM] # A) Thank you for qualifying for our survey.

Findings from a Pilot Study to Measure Financial Fraud in the United States | 2017 47
These next questions refer to negative experiences in which someone convinced you to pay them money by misrepresenting, lying about, or hiding information about something they promised you would receive.
Please answer only about negative experiences that happened within the last twelve months -- that is,
since [AUTOFILL DATE A YEAR AGO FROM SURVEY DATE]… # A1) Since [AUTOFILL DATE A YEAR AGO FROM SURVEY DATE]… Has anyone convinced you to invest your money in something by promising high or guaranteed rates
of returns, but the investment turned out to be worth much less than what you were told or your money was never invested at all?
Yes ................................................................................................................................ 1 No ................................................................................................................................. 2 Don't know .................................................................................................................... 3 Prefer not to say ............................................................................................................ 4 # A2) Since [AUTOFILL DATE A YEAR AGO FROM SURVEY DATE]… Have you paid for any services that you never received or that turned out to be worthless? Yes ................................................................................................................................ 1 No ................................................................................................................................. 2 Don't know .................................................................................................................... 3 Prefer not to say ............................................................................................................ 4 # A3) Since [AUTOFILL DATE A YEAR AGO FROM SURVEY DATE]… Have you paid for any products that you never received or that turned out to be worthless? Yes ................................................................................................................................ 1 No ................................................................................................................................. 2 Don't know .................................................................................................................... 3 Prefer not to say ............................................................................................................ 4 # A4) Since [AUTOFILL DATE A YEAR AGO FROM SURVEY DATE]… Have you been billed for a product, service, or membership that you never agreed to pay for? Yes ................................................................................................................................ 1 No ................................................................................................................................. 2 Don't know .................................................................................................................... 3 Prefer not to say ............................................................................................................ 4 # A5) Since [AUTOFILL DATE A YEAR AGO FROM SURVEY DATE]…

Findings from a Pilot Study to Measure Financial Fraud in the United States | 2017 48
Have you paid money for a job or a way to earn money that in the end did not exist, caused you to
lose money, or was not as profitable as promised? Yes ................................................................................................................................ 1 No ................................................................................................................................. 2 Don't know .................................................................................................................... 3 Prefer not to say ............................................................................................................ 4 # A6) Since [AUTOFILL DATE A YEAR AGO FROM SURVEY DATE]… Have you paid money to receive a prize, grant, inheritance, or lottery that you were told you won but
never received? Yes ................................................................................................................................ 1 No ................................................................................................................................. 2 Don't know .................................................................................................................... 3 Prefer not to say ............................................................................................................ 4 # A7) Since [AUTOFILL DATE A YEAR AGO FROM SURVEY DATE]… Have you given money to a person or an organization who claimed you owed them an unpaid debt,
even though the debt was false or you had already paid it off? Yes ................................................................................................................................ 1 No ................................................................................................................................. 2 Don't know .................................................................................................................... 3 Prefer not to say ............................................................................................................ 4 # A8) Since [AUTOFILL DATE A YEAR AGO FROM SURVEY DATE]… Have you donated money to a charitable organization or a cause on a crowd funding website that
turned out to be fake or that you suspect was fake? Yes ................................................................................................................................ 1 No ................................................................................................................................. 2 Don't know .................................................................................................................... 3 Prefer not to say ............................................................................................................ 4 # A9) Since [AUTOFILL DATE A YEAR AGO FROM SURVEY DATE]… Have you given money to someone who said they were a family member, friend, or someone
interested in you romantically, but that person was not who they claimed to be? Yes ................................................................................................................................ 1 No ................................................................................................................................. 2 Don't know .................................................................................................................... 3 Prefer not to say ............................................................................................................ 4

Findings from a Pilot Study to Measure Financial Fraud in the United States | 2017 49
# A10) Since [AUTOFILL DATE A YEAR AGO FROM SURVEY DATE]… Besides what we have already discussed, in the past year, did anything else happen in which someone
convinced you to pay them money by misrepresenting, lying about, or hiding information? Yes ................................................................................................................................ 1 No ................................................................................................................................. 2 [IF Q.A10 = 1 (YES), ASK; OTHERWISE, SKIP TO Q.A11] # A10a) Please describe what else happened in which someone convinced you to pay them money by
misrepresenting, lying about, or hiding information. Please be as specific as possible. [_________________________________________________________________________ __________________________________________________________________________ __________________________________________________________________________ CODING USE ONLY ________________________________________________________] # A11) [BUILDER: NUMBER OF FRAUD OCCURANCES ENTER THE # OF PUNCHES OF Q.A1, A2, A3, A4, A5, A6, A7, A8, A9, A10 = 1 (YES) [__________] [EDIT: 0 – 10] # A12) [BUILDER: DEFINE USER GROUP IF Q.A11 GE 1, PUNCH CODE 1 IF Q.A11 = 0, PUNCH CODE 2 Fraud ............................................................................................................................. 1 No fraud ....................................................................................................................... 2] [IF Q.A12 = 1 (FRAUD), ASK; OTHERWISE SKIP TO Q.P1] # A13) We will now ask you several more specific questions about your experiences in the past year in which
someone convinced you to pay them money by misrepresenting, lying about, or hiding information about something they promised you would receive.

Findings from a Pilot Study to Measure Financial Fraud in the United States | 2017 50
[IF Q.A1 = 1 (YES), ASK; OTHERWISE SKIP TO Q.D1] # B1) You stated that in the past year, someone convinced you to invest in something by promising high or
guaranteed rates of returns, but the investment turned out to be worth much less than what you were told or your money was never invested at all.
How many times did this happen in the past year? 1 time ............................................................................................................................ 1 2 or more times ............................................................................................................. 2 # B2) [IF Q.B1 = 2 (2+) DISPLAY] For the next few questions, think about the investment in which you
lost the most money. What type of investment was it…? [RANDOMIZE – ANCHOR CODE 9] A little-known stock (often called a penny stock) ........................................................ 1 Exclusive shares of a company prior to that company’s initial public offering ........... 2 Something that guaranteed a daily rate of return .......................................................... 3 A Real Estate Investment Trust .................................................................................... 4
An oil or gas exploration project .................................................................................. 5 An alternative energy company .................................................................................... 6 A government or corporation bond or debt (such as a promissory note, prime bank note or bond)
7 Commodities such as foreign currencies, agricultural products, energy products, or precious
metals .................................................................................................................................. 8 Something else (Please be specific) .............................................................................. 9 [______________________________] # B3) Do you believe your investment was part of a Ponzi scheme where any profits you may have made
came from the funds of new investors? Yes ................................................................................................................................ 1 No ................................................................................................................................. 2 Don't know .................................................................................................................... 3

Findings from a Pilot Study to Measure Financial Fraud in the United States | 2017 51
[IF Q.A2 = 1 (YES), ASK; OTHERWISE SKIP TO Q.C1] # D1) You stated that in the past year you paid for a service or services that you never received or that
turned out to be worthless or unnecessary. How many times did this happen during the past year? 1 time ............................................................................................................................ 1 2 or more times ............................................................................................................. 2 # D2) [IF Q.D1 = 2 (2+) DISPLAY] Thinking about the service or services that cost you the most money. What type of service did you pay for, was it…? [RANDOMIZE – ANCHOR CODE 7] Useless computer virus protection software or a software upgrade ............................. 1 A service to remove negative information from your credit report .............................. 2 An upfront fee to someone who promised to get you a loan or credit card .................. 3 Repair services for your home or your vehicle that were never provided or that turned out to be
unnecessary ......................................................................................................................... 4 A service to get your immigration status changed ....................................................... 5
Was it a service to help manage or pay off a debt, such as mortgage debt, student debt, or medical debt ...................................................................................................................................... 6
Something else (Please be specific) .............................................................................. 7 [______________________________] [IF Q.D2 = 6 (DEBT), ASK; OTHERWISE SKIP TO Q.C1] # D3) What type of debt did you pay to have removed? Was it…? (Select all that apply) [RANDOMIZE – ANCHOR CODE 6] [M] Credit card debt ............................................................................................................ 1 Mortgage debt ............................................................................................................... 2 Student loan debt .......................................................................................................... 3 Medical debt ................................................................................................................. 4
Personal loan debt ......................................................................................................... 5 Some other debt (Please be specific) ............................................................................ 6

Findings from a Pilot Study to Measure Financial Fraud in the United States | 2017 52
[IF Q.A3 = 1 (YES), ASK; OTHERWISE SKIP TO Q.E1] # C1) You stated that during the past year you paid for a product or products that you never received or that
turned out to be worthless. How many times did this happen in the past year? 1 time ............................................................................................................................ 1 2 or more times ............................................................................................................. 2 # C2) [IF Q.C1 = 2 (2+) DISPLAY] Thinking about the product in which you paid the most money for… Was this something that turned out to be worthless or something that you never received? Worthless ...................................................................................................................... 1 Never received .............................................................................................................. 2 [IF Q.C2 = 1 (WORTHLESS), ASK; OTHERWISE SKIP TO Q.C5] # C3) Did you purchase a product to lose weight, or to lose weight without diet and exercise, but the results
did not deliver as promised? Yes ................................................................................................................................ 1 No ................................................................................................................................. 2 [IF Q.C3 = 2 (NO), ASK; OTHERWISE SKIP TO Q.C5] # C4) Please describe the product or products. Please be as specific as possible. [_________________________________________________________________________ __________________________________________________________________________ __________________________________________________________________________ CODING USE ONLY ________________________________________________________] [IF C2 = 2 (NEVER RECEIVED), ASK; OTHERWISE SKIP TO Q.E1] # C5) Did you pay for something you never received from a seller on Craigslist, eBay, or another online
classified ad or auction website? Yes (Please be specific) ................................................................................................ 1 No ................................................................................................................................. 2 [IF Q.A4 = 1 (YES), ASK; OTHERWISE SKIP TO Q.F1]
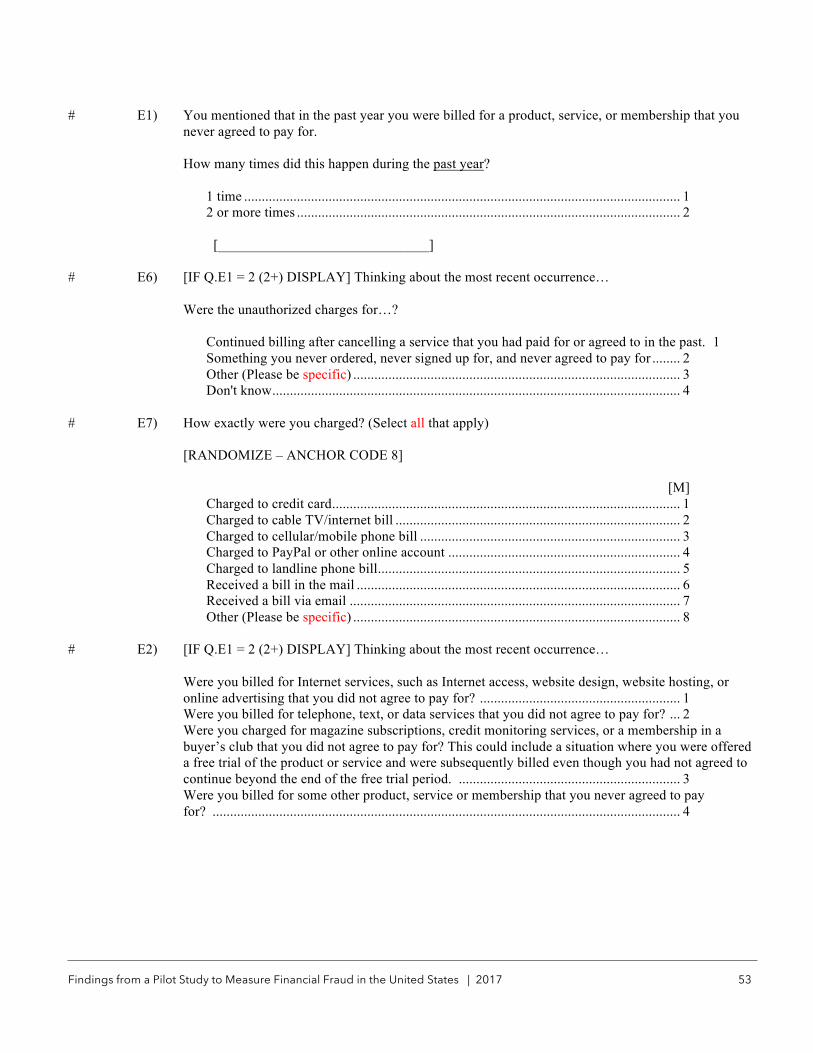
Findings from a Pilot Study to Measure Financial Fraud in the United States | 2017 53
# E1) You mentioned that in the past year you were billed for a product, service, or membership that you never agreed to pay for.
How many times did this happen during the past year? 1 time ............................................................................................................................ 1 2 or more times ............................................................................................................. 2 [______________________________] # E6) [IF Q.E1 = 2 (2+) DISPLAY] Thinking about the most recent occurrence… Were the unauthorized charges for…? Continued billing after cancelling a service that you had paid for or agreed to in the past. 1 Something you never ordered, never signed up for, and never agreed to pay for ........ 2 Other (Please be specific) ............................................................................................. 3 Don't know .................................................................................................................... 4 # E7) How exactly were you charged? (Select all that apply) [RANDOMIZE – ANCHOR CODE 8] [M] Charged to credit card ................................................................................................... 1 Charged to cable TV/internet bill ................................................................................. 2 Charged to cellular/mobile phone bill .......................................................................... 3 Charged to PayPal or other online account .................................................................. 4 Charged to landline phone bill ...................................................................................... 5 Received a bill in the mail ............................................................................................ 6 Received a bill via email .............................................................................................. 7 Other (Please be specific) ............................................................................................. 8 # E2) [IF Q.E1 = 2 (2+) DISPLAY] Thinking about the most recent occurrence… Were you billed for Internet services, such as Internet access, website design, website hosting, or
online advertising that you did not agree to pay for? ......................................................... 1 Were you billed for telephone, text, or data services that you did not agree to pay for? ... 2 Were you charged for magazine subscriptions, credit monitoring services, or a membership in a
buyer’s club that you did not agree to pay for? This could include a situation where you were offered a free trial of the product or service and were subsequently billed even though you had not agreed to continue beyond the end of the free trial period. ............................................................... 3
Were you billed for some other product, service or membership that you never agreed to pay for? ..................................................................................................................................... 4

Findings from a Pilot Study to Measure Financial Fraud in the United States | 2017 54
[IF Q.A5 = 1 (YES), ASK; OTHERWISE SKIP TO Q.G1] # F1) You stated that in the past year you paid for a job or a way to earn money that in the end did not exist,
caused you to lose money, or was not as profitable as promised. How many times did this happen during the past year? 1 time ............................................................................................................................ 1 2 or more times ............................................................................................................. 2 # F2) [IF Q.F1 = 2 (2+) DISPLAY] Thinking about the most recent occurrence… Did this involve…? [RANDOMIZE – ANCHOR CODE 5] Paying someone who promised to help you start your own business or coach you on launching a
new career online ................................................................................................................ 1 Paying someone who promised to help you make money working from home ........... 2 Paying a fee for training that was supposed to result in a guaranteed job .................... 3 A job where the only way to make money was by recruiting other people to sell a product, rather
than selling the product itself .............................................................................................. 4 Something else .............................................................................................................. 5
[IF Q.F2 = 5 (OTHER), ASK; OTHERWISE SKIP TO Q.G1] # F3) Please describe the job. Please be as specific as possible. [_________________________________________________________________________ __________________________________________________________________________ __________________________________________________________________________ CODING USE ONLY ________________________________________________________]

Findings from a Pilot Study to Measure Financial Fraud in the United States | 2017 55
[IF Q.A6 = 1 (YES), ASK; OTHERWISE SKIP TO Q.I1] # G1) You stated that in the past year you paid money to receive a prize, grant, inheritance, or lottery that
you were told you won but never received. How many times did this happen during the past year? 1 time ............................................................................................................................ 1 2 or more times ............................................................................................................. 2 # G2) [IF Q.G1 = 2 (2+) DISPLAY] Thinking about the most recent occurrence. Was the money you were
told you would receive associated with…? A foreign lottery? .......................................................................................................... 1 A sweepstakes that you had entered into previously? .................................................. 2 An unclaimed inheritance? .......................................................................................... 3 Helping a stranger get his/her money out of a foreign country? .................................. 4 Something else? ............................................................................................................ 5 # G6) Were you informed that you would have to pay a deposit or a fee in order to get the money you were
told you would receive? Yes ................................................................................................................................ 1 No ................................................................................................................................. 2

Findings from a Pilot Study to Measure Financial Fraud in the United States | 2017 56
[IF Q.A7 = 1 (YES), ASK; OTHERWISE SKIP TO Q.J] # I1) You stated that in the past year you gave money to a person or an organization who claimed you
owed them an unpaid debt, even though the debt was false or you had already paid it off. How many times did this happen during the past year? 1 time ............................................................................................................................ 1 2 or more times ............................................................................................................. 2 # I2) [IF Q.I1 = 2 (2+) DISPLAY] Thinking about the most recent occurrence… What did the person or organization say the debt was for, was it for…? [RANDOMIZE – ANCHOR CODE 7] Unpaid taxes ................................................................................................................. 1 A personal loan ............................................................................................................. 2 Credit card debt ............................................................................................................ 3 Mortgage debt ............................................................................................................... 4 Health care or medical care debt .................................................................................. 5 Student loan debt .......................................................................................................... 6
Something else (Please be specific) .............................................................................. 7 [IF Q.A8 = 1 (YES), ASK; OTHERWISE SKIP TO Q.K1] # J1) You stated that in the past year you donated money to a charitable organization or a cause on a crowd
funding website that turned out to be fake or that you suspect was fake. How many times did you donate money to a fake organization in the past year? 1 time ............................................................................................................................ 1 2 or more times ............................................................................................................. 2

Findings from a Pilot Study to Measure Financial Fraud in the United States | 2017 57
[IF Q.A9 = 1 (YES), ASK; OTHERWISE SKIP TO Q.L1] # K1) You stated that in the past year you gave money to someone who said they were a family member,
friend, or someone interested in you romantically, but that person was not who they claimed to be. How many times did this happen during the past year? 1 time ............................................................................................................................ 1 2 or more times ............................................................................................................. 2 # K2) [IF Q.K1 = 2 (2+) DISPLAY] Thinking about the most memorable occurrence… Was this person…? [RANDOMIZE] Someone who seemed to be interested in you romantically or who you had a romantic connection
with ...................................................................................................................................... 1 Someone pretending to be a friend or relative who needed your help ......................... 2 [IF Q.A10 = 1 (YES), ASK; OTHERWISE SKIP TO Q.M] # L1) You described a different negative financial experience in which someone convinced you to pay
money by misrepresenting, lying about, or hiding information about something they promised you would receive.
How many times did this happen during the past year? 1 time ............................................................................................................................ 1 2 or more times ............................................................................................................. 2

Findings from a Pilot Study to Measure Financial Fraud in the United States | 2017 58
[IF Q.A11 GE 2, ASK; OTHERWISE SKIP TO Q.N1] # M1) You’ve stated that since [AUTOFILL DATE A YEAR AGO FROM SURVEY DATE] you’ve had
several negative financial experiences happen to you. Please select the incident you remember the most detail about. [DISPLAY IF Q.A1 = 1] Invested your money in something that promised a high or guaranteed
rate of return ........................................................................................................................ 1 [DISPLAY IF Q.A2 = 1] Paid for services never received or was worthless .............. 2 [DISPLAY IF Q.A3 = 1] Paid for a product(s) that you never received or turned out to be
worthless ............................................................................................................................. 3 [DISPLAY IF Q.A4 = 1] Billed for product, service, membership that you did not agree to pay
for 4 [DISPLAY IF Q.A5 = 1] Paid money for a job or a way to earn money that did not exist 5 [DISPLAY IF Q.A6 = 1] Paid money for a prize, grant, lottery that you were told you won but
never received ..................................................................................................................... 6 [DISPLAY IF Q.A7 = 1] Given money to pay an unpaid debt .................................... 7 [DISPLAY IF Q.A8 = 1] Donated money on crowd funding website that was fake ... 8 [DISPLAY IF Q.A9 = 1] Given money to someone who claimed to be related, friend,
romantically involved .......................................................................................................... 9 [DISPLAY IF Q.A10 = 1] Some other way you were defrauded .............................. 10

Findings from a Pilot Study to Measure Financial Fraud in the United States | 2017 59
# N1) For the remainder of the questions focus on the negative financial experience you remember the best. Did you ever have contact with the person, people, or company who took your money, either over
mail, email, text, the telephone, or in person? Yes ................................................................................................................................ 1 No ................................................................................................................................. 2 Don't know .................................................................................................................... 3 Not applicable ............................................................................................................... 4 # N2) How did you find out about the person, product, service, job, charity, or company you gave your
money to? (Select all that apply) [RANDOMIZE – ANCHOR CODE 9] [M] I found out from browsing the Internet ........................................................................ 1 I found out through an email ........................................................................................ 2 I found out through a text message or direct message on my mobile phone ................ 3 I received something in the mail ................................................................................... 4 I found out through a TV commercial or Radio advertisement .................................... 5 I was called directly by someone on the telephone ...................................................... 6 I attended a presentation or seminar ............................................................................. 7 I found out through word-of-mouth or face-to-face from the person who took my money 8 Other (Please be specific) ............................................................................................. 9 [______________________________] # N3) How did you make any payments? (Select all that apply) [RANDOMIZE – ANCHOR CODE 6] [M] I paid online .................................................................................................................. 1 I sent payment through the mail ................................................................................... 2 I paid over the telephone .............................................................................................. 3 I paid at a store .............................................................................................................. 4 I paid the person face-to-face ....................................................................................... 5 Other (Please be specific) ............................................................................................. 6 [______________________________]

Findings from a Pilot Study to Measure Financial Fraud in the United States | 2017 60
# N4) How did you transfer money to the person or company? For example, did you pay by check, use a
credit card, or use some other payment type? (Select all that apply) [M] I used a credit card ........................................................................................................ 1 I used a debit or ATM card ........................................................................................... 2 I paid with cash ............................................................................................................. 3 I paid with a check ........................................................................................................ 4 I transferred money using a mobile or online payment system or app (like PayPal, ApplePay,
Square, Venmo, Google Wallet) ......................................................................................... 5 I purchased a money order to pay ................................................................................. 6 I wired funds through a company like Western Union, Money Gram, or through a bank transfer
7 I used a prepaid card such as a Green Dot, Vanilla Card, Bluebird, or MoneyPak .... 8 I paid with Bitcoin or other digital currency ................................................................ 9 Other payment method (Please be specific) ............................................................... 10 [______________________________] # N5) How much money did you pay in total? (Enter in whole dollars.)
$[________________________________________] [EDIT: 0-999,999]
[CHECK BOX] Don’t know ....................................................................................... 1 [CHECK BOX] Prefer not to say ................................................................................. 2 [IF Q.N5 = DK, REF, ASK; OTHERWISE SKIP TO Q.N6] # N5A) Would you say you paid…? Almost nothing (close to $0) ........................................................................................ 1 Between $1 and $99 ..................................................................................................... 2 Between $100 and $499 ............................................................................................... 3 Between $500 to $999 .................................................................................................. 4 Between $1,000 to $4,999 ............................................................................................ 5 Between $5,000 to $9,999 ............................................................................................ 6 Between $10,000 to $49,999 ........................................................................................ 7 Between $50,000 to $99,999 ........................................................................................ 8 $100,000 or more .......................................................................................................... 9 I can’t remember how much ....................................................................................... 10 Prefer not to say .......................................................................................................... 11 # N6) How many separate times did you pay money in connection with this incident? One time only ............................................................................................................... 1 Two times ..................................................................................................................... 2 Three or more times ..................................................................................................... 3

Findings from a Pilot Study to Measure Financial Fraud in the United States | 2017 61
# N7) When was the most recent time you paid money in connection with this incident? 2016 .............................................................................................................................. 1 2015 .............................................................................................................................. 2 Prior to 2015 ................................................................................................................. 3 Don’t remember/not sure .............................................................................................. 4 # N8) Did you ever get anything in return for what you paid, such as some money back or whatever was
originally promised to you? Yes ................................................................................................................................ 1 No ................................................................................................................................. 2 [IF Q.N8 = 1 (YES), ASK; OTHERWISE SKIP TO Q.N8b] # N8a) What do you estimate was the total value of the money, products, or services you ultimately
received/got back? (Enter in whole dollars.)
$[________________________________________] [EDIT: 0-999,999]
[IF Q.N8 = 2 (NO) ASK; OTHERWISE, SKIP TO Q.N9] # N8b) Have you ever tried to get your money back? Yes ................................................................................................................................ 1 No ................................................................................................................................. 2 # N9) In connection with this incident, did you ever receive a check as a form of payment or reimbursement
that bounced or turned out to be fake? Yes ................................................................................................................................ 1 No ................................................................................................................................. 2 # N10) Did the person, people, or company who took your money state that they were a government official
or department of any kind? (e.g., a police officer, an IRS agent, a local/state/federal government employee)?
Yes ................................................................................................................................ 1 No ................................................................................................................................. 2 # N11) Were they…? Male .............................................................................................................................. 1 Female .......................................................................................................................... 2 Don't know/not applicable ............................................................................................ 3 # N12) Do you know the person or people personally? Yes ................................................................................................................................ 1 No ................................................................................................................................. 2

Findings from a Pilot Study to Measure Financial Fraud in the United States | 2017 62
[IF Q.N12 = 1 (YES), ASK; OTHERWISE SKIP TO Q.N15] # N13) Did you know this person or people through a particular religious, community, professional, or social
organization? Yes ................................................................................................................................ 1 No ................................................................................................................................. 2 # N14) Was the person or people any of the following? (Select all that apply) [RANDOMIZE – ANCHOR CODE 5; CODE 5 EXCLUSIVE] [M] A current or former spouse ........................................................................................... 1 A current or former significant other (girlfriend or boyfriend) .................................... 2 A family member .......................................................................................................... 3 A person who provides personal care to you or to your spouse ................................... 4 None of the above ......................................................................................................... 5 # N15) Did you tell anyone about the incident? Yes ................................................................................................................................ 1 No ................................................................................................................................. 2 [IF Q.N15 = 1 (YES), ASK; OTHERWISE SKIP TO Q.N18] # N16) Who did you tell? (Select all that apply) [M] My family, friends, and/or others in my community .................................................... 1 Bank or credit card company ........................................................................................ 2 Local law enforcement ................................................................................................. 3 Consumer protection agency or federal law enforcement agency ............................... 4 Other (Please be specific) ............................................................................................. 5 [______________________________] [IF Q.N16 = 4 (CONSUMER AGENCY), ASK; OTHERWISE SKIP TO Q.N18] # N17) Which agency did you contact? (Select all that apply) [RANDOMIZE – ANCHOR CODE 10] [M] Federal Trade Commission (FTC) ................................................................................ 1 Consumer Financial Protection Bureau (CFPB) .......................................................... 2 Federal Bureau of Investigation (FBI) .......................................................................... 3 Securities and Exchange Commission (SEC) ............................................................... 4 Better Business Bureau (BBB) ..................................................................................... 5 Internet Crime Complaint Center (IC3) ........................................................................ 6 State Attorney General’s Office ................................................................................... 7 United States Postal Inspection Service (USPIS) ......................................................... 8 Financial Industry Regulatory Authority (FINRA) ...................................................... 9 Other (Please be specific) ........................................................................................... 10 [______________________________]

Findings from a Pilot Study to Measure Financial Fraud in the United States | 2017 63
[DISPLAY MENTIONS FROM Q.N17] # N17a) How satisfied were you with the agency’s or agencies’ response?
Very Dissatisfied
Somewhat Dissatisfied
Neither Satisfied nor Dissatisfied
Somewhat Satisfied
Very Satisfied
a) Federal Trade Commission (FTC)
1 2 3 4 5
b) Consumer Financial Protection Bureau (CFPB)
1 2 3 4 5
c) Federal Bureau of Investigation (FBI)
1 2 3 4 5
d) Securities and Exchange Commission (SEC)
1 2 3 4 5
e) Better Business Bureau (BBB) 1 2 3 4 5 f) Internet Crime Complaint Center
(IC3) 1 2 3 4 5
g) State Attorney General’s Office 1 2 3 4 5 h) United States Postal Inspection
Service (USPIS) 1 2 3 4 5
i) [INSERT OTHER FROM Q.N17]
1 2 3 4 5
[IF Q.N15 = 2 (NO), ASK; OTHERWISE SKIP TO Q.N19] # N18) Why did you not tell anyone about the incident? (Select all that apply) [RANDOMIZE – ANCHOR CODE 13] [M] I was embarrassed ......................................................................................................... 1 Didn’t know I could report it ........................................................................................ 2 Didn’t know which authority to contact ....................................................................... 3 Didn’t know how to contact the appropriate authority ................................................. 4 Didn’t lose much money ............................................................................................... 5 Took care of it myself ................................................................................................... 6 Didn’t think it would do any good ................................................................................ 7 Didn’t want to bother the police/It was not important enough ..................................... 8 Didn’t find out that my money was gone until long after it happened/too late for police or
investigators to help ............................................................................................................ 9 Couldn’t identify the person or organization that took my money or provide much information
that would be helpful to investigators or the police .......................................................... 10 The person responsible was a friend or family member and I didn’t want to get them in trouble
11 Too inconvenient/didn’t want to take the time ........................................................... 12 Other (Please be specific) ........................................................................................... 13 [______________________________]

Findings from a Pilot Study to Measure Financial Fraud in the United States | 2017 64
# N19) At the present time, do you feel that this incident is resolved? Yes ................................................................................................................................ 1 No ................................................................................................................................. 2 [IF Q.N19 = 1 (YES), ASK; OTHERWISE SKIP TO Q.O1] # N19a) Approximately how long did it take to resolve? One day or less (1-24 hours) ......................................................................................... 1 More than a day, but less than a week (25 hours-6 days) ............................................. 2 At least a week, but less than one month (7-30 days) .................................................. 3 One month to less than three months ............................................................................ 4 Three months to less than six months ........................................................................... 5 Six months to less than one year .................................................................................. 6 One year or more .......................................................................................................... 7 Don’t know/Don’t remember ....................................................................................... 8 # N20) Approximately how many hours have you spent in total trying to resolve this incident? Enter your response in hours. If less than an hour enter “0”.
[________________________________________] [EDIT: 0-9999]
Findings from a Pilot Study to Measure Financial Fraud in the United States | 2017 65
# O1) Negative financial experiences can affect people in many different ways. Now we want to ask how
the incident made you feel. How distressing was this incident? Not at all distressing ..................................................................................................... 1 Mildly distressing ......................................................................................................... 2 Moderately distressing .................................................................................................. 3 Severely distressing ...................................................................................................... 4 # O2) Did you feel any of the following ways for A MONTH OR MORE as a result of this experience? [RANDOMIZE – ANCHOR OTHER]
Yes No
a) Worried or anxious 1 2 b) Angry 1 2 c) Sad or depressed 1 2 d) Vulnerable 1 2 e) Violated 1 2 f) Like you couldn’t trust people 1 2 g) Unsafe 1 2 h) Embarrassed 1 2 i) Difficulty Sleeping 1 2 j) Stressed 1 2 k) Some other way 1 2
[IF Q.O2 K (OTHER) = 1 (YES), ASK; OTHERWISE SKIP TO Q.O3] # O2z) You mentioned you felt some other way. Please explain how you felt below. Please be as specific as possible. [_________________________________________________________________________ __________________________________________________________________________ __________________________________________________________________________ CODING USE ONLY ________________________________________________________] # O3) Did you seek any kind of professional or medical help for the feelings you experienced as a result of
this incident? Yes ................................................................................................................................ 1 No ................................................................................................................................. 2

Findings from a Pilot Study to Measure Financial Fraud in the United States | 2017 66
[IF Q.O3 = 1 (YES), ASK; OTHERWISE SKIP TO Q.O4] # O3a) What kind of professional or medical help did you seek? (Select all that apply) [RANDOMIZE – ANCHOR CODE 5] [M] Counseling/therapy ....................................................................................................... 1 Medication .................................................................................................................... 2 Visited doctor or nurse ................................................................................................. 3 Visited ER/hospital/clinic ............................................................................................. 4 Other (Please be specific) ............................................................................................. 5 [______________________________] # O4) Has this incident made it hard for you to meet your monthly payments or pay your bills? Yes ................................................................................................................................ 1 Somewhat ..................................................................................................................... 2 No ................................................................................................................................. 3 # O5) Do you believe that the person, people, charity, or company you gave money to intentionally tried to
scam or defraud you? Yes ................................................................................................................................ 1 No ................................................................................................................................. 2 Don’t know/not sure ..................................................................................................... 3

Findings from a Pilot Study to Measure Financial Fraud in the United States | 2017 67
# P1) The next questions are about how you feel about your financial situation in general. Please answer as
honestly as possible. Using a 0 to 10 scale where 0 means “no control at all” and 10 means “very much control,” how
would you rate the amount of control you have over your financial situation these days?
No Control at All 0
1 2 3 4 5 6 7 8 9 Very Much Control
10
0 1 2 3 4 5 6 7 8 9 10 # P2) How difficult is it for you to meet monthly payments or pay your bills? Not at all difficult ......................................................................................................... 1 Not very difficult .......................................................................................................... 2 Somewhat difficult ....................................................................................................... 3 Very difficult ................................................................................................................ 4 # P3) In the past 12 months did you [or your partner] give financial help totalling $500 or more to friends or
relatives? (By financial help we mean giving money, helping pay bills, or covering specific costs such as those for medical care or insurance, education, down payment for a home, rent, etc. The financial help can be considered support, a gift, or a loan.)
Yes ................................................................................................................................ 1 No ................................................................................................................................. 2 Not sure/prefer not to say ............................................................................................. 3 # P4) In the past 12 months did you [or your partner] receive financial help totalling $500 from friends or
relatives? (By financial help we mean receiving money, help paying bills or covering specific costs such as those for medical care or insurance, education, down payment for a home, rent, etc. The financial help can be considered support, a gift, or a loan.)
Yes ................................................................................................................................ 1 No ................................................................................................................................. 2 Not sure/prefer not to say ............................................................................................. 3 # P5) In the past 12 months, were any children, parents, or other relatives dependent on you for more than
half of their financial support? Yes ................................................................................................................................ 1 No ................................................................................................................................. 2 Not sure/prefer not to say ............................................................................................. 3 # P6) Not including retirement accounts, do you have any investments in stocks, bonds, mutual funds, or
other securities? Yes ................................................................................................................................ 1 No ................................................................................................................................. 2 Don't know/prefer not to say ........................................................................................ 3

Findings from a Pilot Study to Measure Financial Fraud in the United States | 2017 68
# P7) Which of the following statements comes closest to describing the amount of financial risk that you
are willing to take when you save or make investments? Take substantial financial risks expecting to earn substantial returns .......................... 1 Take above average financial risks expecting to earn above average returns .............. 2 Take average financial risks expecting to earn average returns ................................... 3 Not willing to take any financial risks .......................................................................... 4 # P8) The next questions are about how you feel about different aspects of your life. Please answer as
honestly as possible. [RANDOMIZE]
Often
Some of the time
Hardly ever or never
a) Feel you lack companionship 1 2 3 b) Feel left out 1 2 3 c0) Feel isolated from others 1 2 3
# P9) The next questions are about how you feel about other problems that may be happening in your life
right now. Indicate whether any of these are current and ongoing problems that have lasted twelve months or longer. If the problem is happening to you, indicate how upsetting it has been. Please answer as honestly as possible.
[RANDOMIZE]
No, isn’t happening
Yes, but not upsetting
Yes, somewhat upsetting
Yes, very upsetting
a) Ongoing housing problems 1 2 3 4 b) Ongoing financial strain 1 2 3 4 c) Ongoing problems in a close relationship 1 2 3 4 d) Ongoing health problems 1 2 3 4 e) Ongoing physical or emotional problems in
spouse or a child 1 2 3 4
# P10) How often do you engage in certain behaviors? Please answer as honestly as possible. [RANDOMIZE]
Daily 2-3 Times a Week
Once a week
2-3 Times a month
Once a month
Several times a year
Never Not applicable
P16) Use the Internet 1 2 3 4 5 6 7 8 P17) Make online purchases 1 2 3 4 5 6 7 8 P18) Monitor financial accounts
(online, at the bank, ATM, or with a financial advisor)
1 2 3 4 5 6 7 8

Findings from a Pilot Study to Measure Financial Fraud in the United States | 2017 69
# D1x) Before we finish, we just need to get some background information. What is your marital status? Married ......................................................................................................................... 1 Single ............................................................................................................................ 2 Separated ...................................................................................................................... 3 Divorced ....................................................................................................................... 4 Widowed/widower ........................................................................................................ 5 Prefer not to say ............................................................................................................ 6 # D1ax) Which of the following describes your current living arrangements? I am the only adult in the household ............................................................................. 1 I live with my spouse/partner/significant other ............................................................ 2 I live in my parent’s home ............................................................................................ 3 I live with other family, friends, or roommates ............................................................ 4 Prefer not to say ............................................................................................................ 5 # D2x) Including yourself, how many people are in your household? 1 (only yourself) ........................................................................................................... 1 2 .................................................................................................................................... 2 3 .................................................................................................................................... 3 4 .................................................................................................................................... 4 5 .................................................................................................................................... 5 6 or more ....................................................................................................................... 6 Prefer not to say ............................................................................................................ 7 # D3x) How many children or dependent adults rely on you (or your spouse) for financial support? Please
include children not living at home, and step-children as well. 0 .................................................................................................................................... 1 1 .................................................................................................................................... 2 2 .................................................................................................................................... 3 3 .................................................................................................................................... 4 4 .................................................................................................................................... 5 5 .................................................................................................................................... 6 6 or more ....................................................................................................................... 7 Prefer not to say ............................................................................................................ 8 [IF Q.D1= 1 (MARRIED OR PARTNERED), ASK; OTHERWISE SKIP TO Q.D5] # D4x) Who is the primary financial decision-maker in your household? Me/myself ..................................................................................................................... 1 My spouse ..................................................................................................................... 2 I share the responsibility equally with my spouse ........................................................ 3 Other ............................................................................................................................. 4 Prefer not to say ............................................................................................................ 5
Findings from a Pilot Study to Measure Financial Fraud in the United States | 2017 70
# D5x) From the following list of organizations, please select the ones you have heard of. (Select all that
apply) [RANDOMIZE – ANCHOR CODE 13] [DISPLAY IN 2 COLS] [M] Federal Trade Commission (FTC) ................................................................................ 1 Consumer Financial Protection Bureau (CFPB) .......................................................... 2 Financial Industry Regulatory Authority (FINRA) ...................................................... 3 National Consumers League ......................................................................................... 4 Securities and Exchange Commission (SEC) ............................................................... 5 Better Business Bureau (BBB) ..................................................................................... 6 Consumer Federation of America ................................................................................. 7 National Consumer Agency .......................................................................................... 8 Federal Bureau of Investigation (FBI) .......................................................................... 9 Internet Crime Complaint Center (IC3) ...................................................................... 10 State Attorney General’s Office ................................................................................. 11 United States Postal Inspection Service (USPIS) ....................................................... 12 None of these .............................................................................................................. 13 # D6x) Which of the following best describes your current work status? Self-employed ............................................................................................................... 1 Work full-time for an employer .................................................................................... 2 Work part-time for an employer ................................................................................... 3 Homemaker .................................................................................................................. 4 Full-time student ........................................................................................................... 5 Permanently sick, disabled, or unable to work ............................................................. 6 Unemployed or temporarily laid off ............................................................................. 7 Retired .......................................................................................................................... 8 Prefer not to say ............................................................................................................ 9 # D7x) How would you characterize the area in which you live? Urban ............................................................................................................................ 1 Suburban ....................................................................................................................... 2 Rural ............................................................................................................................. 3 Prefer not to say ............................................................................................................ 4 # D8x) What was the last year of education that you completed? Did not complete high school ....................................................................................... 1 High school graduate – regular high school diploma ................................................... 2 High school graduate – GED or alternative credential ................................................. 3 Some college ................................................................................................................. 4 College graduate ........................................................................................................... 5 Post graduate education ................................................................................................ 6 Prefer not to say ............................................................................................................ 7

Findings from a Pilot Study to Measure Financial Fraud in the United States | 2017 71
# D9x) What is your household’s approximate annual income, including wages, tips, investment income,
public assistance, income from retirement plans, etc.? Less than $15,000 ......................................................................................................... 1 At least $15,000 but less than $25,000 ......................................................................... 2 At least $25,000 but less than $35,000 ......................................................................... 3 At least $35,000 but less than $50,000 ......................................................................... 4 At least $50,000 but less than $75,000 ......................................................................... 5 At least $75,000 but less than $100,000 ....................................................................... 6 At least $100,000 but less than $150,000 ..................................................................... 7 $150,000 or more .......................................................................................................... 8 Don't know .................................................................................................................... 9 Prefer not to say .......................................................................................................... 10
[END]