
Finding Your Partner - InterVISTAS · Finding Your Partner Outlook: Alliances, ... Analysis...
35
Finding Your Partner Outlook: Alliances, JV’s M&A’s Dr. Emre Serpen Executive Vice President InterVISTAS Consulting Group WORLD ROUTES 2012, ABU DHABI, UAE
Transcript of Finding Your Partner - InterVISTAS · Finding Your Partner Outlook: Alliances, ... Analysis...

Finding Your Partner Outlook: Alliances, JV’s M&A’s
Dr. Emre Serpen
Executive Vice President
InterVISTAS Consulting Group
WORLD ROUTES 2012, ABU DHABI, UAE

Air transport growth is greater in emerging
economies in Asia, Latin America, Middle East,
1 Airbus August 2011 Forecast
Partnership and cooperation with
airlines in emerging markets is critical
for future growth
Shifting market growth: The GDP growth of
emerging economies is significantly higher than
mature economies
Small growth in GDP translates to significant market
growth in Asian, Latin American markets

Using geographic advantage Gulf Carriers and TK are growing
connecting emerging markets in particular Asia, Middle East and
Africa
2
The emergence of Gulf/Middle East carriers causing shift in global traffic flows across major connecting hubs

With significant new aircraft orders, growth is set to increase in coming years
3 Source: Diio Mi Sept 27th, 2012. Both directions total.

Emirates supported its network thru code shares
4 Source: Diio Mi Sept 27th, 2012 (For Sept 2012).
Emirates
Profitable year-on-year growth
Second brand worldwide
Significant marketshare in India, many
African states
Changed dynamics of Kangaroo route
Continuing growth
More market penetration in
US Canada
FlyDubai expanding
regional routes
Positioned to take
advantage of markets with
significant potential – Iraq.
Iran etc

Emirates/QANTAS Partnership Signals Change in Traditional
Alliance Relationships - Immediate impact on One world
5
QANTAS Before Emirates Partnership:
• 5 One-Stop Destinations in Europe (via QF
operations or code shares)
• No service to Middle East/North Africa
QANTAS After Emirates Partnership:
• Stop flying from Singapore and BKK to Europe
• Drop Frankfurt Service
• Drop code share plans with MH to 5 European Countries
• Discontinue BA code share (SIN/TPE), CX (HK/Rome)
• 32 One-Stop Destinations in Europe & 31 One-Stop Destinations in
Middle East/North Africa via DXB
• Revised service to SIN/HKG/KUL for better connectivity to Asia
Source: Sample Summer 2012 schedule
Did BA had to use
its aircraft in flights
beyond Singapore
?
Reduction in feeder
traffic with CX code
shares ?
:JAL – BA Start 1st
October •Include Paris /FR
•19 Flights
LHR/NRT
•March 2013
? Deal with CX, MH

Etihad using code shares supporting its growth
6 Source: Diio Mi Sept 27th, 2012

Etihad adding partnerships to support its growth
strategy
7 Source: Diio Mi Sept 27th, 2012 (For Sept 2012).
2011 profitable
Interim 2012 revenues 30% increase
800,000 passengers from passenger airlines
$ 281 Million from partner airlines
Since 2008 growth fro 2 to 35 code share partners
Mergers and Acquisitions key to 20 year plan
10 year strategic partnership with Virgin Australia
40 %Stake in Air Seychelles
29% Air Berlin Stake, access
to high yield European Markets
? Partnership with Air France &
KLM – one world indicated no
issues with Air Berlin
Economies of Scale in 787 fleet
, 56 aircraft common activities

Strategic Partnerships Cross Alliance Boundaries and
are Becoming More Complex
8
Codeshare/
FFP benefits
under
Discussion
Sample of
selected
strategic
partnerships of
Etihad and
Emirates
Cooperation
under
discussion

The three Global Airline Alliances continues see strong coverage in the Americas, Europe and Asia. Nevertheless, there is notable absence of
membership in the Middle East and India.
Alliance focus on emerging markets, Asia, Middle
East, Latin America
9
Passengers carried by Middle Eastern
airlines that belong to a global alliance
account for only 2.4% of total alliance
passengers and 1.8% of daily departures.

There may be further impacts on Alliances due to JV
and Merger activity
10
joins Star
join SkyTeam
exits SkyTeam
& joins Star
join oneworld
join SkyTeam
Source: OAG Max
join SkyTeam
Membership in Global Alliances is very fluid.
LATAM, Emirates-Qatar Deal
Malaysian
Sri Lankan

Ownership laws, national interests typically
restricts industry consolidation
Perceived national Interest
• Ownership rules
• Singapore/China Eastern
• Public opinion against foreign multinationals
• Some improvements (Malev, Air India)
Competition Law
• The interpretation of the competition law often
inhibit ed consolidation EU/US
• In 2001 DOJ blocked United/US merger on the
grounds that the fares would increase
Practicalities
• Fleets, cultures, work practices, IT, seniority lists
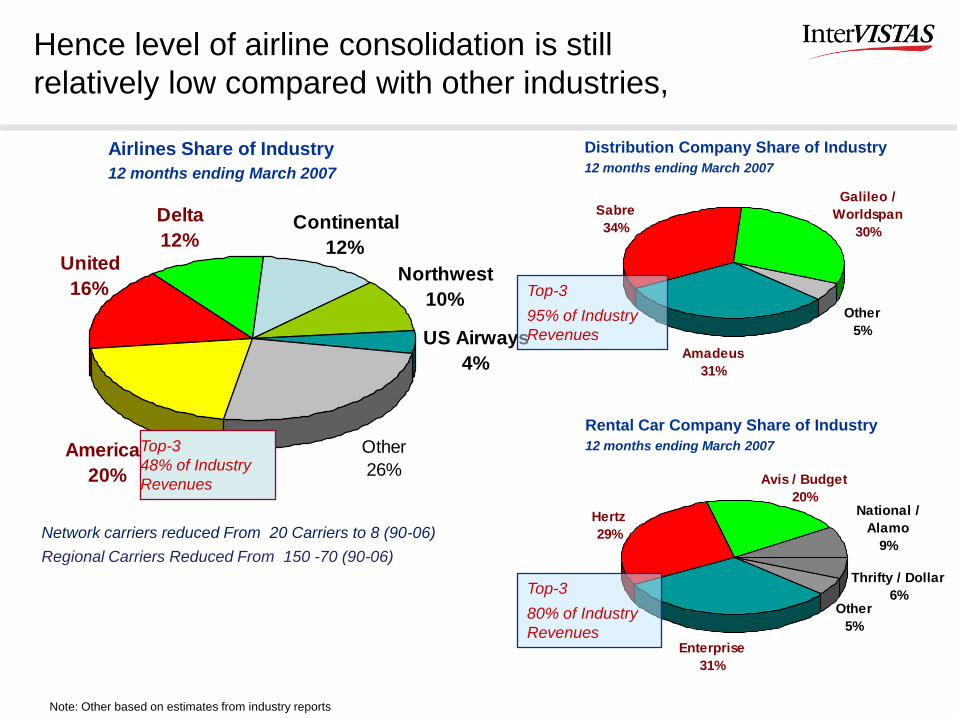
Hence level of airline consolidation is still
relatively low compared with other industries,
Note: Other based on estimates from industry reports
Delta
12%
American
20%
Northwest
10%
US Airways
4%
Other
26%
Continental
12%United
16%
Top-3
48% of Industry
Revenues
Airlines Share of Industry
12 months ending March 2007
Distribution Company Share of Industry
12 months ending March 2007
Sabre
34%
Galileo /
Worldspan
30%
Amadeus
31%
Other
5%
Rental Car Company Share of Industry
12 months ending March 2007
Other
5%
Thrifty / Dollar
6%
Hertz
29%
Avis / Budget
20%
Enterprise
31%
National /
Alamo
9%
Top-3
80% of Industry
Revenues
Top-3
95% of Industry
Revenues
Network carriers reduced From 20 Carriers to 8 (90-06)
Regional Carriers Reduced From 150 -70 (90-06)

Some consolidation has started within EU, also
some flag carriers ceased to exist
The synergies from integration with Swiss, exceeded 200 million Euros
• expanded route network with more destinations and better connections
• interlinked frequent flyer programmes and mutual lounge access
Total synergies from integration of Austrian are estimated at around EUR 80 million Euros (both revenue and cost)
• improved access to international passenger flows and joint international marketing,
• cost advantages and economies of scale
The scope of integration Swiss /Austrian were similar
• Autonomous carrier own business management, own crew and fleet
• Zurich integral part of Lufthansa’s multi hub strategy
The airline related savings of €525 million over three years by combining purchasing, sales and information technology.
Lufthansa
Air France / KLM
Nonstop Total Weekly seats Operated by Lufthansa Group
Aug. 2003–Aug. 2008, Dec. 2008
Depending on further progress of discussions between FAA
– EU in future we could see similar deals between US/EU

Joint ventures increasing in across the board
14
Joint Venture / Anti-trust Immunity relationships allow for better coordination in scheduling and pricing to offer passengers more convenient travel options.

Short haul routes : LCCs have quadrupled their intra-
European market share in the last ten years
RAPID LCC
EXPANSION ACROSS EUROPE LEADING TO
INCREASED MARKET SHARE
2001 2008
FSC
LCC
2001 2004 2008 2012E
Source: OAG, 2011; Lit search;
2012

Similar patterns in Asia, Middle East , also closer business models
may lead to further cooperation between network and LCC
16 Source: Diio Mi Sept 27th, 2012 (For Sept 2012).
Air Arabia
Flydubai
Focus on short haul profitability, reduction in
CASK, Eg Malindo, Air Asia,
Cooperation between Network and LCC carriers
-Eg LH/Jetblue. Etihad/VA et
Network carriers to leverage LCC relationships
much better
Do we have more opportunity for further
partnerships between Network And LCC ??

Increasing Joint Ventures and “Innovative
Partnerships”
Alliances and
Joint Ventures
Mergers
Cross-Border
Innovative
Partnerships
• Central Africa / India / Middle East / CIS carriers likely next to consider Global
alliances membership
• Potential new JVs to form in light of recently announced Emirates / Qantas Joint
Venture and codeshare partnership
• Global Alliances attracting LCCs to join via hybrid partnership platform (SkyTeam)
• Within the EU: Lufthansa with Austrian, Swiss, Brussels Airlines;
• IAG: British Airways and Iberia
• Latin America – AviancaTACA; LATAM Airlines Group
• Potential US-EU airline mergers? (Pending regulatory approvals)
• China Eastern & Qantas (carriers in different competing Global Alliances) to form
Hong Kong based LCC
• Etihad /Australia
• Porter (small, regional Canadian airline) signs interline partnership with South
African Airways via Washington IAD

Finding Partner: Analysis, Strategy, Execution

Analysis Overview Identify changes in region and market
level in both demand, supply, considering circuitry and yield
1. Relative growth of region to region flows considering yield and circuitry
2. Benchmark connectivity with key competitors considering yield
3. Historical growth O/D growth
4. Relative growth of airline market share share compared to O/D market flow considering yield and circuitry
Region A1 A2 A3 Yield
EU-EU 6.2 6.6 8.5 9.6
LA-EU 9.4 9.2 11.0 9.1
EU-NO 9.1 9.1 10.6 9.0
AP-EU 9.5 9.1 8.8 9.3
Connect
Markets 2005 2006 2007 2008 2009 2010
CDG-MED 87 391 853 793 1,717 2,566 DAM-MXP 35 29 56 2,347 2,561 PEK-ODS 1,452 2,050 1,195 1,539 2,539 2,528 BKK-TLV 847 1,294 2,308 3,745 3,679 2,499
Connect
Markets
Service Share O&D Share % Change CCt
Jan-09 Jan-10 2009 2010 Service O&D O&D Yield
BKK-ARN 0.8% 0.9% 2.0% 3.3% 8% 61% 101% 6,786 3.0
PEK-TIP 0.6% 0.7% 1.6% 2.9% 4% 79% 101% 5,968 3.0
IKA-YYZ 1.4% 1.3% 7.3% 8.9% -9% 23% 110% 5,674 2.8
ALG-MED 50.2% 100.0% 86.0% 86.3% 99% 0% 117% 5,196 7.7
Region-Region
Circuitry Yield Onboard O&D Industry O&D Growth A1 Share
Aug-09 Aug-10 Aug-09 Aug-10 Aug-10 Aug-10 A1 Industry of Industry
EU-NO 108% 8.8 9.0 869,909 1,019,118 8,330,229 8,479,367 17.2% 1.8% 12%
NO-EU 109% 8.7 9.1 835,797 986,496 8,330,229 8,479,367 18.0% 1.8% 12%
AP-AF 107% 9.4 9.3 657,943 703,314 5,776,835 5,630,906 6.9% -2.5% 12%
AF-AP 106% 9.4 9.3 655,028 701,660 5,776,835 5,630,906 7.1% -2.5% 12%
Focus on city pairs we want to develop/improve
19

Strategic Evaluation - is critical to establish competitive
strengths and determine scenarios for growth opportunities
Market analysis -the
demand and supply,
competitor activities
and strategic change
Market Growth
compared with Client
Growth, where client
growth may be
slower than market
growth, also vis-a-vis
fare changes.
Strategic evaluation
is used in the of the
development
scenarios
20

Strategic Evaluation Market Analysis and SWOT
Market share growth compared with total market growth
lose marketshare whilst reducing its average fares.
marketshare growth and fare protection in growing markets 21

22
For example growth of competitor activities at airline’s hub. This analysis
shows though this particular client is growing y-o-y 25% on its hub serving
top 500 markets,

23
Other deeper analysis include analysis of an airline’s hub which may be poorly designed
with the lack of a clear arrival/departure bank structure. This for instance equates to lost
opportunities in connecting O/D markets

Market forecasting to determine priorities
24
Top-down elements include GDP-driven passenger growth.
There is an established correlation between year-over-year GDP growth and corresponding growth in passenger volumes.
For increased accuracy, the GDP of respective countries on a route network and point-of-sale data are considered in the analysis
This smoothes temporary fluctuations of bottom up analysis
The bottom-up elements include regression analysis utilizing IATA Paxis and MIDT flown passenger data.
The market forecasting results are then used as an input to network optimisation tools.

Development of Route Strategy
25
Selected scenarios evaluated to establish
route strategy and route structure
Test different scenarios and business models
and evaluate respective differences in
variable contribution towards selection of the
best model
Use of optimisation models.
New destinations with better market growth,
and yield advantages. The route structure
that maximises marketshare, and variable
contribution improving competitiveness is
selected
Identify key changes to Long Haul, Medium
Haul, Regional and Domestic
Identify key changes for better use of alliance and code share partnerships

Deciding on code share, alliance, Joint Venture
Strategies
26
Network Planning
Long & Medium
Term
Shorth Term
Alliances
Pricing
Revenue
Management
Sales
OPerations
Distribution
Other
Finance
Strategic Plan
Market
Forecasting
Capacity
growth (incl
competitors)
Average Fares
Costs
Service
Objectives
Network
Design
Scenario
Development
Hub
Optimisation
Changes to
Fleet Plan
MIDT/BIDT
Network Planning
Long & Medium
Term
Shorth Term
Alliances
Pricing
Revenue
Management
Sales
OPerations
Distribution
Other
Finance
Strategic Plan
Network
Design
Scenario
Development
MIDT/BIDT
Identify value
of current
codeshares
Identify new
codeshare
opportunities to
improve
sustainable
variable
conytribution
Contact
candidate
airlines and
initiate new
codeshare
agreements
Develop code
share
agreement
Monitor
execute
changes to
improve gains
from the
current alliance
Contact
alliances to
initiate
membership
execute
Alliance
Participation
Identify Joint
Venture
Partners to
improve
sustainable
variable
contribution
Contact JV
Partners
towards
agreement
Execute Joint
Venture
AgreementExecute
codeshare
agreements
Identify alliance
to opportunitie
improve
sustainable
variable
contribution
Monitor
Performance of
current
codeshare
agreements
Monitor
Benefits from
JV partnership

27
Following the network optimisation analysis,
bilateral and codeshare development
opportunities can be identified and examined
or long-haul flights with codeshares to other
alliance hubs including beyond points,
medium/short-haul flights in a feeder role.
As some alliances selectively restrict code
shares with rival alliances, the value of current
code shares must be evaluated. beneficial for
the airline.
Example: Value of Current Codeshares
Determination of code share benefits

Evaluation of Alliance Benefits
28
Network Benefits
Additional pax due to
meaningful and advantageous
connections.
Develop the best strategic fit
with the alliance for own
strategy
Different Objectives
feeder to alliance hubs
protect stratetic interests
Bilateral agreements
excluding other airlines
.

Evaluation of ATI Benefits
29
Category Low High Revenue Comes From…
CRM 1.5 1.5 CRM improvements
FFP 5 15Increase costs per KM to
suppliers using Alliance FFP.
Opportunity cost of not having ATI/Open Skies 0 0Could lose many benefits
currently offered from Alliance
Low er COUNTRY distribution costs 6 9 Reduce commissions/overrides
Net Fares in COUNTRY mkts 0 0 Better coordination of net fares
Target corporate accounts 0 0Offer corporations deals for their
entire travel needs
Internet sales increase 0 0Joint coordination of sales
campaigns & promotions
Increase in COUNTRY sales 30 30Combination of pricing, RM, sales
& marketing
Competitive effect in COUNTRY marketplace 0 0Competitive response (pricing,
RM, sales & marketing)
Low er Country distribution costs 39 39 Reduce distribution costs
Negative competitive effect in domestic
marketplace0 0
Competitors erode Client market
share
Franchise Country CTO's 0 0Spin-off Country CTO's through
franchise concept
ATI Benefits:
Commercial and operational
alliance-wide cooperation,
reciprocal participation in each
other’s FFP,
proration of passenger fares,
co-operation on facilities and
passenger handling,
lounge exchange program,
common promotion and
advertising
common procurement

Joint venture success requires careful planning,
stakeholder engagement and change management
30
Realistic assumptions, especially on yield
increases
Governance of network, pricing, revenue
management, distribution
Cultural fit
Tone of the Joint Venture Discussions
Clear execution and communication plan
towards JV, M&A activities
Focus on revenue growth not just cost
reduction
Equity, ownership issues/value part of the
business plan, as well as network and other
benefits
Emphasis of the alternative scenario during
discussions

Critical success factors for successful JV’s and MA’s
Pre-merger Agreements
Delta/Northwest
Sufficient time Both Planning and Execution
AF/KLM
Business Case + Communications Plan + Funds
US Airways / United was blocked.
Realistic expectations + Benefits
Cultural fit + Change management
IT
Don’t Touch Brands
Governance and organisation for JV M&A management
Source: Dr Iatrou, Global symposium on Air Transport Liberalisation ICAO Dubai,
results of global survey of 32 airlines
0% 20% 40% 60% 80% 100%
Hubbing
Economies of Destiny
New Market Growth
Network Optimization
Economies of Scope
Financial Synergies
Marketing Synergies
Corp. Planning Synergies
Maint. Synergies
IT Synergies
Purchasing Synergies
Economies of Scale
Alliances & Mergers
Mergers
Alliances
Benefits

32
InterVISTAS’ Client Experiences
Team Members’ Client Experiences: 60+ Airlines
Sectors Selected Current
Clients
• Qantas
• Malaysian Airlines
• Garuda
• Turkish Airlines,
• MAZ Holding,
• DAS Holding,
• Oman Airways,
• Sri Lanka Airlines,
• RAK airlines,
• Royal Jordanian
• Porter Airlines
• Etihad
• British Airways
• Amadeus
• Belleair
Regions
• Europe,
• Middle East,
• South Asia,
• Eastern Europe
32

Our Airline Practice Service Lines are Focused on Airline
Strategy and Airline Performance Improvement
Strategy – Develop strategy, feasibility studies and
business planning
– Market Forecasting (Airline, Airport, MRO, Cargo)
– Start up Airline and MRO feasibility and business plan
– Mergers and acquistions planning
Network and Fleet Planning – Develop and
optimise network and route plans for airlines
– Route Planning and Schedule Development, Alliances
– Hub design and optimisation, slot remarketing
– Fleet planning , Aircraft leasing and remarketing
Financial Services – Evaluate airline investment
opportunities
– Due diligence (Airline, Airport, MRO, Cargo, GH)
– Privatization and spin-off and financing of Airline, MRO, Pilot
School, GH, Cargo
IT Strategy
Strategy and Finance Performance Improvement
Commercial Improvement – Airline Revenue
Improvement
– Pricing and Revenue Management
– Marketing, Sales and Distribution
– Technology solutions supporting revenue growth
Operations Improvement – Airline
Productivity Improvement and Cost Reduction
– Diagnostic and Cost reduction
– MRO
– Crew Resource Management
– Integrated Operations Control
Restructuring & Change Management –
Airline Transformation and Turnaround
– Restructuring (Airline, MRO, Cargo, Aerospace)
– Start up Implementation
– Performance management
– Organisation improvement and change management.
IT Implementation
33