Finding U.S. Census Bureau Data on Languages and Origin Susan Bauckus, NHLRC July 17, 2012.
23
Finding U.S. Census Bureau Data on Languages and Origin Susan Bauckus, NHLRC July 17, 2012
-
Upload
jaren-tinsley -
Category
Documents
-
view
214 -
download
0
Transcript of Finding U.S. Census Bureau Data on Languages and Origin Susan Bauckus, NHLRC July 17, 2012.
Finding U.S. Census Bureau Data on Languages and Origin
Susan Bauckus, NHLRCJuly 17, 2012

We’ll find:
1) Total % of LOTE speakers + foreign born
2) # of speakers of particular LOTEs in a given area (nation, state, county, city)
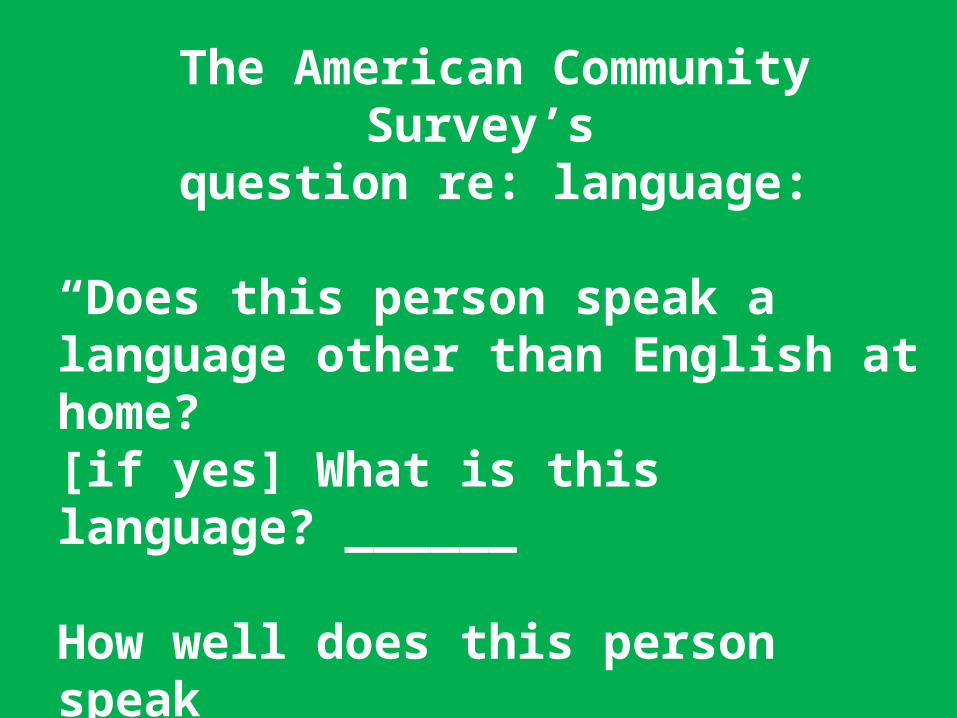
The American Community Survey’s question re: language:
“Does this person speak a language other than English at home?[if yes] What is this language? ______
How well does this person speak English? -- very well, well, not well, not at all.”
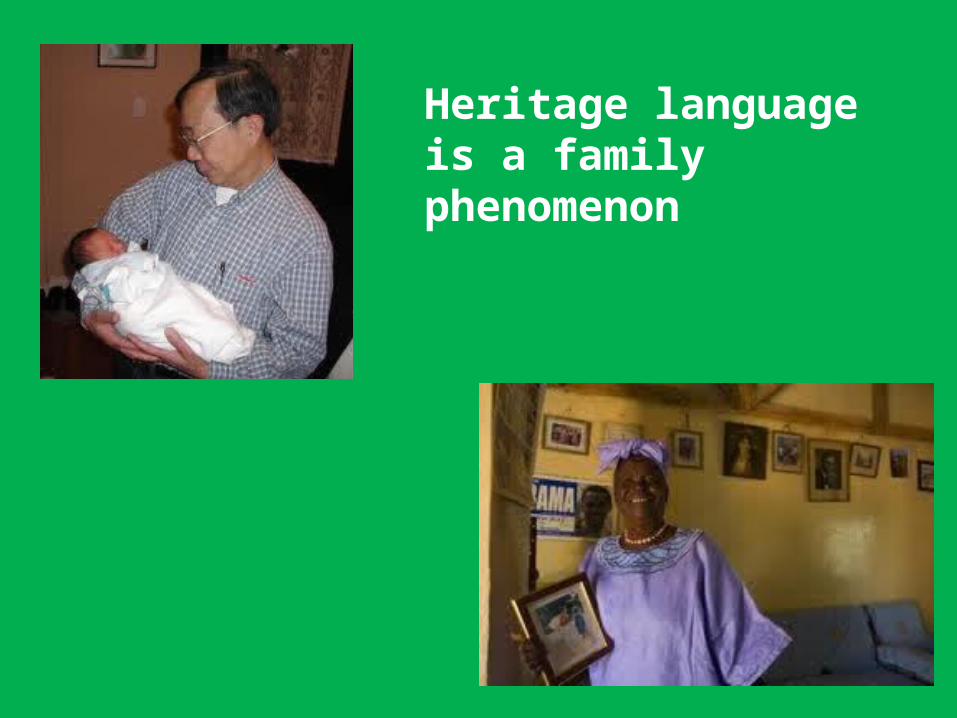
Heritage language is a family phenomenon


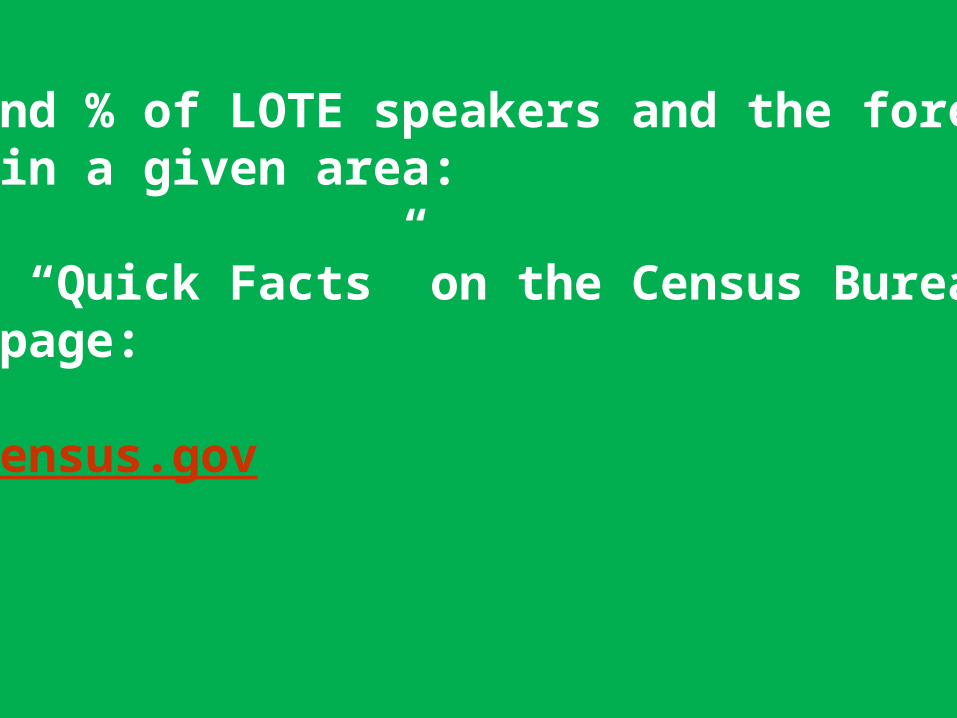
To find % of LOTE speakers and the foreign- born in a given area:
Go to “Quick Facts” on the Census Bureau’s home page:
www.census.gov
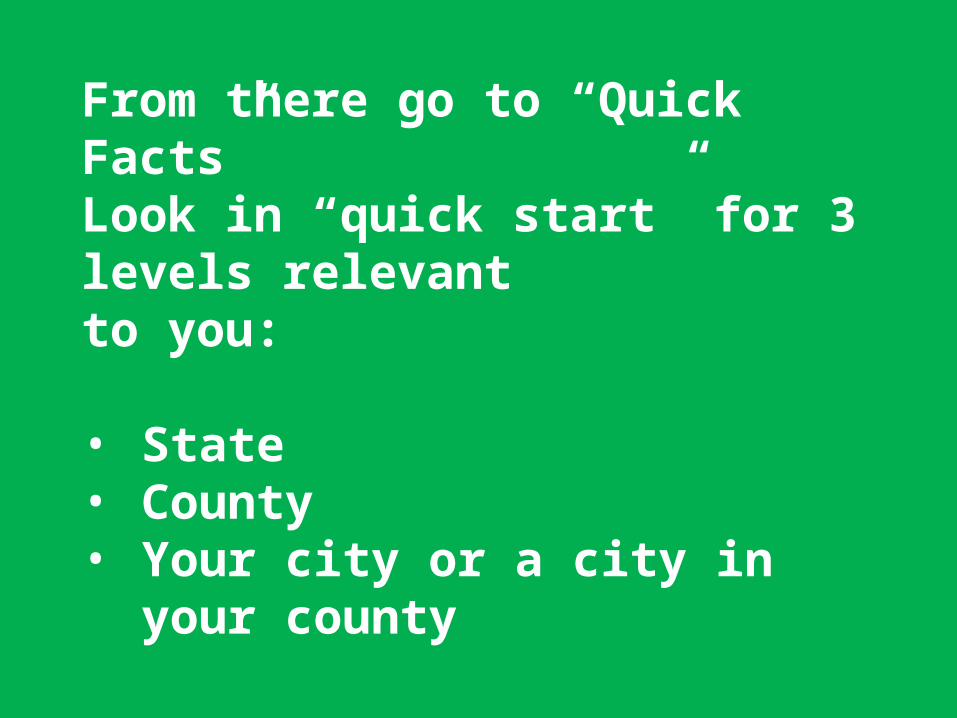
From there go to “Quick Facts”Look in “quick start” for 3 levels relevantto you:
• State• County• Your city or a city in your county
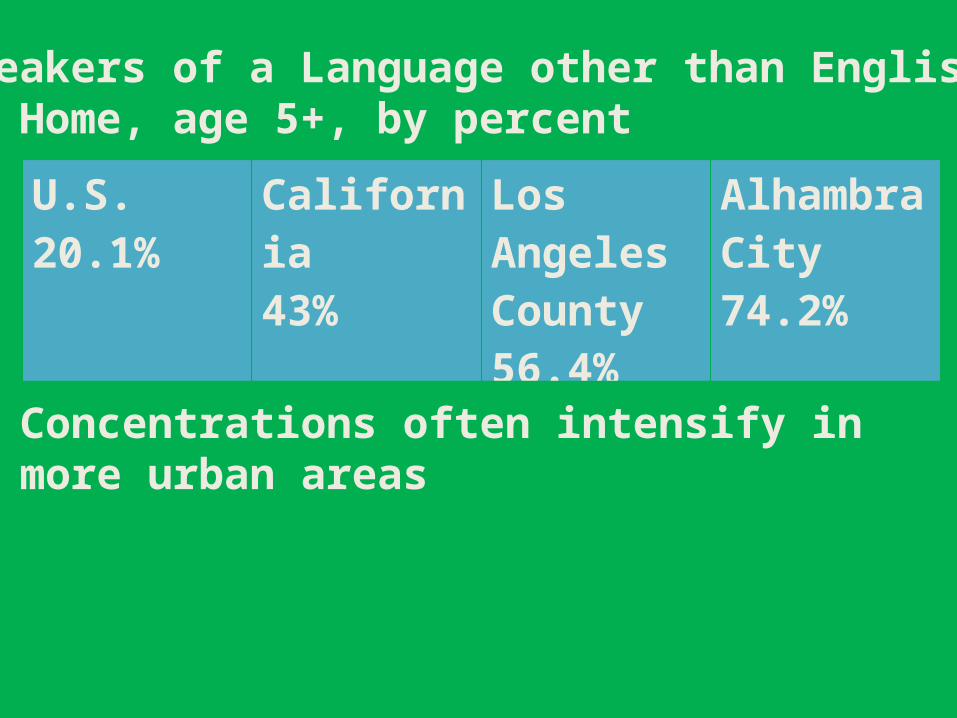
Speakers of a Language other than English at Home, age 5+, by percent
U.S. 20.1%
California43%
Los Angeles County 56.4%
Alhambra City 74.2%
Concentrations often intensify in more urban areas
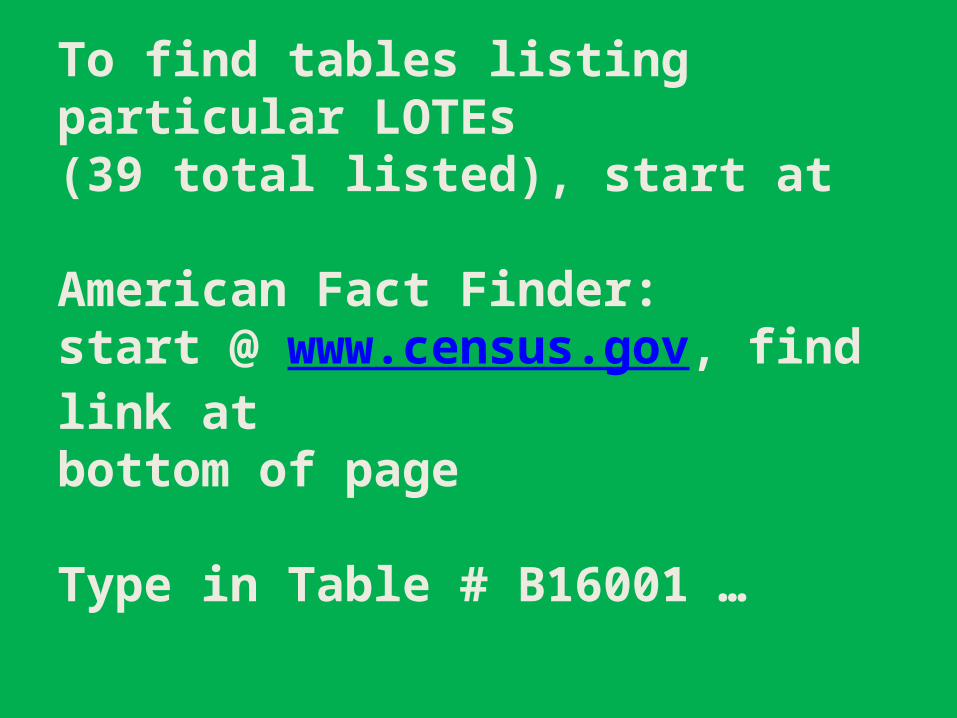
To find tables listing particular LOTEs(39 total listed), start at
American Fact Finder:start @ www.census.gov, find link at bottom of page
Type in Table # B16001 …

African languagesArabicArmenianChineseFrench (incl. Patois, Cajun)French CreoleGermanGreekGujaratiHebrewHindiHmongHungarianItalianJapaneseKoreanLaotianMon-Khmer, CambodianNavajoPersian
PolishPortuguese or Portuguese CreoleRussianScandinavian languagesSerbo-CroatianSpanish or Spanish CreoleSpeak only EnglishTagalogThaiUrduVietnameseYiddishOther Asian languagesOther Indic languagesOther Indo-European languagesOther Native North American languagesOther Pacific Island languages
39 Languages/groups Included in Table B16001:
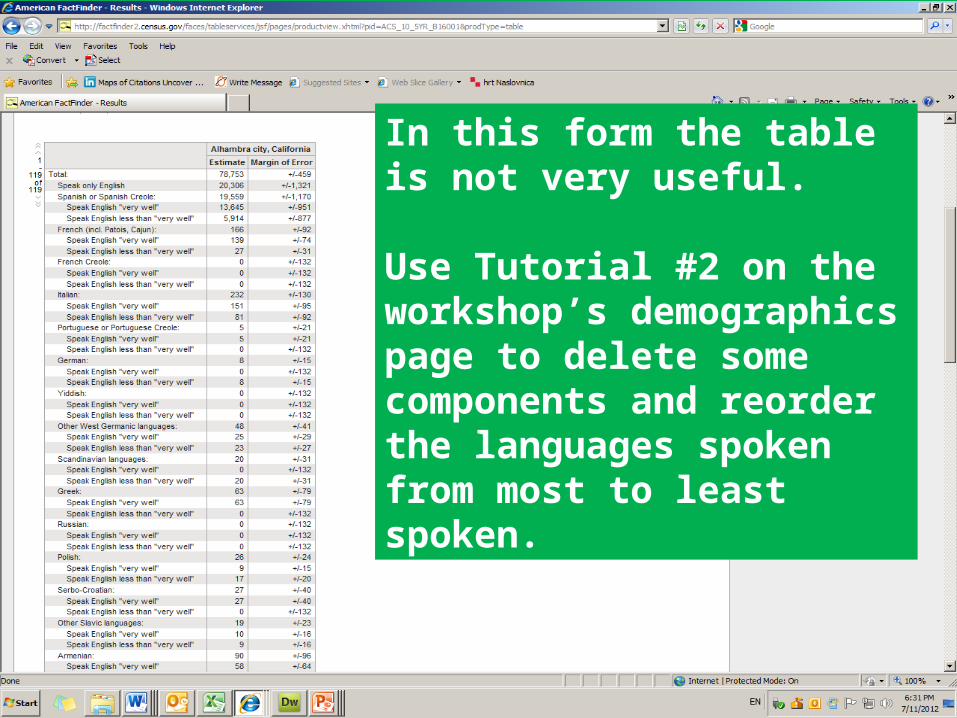
In this form the table is not very useful.
Use Tutorial #2 on the workshop’s demographics page to delete some components and reorder the languages spoken from most to least spoken.
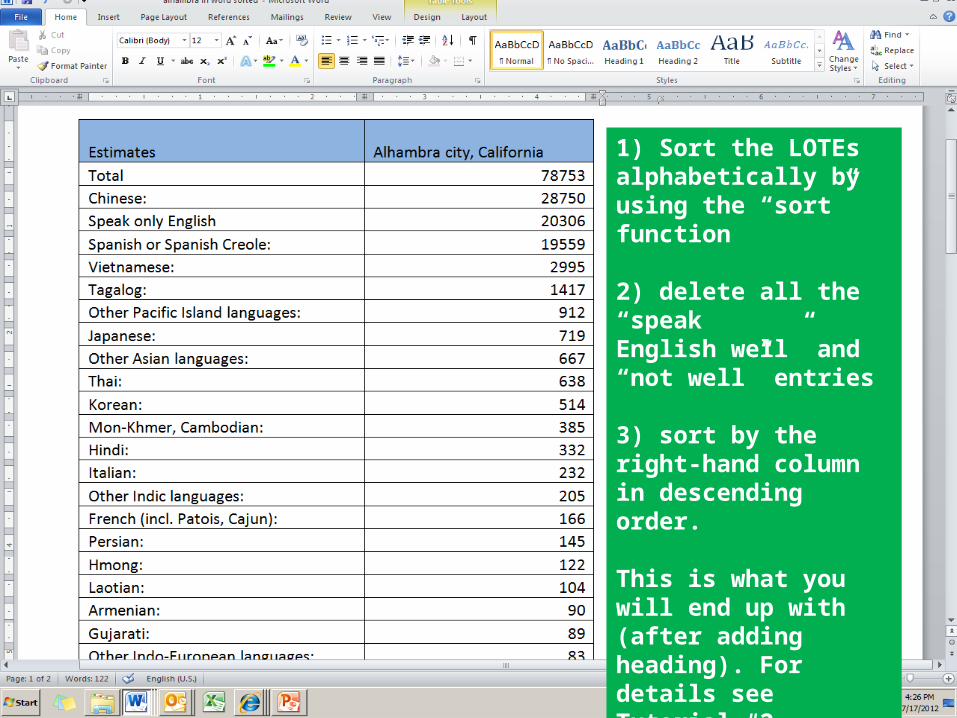
1) Sort the LOTEs alphabetically by using the “sort” function
2) delete all the “speakEnglish well” and “not well” entries
3) sort by the right-hand column in descending order.
This is what you will end up with (after adding heading). For details see Tutorial #2.
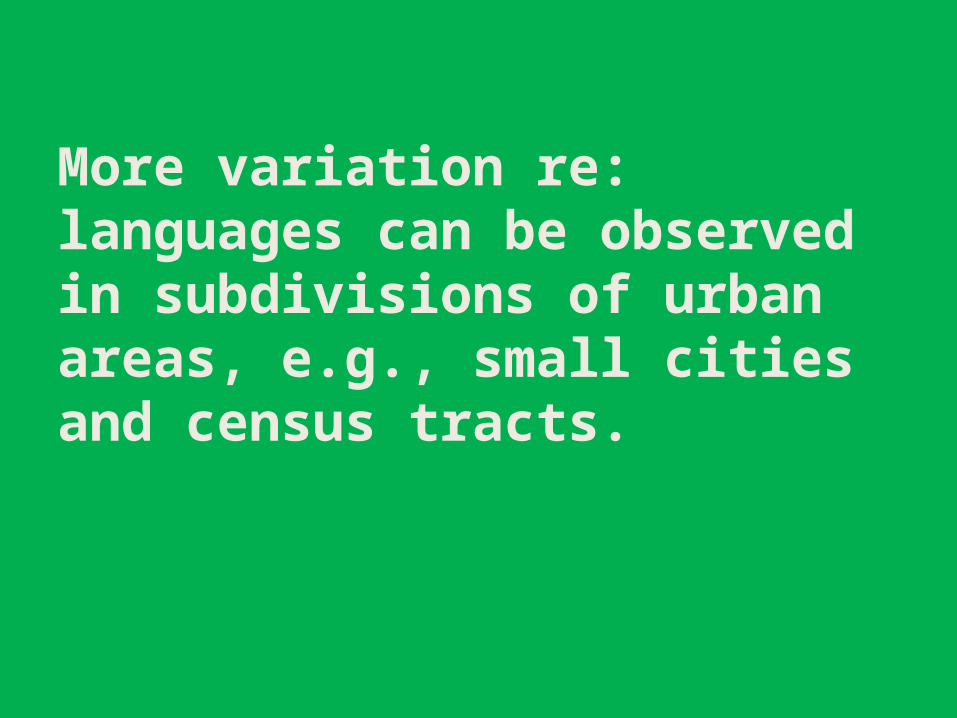
More variation re: languages can be observed in subdivisions of urban areas, e.g., small cities and census tracts.
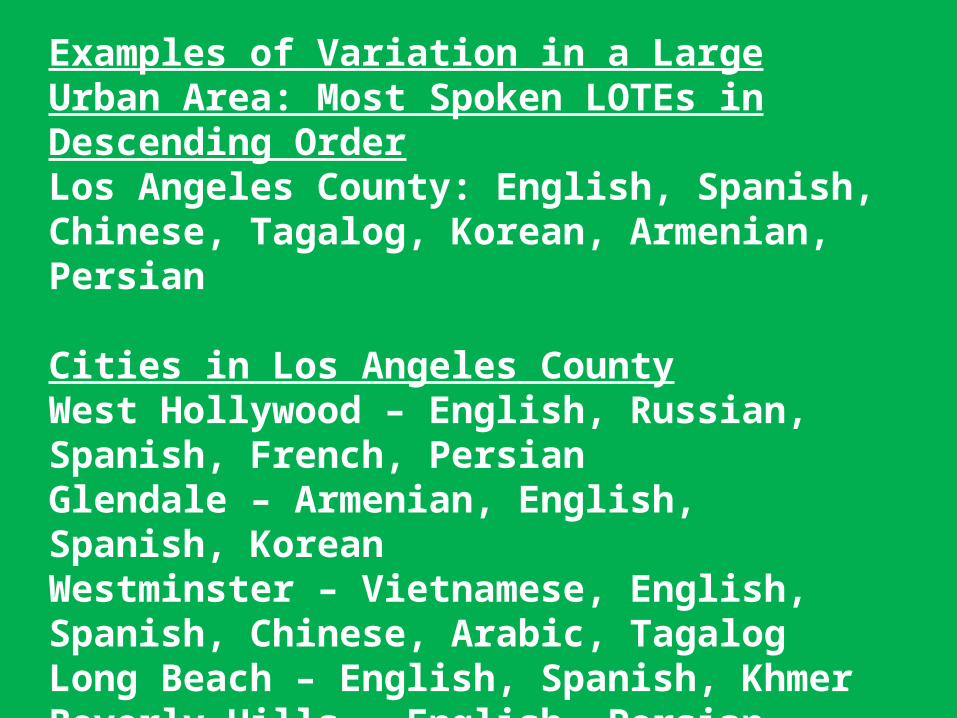
Examples of Variation in a Large Urban Area: Most Spoken LOTEs in Descending OrderLos Angeles County: English, Spanish, Chinese, Tagalog, Korean, Armenian, Persian Cities in Los Angeles CountyWest Hollywood – English, Russian, Spanish, French, Persian Glendale – Armenian, English, Spanish, Korean Westminster – Vietnamese, English, Spanish, Chinese, Arabic, TagalogLong Beach – English, Spanish, KhmerBeverly Hills – English, Persian, Spanish, HebrewAlhambra – Chinese, English, Spanish, Vietnamese
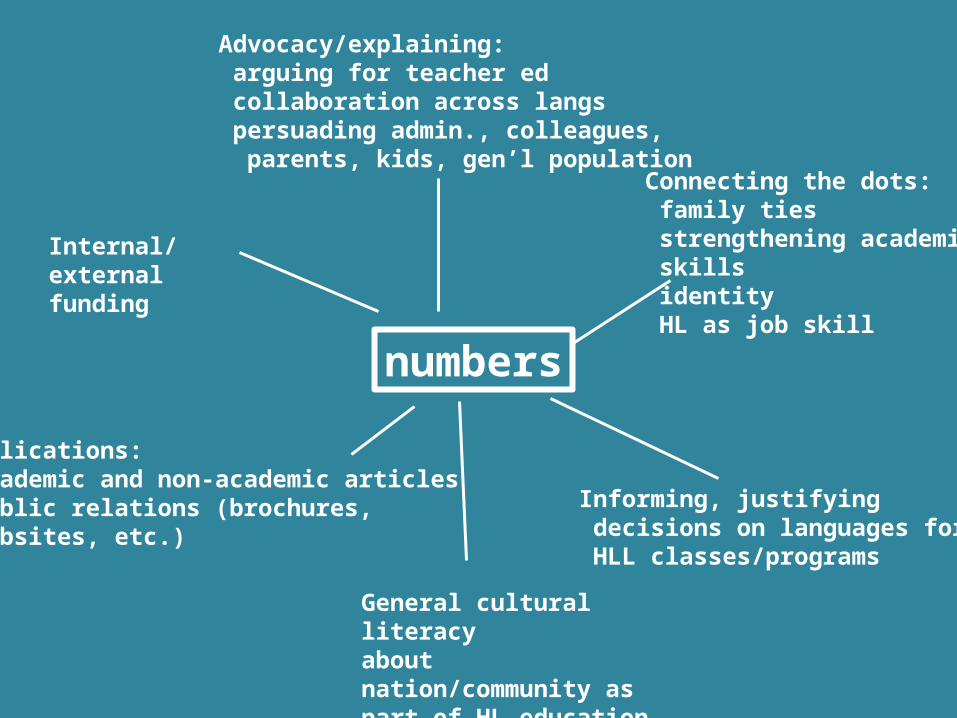
numbers
Connecting the dots: family ties strengthening academic skills identity HL as job skill
Advocacy/explaining: arguing for teacher ed collaboration across langs persuading admin., colleagues, parents, kids, gen’l population
Internal/external funding
Publications: academic and non-academic articles public relations (brochures, websites, etc.)
Informing, justifying decisions on languages for HLL classes/programs
General cultural literacyabout nation/community aspart of HL education
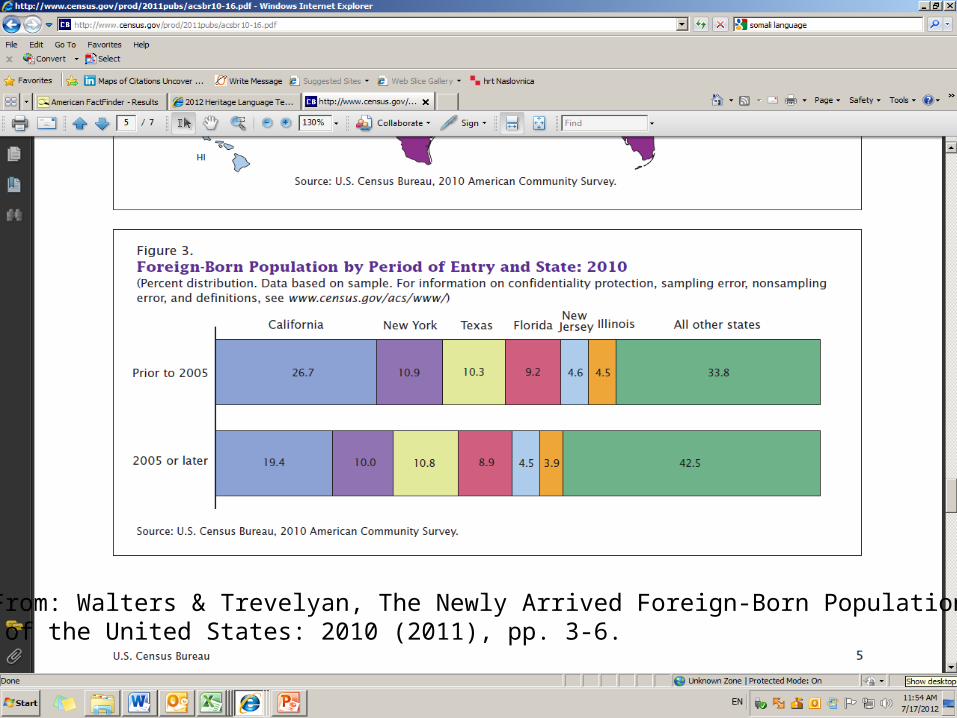
From: Walters & Trevelyan, The Newly Arrived Foreign-Born Population of the United States: 2010 (2011), pp. 3-6.

About the future (from Walters & Trevelyan (2011)):
“The data indicate that newer immigrants may be choosing to reside in locations beyond the traditional ‘gateway’ states and increasingly settling in states with smaller foreign-born populations not typically viewed as major immigrant destinations.

“…. Of the six traditional gateway states, three (California, Illinois, and New York) had a lower proportion of recent entrants than the national average ….
Several states with histories of lighter immigration had consider ably higher proportions of recent entrants.”
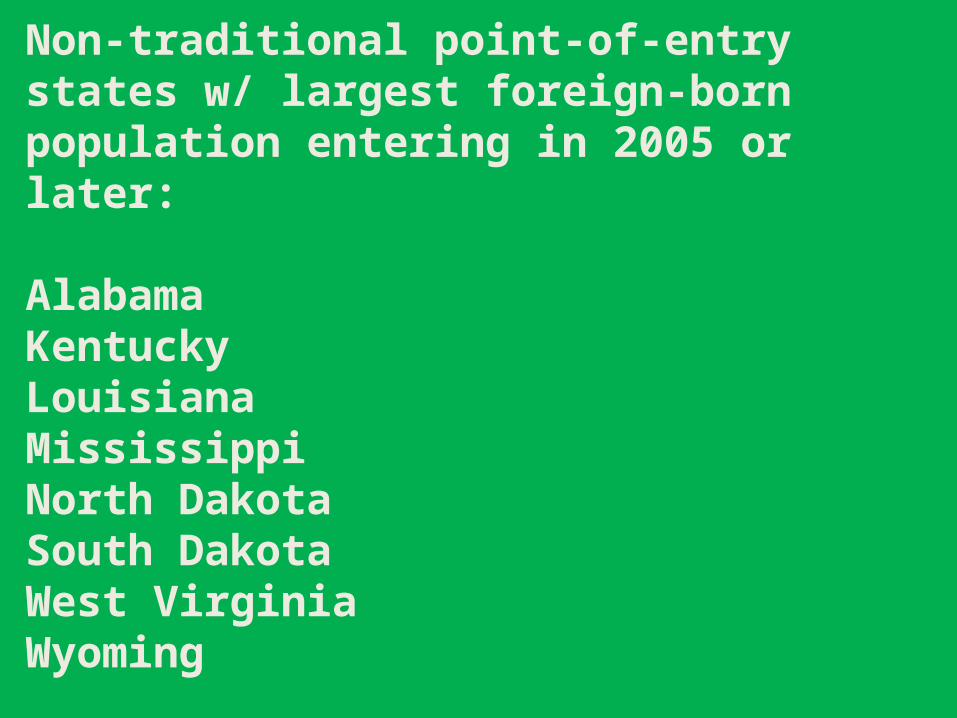
Non-traditional point-of-entry states w/ largest foreign-born population entering in 2005 or later:
Alabama Kentucky Louisiana MississippiNorth Dakota South Dakota West Virginia Wyoming
Walters & Trevelyan, The Newly Arrived Foreign-Born Population of the United States: 2010 (2011), pp. 3-6. http://www.census.gov/prod/2011pubs/ acsbr10-16.pdf

Continuing robust immigration, including movement into non-traditional “gateway” states, may suggest the need for expanded and increased HL education

For Information: see NHLRC’s Demographics Page:
(search/find from nhlrc.ucla.edu)
has tutorials and links to U.S. Census Bureau pages, Table numbers, and other information