Finding and communcating the story in complex data streams - Lesson 4 of 6
55
Finding and Communica-ng the Story – Lesson 4 of 6 – Complex Data Ray Poynter, 2016 Finding and Communica-ng the Story Lesson 4 of 6 Working with Complex Data Streams Ray Poynter July 2016
-
Upload
ray-poynter -
Category
Education
-
view
218 -
download
1
Transcript of Finding and communcating the story in complex data streams - Lesson 4 of 6
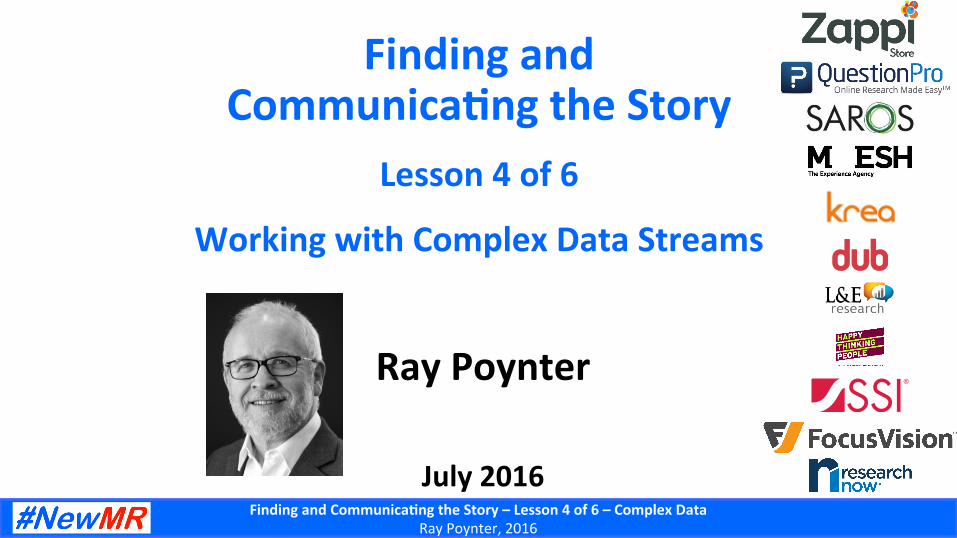
Finding and Communica-ng the Story – Lesson 4 of 6 – Complex Data Ray Poynter, 2016
Finding and Communica-ng the Story
Lesson 4 of 6
Working with Complex Data Streams
Ray Poynter
July 2016
Finding and Communica-ng the Story – Lesson 4 of 6 – Complex Data Ray Poynter, 2016
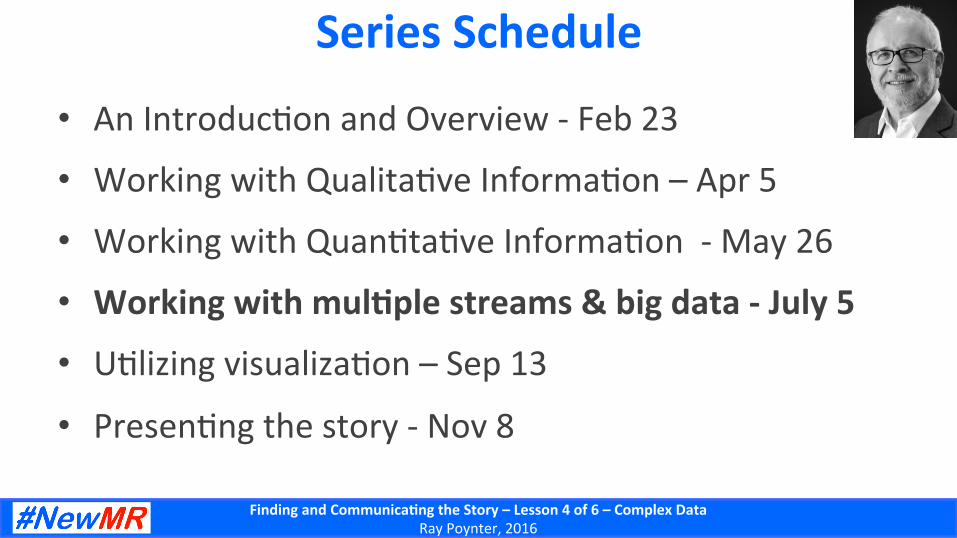
Series Schedule
• An Introduc5on and Overview -‐ Feb 23 • Working with Qualita5ve Informa5on – Apr 5
• Working with Quan5ta5ve Informa5on -‐ May 26
• Working with mul-ple streams & big data -‐ July 5
• U5lizing visualiza5on – Sep 13 • Presen5ng the story -‐ Nov 8
Finding and Communica-ng the Story – Lesson 4 of 6 – Complex Data Ray Poynter, 2016
Agenda
• Brief recap • Complex data and its implica5ons
• Example from measuring social media
• Working with big and complex data
• Strategies for finding the story in the data
Finding and Communica-ng the Story – Lesson 4 of 6 – Complex Data Ray Poynter, 2016
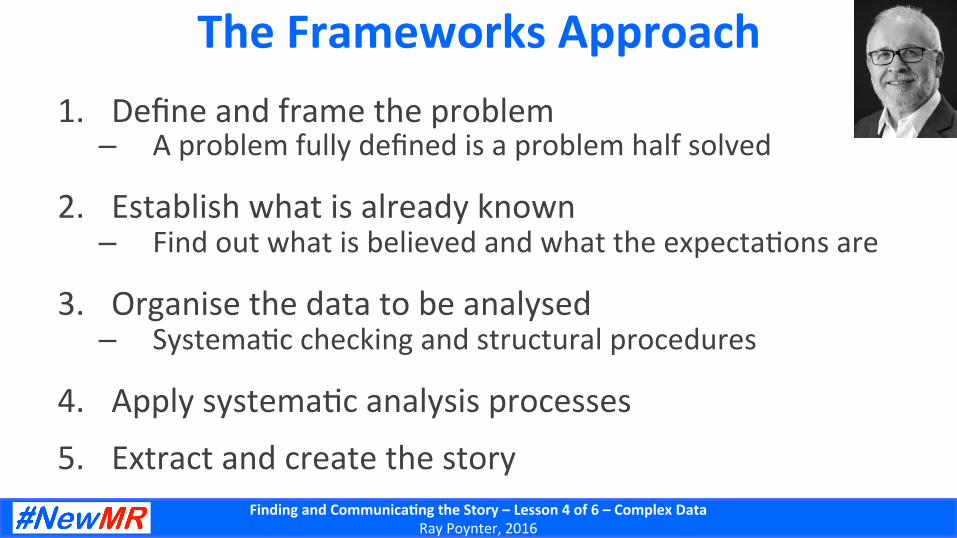
The Frameworks Approach 1. Define and frame the problem – A problem fully defined is a problem half solved
2. Establish what is already known – Find out what is believed and what the expecta5ons are
3. Organise the data to be analysed – Systema5c checking and structural procedures
4. Apply systema5c analysis processes
5. Extract and create the story
Finding and Communica-ng the Story – Lesson 4 of 6 – Complex Data Ray Poynter, 2016
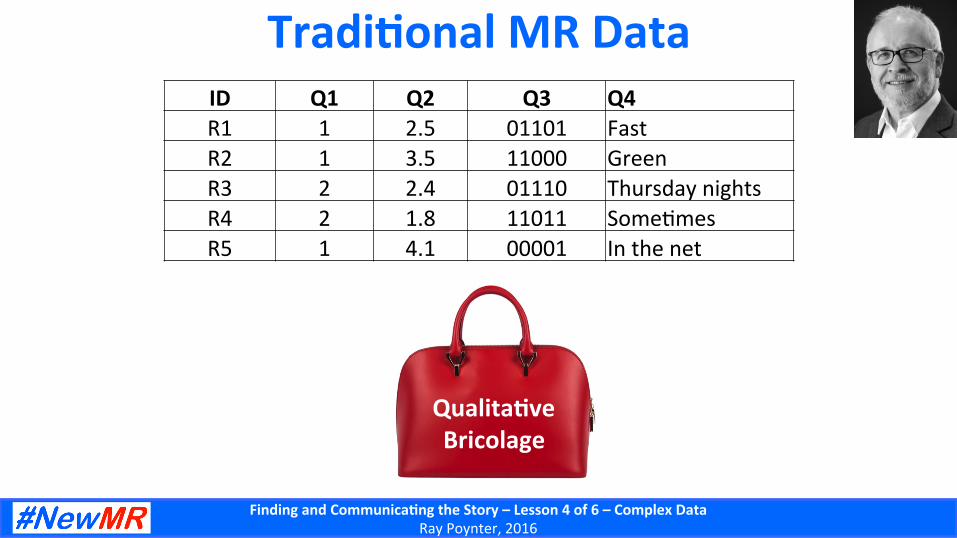
Tradi-onal MR Data ID Q1 Q2 Q3 Q4 R1 1 2.5 01101 Fast R2 1 3.5 11000 Green R3 2 2.4 01110 Thursday nights R4 2 1.8 11011 Some5mes R5 1 4.1 00001 In the net
Qualita-ve Bricolage

Finding and Communica-ng the Story – Lesson 4 of 6 – Complex Data Ray Poynter, 2016
Finding and Communica-ng the Story – Lesson 4 of 6 – Complex Data Ray Poynter, 2016
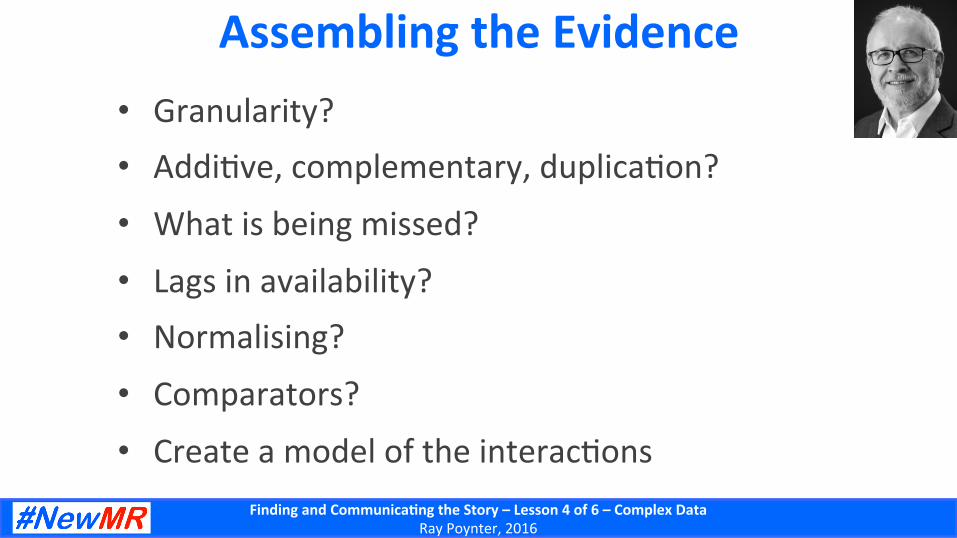
Assembling the Evidence • Granularity? • Addi5ve, complementary, duplica5on?
• What is being missed?
• Lags in availability? • Normalising?
• Comparators?
• Create a model of the interac5ons
Finding and Communica-ng the Story – Lesson 4 of 6 – Complex Data Ray Poynter, 2016
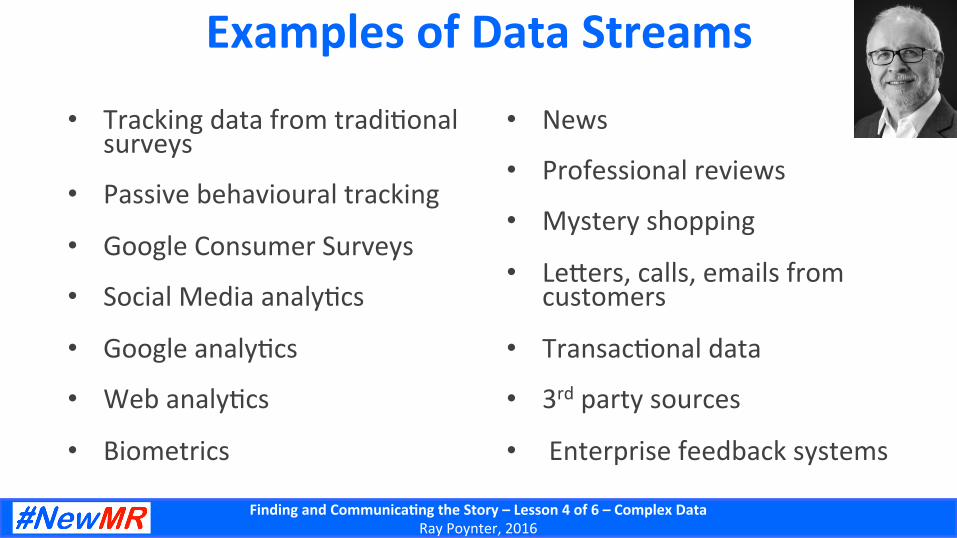
Examples of Data Streams
• Tracking data from tradi5onal surveys
• Passive behavioural tracking
• Google Consumer Surveys
• Social Media analy5cs
• Google analy5cs
• Web analy5cs
• Biometrics
• News
• Professional reviews
• Mystery shopping
• Le\ers, calls, emails from customers
• Transac5onal data
• 3rd party sources
• Enterprise feedback systems
Finding and Communica-ng the Story – Lesson 4 of 6 – Complex Data Ray Poynter, 2016
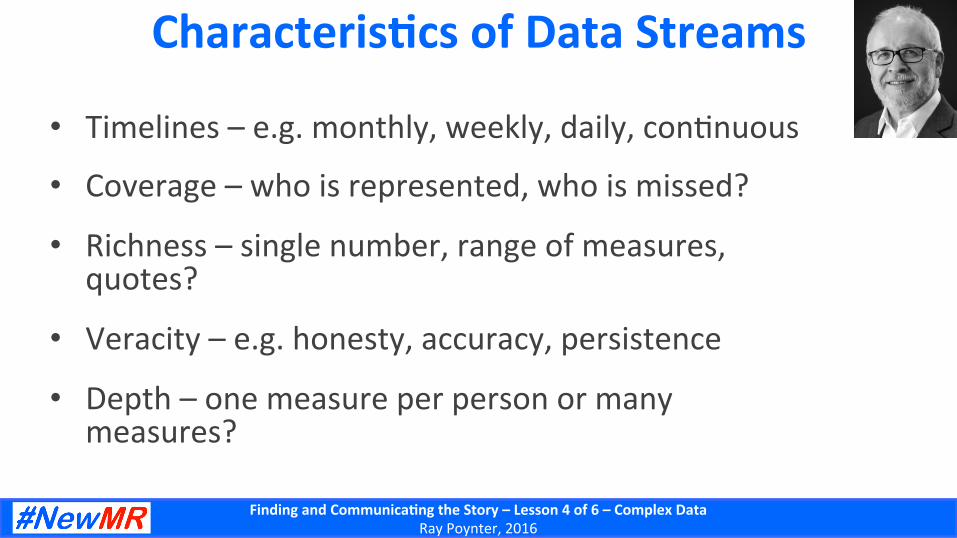
Characteris-cs of Data Streams
• Timelines – e.g. monthly, weekly, daily, con5nuous
• Coverage – who is represented, who is missed?
• Richness – single number, range of measures, quotes?
• Veracity – e.g. honesty, accuracy, persistence • Depth – one measure per person or many
measures?
Finding and Communica-ng the Story – Lesson 4 of 6 – Complex Data Ray Poynter, 2016
Nate Silver & FiveThirtyEight
Finding and Communica-ng the Story – Lesson 4 of 6 – Complex Data Ray Poynter, 2016
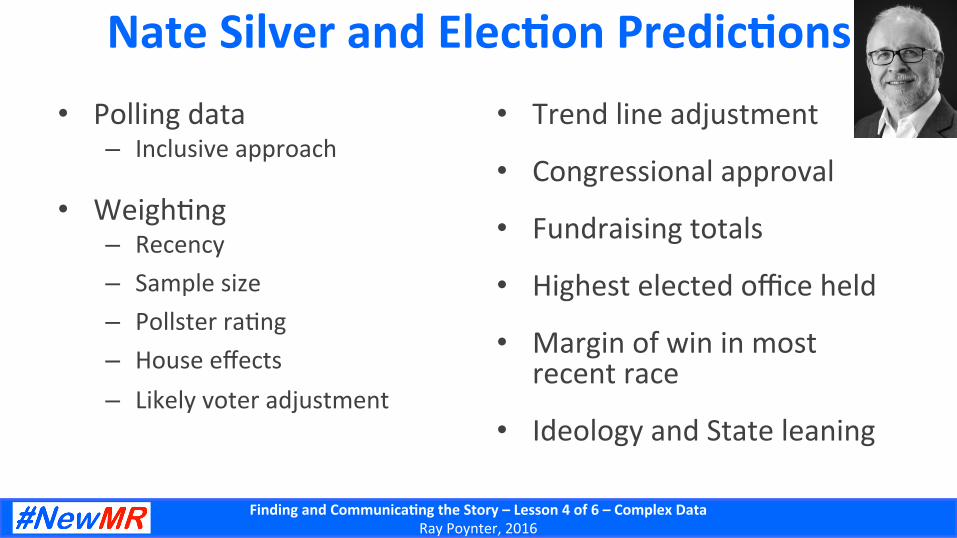
Nate Silver and Elec-on Predic-ons • Polling data
– Inclusive approach
• Weigh5ng – Recency – Sample size – Pollster ra5ng – House effects – Likely voter adjustment
• Trend line adjustment
• Congressional approval • Fundraising totals • Highest elected office held
• Margin of win in most recent race
• Ideology and State leaning

Screenshot, 25 Feb, 2016

NBA Basketball
Screenshot 25 Feb, 2016
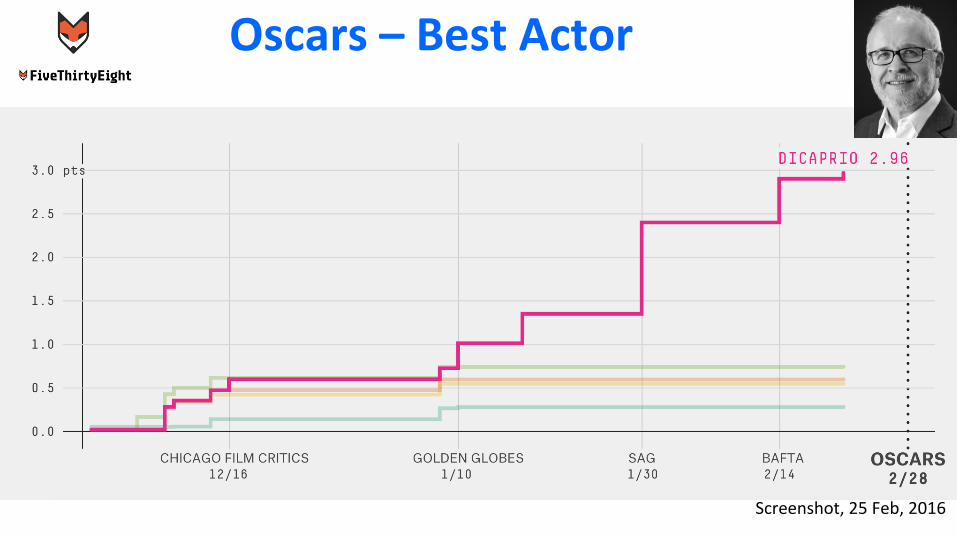
Oscars – Best Actor
Screenshot, 25 Feb, 2016

Finding and Communica-ng the Story – Lesson 4 of 6 – Complex Data Ray Poynter, 2016
Evalua-ng SM Campaigns
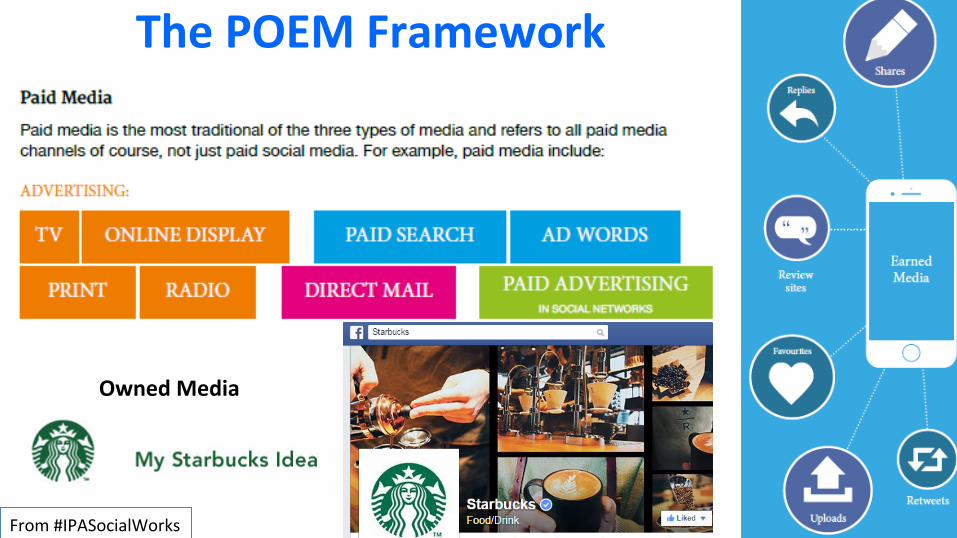
The POEM Framework
Owned Media
From #IPASocialWorks
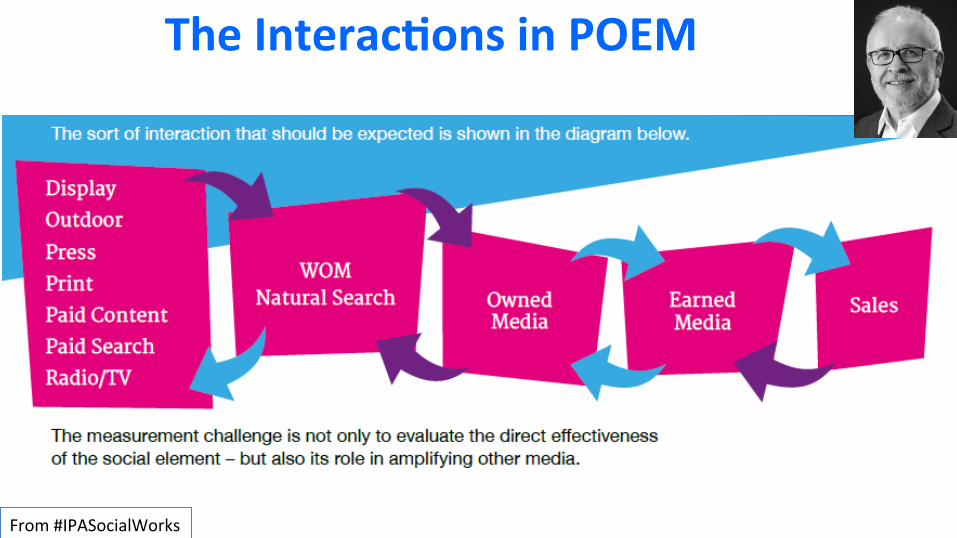
The Interac-ons in POEM
From #IPASocialWorks
Finding and Communica-ng the Story – Lesson 4 of 6 – Complex Data Ray Poynter, 2016
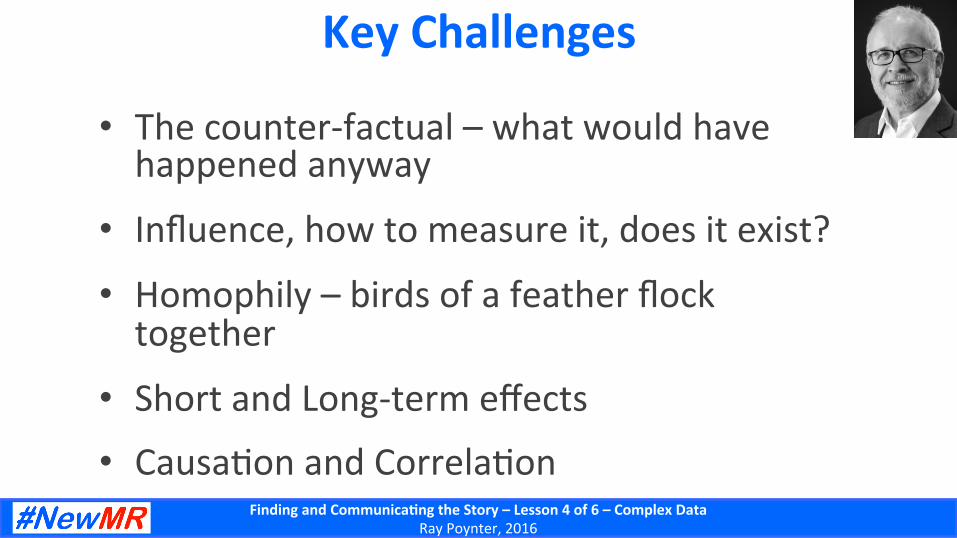
Key Challenges
• The counter-‐factual – what would have happened anyway
• Influence, how to measure it, does it exist?
• Homophily – birds of a feather flock together
• Short and Long-‐term effects
• Causa5on and Correla5on

Finding and Communica-ng the Story – Lesson 4 of 6 – Complex Data Ray Poynter, 2016
Influence and Homophily Type of Market
Influence
Target influencers
Homphily
Target people like buyers

Finding and Communica-ng the Story – Lesson 4 of 6 – Complex Data Ray Poynter, 2016
Short and Long-‐term Effects • Social is very good at measuring short-‐term effects
• The micro-‐objec5ves are oeen ac5va5on events: – Downloads, registra5ons, plays, trial, purchase etc.
• But, long-‐term effects are oeen more important to brand value and price elas5city
• Without short-‐term effects there is usually no long-‐term – But long-‐term effects are not just the sum of the short-‐term effects

Finding and Communica-ng the Story – Lesson 4 of 6 – Complex Data Ray Poynter, 2016
Evalua-on Methods & Approaches
From #IPASocialWorks
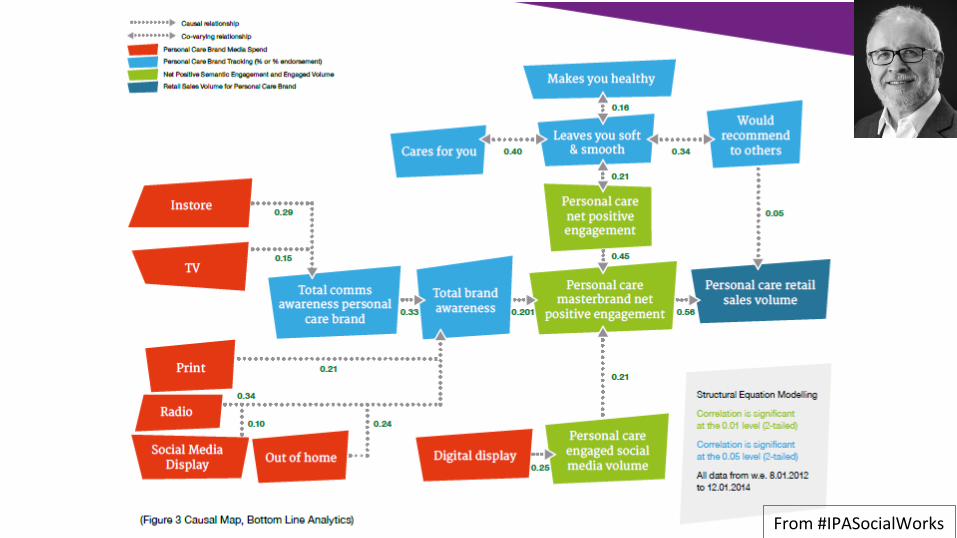
From #IPASocialWorks

Finding and Communica-ng the Story – Lesson 4 of 6 – Complex Data Ray Poynter, 2016
What is the impact of social? Region A – T1 sales = 100 – T2, TV, sales = 110 – T3, TV & Twi\er, sales = 130
Region B – T1, sales 100 – T2, Twi\er, sales = 110 – T3, TV & Twi\ers, sales = 130
Finding and Communica-ng the Story – Lesson 4 of 6 – Complex Data Ray Poynter, 2016
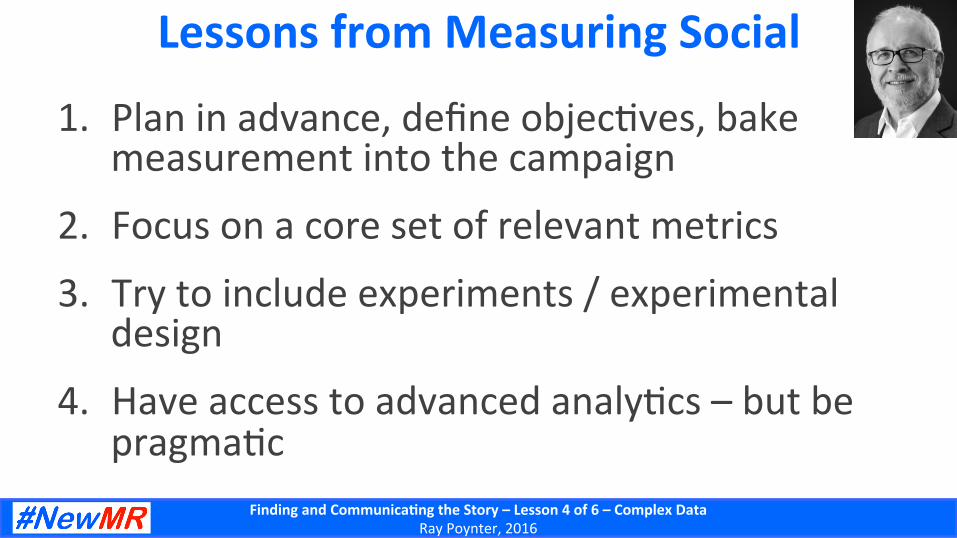
Lessons from Measuring Social
1. Plan in advance, define objec5ves, bake measurement into the campaign
2. Focus on a core set of relevant metrics
3. Try to include experiments / experimental design
4. Have access to advanced analy5cs – but be pragma5c

IBM’s four Vs
Finding and Communica-ng the Story – Lesson 4 of 6 – Complex Data Ray Poynter, 2016
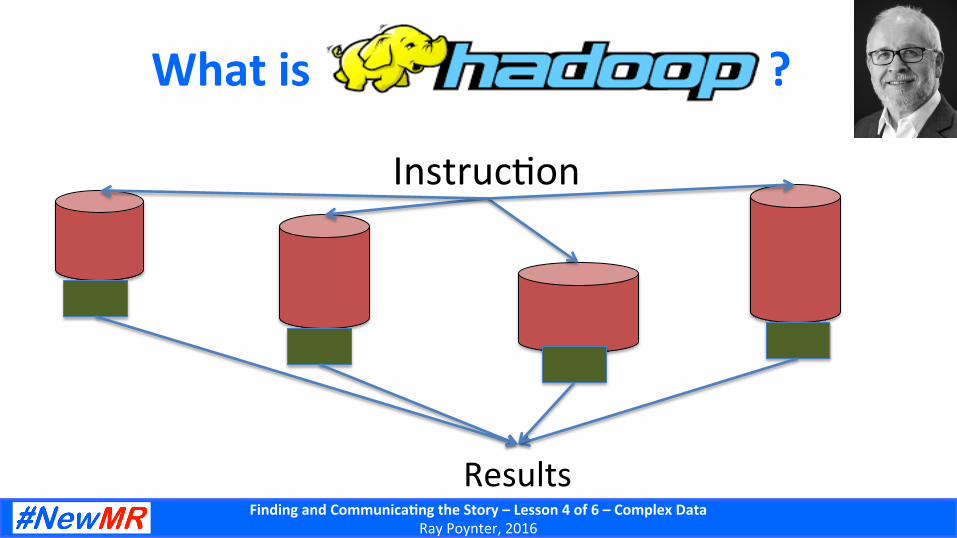
What is ?
Instruc5on
Results
Finding and Communica-ng the Story – Lesson 4 of 6 – Complex Data Ray Poynter, 2016
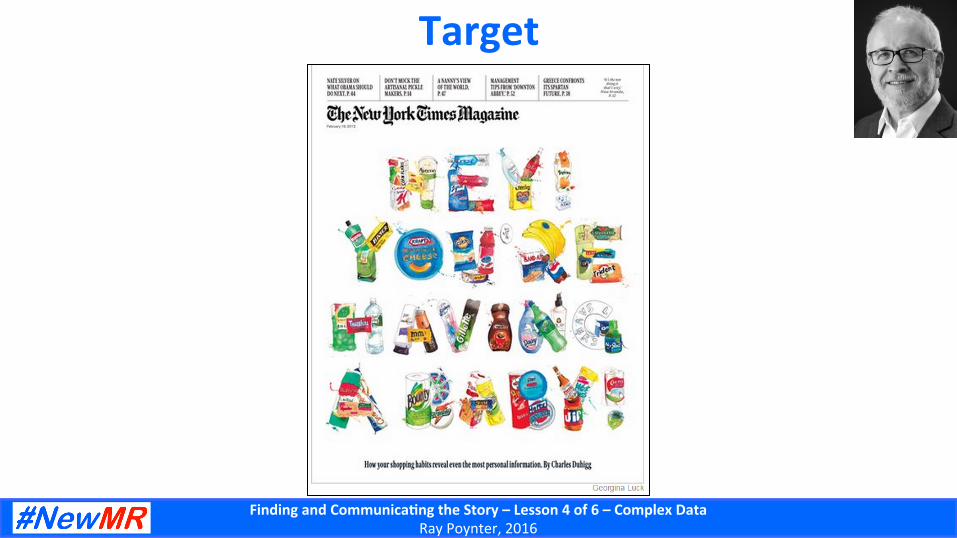
Target
Finding and Communica-ng the Story – Lesson 4 of 6 – Complex Data Ray Poynter, 2016
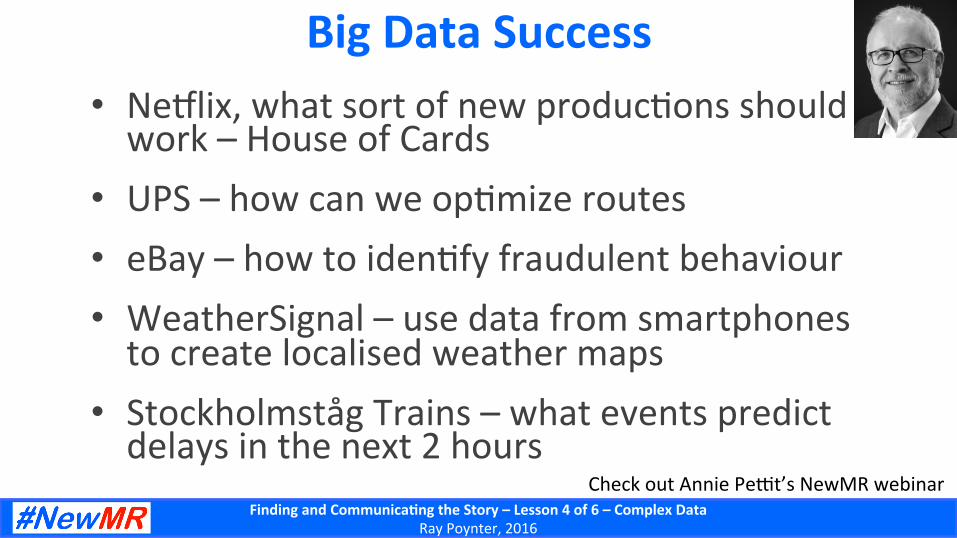
Big Data Success • Nejlix, what sort of new produc5ons should work – House of Cards
• UPS – how can we op5mize routes • eBay – how to iden5fy fraudulent behaviour • WeatherSignal – use data from smartphones to create localised weather maps
• Stockholmståg Trains – what events predict delays in the next 2 hours
Check out Annie Pelt’s NewMR webinar
Finding and Communica-ng the Story – Lesson 4 of 6 – Complex Data Ray Poynter, 2016
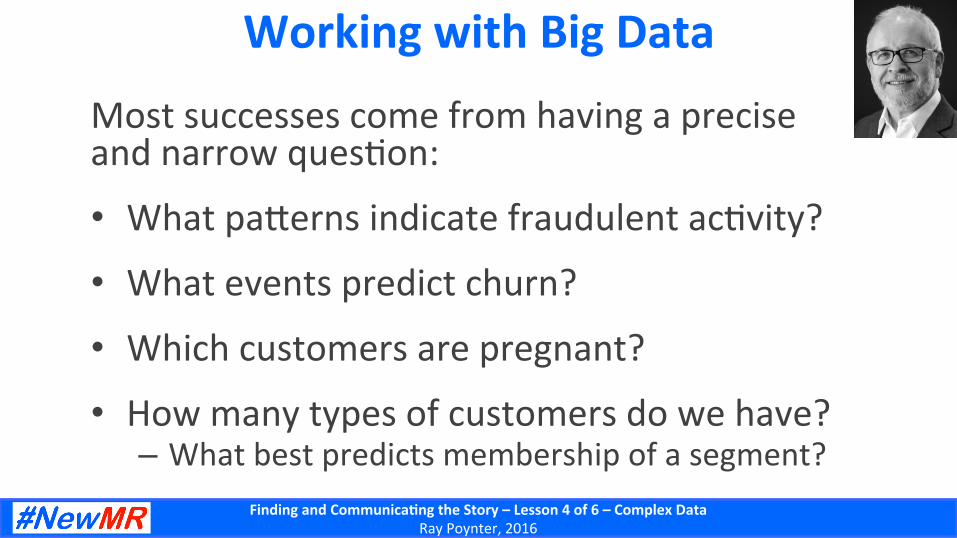
Working with Big Data
Most successes come from having a precise and narrow ques5on:
• What pa\erns indicate fraudulent ac5vity?
• What events predict churn?
• Which customers are pregnant?
• How many types of customers do we have? – What best predicts membership of a segment?
Finding and Communica-ng the Story – Lesson 4 of 6 – Complex Data Ray Poynter, 2016
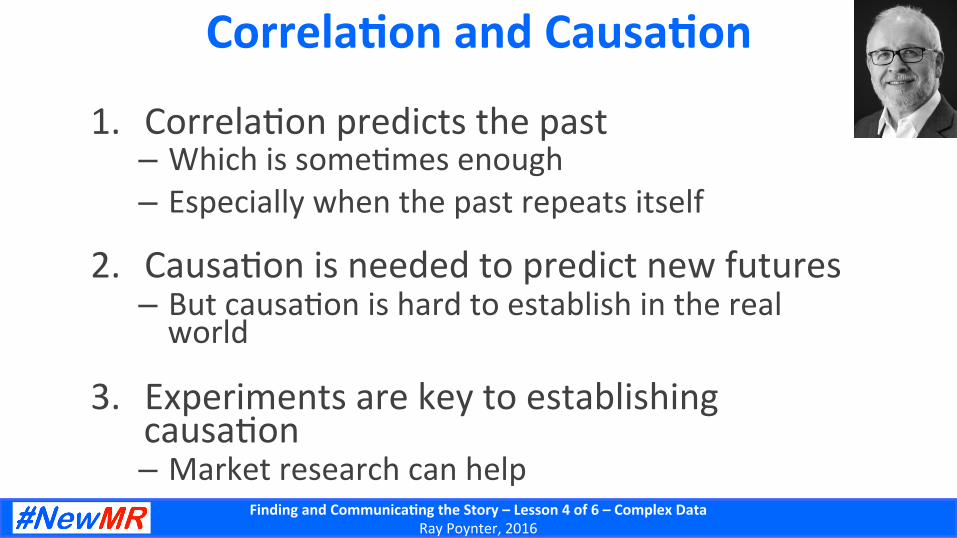
Correla-on and Causa-on
1. Correla5on predicts the past – Which is some5mes enough – Especially when the past repeats itself
2. Causa5on is needed to predict new futures – But causa5on is hard to establish in the real world
3. Experiments are key to establishing causa5on – Market research can help
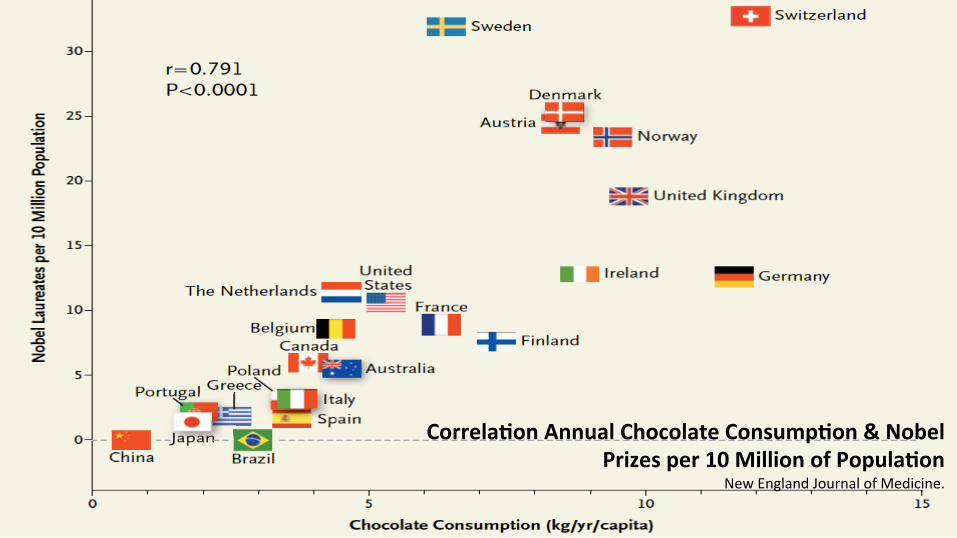
Correla-on Annual Chocolate Consump-on & Nobel Prizes per 10 Million of Popula-on
New England Journal of Medicine.
Finding and Communica-ng the Story – Lesson 4 of 6 – Complex Data Ray Poynter, 2016
Iden-fy the Counterfactual
• What would have happened without the campaign/ac5vity?
• Projec5ons/forecasts • Year-‐on-‐year figures • A/B tests
Finding and Communica-ng the Story – Lesson 4 of 6 – Complex Data Ray Poynter, 2016
Make Predic-ons
Post hoc reasoning when supported by masses of data can support the crea5on of almost any point of view
Genera5ng predic5ons before the campaign – As well as targets – Provides a framework for finding out why the predic5ons were wrong (and they usually are).

Finding and Communica-ng the Story – Lesson 4 of 6 – Complex Data Ray Poynter, 2016
Using Triangula-on
Triangula5on means using mul5ple sources to see if they point the same way – Helps validate findings – Helps avoid embarrassing mistakes
Predic5on can be used with triangula5on to avoid simply describing pa\erns – For example, “If this finding about a decline in sa3sfac3on is true we expect churn to increase over the next three months.”
Finding and Communica-ng the Story – Lesson 4 of 6 – Complex Data Ray Poynter, 2016
Use Benchmarks Few metrics have absolute meaning – And the relevance of 1 million views or shares changes over 5me
So, benchmarks are essen5al – Within brand benchmark – Within plajorm benchmark – Within ver5cal benchmark – Within target group benchmark
Benchmarks highlight the need to make comparisons.
Finding and Communica-ng the Story – Lesson 4 of 6 – Complex Data Ray Poynter, 2016
Organising Complex Data • Define the problem
– What success looks like, a 5ghtly defined ques5on, ac5ons you wish to take
• Assess the characteris5cs of the data streams – Veracity, Granularity, What’s missing, Overlaps etc
• Filter, clean and transform the data • Find the answer
– Find the main story first and then the relevant excep5ons and details – Simplify models as much as possible, but no further (borrowing from Einstein)
– Use comparators to help communicate the answers – Create a compelling story – without focusing on the process or numbers
Finding and Communica-ng the Story – Lesson 4 of 6 – Complex Data Ray Poynter, 2016

Finding and Communica-ng the Story – Lesson 4 of 6 – Complex Data Ray Poynter, 2016

Finding and Communica-ng the Story – Lesson 4 of 6 – Complex Data Ray Poynter, 2016

Normalizing by Growth Pa`erns
Forbes: h\p://bit.ly/NewMR_208
Finding and Communica-ng the Story – Lesson 4 of 6 – Complex Data Ray Poynter, 2016
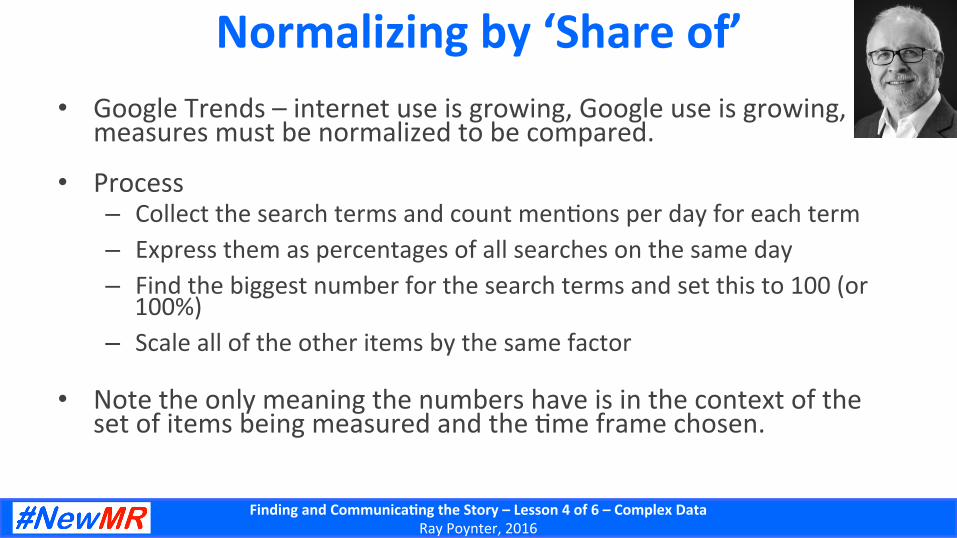
Normalizing by ‘Share of’ • Google Trends – internet use is growing, Google use is growing,
measures must be normalized to be compared.
• Process – Collect the search terms and count men5ons per day for each term – Express them as percentages of all searches on the same day – Find the biggest number for the search terms and set this to 100 (or
100%) – Scale all of the other items by the same factor
• Note the only meaning the numbers have is in the context of the set of items being measured and the 5me frame chosen.
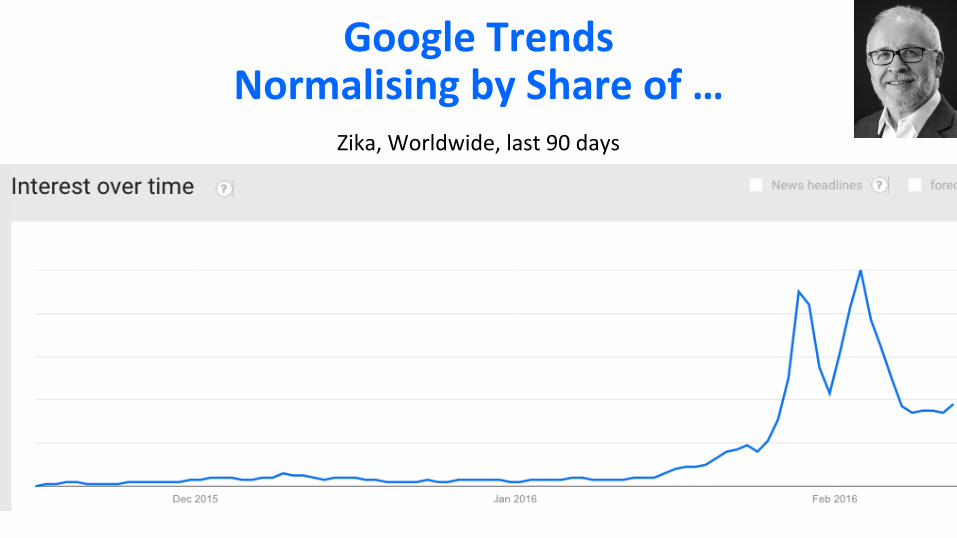
Google Trends Normalising by Share of …
Zika, Worldwide, last 90 days

Comparators
Finding and Communica-ng the Story – Lesson 4 of 6 – Complex Data Ray Poynter, 2016
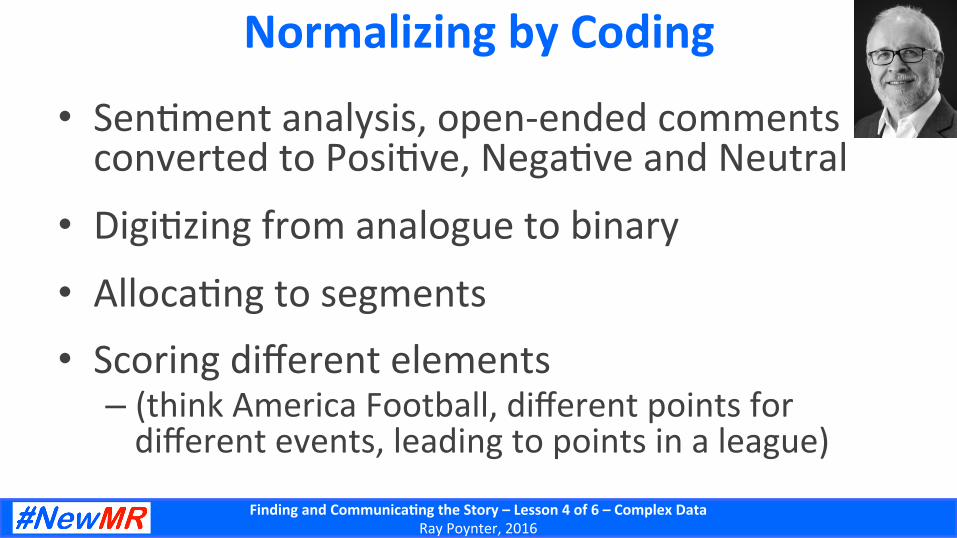
Normalizing by Coding
• Sen5ment analysis, open-‐ended comments converted to Posi5ve, Nega5ve and Neutral
• Digi5zing from analogue to binary
• Alloca5ng to segments • Scoring different elements – (think America Football, different points for different events, leading to points in a league)
Finding and Communica-ng the Story – Lesson 4 of 6 – Complex Data Ray Poynter, 2016
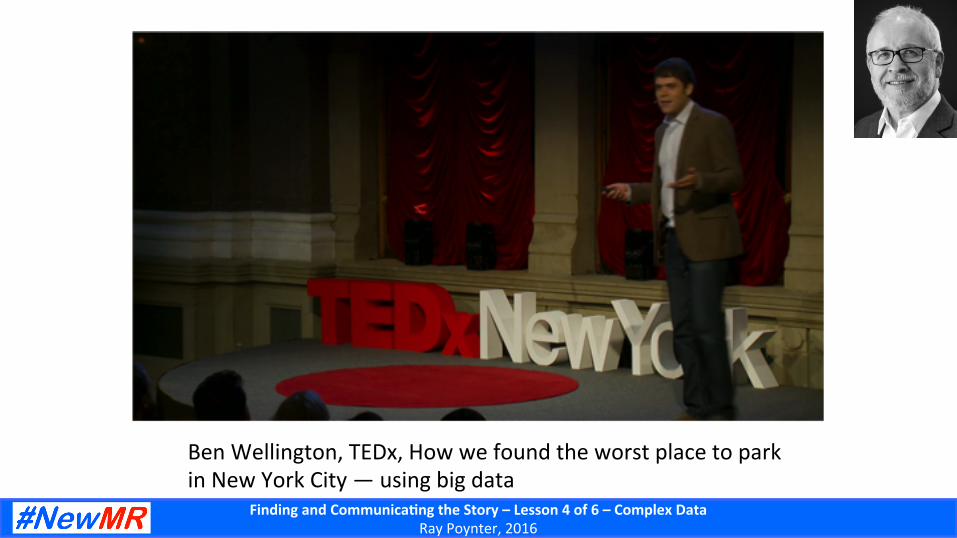
Ben Wellington, TEDx, How we found the worst place to park in New York City — using big data

Finding and Communica-ng the Story – Lesson 4 of 6 – Complex Data Ray Poynter, 2016
Finding and Communica-ng the Story – Lesson 4 of 6 – Complex Data Ray Poynter, 2016
Use the Business Ques-on as a Lens
The same data will deliver different stories, based on different business ques5ons
This is one of the reasons that industry reports have a less focused story – They have many readers, with different needs and ques5ons
The business ques5on defines what is in, what is out, and where the magnifica5on should be

Finding and Communica-ng the Story – Lesson 4 of 6 – Complex Data Ray Poynter, 2016
Find the Relevant Detail
Once you have the total story: – Are there people who have a different story (different from the main story)? • Who are these people? • What is their story? • Where are the differences? • Why are they different? • When do these differences ma\er, come into play?
Finding and Communica-ng the Story – Lesson 4 of 6 – Complex Data Ray Poynter, 2016
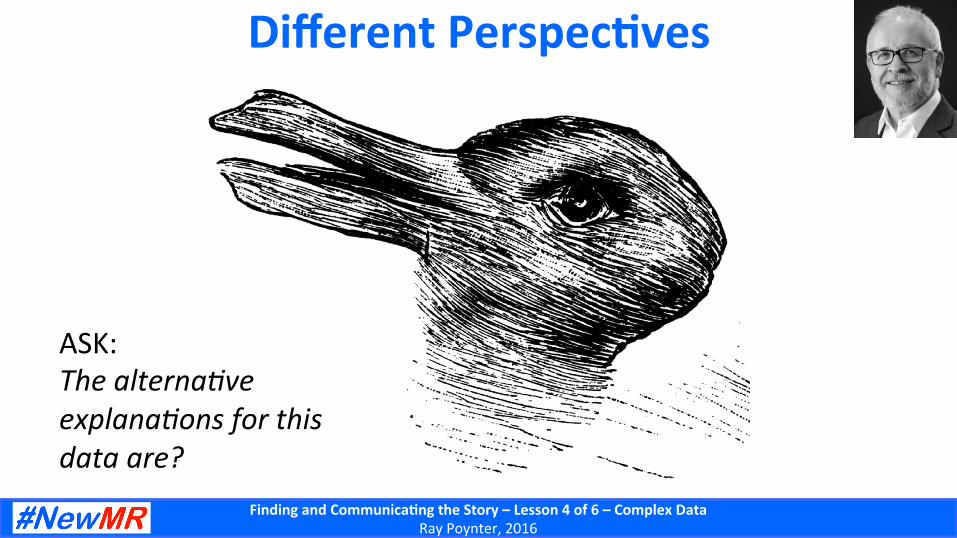
Different Perspec-ves
ASK: The alterna3ve explana3ons for this data are?
Finding and Communica-ng the Story – Lesson 4 of 6 – Complex Data Ray Poynter, 2016
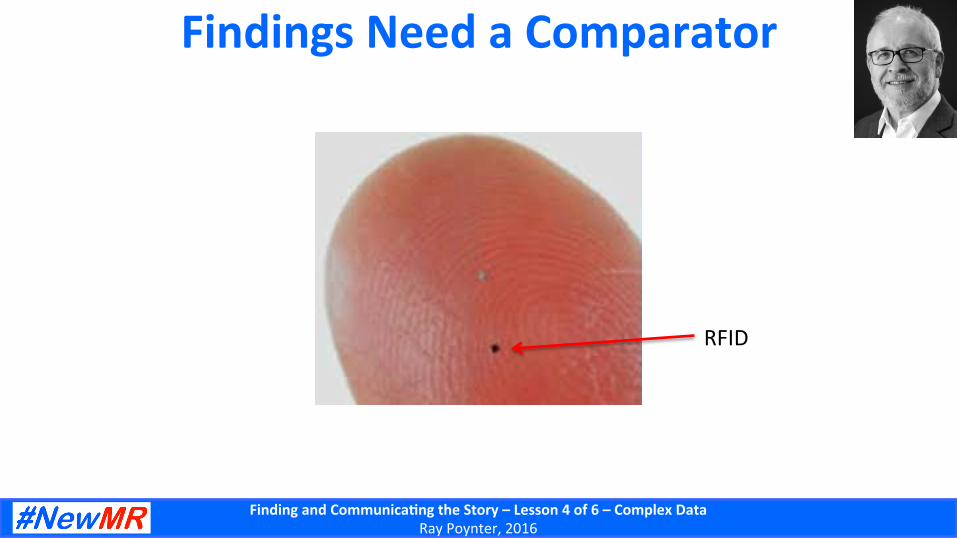
Findings Need a Comparator
RFID

Finding and Communica-ng the Story – Lesson 4 of 6 – Complex Data Ray Poynter, 2016
Bad news for men in Eastern Europe
Eurostat -‐ h\p://goo.gl/r2q526
Amenable Deaths Per 100000 of popula5on -‐ 2012
Finding and Communica-ng the Story – Lesson 4 of 6 – Complex Data Ray Poynter, 2016
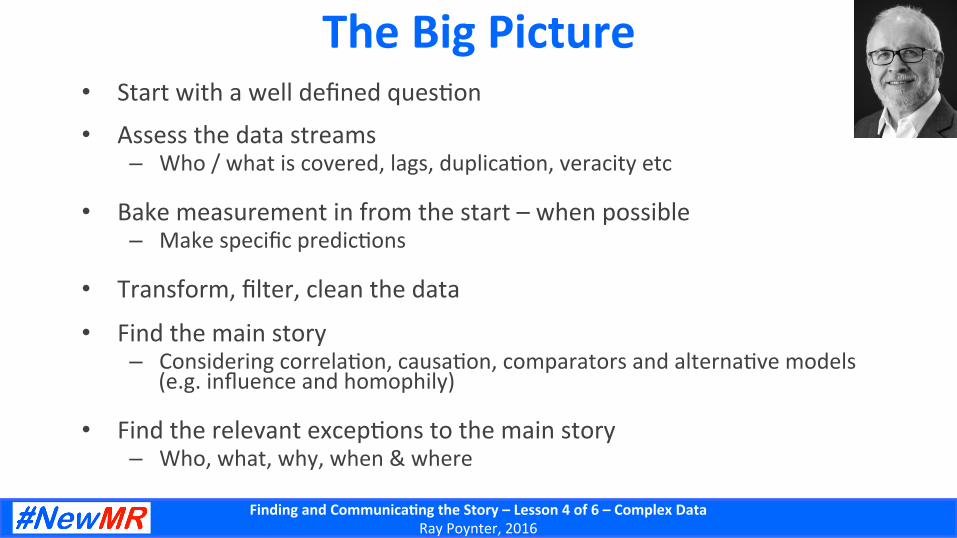
The Big Picture • Start with a well defined ques5on
• Assess the data streams – Who / what is covered, lags, duplica5on, veracity etc
• Bake measurement in from the start – when possible – Make specific predic5ons
• Transform, filter, clean the data
• Find the main story – Considering correla5on, causa5on, comparators and alterna5ve models
(e.g. influence and homophily)
• Find the relevant excep5ons to the main story – Who, what, why, when & where

Finding and Communica-ng the Story – Lesson 4 of 6 – Complex Data Ray Poynter, 2016
Thank You!
Follow me on Twi`er @RayPoynter
Or sign-‐up to receive our weekly mailing at h`p://NewMR.org

Finding and Communica-ng the Story – Lesson 4 of 6 – Complex Data Ray Poynter, 2016
Schedule
• An Introduc5on and Overview -‐ Feb 23 • Working with Qualita5ve Informa5on – Apr 5
• Working with Quan5ta5ve Informa5on -‐ May 26
• Working with mul5ple streams & big data -‐ July 5
• U-lizing visualiza-on – Sep 13 • Presen5ng the story -‐ Nov 8

Finding and Communica-ng the Story – Lesson 4 of 6 – Complex Data Ray Poynter, 2016
Q & A
Ray Poynter The Future Place