Financing Resources of SMEs and Firm Performance: Evidence ...
26
Asian Journal of Business and Accounting 13(2), 2020 1 ABSTRACT Manuscript type: Research paper Research aims: This study investigates the effects of financing resources on firm performance and efficiency among the SMEs of Korea. It also examines the relevance of various factors between the sources of financing and corporate performance and efficiency. Design/Methodology/Approach: Data taken for empirical analysis are those from 2011 to 2016. Samples are taken from the Korea Composite Stock Price Index (KOSPI) and Korea Securities Dealers Association (KOSDAQ) companies listed on the Korea Exchange. To examine the relationship between financing resources and firm performances, we employ a structural equation model (path model) derived from AMOS 24 of the SPSS. Research findings: Results show that SME’s internal finance and institutional finance have a positive effect on firm performance but other capitals have a negative effect on firm performance. Internal finance and corporate credit contribute to better efficiency whereas institutional finance has a significant negative impact on efficiency. These findings suggest that there are differences between financing resources and firm performance. Results also show that institutional finance has a negative impact on growth while other capitals have a positive effect on growth. Theoretical contribution/Originality: This study is unlike past studies; it examines the impact of financing sources on performance. Financing Resources of SMEs and Firm Performance: Evidence from Korea Hung Sik Kim and Kyung-Shick Cho* * Corresponding author: Kyung-Shick Cho is a Visiting Professor at the College of Manage- ment and Economics, Dongguk University, Gyeongju Campus, 123, Dongdae-ro, Gyeongju-si, Gyeongsangbuk-do, Korea 780-714, Korea. E-mail: [email protected] Hung Sik Kim is a Professor at the College of Management and Economics, Dongguk University Gyeongju Campus, 123, Dongdae-ro, Gyeongju-si, Gyeongsangbuk-do, Korea 780- 714, Korea. E-mail: [email protected] https://doi.org/10.22452/ajba.vol13no2.1
Transcript of Financing Resources of SMEs and Firm Performance: Evidence ...

Asian Journal of Business and Accounting 13(2), 2020 1
Financing Resources of SMEs and Firm Performance: Evidence from Korea
ABSTRACTManuscript type: Research paperResearch aims: This study investigates the effects of financing resources on firm performance and efficiency among the SMEs of Korea. It also examines the relevance of various factors between the sources of financing and corporate performance and efficiency. Design/Methodology/Approach: Data taken for empirical analysis are those from 2011 to 2016. Samples are taken from the Korea Composite Stock Price Index (KOSPI) and Korea Securities Dealers Association (KOSDAQ) companies listed on the Korea Exchange. To examine the relationship between financing resources and firm performances, we employ a structural equation model (path model) derived from AMOS 24 of the SPSS.Research findings: Results show that SME’s internal finance and institutional finance have a positive effect on firm performance but other capitals have a negative effect on firm performance. Internal finance and corporate credit contribute to better efficiency whereas institutional finance has a significant negative impact on efficiency. These findings suggest that there are differences between financing resources and firm performance. Results also show that institutional finance has a negative impact on growth while other capitals have a positive effect on growth. Theoretical contribution/Originality: This study is unlike past studies; it examines the impact of financing sources on performance.
Financing Resources of SMEs and Firm Performance: Evidence from Korea
Hung Sik Kim and Kyung-Shick Cho*
* Corresponding author: Kyung-Shick Cho is a Visiting Professor at the College of Manage-ment and Economics, Dongguk University, Gyeongju Campus, 123, Dongdae-ro, Gyeongju-si, Gyeongsangbuk-do, Korea 780-714, Korea. E-mail: [email protected] Sik Kim is a Professor at the College of Management and Economics, Dongguk University Gyeongju Campus, 123, Dongdae-ro, Gyeongju-si, Gyeongsangbuk-do, Korea 780-714, Korea. E-mail: [email protected]
https://doi.org/10.22452/ajba.vol13no2.1

Hung Sik Kim and Kyung-Shick Cho
2 Asian Journal of Business and Accounting 13(2), 2020
The outcome derived adds to the existing literature on SMEs’ preferences towards various financing sources. The samples of this study comprise companies listed on the Korean Stock Exchange. A few studies have examined the relationship between financing resources of Korean SMEs and organisational performance in detail, thereby highlighting that the SMEs’ financing behaviour in Korea is different from other countries. The results of this study can be applied to other countries which may be similar to Korea. Practitioner/Policy implication: Our findings offer insights which can help investors, businessmen, and policymakers who are interested in the Korean Stock market to make better decisions. The results drawn from this study can be used by the respective parties to make better corporate policies with regards to financing and corporate performance.Research limitation/Implications: Future research may consider separating the financial cycles from the growth cycles, or to focus on firm size by dividing firms into large, medium, and small companies. From this study, we conclude that the most important source of financing for SMEs is internal finance which has a positive effect on corporate performance.
Keywords: Financing Resources, SMEs, Firm Performance, EfficiencyJEL Classification: G32
1. Introduction Traditionally, corporate financing decisions are one of the most impor-tant decisions made in the field of finance. Making decisions on the financing resources for large corporations, and small and medium-sized enterprises (SMEs), can be a very important decision as it affects the country’s economy. The financing resources of SMEs differ from that of large companies (Abdulsaleh & Worthington, 2013) although both are equally affected by financial constraints (Beck, Demirgüç-Kunt, & Maksimovic, 2005; Oliveira & Fortunato, 2006; Ayyagari, Demirgüç-Kunt, & Maksimovic, 2010). SMEs are usually small in firm size, but the obstacles affecting their growth can be big, for instance, information uncertainty, credit deficiency, credit, low assurance, and profit volatility. If SMEs do not have sufficient finance, they are likely to go bankrupt.
The theory that is usually applied to examine SME financing and capital structure comprises the pecking order theory (Myers, 1984; Myers & Majluf, 1984) and the trade-off theory. Since SMEs often suffer from problems linked to asymmetric information, such as information costs,

Asian Journal of Business and Accounting 13(2), 2020 3
Financing Resources of SMEs and Firm Performance: Evidence from Korea
SMEs tend to deal with the asymmetry internally, by dealing with the external shareholders and those handling the information. The trade-off theory has been applied to small companies such as SMEs; the theory suggests that SMEs could use a target borrowing ratio to guide their financial policy. López-Gracia and Sogorb-Mira (2008) had shown that both theoretical models can be used to explain the SME’s capital structure.
Another approach used by others (Kimhi, 1997; La Rocca, La Rocca, & Cariola, 2011) to examine SME’s financing is the financial growth cycle paradigm (Berger & Udell, 1998). This theory maintains that SME financing is achieved through various phases of the firm’s lifecycle. In other words, different financing strategies are required at different stages of the firm’s growth cycle.
The purpose of this study is to examine the relationship between financing behaviour and corporate performance/efficiency for small and medium enterprises (SMEs) listed on the Korea stock exchange from 2011 to 2016 through a structural equation model. This study was conducted because the financing behaviour of Korea’s SMEs is different from that of developed countries, such as the US which is done through credit guarantee support, or in Germany where SME’s financing is made up of internal funds, and bank loans. In comparison, SMEs in Korea have a high proportion of internal funds, but a low proportion of bank loans (Korean Chamber of Commerce and Industry, 2014). Only a few studies have examined the relationship between SMEs’ financing behaviour and its performance in the context of Korea, for instance, Cassar and Holmes (2003), Lopez-Gracia and Aybar-Arias (2000), and Watson and Wilson (2002). Other studies have used cross-sectional data to analyse whether the pecking order theory or the trade-off theory is more appropriate for examining SMEs. Using the World Bank Enterprise Survey indicator database, Dong and Men (2014) investigated how the financing of SMEs was influenced by firm characteristics, cross-country differences in the banking sector and diverse economic development and institutions.
Raju and Annamalai (2015) examined the impact of financing sources on firm performance through three growth stages whereas Baker, Kumar and Rao (2017) examined the financing preferences and practices of SMEs. Similarly, Masiak, Block, Moritz, Lang, and Kraemer-Eis (2019) investigated the differences of the financing patterns of micro firms and larger SMEs. It appears that the various financing sources of SMEs need to be taken into account because they affect the SMEs characteristics. Further to this, other studies (Abdulsaleh & Worthington, 2013) noted that owner-manager structure may also affect the SME’s

Hung Sik Kim and Kyung-Shick Cho
4 Asian Journal of Business and Accounting 13(2), 2020
financial behaviour. While Raju and Annamalai (2015) had analysed the relationship between financing sources and performance through three growth stages, this study will not be distinguishing the growth stages. While the samples used by Raju and Annamalai (2015) were derived from a privately held company, the sample of this study was based on companies listed on the Korea Stock Exchange. While Raju and Annamalai (2015) used firm size, volatility, collateral assets, and age as corporate characteristics, this study does not use collateral assets.
This study contributes to the literature looking at the relationship between financing resources and performance in several ways. First, this study differs from existing literature by studying the impact of funding sources on performance, thereby adding to the existing literature on SME’s preferences for funding sources, such as internal finance, insti-tutional finance, non-institutional finance, or trade credits. Raju and Annamalai (2015) and a few other studies had shown different findings depicting the relationship between funding sources and growth, between corporate characteristics and funding sources, and between corporate characteristics and growth/performance/efficiency. In this study, we employed sales growth as an endogenous variable, and three firm characteristics (e.g. firm size, profit volatility, and firm age) as exogenous variables. Therefore, the outcome derived from this study would help to justify the conflicting findings noted in current literature. Moreover, the empirical analysis of this study focused on SMEs listed on the Korea Stock Exchange. The financial statements of listed SMEs are easy to obtain, their annual reports are audited, and often subjected to consistent monitoring, thereby making these companies more reliable as compared to the low reliability of unlisted SMEs. Until now, very few studies have examined the relationship between financing resources of SMEs and their performance in detail, in the context of Korea since the financing behaviour of Korean SMEs tend to be distinctive from other countries. In that regard, the outcome drawn from this study could be applied to other countries similar to Korea.
2. Literature and Hypothesis Development
2.1 Influence of Financing Resources on Firm Performance and Efficiency
In examining the relationship between financing resources and firm performance and efficiency, the variables used in this study include: internal finance, institutional finance, non-institutional finance, and trade

Asian Journal of Business and Accounting 13(2), 2020 5
Financing Resources of SMEs and Firm Performance: Evidence from Korea
credit. They were used as substitute variables for financing resources. Some studies (Carter, Brush, Gatewood, Greene, & Hart, 2003; Cosh, Cumming, & Hughes, 2009; Lokhande, 2011; Moscalu, Girardone, & Calabrese, 2019) examining the relationship between funding sources and performance (or efficiency) found that the informational capacity of SMEs tend to interfere with SMEs ability in obtaining external credits. Others (Ughetto, 2008; Dogra & Gupta, 2009) found that internal financing was an important factor to consider when looking for financing resources.
A number of studies argued that it is necessary to increase debt capital which includes institutional finance and non-institutional finance when firms need financing. They noted that internal reserves need to be increased at the maturity stage, and when profitability increases, firms should use just a little debt. Abe, Troilo and Batsaikhan (2015) suggested that banks play an important role in fundraising, acting as the SME’s external financing resource. It appears that firms financed by bank loans were more productive than firms financed by informal sources (Ayyagari et al., 2010). Further, unofficial funding channel undermines firm performance. However, Mallick and Yang (2011) found that firms financed through in-house reservations, and stock issuance have better performance, and firms financed through bank loans, such as debt financing have lower performance. Abe et al. (2015) noted that it was not easy for SMEs to finance bank loans while others (Tsuruta, 2008; Ogawa, Sterken, & Tokutsu, 2013) have suggested that SMEs focus on intra-firm credit when SMEs cannot access external sources for funds.
Overall, it appears that past studies had shown a positive relation-ship between internal financing and firm performance, a mixed rela-tionship between debt capital and firm performance, and a positive relationship between trade credit and firm performance. For this study, the following null hypotheses were thus established:
H1: Financing resources have no significant impact on firm performance.
H2: Financing resources have no significant impact on firm efficiency.
2.2 Influence of Financing Resources on Firm Growth
Since the current study also examines the relationship between financing resources and firm growth potential, the effect of capital structure on growth is further discussed.

Hung Sik Kim and Kyung-Shick Cho
6 Asian Journal of Business and Accounting 13(2), 2020
Berger and Udell (1998) focused on the financial growth cycle in which financing options varied as SMEs grew. They noted that SMEs need funding at all stages of growth because any deficiency in funding hampers the growth of SMEs (Winborg & Landström, 2001). Likewise, Becchetti and Trovato (2002) observed that the existence of various financial resources tend to increase the growth potential of SMEs. This was also reiterated by Gregory, Rutherford, Oswald and Gardiner (2005) who stated that capital structure decisions affect the growth potential of SMEs. Other studies examined the impact of internal financing on the growth potential of SMEs and Carpenter and Petersen (2002) noticed that the growth of small firms may be constrained by the lack of internal finance availability. Smaller and younger firms have been observed to have higher growth-cash flow sensitivities than larger and more matured firms (Oliveira & Fortunato, 2006). In comparison, companies with high growth potentials preferred to finance their capital rather than access internal financing (Abor & Biekpe, 2007; Degryse, de Goeij, & Kappert, 2012). Abor and Biekpe (2007), and Michaelas, Chittenden and Poutziouris (1999) also noted that SMEs prefer to borrow money from outside because this will enable it to expand faster since the growth of companies is funded by internal finances. Obviously, fast-growing SMEs prefer to finance short-term current liabilities rather than long-term non-current liabilities. This was detected by Ogawa et al. (2013) who noted that financing resources associated with corporate credit played an important role in raising funds for venture firms which were less likely to get their financed from bank loans.
This means that past studies tend to show that there was a mixed relationship between internal financing and growth, a positive relationship between institutional finance (outside) and growth, and a positive relationship between trade credit and growth. Based on this, the following null hypothesis was thus established:
H3: Funding behaviour has no significant impact on growth.
2.3 Influence of Growth on Firm Performance and Firm Efficiency
Since this study also examines the relationship between firm charac-teristics and financing resources, it is apt to focus on past research which looks at the impact of growth on corporate performance (or efficiency). In the context of this study, growth is related to business performance (or efficiency). Becchetti and Trovato (2002) had shown that size and age were not the only determinants of growth. It was found that financial

Asian Journal of Business and Accounting 13(2), 2020 7
Financing Resources of SMEs and Firm Performance: Evidence from Korea
constraints and access to foreign markets also impacted the growth of small and medium-sized firms significantly. Lu and Beamish (2006) found that there was a negative moderating relationship between SME’s foreign and direct investment activities and firm profitability.
This means that if SMEs entered foreign markets, or make direct foreign investments for growth, their performance would increase. Based on this, the following null hypotheses were formulated:
H4: There is no significant impact of growth on firm performance.H5: There is no significant impact of growth on firm efficiency.
2.4 Influence of Firm Characteristics on Financing Resources
The current study also examines the relationship between firm charac-teristics and financing resources. Petersen and Rajan (1994) argued that when a firm maintains long-term relationships with the banks, information asymmetry would be reduced because banks are well aware of the corporate credit information. This occurs because in the relation-ship between firm size and financing resources, there is a negative relationship between firm size and bank-debt ratio (Ooi, 2000). A few studies like Abor and Biekpe (2007) have also analysed the relation-ship between volatility and financing resources by focussing on the relationship between firm age and financing resources. They noted that managing a business over a long period of time requires more funding, thereby establishing a positive relationship between firm age and bank debts. Paul, Whittam and Wyper (2007) used the pecking order theory to examine start-up firms. They found that most start-up firms were initially financed by internal financing.
The outcome of these studies showed a negative relationship occurring between firm size and bank debt, and a positive (negative) relationship between firm age and bank debt (internal financing). Based on this, the following null hypothesis was established.
H6: Firm characteristics have no significant effect on financing resources.
2.5 Influence of Firm Characteristics on Growth, Firm Performance, and Efficiency
To examine the relationship between firm characteristics and growth, firm performance and efficiency, it is first necessary to focus on the relationship between firm size and performance. This is because

Hung Sik Kim and Kyung-Shick Cho
8 Asian Journal of Business and Accounting 13(2), 2020
Lumpkin (1998) had shown that small firms were more efficient in choosing profitable investments due to their need for survival. Likewise, Gschwandtner (2005) also argued that productivity increases firm size because it is favourable to the economies of scale, investment diversi-fications, and strategic performance. This was also endorsed by Oliveira and Fortunato (2006) who asserted that small firms have more cash flow sensitivity, and more sustained growth than those large firms, hence firm size increases profitability (firm performance) (Nunes, Viveiros, & Serrasqueiro, 2012).
The relationship between variability and performance has also been investigated, for instance Kang and Heshmati (2008) looked at the relationship between firm age and performance. They noted that older firms were more profitable, and had better performance than younger firms. Nunes et al. (2012) examined firm age, and increased profitability (or firm performance) while focussing on the relationship between firm characteristics and growth, Becchetti and Trovato (2002) noted that SMEs have greater growth potentials than larger firms while Classen, Carree, Van Gils and Peters (2014) identified the negative relationship between firm age and investment incentives. Similarly, Nunes et al. (2012) also revealed that profit volatility decreases as firm age increases.
In summary, it can be said that past studies had reported a negative relationship between firm size and performance, a positive relationship between firm age and performance, and a negative relationship between firm size or firm age and growth. Based on this, the following null hypotheses were established.
H7: Firm characteristics have no significant effect on firm growth.H8: Firm characteristics have no significant effect on firm perfor-
mance.H9: Firm characteristics have no significant effect on firm efficiency.
3. Research Method
3.1 Data Collection and Sample
Data utilised for this study comprise of secondary data extracted from the SMEs listed on the Korea Exchange (KRX), dated January 1, 2011 to December 31, 2016. Several steps were applied. First, we excluded com-panies for which financial statements were not available from the TS-2000 (as provided by the Korea Listed Companies Association), and the KIS VALUE Library (as provided by the Korea Investors Service, Inc.).

Asian Journal of Business and Accounting 13(2), 2020 9
Financing Resources of SMEs and Firm Performance: Evidence from Korea
Second, all the financial sectors, such as banks, securities and insurances were excluded because they differed from general manufacturing companies in terms of capital structure, and business methods. The current study only focuses on the manufacturing industry based on the following reasons:
1) The manufacturing industry needed huge funding to grow or expand, but the service industry was relatively less disturbed (Beck, Demirgüç-Kunt, & Maksimovic, 2005).
2) The manufacturing industry was financing more often than the service industry or other industries (Mina, Lahr, & Hughes, 2013).
In Korea, the standard capacity for each industry is set in the Enforcement Decree of the Framework Act on SMEs. In general, manufacturing SMEs have less than 300 full-time employees, and their capital is less than eight (8) billion won.
Based on the above criteria, a total of 376 samples were selected, of which 75 were generated from the KOSPI (Korea Composite Stock Price Index), and 301 sample companies were extracted from the KOSDAQ (Korea Securities Dealers Association Automated Quotation). Table 1 shows the status of manufacturing industries (CODE: 10~33) by sample companies.
This study includes 22 samples out of the 23 manufacturing sectors available. This means that the samples in this study were evenly distributed. The most frequent sectors noted include those in electronics, such as computer, image, sound and communication equipment (num-bering 96 or 25.5%).
3.2 Analysis Model and Variables
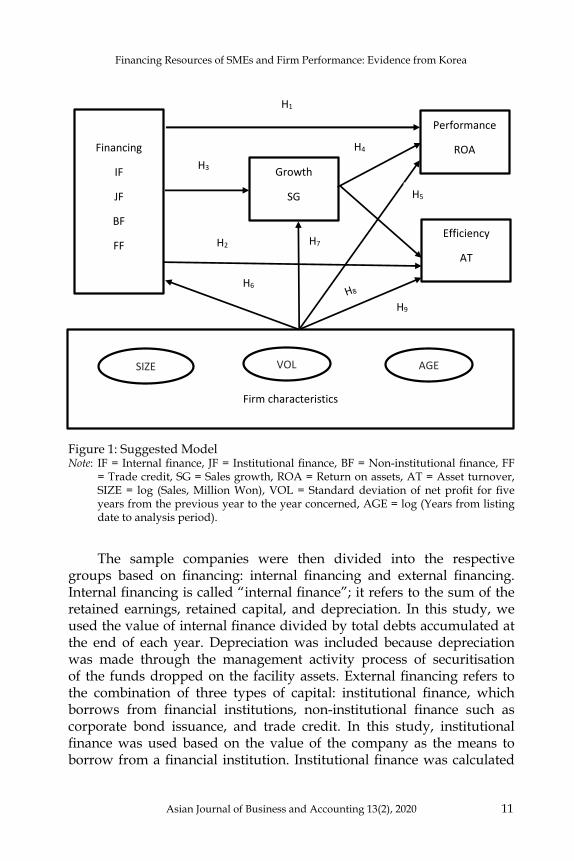
In order to investigate the impact of the financial resources on per-formance, this study used a structural equation model (SEM) from AMOS 24 in the SPSS as shown in Figure 1, which was based on the recommendations of Raju and Annamalai (2015). There are several reasons for using the SEM in this study. First, the SEM is able to show a clearer understanding of the correlations of multiple factors. Second, the SEM is able to describe the covariance between variables in the model. Third, the SEM can estimate the regression coefficients by reflecting the measurement errors when estimating the regression coefficient. Fourth,

Hung Sik Kim and Kyung-Shick Cho
10 Asian Journal of Business and Accounting 13(2), 2020
the SEM makes it possible to estimate the moderating and mediating effects. This study used the following variables.
First, we used the return on assets (ROA) as a proxy for firm performance. The ROA was calculated by dividing the net profit with the total assets gathered at the end of the year. We used total assets turnover as a substitute variable for efficiency. The total assets turnover was calculated by dividing the net sales with the total assets obtained at the end of the year.
Table 1: Sample
No. Manufacturing Industry KOSPI KOSDAQ Total %
1 Electronic component, computer, image, 10 86 96 25.5 sound and communication equipment 2 Other machines and equipment 7 41 48 12.8 3 Medical substance and medicine 7 29 36 9.6 4 Chemical substance and chemical 13 13 26 6.9 5 Car and trailer 4 20 24 6.4 6 Electrical equipment 4 16 20 5.3 7 Rubber product and plastic product 4 15 19 5.1 8 Medical, precision, optics, and watches 1 17 18 4.8 9 Primary metal 6 9 15 4.0 10 Metal processing products 2 12 14 3.7 11 Grocery 2 9 11 2.9 12 Nonmetallic mineral products 4 7 11 2.9 13 Pulp, paper, and paper products 4 6 10 2.7 14 Textile products 2 3 5 1.3 15 Cloth, clothing accessories, and fur 1 4 5 1.3 16 Beverage 1 3 4 1.1 17 Furniture 2 2 4 1.1 18 Other transportation equipment 0 3 3 0.8 19 Others 0 3 3 0.8 20 Print and record carrier duplication 0 2 2 0.5 21 Leather, bags, and shoes 1 0 1 0.3 22 Cokes, briquet, and petroleum products 0 1 1 0.3
Total 75 301 376 100.0
Asian Journal of Business and Accounting 13(2), 2020 11
Financing Resources of SMEs and Firm Performance: Evidence from Korea
The sample companies were then divided into the respective groups based on financing: internal financing and external financing. Internal financing is called “internal finance”; it refers to the sum of the retained earnings, retained capital, and depreciation. In this study, we used the value of internal finance divided by total debts accumulated at the end of each year. Depreciation was included because depreciation was made through the management activity process of securitisation of the funds dropped on the facility assets. External financing refers to the combination of three types of capital: institutional finance, which borrows from financial institutions, non-institutional finance such as corporate bond issuance, and trade credit. In this study, institutional finance was used based on the value of the company as the means to borrow from a financial institution. Institutional finance was calculated
Figure 1: Suggested ModelNote: IF = Internal finance, JF = Institutional finance, BF = Non-institutional finance, FF
= Trade credit, SG = Sales growth, ROA = Return on assets, AT = Asset turnover, SIZE = log (Sales, Million Won), VOL = Standard deviation of net profit for five years from the previous year to the year concerned, AGE = log (Years from listing date to analysis period).
Financing
IF
JF
BF
FF
Performance
ROA
Efficiency
AT
Growth
SG
Firm characteristics
SIZE VOL AGE
H1
H2
H3 H4
H5
H6
H7
H9

Hung Sik Kim and Kyung-Shick Cho
12 Asian Journal of Business and Accounting 13(2), 2020
by dividing the long-term borrowing and short-term borrowing, which include Korean and foreign currency, with total debts gathered at the end of the year. Non-institutional finance was calculated by dividing the corporate bonds with total debts accumulated at the end of the year. Trade credit was calculated by dividing the sum account payable and the note payable with total debts obtained at the end of the year.
Other variables used in this study include growth and firm charac-teristics. The net sales growth rate was used as a substitute variable for growth. The net sales growth rate was calculated by dividing the sales year to date minus sales in the previous year with sales from the previous year. We also used firm size, profit volatility, and firm age as firm char-acteristics. Firm size was calculated by taking the log of sales (in million won) obtained at the end of the year. Profit volatility was calculated by measuring the standard deviation of the net profit for the period based on the past five years to the relevant years. Firm age was calculated by counting the number of years from the listing date to the analysis period. The description of the variables is summarised in the Appendix.
4. Empirical Results
4.1 Basic Statistics
This section explains the basic statistics of the variables introduced so as to determine the probability distribution characteristics, and the outliers of the variables. Table 2 shows the results for the mean, standard deviation, 25% percentile, median, and 75% percentile of each of the variables introduced in this study. To control the effect of the outliers on the analysis results, we winsorized all variables at the 1st and 99th percentiles. We compared basic statistics of the SMEs with the manufacturing industry’s average data taken from the business management analysis of the Economic Statistics System (Bank of Korea). During the analysis period, the ROA average was noted as 0.3%, which was smaller than the SME’s industry average of 2.77%. This means that the samples in this study were less profitable than the average SMEs of the manufacturing industry. The AT average of the SMEs was 0.8%, which was also smaller than the average SME’s average of 1.22%. This means that the samples in this study were less efficient than the average manufacturing industry SMEs. The SG mean value was 6.4%, which was smaller than the average SME’s average of 7.92%. The IF’s average was 256%, which was greater than the median of 137.2%. The JF mean was

Asian Journal of Business and Accounting 13(2), 2020 13
Financing Resources of SMEs and Firm Performance: Evidence from Korea
38.3%, which was smaller than the median value of 40.4%, the BF mean was 3.2%, which was larger than the median 0.0%, and the FF mean was 29.0% of the distribution. Looking at the source of financing, it was noted that the highest average was internal finance (IF), which was financed through retained earnings and retained capital. The next highest average was JF and BF. These results indicate that there was a possibility that the pecking order theory would be established in SMEs.
4.2 Correlation Analysis
Table 3 shows the Pearson correlation analysis of the variables. There was a significant positive correlation between ROA and AT in the 1.0% level (correlation coefficient = 0.226). There was a significant positive relation between ROA and SG at the 5.0% level. There was a significant positive relation between the ROA and the IF/FF at the 1.0% level, and a significant negative relation between the ROA and the JF/BF at the 5.0% and 1.0% level, respectively. There was a significant positive relation between the ROA and SIZE, and a negative relation between the ROA and VOL. When we looked at the correlation between the independent variables, we noted a mixed case, with and without a significant
Table 2: Basic Statistics
Variables N Mean SD 25% Pctl. Median 75% Pctl.
ROA 376 0.003 0.080 -0.026 0.019 0.052AT 376 0.008 0.003 -0.010 0.045 0.111SG 376 0.064 0.136 0.006 0.008 0.010IF 376 2.560 3.176 0.702 1.372 3.046JF 376 0.383 0.217 0.216 0.404 0.565BF 376 0.032 0.057 0.000 0.000 0.043FF 376 0.290 0.167 0.160 0.254 0.383SIZE 376 4.740 0.330 4.524 4.753 4.972VOL 376 5.017 4.748 2.058 3.756 6.207AGE 376 1.108 0.188 0.970 1.093 1.241
Note: ROA = Return on assets, AT = Asset turnover, SG = Sales growth, IF = Internal Finance, JF = Institutional finance, BF = Non-institutional finance, FF = Trade credit, SIZE = log (sales, million won), VOL = Standard deviation of net profit for five years from the previous year to the year concerned, AGE = log (Years from listing date to analysis period). In order to control the effect of outliers on the analysis results, 1% of the top and bottom are winsorized for each variable.

Hung Sik Kim and Kyung-Shick Cho
14 Asian Journal of Business and Accounting 13(2), 2020
Tabl
e 3:
Cor
rela
tion
Ana
lysi
s
RO
A
AT
SG
IF
JF
BF
FF
SIZE
V
OL
AG
E V
IF
ROA
1
A
T 0.
226*
* 1
SG
0.10
3*
0.04
1 1
1.
046
IF
0.39
8**
-0.2
22**
0.
009
1
1.
844
JF
-0.1
21*
-0.0
90
-0.1
14*
-0.5
41**
1
2.
787
BF
-0.3
03**
-0
.184
**
0.11
5*
-0.1
51**
-0
.083
1
1.28
8FF
0.
248*
* 0.
429*
* 0.
074
0.33
7**
-0.6
54**
-0
.186
**
1
2.60
0SI
ZE
0.39
6**
0.53
4**
-0.0
71
-0.1
53**
0.
164*
* -0
.252
**
0.16
1**
1
1.
676
VO
L -0
.276
**
-0.1
30*
0.00
0 -0
.059
0.
040
0.12
4*
-0.1
58**
0.
102*
1
1.
118
AG
E -0
.096
-0
.012
-0
.128
* -0
.131
* 0.
058
-0.0
94
-0.1
14*
0.07
2 -0
.047
1
1.09
0
Not
e: R
OA
= R
etur
n on
ass
ets,
AT
= A
sset
turn
over
, SG
= S
ales
gro
wth
, IF
= In
tern
al fi
nanc
e, JF
= In
stitu
tiona
l fina
nce,
BF
= N
on-
inst
itutio
nal fi
nanc
e, F
F =
Trad
e cr
edit,
SIZ
E =
log
(sal
es, m
illio
n w
on),
VO
L =
Stan
dard
dev
iatio
n of
net
pro
fit fo
r fiv
e ye
ars
from
the
prev
ious
yea
r to
the
year
con
cern
ed, A
GE
= lo
g (Y
ears
from
list
ing
date
to a
naly
sis
peri
od).
**, *
indi
cate
sig
nific
ance
at
the
1% a
nd 5
% le
vels
(bot
h si
des)
, res
pect
ivel
y.

Asian Journal of Business and Accounting 13(2), 2020 15
Financing Resources of SMEs and Firm Performance: Evidence from Korea
correlation. In some cases, the correlation coefficient was noted to be slightly higher in some factors. As a result of examining the variance inflation factor (VIF) for the multicollinearity problem of the introduced independent variables, it was therefore confirmed that the maximum value among the independent variables was 2.787, which was within the allowable range of statistics.
4.3 Empirical Results
Figure 2 shows the results of the relation among the factors introduced in the structural equation while Tables 4 and 5 illustrate the results of the path model.
Figure 2: Path Model ResultsNote: IF = Internal Finance, JF = Institutional Finance, BF = Non-institutional Finance, FF
= Trade Credit, SG = Sales growth, ROA = Return on assets, AT = Asset turnover, SIZE = log (sales, million won), VOL = Standard deviation of net profit for five years from the previous year to the year concerned, AGE = log (Years from listing date to analysis period).

Hung Sik Kim and Kyung-Shick Cho
16 Asian Journal of Business and Accounting 13(2), 2020
Table 4: Summary of Path Model Results
Path Estimate S.E. C.R. P
H1: Impact of financing resources on firm performanceROA←Internal finance 0.012 0.001 10.779 ***ROA←Institutional finance 0.030 0.016 1.844 0.065ROA←Non-institutional finance -0.130 0.055 -2.384 0.017H2: Effect of financing resources on efficiencyAsset Turnover←Internal finance 0.000 0.000 -8.182 ***Asset Turnover←Institutional finance -0.002 0.001 -1.730 0.084Asset Turnover←Non-institutional finance -0.003 0.002 -1.423 0.155Asset Turnover←Trade credit 0.008 0.001 7.226 ***H3: Impact of financing resources on growthSales Growth←Institutional finance -0.060 0.032 -1.853 0.064Sales Growth←Non-institutional finance 0.219 0.127 1.720 0.085H4: Impact of growth on firm performanceROA←Sales Growth 0.084 0.022 3.835 ***H5: Effect of growth on efficiencyAsset Turnover←Sales growth 0.001 0.001 1.150 0.250H6: Effect of firm characteristics on financing resourcesInternal finance←Firm size -1.385 0.489 -2.834 0.005Institutional finance←Firm size 0.055 0.029 1.913 0.056Non-institutional finance←Firm size -0.040 0.009 -4.705 ***Trade Credit←Firm size 0.151 0.018 8.326 ***Non-institutional finance←Volatility 0.001 0.001 2.454 0.014Trade credit←Volatility -0.006 0.001 -4.674 ***Internal Finance←Firm age -2.035 0.857 -2.374 0.018Non-institutional finance←Firm age -0.026 0.015 -1.764 0.078Trade credit←Firm age -0.091 0.031 -2.914 0.004H7: Effect of firm characteristics on growthSales Growth←Firm size -0.010 0.022 -0.451 0.652Sales Growth←Firm age -0.081 0.037 -2.190 0.029H8: Impact of firm characteristics on firm performanceROA←Firm size 0.115 0.009 12.250 ***ROA←Volatility -0.005 0.001 -7.863 ***ROA←Firm age -0.033 0.016 -2.074 0.038H9: Effect of firm characteristics on efficiencyAsset Turnover←Firm size 0.005 0.000 10.637 ***Asset Turnover←Volatility 0.000 0.000 -3.302 ***
Note: *** means significant at 1% level.

Asian Journal of Business and Accounting 13(2), 2020 17
Financing Resources of SMEs and Firm Performance: Evidence from Korea
Returning to our hypotheses, it is hereby noted that Hypothesis 1 examines the effects of financing sources on firm performance. Here, the financing sources were divided into four groups of liabilities: internal finance (IF), institutional finance (JF), non-institutional finance (BF), and trade credit (FF). Results showed that IF and JF have a positive effect on firm performance while BF has a negative effect on firm performance. The coefficient of IF was 0.012, which was significant at the 1% level. This means that an increase in the internal financing, with a net income margin of 0.012, also increases the internal reservations by one unit. These results are consistent with previous studies which showed that that internal finance played an important role in the performance of SMEs (Ughetto, 2008; Dogra & Gupta, 2009). This outcome was also noted in the Korean SMEs, where internal finance showed a positive effect on performance. The results suggest that a pecking order based on information asymmetry was likely to be established in the Korean SMEs.
The coefficient of JF was 0.030, which was significant at the 10% significance level. This means that an increase in the net asset value of 0.030 in the JF will increase bank borrowings by one unit. However, the coefficient of the non-institutional finance such as the issuance of corporate bonds at (–) 0.130 showed a 5% significance level. This means that a decrease in the net total assets ratio of 0.130 will have a one-unit capital increase. These results are consistent with previous studies which showed a mixed relationship between debt capital and performance (Gonzalez & Gonzalez, 2012; Abe et al., 2015; Ayyagari et al., 2010; Bilgin, Marco Lau, & Demir, 2012; Mallick & Yang, 2011). This outcome suggests that Korean SMEs have a mixed influence on external finance and performance. There was no evidence showing the relationship between trade credit and firm performance. This means that the trade credit of Korean SMEs contributes to firm performance. This result is different from Ogawa et al. (2013) and Bönte and Nielen (2011) who had
Table 5: Path Analysis Results between Financing Resource Variables
Path Estimate S.E. C.R. P
ROA←Internal finance 0.012 0.001 10.779 ***Institutional finance←Internal finance -0.036 0.003 -12.067 ***Trade credit←Institutional finance -0.531 0.027 -19.363 ***Non-institutional finance←Trade credit -0.047 0.017 -2.734 0.006
Note: *** means significant at 1% level.

Hung Sik Kim and Kyung-Shick Cho
18 Asian Journal of Business and Accounting 13(2), 2020
noted that trade credits were useful for credit-limited firms. In summary, these results showed that both the internal financing, such as internal reserves, and institutional financing, such as financial institutions, were important factors for the Korean SMEs to obtain better firm perfor-mance. However, the same result also showed that non-institutional finance such as the issuance of corporate bonds had negatively affected firm performance.
Following Hypothesis 1, the next hypothesis (Hypothesis 2), exam-ines the effect of financing sources on efficiency. Results showed that IF and FF had a significant positive effect on efficiency, but JF has a significant negative effect on efficiency. Interestingly, JF which means borrowing from financial institutions had a positive effect on ROA, but JF had a negative effect on total asset turnover. In other words, while JF increases firm performance, it also decreases efficiency. This means that JF has a dual nature. More specifically, the 1-unit increase in IF leads to a slight positive change in the efficiency of Korean manufacturing SMEs, and the one (1) credit per company increase is a positive change of 0.008 in the efficiency of Korean manufacturing SMEs. However, an increase in the JF caused a negative effect on efficiency.
Hypothesis 3 analyses the impact of financing sources on growth. The result showed that IF has a negative impact on growth. This finding is consistent with previous studies which showed that SMEs have a negative impact on growth potentials (Abor & Biekpe, 2007; Degryse et al., 2012). In contrast, BF was observed to cause a positive effect on growth. This means that IF was not motivating the firm’s growth potential whereas BF was motivating growth potential. In other words, borrowing from financial institutions can be a hindrance to growth, hence it caused the negative effect of high interest rates on loans, and the monitoring activities required for making investment decisions of SMEs.
Hypothesis 4 examines the impact of growth on firm performance. This study used net sales growth rate (SG) as a substitute variable for growth, and ROA as a substitute variable for firm performance. The results showed that there was a positive relationship between SG and ROA at the 1% significance level (coefficient = 0.084). The outcome was noted to be consistent with previous studies (e.g. Becchetti & Trovato, 2002; Lu & Beamish, 2006) that had highlighted the positive relationship between growth and performance. This means that the higher the growth potential of SMEs in Korea, the higher the firm performance. The increase in one unit of sales can be seen to be accompanied by an increase of 0.084 in total assets.

Asian Journal of Business and Accounting 13(2), 2020 19
Financing Resources of SMEs and Firm Performance: Evidence from Korea
Hypothesis 5 investigates the impact of growth on efficiency. SG was used as a substitute variable for growth, and total asset turnover (AT) was used as a substitute variable for efficiency. The results showed that there was no significant difference between SG and AT. This can mean that growth did not contribute significantly to efficiency.
Hypothesis 6 analyses the effects of firm characteristics on financing resources. The firm characteristics comprised of firm size, profit volatility, and firm age. The results showed a positive relationship between firm size and JF or FF, and a negative relationship between firm size and IF or BF. These results differed from previous studies, such as Ooi (2000) who noted a negative relationship between firm size and bank-debt ratio. This result suggests that the larger the firm size, the easier it is to raise funds through institutional finance and trade credit, and the larger the firm size, the less easy it is to finance through internal finance and non-institutional finance in Korea. The larger the volatility of profit (risk), the easier it is to raise funds through non-institutional financing, and the larger the volatility, the more negative the effect of financing through trade credit. Looking at firm age, the result showed a significant negative relationship between firm age and IF, BF and FF. This implies that the longer the manufacturing SMEs have operated, the more negative its effect on financing resources. These results are consistent with previous studies (e.g. Paul et al., 2007) which showed a negative relationship between firm size and internal finance. This outcome indicates that the pecking order theory was also established in Korean SMEs.
Hypothesis 7 examines the effect of firm characteristics on growth. The result showed that there was a significant negative relationship between firm age and sales growth rate at the 5% significance level (coefficient = –0.081). This means that the older the company, the slower the growth. These results are consistent with prior studies (e.g. Becchetti & Trovato, 2002; Classen et al., 2014; Nunes et al., 2012) which showed that there was a negative (–) relationship between business age and growth in Korean SMEs.
Hypothesis 8 analyses the relationship between firm characteristics and performance. Out analysis showed a positive relationship between firm size and firm performance (coefficient = 0.115). This means that the larger the company, the higher the firm performance. This result is different from prior studies which showed a negative (–) relationship between firm size and performance (Lumpkin, 1998; Gschwandtner, 2005; Oliveira & Fortunato, 2006; Nunes et al., 2012). Additionally, the

Hung Sik Kim and Kyung-Shick Cho
20 Asian Journal of Business and Accounting 13(2), 2020
results also showed a significant negative relationship between earnings volatility and firm age or firm performance. This means that the greater the risk, the shorter the firm age, the lower the firm performance.
Hypothesis 9 examines the effect of firm characteristics on effi-ciency. The results showed a positive relationship between firm size and efficiency, and a negative relationship between profit volatility and efficiency. This means that the larger the firm size, the greater the efficiency, and the higher the profit variability, the smaller the efficiency in Korean SMEs.
There were two main criteria for getting a good model fit. One was the absolute fitness index (GFI, AGFI, RMSEA), and the other was the relative fitness index (NNFI, NFI, CFI). A good model criteria include GFI > 0.9, AGFI > 0.85, RMSEA < 0.06, NNFI > 0.95, NFI > 0.9, and CFI > 0.95 (Kim, Hong, & Choo, 2007). Compared with the model fit of the current study (Table 6), the GFI and AGFI in the absolute fitness criterion fitted the good model criterion while the RMSEA did not fulfil the good model criteria. Nonetheless, even if it was less than 0.10, it was also known to be a good model. The relative fitness index did not fulfil the good model in NNFI, but it satisfied the good condition in NFI and CFI. Therefore, the model fit in this study was considered to have satisfied the good model criteria.
Table 6: Model Fit Summary
This Study Good Model Result Criteria
CMIN 53.995 – DF 12 –
GFI 0.974 0.90 or moreModel fit AGFI 0.881 0.85~0.90 RMSEA 0.097 0.05 or less
NNFI 0.881 0.90 or more NFI 0.950 0.90 or more CFI 0.960 0.90 or more
5. ConclusionThis study has examined the effects of financing resources on performance; it also considered firm characteristics, such as firm size, profit volatility, and firm age. The analysis period encompassed six
CMIN
Absolutefitness index
Relativefitness index

Asian Journal of Business and Accounting 13(2), 2020 21
Financing Resources of SMEs and Firm Performance: Evidence from Korea
years, from 2011 to 2016, and the focus was on the manufacturing SMEs listed in Korea Stock Exchange. This study also used internal financing, institutional financing, non-institutional financing, and trade credit as the financing resources. The total asset profitability was used as a substitute variable for firm performance, and the total asset turn-over was used as a substitute variable for efficiency. The analytical method used was the structural equation models (path models). The final model was reconstructed by considering the interrelation of the variables used.
The results of the analysis focussing on the financing resources are as follows. First, the internal financing and institutional financing of Korean manufacturing SMEs have a positive effect on firm performance whereas non-institutional finance has a negative effect on firm per-formance. Second, internal finance and trade credit have a significant positive impact on efficiency, but institutional financing has a negative effect on efficiency. Third, institutional financing has a negative impact on growth whereas other capitals have a positive effect on growth.
This study is meaningful in that it analysed the relationship between financing resources and Korea SME’s firm performance or efficiency. It also considered the characteristics of the firms. This study expands on the existing literature through its empirical analysis. Although previous studies have used leverage for funding resources, the current study was able to distinguish the funding resources by grouping these into internal finance, such as internal reserves, institutional finance, such as bank borrowing, non-institutional finance, such as corporate bond issuance, and trade credits, such as accounts receivable. Existing studies have mainly analysed cross-sectional data via regression analysis but the current study examined data via the structural equation modeling (path model).
Our findings contribute to investors, businessmen, and policy-makers who may be interested in looking at the relationship between various financing sources, and the performance of SMEs in the Korea Stock Market. The results of this study can be used by businessmen in making corporate policies related to financing. Investors and government policy makers may also benefit by using the information gained to relate to financing and corporate performances. However, future research may consider separating the financial cycles and growth cycles or to divide firm size into large, medium, and small companies.

Hung Sik Kim and Kyung-Shick Cho
22 Asian Journal of Business and Accounting 13(2), 2020
ReferencesAbdulsaleh, A.M., & Worthington, A.C. (2013). Small and medium-sized enter-
prises financing: A review of literature. International Journal of Business and Management, 8(14), 36. http://dx.doi.org/10.5539/ijbm.v8n14p36
Abe, M., Troilo, M., & Batsaikhan, O. (2015). Financing small and medium enter-prises in Asia and the Pacific. Journal of Entrepreneurship and Public Policy, 4(1), 2-32. http://dx.doi.org/10.1108/jepp-07-2012-0036
Abor, J., & Biekpe, N. (2007). Small business reliance on bank financing in Ghana. Emerging Markets Finance and Trade, 43(4), 93-102. http://dx.doi.org/10.2753/ree1540-496x430405
Ayyagari, M., Demirgüç-Kunt, A., & Maksimovic, V. (2010). Formal versus informal finance: Evidence from China. Review of Financial Studies, 23(8), 3048-3097. http://dx.doi.org/10.1596/1813-9450-4465
Baker, H.K., Kumar, S., & Rao, P. (2017). Financing preferences and practices of Indian SMEs. Global Finance Journal, 43. http://dx.doi.org/10.1016/j.gfj.2017.10.003
Becchetti, L., & Trovato, G. (2002). The determinants of growth for small and medium sized firms. The role of the availability of external finance. Small Business Economics, 19(4), 291-306.
Beck, T., Demirgüç-Kunt, A.S.L.I., & Maksimovic, V. (2005). Financial and legal constraints to growth: does firm size matter? The Journal of Finance, 60(1), 137-177. http://dx.doi.org/10.1111/j.1540-6261.2005.00727.x
Berger, A.N., & Udell, G.F. (1998). The economics of small business finance: The roles of private equity and debt markets in the financial growth cycle. Journal of Banking & Finance, 22(6), 613-673. http://dx.doi.org/10.1016/s0378-4266(98)00038-7
Bilgin, M.H., Marco Lau, C.K., & Demir, E. (2012). Technology transfer, finance channels, and SME performance: New evidence from developing countries. The Singapore Economic Review, 57(03), 1250020. http://dx.doi.org/10.1142/s0217590812500208
Bönte, W., & Nielen, S. (2011). Product innovation, credit constraints, and trade credit: Evidence from a cross-country study. Managerial and Decision Economics, 32(6), 413-424. http://dx.doi.org/10.1002/mde.1546
Carpenter, R.E., & Petersen, B.C. (2002). Is the growth of small firms constrained by internal finance? Review of Economics and Statistics, 84(2), 298-309. http://dx.doi.org/10.1162/003465302317411541
Carter, N.M., Brush, C.G., Gatewood, E.J., Greene, P.G., & Hart, M.M. (2003). Financing high-growth enterprise: Is gender an issue. In Critical junctures in women’s economic lives: A collection of symposium papers. Ed. The Centre for Economic Progress, Minneapolis, MN (pp. 45-51).
Cassar, G., & Holmes, S. (2003). Capital structure and financing of SMEs: Australian evidence. Accounting & Finance, 43(2), 123-147. http://dx.doi.org/10.1111/1467-629x.t01-1-00085

Asian Journal of Business and Accounting 13(2), 2020 23
Financing Resources of SMEs and Firm Performance: Evidence from Korea
Classen, N., Carree, M., Van Gils, A., & Peters, B. (2014). Innovation in family and non-family SMEs: An exploratory analysis. Small Business Economics, 42(3), 595-609. http://dx.doi.org/10.1007/s11187-013-9490-z
Cosh, A., Cumming, D., & Hughes, A. (2009). Outside entrepreneurial capital. The Economic Journal, 119(540), 1494-1533.
Degryse, H., de Goeij, P., & Kappert, P. (2012). The impact of firm and industry characteristics on small firms’ capital structure. Small Business Economics, 38(4), 431-447. http://dx.doi.org/10.1007/s11187-010-9281-8
Dogra, B., & Gupta, S. (2009). An empirical study on capital structure of SMEs in Punjab. IUP Journal of Applied Finance, 15(3), 60.
Dong, Y., & Men, C. (2014). SME financing in emerging markets: Firm characteristics, banking structure and institutions. Emerging Markets Finance and Trade, 50(1), 120-149. http://dx.doi.org/10.2753/ree1540-496x 500107
González, V.M., & González, F. (2012). Firm size and capital structure: Evidence using dynamic panel data. Applied Economics, 44(36), 4745-4754. http://dx.doi.org/10.1080/00036846.2011.595690
Gregory, B.T., Rutherford, M.W., Oswald, S., & Gardiner, L. (2005). An empirical investigation of the growth cycle theory of small firm financing. Journal of Small Business Management, 43(4), 382-392. http://dx.doi.org/10.1111/j.1540-627x.2005.00143.x
Gschwandtner, A. (2005). Profit persistence in the ‘very’ long run: Evidence from survivors and exiters. Applied Economics, 37(7), 793-806. http://dx.doi.org/10.1080/0003684042000337406
Kang, J.W., & Heshmati, A. (2008). Effect of credit guarantee policy on survival and performance of SMEs in Republic of Korea. Small Business Economics, 31(4), 445-462. http://dx.doi.org/10.1007/s11187-008-9144-8
Kim, J.H., Hong, S.H., & Choo, B.T. (2007), Applications of structural equation modeling in management studies: A critical review. Korean Management Review, 36(4), 897-923.
Kimhi, A. (1997). Intergenerational succession in small family businesses: Borrowing constraints and optimal timing of succession. Small Business Economics, 9(4), 309-318.
Korean Chamber of Commerce and Industry. (2014). Ways to improve the financing structure of SMEs. Research Report.
La Rocca, M., La Rocca, T., & Cariola, A. (2011). Capital structure decisions during a firm’s life cycle. Small Business Economics, 37(1), 107-130. http://dx.doi.org/10.1007/s11187-009-9229-z
Lokhande, M.A. (2011). Financial inclusion: Options for micro, small and medium enterprises. Synergy (0973-8819), 9(2).
Lopez-Gracia, J., and Aybar-Arias, C. (2000). An empirical approach to the financial behavior of small and medium sized companies. Small Business Economics, 14(1), 55-63.

Hung Sik Kim and Kyung-Shick Cho
24 Asian Journal of Business and Accounting 13(2), 2020
López-Gracia, J., & Sogorb-Mira, F. (2008). Testing trade-off and pecking order theories financing SMEs. Small Business Economics, 31(2), 117-136. http://dx.doi.org/10.1007/s11187-007-9088-4
Lu, J.W., & Beamish, P.W. (2006). SME internationalization and performance: Growth vs. profitability. Journal of International Entrepreneurship, 4(1), 27-48. http://dx.doi.org/10.1007/s10843-006-8000-7
Lumpkin, G.T. (1998). Do young firms have an entrepreneurial orientation? In annual meeting of the Academy of Management, San Diego.
Mallick, S., & Yang, Y. (2011). Sources of financing, profitability and produc-tivity: First evidence from matched firms. Financial Markets, Institutions & Instruments, 20(5), 221-252. http://dx.doi.org/10.1111/j.1468-0416.2011. 00170.x
Masiak, C., Block, J.H., Moritz, A., Lang, F., & Kraemer-Eis, H. (2019). How do micro firms differ in their financing patterns from larger SMEs? Venture Capital, 21(4), 301-325. http://dx.doi.org/10.1080/13691066.2019.1569333
Michaelas, N., Chittenden, F., & Poutziouris, P. (1999). Financial policy and capital structure choice in UK SMEs: Empirical evidence from company panel data. Small Business Economics, 12(2), 113-130.
Mina, A., Lahr, H., & Hughes, A. (2013). The demand and supply of external finance for innovative firms. Industrial and Corporate Change, 22(4), 869-901. http://dx.doi.org/10.1093/icc/dtt020
Moscalu, M., Girardone, C., & Calabrese, R. (2019). SMEs’ growth under financing constraints and banking markets integration in the euro area. Journal of Small Business Management, 1-40. http://dx.doi.org/10.1080/00472778.2019.1668722
Myers, S.C. (1984). The capital structure puzzle. The Journal of Finance, 39(3), 574-592. http://dx.doi.org/10.3386/w1393
Myers, S.C., & Majluf, N.S. (1984). Corporate financing and investment decisions when firms have information that investors do not have. Journal of Financial Economics 13, 187–221. http://dx.doi.org/10.3386/w1396
Nunes, P.M., Viveiros, A., & Serrasqueiro, Z. (2012). Are the determinants of young SME profitability different? Empirical evidence using dynamic estimators. Journal of Business Economics and Management, 13(3), 443-470. http://dx.doi.org/10.3846/16111699.2011.620148
Ogawa, K., Sterken, E., & Tokutsu, I. (2013). The trade credit channel revisited: evidence from micro data of Japanese small firms. Small Business Economics, 40(1), 101-118. http://dx.doi.org/10.1007/s11187-011-9344-5
Oliveira, B., & Fortunato, A. (2006). Firm growth and liquidity constraints: A dynamic analysis. Small Business Economics, 27(2-3), 139-156. http://dx.doi.org/10.1007/s11187-006-0006-y
Ooi, J.T. (2000). Managerial opportunism and the capital structure decisions of property companies. Journal of Property Investment & Finance, 18(3), 316-331. http://dx.doi.org/10.1108/14635780010338317

Asian Journal of Business and Accounting 13(2), 2020 25
Financing Resources of SMEs and Firm Performance: Evidence from Korea
Paul, S., Whittam, G., & Wyper, J. (2007). The pecking order hypothesis: Does it apply to start-up firms? Journal of Small Business and Enterprise Development, 14(1), 8-21. http://dx.doi.org/10.1108/14626000710727854
Petersen, M.A., & Rajan, R.G. (1994). The benefits of lending relationships: Evidence from small business data. The Journal of Finance, 49(1), 3-37. http://dx.doi.org/10.1111/j.1540-6261.1994.tb04418.x
Raju, D., & Annamalai, T.R. (August, 2015). Firm growth, capital choice preferences, and impact on performance: Evidence from the SME Industry. Paper presented at 28th Australasian Finance and Banking Conference, Sydney, Australia. http://dx.doi.org/10.2139/ssrn.2647869
Tsuruta, D. (2008). Bank information monopoly and trade credit: do only banks have information about small businesses? Applied Economics, 40(8), 981-996. http://dx.doi.org/10.1080/00036840600771155
Ughetto, E. (2008). Does internal finance matter for R&D? New evidence from a panel of Italian firms. Cambridge Journal of Economics, 32(6), 907-925. http://dx.doi.org/10.1093/cje/ben015
Watson, R., & Wilson, N. (2002). Small and medium size enterprise financing: A note on some of the empirical implications of a pecking order. Journal of Business Finance & Accounting, 29(3-4), 557-578. http://dx.doi.org/10.1111/ 1468-5957.00443
Winborg, J., & Landström, H. (2001). Financial bootstrapping in small businesses: Examining small business managers’ resource acquisition behaviors. Journal of Business Venturing, 16(3), 235-254. http://dx.doi.org/ 10.1016/s0883-9026(99)00055-5

Hung Sik Kim and Kyung-Shick Cho
26 Asian Journal of Business and Accounting 13(2), 2020
Appendix: Description of Variables
Variable Acronym Definitions
Dependent Variables Performance ROA divide net profit by total assetsEfficiency AT divide net sales by total assets
Independent variables (Financing) Internal finance IF divide the sum of retained earnings, retained capital, and depreciation by total debtInstitutional finance JF divide a long-term and a short-term borrowing including Korean currency and foreign currency by total debtNon-institutional finance BF divide corporate bonds by total debtTrade credit FF dividing sum account payable and note payable by total debt
Potential Sales growth SG divide sales year to date minus sales in the previous year by sales in the previous year
Firm characteristics Firm size SIZE log (sales, million won)Volatility VOL Standard deviation of net profit for five years from the previous year to the year concernedFirm age AGE log (Years from listing date to analysis period).