Financing Property 2012 - Savills Ireland · Financing Property 2012 ... But, in this presentation...
95
Financing Property 2012 Theme: Who’s in charge – borrowers, lenders or politicians? Our 24 th annual series of presentations
Transcript of Financing Property 2012 - Savills Ireland · Financing Property 2012 ... But, in this presentation...

Financing Property 2012 Theme: Who’s in charge – borrowers, lenders or politicians?
Our 24th annual series of presentations

William Newsom The Property Finance Market
Presentation contents
Mat Oakley The Commercial Property Markets
Faisal Choudhry The Residential Property Markets
Joan Henry The Irish Property Markets
Angus Potterton Conclusions
Angus Potterton Introduction

What are the biggest issues facing the property finance market today?
The Property Finance Market - contents
What has triggered the structural change?
What is the nature of the structural change?
Annual lending activity going forward
Note: This is a re-run (and update) of presentations made in June 2012

What are the biggest issues facing the property
finance market today?
During May 2012, I met 46 property lenders, borrows and market participants
So many different answers, but the main ones were ....
To paraphrase Bill Clinton: “It’s the economy stupid”
The regulatory environment – Basel, Slotting, Solvency, etc.
Scarcity of capital; allocation of capital to property lending; the increased cost of it
In this context, the regulators are in charge
Banks deleveraging
The future of secondary. Whilst fundamental, it is merely a question of pricing.
Some secondary values continue to fall, whilst other assets represent great
opportunities

Other issues raised, but no less important
The crisis in the Eurozone. But no one knows how it will pan out. However, life
will carry on. London is well placed to weather the storm (in some cases
benefiting)
The funding gap. But the world is awash with equity. Trouble is, it’s not in the
right place (not enough with the banks)
The scarcity of suitable product to lend against, particularly for those chasing
prime opportunities. What’s new?
The cost of unwinding swaps. It is a huge issue for existing loan books. It is a
“known known”. The five years burn off by 31.12.2013. Long dated swaps
remain a serious problem
Everything takes so long – purchases, refinancing, approvals processes, extra
layers of due diligence (“business prevention officers”), decision making

But above all, it’s a market full of contradictions
Some say “the market is closed”, or “there’s no new lending”, or “the Germans are
going home”, or “development finance is non-existent”, etc. One borrower (with 40+
years experience) said “This is the worst time ever to raise finance”
But yet:
I have 200+ names of lending organisations in my sights (both commercial and
residential, some coming, some going). The equivalent figure in 1994 was 140
I can name (and will) 16 organisations who can write a cheque for £100M or more
I can name (but won’t) another 50 organisations who are actively lending above
£10M. But, in this presentation I name 75 players in the market
At the Residential Development Funding Conference on 15 March 2012, I named
37 organisations that provide such finance (both senior and mezz). Albeit
selectively
A development company recently received over a dozen offers of finance for a
large office property in central London (7 years income, then total redevelopment)
Why so many contradictions?
Because the property finance market is currently going through huge structural
change
A transition from ‘traditional’ bank lenders to a whole new generation of ‘non-
traditional’ lenders
A transition from those with legacy issues to those without
A transition from those subject to ‘heavy’ regulation to those without (or less of it).
In that context, the regulators are in charge

What has triggered the structural change?
A very favourable lending environment (from a lender’s point of view), attracting
new players into the market (A)
The regulatory environment – for UK banks, that is slotting (B)
Dealing with reducing the debt mountain
I will now examine A and B

-2%
-1%
0%
1%
2%
3%
4%
5%
The message is the same but more so: “Now is a
brilliant time to be lending” (quoted 2009, 2010, 2011)
4.0
4.5
5.0
5.5
6.0
6.5
7.0
7.5
8.0
Gross cost of money (GCoM): 5
year swap and interest rate margin
0%
1%
2%
3%
4%
5%
6%
7%
8%
9%
UK Base Rate
20yr High Coupon Gilts
IPD All Property Equivalent Yield(monthly index)
5yr Semi-annual Interest RateSwaps
2008 2009 2010 2011 2012 2008 2009 2010 2011 2012
A Property yields remain high ...
B The cost of debt remains low ...
C And the spread between
property yields and the cost of
money remains wide
Provided you have the liquidity
2008 2009 2010 2011 2012
IPD APEY less GCoM
8.0%
7.5%
7.0%
6.5%
6.0%
5.5%
5.0%
4.5%
4.0%
A
C
B

Interest rate margins have increased by 100 bps over
the last 9 months. Where do they go from here?
Forecast. Everyone says that they will continue to increase. Correct
However, at the truly prime end, where there is competitive pressure, there is potential for
them to decrease (there are examples of this)
Source: De Montfort University
0
100
200
300
400
500
600
1999 2000 2001 2002 2003 2004 2005 2006 2007 2008 2009 2010 2011 2012 2013 2014
Prime Office
Secondary Office
Forecast
bps
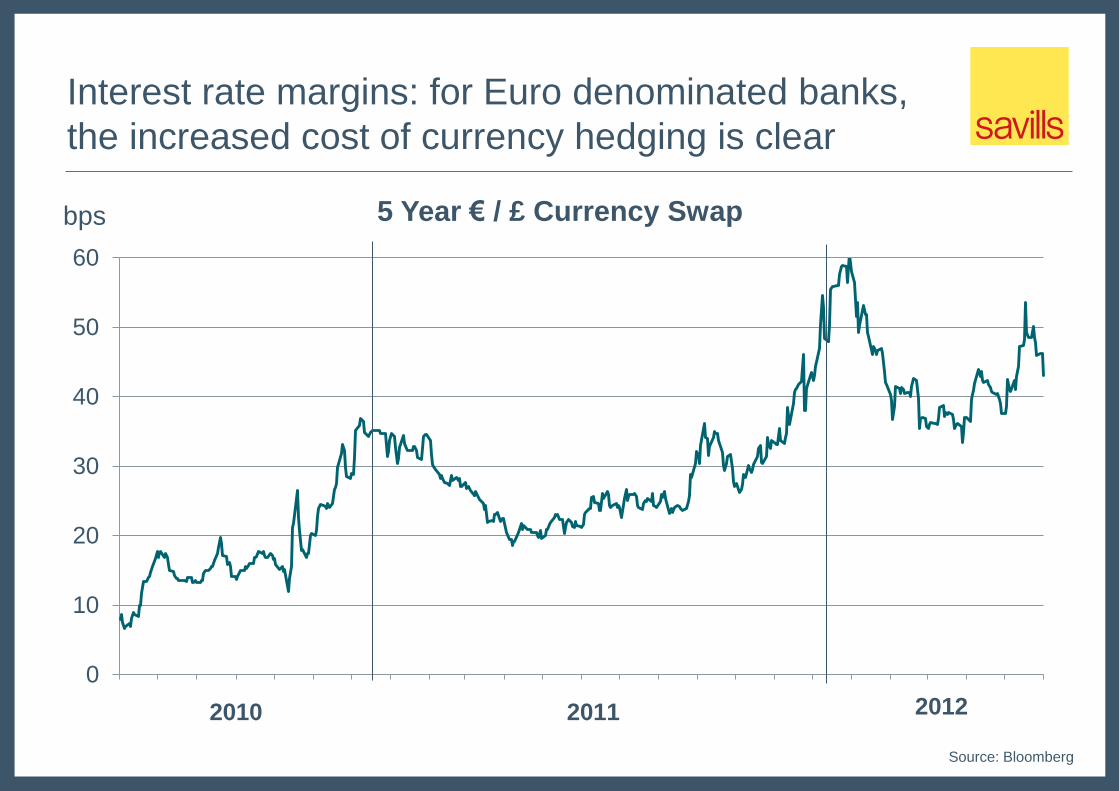
Interest rate margins: for Euro denominated banks,
the increased cost of currency hedging is clear
0
10
20
30
40
50
60
5 Year € / £ Currency Swap
2010 2011 2012
Source: Bloomberg
bps

LTVs: same old story – good for lenders, not so good
for borrowers
Source: De Montfort University
55%
60%
65%
70%
75%
80%
85%
1999 2000 2001 2002 2003 2004 2005 2006 2007 2008 2009 2010 2011
Average maximum LTV ratios for investment sectors
LTV’s have continued to go south; along with higher ICRs, higher margins, higher
arrangement fees, more comprehensive documentation and longer timescales
But there is a consequence of these more onerous lending terms ...
Prime office
Secondary office

The distinction between segments of the capital stack
has become blurred
Because of higher margins, ICRs and fees etc, raising debt finance has become less
attractive for property owners
The structural change is such that for many traditional lenders, their biggest competitors
are those with equity to invest
Source: Savills
Equity 5-15%
Mezzanine/B Notes
5-15% @
Libor + 200/300 bps
Senior debt /
A note 75-
80% @ Libor
+ 75/100 bps
Pre-credit crunch stack Capital stack today
Equity
Senior debt
Preferred equity
Mezzanine
Stretched senior
Slice Target return Comments
/cost
70%-100% 5% - 20%
50%-85% 8% - 15% Have been known
to provide the
senior debt slice too
Up to
50%-65% 6% - 10%

The regulatory environment – for UK banks, that is
slotting
An FSA imposed risk weighting model. Very technical
Under slotting, all loans are to be assessed annually, not just new loans
The EBA is imposing higher Tier 1 capital ratios anyway. Slotting is on top of that
– leading to even higher capital requirements
The process: all property loans are assessed by reference to five criteria and
then slotted into one of four slots: strong, good, satisfactory or weak. Different
risk weightings: 70%, 90%, 115% and 250% respectively
Is being rolled out now. Being phased with different speeds for different banks
Impact? One UK Bank told me it will need nearly three times the capital as a
result of slotting
Which is huge. Two thirds of all lending has been by UK lenders. The UK banks
needs tens of millions of additional capital just to stand still
So what are the consequences of slotting?
Existing loan books: The banks will be under pressure to accelerate the process of
deleveraging. More sales of loan books and other workout scenarios
New lending: UK banks will be constrained
Loans slotted ‘satisfactory’ or ‘weak’ or ‘default’: a no-go area for UK banks?
Banks need to raise more capital. But can they?
Impact for property? We see it as positive. As it will accelerate the sale of loan books (and
other workout scenarios). Which will accelerate resolution of legacy issues. Which will
accelerate sales and/or active management of individual properties. Much needed
Strangely, development finance fits well into slotting (less than 2.5 years). Recent
research by IPD suggests slotting provides “perverse incentive”
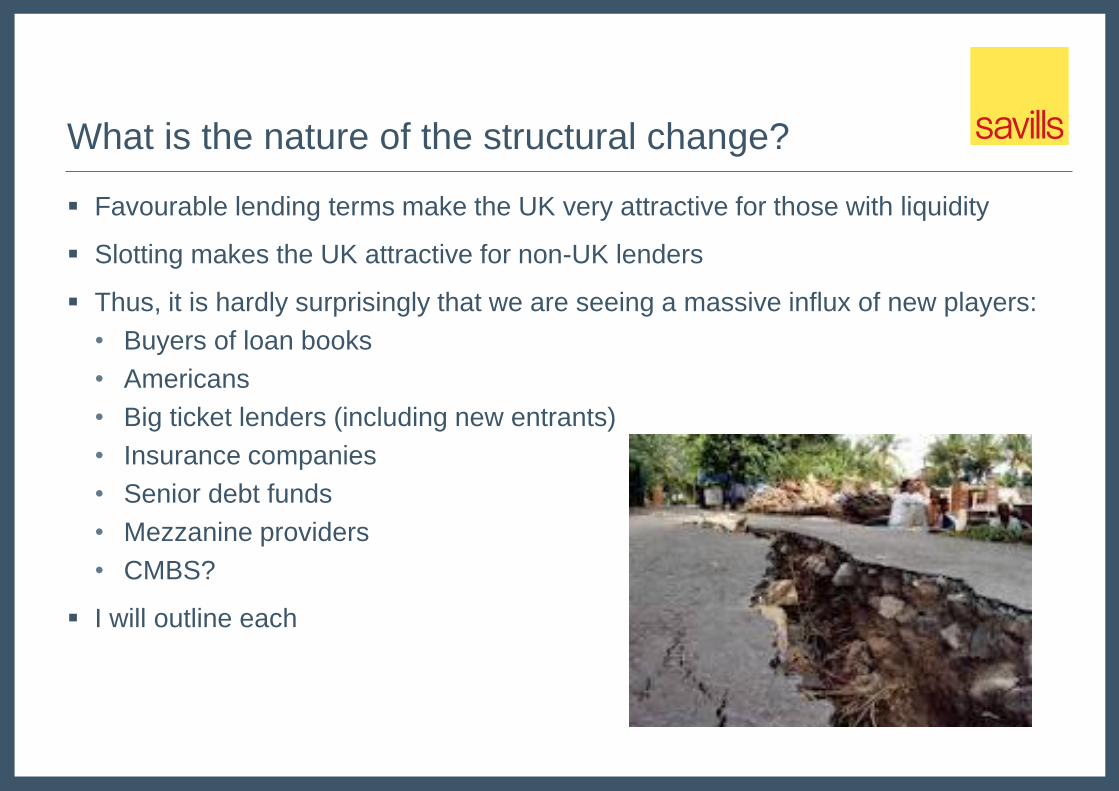
What is the nature of the structural change?
Favourable lending terms make the UK very attractive for those with liquidity
Slotting makes the UK attractive for non-UK lenders
Thus, it is hardly surprisingly that we are seeing a massive influx of new players:
• Buyers of loan books
• Americans
• Big ticket lenders (including new entrants)
• Insurance companies
• Senior debt funds
• Mezzanine providers
• CMBS?
I will outline each

At least 6 UK loan books were sold over the
12 months to June 2012
Date Seller Buyer Description Face value Sale price Discount
Jun-11 Anglo Irish
Bank Urbicus
Scottish loan
portfolio £300m Undisclosed -
Sep-11 NAMA Barclay Brothers Maybourne Hotels £696m £696m 0%
Oct-11 Bank of
Ireland Kennedy Wilson UK loan portfolio £1.75bn c£1.4bn 20%
Dec-11 RBS Blackstone Project Isobel £1.36bn £950m 30%
Dec-11 Lloyds Lone Star Project Royal £923m c£550m 30-40%
Dec-11 NAMA Morgan Stanley
REI
Saturn/West
Properties £216m c£75m 60-70%
Mar-12 Eurohypo AXA UK loan portfolio £200m Undisclosed -
Apr-12 Bundesbank PIMCO Lehman’s Diversity
CMBS £1.14bn C£740m 30-40%
£6.585bn
Source: Real Estate Capital Magazine
Note the number of American buyers Sources of finance? Mixed

At least 5 portfolios of property loans were on the
market in June 2012
Seller Portfolio Name Description/notes Nominal
value
Lloyds Banking
Group
Project
Harrogate/
Royal II
Portfolio of 70 loans secured against
about 60 properties, all UK. All in
default
£625m
Allied Irish Bank Project Pivot Mainly small ticket commercial property,
all UK
£400m
Allied Irish Bank Project Kildare Portfolio of commercial property in
Ireland
€645M
Lloyds Banking
Group
Project Prince A mixed portfolio of Irish properties.
Understood to be under offer @ 18
cents/€ to Kennedy Wilson and
Deutsche Bank
€360M
NAMA Chrome Portfolio Understood to be under offer to Pears
Group/Dev Secs
£100M
Source: Real Estate Capital Magazine
Pricing? Large discounts to par may be necessary to get them away

I am forecasting more loan book sales – over some
years to come
Source: De Montfort University and Savills
Further increased loan sales as the cost of unwinding five year swaps written before 31.12.2008 burns off
Not seeing more loan sales till now is in line with expectation, as various stages of market evolution were
necessary before loan sales were to emerge in earnest
0
2
4
6
8
10
12
2010 2011 2012 2013/14 2015/16 2017/18
3 to 7 year play
£800M
£4.0bn
£8 bn+
£10 bn p.a.
£8 bn p.a.
£bn Forecast
£6 bn p.a.

Never before (in 20+ years) have I seen so many
Americans in this market (or looking at it)
A selection of them:
AIG
Apollo
AREA
Bank of America
Blackstone
Cerberus
Chalkhill
Citigroup
Colony Capital
Deutsche Bank
Fortress
GE Capital
Goldman Sachs
Jeffries International
Kennedy Wilson
KKR
Lone Star
Mass Mutual / Cornerstone
Met Life
Morgan Stanley
New York Life
Och Ziff
Perella Weinberg
PIMCO
Pramercia REC
Pricoa
Starwood
Wells Fargo
Westbrook Partners
Source: Savills
What’s that say about the market? The Americans feel more in charge of their destiny. The
US is ahead of us on the curve. The UK offers excellent risk adjusted returns. However, I
think size of platform matters. They will be focused on the larger portfolios/lot sizes

Lenders are seeking larger lot sizes
5%
12%
19%
4%
29% 31%
0%
5%
10%
15%
20%
25%
30%
35%
< £1m £1-4.9M £5-9.9M £10-19.9M £20-49.9M > £50M
Typical loan size in 2011: proportion of organisations’ new lending
Source: De Montfort University
This is a precursor for my list of bigger ticket lenders/...
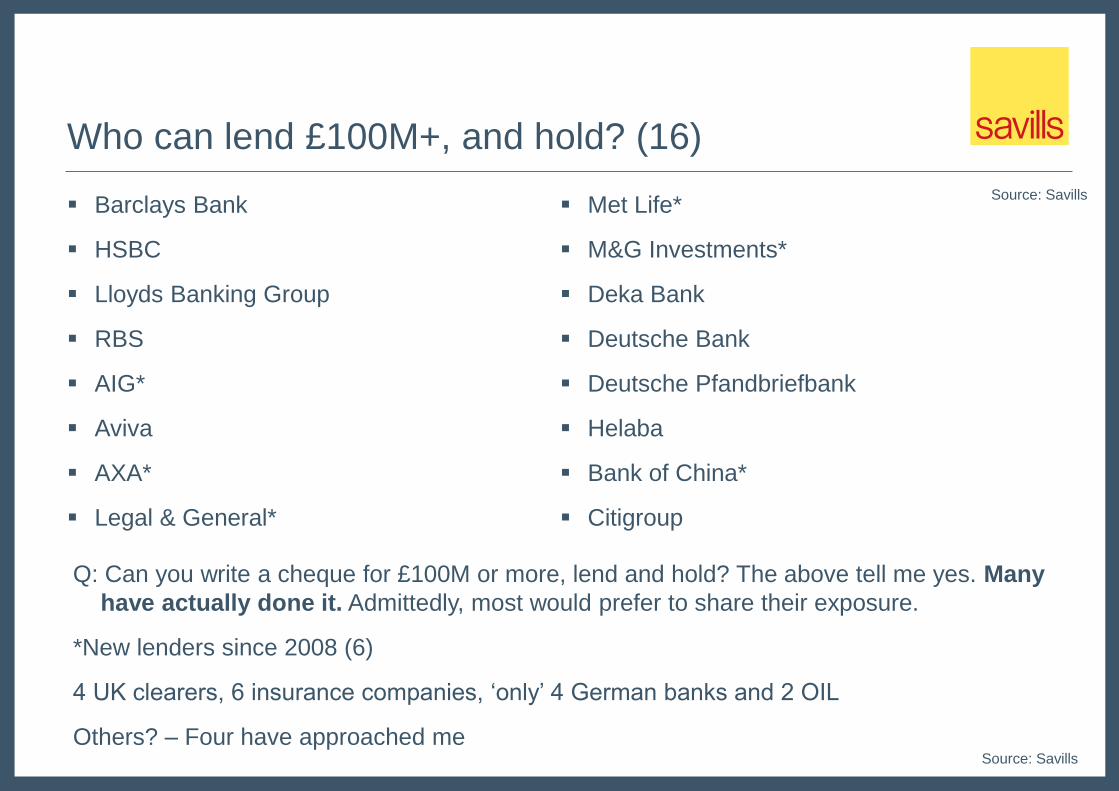
Who can lend £100M+, and hold? (16)
Barclays Bank
HSBC
Lloyds Banking Group
RBS
AIG*
Aviva
AXA*
Legal & General*
Met Life*
M&G Investments*
Deka Bank
Deutsche Bank
Deutsche Pfandbriefbank
Helaba
Bank of China*
Citigroup
Source: Savills
Q: Can you write a cheque for £100M or more, lend and hold? The above tell me yes. Many
have actually done it. Admittedly, most would prefer to share their exposure.
*New lenders since 2008 (6)
4 UK clearers, 6 insurance companies, ‘only’ 4 German banks and 2 OIL
Others? – Four have approached me
Source: Savills

Insurance companies potentially offer huge liquidity
The top 4/5 insurance companies together lent approximately £4bn in 2011, 15% of total lent
Source: Savills
Company Started * Comment
Canada Life 1980 Well established direct property investment and lending team
Aviva 1983 Very active lenders; long term lending; min 15 years
Met Life 2000/2010 Very active lenders
AXA 2008 Very active taking participations. Reported to be doing their first bilateral
M&G Inv. 2009 Very active lenders of both senior and mezzanine
Legal & General 2011 Recently announced their first property lending deal
AIG 2012 Recently announced their first property lending deal
Pricoa/Prudential of US 2012 Recently announced their desire to lend in UK
Mass Mutual/ Cornerstone 2012 Recently announced their desire to lend in UK
Allianz Pending Very active in Europe, but no Sterling denominated business (yet)
Predica Pending The insurance arm of Credit Agricole. Actively lending in France
New York Life Pending Reported to be looking at the UK
*Approx. date they started lending against UK commercial property

Why are insurance companies having such a
good time?
No Basel; nor Slotting; just Solvency 2 (referred to last year) which is considered to be
relatively benign
No capital adequacy issues; real money investors with cash to invest
Little or no legacy issues
Can lend over £100M without the need for participants/clubs (and often do it)
The UK Insurance companies have the back up of experienced direct property investment
teams with analysts. Aviva also has a long standing established property lending platform
No cross-border currency issues for UK insurance companies
No shortage of opportunities
Often lower margins (225-250 bps, above the gilt) and higher LTVs (60%-65%). A magic
combination for borrowers prepared to sign up long term

Many senior debt funds are being set up. Examples:
Source: Real Estate Capital Magazine
Manager Fund raising Strategy
Aeriance Investments €500m Will make senior loans and buy good quality portfolios
AEW Europe €500m
Senior debt fund taking participations up to €50m from banks
Agfe £1.0bn Targeting fixed-income investors
CBRE Global
Investors
€1.0bn Talking to large investors about club deals, investing in stretched and senior
and whole loans
Cordea Savills N/A Potentially moving into senior lending alongside mezzanine for prime
residential fund
Fortress Invest. Group N/A Targeting higher margin senior loans
Goldman Sachs $3bn+ Global debt fund, targeting senior and subordinated loans
Henderson Global $700-800m Joint venture between property and fixed income teams. Initial focus on UK
and Germany
Morgan Stanley $1bn Global debt fund
Renshaw Bay N/A Backed by Jacob Rothschild and South African Reinet Investments
Schroders - In June, announced they were considering entering real estate lending
Starwood €1bn Targeting higher margin senior loans in UK and Germany
Some are at an early stage of fund raising. I don’t think that, or the precise legal structure or
strategy matters. This all represents market capacity

There is a huge number of players seeking to provide
mezzanine ...
To illustrate this, I name half (18) my list of 36 ‘non-traditional’ mezzanine lenders
Probably a third (6) of those named are responsible for 75%+ of the total mezzanine activity
Source: Savills
• Agfe
• Cairn Capital
• Contour Capital (R)
• Davon/Strata Fund (R)
• Duet/DRC Capital
• Ekistics (R)
• European Risk Capital
• European Special
Opportunities
• La Salle Mgt (R)
• Longbow/Rockpoint (R)
• Maslow Cap/Dragonfly (R)
• Och Ziff Cap. Mgt (R)
• Omni Capital (R)
• Partners Group
• Pluto Cap/Mountgrange (R)
• Pramerica
• Safanad (R)
• Urban Exposure (R)
R = Also named on my residential list
Note: Excludes ‘traditional’ lending organisations (9+) that also provide mezzanine

... but how much business are they doing?
In 2010, 6 organisations reported mezzanine lending of £500M
In 2011, the following was reported
Mezzanine lending still remains a tiny element of total loan books at less than
1%. But huge scope for expanding that
One issue is finding a senior debt provider. Some mezz providers resort to
providing the senior too
Source: De Montfort University
Lenders No. of
providers
Mezzanine
provided
‘Traditional’ bank 9 £784M
‘Non-traditional’ 8 £339M
17 £1,123M

So, what’s all that add up to in terms of
annual lending activity going forward?

Annual lending activity: how much money will be
available to be lent?
In terms of new loans, 2011 turned out to be in line with forecast – notwithstanding a perceived
reduction in activity during H2. Why? Impact of new lenders?
I am expecting at least one third of new loans to come from ‘non-traditional’ lenders
Source: De Montfort University & Savills
£0
£10
£20
£30
£40
£50
£60
£70
£80
£90£83.7bn
bn
£15.1bn
£27.5bn
£36bn
Savills’ Forecast
June 2011. June
2012 unchanged!
Extended loans
New loans
Annual value of loan originations
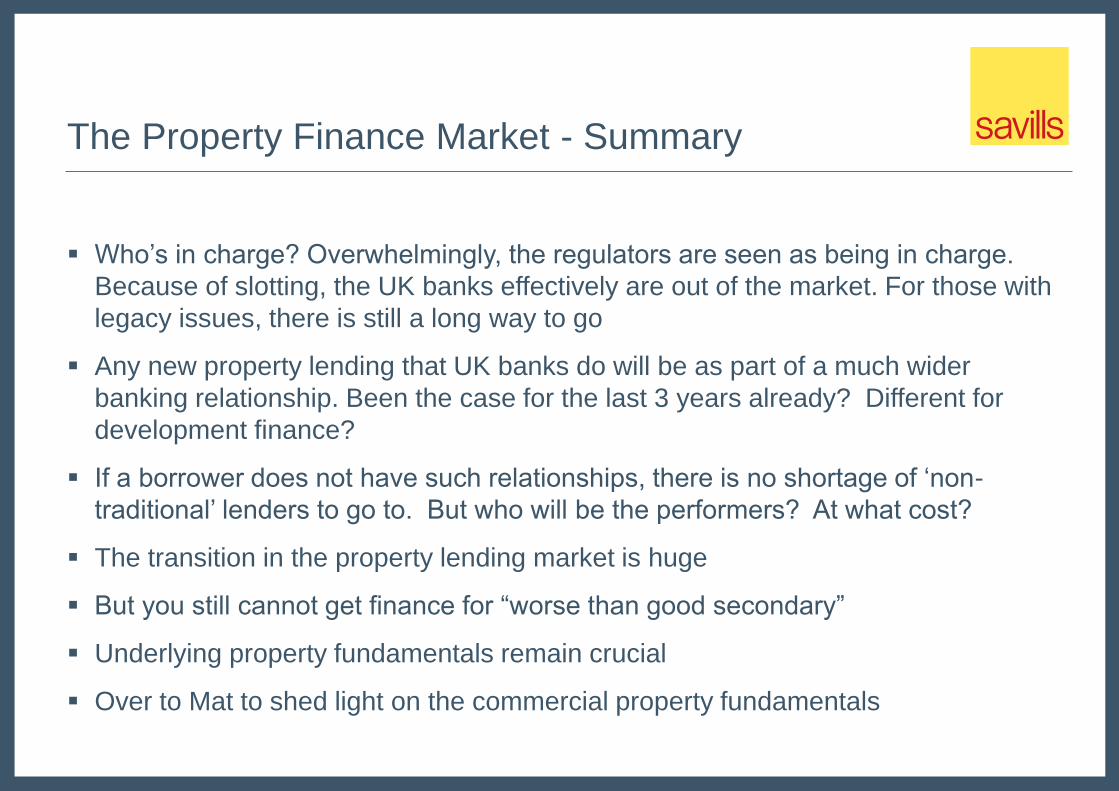
The Property Finance Market - Summary
Who’s in charge? Overwhelmingly, the regulators are seen as being in charge.
Because of slotting, the UK banks effectively are out of the market. For those with
legacy issues, there is still a long way to go
Any new property lending that UK banks do will be as part of a much wider
banking relationship. Been the case for the last 3 years already? Different for
development finance?
If a borrower does not have such relationships, there is no shortage of ‘non-
traditional’ lenders to go to. But who will be the performers? At what cost?
The transition in the property lending market is huge
But you still cannot get finance for “worse than good secondary”
Underlying property fundamentals remain crucial
Over to Mat to shed light on the commercial property fundamentals

Outlook for UK commercial Can a normal market be resumed in a debt-drought?
Mat Oakley

Investment turnover has recovered
0%
10%
20%
30%
40%
50%
60%
70%
80%
0
10,000
20,000
30,000
40,000
50,000
60,000
70,000
2000 2002 2004 2006 2008 2010 2012 to Aug
Rest
of
UK
as %
of
To
tal
£m
Rest of UK
London
RoUK % of Total
Source: Property Data, Savills

Where is the market functioning?
London investment and part pre-let development generally fundable
by debt/equity
Prime investment around the UK restrained by confidence, not
necessarily funding
Small shops and large shopping centres all appear tradeable
Big sheds always popular in risk-averse times

Development is clearly fundable in central London,
though the undersupply story remains credible
Source: Savills
0
2
4
6
8
10
12
14
198
5
198
6
198
7
198
8
198
9
199
0
199
1
199
2
199
3
199
4
199
5
199
6
199
7
199
8
199
9
200
0
200
1
200
2
200
3
200
4
200
5
200
6
200
7
200
8
200
9
201
0
201
1
201
2
201
3
201
4
201
5
m s
q f
t
Development Refurbishment Average

Where isn’t the market functioning?
Source: Savills
0
1
2
3
4
5
6
7
8
9
10
Sh
op
pin
g c
en
tre d
evelo
pm
en
t m
sq
ft

Risk aversion continues to widen the yield spread
0
50
100
150
200
250
300
350
400
450
500
bp
s
Prime/Tertiary spread
Prime/Secondary spread
Source: Savills

We remain in a risk-filled world

More risk means continued risk aversion
Non-domestic investors will continue to be attracted to the UK as a “safe-
haven”
London bias will remain, and this will support investment and
development
Shopping centres, leisure and retail warehouse parks will pick up in
popularity
Regional development will remain scarce
Tenants prepared to pre-let will drive some markets. What will happen to
those who cant?
Prime yields remain low (and possibly go lower)
Secondary and tertiary continue to rise (until they attract the risk-
embracers)

What else is different?
Less new debt available and more old debt to pay off
Weaker economic recovery
Vacancy rates lower due to less overbuilding
Structural change in retail
Impending bulge in lease expiries (good and bad thing)
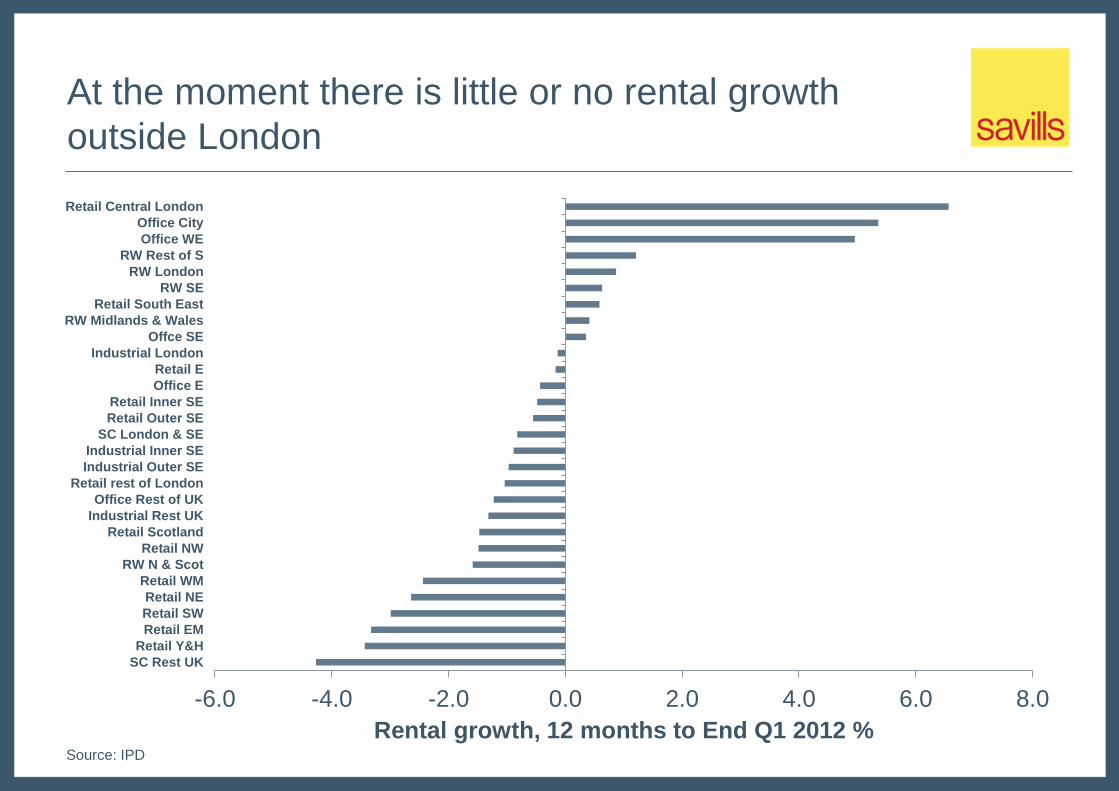
At the moment there is little or no rental growth
outside London
-6.0 -4.0 -2.0 0.0 2.0 4.0 6.0 8.0
SC Rest UK
Retail Y&H
Retail EM
Retail SW
Retail NE
Retail WM
RW N & Scot
Retail NW
Retail Scotland
Industrial Rest UK
Office Rest of UK
Retail rest of London
Industrial Outer SE
Industrial Inner SE
SC London & SE
Retail Outer SE
Retail Inner SE
Office E
Retail E
Industrial London
Offce SE
RW Midlands & Wales
Retail South East
RW SE
RW London
RW Rest of S
Office WE
Office City
Retail Central London
Rental growth, 12 months to End Q1 2012 % Source: IPD
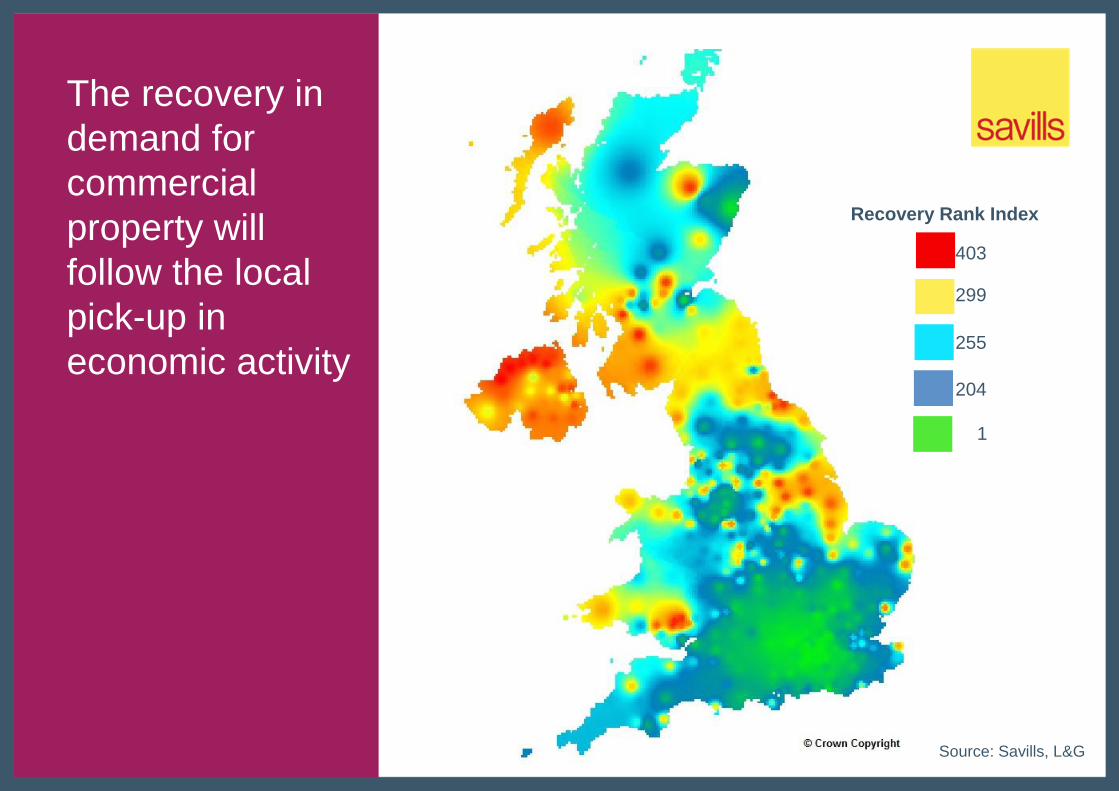
The recovery in
demand for
commercial
property will
follow the local
pick-up in
economic activity
Source: Savills, L&G
299
255
204
1
Recovery Rank Index
403
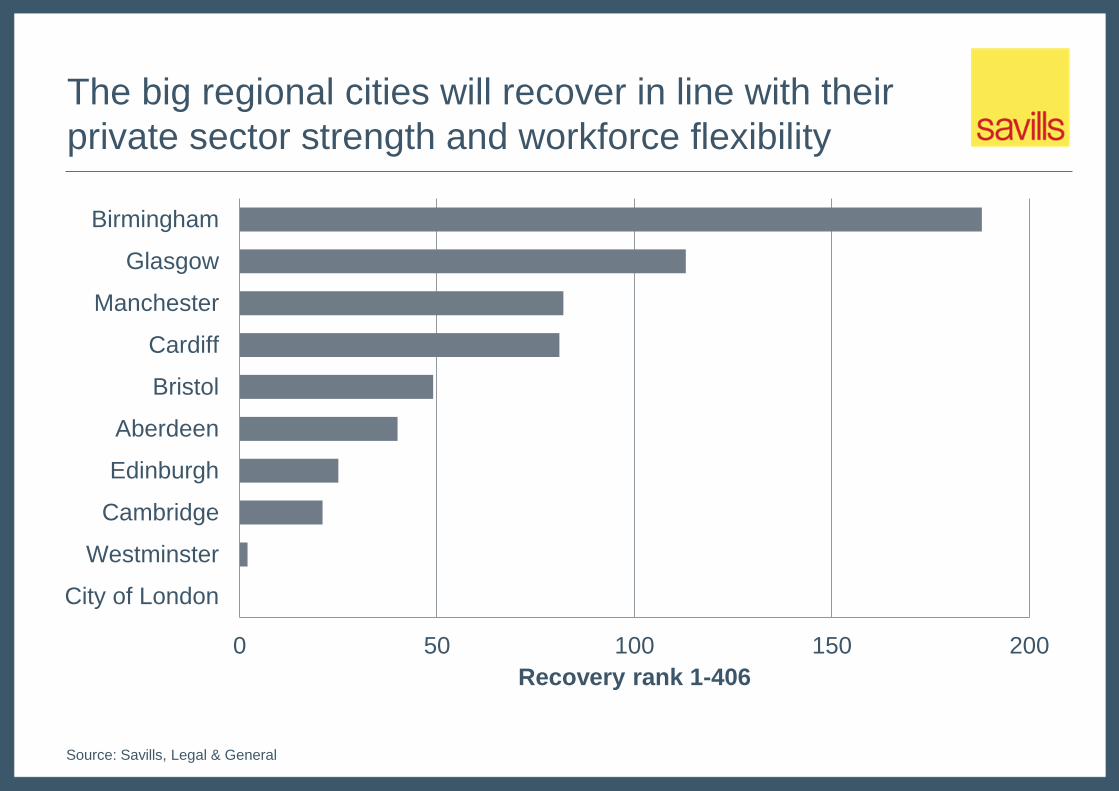
The big regional cities will recover in line with their
private sector strength and workforce flexibility
0 50 100 150 200
City of London
Westminster
Cambridge
Edinburgh
Aberdeen
Bristol
Cardiff
Manchester
Glasgow
Birmingham
Recovery rank 1-406
Source: Savills, Legal & General

Where does structural change leave the “tertiary grot”?
Realistic pricing of property or loan books will enable re-pricing of
rents
Policy help will be needed to resuscitate some locations e.g.
Removal of empty rates liability
Allow temporary change of use to more beneficial uses?
Allow permanent change of use to residential?
Give LEP’s more ability to designate local areas of need?

The best rental growth might not be in the most
obvious “safe” locations
Office:
Strong regional cities where private sector strength balances public sector
contraction
+
Restrained or non-existent development pipeline
=
Better rental growth prospects in some regional cities than in London?
Retail:
Structural change is underway
Some towns will never recover without policy/financial help
But, internet is an opportunity for some segments of retail
Affluent/equity-rich catchments will remain the location of choice
Logistics:
Safe in difficult times
The anti-internet play?

Outlook for UK Residential Structural change in a debt constrained environment
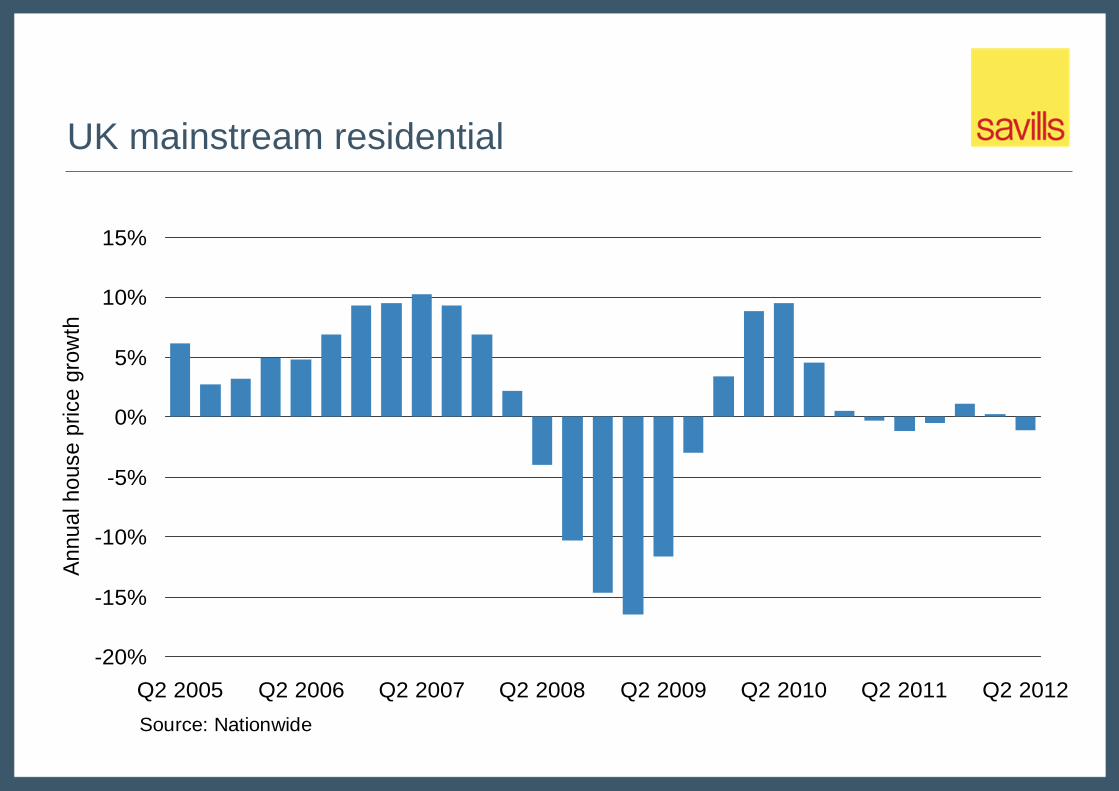
UK mainstream residential
-20%
-15%
-10%
-5%
0%
5%
10%
15%
Q2 2005 Q2 2006 Q2 2007 Q2 2008 Q2 2009 Q2 2010 Q2 2011 Q2 2012
An
nu
al h
ouse
price
gro
wth
Source: Nationwide

UK residential transactions and mortgage lending
0
50,000
100,000
150,000
200,000
250,000
300,000
350,000
400,000
450,000
500,000
2005Q2 2006Q2 2007Q2 2008Q2 2009Q2 2010Q2 2011Q2 2012Q2
Source: Council of Mortgage Lenders / Land Registry / Registers of Scotland / HMRC
Residential transactions
Number of loans for house purchase lending

The previous ‘stable’ market
0
250,000
500,000
750,000
1,000,000
1,250,000
1,500,000
1,750,000
2,000,000
2,250,0001990
1991
1992
1993
1994
1995
1996
1997
1998
1999
2000
2001
2002
2003
2004
2005
2006
2007
2008
2009
2010
2011
Source: Registers of Scotland / HMRC
Resid
ential tr
ansactions (
UK
)
Actual Average 1990-1999

Core markets outperforming - transactions
Source: Land Registry / Registers of Scotland / HMRC
-45% -40% -35% -30% -25% -20% -15% -10% -5% 0%
South West
Greater London
South East
East Anglia
East Midland
Wales
United Kingdom
West Midland
Yorkshire & Humberside
Scotland
North West
North East
Northern Ireland

Oil price
Source: Index Mundi
0
20
40
60
80
100
120
140
160S
ep-0
7
Dec
-07
Mar
-08
Jun-
08
Sep
-08
Dec
-08
Mar
-09
Jun-
09
Sep
-09
Dec
-09
Mar
-10
Jun-
10
Sep
-10
Dec
-10
Mar
-11
Jun-
11
Sep
-11
Dec
-11
Mar
-12
Jun-
12
Sep-
12
Cru
de O
il U
S$
per
barr
el

UK Gross Domestic Product (percentage change)
2.80% 2.70%
-0.10%
-4.90%
1.40%
0.70%
-0.40%
1.10%
1.90%2.30% 2.40%
-6.00%
-5.00%
-4.00%
-3.00%
-2.00%
-1.00%
0.00%
1.00%
2.00%
3.00%
4.00%
2006 2007 2008 2009 2010 2011 2012 2013 2014 2015 2016
Actual Independent average of new forecasts
Source: HM Treasury
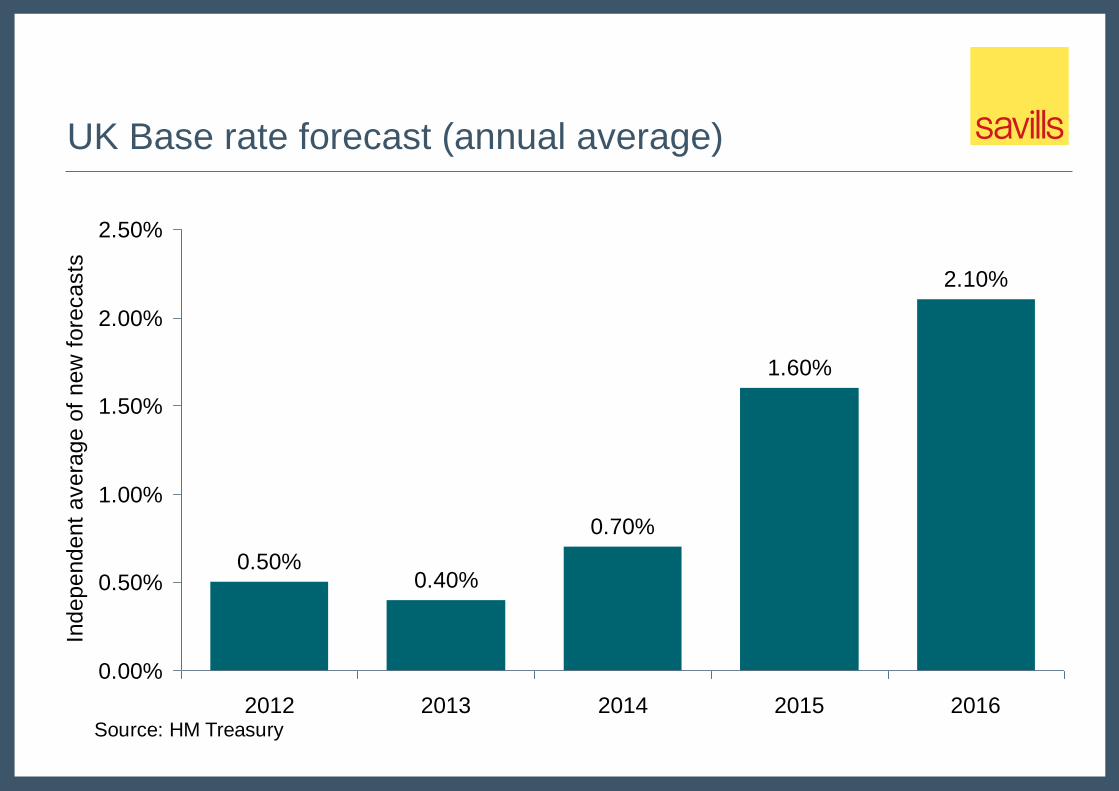
UK Base rate forecast (annual average)
0.50%0.40%
0.70%
1.60%
2.10%
0.00%
0.50%
1.00%
1.50%
2.00%
2.50%
2012 2013 2014 2015 2016
Independent
avera
ge o
f new
fore
casts
Source: HM Treasury
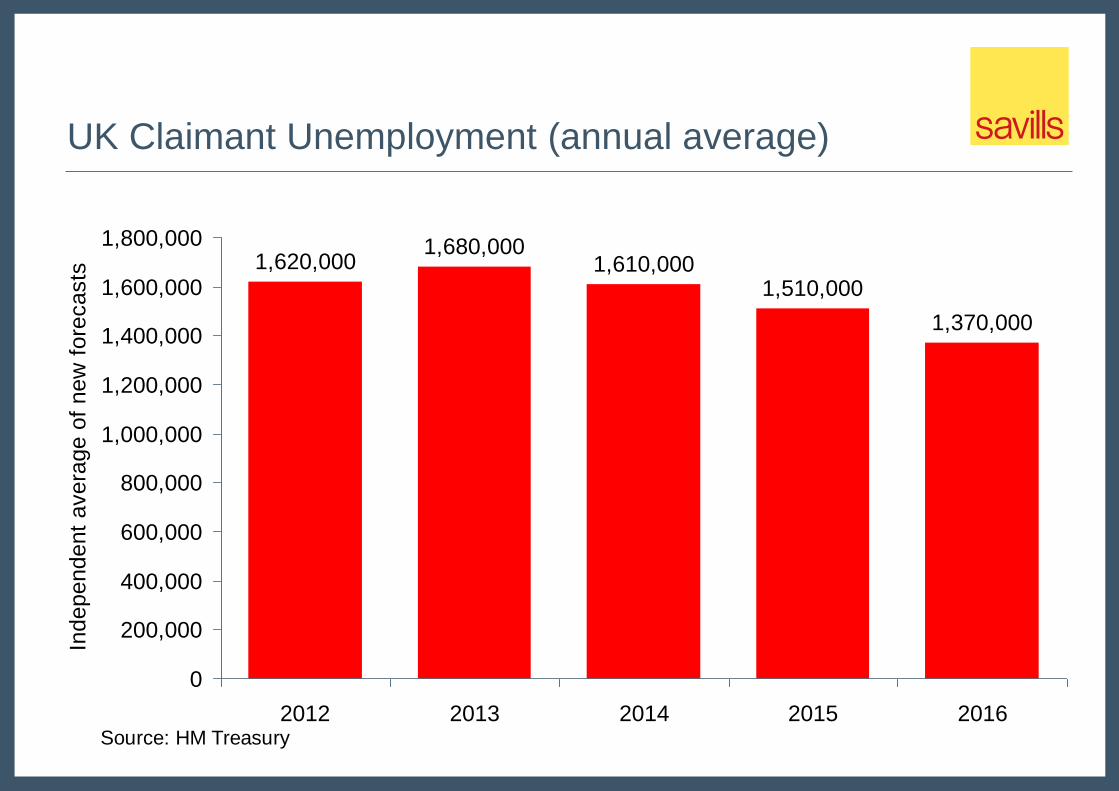
UK Claimant Unemployment (annual average)
1,620,0001,680,000
1,610,0001,510,000
1,370,000
0
200,000
400,000
600,000
800,000
1,000,000
1,200,000
1,400,000
1,600,000
1,800,000
2012 2013 2014 2015 2016
Ind
ep
end
ent
ave
rage
of
ne
w f
ore
ca
sts
Source: HM Treasury
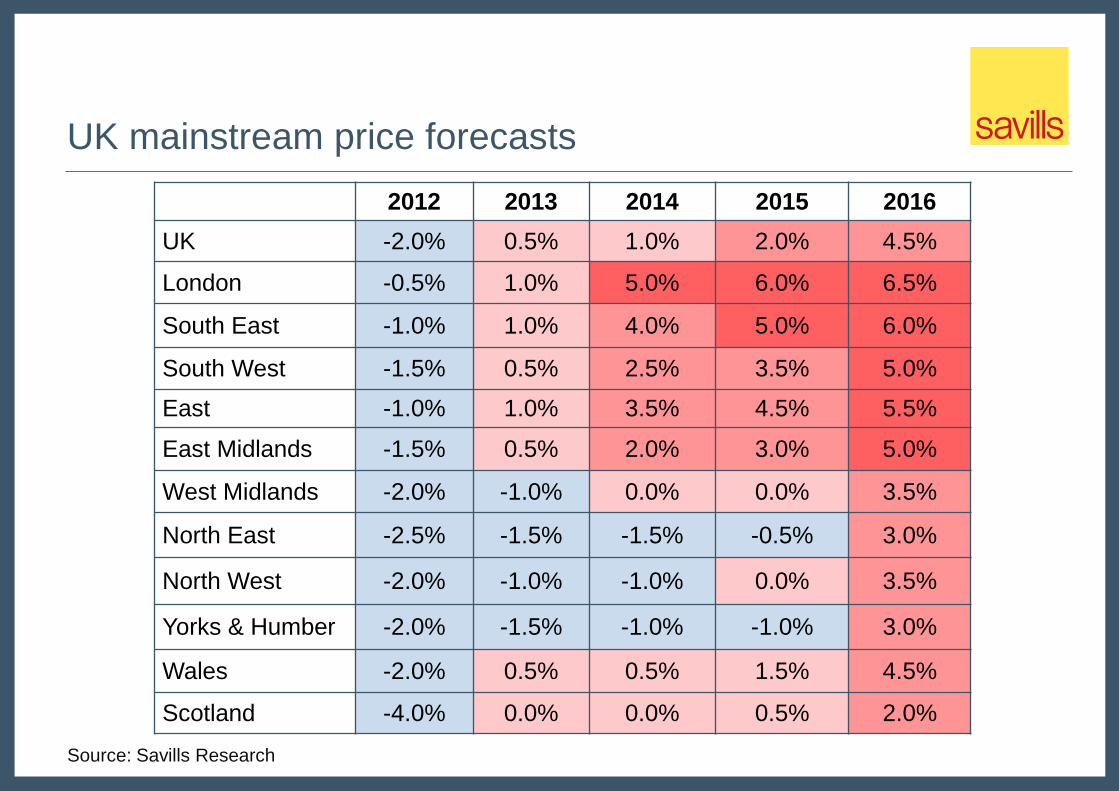
UK mainstream price forecasts
2012 2013 2014 2015 2016
UK -2.0% 0.5% 1.0% 2.0% 4.5%
London -0.5% 1.0% 5.0% 6.0% 6.5%
South East -1.0% 1.0% 4.0% 5.0% 6.0%
South West -1.5% 0.5% 2.5% 3.5% 5.0%
East -1.0% 1.0% 3.5% 4.5% 5.5%
East Midlands -1.5% 0.5% 2.0% 3.0% 5.0%
West Midlands -2.0% -1.0% 0.0% 0.0% 3.5%
North East -2.5% -1.5% -1.5% -0.5% 3.0%
North West -2.0% -1.0% -1.0% 0.0% 3.5%
Yorks & Humber -2.0% -1.5% -1.0% -1.0% 3.0%
Wales -2.0% 0.5% 0.5% 1.5% 4.5%
Scotland -4.0% 0.0% 0.0% 0.5% 2.0%
Source: Savills Research

UK mainstream transaction forecasts
0
250,000
500,000
750,000
1,000,000
1,250,000
1,500,000
1,750,0002006
2007
2008
2009
2010
2011
2012
2013
2014
2015
2016
Source: HMRC / Savills Research
Resid
ential tr
ansactions
Actual Forecast

UK prime market
-30%
-20%
-10%
0%
10%
20%
30%
40%
2005Q2 2006Q2 2007Q2 2008Q2 2009Q2 2010Q2 2011Q2 2012Q2
Year
on Y
ear
change in v
alu
e
Prime Central London Prime Regional
Source: Savills Research

Prime London
Prime London driven by
Global wealth - influenced by global economy
Safe haven status
Currency advantage
Recycling of accumulated domestic wealth
Threats
Excessive economic uncertainty (UK and EU)
Taxation

UK residential development
Source: DCLG / Reuters
Estim
ate
-80
-40
0
40
80
120
160
200
240
280
320
360
400
440
(40,000)
(20,000)
-
20,000
40,000
60,000
80,000
100,000
120,000
140,000
160,000
180,000
200,000
220,000
2003 2004 2005 2006 2007 2008 2009 2010 2011
Avera
ge g
ross p
rofil (m
illio
n)
Private
housin
g c
om
ple
tions (
UK
)
Private housing completions Average profit of top 8 housebuilders
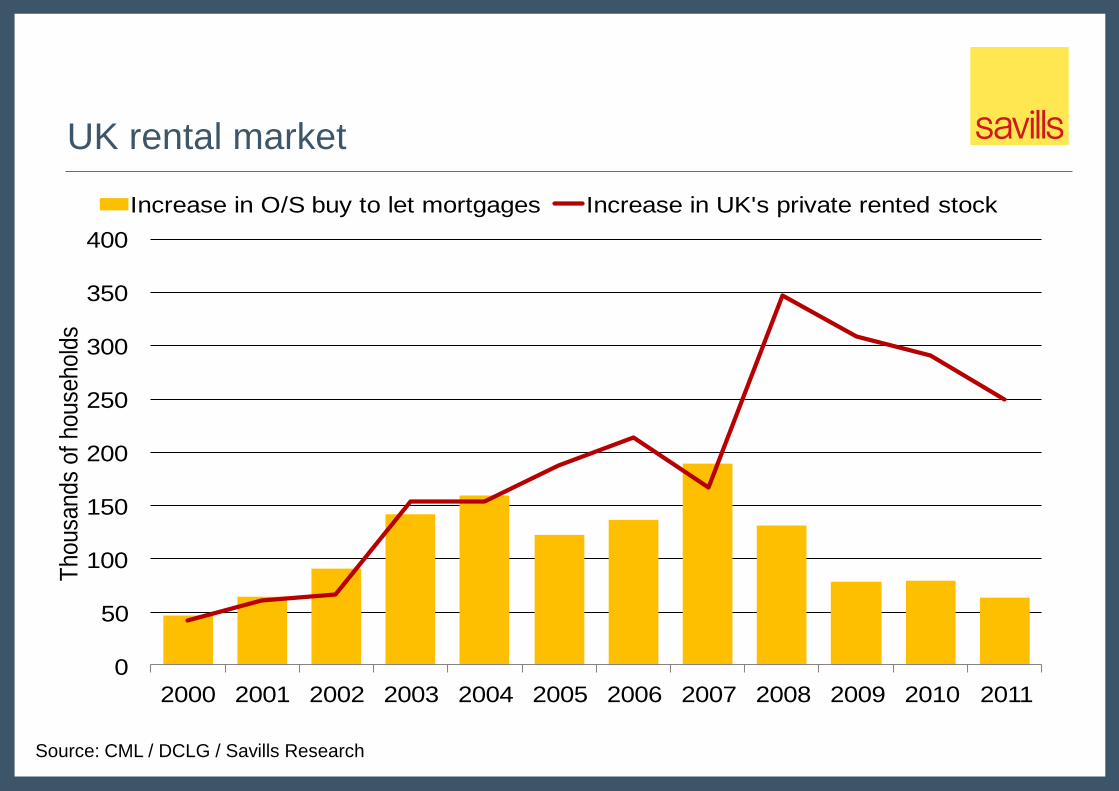
UK rental market
Source: CML / DCLG / Savills Research
0
50
100
150
200
250
300
350
400
2000 2001 2002 2003 2004 2005 2006 2007 2008 2009 2010 2011
Thousa
nds
of
house
hold
s
Increase in O/S buy to let mortgages Increase in UK's private rented stock

Investment Matrix
Less than
6.0% 6.0% to 6.5% 6.5% to 7.0% 7.0% to 7.5% 7.5% to 8.0% Over 8.0%
Less than
50%
Brighton &
Hove
Greater London
Elmbridge
50% to 55% Southend
Bournemouth
Bristol
Colchester
Oxford
Southampton
Reading
Woking
55% to 60% Northampton Portsmouth
Medway Milton Keynes
60% to 65%
Edindurgh
Stockport
Warrington
Cardiff Leicester
Nottingham
65% to 70% Bradford
Newcastle
Leeds
Manchester
Sheffield
Coventry
Birmingham
Over 70% Kirklees Glasgow
Liverpool
Forecast Total Returns 2011 - 2021
Pro
po
rtio
n o
f To
tal R
etu
rn f
rom
Ren
t
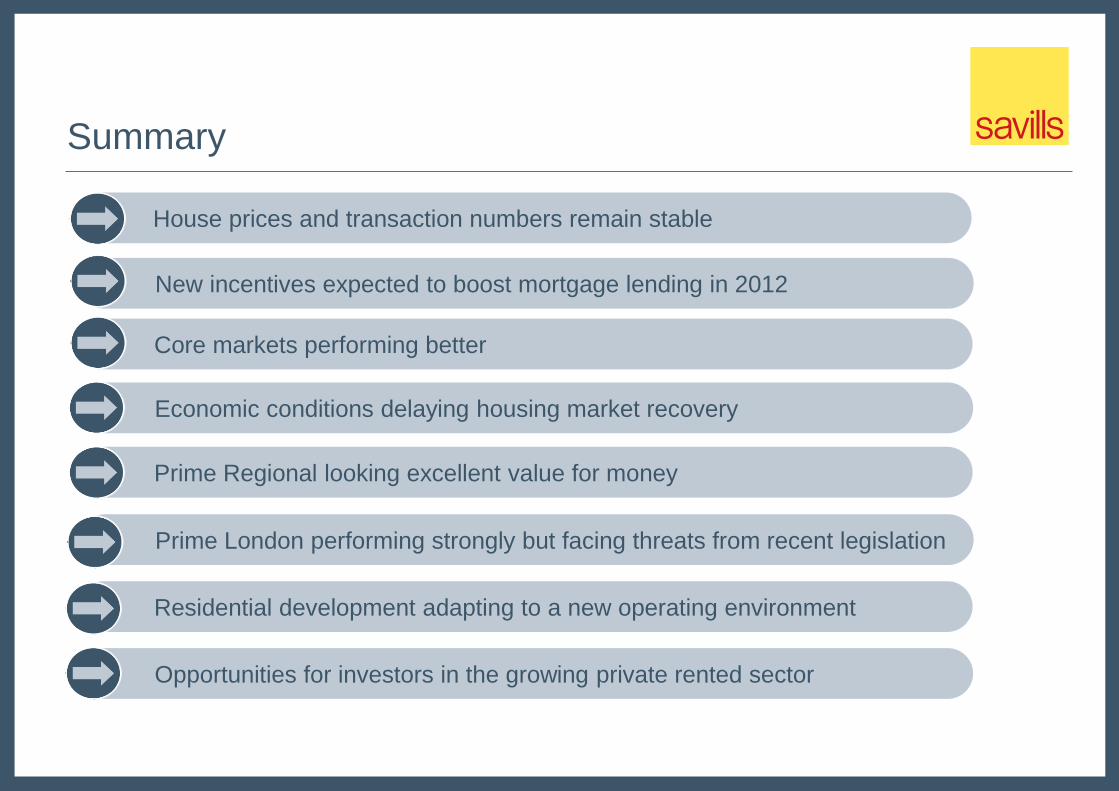
House prices and transaction numbers remain stable
Summary
New incentives expected to boost mortgage lending in 2012
Prime Regional looking excellent value for money
Core markets performing better
Economic conditions delaying housing market recovery
Prime London performing strongly but facing threats from recent legislation
Residential development adapting to a new operating environment
Opportunities for investors in the growing private rented sector

Irish Property Market Overview
Joan Henry

Commercial Market Commercial Market
Prime occupier markets holding their own Occupier demand led market activity
Investment market come to life again Investment market stagnant
Market Context
Housing Market Housing Market
Some pick up, rental dominates Activity Weak across the board
Prices remain under pressure Continued fall in prices
Structural problems will drag on recovery
2012 2011

Property Market Overview
2. Occupier Markets
Offices
Retail
Industrial
6.
Investment Market 3.
1. Market Context
Conclusions and Challenges
Housing Market 5.
Hotel Market 4.

2. Occupier Markets
Offices

Dublin Office Market
Source: Savills Research
0%
5%
10%
15%
20%
25%
-
50,000
100,000
150,000
200,000
250,000
300,000
350,000
2001 2002 2003 2004 2005 2006 2007 2008 2009 2010 2011 2012
Annual Take-Up sq.m(LHS) Completions sq.m(LHS) Vacancy Rate %(RHS)

Dublin Office Market A closer look...
Take-up
‒ Dominated by Dublin 2&4
‒ 66% of all take-up
‒ Occupier type
Vacancy – e.g. Dublin 2
‒ 12.1% total in D. 2
‒ 4.8% vacancy for Grade A
Add in pic of State Street

Dublin Office Market Deals in 2012
One Park Place,
Hatch Street, Dublin 2
Size: 2,000sqm
Occupier: Irish Life & Permanent
Kilmore House,
Spencer Dock, Dublin 1
Size: 600sqm
Occupier: Ecclesiastical Insurance
East Point Plaza, East Point
Business Park, Dublin 3
Size: 1,400sqm
Occupier: Chase Paymentech

Office Market Outlook
Prime
Rents
Secondary
Rents Completions Supply Demand
2012 Bottomed
out Bottomed out None Diminishing
Dublin 2 & 4 lead,
Grade A
2013 Trending up
Bump along
the bottom None
Trend to
continue
City locations &
Grade A

Occupier Market
Retail

Retail Consumer Sentiment – upward spike followed by slump
Source: KBC/ESRI, Savills Research
35
40
45
50
55
60
65
70
75
2009 2010 2011 2012 Sep 2012

Source: CSO, Savills Research
Retail Retail Sales – remain under pressure, but narrower range
-15%
-10%
-5%
0%
5%
10%
15%
2007 2008 2009 2010 2011 2012
% C
han
ge
Change in Value of Retail Sales for All Retail (excl. Motors)

Retail Key players
Discount Retailers
‒ Aldi / Lidl / Dealz (30 new stores in 2012) /
Euro 2 etc
International Retailers
‒ H & M / Bestseller / DFS / TK Maxx

Dublin Retail Market Deals in 2012
Dubarry
Location: Dublin 2
Size: 170 sqm
Schuh
Location: Pavilions Swords
Size: 302 sqm

Retail Grafton Street / Henry Street Research
Prime retail streets maintain high
occupancy
Grafton Street at 98%
‒ 5% (11 units) trading but available
Henry Street at 100%
‒ 1% (5 units) trading but available
Key Trend to watch
‒ Increased activity on shorter lease
terms and /or
‒ Turnover rents

Retail Market Outlook
Prime
Rents
Secondary
Rents Supply Demand
2012 Bottoming Under
pressure
Prime-limited
Rest -Oversupply
Prime market
“holding its own”
2013 Prime to
stabilise Under pressure Continuation Prime once again

Occupier Market
Industrial

Dublin Industrial Market Take up and vacancy 2006 - 2012
Source: Savills Research
0
200,000
400,000
600,000
800,000
1,000,000
1,200,000
1,400,000
1,600,000
2006 2007 2008 2009 2010 2011 2012 est
(sq
m)
Take up Vacancy

Dublin Industrial Market Key Industrial Deal in 2012
5 & 7 Westgate Business
Park, Ballymount,
Dublin 24
Size: Approximately 6,039 sqm
Occupier: TV3
Forest Park,
Mullingar
Co Westmeath
Size: 2,245 sqm

Industrial Market Outlook
Prime
Rents
Secondary
Rents Supply Demand
2012 Under pressure Close to zero Oversupply Occupier’s market
2013 Close to
secondary Close to zero Continuation Continuation

3. Investment Market

Investment Market Turnover and No. of deals – market is recovering
Source: Savills Research
€ M
illio
ns
Source: Savills Research
0
20
40
60
80
100
120
-
500
1,000
1,500
2,000
2,500
3,000
3,500
2003 2004 2005 2006 2007 2008 2009 2010 2011 2012 2013
No
. o
f D
ea
ls
Tu
rno
ve
r -
€m
Turnover Number of Deals

Riverside II Sir John Rogersons Quay
Lot Size: c. €35m Yield: 8.6%
Investment Market 2012 Deals
Alliance Dublin 4
Lot Size: c. €40m Yield: 6.25%
Residential Deal Office Deal
One Warrington Place Dublin 2
Lot Size: c. €27m Yield: 7.5%
Office Deal

Investment Market Demand/Buyers
Demand Category Category of investment spend
Private/opportunity Equity €20m-€100m plus
Core Institutional Up to €50m
Domestic high net worth Re-emerging up to €25m
Private investors (local & international) €5-15m
Local demand Up to €5m

Investment Market Supply – Large increase
Driven by
Banks (primarily outside NAMA)
Receiverships
c. €400 m stock on Dublin market

Investment Market Outlook
Turnover
Forecast Yields Supply Demand
2012 €500m Stabilising for prime Increasing Active across all
price categories
2013 €700m Stable for prime Increasing Active across all
price categories

4. Hotel Market

Hotel Market Transactional market re-started 2012
Market split by location
Dublin and other cities continue to lead the
recovery in room sales
Varied performance in rural locations
Demand
Domestic and international buyers active
Cash buyers at realistic prices
Bank debt availability is improving

5. Housing Market
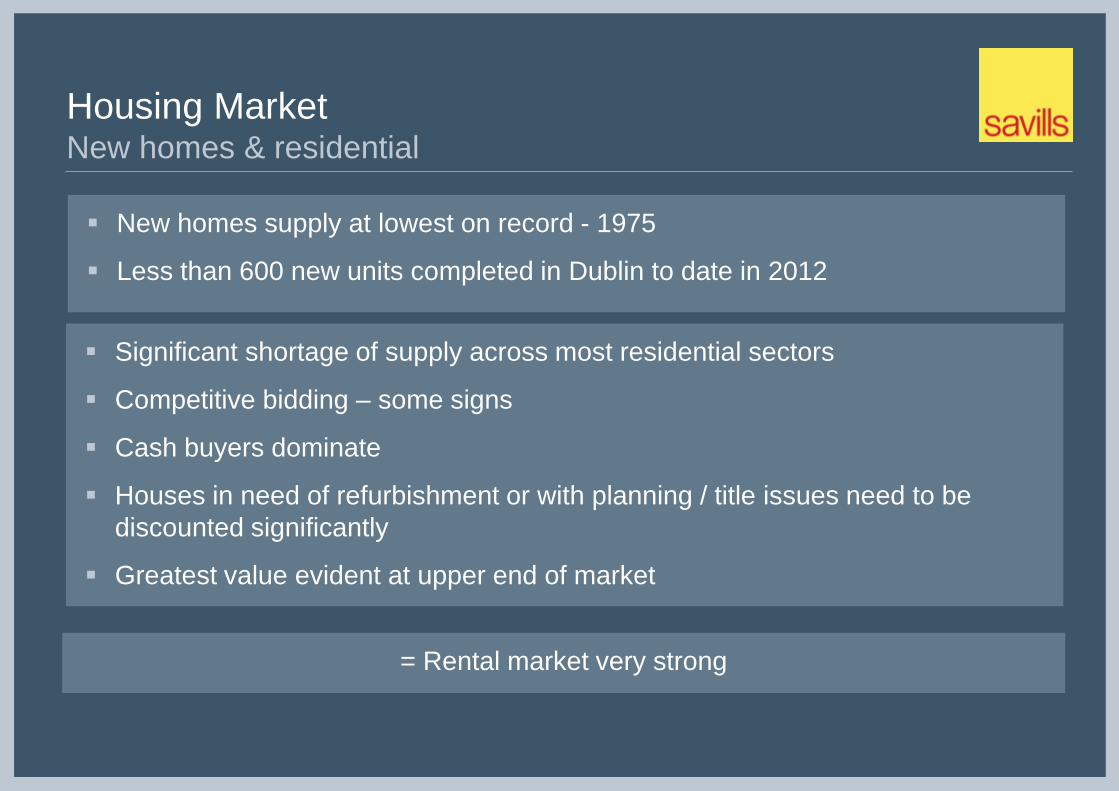
Housing Market New homes & residential
New homes supply at lowest on record - 1975
Less than 600 new units completed in Dublin to date in 2012
Significant shortage of supply across most residential sectors
Competitive bidding – some signs
Cash buyers dominate
Houses in need of refurbishment or with planning / title issues need to be
discounted significantly
Greatest value evident at upper end of market
= Rental market very strong

Housing Market Key Trend to watch - Dublin Stock
Average fall in Stock from February 2011 to July 2012
South County Dublin - 32%
North Dublin - 36%
City Centre - 29%

Housing Market Outlook
Prime
Prices
Secondary
Prices
Supply Demand Challenges
2012 Bottoming Under
pressure
No new units
2nd hand limited
Prime to lead
Rental to
dominate
Confidence
Liquidity
2013
Floor,
limited
upside
Case by
case Continuation
Prime once
again
Confidence
Liquidity

6. Conclusions & Challenges

Conclusions
Occupier markets stable - prime
Investment market recovery
Housing market
Rental to dominate/slow to recover
Conclusions and Challenges
Challenges
Economy / Eurozone
Pricing / Values
Asset Management

Overall Conclusions
Angus Potterton