FINANCING DISASTER MANAGEMENT IN...
283
FINANCING DISASTER MANAGEMENT IN INDIA A Study for the Thirteenth Finance Commission National Institute of Disaster management New Delhi August 2009
Transcript of FINANCING DISASTER MANAGEMENT IN...

FINANCING DISASTER MANAGEMENT
IN INDIA
A Study for the
Thirteenth Finance Commission
National Institute of Disaster management New Delhi
August 2009
FINANCING DISASTER MANAGEMENT IN
INDIA
A Study for the Thirteenth Finance Commission
by
P.G.Dhar Chakrabarti Executive Director
National Institute of Disaster Management New Delhi
August 2009

1
FINANCING DISASTER MANAGEMENT IN INDIA
A Study for the Thirteenth Finance Commission
C O N T E N T
Preface
1. INTRODUCTION 8
2. HAZARD - VULNERABILITY- RISK PROFILE 11
3. DISASTERS AND THEIR TRENDS 27
4. AWARDS OF FINANCE COMMISSIONS 38
5. PATTERN OF EXPENDITURE ON DISASTER MANAGEMENT 49
6. VIEWS OF STATE GOVERNMENTS 69
7. MANDATES OF DISASTER MANAGEMENT ACT 87
8. RESTRUCTURING DISASTER MANAGEMENT FUNDS 101
9. INSTITUTIONAL MECHANISMS 118
10. PRINCIPLES FOR ALLOCATION OF FUND 120
11. RISK TRANSFER, INSURANCE AND REINSURANCE 138
12. RECOMMENDATIONS 153
REFERENCES
ANNEXURES
163
2
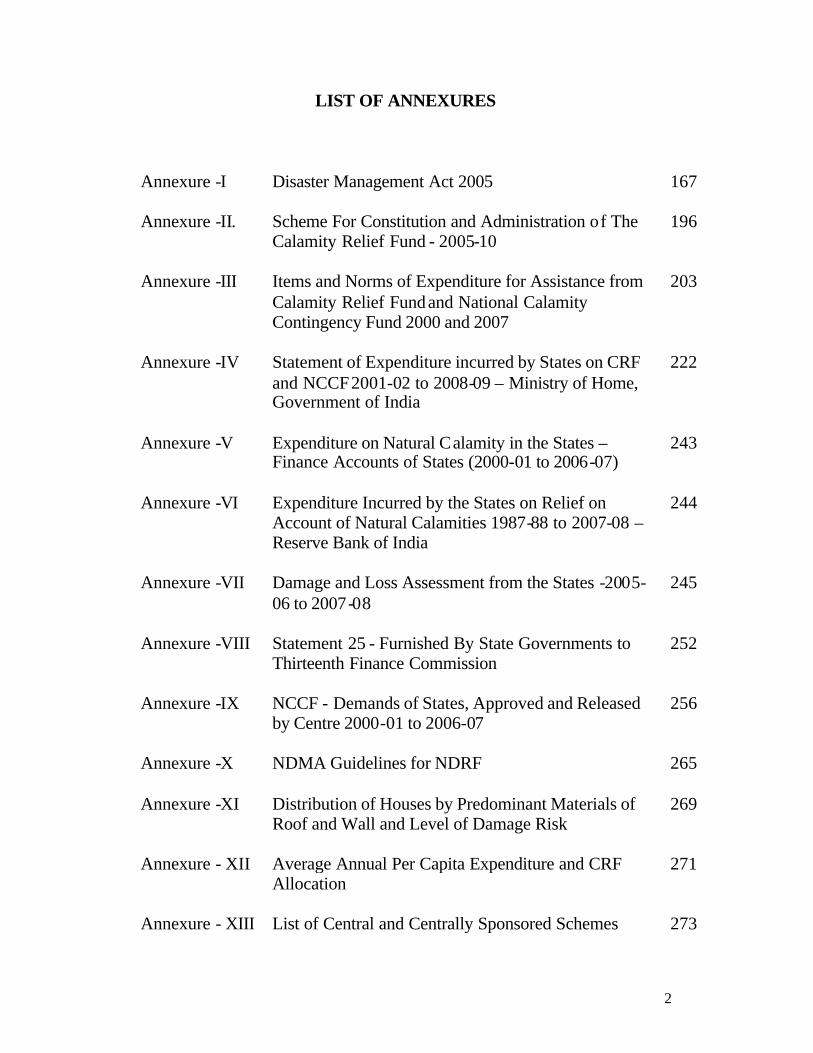
LIST OF ANNEXURES
Annexure -I Disaster Management Act 2005
167
Annexure -II. Scheme For Constitution and Administration of The Calamity Relief Fund - 2005-10
196
Annexure -III Items and Norms of Expenditure for Assistance from Calamity Relief Fund and National Calamity Contingency Fund 2000 and 2007
203
Annexure -IV Statement of Expenditure incurred by States on CRF and NCCF 2001-02 to 2008-09 – Ministry of Home, Government of India
222
Annexure -V Expenditure on Natural Calamity in the States – Finance Accounts of States (2000-01 to 2006-07)
243
Annexure -VI Expenditure Incurred by the States on Relief on Account of Natural Calamities 1987-88 to 2007-08 – Reserve Bank of India
244
Annexure -VII Damage and Loss Assessment from the States -2005-06 to 2007-08
245
Annexure -VIII Statement 25 - Furnished By State Governments to Thirteenth Finance Commission
252
Annexure -IX NCCF - Demands of States, Approved and Released by Centre 2000-01 to 2006-07
256
Annexure -X NDMA Guidelines for NDRF
265
Annexure -XI Distribution of Houses by Predominant Materials of Roof and Wall and Level of Damage Risk
269
Annexure - XII Average Annual Per Capita Expenditure and CRF Allocation
271
Annexure - XIII List of Central and Centrally Sponsored Schemes 273
3
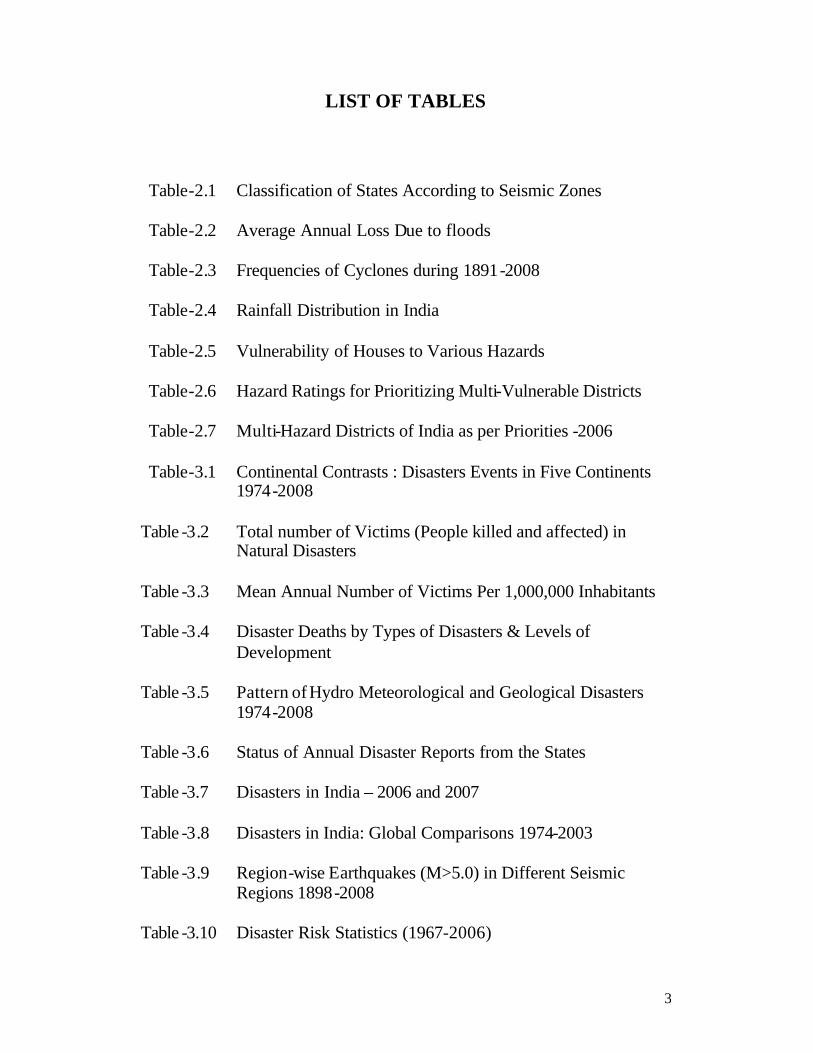
LIST OF TABLES
Table-2.1
Classification of States According to Seismic Zones
Table-2.2
Average Annual Loss Due to floods
Table-2.3
Frequencies of Cyclones during 1891-2008
Table-2.4
Rainfall Distribution in India
Table-2.5
Vulnerability of Houses to Various Hazards
Table-2.6
Hazard Ratings for Prioritizing Multi-Vulnerable Districts
Table-2.7
Multi-Hazard Districts of India as per Priorities -2006
Table-3.1
Continental Contrasts : Disasters Events in Five Continents 1974-2008
Table -3.2 Total number of Victims (People killed and affected) in Natural Disasters
Table -3.3 Mean Annual Number of Victims Per 1,000,000 Inhabitants
Table -3.4 Disaster Deaths by Types of Disasters & Levels of Development
Table -3.5 Pattern of Hydro Meteorological and Geological Disasters 1974-2008
Table -3.6 Status of Annual Disaster Reports from the States
Table -3.7 Disasters in India – 2006 and 2007
Table -3.8 Disasters in India: Global Comparisons 1974-2003
Table -3.9 Region-wise Earthquakes (M>5.0) in Different Seismic Regions 1898-2008
Table -3.10 Disaster Risk Statistics (1967-2006)

4
Table -3.11 Economic Loss Potential of Earthquake, Flood, Cyclone and
Drought
Table - 4.1 Allocation of Margin Money to States
Table - 4.2 Allocation of Calamity Relief Fund
Table-5.1
Relief Expenditure as Percentage of Receipts -Statement 25
Table -5.2 Closing Balance of CRF & NCCF – MHA Data
Table -5.3 Closing Balance of States on Natural Calamities – MoF Data
Table -5.4 State Expenses on Natural Calamities – RBI Data
Table -5.5 Annual Growth of Relief Expenditure of States
Table -5.6 Percentage Share of Relief Expenditure of States
Table -5.7 Adequacy of CRF Allocations – 2000-01 to 2006-07
Table -5.8 NCCF Allocations 2000-01 to 2006-07
Table -5.9 Net Resource Gaps: (Actual Expenditure) – (CRF+NCCF)
Table -5.10 Items of Permissible Expenditure under CRF and NCCF
Table -5.11 Gujarat- Percentage Share of Relief Expenditure: Minor Headwise
Table-5.12
Tamil Nadu- Percentage Share of Relief Expenditure: Minor Headwise
Table -5.13 Distribution of Relief Expenditure by States across Calamities
Table -5.14 Distribution of Relief Expenditure by States across Calamities
Table -5.15 Revised Norms, Scale of Relief and Percentage Increase over Previous Norms
Table-6.1
Expenditure on Relief - Andhra Pradesh
5
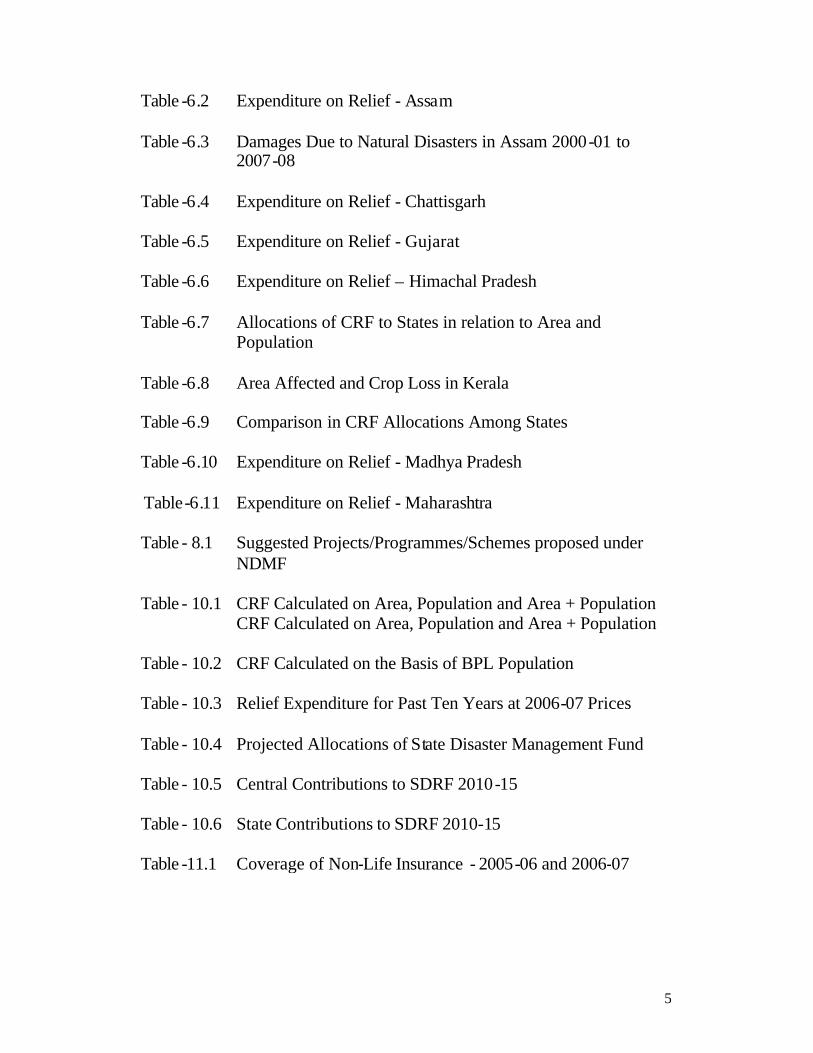
Table -6.2 Expenditure on Relief - Assam
Table -6.3 Damages Due to Natural Disasters in Assam 2000-01 to 2007-08
Table -6.4 Expenditure on Relief - Chattisgarh
Table -6.5 Expenditure on Relief - Gujarat
Table -6.6 Expenditure on Relief – Himachal Pradesh
Table -6.7 Allocations of CRF to States in relation to Area and Population
Table -6.8 Area Affected and Crop Loss in Kerala
Table -6.9 Comparison in CRF Allocations Among States
Table -6.10 Expenditure on Relief - Madhya Pradesh
Table-6.11
Expenditure on Relief - Maharashtra
Table - 8.1 Suggested Projects/Programmes/Schemes proposed under NDMF
Table - 10.1 CRF Calculated on Area, Population and Area + Population CRF Calculated on Area, Population and Area + Population
Table - 10.2 CRF Calculated on the Basis of BPL Population
Table - 10.3 Relief Expenditure for Past Ten Years at 2006-07 Prices
Table - 10.4 Projected Allocations of State Disaster Management Fund
Table - 10.5 Central Contributions to SDRF 2010-15
Table - 10.6 State Contributions to SDRF 2010-15
Table -11.1 Coverage of Non-Life Insurance - 2005-06 and 2006-07
6
PREFACE
The National Institute of Disaster Management was asked by the Thirteenth Finance Commission to conduct a study on Financing Disaster Management in India, particularly with reference to the new funds envisaged in the Disaster Management Act 2005. The specific terms of reference of the study included assessing the hazard risk and vulnerability profiles of the States, analyzing the trends of disasters during the past, examining the pattern of expenses incurred by the States for the management of disasters and suggesting appropriate principle and strategy for determining the allocation of federal finances for management of disasters during the next five yearly fiscal cycle starting from April 2010.
2. The institute organized a National Workshop on Financing Disaster Management in India which was attended among others by the Relief Commissioners of the States, representatives of the various Central Ministries/Departments , economists and experts. Primary and secondary resource materials were collecte d from various Central Ministries/Departments, Reserve Bank of India, Comptroller and Auditor General of India and other sources. Discussions were also held with authorities at various levels.
3. The findings of the study have been presented in twelve chapters. Chapter 1 introduces the study, chapter 2 assesses the hazard, vulnerability and risks of the States and chapter 3 analyses the trends of disasters in the country. Chapter 4 reviews the awards of different Finance Commissions, while chapter 5 examines the pattern of expenses incurred by the States on disaster relief. Chapters 6 presents the views of the State governments in their Memorandums submitted to the Commission. Chapter 7 analyses the provisions of Disaster Management Act to the extent these are relevant for financing
7
disaster management in the country. The next four chapters present the recommendations of the study with regard to restructuring of the funds, institutional mechanism, principles of allocation and risk transfer, insurance and re insurance. The recommendations have been summed up in the concluding chapter.
4. We are thankful to the Finance Commission for entrusting the study to the Institute. We are grateful to Dr. Sanjiv Misra Hon’ble Member of the Commission for his valuable guidance in conducting the study. We are also thankful to Shri Sumit Bose, Member Secretary of the Commission and Shri B.S. Bhullar, Joint Secretary for their valuable inputs from time to time. We hope that the findings of the study shall be useful to the Commission for firming up its recommendations to the Government.
(P.G.Dhar Chakrabarti) Executive Director
National Institute of Disaster Management
Delhi 7 August 2009
8
INTRODUCTION
India is one of the most disaster prone countries in the world . Almost every type of natural and man-made disasters take place in India at regular intervals taking heavy toll of life and causing enormous damages to houses and other infrastructure. Rapid urbanization, unplanned growth of human settlements, unsafe building practices and multiple layers of vulnerabilities have contributed to the rising trends of disaster losses in the country. This has been further compounded by the climate change and its impacts. A World Bank study1 had indicated that India lost about 2.25% of its GDP and 12.15% of its revenue during 1996-2000, which is quite sizeable by any standards. 1.2 The successive Finance Commissions were seized with the issue of financing disaster management by the States. The Second Finance Commission (1955-60) innovated the concept of Margin Money to be set apart as a separate fund for meeting expenses on natural calamities. The margin money allocated to the States by the various Finance Commissions steadily increased from Rs. 13.75 crores during 1955-60 to Rs. 1203.75 crores during 1985-90. The Ninth Finance Commission (1990-95) constituted the Calamity Relief Fund (CRF) to be contributed by the Central and the States Governments on 75:25 basis as non-plan grant. The quantum of fund to be allocated to the States was determined with reference to the actual expenses on relief incurred during the previous decade. The Tenth (1995-2000), Eleventh (2000-2005) and the Twelfth Finance Commissions (2005-2010) retained the CRF scheme with minor modifications. CRF allocation to the States has registered a phenomenal increase from Rs. 4020 crores during 1990-95 to Rs. 21333.33 crores during 2005-10. 1.3 The Tenth Finance Commission had constituted the National Fund for Calamity Relief (NFCR) to deal with catastrophic disasters, which was substituted by National Calamity Contingency Fund (NCCF) by the Eleventh Finance Commission. With an initial corpus of Rs. 500 crores, NCCF is replenished by levy of special surcharges on taxes for a limited period. The NCCF expenditure is also showing a rising trend from Rs. 924.21 crores in 2000-01 to Rs. 3061.44 crores during 2005-06.
1 Financing Rapid Onset Natural Disaster Losses in India: A Risk Management Approach, The World Bank, August 2003, page 8.

9
1.4 The Disaster Management Act 2005 has ushered a complete paradigm shift in disaster management in India. Not only has disaster been defined to include all calamities, natural and man-made, the scope of disaster management itself has changed from post disaster relief to holistic management of disasters which includes prevention, mitigation, preparedness and reconstruction. The Act has created Disaster Management Authorities at the national, state and district level and further set up Disaster Response Fund and Disaster Mitigation Fund at all these three levels. 1.5 Keeping these changes in view, the Thirteenth Finance Commission has been entrusted with a specific mandate to “review the present arrangements as regards financing of Disaster Management with reference to the National Calamity Contingency Fund and the Calamity Relief Fund and the funds envisaged in the Disaster Management Act, 2005 and make appropriate recommendations thereon”. 1.6 The Commission has asked the National Institute of Disaster Management (NIDM) to undertake a comprehensive study of financing the management of natural and man-made disasters in India with particular reference to the Disaster Management Act 2005. The scope of the study is as follows:
a) Assess the hazard, risk and vulnerability profiles of the States and districts in India.
b) Analyze the trend of disasters in India during the past and make realistic projections for the future
c) Examine the pattern of expenses incurred by the States for the management of disasters during the past and project the likely demands of fund during 2010-15.
d) Suggest the most appropriate strategy for constitution of Disaster Response Fund and Disaster Mitigation Fund at the National, State and District levels as mandated by the Disaster Management Act, 2005.
e) Consider alternative methods of financing disaster management.
1.7 The Commission further asked that the following issues shall be covered in the study:
i) Whether the scope of natural calamities, as defined by the successive Finance Commissions needs any revision keeping in view the provisions of the Disaster Management Act 2005.
10
ii) What should be the composition and scope of National Disaster Response Fund (NDRF)? Should it consist of only central share or Sta tes shall also be asked to contribute to it .
iii) What should be the composition and scope of Sta te Disaster Response Fund (SDRF)? Should it consist of state share or Centre shall also contribute to it and if so to what extent.
iv) What should be the principle of allocation of fund to the States? Should the pattern of expenditure on relief incurred by the States in the past be the only criteria or factors like hazards, risks, vulnerabilities of the States be given some weightage in deciding the allocations.
v) What should be the composition of National Disaster Mitigation Fund and State Disaster Mitigation Fund? Should these comprise of Plan grant/loan only or these should have a Non-Plan component as well.
vi) What should be the composition and scope of District Disaster Response Fund and District Disaster Mitigation Fund? What should be the principle of distribution of funds between States and districts?
vii) How catastrophic disasters shall be financed. Should the mechanism of additional duty on central taxes continue for mobilizing resources to finance catastrophic disasters?
viii) What should be the institutional mechanism in the Centre, States and the districts for the management of these Funds? Should the National Disaster Management Authority (NDMA), State Disaster Management Authorities (SDMA) and District Disaster Management Authorities (DDMA) be involved for the management of these Funds?
ix) What should be the mechanism for monitoring the expenditure incurred out of the Funds?
x) What innovative insurance and reinsurance solutions can be found to reduce the recurring expenses on relief?
Methodology
1.8 The NIDM organized a National Workshop on Financing Disaster Management in which State Relief Commissioners, representatives of Central Government Ministries and Departments and experts participated. Primary and secondary resource materials were collected form the Commission, Central Ministries and Departments, State governments, Reserve Bank of India, Comptroller and Auditor General and other sources. Discussions were also held with authorities at various levels before finalizing the study report.

11
HAZRD, VULNERABILITY AND RISK PROFILE
The word disaster derived from the Latin words ‘dis’ meaning bad and ‘aster’ meaning star, conveys a sense of fatalism, which dominated public perception about disasters and even influenced public policies on disaster management, or absence of such policies, in many countries for a long time. 2.2 Scientific knowledge of the hazards of nature and the risks and vulnerabilities of social, economic and living conditions of people have resulted in the understanding that disasters are not at all pre destined but are the outcome of interplay of hazards, risks and vulnerabilities. Hazard is a ‘potentially damaging physical event, phenomenon or human activity that may cause the loss of life or injury, property damage, social and economic disruption or environmental degradation’1. Hazards could be either to due natural factors embedded in geophysical or climatic conditions or these may be induced by human processes. Natural hazards can have different origins: geological (such as earthquakes, landslide, mud flows etc), hydro-meteorological (such as cyclone, flood, hail storm, cloud burst, snow avalanche, heat and cold wave, droughts etc) and biological (such as epidemics, pandemics etc). The manmade hazards can be due to technology failure or human error (such as industrial, nuclear or chemical failure) or deliberate design (such as war or terror attacks) or environmental degradation (such as water or air pollution, degradation of sub surface reserve, climate change etc). 2.3 Vulnerabilities are determined by factors like social and economic conditions of the people, nature of human settlements, type of construction of houses and infrastructure, level education and awareness etc. Improvement of all these indic es can reduce vulnerability and thereby help to prevent or mitigate a disaster situation. Risk is a measure of losses (deaths, injuries, property damages, disruption of livelihoods and economic activities or damages to environment etc) that can happen due to a hazard in the given contexts of vulnerabilities. 2.4 Disasters are the consequences of inappropriately managed risks which results in ‘a serious disruption of the functioning of a community or a society causing widespread human, material, economic or
1 United Nations International Strategy for Disaster Reduction. http://www.unisdr.org/eng/library/lib-terminology.htm

12
environmental losses which exceed the ability of the affected community or society to cope using its own resources’. The risks of disasters can be reduced significantly by preparedness at all levels, specially by enhancing the capacities of institutions, communities and in dividuals. The relationship between hazard-vulnerability-risk -disaster can be explained with the following equation:
Disaster = Risk (Hazard x Vulnerability) ÷ Capacity
2.5 In the case of natural disasters, hazards are embedded in the geo-physical and climatic conditions of the regions. In the case of man made disasters, hazards are created by human beings by unsafe living conditions, building practices, production processes and environmental degradations, largely due to inequities and poor governance. There is a growing school of thought that suggests that there is nothing called natural disasters – it is the vulnerabilities of the people and failure to live in harmony with nature that transforms the natural hazards into disasters, which are always man made.2 This has given rise to the hope that many disasters can in fact be prevented and mitigated or at least the risks of disasters can be reduced substantially, particularly for those living in vulnerable conditions in many parts of the world. 3 2.6 The developed countries have been able to manage the risks to a large extent by preventive, mitigation and preparedness measures and by enhancing the capacities of individuals and communities through education and awareness and in consequence the intensity of disasters in terms of loss lives and property have been blunted considerably. The developing countries, in contrast, are facing the burnt of disasters, which are causing substantial loss of lives and assets, creating serious set backs to development. Therefore disaster management has emerged as an important issue of sustainable development in the developing countries.4 2 Ben Wisner, Piers M Blaikie, Terry Cannon , At Risk: Natural Hazards, People's Vulnerability and Disasters, Taylor and Francis, 2003, page 29. 3 This hope has resulted in many initiatives at the global, national and local levels for disaster ris k reduction. The United Nations observed the nineties as the International Decade for Natural Disaster Reduction (IDNDR). During the middle of the decade the world community adopted the Yokohama Strategy of Safer World in 1994 which laid emphasis on application of science and technology, particularly early warning for disaster risk reduction. End review of IDNDR led to the realization that no quick fix scientific solution can be found to disasters and therefore a multi-pronged approach at five different levels - legal-institutional, scientific-technological, educational, socio-economic and humanitarian – should be taken. These five priorities are included in the Hyogo Framework of Action adopted at the World Conference of Disaster Reduction in 2005. 4 In India the Planning Commission recongised disaster management as a development issue for the first time in 2002 when a chapter on ‘Disaster Management: A Development Perspective’ was included in the Tenth Five Year Plan.
13
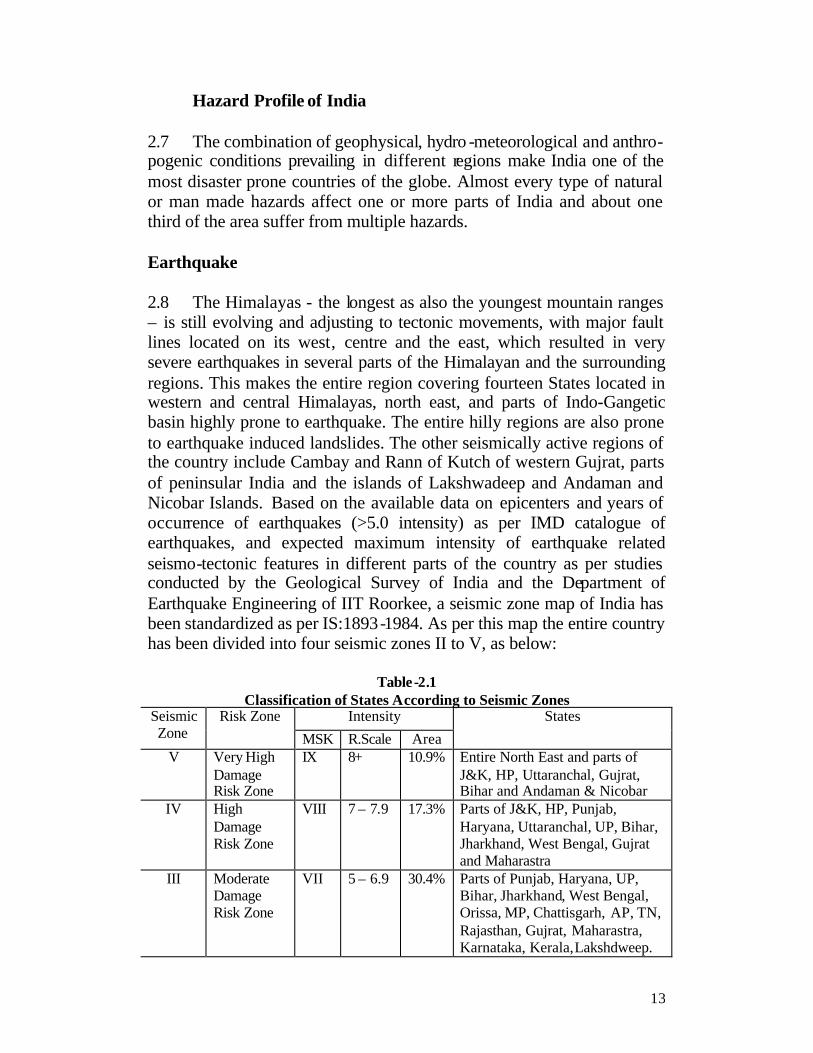
Hazard Profile of India 2.7 The combination of geophysical, hydro -meteorological and anthro- pogenic conditions prevailing in different regions make India one of the most disaster prone countries of the globe. Almost every type of natural or man made hazards affect one or more parts of India and about one third of the area suffer from multiple hazards. Earthquake 2.8 The Himalayas - the longest as also the youngest mountain ranges – is still evolving and adjusting to tectonic movements, with major fault lines located on its west, centre and the east, which resulted in very severe earthquakes in several parts of the Himalayan and the surrounding regions. This makes the entire region covering fourteen States located in western and central Himalayas, north east, and parts of Indo-Gangetic basin highly prone to earthquake. The entire hilly regions are also prone to earthquake induced landslides. The other seismically active regions of the country include Cambay and Rann of Kutch of western Gujrat, parts of peninsular India and the islands of Lakshwadeep and Andaman and Nicobar Islands. Based on the available data on epicenters and years of occurrence of earthquakes (>5.0 intensity) as per IMD catalogue of earthquakes, and expected maximum intensity of earthquake related seismo-tectonic features in different parts of the country as per studies conducted by the Geological Survey of India and the Department of Earthquake Engineering of IIT Roorkee, a seismic zone map of India has been standardized as per IS:1893-1984. As per this map the entire country has been divided into four seismic zones II to V, as below:
Table-2.1
Classification of States According to Seismic Zones Seismic Zone
Risk Zone Intensity States
MSK R.Scale Area V Very High
Damage Risk Zone
IX 8+ 10.9% Entire North East and parts of J&K, HP, Uttaranchal, Gujrat, Bihar and Andaman & Nicobar
IV High Damage Risk Zone
VIII 7 – 7.9 17.3% Parts of J&K, HP, Punjab, Haryana, Uttaranchal, UP, Bihar, Jharkhand, West Bengal, Gujrat and Maharastra
III Moderate Damage Risk Zone
VII 5 – 6.9 30.4% Parts of Punjab, Haryana, UP, Bihar, Jharkhand, West Bengal, Orissa, MP, Chattisgarh, AP, TN, Rajasthan, Gujrat, Maharastra, Karnataka, Kerala, Lakshdweep.

14
II Low Damage Risk Zone
VI < 4.9 41.4% Parts of Rajasthan, MP, Orissa, Chattisgarh, Jharkhand, AP, TN, Maharastra, Karnataka, Kerala.
Thirty-five major towns with population of more than half a million each are located in seismic zone III, IV and V. The total population of these towns is 96.46 million. Each of these towns has the potential risks of earthquakes with catastrophic consequences. Floods 2.9 Himalayas is also the home of the largest non-polar glacial deposits in the world, which sustains the Indo-Gangetic -Brahmaputra basin with a spread of nearly two and half thousand kilometers and a depth ranging three to six hundred kms. An
intricate river system of this basin carry water and silt from a wide catchments through the longest as also the densiest of the alluvial plains of the world. Landslides and soil erosion in the hills due to depletion of forest cover and seismic activities have increased the silt burden of the drainage system reducing the carrying capacity of the rivers and the dams constructed over the rivers at many places which spills with moderate to heavy rainfall causing flood and flash floods at many places. 2.10 The country receives an annual precipitation of 400 million-hectre meters, of which 75% is received during four months of monsoon (June-September) and, as a result, almost all the rivers carry heavy discharge during the period. The flood hazard is compounded by the problems of sediment deposition, drainage congestion and synchronization of river floods with sea tides in the coastal plains. The

15
area vulnerable to floods is 40 million-hectare and the average area affected by floods annually is about 8 million hectares. The average annual total damage to crops, houses and public utilities during the period 1953-2008 was about Rs. 9720 million.
Table-2.2
Average Annual Loss Due to floods Sl No. Item Extent of damages 1. Land area affected 7.56 million hectares 2. Population affected 32.03 million 3. Human lives lost 1504 4. Livestock lost 96713 5. Number of houses damaged 11683 6. Value of houses damaged Rs. 136.615 crores 7. Crop damaged Rs. 460.07 crores 8. Public utilities damaged Rs. 377.126 crores Total loss Rs. 982.126 crores
Cyclones 2.11 More than eight thousand kms of coastline in the east and the west and its hinterland, covering a large part of 13 States and Union Territories
inhabited by nearly people 200 million people face the hazards of tropical cyclones, and the associated storm surge and heavy rainfall, both before and after the monsoon. Post monsoon cyclones are usually more intense both in numbers and their effects, since the rivers which are already full with water can not carry the excess load of tidal surge and rain causing fresh floods in coastal areas. 2.12 Over 58 per cent of the cyclonic storms that develop in the Bay of Bengal, approach or cross the east coast in October and November. Only 25 per cent of the storms that develop over the

16
Arabian Sea approach west coast. In the pre-monsoon season, corresponding figures are 25 per cent over the Arabian Sea and 30 per cent over the Bay of Bengal.
Table-2.3 Frequencies of Cyclones during 1891-2008
West Coast East Coast State Coastal
districts No of storms
State Coastal districts
No of storms
Kerala Trivandrum 1 West Bengal
24 Paraganas 23 Ernakulam 1 Midnapore 12 Malapuram 1 Orissa Balasore 19 Calicut 2 Cuttack 17
Karnataka Cannanore 1 Puri 10 Ganjam 7
South Kanara 2 Andhra Pradesh
Srikakulam 14 Vizag 8 East Godavari 8 Krishna 14 Guntur 3 Nellore 21
Gujrat Baroach 1 Tamil Nadu
Chingleput 15 Bhavnagar 2 South Arcot 5 Junagad 10 Tanjore 13 Jamnagar 3 Ramanathapuram 3 Kutch 3 Trinuveli 2
Tsunami 2.13 Tsunamis are large waves generated by sudden movements of the ocean floor that displace a large volume of water. Although usually associated with earthquakes, tsunamis can also be triggered by many other types of phenomenon, including submarine or terrestrial landslides, volcanic eruptions, explosions or even bolides (e.g, asteroid, meteor, comet) impacts. Tsunamis have potential to strip beaches, uproot plantations, inundate large inland tract, damaging life and property in coastal areas. Indian coastal belt had not recorded many tsunamis in the past. The earthquakes of 1881 and 1941 over the Bay of Bengal had caused some damages in Andaman region. The earthquakes of 1819 and 1845 near the Rann of Kutch created rapid movements of water on Arabian Sea. The 1945 Mekran earthquake (Magnitude 8.1) generated tsunami of 12 to 15 meters height causing some damages in Gulf of Cambay and Mumbai. The Sumatra earthquake of December 2004 (Magnitude 9.1) caused widespread damages in large parts of Andaman & Nicobar, Tamil Nadu, Pondicherry, Andhar Pradesh and Kerala.
17
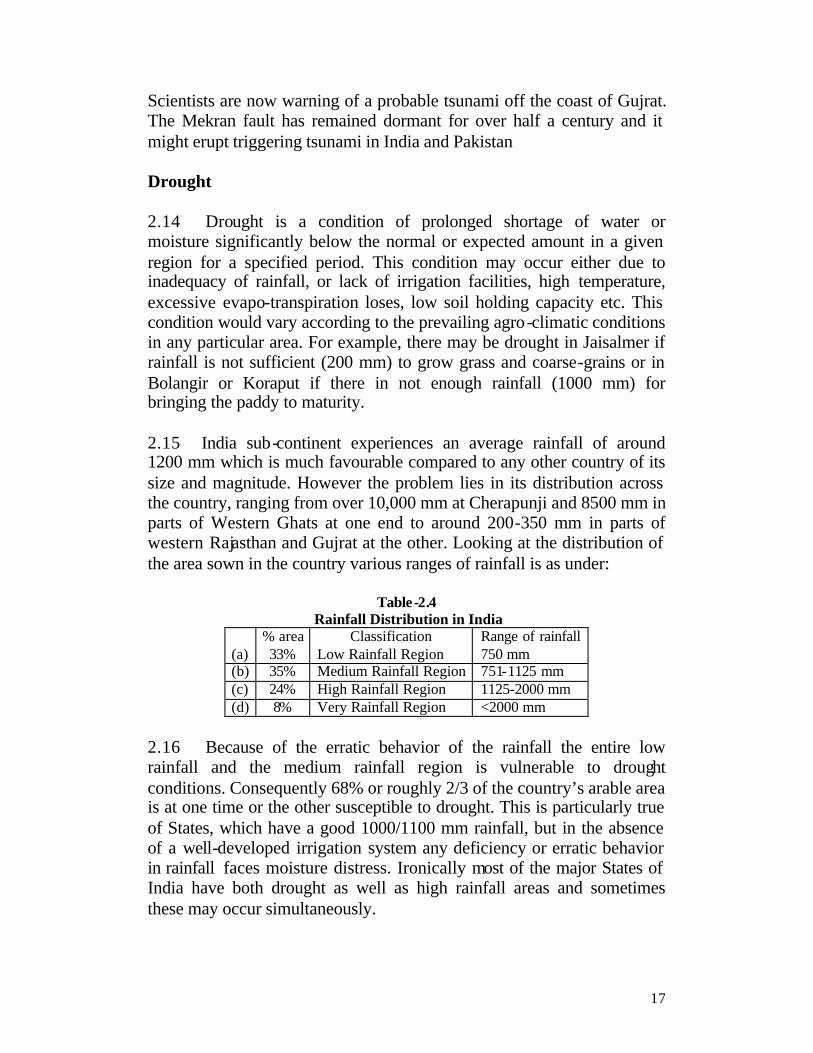
Scientists are now warning of a probable tsunami off the coast of Gujrat. The Mekran fault has remained dormant for over half a century and it might erupt triggering tsunami in India and Pakistan Drought 2.14 Drought is a condition of prolonged shortage of water or moisture significantly below the normal or expected amount in a given region for a specified period. This condition may occur either due to inadequacy of rainfall, or lack of irrigation facilities, high temperature, excessive evapo-transpiration loses, low soil holding capacity etc. This condition would vary according to the prevailing agro-climatic conditions in any particular area. For example, there may be drought in Jaisalmer if rainfall is not sufficient (200 mm) to grow grass and coarse-grains or in Bolangir or Koraput if there in not enough rainfall (1000 mm) for bringing the paddy to maturity. 2.15 India sub-continent experiences an average rainfall of around 1200 mm which is much favourable compared to any other country of its size and magnitude. However the problem lies in its distribution across the country, ranging from over 10,000 mm at Cherapunji and 8500 mm in parts of Western Ghats at one end to around 200-350 mm in parts of western Rajasthan and Gujrat at the other. Looking at the distribution of the area sown in the country various ranges of rainfall is as under:
Table-2.4
Rainfall Distribution in India % area Classification Range of rainfall
(a) 33% Low Rainfall Region 750 mm (b) 35% Medium Rainfall Region 751-1125 mm (c) 24% High Rainfall Region 1125-2000 mm (d) 8% Very Rainfall Region <2000 mm
2.16 Because of the erratic behavior of the rainfall the entire low rainfall and the medium rainfall region is vulnerable to drought conditions. Consequently 68% or roughly 2/3 of the country’s arable area is at one time or the other susceptible to drought. This is particularly true of States, which have a good 1000/1100 mm rainfall, but in the absence of a well-developed irrigation system any deficiency or erratic behavior in rainfall faces moisture distress. Ironically most of the major States of India have both drought as well as high rainfall areas and sometimes these may occur simultaneously.
18
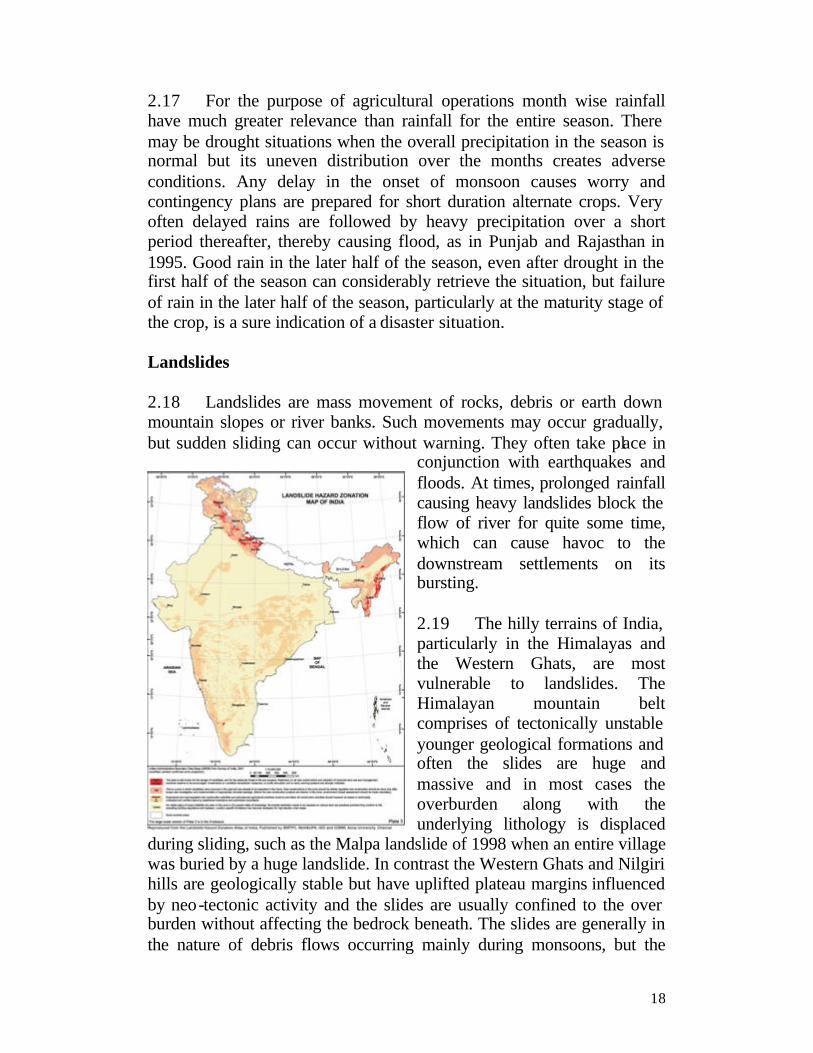
2.17 For the purpose of agricultural operations month wise rainfall have much greater relevance than rainfall for the entire season. There may be drought situations when the overall precipitation in the season is normal but its uneven distribution over the months creates adverse conditions. Any delay in the onset of monsoon causes worry and contingency plans are prepared for short duration alternate crops. Very often delayed rains are followed by heavy precipitation over a short period thereafter, thereby causing flood, as in Punjab and Rajasthan in 1995. Good rain in the later half of the season, even after drought in the first half of the season can considerably retrieve the situation, but failure of rain in the later half of the season, particularly at the maturity stage of the crop, is a sure indication of a disaster situation. Landslides 2.18 Landslides are mass movement of rocks, debris or earth down mountain slopes or river banks. Such movements may occur gradually, but sudden sliding can occur without warning. They often take place in
conjunction with earthquakes and floods. At times, prolonged rainfall causing heavy landslides block the flow of river for quite some time, which can cause havoc to the downstream settlements on its bursting. 2.19 The hilly terrains of India, particularly in the Himalayas and the Western Ghats, are most vulnerable to landslides. The Himalayan mountain belt comprises of tectonically unstable younger geological formations and often the slides are huge and massive and in most cases the overburden along with the underlying lithology is displaced
during sliding, such as the Malpa landslide of 1998 when an entire village was buried by a huge landslide. In contrast the Western Ghats and Nilgiri hills are geologically stable but have uplifted plateau margins influenced by neo-tectonic activity and the slides are usually confined to the over burden without affecting the bedrock beneath. The slides are generally in the nature of debris flows occurring mainly during monsoons, but the

19
effects are felt more acutely due to higher density of population in this region. Scientists have been warning of increasing incidence of landslides due to glacial melts in the higher Himalayas and flash floods in the lower Himalayas. Increase of heavy rainfall events in the western ghats shall similarly trigger more frequent landslides in the region. Avalanches 2.20 Avalanche is the sliding down of snow cover on mountain slope. Avalanches may occur due to a combination of a variety of factors such inclined slope of the mountain, depth of snow cover, wind velocity and atmospheric temperature, vibrations caused by gun fire and strength of resisting forces like vegetation cover of trees and shrubs. When the balance between the gravitational force of snow cover and the resisting force of the slope and the anchoring effect of shrubs are lost avalanches are caused. Avalanches may create various crisis situations for the local administration, for example road traffic may be blocked and communication links to vital areas may be disrupted, winter sports may be disturbed stranding tourists in places with limited facilities and small rivers may be blocked creating danger of down stream flooding. Sometimes avalanche may also hit or even bury human settlements down the slopes, such as the Kashmir avalanche of 2005 which killed 278 persons, mostly in their temporary winter hutments. Man Made Hazards 2.21 The plethora of natural hazards of India is compounded by man made hazards of various types. Some of these hazards are so regular and widely dispersed across territories, such as road accidents, infant and maternal mortality, malnutrition, water and air pollution etc that do not create the sensation of sudden disruption despite the huge loss of lives that these entail. Others such as industrial accidents, fire, building collapse, road and rail accidents, serial bomb blasts etc have all the ingredients of disasters that put considerable stress on the normal administrative and socio-economic mechanism to cope with. 2.22 Among the man made disasters probably the most important is industrial disasters. Industrial disasters may be caused by chemical, mechanical, civil, electrical or other process failures in an industrial plant due to accident or negligence which may cause widespread damages within and outside the plant. The worst example is the Bhopal Gas Tragedy which has so far claimed 15,000 people and affected another 120,000 for their life besides stunting the growth of a generation born out of the affected population. This is the worst industrial disaster to have
20
happened anywhere in the world and triggered a completely new legal regime and practices for preventing such disasters. About 1800 major industrial hazard units of India are located in 273 districts in 22 States. Stringent environmental protection laws have prevented major industrial disasters after Bhopal, but minor disasters do take place on and off site and also during transportation of hazardous material, which claim a number of lives besides creating various environmental problems. 2.23 Another critical man made hazard is the epidemics which may take place due to poor sanitary conditions that contaminate food and water or due inadequate disposal of human or animal carcasses in post disaster situation. Epidemics become real time dangers during flood and earthquake. Sometimes poor solid waste management may create epidemic like plague which was quite common and used to claim hundreds of lives. Incidence of plagues have come down but it can still occur claiming many human lives and disrupt normal life as it did in the prosperous city of Surat in 1994. 2.24 Added to these manmade hazards are the threats of Nuclear, Biological and Chemical (NBC) disasters, and now the dangers of pandemics created by avian flu. Nuclear facilities in India have adopted internationally accepted guidelines for ensuring safety to the public and environment. A crisis management system is also in place to take care of any nuclear hazard. The country is also developing a crisis management procedure for fighting the hazard of bird flue. 2.25 Almost the entire billion plus people of India are exposed to one or other forms of these natural or manmade hazards and about one third of them are critically so due to their location in multi-hazard prone areas which face one or more hazards. Vulnerability Profile of India 2.26 The natural and man made hazards of India are compounded by the vulnerable social and economic conditions of a large segment of the population, fragile human settlements, unsafe building practices, low level of education and awareness etc. These conditions prevail throughout the country although the scale of vulnerabilities may differ among the states, among regions within the same state and among different groups of people within the same region or communities. For example, women, children, aged or the disabled may be more vulnerable to disasters. Human Development Reports of the States provide a good index of the vulnerabilities, but these do not adequately capture the differential

21
vulnerabilities of States and regions to different types of disasters. In fact, the vulnerabilities are influenced by such a complex range of factors that giving weightage to these factors and developing a composite index of vulnerabilities is an extremely difficult task. The difficulties are further exacerbated by non-availability of data at a macro level. This explains the absence of good macro level vulnerability studies in a large and diverse country like India, even though there may be a good number of such studies at the micro level.
2.27 The Vulnerability Atlas of India 1998 was probably the first and still the only significant attempt to develop a macro level analysis of vulnerabilities for the country. The entire landmass of India was mapped for the four main natural hazards of earthquake, cyclone, wind speed and flood using Survey of India base maps in a scale of 1:2.5 million and the existing census data of housing types were superimposed on the hazard maps to assess the vulnerability of the structures in various hazard zones. It was found that a very large percentage of the total 195 million housing stocks of
the country are exposed to ‘very high’ and ‘high’ risks of damages due to earthquakes, cyclones and floods. Using these data sets 169 districts of the country inhabited by nearly 300 million people were identified as multi-hazard districts which are prone to more than one hazard. The atlas was updated and digitized in 2006 using the demographic and housing typology data of 2001 census. The vulnerability conditions that emerge are as follows:
Table-2.5 Vulnerability of Houses to Various Hazards
Census Houses Level of Risk Under
Wall and Roof
Types
No. of Houses
(%) EQ Zone Wind Velocity m/s Flood Prone Area in %
V IV III II 55 47 44 33 Area in % Area in %
10.9 17.3 30.4 41.4 5.0 40.2 48.0 6.7 7.9 Mud Wall Rural Rural 26.4
Urban Urban 3.2
Total Total 29.6 VH H M L VH H M L VH
Stone Wall
Rural Rural 8.2
Urban Urban 2.1

22
Total Total 10.3 VH H M L H M L VL VH
Burnt Brick Wall
Rural Rural 25.2
Urban Urban 19.7
Total Total 44.9 H M L VL H M L VL H/M
Concrete Wall
Rural Rural 0.9
Urban Urban 1.7
Total Total 2.6 M L VL VL L VL VL VL L/VL
Wood Wall
Rural Rural 0.9
Urban Urban 0.3
Total Total 1.2 M L VL VL VH H M L H
Other Materials
Rural Rural 9.7
Urban Urban 1.7
Total Total 11.4 M VL VL VL VH H M L VH
L.Weight Sloping Roof
Rural Rural 27.8
Urban Urban 7.0
Total Total 34.8 M M L VL VH VH H M VH
H.Weight Sloping Roof
Rural Rural 26.2
Urban Urban 5.2
Total Total 31.4 H M L VL H M L VL H
Flat Roof Rural Rural 17.2 Urban Urban 16.5 Total 84,067,581 33.7 Damage Risk as per that for the Wall supporting it
Level of Risk: VH= very high, H= high, M= moderate, L=low, VL= very low
2.27 The Vulnerability Atlas of 2006 categorized 348 out of 593 districts of India as multi-hazard5. These districts are inhabited by 518 million people – a significant increase compared to the situation captured in the Vulnerability Atlas of 1998. Uttar Pradesh has the maximum number of multi-hazard districts (61) followed by Bihar (32), Assam (23) and Gujarat (22). These multi-hazard districts were further categorised by their priorities according to ratings given to hazards of different intensities, as under
Table-2.6 Hazard Ratings for Prioritizing Multi-Vulnerable Districts
Earthquake Ratings
Cyclone Ratings
Flood Ratings
Landslide Ratings
Total Priority Ratings
Zone-V: 10 Wind Speed >50: 10
Area under flood >40%: 10
Very High Risk: 10 P1: >20
Zone- IV: 7 Wind Speed > 47: 7
Area under flood > 20%: 7 High Risk: 7 P2: >15-20
Zone- III: 5 Wind Speed >44-39: 5
Area under flood > 5%: 5
Moderate Risk: 5 P3: >10-15
Zone- II: 3 Wind Speed >33: 3
Area under flood > 3%: 3 Low Risk: 3 P4: >7-10
Applying these indexes the priority multi-hazard districts of India - P1, P2, P3 and P4 - were further classified as under6:
5 The reason why the number of multi-hazard districts increased in 2006 was due to the fact landslide was included in the analysis of 1998. 6 Report of the Expert Committee under the Chairmanship of Prof A.S.Arya, National Seismic Adviser

23
Table-2.7
Multi-Hazard Districts of India as per Priorities -2006 Total Multi-Hazard Districts Total Population of
STATES District
s P1 P2 P3
P4
Total Population
M-H Districts
1 Andhra Pradesh 23 2 4 3 5 14 75,727,541 40,092,560 2 Arunachal Pradesh 13 1 12 13 1,091,117 1,091,117 3 Assam 23 9 8 6 23 26,638,407 26,638,407 4 Bihar 37 2 11 17 1 31 82,878,796 68,514,683 5 Chhattisgarh 16 20,795,956 0 6 Delhi 9 2 2 13,782,976 4,022,079 7 Goa 2 2 2 1,343,998 1,343,998 8 Gujarat 25 4 14 3 21 50,596,992 45,363,055 9 Haryana 19 4 12 16 21,082,989 17,735,401 10 Himachal Pradesh 12 8 4 12 6,077,248 6,077,248 11 Jammu & Kashmir 14 8 6 14 10,069,917 10,069,917 12 Jharkhand 18 26,909,428 1,974,848 13 Karnataka 27 5 5 52,733,958 6,655,447 14 Kerala 14 8 5 1 14 31,838,619 31,838,619 15 Madhya Pradesh 45 60,385,118 0 16 Maharashtra 35 3 3 96,752,247 11,126,678 17 Manipur 9 7 2 9 2,388,634 2,388,634 18 Meghalaya 7 3 4 7 2,306,069 2,306,069 19 Mizoram 8 8 8 891,058 891,058 20 Nagaland 8 1 7 8 1,988,636 1,988,636 21 Orissa 30 6 2 5 1 14 36,706,920 22,418,885 22 Punjab 17 13 3 1 17 24,289,296 24,289,296 23 Rajasthan 32 56,473,122 0 24 Sikkim 4 4 4 540,493 540,493 25 Tamil Nadu 30 1 8 2 11 62,110,839 21,514,396 26 Tripura 4 4 4 3,191,168 3,191,168 27 Uttar Pradesh 70 15 38 12 65 166,052,859 155,062,383 28 Uttaranchal 13 1 6 6 13 8,479,562 8,479,562 29 West Bengal 18 6 8 2 2 18 80,221,171 80,221,171 30
Andaman & Nicobar 2 356,265 0

24
31 Chandigarh 1 900,914 0 32 Dadra & N Haveli 1 220,451 0 33 Daman & Diu 2 44110 0 34 Lakshadweep 1 60595 0 35 Pondicherry 4 31362 0
Total 593 47 128
137 36 348
1,025,958,831 595,835,808
2.28 While the Vulnerability Atlas has provided a useful tool for assessing the vulnerability profile of a State, region or district, it has its obvious limitations. First, resolution of 1:1.25 million scale maps are not very useful for assessing the vulnerabilities at micro levels. If we have to assess the vulnerabilities of a town or a cluster of villages higher resolution maps in the scale of 1:1000 are required. Although the technology for generating such high resolution maps are well within the capacities of the mapping and remote sensing agencies of the country, the access to and availability of such maps are constrained by various factors. Secondly, these maps must also be supplemented by adequate data on various aspects of physical, social and economic vulnerabilit ies which are either not available for the entire country or are scattered so much among various agencies that integration of these data for specific regions of the country is not always an easy task. 2.29 It is possible to use the Geographical Information System (GIS) tools to integrate various spatial data sets such as topography, hydrology, land use-land cover, settlement pattern, built structure etc and non-spatial data such as demography, socio-economic conditions and infrastructure like road, rail network, communication system, hospital etc in a common platform for developing a sound information base for real time assessment and monitoring of hazards, vulnerabilities, risks and disasters. Such an effort is underway through the National Spatial Data Infrastructure (NSDI) project of the Department of Science & Technology but it may take years before all the layers of hazard, vulnerability and risks are captured on high resolution maps on GIS platform. It would then be possible to develop a composite HVR Index for deciding the relative vulnerabilities of the States, regions and districts. Risk Profile of India 2.30 Based on the hazards and vulnerability conditions, the risk profiles of the States and regions can be developed. Advanced tools for risk

25
profiling are available, but very seldom have these tools been applied in the country for designing appropriate policy interventions for managing the risks. The first and foremost task of risk management is to undertake comprehensive studies for risk assessment, which quantifies the Probable Maximum Loss (PML) and Average Annual Loss (AAL) of a country or a region on the basis of a probabilistic risk model. The Risk Management Solutions of India (RMSI) applied this model for quantifying PML and AAL of four Indian States of Andhra Pradesh, Gujarat, Maharashtra and Orissa in respect of flood, earthquake and cyclone. This study was undertaken at the instance of the World Bank for their study on Financing Rapid Onset Natural Disaster Losses in India: A Risk Management Approach. The key findings of the study are summarized below.
• The total exposed value to natural catastrophes in Andhra Pradesh, Gujarat, Maharashtra and Orissa is 44, 48, 78 and 15 billion US dollars respectively at 2001 prices. Housing dominates with 60-65% share except in Orissa where it is 47%.
• The average annual loss due to all perils in Andhra Pradesh, Gujarat, Maharashtra and Orissa is 83, 65, 3 and 43 million dollars respectively. The corresponding loss cost (loss per thousand) is 3.64, 1.97, 0.04 and 3.96. Except Maharashtra all the three States pay heavy price for the catastrophes.
• The loss cost for housing due to cyclones in Andhra Pradesh, Gujarat and Orissa is 1.55, 0.76 and 3.22 respectively and can be compared with 1.56 in Florida and 0.27 in Japan. Similarly the housing loss cost due to earthquakes in Gujarat is 0.52 and can be compared with 2.51 in California and 1.67 in Japan.
• Based on the long-term average, flood is the most damaging peril for housing as well as public infrastructure in all the States except for housing in Orissa where cyclone is far more damaging than flood. Because of its low rate of occurrence earthquake does not prove to be so damaging even in Gujarat.
• The 150-year return period losses due to all perils for the combined assets in terms of absolute and % of exposed value are as follows:
Andhra Pradesh US$ 921 2.12% Gujarat US$ 1009 2.13% Maharashtra US$ 58 0.08% Orissa US$ 479 3.18%
• These losses may be considered as probable maximum losses and
can be used for risk planning. Andhra Pradesh and Gujarat are by
26
and large at the same level of risk and occupy the top position in terms of absolute risk. However, Orissa suffers from highest risk in terms of damageability. Maharashtra may not require a serious financial catastrophe risk planning.
• The long-term average cost of natural catastrophes as a % of state GDP of Andhra Pradesh, Gujarat and Orissa is 0.3%, 0.3% and 0.6 % respectively. And the 150-year loss is 3.3%, 4.4% and 6.5% of state GDP. The 150-year loss as a percent of tax revenue of the state in Andhra Pradesh, Gujarat and Orissa is 29%, 44% and 42% respectively. In terms of capacity to absorb the impact Orissa is placed at the worst followed by Gujarat and Andhra Pradesh.
2.31 It is possible to further improve on the methodology of the study and undertake similar studies for the entire country in a multi-hazard framework. Based on such studies the total risks of disasters can be quantified and the appropriate strategies for risk management can be developed for the country, the States and the districts. Depending on the resources that shall be available for investment on structural and non-structural measures for prevention and mitigation of disasters the acceptable risks of the country can also be quantified on the basis of the following equation
Total Risk – (Prevention + Mitigation) = Acceptable Risk
Once the level of acceptable risk is decided the country must be prepared to live with these risks. The overriding principle is that the level of preparedness should as far as possible match the level of acceptable risks. The gap between the acceptable risk and preparedness provides a sure call for disasters. PML and AAL provide a framework for analyzing the probability of such disasters in space and time. The country must arrange the resources required for managing these disasters through the mechanism of budgetary resources under Non-Plan or Plan Head, external assistance, borrowing, taxation, or risk transfer through insurance and re-insurance. 2.32 In the absence of such a rigorous analysis it is not possible to exactly quantify the risk profile of India. However given the hazard and vulnerability profile of the country India is among the most critical hot spot risk zones of the world. This would be evident when trends of disasters in India are analyzed.
27
DISASTERS AND THEIR TRENDS
Before the disaster trends in India are analysed it may be worthwhile to look into the global disaster trends.
Global Disaster Trends
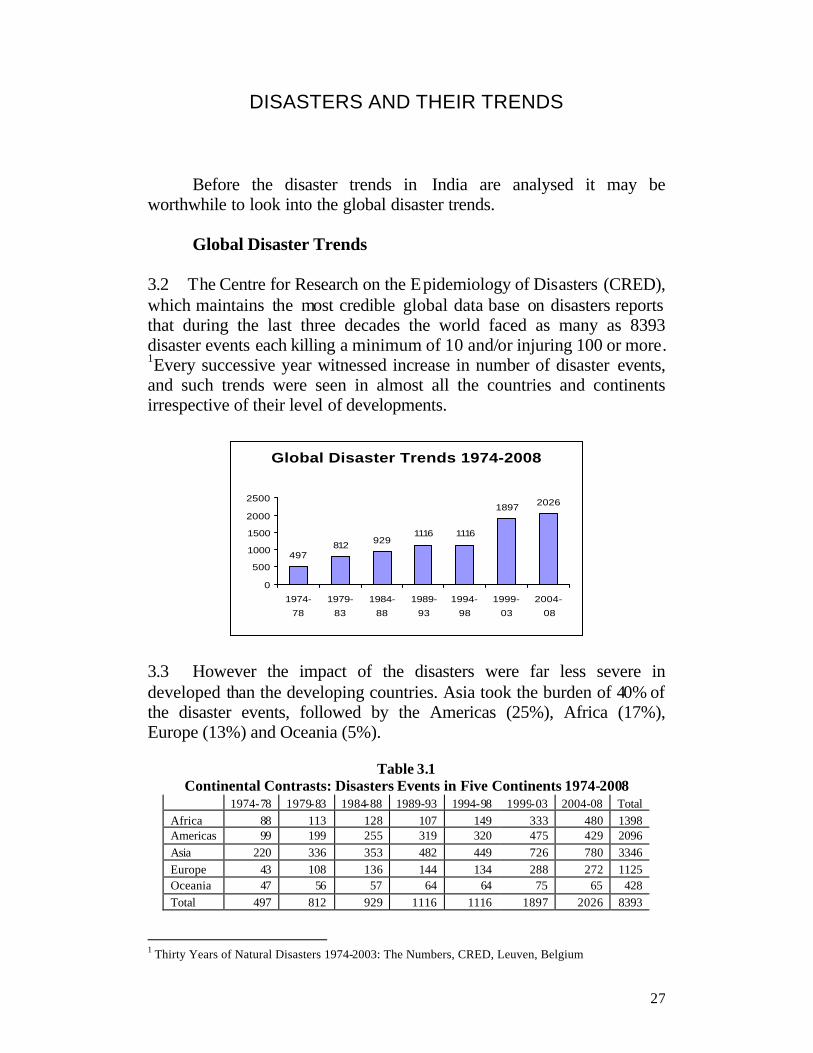
3.2 The Centre for Research on the Epidemiology of Disasters (CRED), which maintains the most credible global data base on disasters reports that during the last three decades the world faced as many as 8393 disaster events each killing a minimum of 10 and/or injuring 100 or more. 1Every successive year witnessed increase in number of disaster events, and such trends were seen in almost all the countries and continents irrespective of their level of developments.
Global Disaster Trends 1974-2008
497812 929
1116 1116
1897 2026
0
500
1000
1500
2000
2500
1974-
78
1979-
83
1984-
88
1989-
93
1994-
98
1999-
03
2004-
08
3.3 However the impact of the disasters were far less severe in developed than the developing countries. Asia took the burden of 40% of the disaster events, followed by the Americas (25%), Africa (17%), Europe (13%) and Oceania (5%).
Table 3.1
Continental Contrasts: Disasters Events in Five Continents 1974-2008 1974-78 1979-83 1984-88 1989-93 1994-98 1999-03 2004-08 Total Africa 88 113 128 107 149 333 480 1398 Americas 99 199 255 319 320 475 429 2096 Asia 220 336 353 482 449 726 780 3346 Europe 43 108 136 144 134 288 272 1125 Oceania 47 56 57 64 64 75 65 428 Total 497 812 929 1116 1116 1897 2026 8393
1 Thirty Years of Natural Disasters 1974-2003: The Numbers, CRED, Leuven, Belgium
28
3.4 Within Asia it is the South Asia that faced the maximum number of disasters (30%), followed by South East Asia (28%), East Asia (27%), Central Asia (8%) and West Asia (7%).Within South Asia, India had the largest share (40%), followed by Bangladesh (22%) and Pakistan (13%). 3.5 The impact of the disasters in terms of number of persons killed and affected presents a much sharper contrasts between the developed and the developing countries. Asia being the largest and the most populated continent had to share the major burden, but the share (88.8%) was rather disproportionate.
Table-3.2
Total number of Victims (People killed and affected) in Natural Disasters 1974-78 1979-83 1984-88 1989-93 1994-98 1999-03
Africa 17,508,792 52,512,857 64,218,089 74,326,985 39,829,959 99,583,503 Americas 9,412,304 46,719,655 21,510,762 9,595,998 25,917,605 22,861,100 Asia 165,728,618 603,985,726 720,881,573 704,328,791 969,061,214 1,373,557,427 Europe 2,238,584 1,819,847 383,468 4,906,478 10,262,461 10,961,321 Oceania 98,622 684,893 712,930 7,320,767 10,296,472 268,817 Total 194,986,920 705,722,978 807,706,822 800,479,019 1,055,367,711 1,507,232,168
3.6 If we work out the share per million of population the disparities become even more glaring, as would be evident from the following table.
Table-3.3 Mean Annual Number of Victims Per 1,000,000 Inhabitants
1974-78 1979-83 1984-88 1989-93 1994-98 1999-03 2004-08 Africa 814.7 2112.8 2330.9 2294.6 1099.4 2406.2 2,002.0 Americas 330.8 1468.8 626.6 261.3 643.9 540.8 956.2 Asia 1376.1 4585.2 4890.4 4412.9 5555.2 7348.9 3677.5 Europe 61.0 48.3 9.9 130.9 281.8 300.9 82.0 Oceania 93.0 582.3 572.8 5292.8 7224.4 174.3 211.8 Total 937.3 3116.7 3229.2 2988.0 3657.0 4882.2 3,684.0
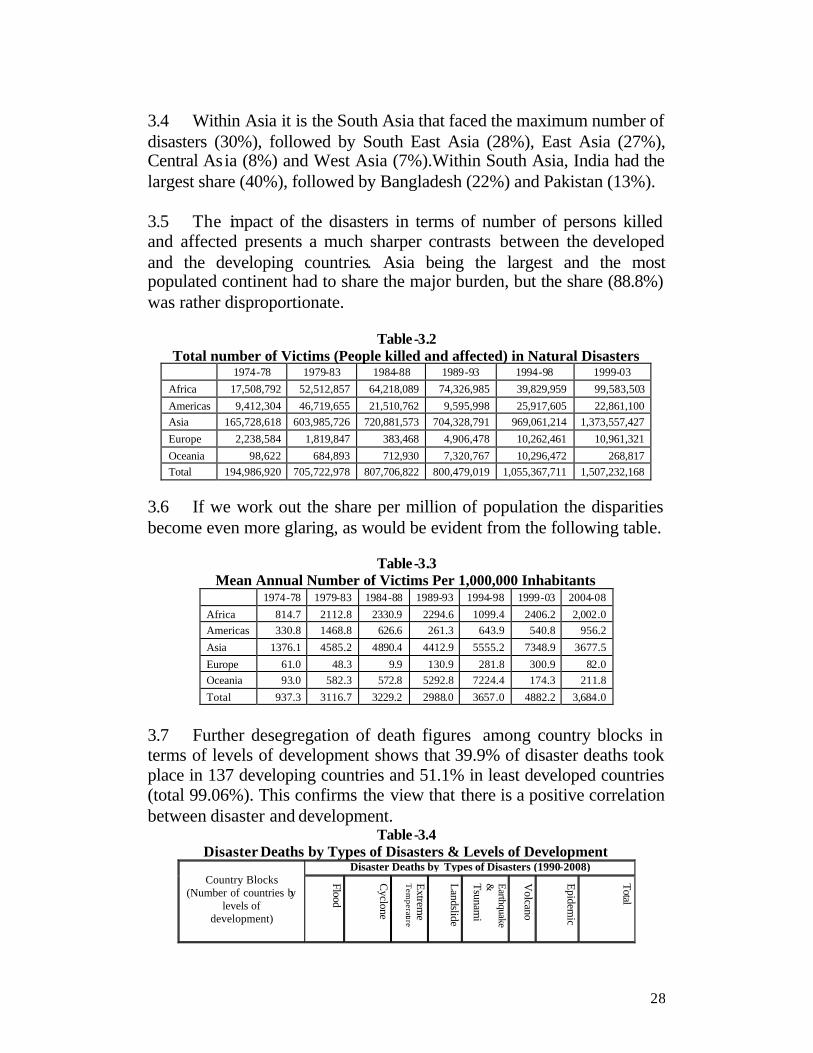
3.7 Further desegregation of death figures among country blocks in terms of levels of development shows that 39.9% of disaster deaths took place in 137 developing countries and 51.1% in least developed countries (total 99.06%). This confirms the view that there is a positive correlation between disaster and development.
Table-3.4 Disaster Deaths by Types of Disasters & Levels of Development
Country Blocks
(Number of countries by levels of
development)
Disaster Deaths by Types of Disasters (1990-2008)
Flood
Cyclone
Extreme
Tem
perature
Landslide Earthquake &
Tsunam
i
Volcano
Epidemic
Total
29
Developed (30 countries) 2150 5430 47516 426 5910 44 442 61918
CEE+CIS (27 countries) 2035 512 3109 1176 2412 0 568 10412
Developing (137 countries) 97061 65258 12599 9369 397303 900 47616 630106
Least developed (50) 20127 149517 3320 1739 9247 201 70588 254739
Non classified 99 767 57 23 2277 0 104 3327Total 122072 221484 66601 12733 419149 1145 119318 960502
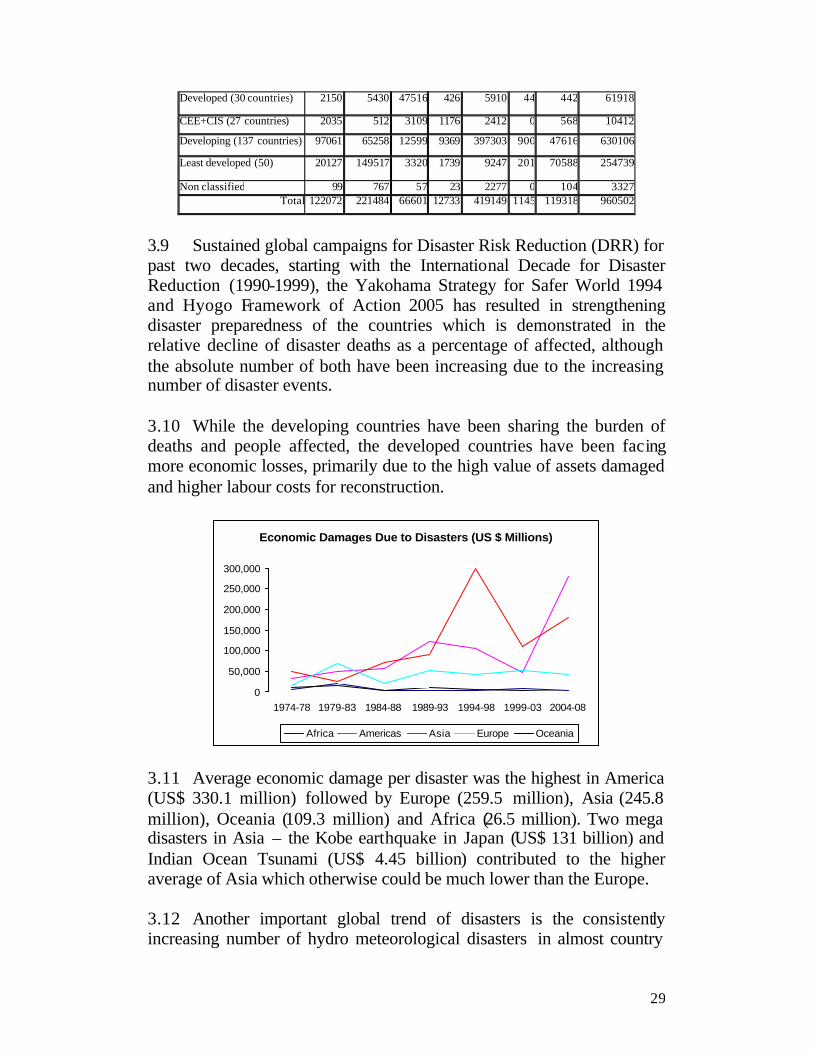
3.9 Sustained global campaigns for Disaster Risk Reduction (DRR) for past two decades, starting with the International Decade for Disaster Reduction (1990-1999), the Yakohama Strategy for Safer World 1994 and Hyogo Framework of Action 2005 has resulted in strengthening disaster preparedness of the countries which is demonstrated in the relative decline of disaster deaths as a percentage of affected, although the absolute number of both have been increasing due to the increasing number of disaster events. 3.10 While the developing countries have been sharing the burden of deaths and people affected, the developed countries have been facing more economic losses, primarily due to the high value of assets damaged and higher labour costs for reconstruction.
Economic Damages Due to Disasters (US $ Millions)
0
50,000
100,000
150,000
200,000
250,000
300,000
1974-78 1979-83 1984-88 1989-93 1994-98 1999-03 2004-08
Africa Americas Asia Europe Oceania
3.11 Average economic damage per disaster was the highest in America (US$ 330.1 million) followed by Europe (259.5 million), Asia (245.8 million), Oceania (109.3 million) and Africa (26.5 million). Two mega disasters in Asia – the Kobe earthquake in Japan (US$ 131 billion) and Indian Ocean Tsunami (US$ 4.45 billion) contributed to the higher average of Asia which otherwise could be much lower than the Europe. 3.12 Another important global trend of disasters is the consistently increasing number of hydro meteorological disasters in almost country

30
and continent of the world. Incidents of geological disasters like earthquakes, landslides and volcanoes have remained more or less constant, even though the impact of these disasters in terms of loss and injuries of life and damages of buildings and infrastructures have worsened due largely to the rapid growth of population in the developing countries, unplanned settlements and unsafe building practices. The hydro meteorological disasters like flood, drought, windstorms, cyclones, tornadoes and other extreme climatic events, on the other hand have been continuously on the rise as would be evident from the following table.
Table-3.5
Pattern of Hydro Meteorological and Geological Disasters 1974-2008 Hydro Meteorological Disasters Geological Disasters
1974-
78 1979-
83 1984-
88 1989-
93 1994-
98 1999-
03 2004-
08 1974-
78 1979-
83 1984-
88 1989-
93 1994-
98 1999-
03 2004-08
Africa 84 109 120 97 145 322 472 4 4 8 10 4 11 8
Americas 85 162 229 284 285 436 1,873 14 37 26 35 35 39 37
Asia 183 276 294 408 387 612 2,853 37 60 59 74 62 114 87
Europe 33 82 124 128 123 271 1017 10 26 12 16 11 17 16
Oceania 43 52 50 53 57 66 376 4 4 7 11 7 9 10
3.13 This trend gets sharper over a wider time frame as the following graph based on the data of past hundred years would indicate.
Spiraling Hydrometeorological Disasters
0
500
1000
1500
2000
2500
1900-09
1910-19
1920-29
1930-39
1940-49
1950-59
1960-69
1970-79
1980-89
1990-99
2000-08
Hydro-meteorological Geological Biological
Every passing year has seen increase in the number of hydro climatic disaster events in almost every country and continent. This trend is clearly attributed to the global warming and climate change. The Intergovernmental Panel on Climate Change (IPCC) in its Fourth Assessment report has projected that climate related disaster events such as storm surge, flood, flash floods, drought etc shall increase in the coming years and decades. Besides new types of disasters such as submergence of low lying island and coastal areas, glacial lake outburst floods etc shall add to the existing disaster types.

31
Disaster Trends in India
3.14 There is no comprehensive disaggregated reliable database on disasters in India. Although the institutional system of payment of ex-gratia relief assistance even to a single victim of natural disasters had been in existence throughout the country since 1990 when the recommendation of the Ninth Finance Commission to set up a Calamity Relief Fund was accepted for implementation, the wealth of data generated by the system have not been captured either at the level of the State or the Union governments. Major disasters requiring central assistance are documented through the mechanism of Memorandum of the States to the Union, but minor disasters which are more in numbers and which happen almost daily throughout the country are not reported. This is a major constraint which hinders detailed analysis of disaster trends in the country. 3.15 Considering the data gaps on disaster in India, the Eleventh Finance Commission had recommended that ‘every State should prepare an Annual report on natural calamities relating to the preceding financial year, and submit it to the Union Ministry of Agriculture by 30th September every year, following which the Ministry of Agriculture will bring out a Report on the Natural Calamities and their Management by 31 December every year. The Centre’s contribution to the CRF of a State, due on 1st November, will be released only after this report has been received’ 2 . Unfortunately this recommendation has not been fully implemented either by the State or the Union government. The Union Ministry of Agriculture did devise a format for submission of the Annual Report by the States, which was reiterated by the Union Ministry of Home when the subject of ‘coordination of relief measures in the event of natural calamities (other than drought, hailstorm, pest attacks or epidemics) and man-made disasters’ was transferred to the Union Ministry of Home in 2002. But very few State governments have actually been submitting the Annual Report as per the prescribed format but this was not considered a good enough ground for withholding release of central share of second instalment as recommended by the Eleventh and reiterated by the Twelfth Commission. 3.16 Only 3 States – Andhra Pradesh, Assam and Gujarat – submitted all the Annual Reports of the current fiscal cycle. None of the Annual Reports submitted by the States were as per the prescribed format. None of the States has furnished the disaggregated data in respect of all the 10
2 Report of the Eleventh Finance Commission. Para 9.29 (r)

32
approved natural cala mities for which CRF assistance is admissible and therefore it is not possible to compile the disaster statistics for the country from these Reports. This was probably the reason why the National Report on the Natural Calamities and their Management, which was expected to be published by the Central government annually, could not be done even once.
Table-3.6 Status of Annual Disaster Reports from the States 2005-06 2006-07 2007-08
1. Andhra Pradesh Y Y Y 2. Assam Y Y Y 3. Bihar N N Y 4. Chhatisgarh N Y N 5. Gujarat Y Y Y 6. Himachal Pradesh Y N N 7. Jharkhand N Y N 8. Kerala Y Y N 9. Madhya Pradesh Y N Y 10. Maharastra Y N N 11. Meghalaya Y Y N 12. Mizoram Y Y N 13. Nagaland N Y N 14. Orissa N N Y 15. Punjab Y N N 16. Rajasthan Y Y N 17. Tamil Nadu Y Y N 18 Uttar Pradesh N Y N 19. West Bengal N N Y
Y= Yes, N= No. Remaining 9 states did not submit their reports at all 3.17 Based on the Annual Reports from the States a statement on damage and losses has been compiled in Annexure-VII. The Annual Report of the Union Ministry for Home Affairs for the years 2006-07 and 2007-08 published a summary for the disaster events of these two years. Although seemingly incomplete as the data from a number of States are still missing and intriguingly data from some of the States that did not submit Annual Disasters Report are reported, this was probably for the first time that a national level report on disasters of the year has been published. The summary data is compiled in the table given below:
Table-3.7
Disasters in India – 2006 and 2007
Human Lives lost
Cattle lost
Houses damaged
Crop area damaged (Lac. Hect.)
2006 2007 2006 2007 2006 2007 2006 20007
Andhra Pradesh 247 134 366308 47598 322074 235814 8.13 1.93
Arunachal Pradesh - 4 - 14736 - 12987 - 0.28

33
Assam 7 134 20 - 2367 15846 0.11 6.75
Bihar 25 976 19 988 17447 690466 0.75 16.62
Chhattisgarh 37 15 9653 53 15820 12482 0.15 0.026
Goa - 3 - - 5 1100 0.002 -
Gujarat 293 486 8421 9707 161625 41756 7.47 4.68
Haryana 6 - - - - - - -
Himachal Pradesh 48 98 846 3087 4379 10820 0.94 1.13
Jammu & Kashmir 25 - 2677 - 11835 - 0.61 --
Jharkhand 5 2 101 2 3011 986 0.03 0.01
Karnataka 123 222 236 12958 20440 231698 1.55 5
Kerala 180 262 2269 2813 114435 58804 0.24 0.38 Madhya Pradesh 168 76 6107 307 129998 18321 0.04 Maharashtra 423 155 13417 1477 594516 47045 12.59 -
Manipur - - - - - - - - Meghalaya - - - - - - - -
Mizoram - 12 - 8 - 2243 - 0.04
Nagaland - - - - - - - -
Orissa 90 91 1656 662 120356 104712 3.09 3.19
Punjab 8 7 16 18 224 527 0.02 0.28
Rajasthan 146 63 42253 5114 254844 10058 17.36 -
Sikkim - - - - - - - -
Tamil Nadu 23 52 67 159 444 726 17.37 -
Tripura 4 8 - - - 3 - -
Uttar Pradesh 508 261 588 157 - 165064 - 5.13
Uttaranchal - 83 - - - - - - West Bengal 36 348 697 4154 160575 996948 0.45 24.91 2402 3492 455351 103998 1934395 2658406 70.86 70.396
Source: Annual Reports of the Ministry of Home Affairs, 2006 -07 and 2007-08
3.18 The Union Ministry for Home Affairs recently introduced a web based financial monitoring system which would generate information on the expenses incurred by the States on various items of relief and rehabilitation. This system should be further revised to capture information on every disaster event in the States on a monthly basis which can be an additional source of rapid, reliable and disaggregated information on disasters throughout the country. 3.19 In the absence of country wide disaggregated data on disasters reliance was placed on the database of the Centre for Research on the Epidemiology of Disasters (CRED)3. This is good for global comparisons but not adequate to capture micro level details for proper analysis of disaster trends. CRED defines disaster as one in which 10 or more persons are killed and/or 100 or more persons are injured. But as per CRF norms even a single person affected by disasters is eligible for relief. 3 Thirty Years of Natural Disasters 1974-2003: The Numbers, Centre for Research on the Epidemiology of Disasters Louvain, 2004. Other annual figures have been obtained from Emergency Database (EM -DAT) of the CRED.
34
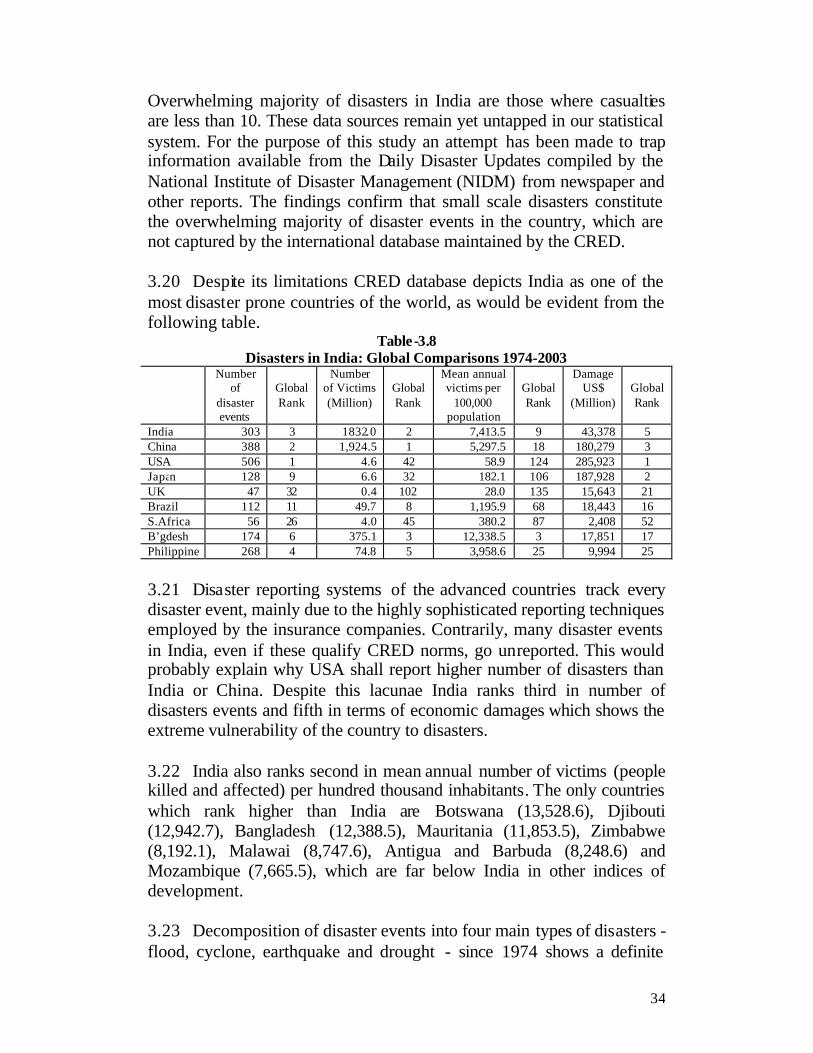
Overwhelming majority of disasters in India are those where casualties are less than 10. These data sources remain yet untapped in our statistical system. For the purpose of this study an attempt has been made to trap information available from the Daily Disaster Updates compiled by the National Institute of Disaster Management (NIDM) from newspaper and other reports. The findings confirm that small scale disasters constitute the overwhelming majority of disaster events in the country, which are not captured by the international database maintained by the CRED. 3.20 Despite its limitations CRED database depicts India as one of the most disaster prone countries of the world, as would be evident from the following table.
Table-3.8 Disasters in India: Global Comparisons 1974-2003
Number of
disaster events
Global Rank
Number of Victims (Million)
Global Rank
Mean annual victims per
100,000 population
Global Rank
Damage US$
(Million)
Global Rank
India 303 3 1832.0 2 7,413.5 9 43,378 5 China 388 2 1,924.5 1 5,297.5 18 180,279 3 USA 506 1 4.6 42 58.9 124 285,923 1 Japan 128 9 6.6 32 182.1 106 187,928 2 UK 47 32 0.4 102 28.0 135 15,643 21 Brazil 112 11 49.7 8 1,195.9 68 18,443 16 S.Africa 56 26 4.0 45 380.2 87 2,408 52 B’gdesh 174 6 375.1 3 12,338.5 3 17,851 17 Philippine 268 4 74.8 5 3,958.6 25 9,994 25
3.21 Disaster reporting systems of the advanced countries track every disaster event, mainly due to the highly sophisticated reporting techniques employed by the insurance companies. Contrarily, many disaster events in India, even if these qualify CRED norms, go unreported. This would probably explain why USA shall report higher number of disasters than India or China. Despite this lacunae India ranks third in number of disasters events and fifth in terms of economic damages which shows the extreme vulnerability of the country to disasters. 3.22 India also ranks second in mean annual number of victims (people killed and affected) per hundred thousand inhabitants. The only countries which rank higher than India are Botswana (13,528.6), Djibouti (12,942.7), Bangladesh (12,388.5), Mauritania (11,853.5), Zimbabwe (8,192.1), Malawai (8,747.6), Antigua and Barbuda (8,248.6) and Mozambique (7,665.5), which are far below India in other indices of development. 3.23 Decomposition of disaster events into four main types of disasters - flood, cyclone, earthquake and drought - since 1974 shows a definite
35
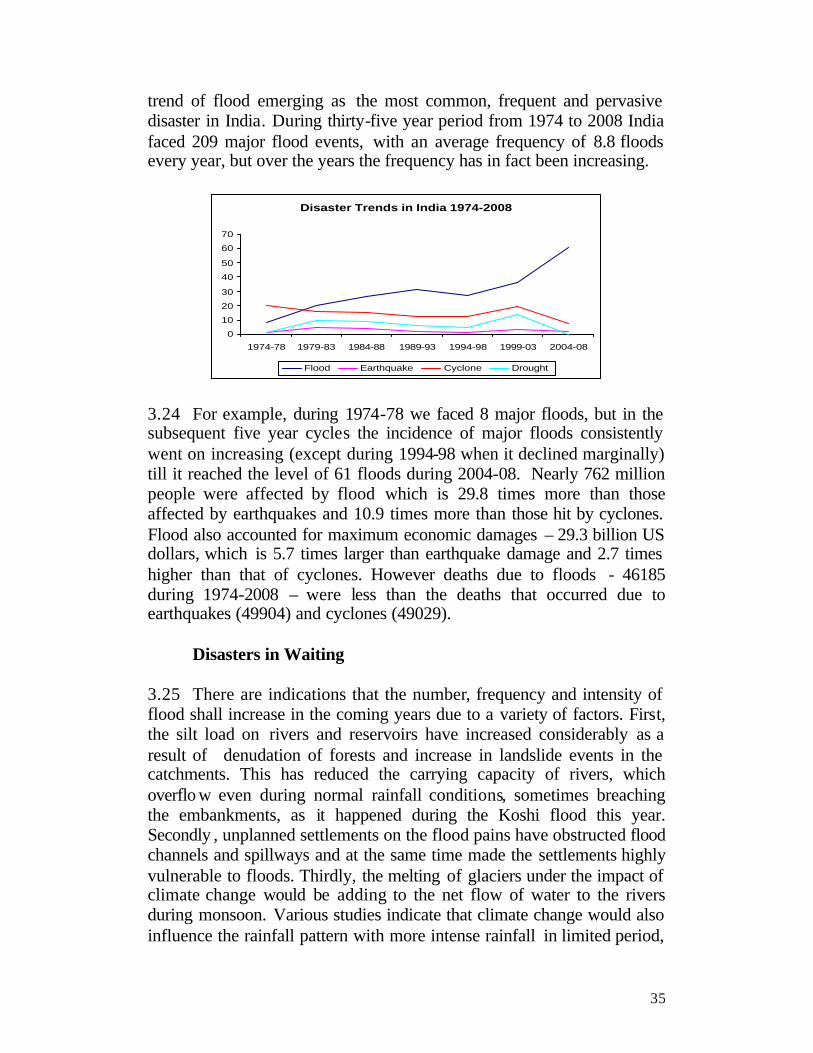
trend of flood emerging as the most common, frequent and pervasive disaster in India. During thirty-five year period from 1974 to 2008 India faced 209 major flood events, with an average frequency of 8.8 floods every year, but over the years the frequency has in fact been increasing.
Disaster Trends in India 1974-2008
0
10
20
30
40
50
60
70
1974-78 1979-83 1984-88 1989-93 1994-98 1999-03 2004-08
Flood Earthquake Cyclone Drought
3.24 For example, during 1974-78 we faced 8 major floods, but in the subsequent five year cycles the incidence of major floods consistently went on increasing (except during 1994-98 when it declined marginally) till it reached the level of 61 floods during 2004-08. Nearly 762 million people were affected by flood which is 29.8 times more than those affected by earthquakes and 10.9 times more than those hit by cyclones. Flood also accounted for maximum economic damages – 29.3 billion US dollars, which is 5.7 times larger than earthquake damage and 2.7 times higher than that of cyclones. However deaths due to floods - 46185 during 1974-2008 – were less than the deaths that occurred due to earthquakes (49904) and cyclones (49029). Disasters in Waiting 3.25 There are indications that the number, frequency and intensity of flood shall increase in the coming years due to a variety of factors. First, the silt load on rivers and reservoirs have increased considerably as a result of denudation of forests and increase in landslide events in the catchments. This has reduced the carrying capacity of rivers, which overflo w even during normal rainfall conditions, sometimes breaching the embankments, as it happened during the Koshi flood this year. Secondly , unplanned settlements on the flood pains have obstructed flood channels and spillways and at the same time made the settlements highly vulnerable to floods. Thirdly, the melting of glaciers under the impact of climate change would be adding to the net flow of water to the rivers during monsoon. Various studies indicate that climate change would also influence the rainfall pattern with more intense rainfall in limited period,
36
as it happened during the Mumbai flood in 2005, which would be beyond the design capacity of drainage systems particularly in the cities. In fact, successive floods in major cities all over the country point to the potentially damaging consequences of floods in future. 3.26 Earthquakes are less frequent but certainly more damaging than floods. Average return period of earthquake with a magnitude of M>7 which can be potentially dangerous is once in three and half years.
Table 3.9
Earthquakes (M>5.0) in Different Seismic Regions 1898-2008 Seismic region No. of earthquakes of magnitude Average Return
Period 5-5.9 6- 6.9 7-7.9 8.0+
1. Western Himalayas 25 7 2 2 2.5 – 3 yrs 2. Central Himalayas 68 28 4 1 1 yr 3. North East India 200 128 15 4 <4 months 4. Indo -Gangetic Basin 14 6 - - 5 yrs 5. Cambay and Rann of Kutch 4 4 1 1 20 yrs 6. Peninsular India 31 10 - - 2.5-3 yrs 7. Andaman & Nicobar 80 68 1 1 <8 months Whole in India 422 249 23 8 <2 months
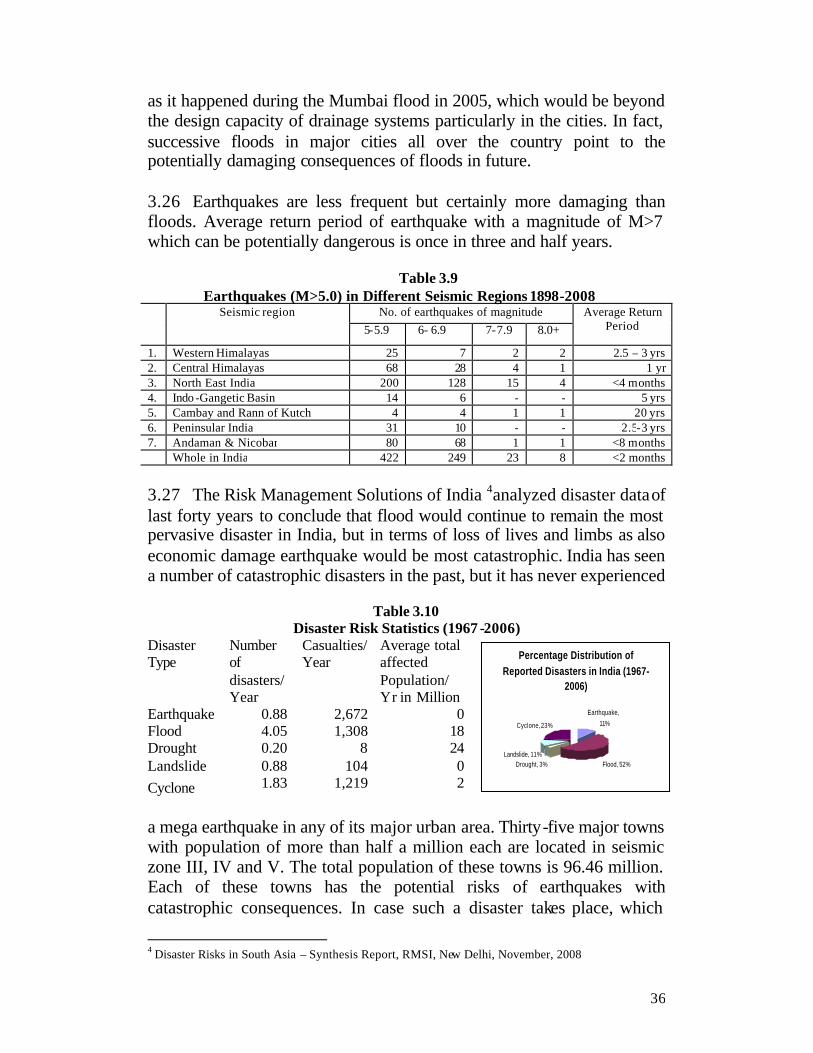
3.27 The Risk Management Solutions of India 4analyzed disaster data of last forty years to conclude that flood would continue to remain the most pervasive disaster in India, but in terms of loss of lives and limbs as also economic damage earthquake would be most catastrophic. India has seen a number of catastrophic disasters in the past, but it has never experienced
Table 3.10
Disaster Risk Statistics (1967 -2006) Disaster Type
Number of disasters/ Year
Casualties/ Year
Average total affected Population/ Yr in Million
Percentage Distribution of Reported Disasters in India (1967-
2006)
Earthquake,
11%
Flood, 52%Drought, 3%Landslide, 11%
Cyclone, 23%
Earthquake 0.88 2,672 0 Flood 4.05 1,308 18 Drought 0.20 8 24 Landslide 0.88 104 0 Cyclone 1.83 1,219 2
a mega earthquake in any of its major urban area. Thirty-five major towns with population of more than half a million each are located in seismic zone III, IV and V. The total population of these towns is 96.46 million. Each of these towns has the potential risks of earthquakes with catastrophic consequences. In case such a disaster takes place, which
4 Disaster Risks in South Asia – Synthesis Report, RMSI, New Delhi, November, 2008

37
seismologists have been warning are very well within the range of very high probability, the scale of damage would be much beyond the trend we have experienced so far.
Table 3.11 Economic Loss Potential of Earthquake, Flood, Cyclone and Dro ught Average Annnual Economic Loss
Earthquake, 10%
Flood, 63%
Drought, 19%Cyclone, 8%
Disaster Type
Annual exceedenc
e probability
Economic loss (US$
Millions)
Percentage to GDP
Earthquake
0.5% 10,987 1.2%
Flood 5% 4,913 0.5% Cyclone 20% 2,035 0.2% Drought 3% 8,980 0.8%
3.28 Climate change and rapid urban growth are the two most important factors that would contribute to the rising trend of disasters in India. Rapid increase in hydro meteorological disasters is attributed to the changing climate which is expected to further increase the frequencies as well as the intensities of flood, flash floods and cyclone. In the long run, this would reduce the net availability of surface and sub-surface water thereby increasing the incidence of droughts. 3.29 India is one among the least urbanized countries of the world with less than 30 percent of its population living in towns compared to the world average of more than 50 percent. Every analysis has projected an urban explosion in India from 285 million in 2001 to 550 million in 2021. Already India has the largest concentration of mega cities in the world which are growing with an average rate of 4.5% per year. Much of this growth is induced by migration of poor labour force in search employment in the cities. With land prices soaring high the migrant population are settling down in dense unplanned settlements and unsafe buildings which are extremely vulnerable to disasters. 3.30 While prediction of every type of disaster over a short term period of 5-10 years may be extremely difficult, judging by the trend of the previous years and the average period of various types of disasters it can be anticipated that during the five year fiscal cycle of Thirteenth Finance Commission (2010-15) there is a very strong probability that the country may face both earthquake (last major earthquake was in 2001) and drought (last major drought took place in 2002), while the recurring phenomenon of flood, cyclone, landslide, fire, hailstorm, cloudburst, avalanche etc would continue as usual or with more frequencies and intensities. For the sake of sound planning it may be worthwhile to proceed on the basis of worst case scenarios, as indicated above.

38
AWARDS OF FINANCE COMMISSIONS
The Constitution of India has not directly specified which level of
government is responsible for managing disasters – neither relief for natural calamities nor disaster management figures anywhere in the Union, State or Concurrent List, although under entry 97 of the Union list, a subject that is not specifically mentioned in any of the lists would ordinarily have to be dealt by the Union Government. However, by convention this responsibility has been vested on the States, and rightly so since the most of the action on disaster management lie in the States and the districts, while the central government plays a largely a supportive role with financial, technical and material support whenever necessary. 4.2 The supportive functions of Central government extends from early warning of disasters by various agencies like Indian Meteorological Department, Central Water Commission etc to deployment of aircrafts and boats, specialist teams of armed forces, National Disaster Response Force (NDRF) etc, arrangements for relief materials and essential commodities including medical stores, restoration of critical infrastructure facilities including communication network and such other assistance, as may be required by the affected States to meet the situation effectively. The expenses incurred by the agencies of the Central government are met by and large from the Plan and non-P lan budget of the Central Ministries. For example, the Ministry of Home Affairs as the nodal Ministry in charge of disaster management has a budgetary allocation of Rs. 112.91 crores under account head 2245- Relief on Account of Natural Calamities. Similarly other nodal Ministries in charge of specific aspects of disaster management – Ministry of Agriculture (nodal Ministry for drought and pest attack 1), Ministry of Environment and Forests (industrial and chemical disasters), Department of Atomic Energy (nuclear disaster), Ministry of Health & Family Welfare (epidemics and pandemics) meet their expenses from their respective budgetary sources, which were never the subject of review by the Finance Commissions. 4.3 The overwhelming expenditure on disaster management in India, more specifically for post-disaster response, relief and rehabilitation, are
1 Assistance to the States for Drought and Pest attack are covered under the Calamity Relief Funds allocated by the Finance Commissions.

39
incurred by the State governments and district administration and almost the entire budgetary allocations for the same are met from the allocations made to the States annually for the five year fiscal cycle on the basis of the recommendations made by the Finance Commissions constituted under article 280 of the Constitution of India . In fact, the entire system of financing disaster management in India has evolved around he recommendations of the successive Finance Commissions. 4.2 The recommendations of the Finance Commissions have been based on the overriding principle that financial assistance to the States shall be limited to providing immediate gratuitous relief to the victims of natural calamities and to restore the public utilities so that the affected persons are able to restart their economic activities again. The objective of such assistance was neither to compensate people for their loss (which is the function of insurance) nor to reconstruct the damaged assets to the pre-disaster conditions, which are expected to be met from the States from their own resources or from the funds available under various plan schemes of the Central government. This relief centric approach did not encourage strategic thinking on the total financial requirement of the States for holistic management of disasters, quantification of resource gaps and how such gaps can be met over time by various innovative financial instruments for risk management. The Thirteenth Finance Commission, constituted on the backdrop of the paradigm shift in disaster management ushered by the Disaster Management Act 2005, has the opportunity to look into some of these basic issues of financing disaster management which would definitely occupy important space in public policies in the coming years.
Margin Money Scheme
4.3 The First FC (1950-55) did not make any recommendation regarding the financing of relief expenditure of the States. The Second FC (1955-60) took cognizance of the subject suo moto as it was ‘struck by the dislocation caused to the finances of many States by unforeseen expenditure on natural calamities like famine, droughts and floods’ and was ‘impressed with the need for making some regular provisions to meet this type of expenditure.’2 The Commission innovated the concept of Margin Money to be allocated to the States as a separate fund for meeting the expenses on natural calamities. This was roughly calculated on the average annual expenditure over the last decade. The balance fund after meeting the expenses was to be ‘invested in readily marketable
2 Report of Second Finance Commission, page 64

40
government securities so that they may be available when needed, without the States having, except in abnormal circumstances, to curtail other expenditure or approach the Union for assistance’ 3 . In case expenditure by a State exceeded its margin, Central assistance to the extent of 75 percent (50 percent as loan and 25 percent as grant) was made available. 4.4 The next six Finance Commissions continued with the margin money scheme with some modifications. The Third FC (1960-65), without specifically awarding any margin money included the item under the general ‘Grants-in-Aid to the States’. The Fourth FC (1965-70) did not recommend any change apart from refixing the margin money. The Fifth FC (1970-75) recommended that 75 percent assistance should be given wholly in the form of grants. 4.5 The Sixth FC (1975-80), for the first time had a specific term of reference to ‘review the policy and arrangements in regard to the financing of relief expenditure by the States affected by natural calamities and examine the feasibility of establishing a National Fund to which the Central and State Governments may contribute a percentage of their revenue receipts’. The Sixth FC devoted an entire chapter on financing of relief expenditure, which became the practice for the subsequent Commissions. The Commission noted with concern alarming increase in Central assistance for drought relief, which exceeded the Plan assistance in some of the states and felt that much of this wasteful expenditure could be avoided with better planning and organisation. The Commission felt that detailed programmes off medium and long term significance should be drawn up under Plan for permanent improvement of drought and flood prone areas. The Sixth FC examined the idea of a National Fund for Calamities but found that it was neither feasible nor desirable, mainly due to the opposition of majority of the States. 4.6 The Seventh FC (1980-85) made a distinction between calamities of different natures by differentiating between droughts on the one hand and floods, cyclones and earthquakes on the other. The distinction was made on the basis of the nature of events and the type of measures required for response. The Commission recognised that relief requirement for the rapid onset disasters like floods, cyclones and earthquakes was immediate and quick, while slow-onset events like droughts could be planned in a long-term perspective. It recommended that in the event of drought, the expenditure of a State, over and above the margin money,
3 Ibid

41
has to be funded out of the contribution from the plan outlay only. As regards expenditure on repairs and restoration of public works following floods, cyclones and earthquakes, which was in excess of a State’s margin money, Central assistance was to be given as non-plan grants not adjustable against the Plan. It further recommended that where a calamity was of rare severity, the central government could extend assistance to the State concerned even beyond the scheme suggested by the Commission. 4.7 The Eighth FC (1985-90) recommended the continuation of the scheme suggested by the Seventh FC with the modification that a higher quantum of margin money shall be fixed for the States and damages caused by fire shall be treated on the same footing as floods, cyclones and earthquakes. There was a quantum jump in margin money allocations from the Sixth FC onwards, as would be evident from the following graph. This is apart from the ad hoc Central assistance given to States as grants, loan or advances against the current plan etc to deal with specific calamities over and above the margin money allocations.
Margin Money Awarded by Finance Commissions (Rs. in Crores)
30.75 78.41 72.35
253.55
502.75
1203.75
0
200400
600
800
10001200
1400
2nd FC1955-60
3rd FC1960-65
4th FC1965-70
5th FC1970-75
6th FC1975-80
7th FC1980-85
8th FC 1985-90
4.8 Margin money allocations by the Fifth FC were less than the amount allocated by the Fourth FC basically on account of reduced allocations for the States of West Bengal and Punjab, though partially compensated by higher allocations for Haryana, the new entrant. Sixth FC increased the allocations substantially across the board for all the States, but Rajasthan, Bihar, West Bengal, Maharashtra were the major gainers. During the Seventh and Eighth FC period, allocations at all India level almost doubled over the period of previous Commissions. From the Fourth to Eighth FC taken together, Bihar (12.9 %), West Bengal
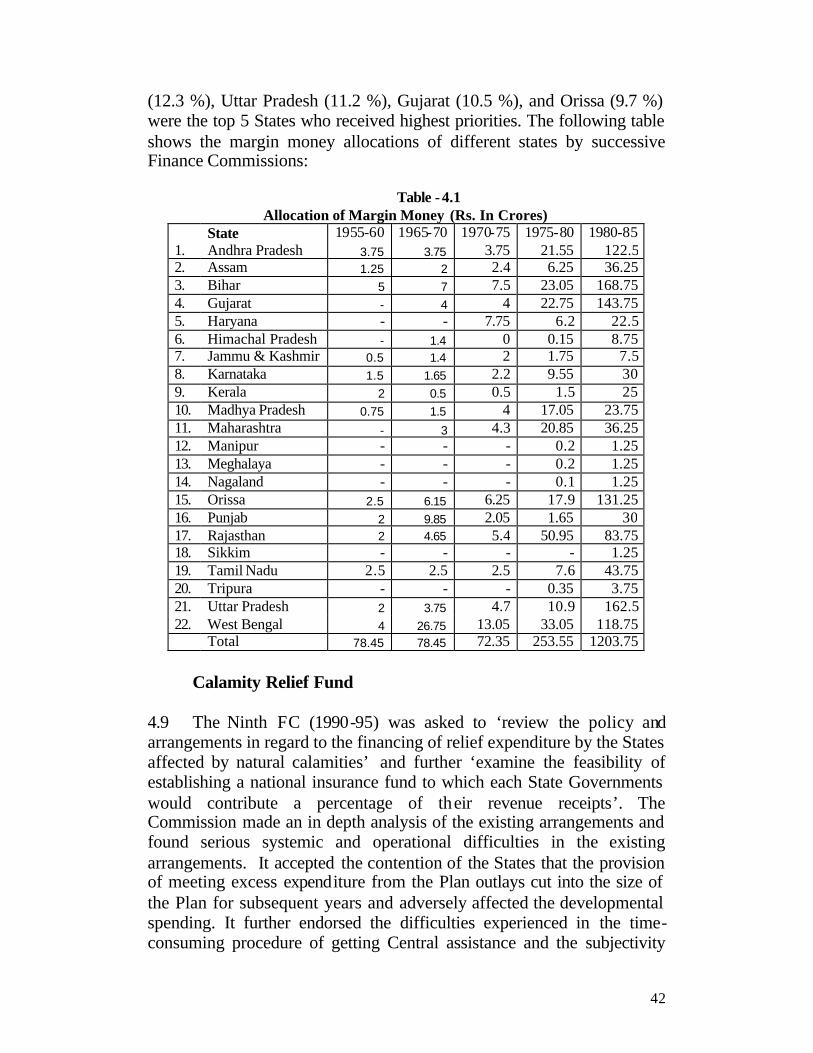
42
(12.3 %), Uttar Pradesh (11.2 %), Gujarat (10.5 %), and Orissa (9.7 %) were the top 5 States who received highest priorities. The following table shows the margin money allocations of different states by successive Finance Commissions:
Table - 4.1
Allocation of Margin Money (Rs. In Crores) State 1955-60 1965-70 1970-75 1975-80 1980-85 1. Andhra Pradesh 3.75 3.75 3.75 21.55 122.5 2. Assam 1.25 2 2.4 6.25 36.25 3. Bihar 5 7 7.5 23.05 168.75 4. Gujarat - 4 4 22.75 143.75 5. Haryana - - 7.75 6.2 22.5 6. Himachal Pradesh - 1.4 0 0.15 8.75 7. Jammu & Kashmir 0.5 1.4 2 1.75 7.5 8. Karnataka 1.5 1.65 2.2 9.55 30 9. Kerala 2 0.5 0.5 1.5 25 10. Madhya Pradesh 0.75 1.5 4 17.05 23.75 11. Maharashtra - 3 4.3 20.85 36.25 12. Manipur - - - 0.2 1.25 13. Meghalaya - - - 0.2 1.25 14. Nagaland - - - 0.1 1.25 15. Orissa 2.5 6.15 6.25 17.9 131.25 16. Punjab 2 9.85 2.05 1.65 30 17. Rajasthan 2 4.65 5.4 50.95 83.75 18. Sikkim - - - - 1.25 19. Tamil Nadu 2.5 2.5 2.5 7.6 43.75 20. Tripura - - - 0.35 3.75 21. Uttar Pradesh 2 3.75 4.7 10.9 162.5 22. West Bengal 4 26.75 13.05 33.05 118.75 Total 78.45 78.45 72.35 253.55 1203.75
Calamity Relief Fund
4.9 The Ninth FC (1990-95) was asked to ‘review the policy and arrangements in regard to the financing of relief expenditure by the States affected by natural calamities’ and further ‘examine the feasibility of establishing a national insurance fund to which each State Governments would contribute a percentage of their revenue receipts’. The Commission made an in depth analysis of the existing arrangements and found serious systemic and operational difficulties in the existing arrangements. It accepted the contention of the States that the provision of meeting excess expenditure from the Plan outlays cut into the size of the Plan for subsequent years and adversely affected the developmental spending. It further endorsed the difficulties experienced in the time-consuming procedure of getting Central assistance and the subjectivity

43
which creeps through the brief visit of the Central team. The Commission concluded that the conditionality attached to release of Central assistance on the basis of recommendations of a Central team could be prone to substantial under-assessments and cursory understanding of the real situation.4 Therefore, it came to the conclusion that an alternate system of relief funding had to be developed. 4.10 The Commission made path breaking recommendations which completely replaced the ‘existing arrangements of financing relief expenditure involving the provision of margin money, preparation of State’s memoranda, visits of central teams, etc by a scheme which is qualitatively different in the sense that generous funds are placed at the disposal of the states and they are expected to look after themselves in almost all situations’.5 The salient features of the new scheme were as follows:
a) A Calamity Relief Fund was constituted for each State to be contributed 75 percent by the Central government and 25 percent by the State concerned.
b) The Fund shall be kept in a nationalised bank and operated under the control of a Committee headed by the Chief Secretary, which will decide all matters connected with the financing of the relief expenditure.
c) The Committee shall decide the norms suitable to the State as it may not always be realistic to have one uniform norm throughout the country.
d) The interests accrued on the fund and the savings available in a particular year shall be carried forward to the next year and at the end of the fifth year the balance amount shall be carried forward for the next Plan.
e) If the requirement of fund in a particular year is more than what is available, the State may draw 25 percent of the funds due to it in the following year from the Centre to be adjusted against the dues of the subsequent year.
f) All the natural calamities considered by the earlier Commissions should continue to be covered but the distinction drawn between droughts on the one hand and floods, cyclones, fire etc., on the other, should be done away with.
g) An Expert Group constituted by the Centre would monitor utilisation of the fund and advise the State on its optimal utilisation.
4 Report of Ninth Finance Commission, Para 6.7. 5 Ibid Para 6.17
44
4.11 The Ninth FC examined the feasibility of setting up a National Insurance Fund and concluded that providing insurance cover to all affected/ vulnerable people, most of whom are poor with little to insure would not be a viable option and would run into serious operational difficulties.
4.12 The Tenth FC (1995-2000) recommended the continuation of the Calamity Relief Fund with some modifications. The main features of the modified scheme were as follows:
a) The CRF should be held outside the public account of the State in a manner prescribed by Ministry of Finance, which will also ensure that the Central contributions released in earlier years have been credited to the CRF.
b) The existing scheme should be modified so as to provide for flexibility in the investment options subject to ensuring security and liquidity.
c) The Ministry of Agriculture shall constitute a committee comprising of experts and representatives of State governments to frame common guidelines in regard to the items and their rates and norms that can be debited to the CRF.
d) The State Committee under the Chair of Chief Secretary would decide on all matters connected with financing of relief expenditure subject to general guidelines issued by the Ministry of Agriculture.
e) The Accountants General would be instructed to see that expenditure only on the items approved is booked under the account head of natural calamities.
4.13 The Eleventh FC (2000-05) found ample justification in continuing with the existing CRF scheme for meeting the expenditure for providing immediate relief to the victims of cyclone, drought, earthquake, fire and hailstorm. Expenditure on restoration of infrastructure and other capital assets, except those which are intrinsically connected with relief operations and connectivity with the affected area and population should be met from the plan funds on priority. The Commission suggested that a multi-disciplinary group of 200-300 skilled professionals in each State should be kept in readiness to respond to any disaster event. This group should be given training in diverse fields such as communication, medical and public health, sanitation, housing etc so that the country can have a team of about 3000-4000 trained personnel at any given point of time in readiness to be deployed anywhere where disaster strikes. The expenditure for their training would be met from CRF. The Commission further recommended that every State shall submit an Annual Report by
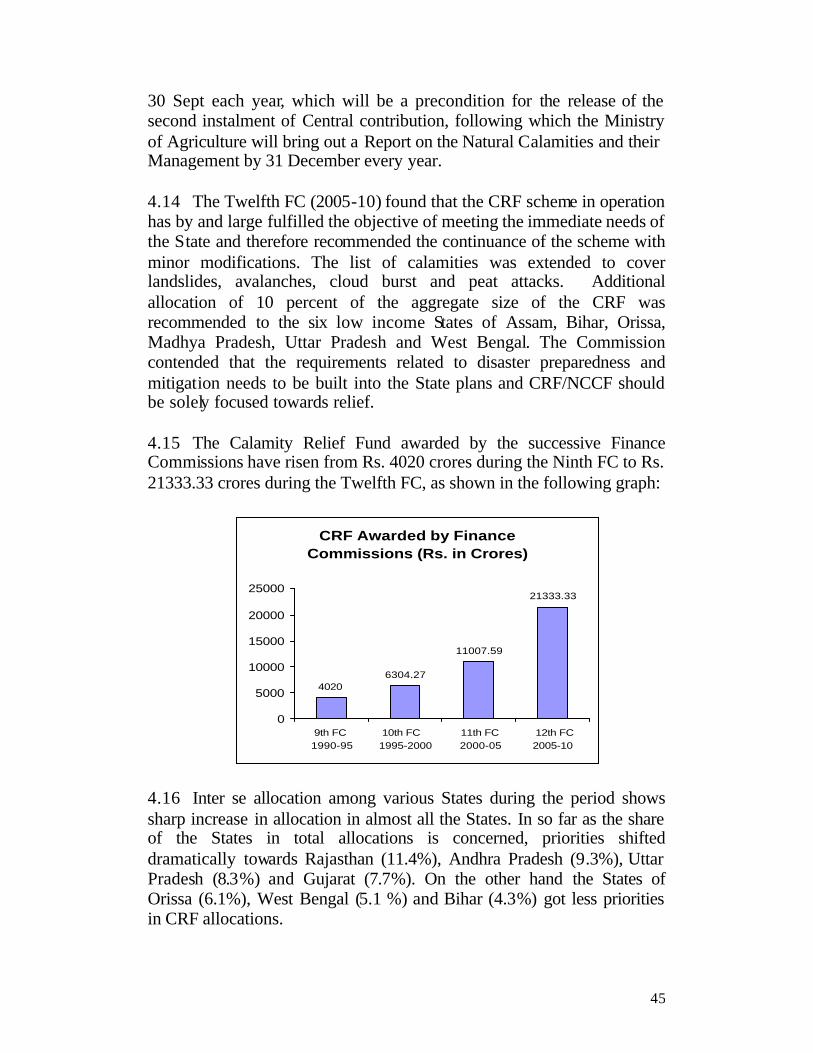
45
30 Sept each year, which will be a precondition for the release of the second instalment of Central contribution, following which the Ministry of Agriculture will bring out a Report on the Natural Calamities and their Management by 31 December every year.
4.14 The Twelfth FC (2005-10) found that the CRF scheme in operation has by and large fulfilled the objective of meeting the immediate needs of the State and therefore recommended the continuance of the scheme with minor modifications. The list of calamities was extended to cover landslides, avalanches, cloud burst and peat attacks. Additional allocation of 10 percent of the aggregate size of the CRF was recommended to the six low income States of Assam, Bihar, Orissa, Madhya Pradesh, Uttar Pradesh and West Bengal. The Commission contended that the requirements related to disaster preparedness and mitigation needs to be built into the State plans and CRF/NCCF should be solely focused towards relief. 4.15 The Calamity Relief Fund awarded by the successive Finance Commissions have risen from Rs. 4020 crores during the Ninth FC to Rs. 21333.33 crores during the Twelfth FC, as shown in the following graph:
CRF Awarded by Finance Commissions (Rs. in Crores)
40206304.27
11007.59
21333.33
0
5000
10000
15000
20000
25000
9th FC 1990-95
10th FC 1995-2000
11th FC 2000-05
12th FC 2005-10
4.16 Inter se allocation among various States during the period shows sharp increase in allocation in almost all the States. In so far as the share of the States in total allocations is concerned, priorities shifted dramatically towards Rajasthan (11.4%), Andhra Pradesh (9.3%), Uttar Pradesh (8.3%) and Gujarat (7.7%). On the other hand the States of Orissa (6.1%), West Bengal (5.1 %) and Bihar (4.3%) got less priorities in CRF allocations.
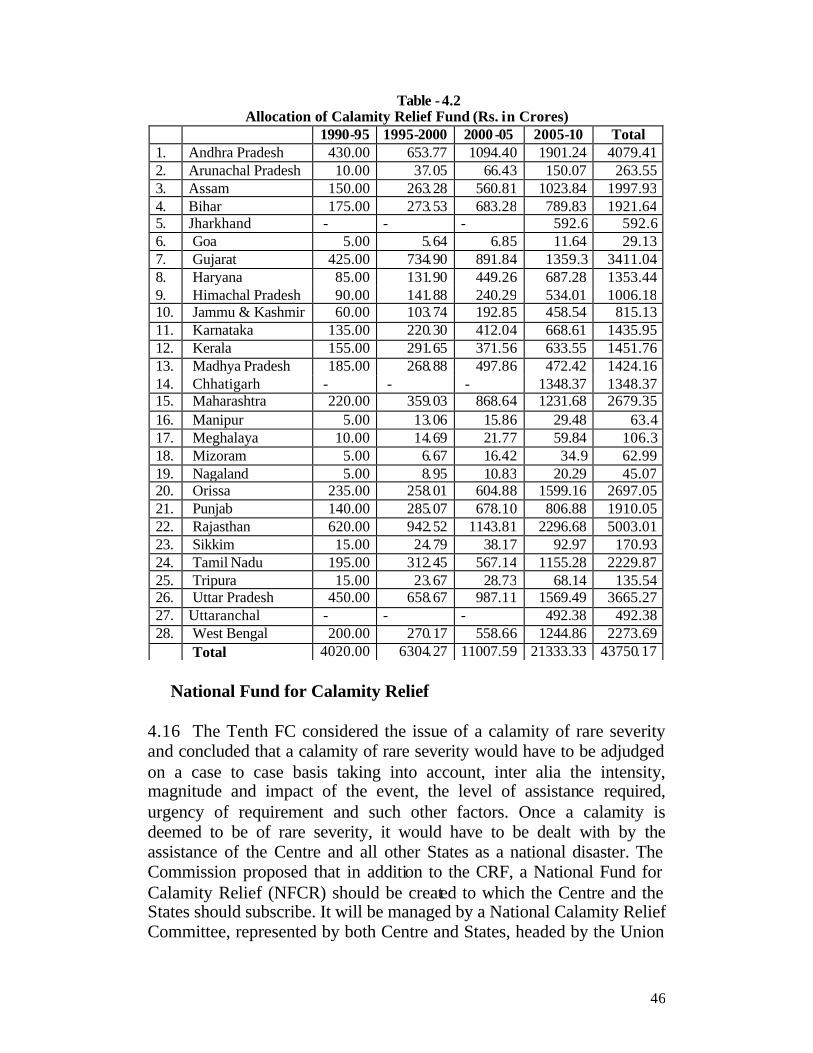
46
Table - 4.2 Allocation of Calamity Relief Fund (Rs. in Crores)
1990-95 1995-2000 2000-05 2005-10 Total 1. Andhra Pradesh 430.00 653.77 1094.40 1901.24 4079.41 2. Arunachal Pradesh 10.00 37.05 66.43 150.07 263.55 3. Assam 150.00 263.28 560.81 1023.84 1997.93 4. Bihar 175.00 273.53 683.28 789.83 1921.64 5. Jharkhand - - - 592.6 592.6 6. Goa 5.00 5.64 6.85 11.64 29.13 7. Gujarat 425.00 734.90 891.84 1359.3 3411.04 8. Haryana 85.00 131.90 449.26 687.28 1353.44 9. Himachal Pradesh 90.00 141.88 240.29 534.01 1006.18 10. Jammu & Kashmir 60.00 103.74 192.85 458.54 815.13 11. Karnataka 135.00 220.30 412.04 668.61 1435.95 12. Kerala 155.00 291.65 371.56 633.55 1451.76 13. Madhya Pradesh 185.00 268.88 497.86 472.42 1424.16 14. Chhatigarh - - - 1348.37 1348.37 15. Maharashtra 220.00 359.03 868.64 1231.68 2679.35 16. Manipur 5.00 13.06 15.86 29.48 63.4 17. Meghalaya 10.00 14.69 21.77 59.84 106.3 18. Mizoram 5.00 6.67 16.42 34.9 62.99 19. Nagaland 5.00 8.95 10.83 20.29 45.07 20. Orissa 235.00 258.01 604.88 1599.16 2697.05 21. Punjab 140.00 285.07 678.10 806.88 1910.05 22. Rajasthan 620.00 942.52 1143.81 2296.68 5003.01 23. Sikkim 15.00 24.79 38.17 92.97 170.93 24. Tamil Nadu 195.00 312.45 567.14 1155.28 2229.87 25. Tripura 15.00 23.67 28.73 68.14 135.54 26. Uttar Pradesh 450.00 658.67 987.11 1569.49 3665.27 27. Uttaranchal - - - 492.38 492.38 28. West Bengal 200.00 270.17 558.66 1244.86 2273.69 Total 4020.00 6304.27 11007.59 21333.33 43750.17
National Fund for Calamity Relief
4.16 The Tenth FC considered the issue of a calamity of rare severity and concluded that a calamity of rare severity would have to be adjudged on a case to case basis taking into account, inter alia the intensity, magnitude and impact of the event, the level of assistance required, urgency of requirement and such other factors. Once a calamity is deemed to be of rare severity, it would have to be dealt with by the assistance of the Centre and all other States as a national disaster. The Commission proposed that in addition to the CRF, a National Fund for Calamity Relief (NFCR) should be created to which the Centre and the States should subscribe. It will be managed by a National Calamity Relief Committee, represented by both Centre and States, headed by the Union
47
Agriculture Minister and comprising of Deputy Chairman of Planning Commission, two Union Ministers and five Chief Ministers to be nominated by the Prime Minister by rotation. The NFCR would be operated by the Ministry of Agriculture, to be maintained outside the Public Account of the Union Government. The guidelines would be prepared by the Ministry of Finance and audited annually by the CAG. The corpus of the fund will be Rs. 700 crores, to be built over five years, with an initial corpus of Rs. 200 crores to which the Centre would contribute Rs. 150 crores and the S tates Rs. 50 crores, in the proportion of 75:25 respectively. In addition, for each of the five years the Centre would contribute Rs. 75 crores and the States Rs. 25 crores. The objective was to create a system to usher a sense of ‘national solidarity in a common endeavour which would then abide beyond the period of distress.’
National Calamity Contingency Fund
4.17 The Eleventh FC reviewed the scheme of National Calamity Relief Fund in detail and found that the entire corpus of the Fund was exhausted in three years. It concluded that the existence of the fund encouraged representations from the states for assistance even when a calamity could be met from the state’s own resources. It therefore recommended dissolution of the fund as it had not resulted in making funds readily available in times of calamities of rare severity. It however, recommended putting in place a system which would make it possible for a body of experts to take suo moto cognizance of a disaster of rare severity and recommend suitable measures for financing the same. It recommended setting up of a National Centre for Calamity Management (NCCM) to monitor the natural calamities and their impact on area and population. Recommendations from NCCM to the Central Government would enable them to take a view on release of assistance to cope with a severe event. This should be financed by the levy of a special surcharge on Central taxes for a limited period; this collection would be kept in a separate fund called the National Calamity Contingency Fund (NCCF). The initial corpus of Rs 500 crore would be contributed by the Government of India, thereafter it would be filled by proceeds from the special surcharge. 4.18 An amount of Rs. 8063.44 crores (average Rs. 1612.6 crores annually) was spent on NCCF during the fiscal cycle 2000-2005. The year 2005-06 started with a huge spending of Rs. 3061.44 crores due largely to the floods in as many as 12 States, but subsequent years have seen drastic decline in NCCF expenditure largely due to stringent

48
enforcement of NCCF norms by the Ministry of Home Affairs. The expenditure during 2006-07 declined to Rs. 1962.05 crores followed by further declines during 2007-08 to Rs. 373.37 crores and Rs. 311.84 crores during 2008-09 crores (ending November 2008). The details of NCCF expenditure during 2008-09 are shown in the following graph.
Expenses on NCCF - 2000-2008 (Rs. in Crores)
924.21
1368.681600 1587.42
2583.12
3061.44
1962.05
373.37 311.84
0
500
1000
1500
2000
2500
3000
3500
2000-01
2001-02
2002-03
2003-04
2004-05
2005-06
2006-07
2007-08
2008-09

49
PATTERN OF EXPENDITURE ON DISASTER MANAGEMENT
Every successive Finance Commission has followed the cardinal principle that the expenditure incurred by the States on relief on account of natural calamities during the previous ten years should be the main basis of allocation of funds to the States for the next five year fiscal cycle, although this has been supplemented by considerations like inflation, low income status of some of the States etc. Therefore it would be worthwhile to look in depth into the pattern of expenditure incurred by the States on disaster management from 2000-01 onwards.
Data on State Expenditure on Relief
5.2 State expenditure figures on relief have been accessed from accessed various sources – the State governments which actually incur the expenditure, the Ministry of Home Affairs which has the nodal responsibility to monitor the expenditure incurred by the States, the Ministry of Finance (Department of Expenditure) which releases the CRF and NCCF allocations, the Comptroller and Auditor General which audits the accounts of the States and the Reserve Bank of India which consolidates the expenditure incurred by the States.
5.3 Finance Commission devised a format for the States for furnishing disaggregated information on receipts and expenditure on each of the ten natural calamities for the period 2002-03 to 2007-08 (RE). 22 States responded but none provided disaggregated information in respect of all the 10 natural calamities. 18 States reported on drought and flood, 7 each on cyclone and hailstorm and 11 on fire. The details provided by the States in Statement-25 have been compiled in Annexure -VIII. It may not be correct to make any conclusive analysis on the basis of incomplete information. However, it may be interesting to look at the receipts of the States vis-à-vis expenditure , as reported by the States. 8 out of the 22 reporting States appear to have spent more than they have received, as shown in the table below. This needs further corroboration from other data sources.
Table-5.1 Relief Expenditure as Percentage o f Receipts - Statement 25
2002- 03
2003- 04
2004- 05
2005- 06
2006- 07
2007- 08
2002- 07
1 Andhra Pradesh 256 34 237 120 145 116 144 2 Arunachal Pradesh 101 100 101 100 98 100 99
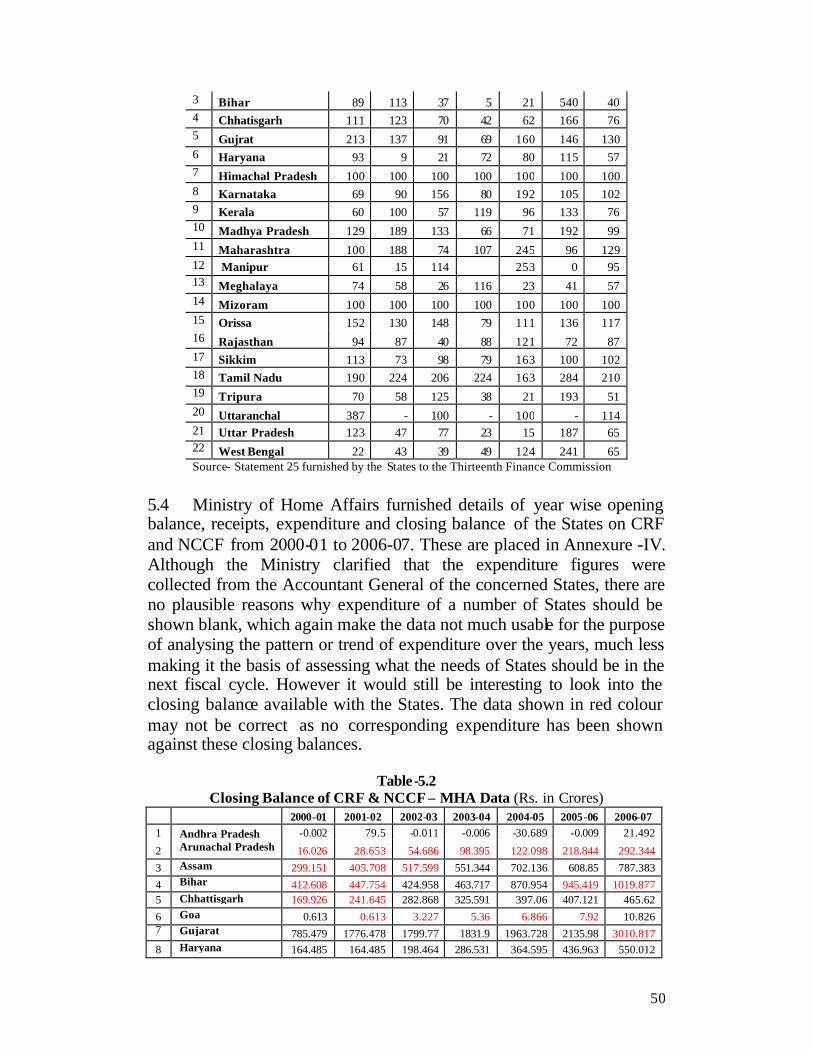
50
3 Bihar 89 113 37 5 21 540 40 4 Chhatisgarh 111 123 70 42 62 166 76 5 Gujrat 213 137 91 69 160 146 130 6 Haryana 93 9 21 72 80 115 57 7 Himachal Pradesh 100 100 100 100 100 100 100 8 Karnataka 69 90 156 80 192 105 102 9 Kerala 60 100 57 119 96 133 76 10 Madhya Pradesh 129 189 133 66 71 192 99 11 Maharashtra 100 188 74 107 245 96 129 12 Manipur 61 15 114 253 0 95 13 Meghalaya 74 58 26 116 23 41 57 14 Mizoram 100 100 100 100 100 100 100 15 Orissa 152 130 148 79 111 136 117 16 Rajasthan 94 87 40 88 121 72 87 17 Sikkim 113 73 98 79 163 100 102 18 Tamil Nadu 190 224 206 224 163 284 210 19 Tripura 70 58 125 38 21 193 51 20 Uttaranchal 387 - 100 - 100 - 114 21 Uttar Pradesh 123 47 77 23 15 187 65 22 West Bengal 22 43 39 49 124 241 65 Source- Statement 25 furnished by the States to the Thirteenth Finance Commission
5.4 Ministry of Home Affairs furnished details of year wise opening balance, receipts, expenditure and closing balance of the States on CRF and NCCF from 2000-01 to 2006-07. These are placed in Annexure -IV. Although the Ministry clarified that the expenditure figures were collected from the Accountant General of the concerned States, there are no plausible reasons why expenditure of a number of States should be shown blank, which again make the data not much usable for the purpose of analysing the pattern or trend of expenditure over the years, much less making it the basis of assessing what the needs of States should be in the next fiscal cycle. However it would still be interesting to look into the closing balance available with the States. The data shown in red colour may not be correct as no corresponding expenditure has been shown against these closing balances.
Table-5.2
Closing Balance of CRF & NCCF – MHA Data (Rs. in Crores) 2000-01 2001-02 2002-03 2003-04 2004-05 2005-06 2006-07
1 Andhra Pradesh -0.002 79.5 -0.011 -0.006 -30.689 -0.009 21.492
2 Arunachal Pradesh 16.026 28.653 54.686 98.395 122.098 218.844 292.344 3 Assam 299.151 405.708 517.599 551.344 702.136 608.85 787.383 4 Bihar 412.608 447.754 424.958 463.717 870.954 945.419 1019.877 5 Chhattisgarh 169.926 241.645 282.868 325.591 397.06 407.121 465.62 6 Goa 0.613 0.613 3.227 5.36 6.866 7.92 10.826 7 Gujarat 785.479 1776.478 1799.77 1831.9 1963.728 2135.98 3010.817 8 Haryana 164.485 164.485 198.464 286.531 364.595 436.963 550.012
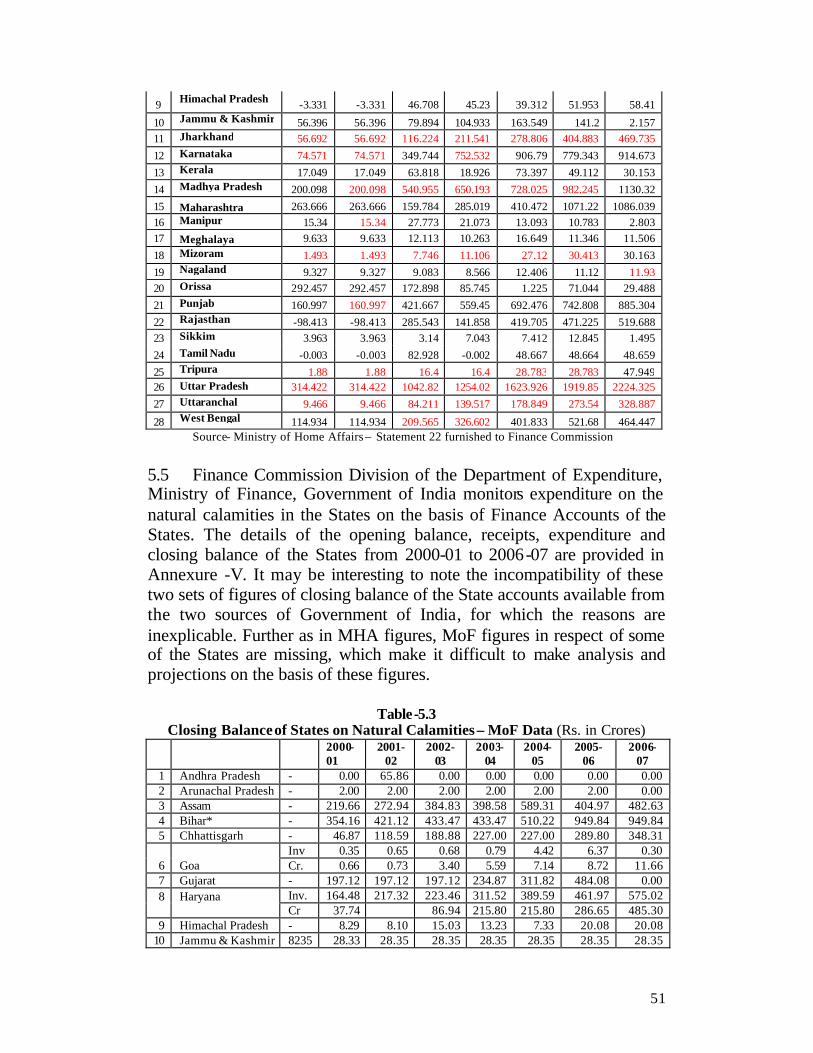
51
9 Himachal Pradesh -3.331 -3.331 46.708 45.23 39.312 51.953 58.41
10 Jammu & Kashmir 56.396 56.396 79.894 104.933 163.549 141.2 2.157 11 Jharkhand 56.692 56.692 116.224 211.541 278.806 404.883 469.735 12 Karnataka 74.571 74.571 349.744 752.532 906.79 779.343 914.673 13 Kerala 17.049 17.049 63.818 18.926 73.397 49.112 30.153 14 Madhya Pradesh 200.098 200.098 540.955 650.193 728.025 982.245 1130.32 15 Maharashtra 263.666 263.666 159.784 285.019 410.472 1071.22 1086.039 16 Manipur 15.34 15.34 27.773 21.073 13.093 10.783 2.803 17 Meghalaya 9.633 9.633 12.113 10.263 16.649 11.346 11.506 18 Mizoram 1.493 1.493 7.746 11.106 27.12 30.413 30.163 19 Nagaland 9.327 9.327 9.083 8.566 12.406 11.12 11.93 20 Orissa 292.457 292.457 172.898 85.745 1.225 71.044 29.488 21 Punjab 160.997 160.997 421.667 559.45 692.476 742.808 885.304 22 Rajasthan -98.413 -98.413 285.543 141.858 419.705 471.225 519.688 23 Sikkim 3.963 3.963 3.14 7.043 7.412 12.845 1.495 24 Tamil Nadu -0.003 -0.003 82.928 -0.002 48.667 48.664 48.659 25 Tripura 1.88 1.88 16.4 16.4 28.783 28.783 47.949 26 Uttar Pradesh 314.422 314.422 1042.82 1254.02 1623.926 1919.85 2224.325 27 Uttaranchal 9.466 9.466 84.211 139.517 178.849 273.54 328.887
28 West Bengal 114.934 114.934 209.565 326.602 401.833 521.68 464.447 Source- Ministry of Home Affairs – Statement 22 furnished to Finance Commission
5.5 Finance Commission Division of the Department of Expenditure, Ministry of Finance, Government of India monitors expenditure on the natural calamities in the States on the basis of Finance Accounts of the States. The details of the opening balance, receipts, expenditure and closing balance of the States from 2000-01 to 2006-07 are provided in Annexure -V. It may be interesting to note the incompatibility of these two sets of figures of closing balance of the State accounts available from the two sources of Government of India, for which the reasons are inexplicable. Further as in MHA figures, MoF figures in respect of some of the States are missing, which make it difficult to make analysis and projections on the basis of these figures.
Table-5.3 Closing Balance of States on Natural Calamities – MoF Data (Rs. in Crores)
2000-
01 2001-
02 2002-
03 2003-
04 2004-
05 2005-
06 2006-
07 1 Andhra Pradesh - 0.00 65.86 0.00 0.00 0.00 0.00 0.00 2 Arunachal Pradesh - 2.00 2.00 2.00 2.00 2.00 2.00 0.00 3 Assam - 219.66 272.94 384.83 398.58 589.31 404.97 482.63 4 Bihar* - 354.16 421.12 433.47 433.47 510.22 949.84 949.84 5 Chhattisgarh - 46.87 118.59 188.88 227.00 227.00 289.80 348.31
6 Goa Inv 0.35 0.65 0.68 0.79 4.42 6.37 0.30 Cr. 0.66 0.73 3.40 5.59 7.14 8.72 11.66
7 Gujarat - 197.12 197.12 197.12 234.87 311.82 484.08 0.00 8
Haryana
Inv. 164.48 217.32 223.46 311.52 389.59 461.97 575.02 Cr 37.74 86.94 215.80 215.80 286.65 485.30
9 Himachal Pradesh - 8.29 8.10 15.03 13.23 7.33 20.08 20.08 10 Jammu & Kashmir 8235 28.33 28.35 28.35 28.35 28.35 28.35 28.35
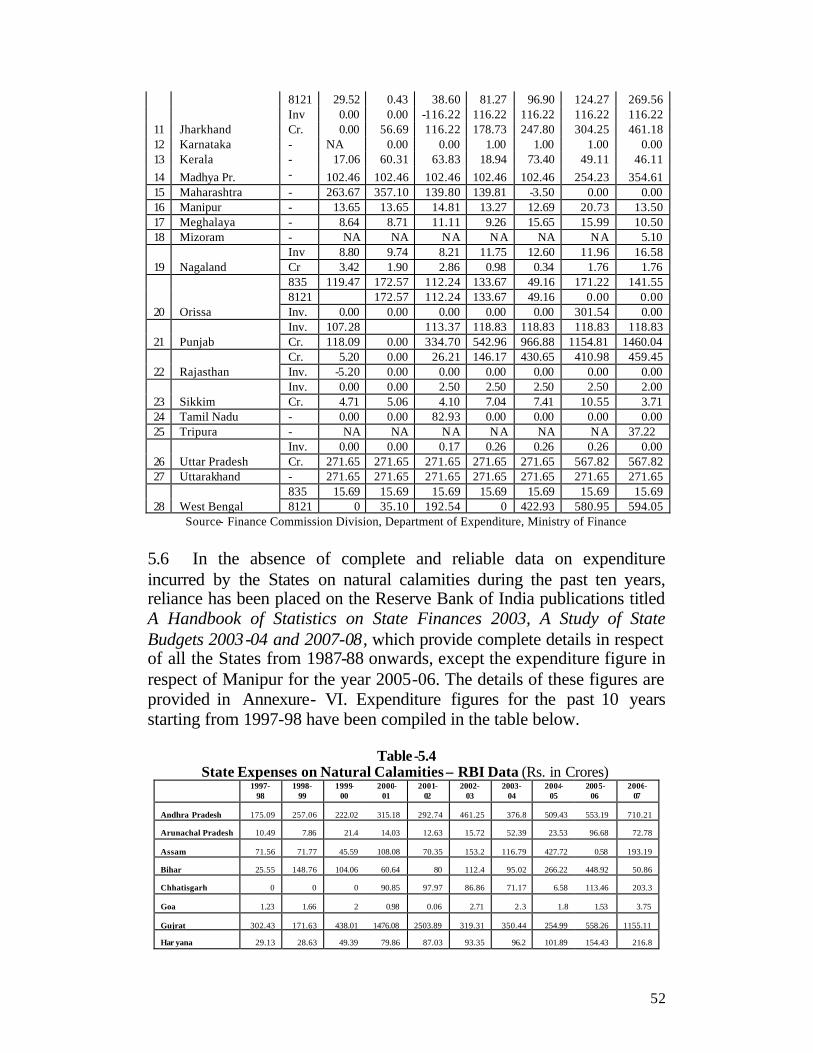
52
8121 29.52 0.43 38.60 81.27 96.90 124.27 269.56
11 Jharkhand Inv 0.00 0.00 -116.22 116.22 116.22 116.22 116.22 Cr. 0.00 56.69 116.22 178.73 247.80 304.25 461.18
12 Karnataka - NA 0.00 0.00 1.00 1.00 1.00 0.00 13 Kerala - 17.06 60.31 63.83 18.94 73.40 49.11 46.11 14 Madhya Pr. - 102.46 102.46 102.46 102.46 102.46 254.23 354.61 15 Maharashtra - 263.67 357.10 139.80 139.81 -3.50 0.00 0.00 16 Manipur - 13.65 13.65 14.81 13.27 12.69 20.73 13.50 17 Meghalaya - 8.64 8.71 11.11 9.26 15.65 15.99 10.50 18 Mizoram - NA NA NA NA NA NA 5.10
19 Nagaland Inv 8.80 9.74 8.21 11.75 12.60 11.96 16.58 Cr 3.42 1.90 2.86 0.98 0.34 1.76 1.76
20 Orissa
835 119.47 172.57 112.24 133.67 49.16 171.22 141.55 8121 172.57 112.24 133.67 49.16 0.00 0.00 Inv. 0.00 0.00 0.00 0.00 0.00 301.54 0.00
21 Punjab Inv. 107.28 113.37 118.83 118.83 118.83 118.83 Cr. 118.09 0.00 334.70 542.96 966.88 1154.81 1460.04
22 Rajasthan Cr. 5.20 0.00 26.21 146.17 430.65 410.98 459.45 Inv. -5.20 0.00 0.00 0.00 0.00 0.00 0.00
23 Sikkim Inv. 0.00 0.00 2.50 2.50 2.50 2.50 2.00 Cr. 4.71 5.06 4.10 7.04 7.41 10.55 3.71
24 Tamil Nadu - 0.00 0.00 82.93 0.00 0.00 0.00 0.00 25 Tripura - NA NA NA NA NA NA 37.22
26 Uttar Pradesh Inv. 0.00 0.00 0.17 0.26 0.26 0.26 0.00 Cr. 271.65 271.65 271.65 271.65 271.65 567.82 567.82
27 Uttarakhand - 271.65 271.65 271.65 271.65 271.65 271.65 271.65
28 West Bengal 835 15.69 15.69 15.69 15.69 15.69 15.69 15.69 8121 0 35.10 192.54 0 422.93 580.95 594.05
Source- Finance Commission Division, Department of Expenditure, Ministry of Finance
5.6 In the absence of complete and reliable data on expenditure incurred by the States on natural calamities during the past ten years, reliance has been placed on the Reserve Bank of India publications titled A Handbook of Statistics on State Finances 2003, A Study of State Budgets 2003-04 and 2007-08, which provide complete details in respect of all the States from 1987-88 onwards, except the expenditure figure in respect of Manipur for the year 2005-06. The details of these figures are provided in Annexure- VI. Expenditure figures for the past 10 years starting from 1997-98 have been compiled in the table below.
Table-5.4
State Expenses on Natural Calamities – RBI Data (Rs. in Crores)
1997- 98
1998- 99
1999- 00
2000- 01
2001- 02
2002- 03
2003- 04
2004- 05
2005- 06
2006- 07
Andhra Pradesh 175.09 257.06 222.02 315.18 292.74 461.25 376.8 509.43 553.19 710.21
Arunachal Pradesh 10.49 7.86 21.4 14.03 12.63 15.72 52.39 23.53 96.68 72.78
Assam 71.56 71.77 45.59 108.08 70.35 153.2 116.79 427.72 0.58 193.19
Bihar 25.55 148.76 104.06 60.64 80 112.4 95.02 266.22 448.92 50.86
Chhatisgarh 0 0 0 90.85 97.97 86.86 71.17 6.58 113.46 203.3
Goa 1.23 1.66 2 0.98 0.06 2.71 2.3 1.8 1.53 3.75
Gujrat 302.43 171.63 438.01 1476.08 2503.89 319.31 350.44 254.99 558.26 1155.11
Har yana 29.13 28.63 49.39 79.86 87.03 93.35 96.2 101.89 154.43 216.8

53
Himac hal Pradesh 49.88 23.53 33.58 61.61 82.38 62.8 50.3 52.86 213.71 128.74
Jammu & Kashmir 21.24 31.7 25.9 35.09 60.09 38.71 40.67 42.63 646.18 373.55
Jharkhand 0 0 0 0 77.89 160.01 85.91 137.82 80 227.72
Karnataka 66.36 104.3 93.37 78.77 113.85 192.21 363.63 240.2 474.88 612.15
Kerala 72.54 62.6 65.21 23.12 114.71 74.13 77.84 287.73 102.08 89.78
Madhya Pradesh 203.74 90.28 63.45 109.15 124.28 373.54 253.41 101.2 421.08 343.54
Maharashtra 339.42 425.68 62.46 122.1 165.38 185.57 497.01 411.27 1524.97 1641.22
Manipur 1.96 2.82 6.68 0.39 0 1.17 4.87 7.07 0 0.83
Meghalaya 3.03 3.09 3.23 3.94 5.12 4.35 4.56 10.95 11.29 11.61
Mizoram 1.33 1.35 7.9 2.97 1.08 4.39 3.38 11.58 3.7 13.66
Nagaland 1.89 1.97 2.14 1.96 2.05 3.56 -0.23 0.85 4.62 5.64
Orissa 89.91 45.58 827.64 143.65 268.39 206.69 345.81 303.65 396.55 457.75
Punjab 42.22 31.15 0.23 78.59 226.17 10.94 135.3 291.23 73.01 149.82
Rajasthan 192.02 201.32 232.56 526.72 320.96 465.32 954.61 470.65 422.87 724.92
Sikkim 17.58 5.33 13.19 4.74 6.84 7.57 10.95 18.4 15.34 9.83
Tamil Nadu 94.04 55.48 30.64 10.77 126.07 377.32 408.54 1006.8 1574.55 -22.06
Tripura 0.94 11.72 11.46 9.32 0.59 11.86 4.59 14.09 13.3 21.94
Uttaranchal 0 0 0 5.07 17.02 65.09 35.05 45.92 56.42 92.65
Uttar Pradesh 107.36 200.61 134.24 65.99 100.88 498.45 102.85 392.26 373.15 128.43
West Bengal 55.13 118.39 112.87 447.87 53.08 164.55 117.04 127.14 234.84 241.72
All States 1976.81 2105.77 2612.21 3878.45 5012.1 4169.18 4658.16 5568.14 8572.46 7859.45
Source: Handbook of Statistics on State Finances 2003; Study of State Budgets 2003-04 and 2007-08
5.7 The figure shows a phenomenal growth of relief expenditure in almost all the States. For the country as a whole the annual relief expenses during 2000-07 registered a growth of 268% over the years 1995-2000. The States of Arunachal Pradesh, Assam, Gujarat, Himachal Pradesh, Jammu & Kashmir, Karnataka, Punjab, Rajasthan and Tamil Nadu had growth in expenditure which was higher than the national average.
Table-5.5
Annual Growth of Relief Expenditure of States
1987-
90 1990-
95 1995- 2000
2000- 05
2000- 07
% growth 2000-07 over
1995-2000
Andhra Pradesh 37.14 81.83 224.614 391.08 459.83 204.72 Arunachal Pradesh 4.88 2.72 12.696 23.66 41.11 323.80 Assam 37.15 51.21 55.624 175.228 152.84 274.77
Bihar 37.53 31.30 69.69 122.856 159.15 228.37
Goa 0.01 1.12 1.564 1.57 1.88 120.20 Gujarat 53.22 30.03 199.752 980.942 945.44 473.31
Haryana 11.87 17.91 104.704 91.666 118.51 113.19
Himachal Pradesh 17.31 18.90 34.748 61.99 93.20 268.22 Jammu & Kashmir 16.75 12.08 23.726 43.438 176.70 744.75 Karnataka 6.40 51.30 70.804 197.732 296.53 418.80
Kerala 12.30 36.54 62.536 115.506 109.91 175.75
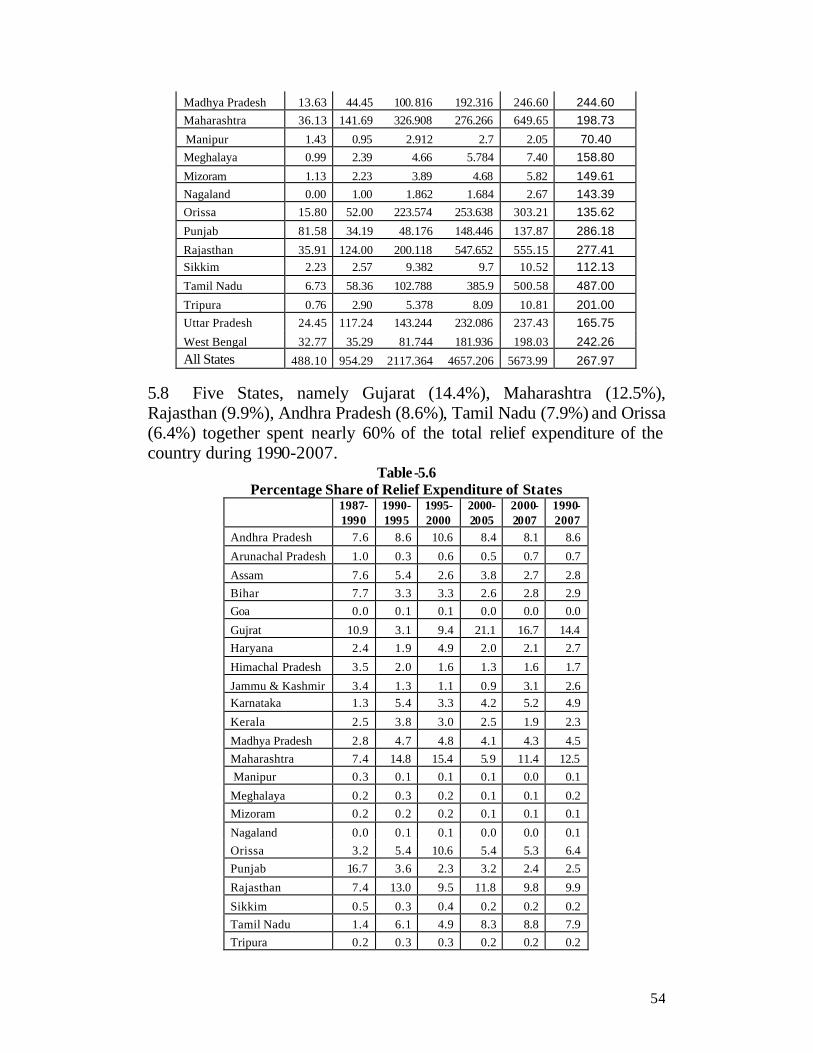
54
Madhya Pradesh 13.63 44.45 100.816 192.316 246.60 244.60 Maharashtra 36.13 141.69 326.908 276.266 649.65 198.73
Manipur 1.43 0.95 2.912 2.7 2.05 70.40 Meghalaya 0.99 2.39 4.66 5.784 7.40 158.80
Mizoram 1.13 2.23 3.89 4.68 5.82 149.61 Nagaland 0.00 1.00 1.862 1.684 2.67 143.39 Orissa 15.80 52.00 223.574 253.638 303.21 135.62
Punjab 81.58 34.19 48.176 148.446 137.87 286.18
Rajasthan 35.91 124.00 200.118 547.652 555.15 277.41 Sikkim 2.23 2.57 9.382 9.7 10.52 112.13
Tamil Nadu 6.73 58.36 102.788 385.9 500.58 487.00
Tripura 0.76 2.90 5.378 8.09 10.81 201.00 Uttar Pradesh 24.45 117.24 143.244 232.086 237.43 165.75
West Bengal 32.77 35.29 81.744 181.936 198.03 242.26 All States 488.10 954.29 2117.364 4657.206 5673.99 267.97
5.8 Five States, namely Gujarat (14.4%), Maharashtra (12.5%), Rajasthan (9.9%), Andhra Pradesh (8.6%), Tamil Nadu (7.9%) and Orissa (6.4%) together spent nearly 60% of the total relief expenditure of the country during 1990-2007.
Table-5.6 Percentage Share of Relief Expenditure of States
1987- 1990
1990- 1995
1995- 2000
2000- 2005
2000- 2007
1990- 2007
Andhra Pradesh 7.6 8.6 10.6 8.4 8.1 8.6
Arunachal Pradesh 1.0 0.3 0.6 0.5 0.7 0.7
Assam 7.6 5.4 2.6 3.8 2.7 2.8 Bihar 7.7 3.3 3.3 2.6 2.8 2.9 Goa 0.0 0.1 0.1 0.0 0.0 0.0
Gujrat 10.9 3.1 9.4 21.1 16.7 14.4 Haryana 2.4 1.9 4.9 2.0 2.1 2.7
Himachal Pradesh 3.5 2.0 1.6 1.3 1.6 1.7
Jammu & Kashmir 3.4 1.3 1.1 0.9 3.1 2.6 Karnataka 1.3 5.4 3.3 4.2 5.2 4.9
Kerala 2.5 3.8 3.0 2.5 1.9 2.3
Madhya Pradesh 2.8 4.7 4.8 4.1 4.3 4.5 Maharashtra 7.4 14.8 15.4 5.9 11.4 12.5 Manipur 0.3 0.1 0.1 0.1 0.0 0.1
Meghalaya 0.2 0.3 0.2 0.1 0.1 0.2 Mizoram 0.2 0.2 0.2 0.1 0.1 0.1
Nagaland 0.0 0.1 0.1 0.0 0.0 0.1 Orissa 3.2 5.4 10.6 5.4 5.3 6.4 Punjab 16.7 3.6 2.3 3.2 2.4 2.5
Rajasthan 7.4 13.0 9.5 11.8 9.8 9.9
Sikkim 0.5 0.3 0.4 0.2 0.2 0.2 Tamil Nadu 1.4 6.1 4.9 8.3 8.8 7.9 Tripura 0.2 0.3 0.3 0.2 0.2 0.2
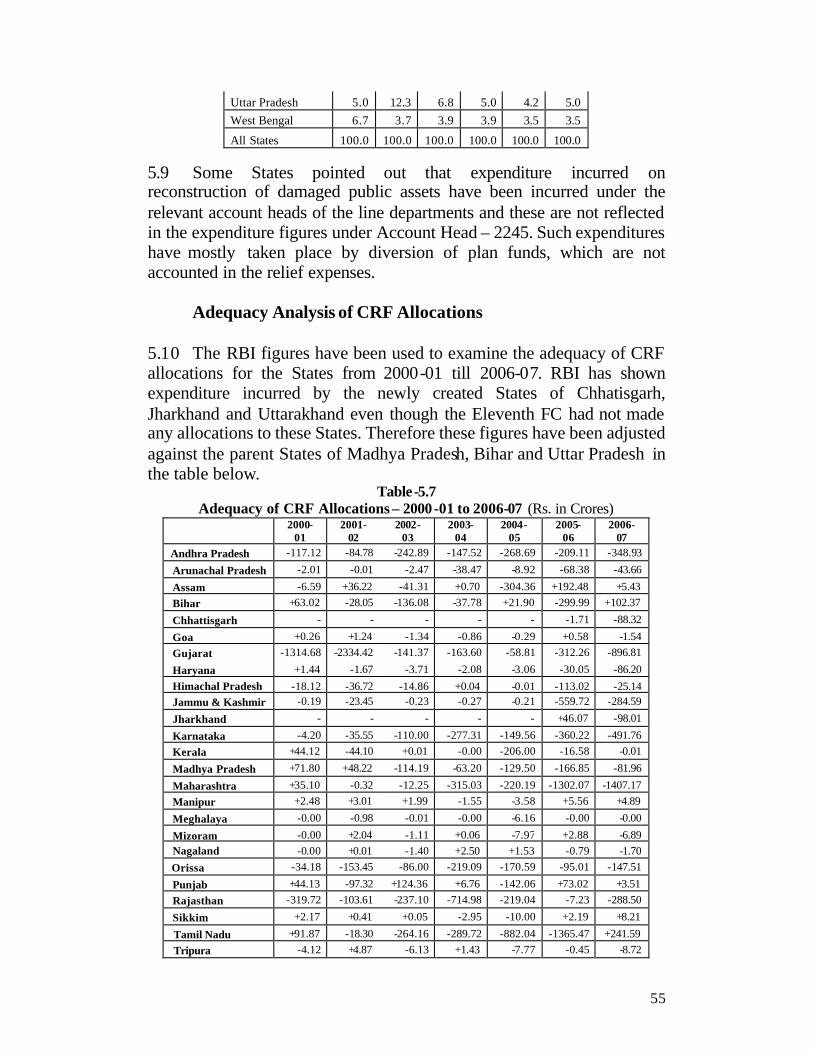
55
Uttar Pradesh 5.0 12.3 6.8 5.0 4.2 5.0 West Bengal 6.7 3.7 3.9 3.9 3.5 3.5
All States 100.0 100.0 100.0 100.0 100.0 100.0
5.9 Some States pointed out that expenditure incurred on reconstruction of damaged public assets have been incurred under the relevant account heads of the line departments and these are not reflected in the expenditure figures under Account Head – 2245. Such expenditures have mostly taken place by diversion of plan funds, which are not accounted in the relief expenses.
Adequacy Analysis of CRF Allocations
5.10 The RBI figures have been used to examine the adequacy of CRF allocations for the States from 2000-01 till 2006-07. RBI has shown expenditure incurred by the newly created States of Chhatisgarh, Jharkhand and Uttarakhand even though the Eleventh FC had not made any allocations to these States. Therefore these figures have been adjusted against the parent States of Madhya Pradesh, Bihar and Uttar Pradesh in the table below.
Table-5.7 Adequacy of CRF Allocations – 2000-01 to 2006-07 (Rs. in Crores)
2000-
01 2001-
02 2002-
03 2003-
04 2004-
05 2005-
06 2006-
07 Andhra Pradesh -117.12 -84.78 -242.89 -147.52 -268.69 -209.11 -348.93
Arunachal Pradesh -2.01 -0.01 -2.47 -38.47 -8.92 -68.38 -43.66
Assam -6.59 +36.22 -41.31 +0.70 -304.36 +192.48 +5.43 Bihar +63.02 -28.05 -136.08 -37.78 +21.90 -299.99 +102.37
Chhattisgarh - - - - - -1.71 -88.32
Goa +0.26 +1.24 -1.34 -0.86 -0.29 +0.58 -1.54 Gujarat -1314.68 -2334.42 -141.37 -163.60 -58.81 -312.26 -896.81
Haryana +1.44 -1.67 -3.71 -2.08 -3.06 -30.05 -86.20 Himachal Pradesh -18.12 -36.72 -14.86 +0.04 -0.01 -113.02 -25.14 Jammu & Kashmir -0.19 -23.45 -0.23 -0.27 -0.21 -559.72 -284.59
Jharkhand - - - - - +46.07 -98.01
Karnataka -4.20 -35.55 -110.00 -277.31 -149.56 -360.22 -491.76 Kerala +44.12 -44.10 +0.01 -0.00 -206.00 -16.58 -0.01
Madhya Pradesh +71.80 +48.22 -114.19 -63.20 -129.50 -166.85 -81.96
Maharashtra +35.10 -0.32 -12.25 -315.03 -220.19 -1302.07 -1407.17 Manipur +2.48 +3.01 +1.99 -1.55 -3.58 +5.56 +4.89
Meghalaya -0.00 -0.98 -0.01 -0.00 -6.16 -0.00 -0.00
Mizoram -0.00 +2.04 -1.11 +0.06 -7.97 +2.88 -6.89 Nagaland -0.00 +0.01 -1.40 +2.50 +1.53 -0.79 -1.70 Orissa -34.18 -153.45 -86.00 -219.09 -170.59 -95.01 -147.51
Punjab +44.13 -97.32 +124.36 +6.76 -142.06 +73.02 +3.51 Rajasthan -319.72 -103.61 -237.10 -714.98 -219.04 -7.23 -288.50
Sikkim +2.17 +0.41 +0.05 -2.95 -10.00 +2.19 +8.21
Tamil Nadu +91.87 -18.30 -264.16 -289.72 -882.04 -1365.47 +241.59 Tripura -4.12 +4.87 -6.13 +1.43 -7.77 -0.45 -8.72

56
Uttar Pradesh +107. 58 +69.67 -236.41 +68.90 -129.20 -77.21 +176. 05 Uttaranchal - - - - - +38.27 +3.94 West Bengal -346.77 +53.08 -53.08 -0.00 -4.25 -0.11 -0.22
All India -1703.73 -2743.95 -1579.68 -2194.02 -2908.82 -4628.05 -3761.66 (+) signifies savings from CRF allocations. (–) presents excess expenditure over CRF allocation
5.11 This statement shows that barring the four relatively small States of Manipur, Nagaland, Sikkim and Uttaranchal the CRF allocations during 2000-01 to 2006-07 were inadequate in all the States. The excess expenditure incurred over CRF allocations during the period were very high in some of the States - Andhra Pradesh (78.8%), Gujarat (374%), Jammu & Kashmir (235.8%), Karnataka (220.7%), Maharastra (243%), Tamil Nadu (249.6%) and Orissa (74.4%), Rajasthan (94.7%). This was mainly due the earthquakes of Gujarat (2001) and Jammu & Kashmir (2005), droughts in Rajasthan, Gujarat and Karnataka (2002), tsunami in Tamil Nadu (2004) and floods in Maharastra (2005,2006). For the country as a whole the total expenditure incurred by the States on relief during the period was Rs. 38,589.60 crores against the total CRF allocations of Rs. 19049.70 crores, thereby leaving a gap of Rs. 19519.90 crores. This gap was largely covered by NCCF allocations of Rs. 13086.93 crores during the period, as under:
Table-5.8
NCCF Allocations 2000 -01 to 2006-07 (Rs. in Crores)
2000-
01 2001-
02 2002-
03 2003-
04 2004-
05 2005-
06 2006-
07 Total Andhra Pradesh 0.00 30.44 59.94 116.75 87.20 100.00 203.06 597. 39 Arunachal Pradesh 2.00 0.00 12.78 29.79 9.09 68.44 44.38 166.48
Assam 0.00 0.00 0.00 0.00 211.55 0.00 0.00 211 .55 Bihar 29.67 0.00 0.00 0.00 398.92 0.00 0.00 428.59
Chhattisgarh 40.00 42.88 100.68 26.83 52.74 0.00 0.00 263. 13
Goa 0.00 0.00 0.00 0.00 0.00 0.00 0.00 0.00 Gujarat 585.00 994.37 23.29 32.41 55.00 304.31 545.69 2540.07
Haryana 0.00 0.00 0.00 2.20 0.00 0.00 0.00 2.20
Himachal Pradesh 8.29 61.48 14.05 0.30 0.00 112.97 25.14 222. 23 Jammu & Kashmir 0.00 23.20 0.00 0.00 50.00 309.77 0.00 382. 97 Jharkhand 0.00 0.00 0.00 0.00 0.00 0.00 0.00 0.00 Karnataka 0.00 0.00 196.88 316.47 63.62 358.85 384.97 1320.79 Kerala 0.00 0.00 0.00 0.00 206.00 17.94 0.00 223. 94
Madhya Pradesh 35.00 22.72 183.34 36.72 1.70 0.00 30.85 310. 33
Maharashtra 0.00 0.00 20.00 77.46 173.23 657.25 589.90 1517.84 Manipur 0.00 0.00 7.07 0.00 0.00 0.00 0.00 7.07
Meghalaya 1.00 0.00 0.00 0.00 6.16 0.00 0.00 7.16
Mizoram 0.00 0.00 0.00 0.00 10.68 0.00 0.00 10.68 Nagaland 0.00 0.00 0.00 0.00 1.81 0.00 0.81 2.62
Orissa 35.00 114.62 21.84 104.43 53.44 0.00 25.00 354. 33 Punjab 0.00 0.00 0.00 0.00 0.00 0.00 0.00 0.00 Rajasthan 85.00 78.97 434.08 512.74 216.79 0.00 100.00 1427.58
Sikkim 0.00 0.00 0.00 0.00 9.90 0.00 5.20 15.10
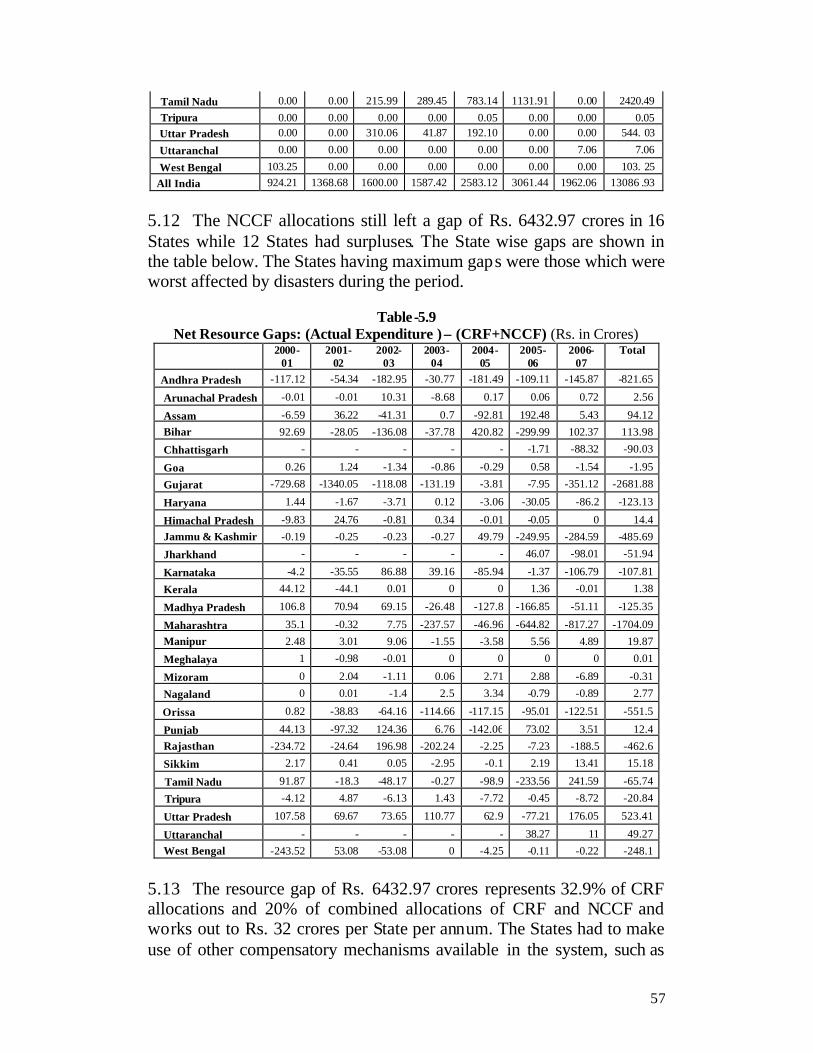
57
Tamil Nadu 0.00 0.00 215.99 289.45 783.14 1131.91 0.00 2420.49 Tripura 0.00 0.00 0.00 0.00 0.05 0.00 0.00 0.05 Uttar Pradesh 0.00 0.00 310.06 41.87 192.10 0.00 0.00 544. 03
Uttaranchal 0.00 0.00 0.00 0.00 0.00 0.00 7.06 7.06
West Bengal 103.25 0.00 0.00 0.00 0.00 0.00 0.00 103. 25 All India 924.21 1368.68 1600.00 1587.42 2583.12 3061.44 1962.06 13086 .93
5.12 The NCCF allocations still left a gap of Rs. 6432.97 crores in 16 States while 12 States had surpluses. The State wise gaps are shown in the table below. The States having maximum gaps were those which were worst affected by disasters during the period.
Table-5.9
Net Resource Gaps: (Actual Expenditure ) – (CRF+NCCF) (Rs. in Crores) 2000-
01 2001-
02 2002-
03 2003-
04 2004-
05 2005-
06 2006-
07 Total
Andhra Pradesh -117.12 -54.34 -182.95 -30.77 -181.49 -109.11 -145.87 -821.65
Arunachal Pradesh -0.01 -0.01 10.31 -8.68 0.17 0.06 0.72 2.56
Assam -6.59 36.22 -41.31 0.7 -92.81 192.48 5.43 94.12 Bihar 92.69 -28.05 -136.08 -37.78 420.82 -299.99 102.37 113.98
Chhattisgarh - - - - - -1.71 -88.32 -90.03
Goa 0.26 1.24 -1.34 -0.86 -0.29 0.58 -1.54 -1.95
Gujarat -729.68 -1340.05 -118.08 -131.19 -3.81 -7.95 -351.12 -2681.88
Haryana 1.44 -1.67 -3.71 0.12 -3.06 -30.05 -86.2 -123.13
Himachal Pradesh -9.83 24.76 -0.81 0.34 -0.01 -0.05 0 14.4 Jammu & Kashmir -0.19 -0.25 -0.23 -0.27 49.79 -249.95 -284.59 -485.69
Jharkhand - - - - - 46.07 -98.01 -51.94
Karnataka -4.2 -35.55 86.88 39.16 -85.94 -1.37 -106.79 -107.81
Kerala 44.12 -44.1 0.01 0 0 1.36 -0.01 1.38
Madhya Pradesh 106.8 70.94 69.15 -26.48 -127.8 -166.85 -51.11 -125.35
Maharashtra 35.1 -0.32 7.75 -237.57 -46.96 -644.82 -817.27 -1704.09 Manipur 2.48 3.01 9.06 -1.55 -3.58 5.56 4.89 19.87
Meghalaya 1 -0.98 -0.01 0 0 0 0 0.01
Mizoram 0 2.04 -1.11 0.06 2.71 2.88 -6.89 -0.31
Nagaland 0 0.01 -1.4 2.5 3.34 -0.79 -0.89 2.77
Orissa 0.82 -38.83 -64.16 -114.66 -117.15 -95.01 -122.51 -551.5
Punjab 44.13 -97.32 124.36 6.76 -142.06 73.02 3.51 12.4 Rajasthan -234.72 -24.64 196.98 -202.24 -2.25 -7.23 -188.5 -462.6
Sikkim 2.17 0.41 0.05 -2.95 -0.1 2.19 13.41 15.18
Tamil Nadu 91.87 -18.3 -48.17 -0.27 -98.9 -233.56 241.59 -65.74
Tripura -4.12 4.87 -6.13 1.43 -7.72 -0.45 -8.72 -20.84
Uttar Pradesh 107.58 69.67 73.65 110.77 62.9 -77.21 176.05 523.41
Uttaranchal - - - - - 38.27 11 49.27 West Bengal -243.52 53.08 -53.08 0 -4.25 -0.11 -0.22 -248.1
5.13 The resource gap of Rs. 6432.97 crores represents 32.9% of CRF allocations and 20% of combined allocations of CRF and NCCF and works out to Rs. 32 crores per State per annum. The States had to make use of other compensatory mechanisms available in the system, such as

58
advance drawal of 25% of next year’s CRF allocations, additional central assistance, external assistance etc to take care of such deficiencies. The most striking gaps were in the States of Gujarat (Rs. 2681 crores), Maharashtra (Rs. 1704 crores), Andhra Pradesh (Rs. 821.6 crores) and Rajasthan (Rs. 462.2 crores).
Demands and Allocations under NCCF
5.14 In this context it may be worthwhile to look into the pattern of allocations under NCCF. Between 2000-01 and 2008-09 (till November 2008) the total demands projected by the States in their Memorandums to the Government of India for assistance under NCCF was of the order of Rs. 209,993 crores against which the amount approved by the High Level Committee was Rs. 21,228.7 crores, but the actual releases after taking into account the norms and other factors was only Rs. 13998.4 crores. This represents just 6.6 % of the demand. The details of State wise year wise demands for NCCF allocations, approved allocations and actual releases are provided in Annexure - IX. These figures raise important issues regarding the management of the National Calamity Contingency Fund both from the point of view of demands and expectations of the States and supplies and dispensations from the Centre. 5.15 Often the States have been demanding assistance from the Centre with inflated claims of damage and exaggerated costs of relief and restoration, which are difficult to be justified. The State viewpoint is that the disasters result in widespread damage to houses, infrastructure, livelihood and environment which are difficult to be restored within the meagre allocations under CRF and they hard ly have resources from their plan or non-plan budget for such purpose and therefore they need liberal central assistance to reconstruct the damaged assets and infrastructure . The counterargument of the Centre is that assistance under CRF/NCCF is available only to provide immediate relief and restoration and not for long term reconstruction, which has to be arranged from the plan funds. But such funds are not always forthcoming. Richer States can arrange resources by adjustments from other sources, but poorer States have either to divert money from other overheads which creates a setback to development or to leave the damages unattended, which make them susceptible to more damages. Therefore the tension between State expectations and Central dispensations continue, which has not been resolved so far. One of the challenges of the Thirteenth Finance Commission would be to resolve this tension especially in the context of the Disaster Management Act which lays emphasis on mainstreaming disaster risk reduction in post disaster rehabilitation and reconstruction.

59
Additional Central Assistance
5.16 The mechanism of Additional Central Assistance (ACA) has been employed in the recent years, over and above the arrangements of the Finance Commission, for partly meeting the felt needs of the States for post-disaster reconstruction. In this dispensation the Central government provides plan fund to the affected States as a mix of loan and grant on the ratio of 70:30 for general States and 90:10 for Special Category States. Often such funds are raised as soft loan from multi-lateral funding institutions and passed on to the States as Additional Central Assistance. After the Gujarat earthquake of 2001 World Bank loan of Rs. 7936 crores was raised for funding multi-sectoral reconstruction projects over a five-year long period. Similarly, after the India Ocean Tsunami loans were raised from World Bank and Asian Development Bank and Additional Central Assistance worth Rs. 11,907.29 crores were passed on the affected States of Tamil Nadu, Kerala and Andhra Pradesh besides the Union Territories of Andaman & Nicobar Islands and Pondicherry for long terms rehabilitation and reconstruction. After the Kashmir earthquake of 2005 Additional Central Assistance of Rs. 635.88 crores was released to the J&K government for a three year reconstruction programme. Similarly after the monsoon floods of 2005 that affected 12 States Additional Central Assistance of Rs. 5323.26 crores was released to the States. All these expenditure are not booked under Account Head 2245 and therefore these are not reflected in the relief expenditure of the States as shown in data compiled from the RBI and other sources.
Composition of Relief Expenditure
5.17 It may be interestin g to look into what constituted such a massive expense Rs. 38569.60 crores on relief by the States during the period. The Tenth FC had recommended that a Committee of Experts shall be set up to draw a list of items, the expenditure on which alone will be chargeable to the CRF. The Committee was further asked to fix the norms on each approved items of expenditure. The norms initially developed in 1995 has been revised from time to time, the latest being the revised norms of June 2007 which permits expenditure on 26 items under 7 categories, as under.
Table 5.10
Items of Permissible Expenditure under CRF and NCCF 1. Response 1. Evacuation
2. Search and rescue 3. Clearance of debris 4. Disposal of dead bodies/ carcases

60
5. Draining of flood water 6. Hiring boats 7. Ambulance, temporary dispensaries 8. Air dropping of essential supplies
2. Immediate relief 1. Temporary accommodation, food, clothing 2. Emergency supply of drinking water 3. Medicines, disinfectants, insecticides etc 4. Care of cattle/ poultry against epidemics
3. Gratuitous relie f 1. Ex-gratia payment for deaths and injuries 2. Supplementary nutrition
4. Rural population 1. Assistance to small and marginal farmers 2. Input subsidy to other farmers 3. Assistance to sericulture farmers 4. Assistance to animal husbandry sector 5. Assistance to Fishermen 6. Assistance to artisans 7. Employment generation
5. Housing 1. Repair and restoration of damaged houses 6. Infrastructure 1. Repair/ restoration of immediate nature of
damaged infrastructure in following sectors: (a) Roads & bridges (b) Drinking water (c) Irrigation (d) Power (e) Primary education (f) PHC and (g) Community assets
2. Replacing damaged medical equipments 7. Preparedness 1. Specialized training for disaster management
2. Procuring search & rescue and communication equipments
5.18 It could be interesting to look into the item wise details of expenditure by the States, but unfortunately these are not available either with the Central or with the State governments. The standard reply of the Relief Commissioners is that the expenditures are mostly incurred by the district administration and by the line departments who submit utilization certificates but do not furnish item wise details of expenditure. This deprives a close look at the pattern of expenditure that could be useful to the Commission in making recommendations for the future. 5.19 Two major States, namely Gujarat and Tamil Nadu, were selected for an analysis of the pattern and composition of relief expenditure. The data provided under ‘Major Head 2245- Relief on Account of Natural Calamity’ in the State Budgets were compiled in the following tables which indicate that a little more than 30 percent of the total relief expenditure is incurred under Minor Head 80 (General including operations of immediate relief measures). While Gujarat spent 30.5 percent, Tamil Nadu allocated 32.3 percent towards this head of expenditure. Spending on employment generation in both the States,

61
particularly in Tamil Nadu, has registered a perceptible decline, mainly due to the implementation of National Employment Guarantee Schemes (NREGS). The expenditure booked under the minor heads of repairs and restoration of damaged public buildings and roads and bridges has noticed a gradual and significant rise over the years in the State of Tamil Nadu which accounted for roughly 23 percent of total relief expenditure, though the average spending for the last ten years on this head has been around 6 percent. The share of gratuitous relief in total relief expenditure in Gujarat was 9.9 and that Tamil Nadu 17.2 percent. The share of Supply of Drinking water and Fodder for Gujarat and Tamil Nadu are 11.9 and 15.4 percent respectively.
Table-5.11 Gujarat- Percentage Share of Relief Expenditure: Minor Headwise
Ex-gratia
relief
Water and
Fodder Public Health
General Expenditure
Employment Generation
1999-00 4.8 29.6 0.0 1.9 63.6
2000-01 23.5 11.8 1.1 31.0 32.5
2001-02 3.7 11.2 0.1 46.5 38.4
2002-03 4.9 40.6 0.0 3.2 51.3
2003-04 2.2 30.7 2.4 18.0 46.6
2004-05 12.4 5.4 7.2 2.4 72.6
2005-06 7.4 4.1 4.1 45.0 39.4 2006-07 5.1 4.5 14.3 39.4 36.8
2007-08 (RE) 8.7 9.7 23.3 2.9 55.3
2008-09 (BE) 13.2 11.4 18.4 2.3 54.8
1999-2008 9.9 11.9 6.2 30.5 41.6
Table-5.12
Tamil Nadu- Percentage Share of Relief Expenditure: Minor Headwise
Ex-gratia relief
Supply of
drinking water
Repairs/ restoration of houses,
roads/bridges
Assistance to farmers, fisherman,
artisans
General Expenditure on Relief & Rehabiltatio
Employment generation and other
expenditure 1999-00 8.4 4.1 17.3 0.0 7.0 63.3 2000-01 14.7 28.0 4.3 4.0 0.0 48.9 2001-02 0.8 60.6 1.5 33.4 0.0 3.7 2002-03 12.1 57.1 2.0 0.0 0.0 28.9 2003-04 15.6 20.6 0.0 0.0 0.0 63.7 2004-05 13.7 22.6 0.2 0.0 63.6 -0.2 2005-06 29.5 1.1 20.4 22.7 25.2 1.0 2006-07 0.6 0.0 8.0 38.6 40.9 11.9 2007-08 (RE) 3.2 15.0 39.5 14.3 27.4 0.5 2008-09 (BE) 2.0 2.7 5.2 0.2 89.3 0.6 1999-2008 17.2 15.4 12.3 12.0 32.3 10.8
5.20 The data provided by the States in their Memorandum were compiled to look into the disaster wise expenditure at the all India level. Although the data provided was seemingly incomplete and not very

62
reliable, a clear trend is clearly discernible in the overall pattern of expenditure during the past 7 years.
Table-5.13
Distribution of Relief Expenditure by States across Calamities (Rs. in Crores) Drought Floods Fire Cyclones Hailstorms Others Total
2002-03 2264.88 389.08 10.00 363.53 26.14 335.94 3389.57
2003-04 2273.73 592.69 40.91 17.60 31.36 114.16 3070.45 2004-05 1671.01 949.02 40.95 8.02 61.30 254.68 2984.98 2005-06 1004.09 3005.02 48.92 106.35 76.90 48.20 4289.48 2006-07 1055.34 4724.30 65.64 13.59 237.56 34.97 6131.40 2007-08 (R.E.) 925.38 2950.80 83.47 84.63 276.23 644.80 4965.31 2002-08 9194.43 12610.91 289.89 593.72 709.49 1432.75 24831.19
5.21 The percentage share works out as under. Flood and drought together consume more than 88% of the total relief expenses of the States.
Table-5.14
Distribution of Relief Expenditure by States across Calamities (%) Drought Floods Fire Cyclones Hailstorms Others
2002-03 67 11 0 11 1 10 2003-04 74 19 1 1 1 4 2004-05 56 32 1 0 2 9 2005-06 23 70 1 2 2 1 2006-07 17 77 1 0 4 1 2007-08 (R.E.) 19 59 2 2 6 13 2002-08 37 51 1 2 3 6
Revised Norms of Relief Expenditure
5.22 The revised norms of expenditure under CRF and NCCF notified by the Ministry of Home Affairs in June 2007 has enhanced the scale of relief and rehabilitation for many items, as shown in the following table . A detailed comparative analysis of the revised norms of 2007 and the previous norms of 2004 is provided in Annexure-III.
Table 5.15
Revised Norms, Scale of Relief and Percentage Increase over Previous Norms Items Scale of relief %
increase Response 1. Evacuation 2. Search and rescue 3. Clearance of debris 4. Disposal of dead bodies/ carcases 5. Draining of flood water 6. Hiring boats 7. Ambulance, temporary dispensaries 8. Air dropping of essential supplies
As assessed by SLC Do Do Do Do Do Do Do
No change No change No change No change
New No change No change No change
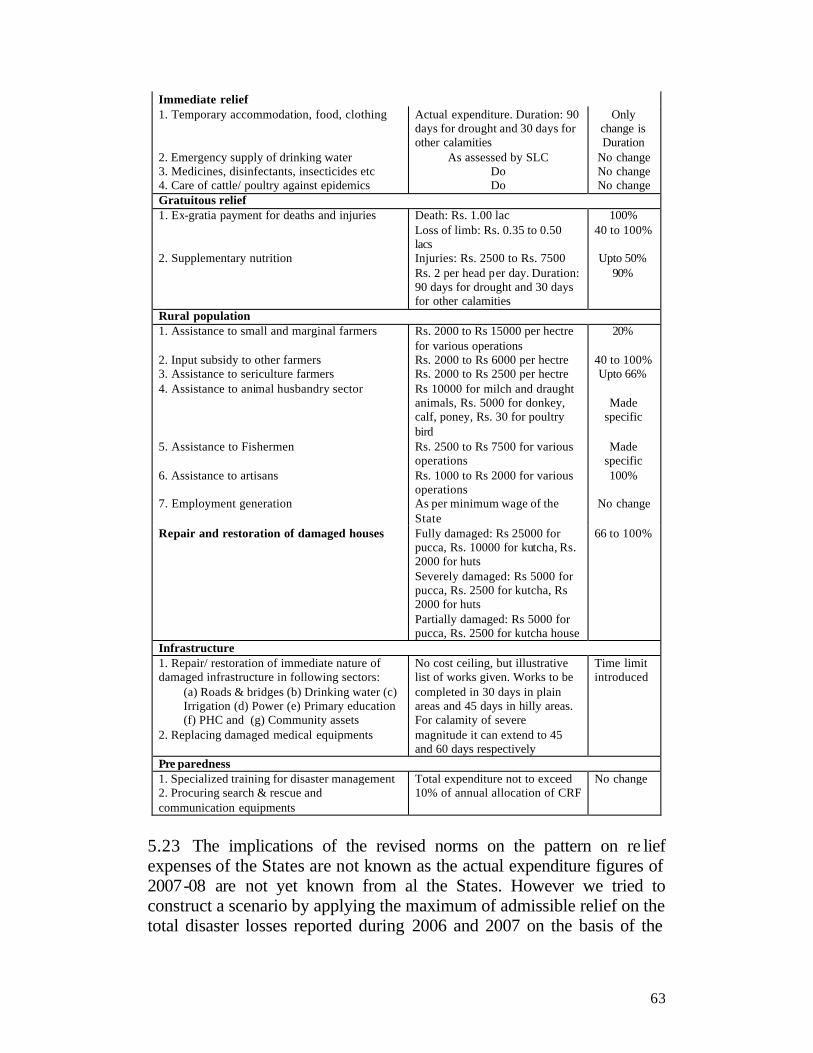
63
Immediate relief 1. Temporary accommodation, food, clothing 2. Emergency supply of drinking water 3. Medicines, disinfectants, insecticides etc 4. Care of cattle/ poultry against epidemics
Actual expenditure. Duration: 90 days for drought and 30 days for other calamities
As assessed by SLC Do Do
Only change is Duration
No change No change No change
Gratuitous relief 1. Ex-gratia payment for deaths and injuries 2. Supplementary nutrition
Death: Rs. 1.00 lac Loss of limb: Rs. 0.35 to 0.50 lacs Injuries: Rs. 2500 to Rs. 7500 Rs. 2 per head per day. Duration: 90 days for drought and 30 days for other calamities
100% 40 to 100%
Upto 50%
90%
Rural population 1. Assistance to small and marginal farmers 2. Input subsidy to other farmers 3. Assistance to sericulture farmers 4. Assistance to animal husbandry sector 5. Assistance to Fishermen 6. Assistance to artisans 7. Employment generation
Rs. 2000 to Rs 15000 per hectre for various operations Rs. 2000 to Rs 6000 per hectre Rs. 2000 to Rs 2500 per hectre Rs 10000 for milch and draught animals, Rs. 5000 for donkey, calf, poney, Rs. 30 for poultry bird Rs. 2500 to Rs 7500 for various operations Rs. 1000 to Rs 2000 for various operations As per minimum wage of the State
20%
40 to 100% Upto 66%
Made
specific
Made specific 100%
No change
Repair and restoration of damaged houses Fully damaged: Rs 25000 for pucca, Rs. 10000 for kutcha, Rs. 2000 for huts Severely damaged: Rs 5000 for pucca, Rs. 2500 for kutcha, Rs 2000 for huts Partially damaged: Rs 5000 for pucca, Rs. 2500 for kutcha house
66 to 100%
Infrastructure 1. Repair/ restoration of immediate nature of damaged infrastructure in following sectors:
(a) Roads & bridges (b) Drinking water (c) Irrigation (d) Power (e) Primary education (f) PHC and (g) Community assets
2. Replacing damaged medical equipments
No cost ceiling, but illustrative list of works given. Works to be completed in 30 days in plain areas and 45 days in hilly areas. For calamity of severe magnitude it can extend to 45 and 60 days respectively
Time limit introduced
Pre paredness 1. Specialized training for disaster management 2. Procuring search & rescue and communication equipments
Total expenditure not to exceed 10% of annual allocation of CRF
No change
5.23 The implications of the revised norms on the pattern on re lief expenses of the States are not known as the actual expenditure figures of 2007-08 are not yet known from al the States. However we tried to construct a scenario by applying the maximum of admissible relief on the total disaster losses reported during 2006 and 2007 on the basis of the
64
prevailing norms. The increase works out to 40% in respect of the items where the scale has been laid own specifically in the norms. 5.24 The Disaster Management Act has mandated the National Disaster Management Authority to recommend guidelines for the minimum standards of relief to be provided to persons affected by disasters, which shall include minimum requirements to be provided in the relief camps in relation to shelter, food, drinking water, medical cover and sanitation, special provisions for widows and orphans, ex-gratia assistance on account of loss of life as also assistance on account of damage to houses and for restoration of means of livelihood and such other relief as may be necessary. Similarly the State Disaster Management Authorities have been mandated to lay down guidelines for providing minimum standards of relief to persons affected by disasters in the State. Such standards shall in no case be less than the standards laid down by the NDMA. The NDMA is likely to announce the minimum standard of relief in near future, which is expected to be higher than what has been notified in the MHA notification of June 2007. This would definitely result in further increase in relief expenses during the remaining period of Twelfth Finance Commission award.
Management of Calamity Relief Fund
5.25 The basic rules to be followed for the management of the Calamity Relief Fund has been laid down in the Scheme for the Constitution and Administration of the Calamity Relief Fund notified by the Department of Expenditure, Ministry of Finance, Government of India. A copy of this Scheme is Annexed- II. As per this scheme a State -level Committee under the Chairpersonship of the Chief Secretary of the State and comprising of offic ials normally connected with relief work and experts in various fields shall be set up for the administration of the CRF in the State.
5.26 The CRF shall be constituted in Public Account under the head ‘8235-General and Other Reserve Funds-111 Calamity Relief Fund’, while expenditure shall be incurred under the head ‘2245-Relief on Account of Natural Calamities-05 Calamity Relief Fund’. The share of the Government of India to the Fund shall be paid as Grants-in-aid in two instalments on June 1 and December 1 in each financial year. Likewise, share of the State Governments shall also be transferred to the CRF in two instalments in June and December of the same year. If the Ministry of Finance is satisfied that exigencies of a particular calamity so warrant, the State shall be able to draw 25% of the funds due to the State in the

65
following year from the Centre to be adjusted against the dues of the subsequent year.
5.27 The contributions thus received shall be invested in one or more of the following instruments:
a) Central Government Securities b) Auctioned Treasury Bills c) Interest earning deposits and certificates of deposits with
Scheduled Commercial Banks; d) Interest earning deposits in Co-operative Banks;
5.28 The investment shall be carried out by the RBI branch at the State headquarters or a Bank designated by RBI. The Bank will arrange to collect interest on these securities/bonds and credit the same to the account of the Government on the due date. On maturity of the securities, the proceeds will be collected and credited to the account of the Government or reinvested on the basis of instructions received from the Committee. To meet liability on account of the claims sanctioned for relief, the Committee will first dispose of its holdings of auctioned Treasury Bills to the extent required. If the amount is not sufficient to meet the liability, the Committee may encash the deposits with the local branches of the scheduled commercial banks and the co-operative banks. The Central Government securities may be sold as a last resort.
5.29 The Committee shall be responsible to ensure that the money drawn from the Calamity Relief Fund is actually utilised for the purposes for which the CRF has been set up and only on items of expenditure and as per norms contained in the guidelines issued by the Ministry of Home Affairs. All administrative and miscellaneous expenses of the Committee shall be borne by the State Government under its normal budgetary provisions and not from the CRF.
5.30 These basic rules of the CRF scheme do not seem to be followed in most of the States. The RBI data shows that only 9 out of 28 States have actually constituted the fund under the Public Account - 8235 even though the CRF has been in existence since 1990. The MHA data for the past eight years shows that none of the State government has earned any interest on CRF amount, which lends credit to the impression that the CRF is never invested in securities as prescribed in the scheme. We had specifically asked the State governments to share the details of such investments, but none of the States responded, while Relief Commissioners of many States informally informed that CRF amount is deposited in the accounts of the Finance Secretary and is used like many
66
other central grants as way and means advances of the State government. This has been confirmed in the audit reports of a number of State governments which further shows that State government contributions to the CRF are not released in time. Budgetary allocations under 2245 are released only in bits and parts to the District Collectors and bulk transfers are made on an ad hoc basis only after major disasters hit the districts and there is always some time lag before such transfers actually take place. Therefore the very purpose of depositing CRF in non-lapsable and interest bearing Public Account seems to have been totally defeated. The Finance Commission may therefore like to review the position and lay down stringent guidelines for compliance of the provisions of the scheme.
Audit Reports on Relief Expenditure
5.31 More than 80% of the relief expenditure takes place in the districts either by the District Collector or by the line departments under his supervision in a highly charged environment calling for immediate humanitarian assistance to the affected communities and pressures from all quarters to perform, when the administration is also overwhelmed by multifarious issues related to the management of disasters apart from other day to day administrative duties. This sudden spurt of expenditure within a compressed time zone of one to six months by relatively junior and inexperienced officers without training and exposure to financial management and adequate monitoring by supervisory officers poses challenge to leadership but at the same time it provides opportunities and temptations for various types of irregularities and corruptions. Disasters have made many administrators famous due to their leadership and achievements in difficult circumstances, but at the same time it has made many of them infamous by scams and malpractices. The story of the District Collector who was jailed for malpractices during flood relief operations in Patna made headlines in newspapers, but if the audit reports of the Comptroller and Auditor General of India and Accountant Generals of the States are to be believed there were hundreds of such scams and other irregularities which have not surfaced in the public domain but are equally, if not more, serious. In fact perusal of such reports definitely gives the impression of an extremely messy financial management that calls for reforms and interventions at the highest levels. Surely strict enforcement of financial discipline and expenditure norms would reduce the chances of irregularities and may even lead to substantial savings and more efficient utilization of available funds. 5.32 The Comptroller and Auditor General of India had conducted Performance Audit of Tsnuami Relief and Rehabilitation in the five
67
tsunami affected States and Union Territories of Andhra Pradesh, Kerala, Tamil Nadu, Andaman and Nicobar Islands and Pondicherry during 2005-06. Important findings of the audit were as follows:
a) Large sums of money were diverted in almost all the States for purposes such as administrative expenses, committed liabilities etc which were clearly not permitted under the norms;
b) Irregular and wrong payments were made in violation of norms; c) Excess expenditure was incurred due to wrong application of rates,
payment of enhanced compensation, non-adherence to codal provisions etc;
d) Expenditure was shown against advances made to Departments which remained unutilized for long periods in contravention of rules;
e) The process of beneficiary identification and verification of claims was faulty – there were large number of cases of improper verification, non-achievement of targets, provision of relief to unaffected and ineligible persons etc;
f) There were long delays in the construction and repair of basic infrastructure such as roads and highways, schools, bridges, water supply etc;
g) There were delays in construction of permanent houses due to delay in acquisition of land, delay in approval of plans, release of funds, which led to avoidable cost escalation etc;
h) There was inadequate and improper assessment of damage to fishing vessels, delay in restoration of harbour and jetty works, failure in claiming insurance benefits for deceased fishermen, excess compensation for boats etc.
5.33 The Audit Reports of Accountant Generals of the States of Andhra Pradesh, Bihar, Gujarat, Karnataka, Orissa, Punjab and Uttar Pradesh on CRF and NCCF for the past few years show gross irregularities of very serious nature. Some of these irregularities which are only illustrative and by no means exhaustive in nature are cited as under.
a) Huge sums of money have been spent irregularly on items not at all covered under the scheme. These include purchase of vehicles, furniture, computers, renovation of Deputy Commissioner’s residence, grants to charitable institutions etc.
b) Expenditure has been incurred much in excess of norms prescribed under the scheme.
c) Salaries of employees and other administrative expenses have been incurred from the Fund, completely against the norms.
68
d) Revolving Fund has been created in favour of public sector undertakings in contravention of the norms of the scheme.
e) Large sums of advances were made to various agencies but these were never recovered from them.
f) Sale proceeds from subsidized goods were irregularly credited to the accounts of the public sector undertakings and government departments.
g) Large sums of unutilized balances from the CRF have been retained in the Personal Deposit Account/ Current Account of the District Collector/ other District Officers.
h) Relief works undertaken in previous years have been adjusted against allocations of subsequent years.
5.34 Copies of these Audit Reports were circulated to States of Andhra Pradesh, Bihar, Gujarat, Karnataka, Orissa, Punjab and Uttar Pradesh for their comments, but none of the States responded. However informal discussion with the Relief Commissioners of some of the States confirms the general impression that the existing system of drawal and expenditure of funds in the districts and monitoring of expenditure in the States have many loopholes, which provide huge scope for irregularities and misappropriation. 5.35 Surely there are huge scopes for improvement at every level and in each sector. The Comptroller and Auditor General of India has recommended that a computerised tracking system for monitoring the utilization of financial assistance should be introduced in consultation with the State governments. Pre-contract system for emergency procurement has also been recommended for compliance of procedures without sacrificing the needs of urgency. Standard protocols and guidelines on damage and loss assessment and identification of beneficiaries in disaster situations needs also to be developed to eliminate chances of under assessment or exaggerated assessment or wrong identification of beneficiaries. It is suggested that an Expert Committee may be constituted to look into the entire gamut of administrative, financial, logistic and other issues of relief management and recommend a full proof financial management system that would ensure that relief assistances are provided to the affected people and communities in time and in an efficient manner with a zero tolerance to irregular and corrupt practices.

69
VIEWS OF STATE GOVERNMENTS
The State Governments have submitted their Memorandums to the Thirteenth Finance Commission, stating inter alia the major calamities faced by the States, areas affected, total assistance provided, kind of assistance, source of funding (Central, State and other assistance) etc. The Memorandums further gave details on the systems of assessing the damage (life and property) being followed in the States. 6.2 The specific difficulties faced by the States with respect to accessing funds from CRF/NCCF were highlighted in the Memorandum and suggestions for overcoming these difficulties were also outlined for the consideration of the Commission. These suggestions are summarised as follows: Andhra Pradesh 6.3 Andhra Pradesh incurred more expenditure than the combined allocations under CRF and NCCF as shown in the following table. The excess expenditure is almost more than the State’s contribution to CRF
Table -6.1
Expenditure on Relief-Andhra Pradesh (Rs in crores)
Sl. No.
Year CRF Advance Drawl
NCCF Total
Total expenditure Balance
1 2003-2004 229.28 116.75 346.03 370.97 -24.94
2 2004-2005 240.75 117.88 358.63 541.37 -182.74
3 2005-2006 344.08 100.00 444.08 551.64 -85.28
4 2006-2007 361.28 64.52 203.06 628.86 667.60 -41.80
5 2007-2008 379.35 -64.52 37.51* 352.34 370.88 -18.54
6 2008-2009 398.31 222.26 -23.10
7 2009-2010 418.23
* Additional assistance (NCCF) requested by the State for Sept, Oct/Nov 2007, Feb 2008 & March / April 2008 are yet to be received. 6.4 The State government demanded enhanced allocations of CRF on the following grounds:

70
a) Occurrence of natural calamities over a period of time has increased extensively and intensively causin g enormous financial burden on State exchequer
b) Paradigm shift in the focus from relief centric approach to prevention, mitigation and preparedness has increased disaster management activities on one hand and increasing expenditure on the other.
c) As per revised CRF / NCCF norms, relief assistance towards rescue, relief and rehabilitation has almost doubled.
6.5 The State government made the following suggestions for the consideration of the Commission for improving the existing system:
a) The 1st instalment of CRF may be released in April of every year instead of June so that expenditure due to hailstorm which occurs in April and May and pending bills pertaining to previous financial year could be met / cleared off.
b) Floods and cyclones occur in A.P. usually in August, September and October. Hence, 2nd instalment of CRF may be released in September of every year instead of December so that expenditure towards immediate relief, rescue and rehabilitation due to floods / cyclone can be met.
c) The losses suffered by the State and the expenditure incurred on account of the calamities should be considered for determining the size of Calamity Relief Fund instead of the average expenditure of previous years.
d) The excess expenditure over and above the CRF, incurred by the State during the year may be shared by the central and State Governments in the same ratio of CRF i.e. (3:1).
e) The provision for escalation of prices be considered at 25% for each year.
f) The assistance from National Calamity Contingency Fund may be released expeditiously to enable the State Government to undertake rescue relief and restoration of damaged infrastructure immediately after the calamity.
g) Methodology for calculation of entitlement under NCCF should be worked in consultation with the State Government.
h) The share of contribution by the State Government to the CRF may be fixed @ 10% instead of 25%.
i) Provision should be made for restoration of public utility services to bring them to pre calamity level.

71
Arunachal Pradesh 6.6 The major natural calamities of Arunachal Pradesh include flood, flash flood, cloudburst, landslide, fire and avalanche. The areas in the foot hills or along the river basin are more prone to flood and erosion. The district of Changlang, Lohit, Lower Dibang Valley, East Siang, East Kameng and Papumpare are affected by flood every year. The other districts too are affected by flood in catchment areas but the calamities like flash flood, cloud burst, landslides are more rampant. Fire accidents usually occur during dry season i.e. in winter. The houses in rural areas of the S tate are constructed of thatched materials in very close proximity to each other. Therefore, fire spreads very rapidly and many houses are burnt at a time. The districts of Lower Subansiri, Upper Subansiri, East Kameng, Papumpare, West Sing, Upper Siang, Tirap Kurung Kumey suffered major damages in fire accident. Avalanches occur in snow bound areas of Tawang and West Kameng districts. 6.7 On receipt of funds from the Centre, the State government contributes its share and the composite fund is released to State Level Relief Committee as CRF. However the delay in release of funds from Government of India causes difficulties.
Assam 6.8 The details of funds received from the CRF and NCCF in Assam and the expenditure incurred from 2001-02 are indicated below:
Table -6.2 Expenditure on Relief-Assam
(Rs. in crore) Year CRF NCCF Total
expenditure Central share
State Share
Total
2001-02 79.92 26.64 106.56 0.00 106.56 2002-03 83.92 27.97 111.89 0.00 111.89 2003-04 88.12 29.37 117.49 0.00 176.29 2004-05 92.52 30.84 123.36 211.55 334.91 2005-06 144.79 46.26 194.05 0.00 194.05 2006-07 148.97 49.66 198.63 0.00 198.63 2007-08 153.36 51.12 204.48 0.00 403.10
6.9 Therefore the State government had to incur additional expenditure from its own resources to the tune of Rs. 58.58 crores and Rs. 198.62

72
crores during 2003-04 and 2007-08 respectively. However the damage suffered by the State was much more than the relief provided
Table -6.3
Damages Due to Natural disasters in Assam 2000 -01 to 2007 -08 Year Area
affected (lac hect)
Crop area affected
(lac hect)
Population affected (lakh)
Human lives lost
Cattle lost
Value of crop lost (Crore)
Total damage ( Crore)
2000-01 9.66 3.22 38.88 36 19,988 173.51 251.18 2001-02 2.03 0.36 5.42 4 15 518.35 14.90 2002-03 11.87 2.98 75.50 65 4,294 145.59 780.49 2003-04 7.01 2.13 52.75 35 108 124.74 1128.12 2004-05 2.36 5.22 12.64 497 1,18,772 374.70 NA 2007-08 15.04 6.74 108.67 134 728 NA 1444.24
Hence the State government requested for enhancement of allocations under CRF. Bihar 6.10 The Memorandum of Government of Bihar states that the allocations based on CRF norms constrains the capacity of the State to rise up to the situation demanded by the intensity and frequency of floods. It suggested that the parameters of assessment should cover the recurrence, periodicity, severity, duration of calamity and cost of restoration of infrastructures. All these aspects put together in a basket could lead to a fair assessment of the damage and in allocation of the CRF. 6.11 The State government had sent proposal for additional allocations of Rs. 2156.39 crores under NCCF in 2007, but the amount is yet to be released to the State government. The GOI raised irrelevant queries which were also clarified, but the release is withheld which has put the State government under serious difficulties in managing the disaster. Chattisgarh 6.12 The Government of Chattisgarh did not have problem with CRF allocations, but in so far as NCCF is concerned there are serious difficulties in the timely release from the Centre. Therefore the State Government recommends that once the State government seeks additional assistance under NCCF, 50% of the assistance sought should be released straightway and the balance amount can be released after the visit of the Central Team and completion of other formalities. The State government

73
provided the following details but the expenditure figures for the years 2001-02 and 2002-03 were left blank
Table -6.4
Expenditure on Relief-Chattisgarh (Rs. in crores) Year Calamity NCCF CRF
Expenditure Balance
Opening Balance
GOI share
State's Share
Inter-est.
2000-01 Drought 4000.00 0.00 1085.00 687.00 0.0 6033.63 -261.55
2001-02 Flood 2394.00 -261.55 2163.00 721.00 0.0
2001-02 Drought 1894.00 0.00 0.00 0.00 0.0
2002-03 Drought 10068.00 3659.26 2272.00 757.00 0.0
2003-04 Drought 2683.00 2173.00 1192.50 397.50 0.0 5273.91 1172.09
2004-05 Drought 0.00 1172.09 3695.50 923.88 0.0 3218.19 2573.27
2005-06 Drought 5274.00 2573.27 4190.50 1397.00 0.0 4581.10 8853.67
2006-07 Flood 0.00 8853.67 15032.50 5011.75 0.0 13831.4 15066.6
2007-08 - 0.00 15066.57 2219.00 739.75 0.0 4917.63 13107.7
2008-09 - 0.00 13107.69 4438.00 1479.50 0.0 2924.21 16101
Gujarat 6.13 The Government of Gujarat maintains the CRF for disaster preparedness and for providing relief to victims in the event of cyclone, drought, earthquake, fire, flood and hailstorm. Expenditure on restoration of damaged capital works is ordinarily met from the normal budgetary heads except when it is to be incurred as part of providing immediate relief. However, as per the State Disaster Management Act, every department makes budgetary allocation in their annual departmental plans for disaster preparedness, prevention, mitigation and response measures. The statement of expenditure of the State was given as under:
Table -6.5
Expenditure on Relief-Gujarat Financial
Year CRF
Central share
CRF State share
NCCF Total Allocation
Expenditure Incurred (Rs. in Crores)
Drought Floods Earthquake Total 1998-1999 116.12 38.71 55.35 210.18 1.08 113.73 0 114.81
1999-2000 121.05 40.35 54.58 215.98 265.77 74.52 0 340.29
2000-2001 113.14 40.35 585 738.49 886.28 17.02 560.47 1463.77
2001-2002 117.01 42.37 994.37 1153.75 1042.09 7.13 737.15 1786.37
2002-2003 133.46 44.48 23.29 201.23 195.86 8.35 224.15 428.36
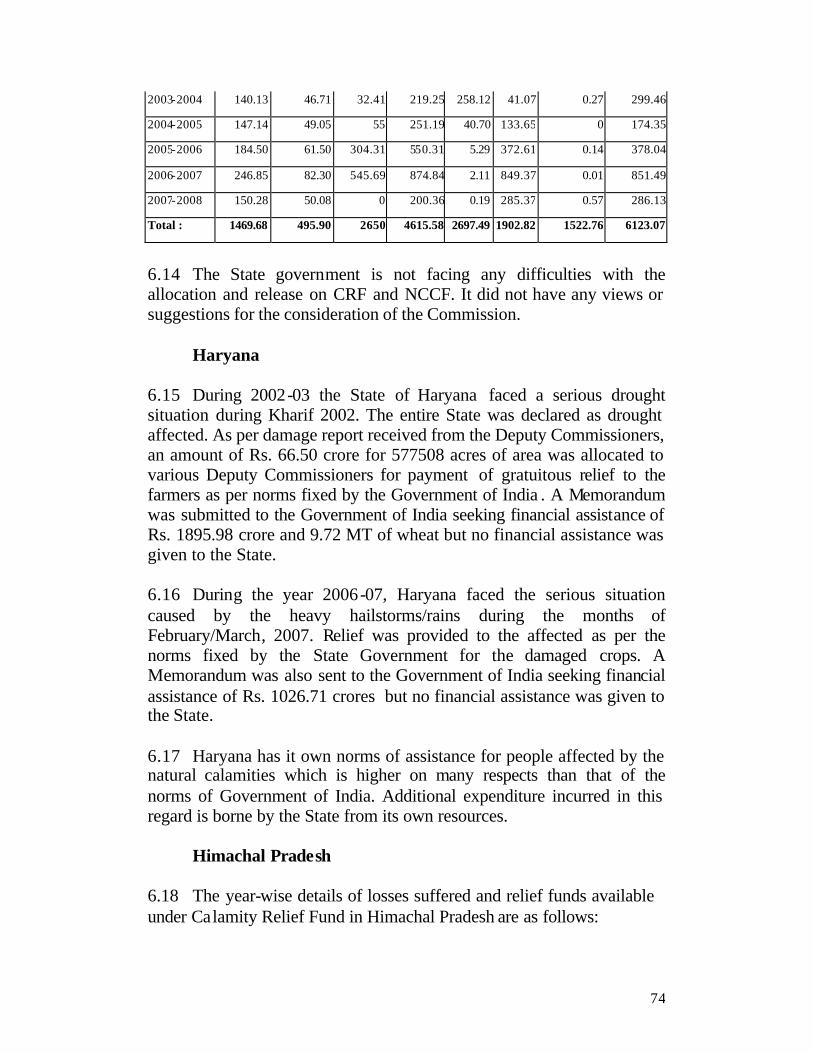
74
2003-2004 140.13 46.71 32.41 219.25 258.12 41.07 0.27 299.46
2004-2005 147.14 49.05 55 251.19 40.70 133.65 0 174.35
2005-2006 184.50 61.50 304.31 550.31 5.29 372.61 0.14 378.04
2006-2007 246.85 82.30 545.69 874.84 2.11 849.37 0.01 851.49
2007-2008 150.28 50.08 0 200.36 0.19 285.37 0.57 286.13
Total : 1469.68 495.90 2650 4615.58 2697.49 1902.82 1522.76 6123.07
6.14 The State government is not facing any difficulties with the allocation and release on CRF and NCCF. It did not have any views or suggestions for the consideration of the Commission. Haryana 6.15 During 2002-03 the State of Haryana faced a serious drought situation during Kharif 2002. The entire State was declared as drought affected. As per damage report received from the Deputy Commissioners, an amount of Rs. 66.50 crore for 577508 acres of area was allocated to various Deputy Commissioners for payment of gratuitous relief to the farmers as per norms fixed by the Government of India . A Memorandum was submitted to the Government of India seeking financial assistance of Rs. 1895.98 crore and 9.72 MT of wheat but no financial assistance was given to the State. 6.16 During the year 2006-07, Haryana faced the serious situation caused by the heavy hailstorms/rains during the months of February/March, 2007. Relief was provided to the affected as per the norms fixed by the State Government for the damaged crops. A Memorandum was also sent to the Government of India seeking financial assistance of Rs. 1026.71 crores but no financial assistance was given to the State. 6.17 Haryana has it own norms of assistance for people affected by the natural calamities which is higher on many respects than that of the norms of Government of India. Additional expenditure incurred in this regard is borne by the State from its own resources. Himachal Pradesh 6.18 The year-wise details of losses suffered and relief funds available under Calamity Relief Fund in Himachal Pradesh are as follows:
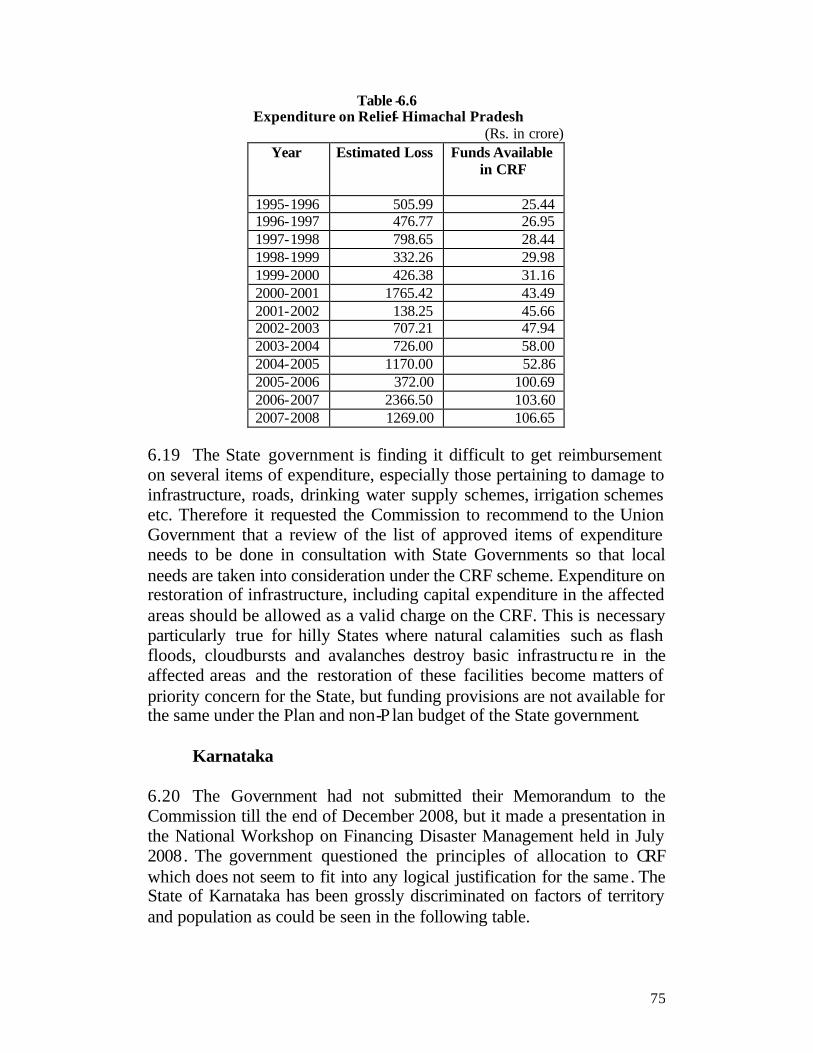
75
Table -6.6 Expenditure on Relief- Himachal Pradesh
(Rs. in crore) Year Estimated Loss Funds Available
in CRF
1995-1996 505.99 25.44 1996-1997 476.77 26.95 1997-1998 798.65 28.44 1998-1999 332.26 29.98 1999-2000 426.38 31.16 2000-2001 1765.42 43.49 2001-2002 138.25 45.66 2002-2003 707.21 47.94 2003-2004 726.00 58.00 2004-2005 1170.00 52.86 2005-2006 372.00 100.69 2006-2007 2366.50 103.60 2007-2008 1269.00 106.65
6.19 The State government is finding it difficult to get reimbursement on several items of expenditure, especially those pertaining to damage to infrastructure, roads, drinking water supply schemes, irrigation schemes etc. Therefore it requested the Commission to recommend to the Union Government that a review of the list of approved items of expenditure needs to be done in consultation with State Governments so that local needs are taken into consideration under the CRF scheme. Expenditure on restoration of infrastructure, including capital expenditure in the affected areas should be allowed as a valid charge on the CRF. This is necessary particularly true for hilly States where natural calamities such as flash floods, cloudbursts and avalanches destroy basic infrastructu re in the affected areas and the restoration of these facilities become matters of priority concern for the State, but funding provisions are not available for the same under the Plan and non-P lan budget of the State government.
Karnataka
6.20 The Government had not submitted their Memorandum to the Commission till the end of December 2008, but it made a presentation in the National Workshop on Financing Disaster Management held in July 2008. The government questioned the principles of allocation to CRF which does not seem to fit into any logical justification for the same. The State of Karnataka has been grossly discriminated on factors of territory and population as could be seen in the following table.
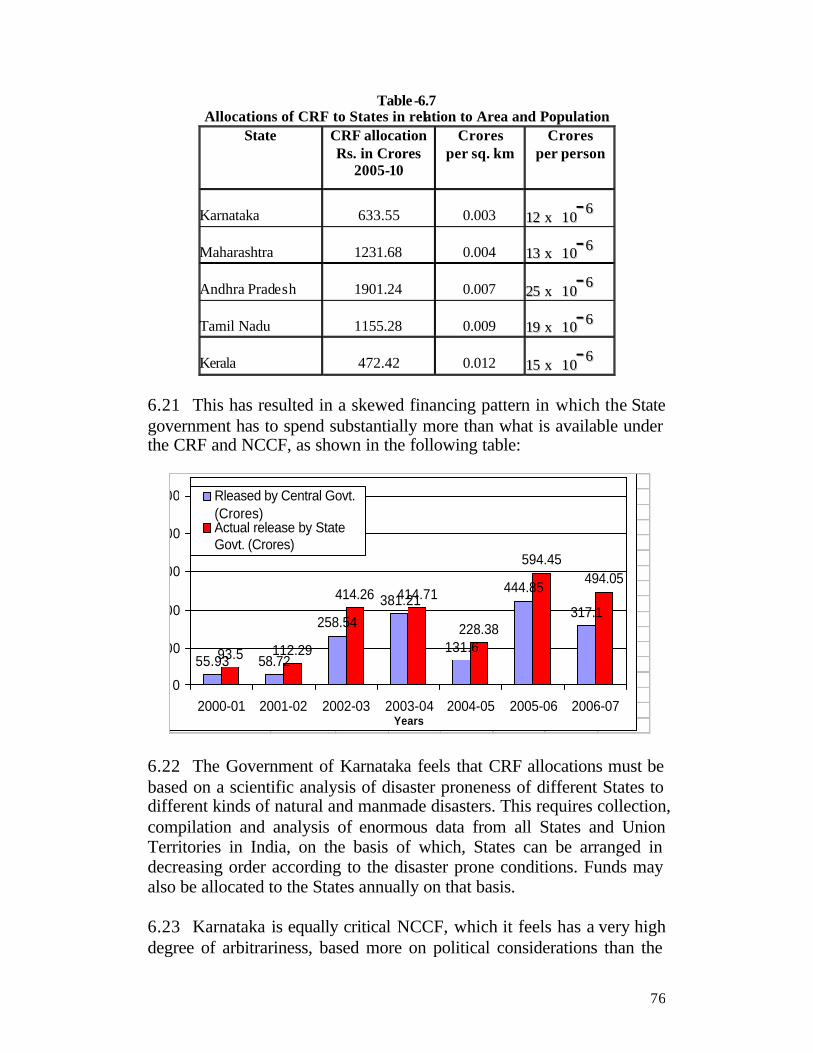
76
Table-6.7 Allocations of CRF to States in relation to Area and Population
State CRF allocation Rs. in Crores
2005-10
Crores per sq. km
Crores per person
Karnataka
633.55
0.003 1122 xx 1100-- 66
Maharashtra
1231.68
0.004 1133 xx 1100-- 66
Andhra Pradesh
1901.24
0.007 2255 xx 1100-- 66
Tamil Nadu
1155.28
0.009 1199 xx 1100-- 66
Kerala
472.42
0.012 1155 xx 1100-- 66
6.21 This has resulted in a skewed financing pattern in which the State government has to spend substantially more than what is available under the CRF and NCCF, as shown in the following table: 6.22 The Government of Karnataka feels that CRF allocations must be based on a scientific analysis of disaster proneness of different States to different kinds of natural and manmade disasters. This requires collection, compilation and analysis of enormous data from all States and Union Territories in India, on the basis of which, States can be arranged in decreasing order according to the disaster prone conditions. Funds may also be allocated to the States annually on that basis. 6.23 Karnataka is equally critical NCCF, which it feels has a very high degree of arbitrariness, based more on political considerations than the
55.93 58.72
258.54
381.21
131.6
444.85
317.1
93.5 112.29
414.26 414.71
228.38
594.45494.05
0
200
400
600
800
1000
2000-01 2001-02 2002-03 2003-04 2004-05 2005-06 2006-07Years
Rleased by Central Govt.(Crores)Actual release by StateGovt. (Crores)
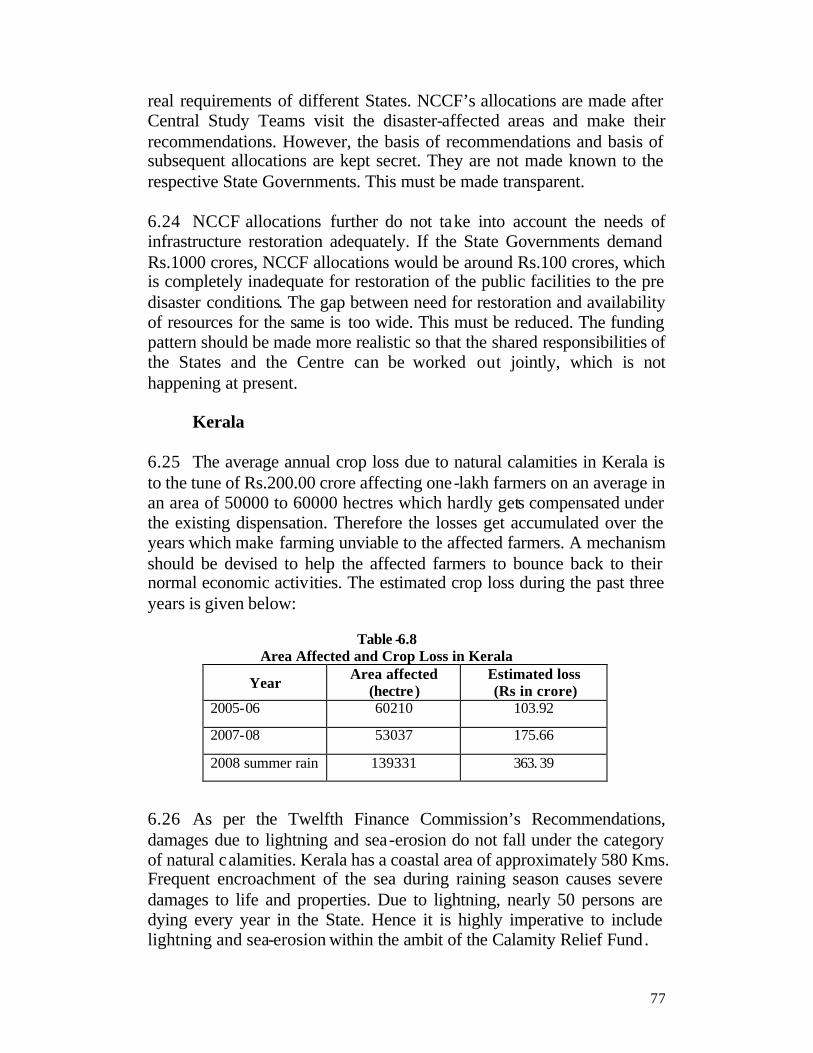
77
real requirements of different States. NCCF’s allocations are made after Central Study Teams visit the disaster-affected areas and make their recommendations. However, the basis of recommendations and basis of subsequent allocations are kept secret. They are not made known to the respective State Governments. This must be made transparent. 6.24 NCCF allocations further do not take into account the needs of infrastructure restoration adequately. If the State Governments demand Rs.1000 crores, NCCF allocations would be around Rs.100 crores, which is completely inadequate for restoration of the public facilities to the pre disaster conditions. The gap between need for restoration and availability of resources for the same is too wide. This must be reduced. The funding pattern should be made more realistic so that the shared responsibilities of the States and the Centre can be worked out jointly, which is not happening at present.
Kerala
6.25 The average annual crop loss due to natural calamities in Kerala is to the tune of Rs.200.00 crore affecting one-lakh farmers on an average in an area of 50000 to 60000 hectres which hardly gets compensated under the existing dispensation. Therefore the losses get accumulated over the years which make farming unviable to the affected farmers. A mechanism should be devised to help the affected farmers to bounce back to their normal economic activities. The estimated crop loss during the past three years is given below:
Table -6.8
Area Affected and Crop Loss in Kerala
Year Area affected (hectre )
Estimated loss (Rs in crore)
2005-06 60210 103.92
2007-08 53037 175.66
2008 summer rain 139331 363. 39
6.26 As per the Twelfth Finance Commission’s Recommendations, damages due to lightning and sea-erosion do not fall under the category of natural calamities. Kerala has a coastal area of approximately 580 Kms. Frequent encroachment of the sea during raining season causes severe damages to life and properties. Due to lightning, nearly 50 persons are dying every year in the State. Hence it is highly imperative to include lightning and sea-erosion within the ambit of the Calamity Relief Fund.

78
Madhya Pradesh
6.27 The Memorandum of Government Madhya Pradesh alleges that it has got a very raw deal from the successive Finance Commissions as would be evident from the allocations made by the previous Commissions to the State in comparison to a few other States of the country.
Table -6.9
Comparison in CRF Allocations Among States (Rs. in Crores) STATES CRF
(1995-2000) CRF
(2000-2005) CRF
(2005-2010) Andhra Pradesh 653.77 1094.40 1901.24 Gujrat 734.90 891.84 1359.30 Madhya Pradesh 268.88 346.08 1348.37 Maharashtra 359.03 868.64 1231.68 Orissa 258.01 604.88 1599.16 Rajasthan 942.52 1143.81 2296.68 Uttar Pradesh 658.17 808.27 1569.49 West Bengal 270.17 558.66 1244.86 6.28 If total geographical area, perennially drought prone area, populatio n of weaker sections and small and marginal farmers, area under irrigation and soil types etc. are considered, the inadequacy and inequitable allocations becomes evident. The Ninth Finance Commission awarded Rajasthan about three times more than Madhya Pradesh. The Tenth the Eleventh and the twelfth Finance Commissions continued this injustice to Madhya Pradesh. 6.29 In case of natural calamities, particularly under drought, relief has to be provided by creating employment opportunities by initiating relief works. Thus a sizeable part of expenditure is booked under normal budget of the development departments, which is not reflected under Grant-58 (major head 2245). This results in under estimation of the expenditure actually incurred on relief measures. This would become clear from the following table:
Table -6.10 Expenditure on Relief- Madhya Pradesh
(Rs. in Crore) Year Actual Expenditure
Incurred Central Assistance
CRF + NCCF 1995-96 68.09 36.16 1996-97 93.69 38.31 1997-98 254.54 143.18 1998-99 65.89 42.49

79
1999-2000 76.62 73.14 2000-2001 67.56 81.98 2001-02 92.15 72.04 2002-03 305.07 234.89 2003-04 182.40 78.17 2004-05 101.42 57.10 2005-06 167.10 190.67 2006-07 211.68 277.52 2007-08 420.01 218.80
6.30 As against the demand of Rs 2172.75 crore of assistance sought from the Central Government for drought during 2003-08, nil assistance was received from the Central government. In such a situation it would be more useful to give flexibility to the State Government, so that the allocation of the available resources is done in such a way that it meets the pressing needs assessed at the field level. In view of the above, the item wise stipulation of the end use of the assistance approved may not be insisted upon and the State be given the flexibility to use the allocated resources for undertaking a wide range of drought combating measures including employment generation. 6.31 The allocation under CRF should be distributed amongst the States on the basis of a transparent criteria and weightage on the basis of the type, intensity and duration of impact of the calamity. The criteria for inter-state allocation under CRF should include drought prone area, duration and periodicity of droughts, need for supply of drinking water, fodder, relief in debt repayments, relief for crop losses and providing employment for roughly 10 months in a predominantly single crop economy. Maharashtra 6.32 The Government of Maharashtra has been investing substantial resources over and above CRF and NCCF as would be evident from the following table:
Table -6.11 Expenditure on Relief-Maharashtra
(Rs. in crores) Year Total Amount
Spent CRF
( 75:25) NCCF Addl. State
Fund
2001-02 164.36 164. 36 - -
2002-03 185.55 185.55 - -

80
2003-04 488.30 207 - 281.30
2004-05 464.26 220 - 244.26
2005-06 1324.71 222.90 1019.48 138.03
2006-07 1122.86 220 227.67 675.19
2007-08 (Till July)
251.26 245.75 - 5.51
6.33 The Government of Maharashtra had a number of suggestions for the consideration of the Thirteenth Finance Commission. These are summed up as under:
a) The Disaster Management Act has been promulgated under the concurrent list. Therefore disaster management should not be relegated as a state responsibility. It needs to be considered as joint responsibility of the Centre and the States.
b) National Disaster Management Authority has been prescribing guidelines on disaster management, especially structural ones, without financial commitments, which have made the guidelines unimplementable by the States. The Finance Commission must address this issue squarely.
c) The Commission must lay down detailed guidelines on the constitution of various Funds created under the Act, such as nature of the funds – whether reserve funds or lapsable Fund, procedure of administration of Funds etc. In the absence of such guidelines the Finance Departments of the States is reluctant to operationalize the Funds
d) The existing CRF may be converted to SDRF. The amount may be revised upwards considering the area, population and vulnerability of the states. Additional demand for funds, when made by States, may be met out of NDRF
e) Mitigation Funds at District and State Level need to be constituted in the same manner. Such Funds need to be at least double than that of Response Fund.
f) Line Departments should undertake some mitigation activities from their own budget. The Mitigation Fund will be utilized for specific vulnerability reduction oriented works. Unlike Response Funds, States would not ask for additional allocation for Mitigation Fund.
g) Activities not supported by line departments, such as emergency communication network, IEC activities, capacity building and training activities, relocation of houses falling within red zone and blue zone, flood protection works, landslide mitigation works
81
including the relocation of people living in landslide prone areas, desilting of rivers and nullahs, lightning mitigation, retrofitting of buildings, etc should be taken up under Mitigation Fund.
Manipur
6.34 The amount of relief given to the victims is based on the guidelines and scales issued by the Government of India. However the estimated values of crops/ houses/properties are much more than the scales prescribed for giving assistance. Meghalaya 6.35 Due to its location, the State is prone to different kinds of natural disasters of re-current nature. Such disasters disrupt the economic activities of the people and cause immense hardship to the affected people. From year to year properties worth crores, both private and public are lost under the impact of disasters, for which grants are disbursed to the affected people out of Calamity Relief Funds to enable them to restart their activities. Similarly, large amounts are spent on repairs/restoration of rain/flood damaged roads, bridges and other infrastructures. The State Government is satisfied with the existing arrangements and do not have any specific suggestion or recommendation to the Commission. Mizoram 6.36 The State government had the following suggestions for the consideration of the Thirteenth Finance Commission
a) Due to its inaccessible terrain and climatic condition, existing norms applicable under CRF/NCCF are not sufficient to the state. Therefore, separate norms should be considered for the entire region of North-east India in general and Mizoram in particular.
b) Since the formation of a Central Team, submission of its recommendations, decisions of the Inter Ministerial Group (IMG) and the actual release of funds take considerable time, which defeat the very objective of providing immediate assistance to the affected people . Therefore immediate assistance should be released on adhoc basis to the affected people on the basis of recommendations made by the State Level Team. The quantum of final assistance shall be decided by the IMG on the basis of assessment made by the Central Team visiting the spot.

82
c) Instead of the present practice of forming Central Teams from different Ministries, Disaster Management Teams may be developed both at the Central and the states. Regular trainings for the State officers handling disaster management may be conducted to enable them handle these issues effectively.
d) CRF should be provided to the Special Category States on the basis of 90:10 formula, and not on the existing ratio of 75:25 as the State governments find it difficult to contribute the State share.
Rajasthan
6.37 Rajasthan has traditionally been facing drought which affects a large human and animal population of the State. The State has also been the major recipient of CRF and NCCF allocations over the years. On the basis of rich experience of the State in the operation of these two funds the State government made the following suggestions for improving the system for the consideration of the Thirteenth Finance Commission. Most of these suggestions relate to the revised norms of CRF/NCCF expenditure notified by the Ministry of Home Affairs.
a) The revised norms provide that relief works for generation of employment can be taken up ‘only to meet additional requirements after taking into account funds available under various plans/schemes with element of employment generation e.g. NREGP, SGRY’. Under NREGP, the entitlement for 100 days employment starts from 1 st of April of the year concerned. Starting from this date, if the right to 100 days employment is exercised continuously, we can cover the period from April up to mid July. This coincides almost exactly with the peak period of drought relief work. Therefore this condition has resulted in a piquant situation where drought affected population can not gain access to employment generation as a drought relief measure under CRF. The right to employment under NREGP should be allowed to be accessed by eligible families at the time of their choice. This means that they should be permitted to take employment in drought relief works under CRF during the peak requirement period of April to mid July, and thereafter take recourse to their statutory right to 100 days employment subsequently at any time of their choice in the course of the rest of the year. By a constructive interpretation of the existing situation, it would be possible to provide almost 200 days employment to the affected families.

83
b) Central norms on relief works for employment generation provides that only daily wages shall be paid at par with the minimum wages of the State for such works, but no material component is admissible, whereas National Rural Employment Guarantee Programme and other employment generation schemes of central and State governments provide for such components, in the absence of which no tangible assets can be created. The State government therefore recommended that at least 40% of the project cost should be sanctioned as material component to create sustainable community assets.
c) Under the revised norms, the cost of food-grains distributed as part
payment to relief labours is to be determined on the basis of ‘Economic Cost’, while in the earlier norms the cost of wheat was to be decided by State government as per provision of SGRY guidelines. The changed norms will result in considerable reduction in quantity of wheat to be provided to relief labour, thus increasing his/her vulnerability in a distress situation. This also amounts to the effective wage rate getting reduced. Therefore the earlier provision should be restored.
d) In the new CRF norms, the replacement of livestock destroyed has
been limited to one large milch /draught animal or four small milch /two small draught animals per Small Farmer/Marginal Farmer/Agriculture labour household. In Rajasthan, animal husbandry provides a second line of defence to the farmer whose crops are damaged in natural disaster. Loss of these animals is a severe blow. Therefore limiting replacement is not correct; the affected farmer must be compensated at least by a viable economic unit of two large milch/ draught animals and ten small milch / draught animals for all the animal owners, irrespective of the category SF/MF agricultural labours.
e) In the revised norms, the time limit has been prescribed for cattle
camps, fodder depots etc, which should better be left to SLC/SEC.
f) The new CRF norms while providing for immediate repair and restoration of the damaged infrastructure, also stipulates that such works should be completed within 30 days (for calamities for normal magnitude) and 45 days (for calamities of severe magnitude). Such time restrictions are impractical especially in crisis situations where restoration works cannot be taken up due to so many exigencies. It is necessary that these time restrictions are

84
suitably extended to six months and one year respectively, so that works can be carried out without difficulty.
g) CRF should cover all types of natural calamities. Frost and cold
wave have severely damaged the Rabi crop (mustard, barley, taramira, coriander, gram, isabgol, vegetables etc.) in Rajasthan, adversely affecting the agricultural economy of the area and financial stability of the farmers. Therefore, the inclusion of frost and cold wave should also be notified as calamities.
h) Many distressed farmers driven to suicides in Maharashtra, Andhra
Pradesh, Madhya Pradesh (including Chhatisgarh) is a matter of great concern. According to the National Crime Records Bureau (NCRB) report 2006, there were 17,060 farmers suicides across India. Our primary concern should be to protect the fortune of vulnerable families in distress during all critical times. Therefore every natural calamity should be covered under the norms of CRF/NCCF.
Sikkim
6.38 The State has been bound by the items and norms of expenditure from the CRF to take up temporary restoration works only. Taking up works purely of temporary nature especially in restoration of vehicular road linkages have not borne fruit. It has been experienced that temporary restoration works do not even last for a day during the monsoon as it is washed away by heavy rain. Therefore works of semi-permanent nature be allowed especially in the hilly States.
Tripura 6.39 The Memorandum of Government of Tripura had two suggestions to offer:
a) As per CRF guidelines, fund under CRF is to be deposited under Public Account Head 8235- General and Other Reserve Fund, 111- Calamity Relief Fund. Thereafter, the fund may be drawn from this Public Account Head for incurring expenditure/term deposit in the Banks authorized by the RBI. This system is causing some accounting difficulties. If the fund is deposited under Public Account and cannot be spent within the financial year of deposit, the Department is required to obtain release again from the Finance Department for drawal of fund. To overcome this problem, present
85
accounting system may be simplified so that after drawal of fund from Head of Account 2245, it may be directly deposited in the Bank Account to facilitate fetching of interest against the entire balance and hassle free drawal.
b) Under CRF norms only small repairs for restoration of
communication and utilities are permissible. But often such small repairs do not serve any durable purpose. As for example, repair of any temporary or semi-temporary bridge remains vulnerable for long term use. If these are replaced by RCC culverts/ permanent bridges, long term purpose is served. The guideline may be modified to accommodate such expenditures.
Uttarakhand 6.40 The Memorandum of Government of Uttarakhand had a number of important suggestions for the consideration of the Thirteenth Finance Commission. These are as under:
a) The State is often affected by extreme cold conditions and farmers in the State often loose their agriculture crops due to frost and cold waves. At present there are no provisions to compensate these losses. It is therefore necessary to bring the norms of the CRF to cover all the disasters that fall within the definition of the DM Act, 2005.
b) The ground realities in the remote hilly areas warrant revision of
time limits of 30 and 45 days for restoration works, as stipulated in the revised CRF norms. In view of the difficult terrain and problems relating to resource mobilization, the time limits for the reconstruction of damaged assets should be extended from 30-45 days to 3 months in the plains while for the hilly terrain these should be revised from 45-60 days to 6 months.
c) Unlike in the plains, disasters often render habitations in the
mountainous regions permanently unfit for human habitation. Landslides and flash floods change the physiography and cause permanent loss of land. The victims of these disasters have to be rehabilitated at alternative safe locations for which funding arrangements needs to be made. More than hundred odd villages in the State have been identified as unfit for habitation.
86
d) In order to facilitate quick response at the time of disaster, the State Governments should be allowed to utilize at least one percent (1%) of the CRF funds for meeting the cost of resource mobilization, hiring of experts and others.
e) In accordance with the provisions of the Disaster Management Act,
2005 the State Government has formulated State and District Disaster, Response and Mitigation Funds. Guideline as to sharing of these funds are required to be clarified.
f) The State Government has set up EOCs in all the districts. These
however lack infrastructure and instruments. A provision of Rs. 14 crore is required to be made for furnishing and equipping the EOCs. in 13 districts and the State EOC.
Uttar Pradesh 6.41 The different parts of the State of Uttar Pradesh are prone to various types of natural calamities such as floods, droughts, hailstorms, fires etc. While, the eastern region of Uttar Pradesh experiences floods in rainy season due to rivers flowing from the neighbouring country Nepal, the other regions experience droughts almost every year. Seven districts of Bundelkhand region of Uttar Pradesh have been suffering from drought continuously for the last four years. The Memorandum of the State government did not have any specific suggestion to offer except that the present pattern of investment should be modified so that funds are made readily available at a short notice at the time of natural calamities. The investment pattern of CRF should be left to the State level Committee. West Bengal 6.42 In its Memorandum submitted to the Thirteenth Finance Commission the Government of West Bengal suggested that erosion and lightning should be recognised as natural calamities as these cause extensive damage to property and infrastructure every year in a number of districts in the State. At present, neither erosion nor lightning is recognized by the Government of India as natural calamity. State Government is not able to access Calamity Relief Fund for sanction of ex-gratia Grant and for repair of damaged infrastructure in case of erosion or lightning. Therefore erosion and lightning should be recognised as natural calamities under Calamity Relief Fund.

87
MANDATES OF DISASTER MANAGEMENT ACT 2005
The Disaster Management Act 2005 was one of the most significant initiatives taken by the Government of India for putting in place an institutional system dedicated to disaster management. Notified on 26 December, 2005, exactly a year after the Indian Ocean Tsunami, the Act was the first acknowledgement of the Government of India of the need for legislative backup to the governance system for efficient management of disasters in the country. Comprising of 11 chapters and 79 sections the Act was promulgated to provide for the “effective management of disasters and for matters connected therewith or incidental thereto.”
7.2 The Act extends to the entire Indian territory, although section 1(3) of the Act provides that it shall come into force on such dates as the Central Government may, by notification in the Official Gazette appoint. The provisions regarding the constitution of National Disaster Management Authority (sections 2-6, 8,10,75,77,79) were notified on 28 July 2006, provisions regarding the Central Government, National Institute of Disaster Management, National Disaster Response Force (sections 7,9,11-13,35-37,42-45, 49, 50, 70(1),76) were notified on 30 October 2007 and provisions regarding the State Government (sections 14-34, 38-41, 48, 51-69, 70(2), 71-74,78,79) were notified on 1 August 2007. The only two sections that remain to be notified are sections 46 and 47 which deal with National Disaster Response Fund and National Disaster Mitigation Fund.
Defining Disasters and Types of Disasters 7.3 The Act has ushered in a paradigm shift in disaster management in the country. First, it defines disasters as “a catastrophe, mishap, calamity or grave occurrence in any area, arising from natural or man-made causes, or by accident or negligence, which results in substantial loss of life, or human suffering, or damage to, and destruction of property, or damage to, or degradation of, environment, and is of such a nature or magnitude as to be beyond the coping capacity of the community of the affected area.” This comprehensive definition of disaster has several implications. First, it broadens the scope of disasters from ‘natural calamity’ recognised by the
88
Finance Commissions to other possible types of natural and man made disasters. The Second to Eighth Finance Commissions had recognized only six ‘natural calamities’ - flood, earthquake, drought, cyclone, fire and hailstorm. The Twelfth Commission added land slides, avalanches, cloud burst and pest attack to this list. This has to be further redefined in the context of the Act. Second, it restricts disasters to only those events which results in ‘substantial loss of life, or human suffering’ or ‘damage to, and destruction of property’ of such a magnitude as to be ‘beyond the coping capacity of the community of the affected area’. Therefore isolated events that do not result in substantial loss life or property would not qualify to be reckoned as disasters. But the Act has not defined what is ‘substantial’ nor has it laid down the conditions of ‘magnitude’. The Commission may therefore provide guidelines to avoid any confusion and /or prevent the misuse the financial provisions in contravention of the provisions of the Act. Thirdly, this simultaneous expansion and compression of the scope of disaster would necessarily imply that financial implications for managing the disasters are worked out afresh so that all the disasters are reasonably covered under the allocations of the Commission. 7.4 The Finance Commissions had never used the term ‘disaster’ in their reports. The Commissions had consistently used the term ‘natural calamity’ and hence the funds for management of the calamities were also known as Calamity Relief Fund and National Calamity Contingency Fund. Under the Act a new set of funds to be known as Disaster Response and Disaster Mitigation Fund have been created at the national, state and district levels. Therefore the first important issue before the Thirteenth Finance Commission would be to decide whether the term ‘natural calamity’ would continue to be used as in the past or it should be replaced by ‘disaster’ as defined in the Act. Keeping in view the provisions of the Disaster Management Act, the Commission may have little option but to adopt the term ‘disaster’ replacing the term ‘natural calamity’ hitherto used. 7.5 Secondly, it would be necessary for the Commission to decide the type of natural or man made disasters that should be recognized for the purpose of admissibility of federal financial assistance or to attach such conditions as may be considered necessary for the efficient financial management of disasters. The High Powered Committee constituted by the Government of India in August 1999 to ‘review existing arrangements for management of natural and man-made disasters and recommend measures

89
for strengthening the system’ had recognized 14 natural and 17 man made disasters under five different groups, as under:
Natural Disasters Man Made Disasters I. Water and Climate related
disasters 1. Floods and Drainage
Management 2. Cyclones 3. Tornadoes and Hurricanes 4. Hailstorm 5. Cloud Burst 6. Heat Wave and Cold Wave 7. Snow Avalanches 8. Droughts. 9. Sea Erosion 10. Thunder & Lightning
II. Geologically related disasters
1. Landslides and Mudflows 2. Earthquakes 3. Dam Failures/ Dam Bursts. 4. Mine Fires
III. Chemical, Industrial & Nuclear
related disasters 1. Chemical and Industrial Disasters 2. Nuclear Disasters
IV. Accident related disasters
1. Forest Fires 2. Urban Fires 3. Mine Flooding 4. Oil Spill 5. Major Building Collapse 6. Serial Bomb Blasts 7. Festival related disasters 8. Electrical Disasters & Fires 9. Air, Road and Rail Accidents. 10. Boat Capsizing. 11. Village Fire
V. Biologically related disasters 1. Biological Disasters and Epidemics 2. Pest Attacks 3. Cattle Epidemics 4. Food Poisoning
7.6 Out of the 14 natural disasters identified by the High Powered Committee, 8 have already been accepted by the previous Finance Commissions. These are flood, earthquake, drought, cyclone, hailstorm, land slides, avalanches, and cloud burst. Not all the remaining 6 natural disasters may be recommended for inclusion in the list of disasters. Flood is essentially a failure of drainage management and therefore there is no need to change the known and accepted category of ‘flood’ into ‘floods and drainage management’. Cyclone is synonymous of hurricane (the term ‘hurricane’ is used in the Americas, while ‘cyclone’ is used in Asia) while tornadoes are not common in Indian sub-continent but essential features of tornadoes are included in cyclones. Therefore cyclone subsumes both ‘tornadoes’ and ‘hurricane’. 7.7 There is strong justification of including ‘heat and cold wave’ as there are many casualties and damages to crop due to heat and cold wave conditions. A number of States have been demanding their inclusion in the list of natural calamities. The specter of climate change would make extreme weather conditions a potential threat to life and property in the years to come.

90
The Commission may therefore consider to include ‘heat and cold wave’ as a disaster, but as a measure of abundant caution it may like to prescribe that in order to qualify for a disaster ‘heat and cold wave’ must be abnormal in nature which is higher than the highest recorded in a region during the past twenty years. 7.8 ‘Erosion’ is another phenomenon that is threatening the coastal States due the effects of sea level rise. A number of States have been demanding recognition of the phenomenon as the initial step for developing a comprehensive strategy for managing it. Likewise, States like Assam and West Bengal have been requesting inclusion of river erosion in the list of natural calamities as changing course of rivers have claimed land and settlements, affecting thousands of people every year in many parts of the State. Therefore the Commission may consider accepting ‘erosion’ as a disaster. This may include both and sea and river erosion. 7.9 ‘Lightning’ is another climatic phenomenon which is likely to increase with the increasing extreme weather events. There are documented evidence that lightning is consuming lot of lives and property in various parts of the country. Many States have been demanding the inclusion of ‘lightning’ in the list of natural calamity. The Commission may therefore include ‘lightning’ as a disaster. There is no need to make a mention of ‘thunderstorm’ as it is already subsumed under ‘lightning’. 7.10 ‘Mudflow’ is another form of landslides and hence there is no need to make any mention of ‘mudflow’ in this category. ‘Dam failure/ Dam bursts’ as a natural disaster may be a consequence of earthquake, landslide or flood and there may be little justification to include this as a separate category of natural disaster. ‘Mine fire’ sometimes happen naturally but this is one of the hazards of mining which the concerned firms engaged in the business must be responsible to manage. Sometimes the magnitude of mine fire may be such that it is beyond the capacity of the company to manage. In such a situation it may seek the assistance of the State authorities for which it should pay for the services. Opening mine fire to federal financial assistance may not be justifiable as it would provide a disincentive to the miners to invest on safety of the mines and its workers. There was a suggestion that the Commission may also consider to include ‘heavy rainfall’ as an independent category of disasters. Mostly heavy and incessant rainfall shall result in flood which is already included as a disaster, but sometimes flood may not occur as a result of heavy rainfall, while it may still cause severe
91
damage to life and property. The climate change experts have been forecasting that the process of global warning would increase the incidence of heavy rainfall – 5 to 10 times of the normal with a return period of 10 years – which would be disastrous. But so far we do not have much empirical evidence of heavy rainfall causing heavy damage but not resulting in flood. Therefore at this stage it may not be advisable to include ‘heavy rainfall’ as separate type of natural disaster, although the position can always be reviewed subsequently. However, tsunami which escaped the attention of the HPC must be included in the list of natural disasters. The Commission may therefore consider including only 4 new types – tsunami, heat and cold wave, erosion and lightning in the existing list of 8 natural disasters. 7.11 Out of 17 man made disasters identified by the High Powered Committee, 2 disasters, namely fire and pest attack are already in the approved list of the Finance Commissions. HPC has listed fire under 4 different categories – forest fire, urban fire, village fire and electrical disasters & fire, which should be subsumed under the existing generic category of fire. ‘Chemical and industrial disasters’ merits recognition by the Commission, as there are growing threats of such disaster with increasing industrialization of the country. The Ninth Finance Commission had in fact recognized the Bhopal Gas Leak Tragedy as the worst industrial disaster of its kind and made a special dispensation for financing the relief and rehabilitation of the victims. A distinction however needs to be drawn between the onsite (within the premises of the plant) and off site disasters (out side the plant affecting the community). The concerned industrial unit shall be solely responsible for all on site disasters and no federal financial assistance shall be available for this purpose. In so far as off-site disasters are concerned the Environment Protection Act 1986 and the rules framed there under has entrusted certain responsibilities to the industries for prevention and management of such disasters. The federal financial assistance should not be available for transferring these responsibilities to the government. The primary responsibility for prevention and management of chemical and industrial disasters shall rest with the concerned industries. The role of the government would be regulatory in nature. However if the regulatory mechanism has failed to prevent a disaster which has affected the community the government can not remain a silent spectator and must intervene to provide relief and rehabilitation assistance to the affected people. Therefore it is suggested for consideration that the Commission may accept ‘Chemical and Industrial Accidents’ as a disaster provided it has affected the
92
community outside the premises of the factory and that immediate assistance is required for the relief and habilitation of the affected people. 7.12 The High Powered Committee has identified ‘nuclear disaster’ as one of the man made disasters. Although such disaster has never taken place in our country we can not take any chance and must be fully prepared for the same. As the country has decided to invest on new nuclear power plants and many such plants shall be expected to come up in the private sector, the chances of accidents shall also increase despite the full proof arrangements that are in place for preventing such accidents. Further, the use of nuclear materials for producing dirty bombs by the terrorists can not be ruled out altogether. The same subversive elements may also use dangerous chemical and biological agents for creating large scale panic among the people and causing damage to life and property. A detailed operating procedure to deal with such emergencies, outlining responsibilities of various agencies has been developed. Most of the responses to such disasters shall be made by the agencies of the Central governments and therefore it may not advisable at this stage to include nuclear, chemical and biological emergencies as ‘disaster’ for the purpose of federal financial assistance to the States. 7.13 The HPC has listed ‘Air, Rail and Road Accidents’ and ‘Boat Capsizing’ as disasters, which indeed they are, but to what extent should these be eligible for financial assistance is debatable. Aviation accidents are covered by insurance which is built into the cost of tickets. Similarly rail accidents are covered by railway relief which forms part of the budget of the Ministry of Railways. Road accidents are also covered by compulsory third party insurance under the Motor Vehicles Act. Therefore no government assistance would be required except for search and rescue operations or medical assistance which in any case are the normal functions of government. Similar regulatory mechanism should be developed for river and marine transportation system. Therefore there may not be much justification for including these accidents as disasters for the purpose of federal financial assistance. 7.14 ‘Mine flooding’ may occur either due to accident within the mine, which should be taken care of by the industry or due to general conditions of flood outside, which is already recognized as a natural disaster. ‘Festival related disasters’ mostly take the shape of stampede which often take a heavy toll of life and district administration is overwhelmed without

93
necessary financial provisions for managing the event. Therefore the Commission may accept ‘Stampede’ as a man made disaster. 7.15 ‘Oil spill’ has created major disasters around the world. India with a long coastline of nearly 8000 km can not remain immune to such disaster. In fact, the risks of oil spill would increase with the increasing volume of marine transport in Indian ocean basins. The long term environmental consequences of oil spill both for coastal population and aquatic species could be very serious. However such disasters are not very frequent and the capacity of the State to respond to such disasters are not quite evident. Probably most of the interventions would be at the level of the Central government and its agencies. None of the States has demanded inclusion of ‘oil spill’ as a disaster. Therefore till detailed studies are carried out it may be premature for the Commission to recognize ‘Oil Spill’ as a man made disaster for the purpose of granting federal assistance to the States. 7.16 The HPC had identified ‘Major building collapse’ as a man made disaster. Normally buildings may collapse due to earthquake, landslide, flood or cyclone. But sometimes buildings may also collapse due to its dilapidated conditions and faulty constructions. Fixing criminal responsibility for such damages may take a long time, while immediate and rehabilitation assistance can not wait. However such cases may not be very frequent and the district administration should find it possible to provide relief to the victims from District Red Cross or other community assistance. The incidents of ‘serial bomb blasts’ are on the rise causing considerable panic and sufferings to the people. While this poses considerable challenge to the intelliegence, law and order and emergency management authorities, it is debatable whether it should be recognized as a disaster. The emergency management system should take care of such eventualities, while relief assistance shall always be available under the Chief Minister’s or Prime Minister’s Relief Fund. 7.17 Out of the remaining three man made disasters identified by the HPC - Biological Disasters and Epidemics, Cattle Epidemics and Food Poisoning – the Commission may consider ‘Epidemics and Pandemics’ as a disaster which can happen independently of other disasters and can have disastrous consequences as the recent threats of swine flu has highlighted. The ‘cattle epidemics’ and ‘food poisoning’ should better be taken care of by the normal animal and human heath care system as this has been done in the past. To sum up, the Commission may recognize the following 17 natural,
94
man made and biological disasters for the purpose of federal financial assistance:
Natural Disasters: (Twelve)
Flood, Earthquake, Drought, Cyclone, Tsunami, Hailstorm, Land Slides, Avalanches, Cloud Burst, Heat and Cold Wave, Erosion and Lightning
Man Made Disasters: (Two)
Industrial Accidents, Fire.
Biological Disasters: (Three)
Pest Attack, Epidemics and Pandemics
Substantial Loss or Damage 7.18 As per the Disaster Management Act, each of these events would qualify as disaster if this results in ‘substantial loss of life, or human suffering’ or ‘damage to, and destruction of property’ or ‘damage to degradation of environment’ of such a nature or magnitude as to be ‘beyond the coping capacity of the community of the affected area’. The Act, however, has not defined what is ‘substantial’ nor has it laid down the conditions of ‘magnitude’. No such rules under the Act has been framed either to clarify these details. Therefore the Commission may have to look into some of these issues and provide necessary guidelines to avoid any confusion and /or prevent the misuse the financial provisions in contravention of the provisions of the Act. 7.19 In so far as ‘substantial loss of life or human suffering’ is concerned the Commission may adopt the standard international definition which recognizes an event to be a disaster if it results in death of 10 or more and/or injuries of 100 or more persons. Therefore lesser casualties should generally be beyond the purview of federal assistance, but in order that this stipulation does not harm the interests of the poor who are generally not covered by any social security system, a proviso may be added that a person living below poverty may still be eligible for assistance irrespective of the number of casualties in an incident. This proviso would be necessary to protect the interests of the poor as death or injury of even a single poor person may sometimes deprive the only bread earner in a family. 7.20 In so far as damage or destruction to property or environment is concerned there is no standard international guideline. Every country seems to follow its own practice according to its own wisdom. However, keeping

95
in view the provisions of the Act and the conditions prevailing in India, it is suggested that the following minimum conditions should be fulfilled for a disaster event to be recognized as resulting in ‘substantial damage’ to property:
a) complete damage of 5 or partial damage of 10 structures, or b) death of 10 milch/drought/other animals, or c) 50% damage of crop/plantation/ trees in majority of villages in at
least one development block of a district, or d) loss of 10 fishing boat/ canoe, or
7.21 Here again, this should be subject to the proviso that these minimum conditions may be further relaxed for a BPL family. The extent of such relaxation may be referred to an Expert Committee which, in any case, shall be required to be constituted to recommend revised norms of financial assistance. Quantifying minimum ‘substantial damage’ to environment would be a much more difficult task. This matter would require further consultations with experts and may therefore be referred to the Expert Committee. Holistic Management of Disasters 7.22 The Act defines disaster management as ‘a continuous and integrated process of planning, organizing, coordinating and implementing measures which are necessary or expedient for:
i) prevention of danger or threat of any danger ii) mitigation or reduction of risk of any disaster or its severity or
consequences iii) capacity building iv) preparedness to deal with any disaster v) prompt response to any threatening disaster situation or disaster vi) assessing the severity or magnitude of effects of any disaster vii) evacuation, rescue and relief viii) rehabilitation and reconstruction’
7.23 The Act goes on to define mitigation as ‘measures aimed at reducing the risk, impact or effects of a disaster or a threatening disaster situation’, preparedness as a ‘state of readiness to deal with a threatening disaster situation or disaster and the effects thereof ’, reconstruction as ‘construction
96
or restoration of a property after disaster’ and so on. The Act, therefore, attempts to define and deal with disasters in a holistic way, linking causes, both natural and man-made with impacts, including life, property and environment, and developing a management plan that includes not only the post disaster aspects of response, relief and reconstruction, but also the pre disaster aspects of prevention, mitigation and preparedness.
Role of Central Government
7.24 The Disaster Management Act 2005 has created a hierarchy of institutions at the national, state and district levels for holistic management of disasters. Therefore the Act formally abandons the notion that disaster management in India is the exclusive responsibility of the States with Central government only playing a supportive role. The definite role of the Central government in the management of disasters has been outlined in a number of Chapters and provisions of the Act 7.25 The National Disaster Management Authority (NDMA) with Prime Minister as Chairperson and 9 other members, one of them designated as Vice Chairperson, would be responsible for laying down the policies, plans and guidelines for disaster management for ensuring timely and effective response to disasters. More specifically, the National Authority is mandated to lay down policies, approve the national plan, approve plans of other ministries and departments, lay down guidelines for states and line ministries/departments, coordinate enforcement and implementation of policy and plans, recommend mitigation funding provisions and coordinate bilateral support to affected countries during disasters. The National Authority is also expected to frame guidelines for provision of minimum standards of relief, special provisions to be extended to widows and orphans and ex gratia assistance for restoration. 7.26 The NDMA is authorized to constitute an Expert Committee comprising of experts in the field of disaster management and having practical experience of disaster management at the national, state and district levels to suggest and recommend measures for different aspects of disaster management. 7.27 The Act provides for the constitution of a National Executive Committee under the chairmanship of the Union Home Secretary to assist the Authority in performance of its functions. The National Executive
97
Committee is mandated to implement the policies and plans of the NDMA and ensure the compliance of directions issued by the Union Government for the purpose of disaster management in the country. The National Executive Committee comprises of the Secretaries to the ministries/departments of agriculture, defence, drinking water supply, environment & forests, finance (expenditure), health, power, rural development, telecommunication, space, science & technology, urban development, water resources and the Chief of the Integrated Defence Staff of the Chiefs of Staff Committee, ex officio. 7.28 A National Plan for Disaster Management, focussing on disaster prevention and mitigation, measures for integration into the development plans, preparedness and capacity building measures, shall be prepared, by the National Executive Committee with regard to the National Policy, in consultation with the State Governments and other expert bodies/organizations. This plan has to be approved by the NDMA. 7.29 The Act defines the responsibilities of the Central government and further outlines the responsibilities of individual Ministries or Departments of Government of India in the holistic management of disasters, which include prevention of disasters, mitigation, preparedness and capacity building, integration of disaster risk reduction in development plans and projects, making available its resources for responding promptly and efficiently to any threatening disaster situation or disasters. 7.30 The Act has created a National Institute of Disaster Management (NIDM) to design, develop and implement training programmes, undertake research, formulate and implement a comprehensive human resource development plan, provide assistance in national policy formulation, assist other research and training institutes, state governments and other organizations for successfully discharging their responsibilities, develop educational materials for dissemination and promote awareness among stakeholders in addition to undertake any other function as assigned to it by the Central Government. NIDM is also required to network with various research and training institutions for sharing of knowledge and resources. 7.31 The Act has further set up a National Disaster Response Force under the general superintendence, direction and control of the NDMA as a specialist response to a threatening disaster situation or disaster. Role of State Government
98
7.32 A similar institutional structure has been created at the State level, with a State Disaster Management Authority (SDMA) under the chairpersonship of the Chief Minister for laying down disaster management plans and policies of the state, coordinate implementation, lay down guidelines, recommend provision of funds for mitigation and preparedness, review the measures taken for preparedness, mitigation and disaster risk reduction. 7.33 A State Executive Committee under the chairpersonship of the Chief Secretary and four secretaries of relevant departments would assist the SDMA in the performance of its functions and be responsible for implementing the National Plan and the State Plan and act as the coordinating and monitoring body for management of disasters in the state. The Committee will prepare the State Disaster Management Plan as per the guidelines laid down by the National Authority and consultations with stake-holders. Role of District Administration 7.34 Most of disaster management initiatives are operationalised at the district level. Recognising the need to create a strong implementing and coordinating body at the district level, the Act has provided for the creation of Disaster Management Authority (DDMA) in each of six hundred plus districts of the country under the co-chairpersonship of the District Magistrate and the President of the Zilla Parishad. The District Disaster Management Authorities shall act as the district planning, coordinating and implementing body for disaster management. They would be responsible for the preparation of district disaster management plan including district response plan, coordinate and monitor implementation of the national and state policies and plans and take all measures for the prevention and mitigation measures in the vulnerable areas of the district, give directions to departments for putting in place requisite measures, organize capacity building of the staff, facilitate community training and awareness, coordinate early warning and dissemination mechanisms, establish stockpiles of relief and rescue materials, ensure regular rehearsals, drills etc and communicate with the State Authority for effective disaster management.
Financial Provisions

99
7.35 The financial provisions of the Act are in keeping with the underlying aim of addressing disaster risk reduction through effective response and sustained prevention and mitigation measures in a holistic framework. The Act has made clear demarcations between response and mitigation funding, thereby acknowledging the inherent difference between expenditure requirements for response during and after disaster situations and mitigation during normal times. 7.36 At the national level, the Act has provided for constitution of two funds viz. National Disaster Response Fund and National Disaster Mitigation Fund. The National Disaster Response Fund, as specified in the Act, would be used for ‘meeting any threatening disaster situation or disaster.’ The Fund will comprise of two components, the majority from a corpus deposited by the Government after due ‘appropriation on the basis of a law made by Parliament’ and any other grants, donations made by any person or institution for the purpose of disaster management. The Response Fund would be available with the National Executive Committee, who would use it towards meeting the expenses for emergency response, relief and rehabilitation according to the guidelines laid down by the Government, in consultation with the National Authority. 7.37 The National Disaster Mitigation Fund has been provided exclusively for the purpose of mitigation and would be used only for mitigation projects. The corpus of the fund would be provided by the Central Government after due appropriation made by Parliament, by law. This fund would be applied by the National Authority. 7.38 The Act has also made provisions for similar funds at the State and district levels. The State Disaster Response Fund shall be available with the State Executive Committee for emergency response, relief and rehabilitation at the State level, while the State Disaster Mitigation Fund shall be made available to the State Disaster Management Authority for mitigation projects. 7.39 The Act enjoins upon the State Government has to create similar funds for the district level. The District Disaster Response Fund and the District Disaster Mitigation Fund would be made available to the District Authorities for response and mitigation purposes respectively. 7.40 The Act also mandates all Central and State government Ministries and Departments to make requisite provisions in its annual budget for
100
funding mechanisms for carrying out activities and programmes set out in their disaster management plans. In times of severe calamities, the Act authorises the Disaster Management Authorities at the national, state and district levels to sanction emergency procurement of materials or immediate application of resources for rescue and relief purposes, waiving off the standard procedures. Minimum Standards of Relief 7.41 The Act has mandated the NDMA to recommend guidelines for the minimum standards of relief to be provided to persons affected by disasters, which shall include minimum requirements to be provided in the relief camps in relation to shelter, food, drinking water, medical cover and sanitation, special provisions for widows and orphans, ex-gratia assistance on account of loss of life as also assistance on account of damage to houses and for restoration of means of livelihood and such other relief as may be necessary. 7.42 Similarly the SDMA has been mandated to lay down guidelines for providing minimum standards of relief to persons affected by disasters in the State. Such standards shall in no case be less than the standards laid down by the NDMA.
101
RESTRUCTURING DISASTER MANAGEMENT FUNDS
The Calamity Relief Fund (CRF) constituted on the recommendations of the Ninth Finance Commission and the National Calamity Contingency Fund (NCCF) set up on the recommendations of the Eleventh Finance Commission form the two pillars of financing disaster management in India. The mechanisms provided by these two funds have been well institutionalized in the federal administrative set up of the country. These have by and large met the immediate needs of relief and rehabilitation after natural calamities, although the issues of long term reconstruction after disasters still remains an unresolved issue.
8.2 The Disaster Management Act 2005, with its emphasis on holistic management of disasters, covering not only the post-disaster phases of response, relief and reconstruction, but also the pre-disaster phases of prevention, mitigation and preparedness has provided for the constitution of two separate funds to be known as Disaster Response Fund, Disaster Mitigation Fund at three levels - national, state and district levels. The Act is however, silent on how the existing funds shall be reconstituted into the new funds as proposed. Therefore, Thirteenth Finance Commission shall be expected to make specific recommendations with regard to the constitution of these funds. In fact, the terms of the reference of the Commission makes it very specific that the Commission shall “review the present arrangements as regards financing of Disaster Management with reference to the National Calamity Contingency Fund and the Calamity Relief Fund and the funds envisaged in the Disaster Management Act, 2005 and make appropriate recommendations thereon”.
National Disaster Response Fund
8.3 Section 46 of the Act makes the following stipulation regarding the constitution of National Disaster Response Fund (NDRF)
(1) The Central Government may, by notification in the Official Gazette, constitute a Fund to be called the National Disaster Response Fund for meeting any threatening disaster situation or disaster and there shall be credited thereto –
(a) an amount which the Central Government may, after due appropriation made by Parliament by law in this behalf provide;
102
(b) any grants that may be made by any person or institution for
the purpose of disaster management.
(2) The National Disaster Response Fund shall be made available to the National Executive Committee to be applied towards meeting the expenses for emergency response, relief and rehabilitation in accordance with the guidelines laid down by the Central Government in consultation with the National Authority.
8.4 Bare reading of this section makes it very clear that the NDRF shall be different from both NCRF and NCCF on the following grounds:
a) Whereas NCRF and NCCF has been constituted by the
Government of India by an executive order on the recommendations of the successive Finance Commissions, NDRF shall be a statutory fund and therefore, the amount provided on the fund shall be made available only after due appropriation made by the Parliament.
b) While CRF and NCCF are meant exclusively for the use of the
State Governments, NDRF shall be placed at the disposal of the National Executive Committee (NEC) compris ing of Secretaries in charge of 15 Ministries/Departments of Government of India, and Chief of the Integrated Defence Staff under the Chairmanship of Union Home Secretary. Nothing in the Act prohibits NDRF to be used by the Central government.
c) CRF comprises of contributions of the Central and the State
Governments at the ratio of 3:1 and the NCCF comprises of additional resources mobilized by the Government of India through surcharge imposed on good. The NDRF shall comprise of two sources : (i) the amount provided by the Central Government after due appropriation made by Parliament and (ii) any grants that may be made by any person or institution for the purpose of the disaster management. Therefore NDRF shall not have any State contribution and more interestingly it may receive contributions from individuals, groups, corporates and even foreign donors.
d) The operational guidelines of CRF and NCCF were issued by the
Ministry of Finance on the recommendations of the Finance Commission and the norms of expenditure are sanctioned by the Ministry of Home Affairs on the recommendations of the Expert Committee as suggested by the Finance Commission. As per the

103
Disaster Management Act, 2005, the NDRF shall be operated on the basis of guidelines laid down by the Central Government in consultation with the National Disaster Management Authority (NDMA).
8.5 Therefore, the moot question for consideration of the Thirteenth Finance Commission is how shall the NDRF be constituted and what will be the status of the NDRF vis-à-vis CRF and NDRF. This issue came up for discussion at the stage when Disaster Management Bill was still under consideration. The Draft Bill prepared by the MHA in consultation with the Ministry of Law and Justice was referred to the Group of Ministers (GOM) under the Chairmanship of the Minister of Defence. The Group of Ministers in the meeting held on 10th April, 2005, made the following observations regarding the constitution of these funds :-
‘The Bill provides for creation of a National Disaster Mitigation Fund and a National Disaster Response Fund. The proposed National Disaster Mitigation Fund will provide funding for projects addressing mitigation and, therefore, is appropriate. Convergence of the NCCF and CRF with the National Disaster Response Fund and State Disaster Response Fund will ensue, after the law is enacted, over a period of time.’
8.6 Therefore, it is clear that NCCF shall be subsumed with the NDRF as and when it is constituted, while CRF shall be merged with the State Disaster Response Fund (SDRF). The constitution of the NDRF is yet to be notified by the Government. The Ministry of Finance was of the opinion that the NDRF should be constituted only after the submission of the report of the Thirteenth Finance Commission, to avoid confusions regarding operation of parallel funds of NCCF and NDRF at the same time, as the CRF and NCCF have their life span, as recommended by the Finance Commission, which is an authority created under the Constitution of India . However, the Ministry of Home Affairs went ahead with its proposal for the constitution of the NDRF on the following grounds:
i) It has become the mandatory requirement of law to constitute these funds under Section 46 of the Act.
ii) The NCRF/NCCF covers only 10 notified national
calamities recommended by the Finance Commission viz. cyclone, drought, avalanche, fire, tsunami, hailstorm, earthquake, landslide, pest attack and cloud burst whereas

104
Disaster Management Act provides for all types of calamities, catastrophe, mishap or grave occurrence arising from natural and manmade causes, or by accident or negligence necessitating financial provisions for management of the disasters for which no financial arrangement is available at present.
iii) Constitution of the State Disaster Response Fund (SDRF)
and District Disaster Response Fund (DDRF) have already been notif ied on 1st August, 2007 and therefore the constitution of NDRF by the Government of India has become necessary.
iv) The NEC has been assigned certain definite functions and
responsibilities under the Act which would require funds to be placed at its disposal.
v) Voluntary contributions received from individuals as well as
institutions as provided in the Act can be mobilized only when the NDRF is constituted.
8.7 The Cabinet has approved the constitution of the NDRF with an initial corpus of Rs. 100 crore to be provided under the Non-Plan Head. The fund has not been constituted as yet as the accounting procedure to be followed including operation of minor head of account would require consultation with the Comptroller General of Accounts. It is likely that the NDRF shall be constituted in the near future and therefore, from the date of notification of constitution of NDRF till 31 March 2010, two parallel funds - NDRF with an initial corpus of Rs. 100 crore and the NCCF as it exists at present - shall continue, with the difference that the NDRF shall be utilized only to meet the expenses to be incurred by the NEC while the NCCF shall be utilized exclusively for meeting the expenses of the State Governments over and above the funds allocated under CRF as per the procedure already laid down for this purpose.
8.8 Merging the NCCF with NDRF with effect from 1 April 2010 would not be difficult. However operationalization of the NDRF would require the specific guidelines to be formulated. As per the Disaster Management Act the guidelines in this regard shall be laid down by the Central Government in consultation with the National Disaster Management Authority. The National Disaster Management Authority has sent Draft Guidelines for Application of National Disaster Response Fund for the consideration of the Government. Copy of the draft

105
Guideline is Annexed -X . The draft guideline is a poor imitation of the existing guidelines on NCCF with some difference, as under:
a) In addition to the 10 natural calamities already notified by the Finance Commission, NDRF should be available for Chemical, Biological, Radiological and Nuclear (CBRN) emergencies/ disasters.
b) NDRF shall be a non-plan fund in Public Account contributed by
(a) Central government by appropriations and (b) individuals or institutions whether by domestic or foreign donors, as stipulated under section 46 of the Act.
c) In the event the State government finding it difficult to manage the
disasters within the resources available in the SDRF, the State government may approach the Central government for seeking assistance under the NDRF.
d) An Inter-Ministerial Central Team with representations from
Planning Commission and NDMA shall visit the State for on-the-spot verification and discussion with the State government at the appropriate levels and report within a fortnight along with its recommendations to NEC.
e) The report will be considered by the NEC which after due
deliberations will finalize its recommendations to the High Level Empowered Committee (HLEC) for release of funds out of NDRF.
f) The HLEC under the Chairmanship of Union Agriculture Minister
and Home Minister, Finance Minister, Deputy Chairman Planning Commission and Vice Chairman, NDMA as Members will review the recommendations of the NEC and finalize its recommendations to be referred to Cabinet for approval.
g) After the proposal is approved by the Cabinet, necessary funds will
be released to the concerned States. It will be desirable that such ‘on account’ relief/assistance is made available to the affected States within a maximum of two months of occurrence of disaster, pending consideration of total amount to be released to the affected States.
h) State government will give information regarding time frame in
which various contracts will be concluded for award of work by the

106
State government authorities with respect to damaged infrastructure such as roads, bridges, drinking water supply, primary education centres, community assets owned by Panchayats etc.
i) The proposed sanctioned amount from out of NDRF will be
released in two instalments- the first instalment being 75% of the sanctioned amount. Thereafter, on receipt of certificate for having incurred the expenditure upto 75%, the balance 25% will be released.
j) State governments receiving the funds from NDRF will render
monthly reports till all works are completed duly indicating the amounts released, expenditures incurred and balance available under each sub-head. These reports will include the progress of work in the district/town where rehabilitation work has been undertaken.
k) The State governments will carry out independent evaluation of
relief efforts to ensure that relief has reached the target groups. 8.9 The guidelines of the NDMA is completely blank on the issue whether NDRF shall be used by the NEC for meeting the expenses of the Central government. NCCF was meant for the exclusive use of the States and it was never used by the Centre , but NDRF is going to be launched soon with an initial corpus of Rs. 100 with a clear understanding the fund may also be used by the Central government for discharging the functions entrusted to the NEC. What are the functions of NEC that would require special funding arrangements out of NDRF over and above budgetary allocations available to various nodal Ministries and Departments of Government of India? The Disaster Management Act 2005 has entrusted the following powers and functions to the NEC:
Section10. Powers and Functions of National Executive Committee - (1) The National Executive Committee shall assist the National Authority in the discharge of its functions and have the responsibility for implementing the policies and plans of the National Authority and ensure the compliance of directions issued by the Central Government for the purpose of disaster management in the country.
(2) Without prejudice to the generality of the provisions contained in sub -section (1), the National Executive Committee may-
(a) act as the coordinating and monitoring body for disaster management; (b) prepare the National Plan to be approved by the National Authority;
107
(c) coordinate and monitor the implementation of the National Policy; (d) lay down guidelines for preparing disaster management plans by
different Ministries or Departments of the Government of India and the State Authorities;
(e) provide necessary technical assistance to the State Governments and the State Authorities for preparing their disaster management plans in accordance with the guidelines laid down by the National Authority;
(f) monitor the implementation of the National Plan and the plans prepared by the Ministries or Departments of the Government of India;
(g) monitor the implementation of the guidelines laid down by the National Authority for integrating of measures for prevention of disasters and mitigation by the Ministries or Departments in their development plans and projects;
(h) monitor, coordinate and give directions regarding the mitigation and preparedness measures to be taken by different Ministries or
Departments and agencies of the Government; (i) evaluate the preparedness at all governmental levels for the purpose of
responding to any threatening disaster situation or disaster and give directions, where necessary, for enhancing such preparedness;
(j) plan and coordinate specialised training programme for disaster management for different levels of officers, employees and voluntary rescue workers;
(k ) coordinate response in the event of any threatening disaster situation or disaster;
(l) lay down guidelines for, or give directions to, the concerned Ministries or Departments of the Government of India, the State Governments and the State Authorities regarding measures to be taken by them in response to any threatening disaster situation or disaster;
(m) require any department or agency of the Government to make available to the National Authority or State Authorities such men or material resources as are available with it for the purposes of emergency response, rescue and relief;
(n) advise, assist and coordinate the activities of the Ministries or Departments of the Government of India, State Authorities, statutory bodies, other governmental or non-governmental organisations and others engaged in disaster management;
(o) provide necessary technical assistance or give advice to the State Authorities and District Authorities for carrying out their functions under this Act;
(p) promote general education and awareness in relation to disaster management; and
(q) perform such other functions as the National Authority may require it to perform.
8.10 None of these functions would probably require special funding arrangements. The closest function that may require some funding support is to ‘coordinate response in the event of threatening disaster situation’ (k), ‘advise, assist and coordinate’ activities government and non-governmental organisations’ (n) and ‘promote general education and

108
awareness in relation to disaster management’ (p) but funding arrangements can very well be made by the concerned Ministries and Departments of government of India, which under section of 35(2) (c) and (d) of the Act are mandated to
(c) ensure appropriate allocation of funds for prevention of disaster, mitigation, capacity-building and preparedness by the Ministries or Departments of the Government of India; and (d) take necessary measures for preparedness to promptly and effectively respond to any threatening disaster situation or disaster;
8.11 In fact, various Ministries and Departments of Government have budgetary provisions under Plan and non-Plan heads for disaster management under their respective jurisdictions, as mentioned in papa 7.2 of this report. If the allocations are inadequate these can always be enhanced through appropriations, but probably it may not be appropriate to vest separate fund to the NEC in the discharge of its functions as NEC would always be performing through the concerned Ministries of the government which have budgets allocated to them for the discharge of their functions. It would be against the fundamental principles of budgeting to allocate funds for the use of a Committee even if it has been constituted under an Act. Therefore the NEC, which is basically a coordinating and planning mechanism should work through the Ministries and Departments which are represented in it and if certain common or residual functions which are not attended by any individual Ministry may be performed by the Ministry of Home Affairs for which necessary funds may be provided in the Ministry’s budget. Since a decision has already been taken by the Cabinet to provide a corpus of Rs. 100 crores in the NDRF for meeting expenses of the NEC, the Finance Commission may take an appropriate view whether the corpus should be continued for meeting the requirement of the NEC or it should be used exclusively for the needs of the States in the manner NCCF is being used at present. 8.12 It is suggested for consideration that a part of NDRF may be invested as premium for catastrophic reinsurance or catastrophic bond for meeting the needs of large scale reconstruction after major disasters. At present funds for post-disaster reconstruction are provided in an ad hoc manner through additional central assistance or raising loan from multi-lateral funding institutions, which are always uncertain and takes considerable time. Catastrophic reinsurance would enable the government to cover the risks of major disasters with a relatively long return period in a cost effective manner. This has been discussed separately in chapter 11 of the report.

109
8.13 The Act provides that NDRF would be raised either through appropriations made by Parliament or contributions made by ‘any person or institution’. An initial corpus of Rs. 100 crores has already been approved by the government. This may be raised to Rs. 1000 crores with effect from 1 April 2010. Thereafter the corpus shall be mobilized through additional excise duty or surcharge on goods or services in a manner that be prescribed in the Union budget. 8.14 Guidelines would also require to be formulated for receiving contributions from persons or institutions. Such contributions may be received by cheques, drafts or pay order drawn in favour of the Chairperson of the NEC or through direct money transfers to the account of the NEC. Such contributions may also be accepted from foreign nationals and institutions including international organizations and multi-lateral financial organizations, subject to the provisions of Foreign Contributions (Regulation) Act. All such contributions shall be transferred to the appropriate interest bearing Public Account of the Government of India or invested in securities in a manner that the Ministry of Home Affairs in consultation with Ministry of Finance may prescribe.
State Disaster Response Fund
8.15 Section 48 of the Disaster Management Act provides that
(1) The State Government shall, immediately after notifications issued for constituting the State Authority and the District Authorities, establish for the purpose of this Act the following funds, namely:
(a) the fund to be called the State Disaster Respon se Fund; (b) the fund to be called the District Disaster Response Fund (c) the fund to be called the State Disaster Mitigation Fund; (d) the fund to be called the District Disaster Mitigation Fund;
(2) The State Government shall ensure that the funds established –
(i) under clause (a) and (c) of sub-section (1) is available to the State Executive Committee;
(ii) under clause (b) and (d) of sub-section (1) is available to the District Authority.
8.16 The notification for constituting the State Authorities and the District Authorities were issued by the Government of India of 1 st August, 2007 and therefore the State Governments are under the statutory obligations to constitute these funds immediately. However, none of the States except Uttarakhand has constituted the funds. The arguments

110
advanced by the State Governments for not constituting the funds are as under:-
a) Since the CRF and NCCF shall be in existence till 31st March,
2010, constitution of separate funds at this stage would create considerable confusions.
b) The Thirteenth Finance Commission has already been asked to
examine the future of CRF and NCCF vis-à-vis the new funds proposed to be constituted under the Act and therefore, it would be prudent to wait for the recommendations of the Commission.
c) The State Governments do not have additional resources for
constituting these funds at the State and the district levels and therefore, unless there is additional devolution of funds from the Centre, these new funds cannot be constituted.
8.17 There does not seem to be any confusion regarding the constitution of the SDRF. As mentioned in para 8.5 above a policy decision has already been taken at the highest level that the CRF would be merged with the SDRF. There is no difference of opinion within the Central government and between the Central and State governments on this issue. Therefore, w.e.f. 1.1.2010 CRF shall cease to exist and the allocations recommended by the Thirteenth Finance Commission to the States for meeting expenditure of relief shall be credited to the SDRF. The scheme for the management of SDRF shall be notified by the Ministry of Finance in the same manner as the CRF scheme is notified for the five year fiscal cycle, with such amendments as are warranted by the provisions of the Disaster Management Act.
8.18 The Act provides that the SDRF shall be available to the State Executive Committee (SEC) under the chairmanship of the Chief Secretary of the State . Therefore the SEC shall take over the functions of the State Level Committee under the chairmanship of Chief Secretary which is responsible for the management of the CRF at present. 8.19 Ideally SDRF should be operationalised with effect from 1 April 2010 when the recommendations of the Thirteenth Finance Commission shall come in effect. However, section 48 of the Disaster Management Act stipulates that the State governments shall establish the Fund immediately after the State and the District Authorities are constituted by the Government of India. The notification constituting these Authorities was issued on 1 August 2007, but except Uttarakhand none of the States

111
has established the Fund. CRF can not be converted as SDRF immediately as it has its life defined by the Commission till 31 March 2010. In order that the legal difficulties in this regard are overcome the Ministry of Home Affairs may advise the State governments to establish the SDRF with a token amount, but effectively Central allocations to the SDRF shall start flowing only from the financial year 2010-11.
District Disaster Response Fund
8.20 Constitution of the District Disaster Response Fund (DDRF) has been stipulated in section 48 of the Act quoted above. None of the State Governments except the Government of Uttarakhand has constituted the DDRF. Most of the State Governments have not been able to make up their minds as to how to constitute the DDRF and they would probably be looking for guidelines from the Thirteenth Finance Commission.
8.21 The Finance Commission does not have jurisdiction to recommend further devolution of funds from the State to the Districts as under Article 243 (G) of the Constitution such powers vest with the State Legislature. However, the Commission may lay down the broad guidelines regarding the constitution and operationalization of the DDRF, on the following grounds:
a) The Commission has the Presidential mandate to review the entire gamut of financing of disaster management with reference to the all the funds envisaged in the Disaster Management Act, 2005 and make appropriate recommendations.
b) Unlike the NDRF, the Act has not prescribed that guidelines
regarding the constitution and operationalization of the DDRF shall be issued by the Central government in consultation with the National Disaster Management Authority.
c) The Act has not entrusted this responsibility either to the State
Disaster Management Authority or to the State Executive Committee.
d) More than 80% of such funds are spent in the districts and
therefore, in the final analysis, the efficacy of the entire financial arrangements for disaster management shall depend to a large extent on how the DDRF shall be utilised.
112
8.22 The Act is completely silent on how the DDRF shall be constituted or how the funds credited to the DDRF shall be utilised. The only provision that the Act makes is that the DDRF shall be established by the State government and that it shall be made available to the District Disaster Management Authority. Therefore the Commission may lay down the basic guidelines regarding the constitution and management of the DDRF. These guidelines are suggested as under:
a) The DDRF shall comprise of funds allocated to a district by the SEC on the basis of expenditure incurred on response, relief, rehabilitation and reconstruction during the past five years.
b) Such funds shall be released by the Finance Department of the
State with the prior approval of the SEC in two instalments during April and October provided that the second instalment shall be released only after 80% of the first instalment has been exhausted and that detailed expenditure statement in the manner prescribed has been submitted to the SEC and the Finance Department.
c) The funds shall be released under Account Head 2245 and shall be
operated through the district treasury.
d) In case the funds allocated to a district is not adequate it shall demand additional fund with detailed justifications for the consideration and decision of the SEC.
e) Expenditure from DDRF shall be incurred strictly as per the norms
to be prescribed for this purpose.
f) The expenditure incurred out of DDRF shall be monitored through a computerised tracking system to be developed for this purpose.
g) The accounts of the DDRF shall be audited every year.
8.23 On the basis of these basic guidelines further detailed guidelines shall be laid down by the Ministry of Home Affairs in consultation with Ministry of Finance.
Disaster Mitigation Funds
8.24 Section 47 of the Act makes the following stipulation regarding the constitution of National Disaster Mitigation Fund (NDMF):
113
(1) The Central government may, by notification in the Official Gazette, constitute a Fund to be called the National Disaster Mitigation Fund and there shall be credited thereto such amount which the Central Government may, after due appropriation made by Parliament by law in this behalf, provide; (2) The National Disaster Mitigation Fund shall be applied by the National Authority.
8.25 Likewise the constitution of the State Disaster Mitigation Fund (SDMF) and State Disaster Mitigation Fund (DDMF) has been prescribed under section 48 of the Act. The NDMF is yet to be constituted by the Central government, whereas the SDMF and DDMF were supposed to have been established immediately after the constitution of the State and District Authorities on 1 August 2007. However none of the States except Uttarakhand has constituted the SDMF and DDMF. 8.26 The Act defines mitigation to include ‘measures aimed at reducing the risk, impact or effects of a disaster or threatening disaster situation’. Such measures shall typically include both structural mitigation measures such as flood protection works or cyclone shelters or retrofitting of lifeline buildings and non-structural measures like early warning, capacity building, land use and zoning regulations, community based preparedness etc. But mitigation may also consist of various measures that directly or indirectly contribute to the reduction of risks of vulnerable population and areas such as poverty alleviation, food security, livelihood generation, environmental protection etc. Therefore mitigation measures are essentially in the nature of developmental works which are to be normally funded out of the Plan budget of the Ministries or Departments of Government. However, there does not seem to be any clear thinking, much less a consensus, on the nature, composition, scope and quantum of Mitigation Fund that would be established at National, State and District levels. The High Power Committee (HPC) on Disaster Management had recommended that at least 10 per cent of plan funds at the national, state and district levels should be earmarked and apportioned for schemes which would specifically address areas such as prevention, reduction, preparedness and mitigation of disasters. The Eleventh Finance Commission considered the issue at length and concluded that these can not be funded either out of the National Calamity Relief Fund or National Contingency Fund. The Commission recommended that
a) Expenditure on restoration of infrastructure and other capital assets, except those that are intrinsically connected with relief

114
operations and connectivity with the affected area and population, should be met from the plan funds on priority basis.
b) Medium and long-term measures should be devised by the
concerned Ministries of the Government of India, the State Governments and the Planning Commission to reduce, and if possible, eliminate, the occurrences of these calamities by undertaking developmental works.
c) The Planning Commission, in consultation with the State
Governments and concerned Ministries, should be able to identify works of a capital nature to prevent the recurrence of specific calamities. These works may be funded under the Plan.
8.23 Conceptually there may be three alternative approaches for the constitution of the National Disaster Mitigation Fund (NDMF):
a) First, the NDMF may comprise of all the existing and future Plan schemes which fulfil the definition of ‘mitigation’ under the Act. The Planning Commission has furnished a list of 155 Central Sector or Centrally Sponsored Schemes that may have some direct, indirect elements of risk mitigation or that may contribute to risk mitigation in the long run. The total allocations under these schemes during 2006-07 was of the order of Rs. 71996.78 crores. These schemes are implemented by a large number of Ministries and Departments of the Central and State governments. The details of these schemes are provided in Annexure - XII. Pulling these schemes together from the existing arrangements under a common Mitigation Fund is neither feasible nor desirable and therefore this option may be rejected outright. However this approach may give a good idea about the total investment that the country is making on mitigation, avoid duplicities and promote better synergies among the agencies of the government working on similar or related fields.
b) Second, the NDMF may consist of a fixed percentage of total
plan allocation which shall be spent only on mitigation activities that are not covered under any of the existing plan schemes. This may typically comprise of a certain percentage of the plan allocations of a Ministry or Department. HPC had recommended that 10% of plan fund of all relevant Ministries may be spent on mitigation. The Planning Commission had in one stage suggested that 0.5% of the total Plan allocation of each Ministry may be

115
earmarked for National Mitigation Fund. Considering that Eleventh Plan has total allocation of Rs. 1096,860 crores under the central sector, an amount of Rs. 5484.43 crores shall be the total corpus of National Mitigation Fund for a five year period. This has however not been reflected in the final document in the Eleventh Five Year Plan (2007-12).
c) Third, the NDMF may consist of certain amount placed at the
disposal of the National Disaster Management Authority which may be utilized for mitigation measures of a residual nature, which are inter-Ministerial or inter-State in nature and which are not attended by any Central Plan scheme. The Working Group of P lanning Commission on Disaster Management for the Eleventh Five year Plan identified twelve disaster mitigation schemes for funding under NDMF:
Table-8.1 Suggested Projects/Programmes/Schemes proposed under NDMF
No. Name of the Project/Programme/Scheme Rs. Cr 1 Strengthening of Fire Services 3636 2 National Cyclone Risk Mitigation Project 1642 3 National Earthquake Risk Mitigation Project 1132 4 National Flood Mitigation Project 2000 5 National Landslide Mitigation Project 200 6 Expanded Disaster Risk Mitigation Project 450 7 National Disaster Communication Network 450 8 Information, Education & Community Programme 100 9 Micro Zonation of Major cities 250 10 Project Preparation Facility/ Research Studies 50 11 Vulnerability Assessment Schemes 50 12 International Cooperation 10 13 Medical Preparedness for Mass Casualties Management 10000 14 National School Safety Project 1000 15 Dissemination of Early Warning to Communities 250 16 Preparedness & Response for Nuclear Emergencies 100 17 Upgradation of NIDM and other Institutes 60 Total 21380
These were noted in the Eleventh Plan documented, but an ad hoc allocation of only Rs. 300 crores has been made for disaster mitigation for the plan period. 8.24 The Eleventh Five Year P lan, developed on the immediate aftermath of the notification of the Disaster Management Act, provided a good opportunity for defining the Disaster Mitigation Fund at the National, State and District levels, but the Plan refrained from doing so,
116
but it made a significant policy statement regarding financing disaster mitigation:
It is important that a portion of the Plan funds is earmarked for efforts that directly or indirectly help in disaster management. Ideally, each project should provide adequately for the disaster mitigation and management expenditure that is identified by the appraisal process described in the previous section as being necessary. In addition, Central and State Governments may, depending upon their own hazard assessments, earmark a suitable and adequate amount for disaster mitigation schemes that are implemented over a definite time period.1
8.25 Therefore the initiative has been left to the Central and State governments, which themselves are looking for some guidelines for the constitution of the NDMF, SDMF and DDMF. The terms of reference of the Thirteenth Finance Commission requires the Commission to look into the constitution of these Funds as well. However the Commission can not make any recommendation regarding the funds that would devolve to these entities, which is to be decided essentially by the Ministry of Home Affairs in consultation with the Planning Commission, National Disaster Management Authority and the Ministry of Finance. Taking various factors into consideration the Commission may recommend the following guidelines regarding the constitution of these Funds:
a) The National Disaster Mitigation Fund shall be placed at the disposal of National Disaster Management Authority for implementation of disaster risk mitigation schemes of a residual nature which are not being implemented by the Central Ministries or the State governments at present. The procedure for approval of the scheme, quantum of funds required for implementation and the manner of implementation shall be decided as per existing rules formulated by the Ministry of Finance in this regard.
b) The State Disaster Management Fund shall consist of such fund as
may be released out of the NDMF or allocated by the State government for mitigation of disaster risks of a residual nature which are not being attended under any existing scheme. Such funds shall be placed at the disposal of the State Disaster Management Authority which shall be responsible for the formulation of the scheme and its implementation as per procedure to be laid down by the State government in this regard.
1 Eleventh Five Year Plan, Chapter 9, page -214.

117
c) The District Disaster Management Fund shall consist of such fund as may be released out of the NDMF or SDMF or allocated by the State government for mitigation of disaster risks of a specific nature which are not being attended under any existing scheme being implemented in the district. Such funds shall be placed at the disposal of the District Disaster Management Authority which shall be responsible for the formulation of the scheme and its implementation as per procedure to be laid down by the State government in this regard.

118
INSTITUTIONAL MECHANISM
The institutional mechanism for constitution and operationalization of CRF and NCCF had been well established at the Central and State Governments. With the entry of Disaster Management Act 2005 and the constitution of new institutional mechanism at the Central, State and district levels such as the National Disaster Management Authority (NDMA), National Executive Council (NEC), State Disaster Management Authority (SDMA), State Executive Council (SEC) and District Disaster Management Authority (DDMA) and the constitution of the Disaster Response Funds and Disaster Mitigation Funds at the national, state and district levels a new set of operational guidelines shall be required for the guidance of these new institutions.
9.2 It is suggested that the following broad principles may be laid down by the Thirteenth Finance Commission on the basis of which detailed guidelines shall be formulated by the Ministry of Finance and the Ministry for the operationalization of the Funds:
a) After the Finance Commission submits its recommendation to the Government, the Ministry of Finance (Department of Expenditure) shall prepare a scheme for the operationalization of the National Disaster Response Fund for the next five years on the basis of recommendation of the Finance Commission and in consultation with the National Disaster Management Authority as provided under section 46(2) of the Act.
b) The Ministry of Finance (Department of Expenditure) shall
similarly prepare a scheme for the operationalization of the State Disaster Response Fund for the next five years on the basis of recommendations of the Finance Commission.
c) The Ministry of Home Affairs, Government of India shall issue
notification in the Official Gazette for the constitution of the National Disaster Response Fund in terms of section 46 of the Disaster Management Act, unless this has already been constituted.
d) The State Governments shall issue notifications in the Official
Gazette for the establishment of the State Disaster Response Fund and District Disaster Response Fund in terms of section 48 of the Disaster Management Act, unless this has already been established.

119
e) The Ministry of Home Affairs, Government of India being the
nodal the Ministry in-charge of disaster management shall issue necessary notification on the items and norms of expenditure admissible under the NDRF and SDRF on the basis of the recommendations of the Commission and scheme prepared by the Ministry of Finance.
f) The Ministry of Finance (Department of Expenditure) shall release
the share of the Central Government to the SDRF in two separate instalments, during April and October in each financial year in the manner prescribed under the scheme at (b) above.
g) The National Executive Committee shall consider the proposals
from the State governments for central assistance under NDRF in the manner prescribed under the scheme at (a) above.
h) The National Executive Committee shall consider the proposals for
other uses of the NDRF in the manner prescribed under the scheme at (a) above.
i) The State Governments shall release funds to the DDRF and other
agencies of the government from the SDRF in the manner prescribed under the scheme at (b) above.
j) The District Disaster Management Authority shall utilize the
DDRF as per the guidelin es of the scheme at (a) and the norms at (f) above.
k) The State Executive Committee shall monitor the utilization of
SDRF and DDRF in the respective States.
l) The Ministry of Home Affairs, Government of India shall monitor the implementation of both the scheme.
120
PRINCIPLES OF ALLOCATION OF FUND
The Finance Commissions have broadly followed the following
principles to determine the composition, use and allocation of CRF and NCCF to the States:
a) CRF to be shared at a ratio of 3:1 by the Centre and the States
shall be available to the States only for the immediate relief to the affected population and restoration of public facilities damaged by natural calamities.
b) The long term needs of rehabilitation and reconstruction shall
be met from plan fund or other sources.
c) If CRF is inadequate for managing disaster in particular State it can seek Central assistance from the NCCF which shall be raised by the Central government through taxation but available to the States only as per CRF norms.
d) The quantum of fund allocated to the States under CRF shall be
determined on the basis of the following principles:
a. The total expenditure incurred by the States from CRF under the ‘Head 2245 - Relief on Account of Natural Calamity’ for the past ten years is aggregated at current price and average expenditure of one year is worked out.
b. The annual rate of inflation of five percent is added for
each year upto the next five year cycle for which the recommendations are made.
c. Weightage of certain percentage of the aggregate size of
the CRF is given to a few low income States.
10.2 Critiques have found fault in these principles on the following grounds:
a) Allocation of funds on the basis of expenditures incurred by the
States favours the richer and better administered States that have higher spending capacities. The States like Gujarat, Maharastra, Tamil Nadu, Rajasthan and Andhra Pradesh have been the major

121
beneficiaries of CRF allocations, while the poor States like Assam, Bihar, Orissa, Madhya Pradesh, Uttar Pradesh etc which are more prone to disasters but have spent inadequately on calamity relief have been discriminated. These States have been ‘trapped in a vicious cycle - because of low expenditures in the past, the size of the CRF for such States turns out to be low, which in turn, constrains their ability to spend on relief in future’1
b) Allocation of funds on the basis of expenditure ignores the
differences of the States in terms of area or population or both , which bestows differential responsibilities to the States. Large States like Karnataka, Madhya Pradesh and Uttar Pradesh feel discriminated on these counts.2
c) Figures on per capita expenditure on disaster relief across States
and per capita allocations of CRF among States present a highly asymmetric distribution with regard to the needs of the States. During 1990-2008 all India average of annual per capita expenditure on relief was Rs. 31.9 , but the range of difference among States was as wide as Rs. 109.2 in Gujarat and Rs. 10.8 in Bihar. The per capita allocation of CRF presented similar inequities – all India average Rs. 18.6, Gujarat Rs.32 and Bihar Rs. 9.2. The horizontal and vertical inequities among States which should have been corrected by fiscal transfers have been perpetuated by the Finance Commission.3
d) The principle that CRF/NCCF allocations shall be available only
for immediate relief and restoration and not for long term reconstruction has created a wide gap between the needs of post-disaster reconstruction and availability of resources with the States. Although this gap has been sought to be bridged to some extent in an ad hoc manner after major disasters through the mechanism of additional central assistance or external assistance, the gap persists widely which makes the areas and population affected by disasters more vulnerable to disasters in future.4
1 Sarat Das and Nandan Jha, Natural Disasters and Relief Provisions in India: Commitments and Ground Realities , Centre for Budget and Governance Accountability, 2004, page 33. 2 Presentation made by the Government of Karnataka at the National Conference on Financing Disaster Management held on 2 July 2008. 3 JTCDM Working Paper Series, Public Policy and Provisioning Towards Natural Disasters in India: Some Issues and Concerns with Specific Focus on the Calamity Relief Fund, Tata Institute of Institute of Social Sciences, 2008. 4 S. Parasuraman and P.V.Unnikrishnan eds, India Disaster Report: Towards a Policy Initiative, 2000
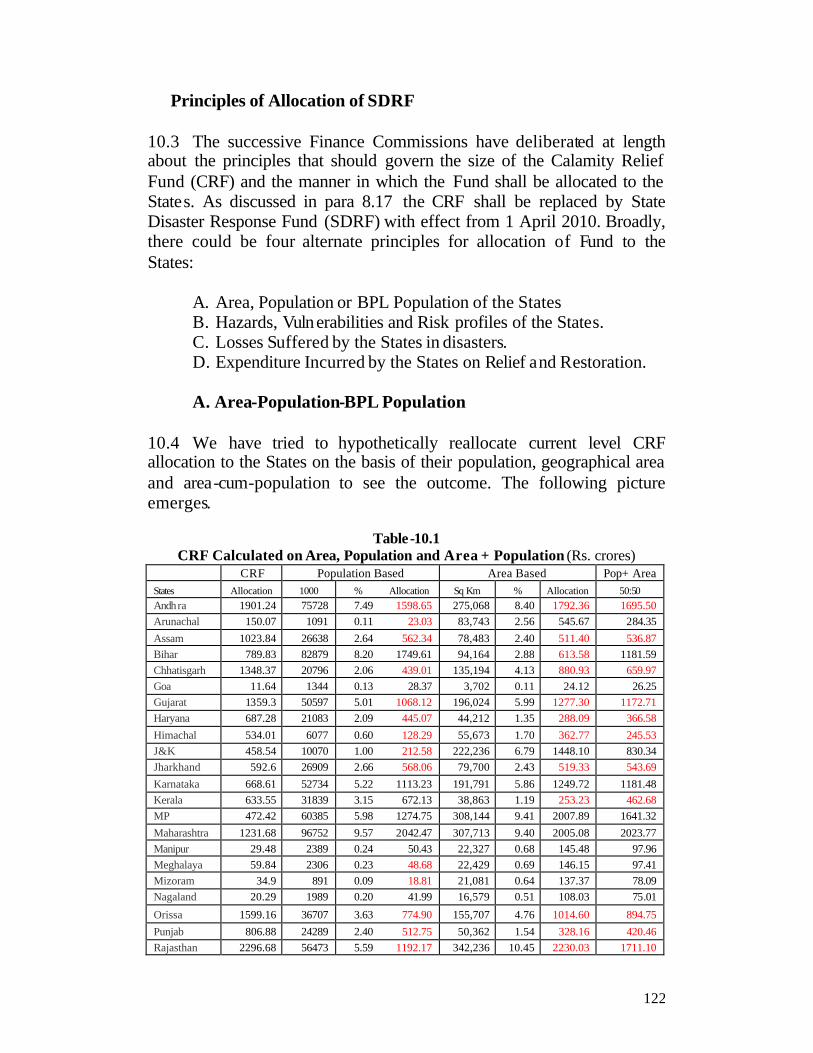
122
Principles of Allocation of SDRF 10.3 The successive Finance Commissions have deliberated at length about the principles that should govern the size of the Calamity Relief Fund (CRF) and the manner in which the Fund shall be allocated to the States. As discussed in para 8.17 the CRF shall be replaced by State Disaster Response Fund (SDRF) with effect from 1 April 2010. Broadly, there could be four alternate principles for allocation of Fund to the States:
A. Area, Population or BPL Population of the States B. Hazards, Vulnerabilities and Risk profiles of the States. C. Losses Suffered by the States in disasters. D. Expenditure Incurred by the States on Relief and Restoration.
A. Area-Population-BPL Population
10.4 We have tried to hypothetically reallocate current level CRF allocation to the States on the basis of their population, geographical area and area-cum-population to see the outcome. The following picture emerges.
Table-10.1
CRF Calculated on Area, Population and Area + Population (Rs. crores) CRF Population Based Area Based Pop+ Area States Allocation 1000 % Allocation Sq Km % Allocation 50:50 Andhra 1901.24 75728 7.49 1598.65 275,068 8.40 1792.36 1695.50 Arunachal 150.07 1091 0.11 23.03 83,743 2.56 545.67 284.35 Assam 1023.84 26638 2.64 562.34 78,483 2.40 511.40 536.87 Bihar 789.83 82879 8.20 1749.61 94,164 2.88 613.58 1181.59 Chhatisgarh 1348.37 20796 2.06 439.01 135,194 4.13 880.93 659.97 Goa 11.64 1344 0.13 28.37 3,702 0.11 24.12 26.25 Gujarat 1359.3 50597 5.01 1068.12 196,024 5.99 1277.30 1172.71 Haryana 687.28 21083 2.09 445.07 44,212 1.35 288.09 366.58 Himachal 534.01 6077 0.60 128.29 55,673 1.70 362.77 245.53 J&K 458.54 10070 1.00 212.58 222,236 6.79 1448.10 830.34 Jharkhand 592.6 26909 2.66 568.06 79,700 2.43 519.33 543.69 Karnataka 668.61 52734 5.22 1113.23 191,791 5.86 1249.72 1181.48 Kerala 633.55 31839 3.15 672.13 38,863 1.19 253.23 462.68 MP 472.42 60385 5.98 1274.75 308,144 9.41 2007.89 1641.32 Maharashtra 1231.68 96752 9.57 2042.47 307,713 9.40 2005.08 2023.77 Manipur 29.48 2389 0.24 50.43 22,327 0.68 145.48 97.96 Meghalaya 59.84 2306 0.23 48.68 22,429 0.69 146.15 97.41 Mizoram 34.9 891 0.09 18.81 21,081 0.64 137.37 78.09 Nagaland 20.29 1989 0.20 41.99 16,579 0.51 108.03 75.01
Orissa 1599.16 36707 3.63 774.90 155,707 4.76 1014.60 894.75 Punjab 806.88 24289 2.40 512.75 50,362 1.54 328.16 420.46 Rajasthan 2296.68 56473 5.59 1192.17 342,236 10.45 2230.03 1711.10

123
Sikkim 92.97 540 0.05 11.40 7,096 0.22 46.24 28.82 Tamil Nadu 1155.28 62111 6.15 1311.19 130,058 3.97 847.47 1079.33 Tripura 68.14 3191 0.32 67.36 10,492 0.32 68.37 67.86 Uttar Pradesh 1569.49 166053 16.43 3505.44 238,566 7.29 1554.51 2529.97 Uttarakhand 492.38 8480 0.84 179.02 53,566 1.64 349.04 264.03 West Bengal 1244.86 80221 7.94 1693.49 88,752 2.71 578.31 1135.90
INDIA 21333.33 1010562 100.00 21333.33 3,273,961 100.00 21333.33 21333.33
The figures shown in red indicate less than what the States are getting at present. In population based allocations the gainer States would be Bihar, Karnataka, Kerala, Madhya Pradesh, Maharastra, Tamil Nadu, Uttar Pradesh and West Bengal, while the losers are some of the most disaster prone States like Assam, Orissa, Jammu & Kashmir, Uttarakand, Chaatisgarh, Jharkhand, Rajasthan, Gujarat, Himachal Pradesh etc. In area based allocations almost all the States except Arunachal, Jammu & Kashmir, Madhya Pradesh, Maharastra, Karnataka will be losers, while in population-cum-area based allocations on an equal weightage basis the situation would not be much different. Goa, Madhya Pradesh, Maharastra, Manipur and Karnataka are the only five States that would be gaining in both population and area based calculations. These are certainly not the only poor or disaster prone States of India. 10.5 If we take BPL population as the criteria for allocation of CRF we get the following picture:
Table-10.2
CRF Calculated on the Basis of BPL Population (Rs. crores)
States CRF
Allocation % of BPL Population
Number of BPL (000)
Allocation on BPL Basis
Andhra Pradesh 1901.24 15.77 11942.31 965.92 Arunachal Prdaesh 150.07 33.47 365.16 29.53 Assam 1023.84 36.09 9613.65 777.58 Bihar 789.83 42.60 35306.45 2855.68 Chhatisgarh 1348.37 40.90 8505.56 687.95 Goa 11.64 4.40 59.14 4.78 Gujarat 1359.3 14.07 7119.00 575.80 Haryana 687.28 8.74 1842.65 149.04 Himachal Pradesh 534.01 7.63 463.68 37.50 Jammu & Kashmir 458.54 3.48 350.44 28.34 Jharkhand 592.6 5.40 1453.09 117.53 Karnataka 668.61 20.04 10567.89 854.76 Kerala 633.55 12.72 4049.92 327.57 Madhya Pradesh 472.42 37.43 22602.11 1828.12 Maharashtra 1231.68 25.02 24207.35 1957.95 Manipur 29.48 28.54 681.82 55.15 Meghalaya 59.84 33.87 781.04 63.17 Mizoram 34.9 19.47 173.48 14.03 Nagaland 20.29 32.67 649.81 52.56 Orissa 1599.16 47.15 17307.35 1399.86

124
Punjab 806.88 6.16 1496.20 121.02 Rajasthan 2296.68 15.28 8629.07 697.94 Sikkim 92.97 36.55 197.37 15.96 Tamil Nadu 1155.28 21.12 13117.84 1061.01 Tripura 68.14 34.44 1098.98 88.89 Uttar Pradesh 1569.49 31.15 51725.51 4183.69 Uttarakhand 492.38 32.80 2781.44 224.97 West Bengal 1244.86 27.02 21675.71 1753.19 INDIA 21333.33 26.10 263756.68 21333.33
In this dispensation the beneficiaries would be Bihar, Madhya Pradesh, Maharastra, Karnataka, Uttar Pradesh and West Bengal but practically all other States would be losers. The gainers are not necessarily the worst sufferers in natural disasters. 10.6 Therefore population, area and BPL population may not necessarily capture the indices of disasters and therefore allocations on the basis of these indicators alone would result in a skewed distribution of federal resources on disaster management that would miss out most of the States and regions that are most prone to disasters. Therefore such a formula would not be acceptable to the majority of the States. The considerations of population, BPL population and geographical area are factored in many devolution formula of the Finance Commission which benefits poor States. There may not be adequate justification for the Commission to extend the same formula for allocation of CRF fund which is essentially meant to assist the States in providing quick relief to the people affected by disasters.
B. Hazard-Vulnerability-Risk Profile
10.7 Ideally hazard-vulnerability-risk profile of the States could be the best indicator of the disasters that a State is likely to face, but this task is infinitely more complex and difficult than this concept may suggest, due to a variety of reasons, as stated below:
a) First of all, we do not yet have authentic and comprehensive
mapping of the hazards, vulnerabilities and risks of the country. As discussed in chapter 2, the Vulnerability Atlas of India has mapped the country for only 4 natural hazards, namely earthquake, landslide, flood and cyclone, whereas 15 other natural and man made hazards are yet to be mapped. Secondly this mapping is at a scale of 1:2.5 million which hardly captures the hazards at the micro level which are extremely complex and diverse. Thirdly the Atlas has considered only one vulnerability factor, namely housing types and that too partially, whereas
125
other vulnerabilities in terms of poverty, settlement pattern, demography, health, disability, gender relations etc have not been factored. In the absence of these details it may not be proper to accept the Vulnerability Atlas of India as the basis of financial allocations to the States.
b) Secondly, there is no consensus among scholars and experts on
the methodology of developing a set of reliable and transparent indicators on hazards-vulnerabilities-risks, particularly in a large country like India , which is characterized by extreme diversities in terms geo-physical and climatic conditions. Even if we are able to narrow down these differences and develop a consensus on a set of broad indicators, determining the relative value to specific types of hazards or vulnerabilities is bound to be a controversial subject, as the States are bound to loose or gain heavily according to these weightage.
c) Thirdly, actual disasters that may take place in the States in
specific years may not exactly follow the relative weightage given to types of hazards, vulnerabilities and risks. Although the probability of disasters in time and space is well known the actual occurrence of disasters in a relatively short span of five years may not be predicted with any degree of accuracy. Therefore allocating federal finance on the basis of pre determined indicators may not be very scientific given the current state of knowledge on the predictability of disasters in the country.
C. Damage-Loss-Need Assessment
10.8 Some experts have suggested that damage and losses suffered by the States in disasters in the past may be taken as the basis for calculation of CRF. But past disasters may not always be very accurate indexes of disasters that would be forthcoming, particularly in a limited time horizon of five years, as disasters may not repeat to the same States in the same manner and with the same magnitude and intensity. Various measures taken by the States for mitigation and preparedness after disasters may in fact reduce the intensity of disasters in the same locations. There is also no guarantee that States which did not suffer huge losses in the past shall not do so in future. There are always elements of uncertainties which make disasters unpredictable in the short span. This makes past disasters events not altogether very reliable basis for allocating federal finance for managing future disasters.

126
10.9 The procedure followed by the States for estimating the damage and looses in disasters are also not very scientific and varies from one State to another. There is no nation wide standardized method for calculation of damage and losses which can make such loss statements comparable . If the Memorandums submitted by the States seeking financial assistance from the Centre are any indication, most of the damages are exaggerated beyond any proportion while many types of losses are grossly underestimated. Again there is lack of disaggregated database on disasters looses, on the basis of which financial allocations can be estimated in a predictable and transparent manner.
D. Expenditure Based Allocations
10.10 Therefore in the absence of an alternate workable methodology, expenditure incurred by the States in managing disasters in the past still appears to be the most objective, practical and transparent tool available for estimating the quantum of fund required for financing disaster management in the country and further distributing the funds to the States for a five yearly fiscal cycle . The advantages of this tool are quite obvious. First, State wise data on expenditure are easily available and there can not be any difference of opinion on what the States have actually spent in managing disasters. Secondly, since the norms and scales of disaster relief are more or less uniform throughout the country, the expenditure figures reflect the differential scale of disaster damage s faced by the States. These figures are in a way self-correcting assessments of damage which are neither available from the States nor are very reliable. Thirdly, expenditure by default mirror images to some extent the hazards and vulnerabilities of the States that find expression in disasters. Therefore relative vulnerabilities of the States also get somewhat reflected in the expenditure statements. The argument that poor States have less capacity to spend is really not supported by empirical evidences as we have noted in para 5.11 that barring the four relatively small States of Manipur, Nagaland, Sikkim and Uttarakhand every other States has in fact spent more than what has been allocated by the Twelfth Finance Commission during the first three years of the current fiscal cycle for which figures are available. The mechanism of NCCF has bridged the resource gap to a large extent although this has not been adequate. Recommended Formula 10.11 Although expenditure statements can not be a substitute of a rigorous scientific methodology of hazards-vulnerabilities-risks, given the
127
current state of our knowledge on the subject in our country, it may not be advisable to allocate funds on the basis of inaccurate and incomplete information. Therefore the existing methodology of assessing the requirement of fund and allocating these funds to the States, followed by the successive Finance Commissions may be adopted by the Thirteenth Finance Commission with some modifications, taking into consideration the spirit and the provisions of the Disaster Management Act, the pattern of expenses of the States and the difficulties experienced by them, as stated in their Memorandums to the Commission. The following formula is suggested for the consideration of the Commission.
i) The actual expenditure incurred by the States under ‘Major Head 2245- Relief on Account of Natural Calamity’ for the past 10 years (1997-98 to 2006-07 or 1998-99 to 2007-08 if the actual expenditure figures of 2007-08 are available) may be taken as the basis for estimating the requirement of funds of the States during 2010-15.
ii) Previous Finance Commissions had excluded NCCF expenses
from the base level calculations. The States benefiting from NCCF allocations demanded that since the nature and norms of expenditure for both CRF and NCCF are the same and NCCF constitutes almost 34% of the total relief expenditure of all the States, base level calculations should not exclude NCCF expenditure. However, analysis of NCCF expenditure shows that 70.32% of NCCF expenses took place in the five States of Gujarat, Karnataka, Maharashtra, Rajasthan and Tamil Nadu. Therefore inclusion of NCCF allocations in base level calculations would distort allocations in favour of a few States at the expense of majority of States. Therefore it is recommended that the Thirteenth Finance Commission may continue to follow the principle of excluding NCCF from the base level calculations.
iii) The expenditure incurred by the States on CRF shall be
aggregated at current price and average expenditure of one year shall be worked out. Annual rate of inflation of 5% shall be added for each year from 2007-08 to 2014-15.
iv) Keeping in view the extended definition of ‘disaster’ in the
Act and the likely inclusion of 7 new disasters as recommended (para 7.17), 35% shall be added over average expenditure to cover the new disasters.
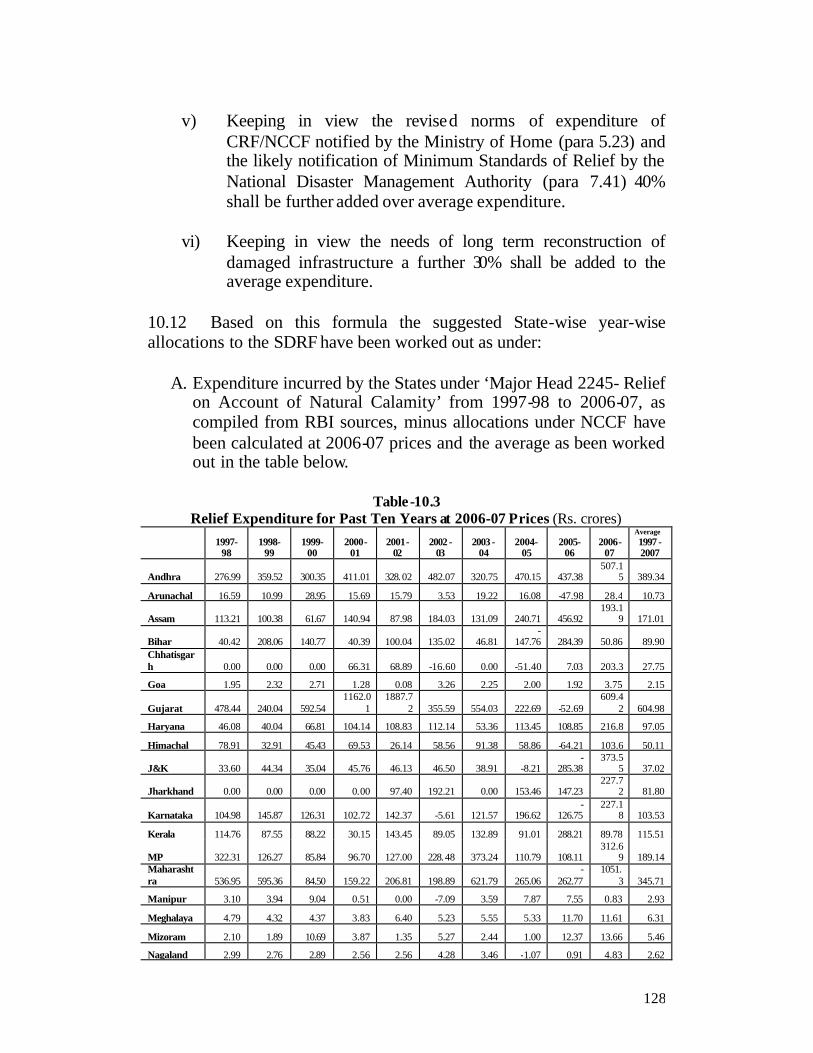
128
v) Keeping in view the revised norms of expenditure of
CRF/NCCF notified by the Ministry of Home (para 5.23) and the likely notification of Minimum Standards of Relief by the National Disaster Management Authority (para 7.41) 40% shall be further added over average expenditure.
vi) Keeping in view the needs of long term reconstruction of
damaged infrastructure a further 30% shall be added to the average expenditure.
10.12 Based on this formula the suggested State-wise year-wise allocations to the SDRF have been worked out as under:
A. Expenditure incurred by the States under ‘Major Head 2245- Relief on Account of Natural Calamity’ from 1997-98 to 2006-07, as compiled from RBI sources, minus allocations under NCCF have been calculated at 2006-07 prices and the average as been worked out in the table below.
Table-10.3 Relief Expenditure for Past Ten Years at 2006-07 Prices (Rs. crores)
1997-
98 1998-
99 1999-
00 2000-
01 2001-
02 2002 -
03 2003 -
04 2004-
05 2005-
06 2006-
07
Average 1997 - 2007
Andhra 276.99 359.52 300.35 411.01 328.02 482.07 320.75 470.15 437.38 507.1
5 389.34
Arunachal 16.59 10.99 28.95 15.69 15.79 3.53 19.22 16.08 -47.98 28.4 10.73
Assam 113.21 100.38 61.67 140.94 87.98 184.03 131.09 240.71 456.92 193.1
9 171.01
Bihar 40.42 208.06 140.77 40.39 100.04 135.02 46.81 -
147.76 284.39 50.86 89.90 Chhatisgarh 0.00 0.00 0.00 66.31 68.89 -16.60 0.00 -51.40 7.03 203.3 27.75
Goa 1.95 2.32 2.71 1.28 0.08 3.26 2.25 2.00 1.92 3.75 2.15
Gujarat 478.44 240.04 592.54 1162.0
1 1887.7
2 355.59 554.03 222.69 -52.69 609.4
2 604.98
Haryana 46.08 40.04 66.81 104.14 108.83 112.14 53.36 113.45 108.85 216.8 97.05
Himachal 78.91 32.91 45.43 69.53 26.14 58.56 91.38 58.86 -64.21 103.6 50.11
J&K 33.60 44.34 35.04 45.76 46.13 46.50 38.91 -8.21 -
285.38 373.5
5 37.02
Jharkhand 0.00 0.00 0.00 0.00 97.40 192.21 0.00 153.46 147.23 227.7
2 81.80
Karnataka 104.98 145.87 126.31 102.72 142.37 -5.61 121.57 196.62 -
126.75 227.1
8 103.53
Kerala 114.76 87.55 88.22 30.15 143.45 89.05 132.89 91.01 288.21 89.78 115.51
MP 322.31 126.27 85.84 96.70 127.00 228.48 373.24 110.79 108.11 312.6
9 189.14 Maharashtra 536.95 595.36 84.50 159.22 206.81 198.89 621.79 265.06
-262.77
1051.3 345.71
Manipur 3.10 3.94 9.04 0.51 0.00 -7.09 3.59 7.87 7.55 0.83 2.93
Meghalaya 4.79 4.32 4.37 3.83 6.40 5.23 5.55 5.33 11.70 11.61 6.31
Mizoram 2.10 1.89 10.69 3.87 1.35 5.27 2.44 1.00 12.37 13.66 5.46
Nagaland 2.99 2.76 2.89 2.56 2.56 4.28 3.46 -1.07 0.91 4.83 2.62
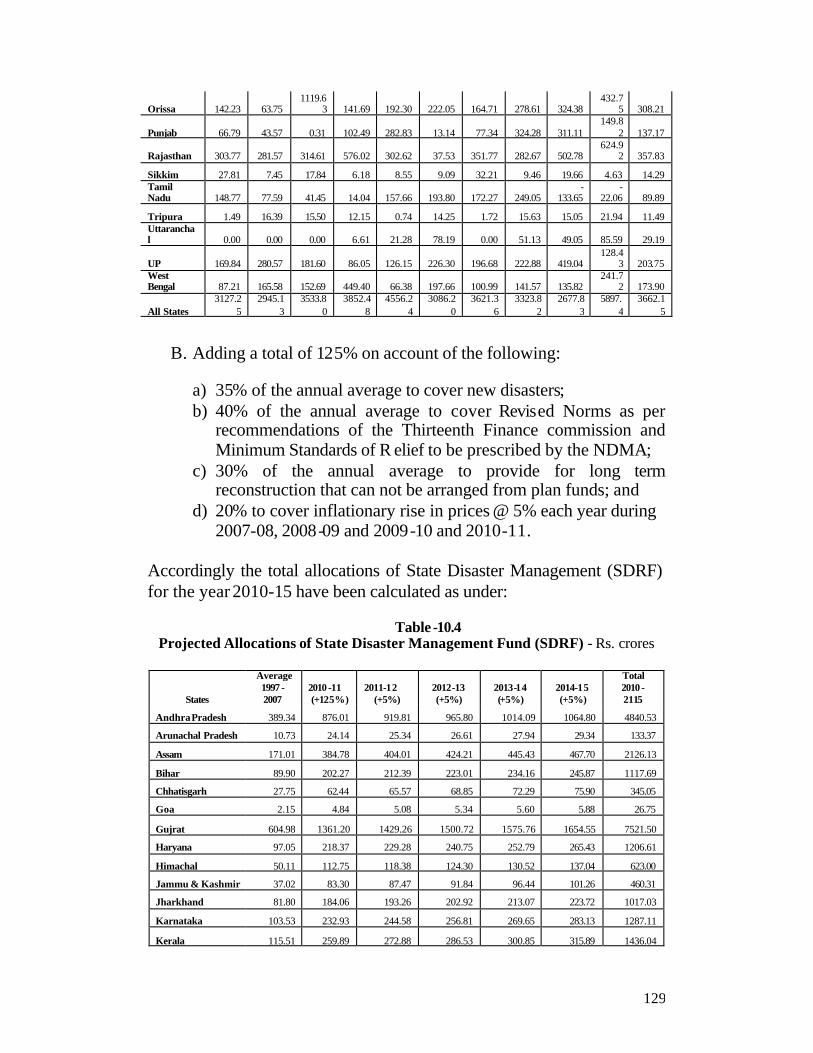
129
Orissa 142.23 63.75 1119.6
3 141.69 192.30 222.05 164.71 278.61 324.38 432.7
5 308.21
Punjab 66.79 43.57 0.31 102.49 282.83 13.14 77.34 324.28 311.11 149.8
2 137.17
Rajasthan 303.77 281.57 314.61 576.02 302.62 37.53 351.77 282.67 502.78 624.9
2 357.83
Sikkim 27.81 7.45 17.84 6.18 8.55 9.09 32.21 9.46 19.66 4.63 14.29 Tamil Nadu 148.77 77.59 41.45 14.04 157.66 193.80 172.27 249.05
-133.65
-22.06 89.89
Tripura 1.49 16.39 15.50 12.15 0.74 14.25 1.72 15.63 15.05 21.94 11.49 Uttaranchal 0.00 0.00 0.00 6.61 21.28 78.19 0.00 51.13 49.05 85.59 29.19
UP 169.84 280.57 181.60 86.05 126.15 226.30 196.68 222.88 419.04 128.4
3 203.75 West Bengal 87.21 165.58 152.69 449.40 66.38 197.66 100.99 141.57 135.82
241.72 173.90
All States 3127.2
5 2945.1
3 3533.8
0 3852.4
8 4556.2
4 3086.2
0 3621.3
6 3323.8
2 2677.8
3 5897.
4 3662.1
5
B. Adding a total of 125% on account of the following:
a) 35% of the annual average to cover new disasters; b) 40% of the annual average to cover Revised Norms as per
recommendations of the Thirteenth Finance commission and Minimum Standards of R elief to be prescribed by the NDMA;
c) 30% of the annual average to provide for long term reconstruction that can not be arranged from plan funds; and
d) 20% to cover inflationary rise in prices @ 5% each year during 2007-08, 2008-09 and 2009-10 and 2010-11.
Accordingly the total allocations of State Disaster Management (SDRF) for the year 2010-15 have been calculated as under:
Table -10.4
Projected Allocations of State Disaster Management Fund (SDRF) - Rs. crores
States
Average 1997 - 2007
2010 -11 (+125%)
2011-12 (+5%)
2012-13 (+5%)
2013-14 (+5%)
2014-15 (+5%)
Total 2010 - 2115
Andhra Pradesh 389.34 876.01 919.81 965.80 1014.09 1064.80 4840.53
Arunachal Pradesh 10.73 24.14 25.34 26.61 27.94 29.34 133.37
Assam 171.01 384.78 404.01 424.21 445.43 467.70 2126.13
Bihar 89.90 202.27 212.39 223.01 234.16 245.87 1117.69
Chhatisgarh 27.75 62.44 65.57 68.85 72.29 75.90 345.05
Goa 2.15 4.84 5.08 5.34 5.60 5.88 26.75
Gujrat 604.98 1361.20 1429.26 1500.72 1575.76 1654.55 7521.50
Haryana 97.05 218.37 229.28 240.75 252.79 265.43 1206.61
Himachal 50.11 112.75 118.38 124.30 130.52 137.04 623.00
Jammu & Kashmir 37.02 83.30 87.47 91.84 96.44 101.26 460.31
Jharkhand 81.80 184.06 193.26 202.92 213.07 223.72 1017.03
Karnataka 103.53 232.93 244.58 256.81 269.65 283.13 1287.11
Kerala 115.51 259.89 272.88 286.53 300.85 315.89 1436.04

130
Madhya Pradesh 189.14 425.57 446.85 469.19 492.65 517.28 2351.53
Maharashtra 345.71 777.85 816.75 857.58 900.46 945.49 4298.13
Manipur 2.93 6.60 6.93 7.28 7.64 8.03 36.49
Meghalaya 6.31 14.21 14.92 15.66 16.45 17.27 78.50
Mizoram 5.46 12.30 12.91 13.56 14.23 14.94 67.94
Nagaland 2.62 5.89 6.18 6.49 6.82 7.16 32.53
Orissa 308.21 693.47 728.14 764.55 802.78 842.92 3831.86
Punjab 137.17 308.63 324.06 340.26 357.28 375.14 1705.38
Rajasthan 357.83 805.11 845.36 887.63 932.01 978.61 4448.72
Sikkim 14.29 32.15 33.76 35.45 37.22 39.08 177.65
Tamil Nadu 89.89 202.26 212.37 222.99 234.14 245.84 1117.59
Tripura 11.49 25.85 27.14 28.49 29.92 31.41 142.81
Uttaranchal 29.19 65.67 68.95 72.40 76.02 79.82 362.86
Uttar Pradesh 203.75 458.45 481.37 505.44 530.71 557.25 2533.21
West Bengal 173.90 391.28 410.85 431.39 452.96 475.61 2162.08
All States 3662.15 8239.84 8651.83 9084.42 9538.64 10015.58 45530.31
10.13 The proposed allocation of Rs. 45530.31 crores to the SDRF for the period 2010-15 shall represent a step up of 112.48% over the allocation of Rs. 21333.33 crores to the CRF during 2005-10. The Centre and the States shall contribute to the State Disaster Response Fund in the ratio of 75:25 as before. A number of Special Category States have requested in their Memorandums submitted to the Commission that instead of 75:25 sharing formula uniformly applied to all the States, the Special Category States as defined by the Planning Commission may be asked to pay in the ratio of 90:10. These requests may not be accepted by the Commission on the ground that all the States must own the Fund and show their commitment by allocating provisions in the State budget to contribute to the fund which will be spent exclusively for the benefit of the people of the State concerned. The buoyancy achieved in State revenue in the recent years should permit the States to allocate 25% fund for managing disasters in their own States, which is an important responsibility entrusted to them under the Disaster Management Act. 10.14 Therefore the contribution of the Central Government to the SDRF shall be as under.
Table-10.5
Central Contributions to SDRF 2010 -15 (Rs. crores)
States 2010-
11 2011-
12 2012-
13 2013-
14 2014-
15 2010-
15
Andhra 657.01 689.86 724.35 760.57 798.60 3630.40
Arunachal 18.11 19.01 19.96 20.96 22.01 100.03
Assam 288.59 303.01 318.16 334.07 350.78 1594.60 Bihar 151.70 159.29 167.26 175.62 184.40 838.27
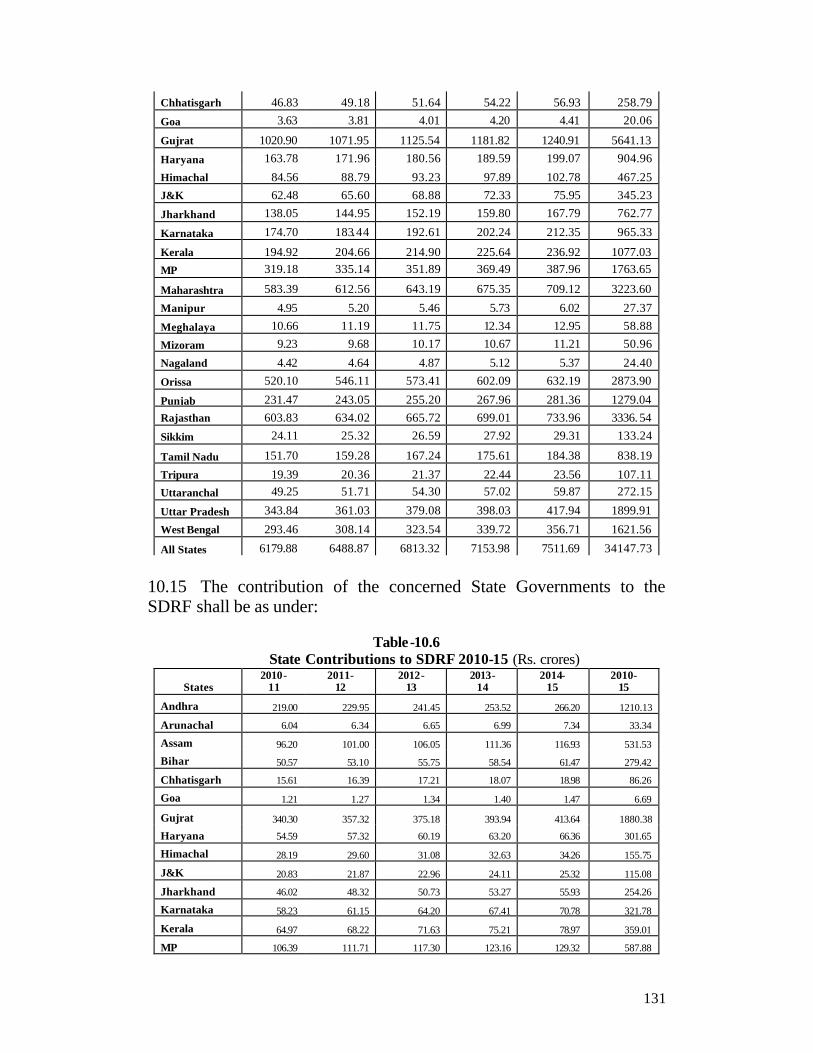
131
Chhatisgarh 46.83 49.18 51.64 54.22 56.93 258.79
Goa 3.63 3.81 4.01 4.20 4.41 20.06
Gujrat 1020.90 1071.95 1125.54 1181.82 1240.91 5641.13
Haryana 163.78 171.96 180.56 189.59 199.07 904.96
Himachal 84.56 88.79 93.23 97.89 102.78 467.25 J&K 62.48 65.60 68.88 72.33 75.95 345.23
Jharkhand 138.05 144.95 152.19 159.80 167.79 762.77
Karnataka 174.70 183.44 192.61 202.24 212.35 965.33
Kerala 194.92 204.66 214.90 225.64 236.92 1077.03 MP 319.18 335.14 351.89 369.49 387.96 1763.65
Maharashtra 583.39 612.56 643.19 675.35 709.12 3223.60
Manipur 4.95 5.20 5.46 5.73 6.02 27.37
Meghalaya 10.66 11.19 11.75 12.34 12.95 58.88
Mizoram 9.23 9.68 10.17 10.67 11.21 50.96
Nagaland 4.42 4.64 4.87 5.12 5.37 24.40
Orissa 520.10 546.11 573.41 602.09 632.19 2873.90
Punjab 231.47 243.05 255.20 267.96 281.36 1279.04 Rajasthan 603.83 634.02 665.72 699.01 733.96 3336. 54
Sikkim 24.11 25.32 26.59 27.92 29.31 133.24
Tamil Nadu 151.70 159.28 167.24 175.61 184.38 838.19
Tripura 19.39 20.36 21.37 22.44 23.56 107.11 Uttaranchal 49.25 51.71 54.30 57.02 59.87 272.15
Uttar Pradesh 343.84 361.03 379.08 398.03 417.94 1899.91
West Bengal 293.46 308.14 323.54 339.72 356.71 1621.56
All States 6179.88 6488.87 6813.32 7153.98 7511.69 34147.73
10.15 The contribution of the concerned State Governments to the SDRF shall be as under:
Table-10.6
State Contributions to SDRF 2010-15 (Rs. crores)
States 2010-
11 2011-
12 2012-
13 2013-
14 2014-
15 2010-
15
Andhra 219.00 229.95 241.45 253.52 266.20 1210.13
Arunachal 6.04 6.34 6.65 6.99 7.34 33.34
Assam 96.20 101.00 106.05 111.36 116.93 531.53
Bihar 50.57 53.10 55.75 58.54 61.47 279.42
Chhatisgarh 15.61 16.39 17.21 18.07 18.98 86.26
Goa 1.21 1.27 1.34 1.40 1.47 6.69
Gujrat 340.30 357.32 375.18 393.94 413.64 1880.38
Haryana 54.59 57.32 60.19 63.20 66.36 301.65
Himachal 28.19 29.60 31.08 32.63 34.26 155.75
J&K 20.83 21.87 22.96 24.11 25.32 115.08
Jharkhand 46.02 48.32 50.73 53.27 55.93 254.26
Karnataka 58.23 61.15 64.20 67.41 70.78 321.78
Kerala 64.97 68.22 71.63 75.21 78.97 359.01
MP 106.39 111.71 117.30 123.16 129.32 587.88

132
Maharashtra 194.46 204.19 214.40 225.12 236.37 1074.53
Manipur 1.65 1.73 1.82 1.91 2.01 9.12
Meghalaya 3.55 3.73 3.92 4.11 4.32 19.63
Mizoram 3.08 3.23 3.39 3.56 3.74 16.99
Nagaland 1.47 1.55 1.62 1.71 1.79 8.13
Orissa 173.37 182.04 191.14 200.70 210.73 957.97
Punjab 77.16 81.02 85.07 89.32 93.79 426.35
Rajasthan 201.28 211.34 221.91 233.00 244.65 1112.18
Sikkim 8.04 8.44 8.86 9.31 9.77 44.41
Tamil Nadu 50.57 53.09 55.75 58.54 61.46 279.40
Tripura 6.46 6.79 7.12 7.48 7.85 35.70
Uttaranchal 16.42 17.24 18.10 19.01 19.96 90.72
Uttar Pradesh 114.61 120.34 126.36 132.68 139.31 633.30
West Bengal 97.82 102.71 107.85 113.24 118.90 540.52
All States 2059.96 2162.96 2271.11 2384.66 2503.90 11382.58
Principles for Allocation of NDRF
10.16 There is a general consensus that National Calamity Contingency Fund (NCCF) shall be subsumed in the National Disaster Response Fund (NDRF) and the methodology of the operation of NDRF should be the same as the NCCF, with the difference that instead of the Inter-Ministerial Group (IMG) it is the National Executive Committee (NEC) that would consider the report of the Central Team and make recommendations to the High Level Committee (HLC). 10.17 However, the existing practice of submission of Memorandum by the States seeking assistance from the Centre and visit of a Central team for on-the-spot assessment of the damages needs to be reviewed as the practice does not seem to be serving any purpose at all. While the State governments in their wisdom have been seeking Central assistance of a magnitude that has no semblance with the realities on the ground, the Central government has been examining the Memorandum in a routine manner purely from the angle of norms of relief admissible under the rules. This has resulted in a huge gaps in the aspirations of the States and the dispensation by the Centre, as described in para 5.14 of the report. If the Central assistance is to be limited to the admissible scale of relief this can be a desk top exercise of calculation which does not require the visit of a multi-disciplinary Central Team. The highly casual and perfunctory manner in which the Central Team assesses the damage and losses in the affected areas in a short span of two-and-half days has been adversely commented by the Finance Commissions in the past. This does not add any value to the process at all except to complete the formality that the requests of the States have been verified and considered, while the fact is

133
that the genuine needs of the States for long term rehabilitation and reconstruction of the affected areas and communities are not considered at all. 10.18 It is therefore suggested for consideration that a revised system for assessing damage, loss and needs of the States after major disasters should be introduced. Whenever there a major disaster which is beyond the capacity and resources of the State government to manage, it may seek for Central assistance. In such situations the Central government shall in consultation the State government constitute a Joint Team of experts drawn from the Central and State government for conducting a comprehensive assessment of the damage, loss and needs of the State as per standard assessment tools to be developed for this purpose. Since the tools shall be based on objective parameters there should not be any difference of opinion between the experts members of the Central and State governments. In case there are differences the Head of the team shall try to resolve them. If the difference still persists both the viewpoints may be reflected in the report. The report shall be submitted within a period of one month for the consideration of the NEC. The revised procedure shall narrow down the difference between the Centre and the States considerably, provide a more pragmatic framework for realistic assessment of damage and losses in disasters, facilitate a more holistic approach to examine to what extent the long term reconstruction works can be dovetailed with various on going plan schemes and make a correct assessment of the actual needs of the States that can be supported from the NDRF. Long Term Reconstruction 10.19 In this context the fundamental principle that Central assistance under CRF/NCCF is available only for the immediate needs of relief and restoration while long term needs of rehabilitation and reconstruction shall be met from the plan funds needs to be reviewed very seriously. It is well known that the State governments do not have a free hand in the utilization of plan funds which are always dedicated to certain schemes. Even if the States are authorised to reallocate the plan funds this would result in diversion of funds which would only create a setback to development. Therefore post disaster reconstruction remains an unresolved issue of federal financing of disaster management. The issue has been addressed in an ad hoc manner during major disasters through the mechanism of external assistance and additional central assistance but this has always been very uncertain and time consuming. The Terms of

134
Reference of the Thirteenth Finance Commission provides an opportunity for resolving this issue. 10.20 The dichotomy between the non-plan and plan fund for financing disaster management – that non-plan funds shall be available only for immediate relief and restoration and plan funds should bee used for long term rehabilitation and reconstruction – must be ended for ever. There must be an integrated approach for meeting the genuine needs of the States for post disaster response, relief, rehabilitation and reconstruction. The objective should be to ensure that the affected communities and areas return back to normal conditions at the earliest possible time and the funds required for the same are available. The following framework is suggested for achieving this objective:
a) The norms of Central assistance should be reviewed to include all items of expenditure for post-disaster management including response, relief, rehabilitation and reconstruction.
b) While response, relief and reconstruction shall be funded entirely
from SDRF/NDRF, reconstruction works shall be dovetailed to the extent possible with the existing or future plan schemes. The extent to which plan funds can be utilized for reconstruction purposes without causing any set back to the development goals of the Fiver Year and Annual Plans of the States shall be one of the specific mandates of the Joint Assessment Team. Similar exercises shall be carried out by the States for managing long term reconstruction works after disasters when Central assistance has not been sought.
c) SDRF has been proposed to be stepped up by over 120% of the
annual average of actual expenditure on CRF of past 10 years at current prices leading to overall 112% step up over the award of Twelfth Finance Commission on Calamity Relief which should be adequate to cater to the long term reconstruction needs after disasters that can not be met from plan funds.
d) The reconstruction works must always be designed on the basis of
the principle of ‘build back better’, so that reconstructed assets are able to withstand the future disasters and scarce public resources are not wasted by temporary restoration works that do not meet even the minimum standards of reconstruction.
e) On the same analogy the standards of ‘relief works’ that have only
wage components and do not permit any durable assets to be

135
constructed must be revised so that the wage components available under SDRF/NDRF can be combined with Plan Funds for construction of durable assets that can mitigate future disasters. There have been many instances of such innovative linking of the CRF/NCCF funds with the Plan schemes at the district level through the initiatives of the District Commissioners and the Zilla Parishads. There is a need to institutionalize such good practices in the system.
f) Ministry of Home Affairs should in consultation with the Planning
Commission and the National Disaster Management Authority develop comprehensive guidelines on how SDRF/NDRF allocations can be combined with plan funds for holistic management of disasters. The guidelines shall also clearly specify how SDRF/NDRF can be utilized for long terms reconstruction works. The issue raised by the Government of Rajasthan regarding the simultaneous operation of CRF and NREGS for employment generation needs to be addressed in these guidelines.
g) However all pre-disaster management initiatives for prevention,
mitigation and preparedness should be met entirely from the Plan budget of the States or the Disaster Mitigation Funds at national, state and district levels as envisaged in the Disaster Management Act. SDRF and NDRF shall not be available for disaster risk reduction activities.
h) However a part of NDRF may be invested on catastrophic
insurance to ensure that necessary financial resources are quickly mobilized for managing catastrophic disasters which are beyond the means of SDRF and NDRF. This has been specifically discussed in chapter 11 of the report.
National Standards for Damage and Loss Assessment 10.21 It is necessary to review the entire process of damage, loss and need assessment after disasters in the country. India has accumulated experience of years and decades in the management of disasters, but unfortunately we have not been able to develop a set standard guidelines for assessment of damage, loss and need after disasters in an objective, clear and transparent manner. Every State and each Department seems to follow its own procedure which is often not laid down anywhere with the result that the entire process is vitiated by subjective judgement of the
136
assessors. Typically an assessor would be a low level government functionary who would make the assessment on visual inspections or inputs received from intermediaries, which are neither validated by the affected communities not verified by the higher level officials, who would generally go by what the village or block level officials have reported. This would result in exaggerated assessment of certain types of damages and under assessment of other categories of damages. For example, damages to the informal sectors that do not have large tangible assets are always under estimated, while they suffer maximum in terms of relative value of the damages. Again, the direct physical damages to life and assets which occur at the moment of disasters would be assessed but the indirect losses which are not so directly visible are not estimated at all. For example, the goods and services that will not be produced or rendered over a time span after disasters and the chain of producers and suppliers that would be affected are never reported, while the States may have to grapple with these issues for a long time. In fact, macro level economic effects of disasters are never assessed and analysed at all, even though these are extremely important for long term disaster recovery. 10.22 There are well established international standards for post disaster damage, loss and need assessment which have been adopted by many countries with encouraging results. Multi-lateral financial institutions like the World Bank and Asian Development Bank have in fact applied these tools for assessing the damages after the cyclones in Orissa and Andhra Pradesh, earthquake in Gujarat and tsunami in Tamil Nadu, Andhra Pradesh, Kerala and Pondicherry. These tools should be adapted in Indian conditions and a common national standard for damage, loss and need assessment should be developed for the entire country. These tools should be flexible enough to take into account the local variations in agricultural and other practices. Scientific techniques like remote sensing and GIS may also be applied for quick assessment and verification of damages. Probably the National Institute of Disaster Management which has been constituted under the Disaster Management Act 2005 may be asked to develop this standard in consultation with experts in the relevant fields and the State governments. The standard so developed shall be field tested and the concerned State and district officials shall be trained in their use and application. The new standards may be introduced throughout the country with effect from 1 April 2010. Similarly new standards and processes should be laid down for joint damage, loss and need assessment after major disasters. External Assistance
137
10.23 After the India Ocean tsunami 2004, India announced that it would not seek any external assistance for post-disaster response and reconstruction. On the contrary India extended its military and humanitarian assistance to its neighbours and other countries. While this policy has enhanced the prestige of India in the international arena, the rationale of this policy is not well appreciated. While the country need not to go with a begging bowl for assistance after every disaster, but when there is a major catastrophic disasters which results in enormous damage of lives, assets and livelihoods there should not be any self imposed isolation that would deprive us of our share from the global mobilization of humanitarian assistance through various UN and other agencies. It is estimated that about 30 billion US dollars was raised after the Indian Ocean tsunami for assisting the affected countries and communities, but India remained deprived of its share and in the process the country had to mobilize its resources from the World Bank, Asian Development Bank and other sources to the tune of 4 billion US dollars, which could easily be raised as grants from the international community of which India is an important member. There are well established international systems for coordinating humanitarian, material, technical and financial resources which can supplement our own resources for quick response and rehabilitation. Every country including the developed countries seeks and receives international assistance in times of disasters for quick recovery and restoration. There is no reason why India should not do the same. As a sovereign country we must always have the prerogative to seek or receive such assistance as and when it may be considered necessary, but this right must be exercised when need be instead of abdicating it once for all. This is particularly important for management of mega disasters that have strong probabilities given the conditions of hazards, vulnerabilities and risks that we live in. The provisions of the Disaster Management Act provide legal instruments for receiving such external assistance in the National Disaster Response Fund.

138
RISK TRANSFER, INSURANCE AND REINSURANCE
Increasing disasters and spiralling public expenditure on disaster management have encouraged many countries to look for market based solutions for transferring risks through insurance and reinsurance, thereby significantly reducing the burden on public exchequer. In the developed countries households and individuals in disaster prone areas insure their assets against various natural and man made disasters as government support for reconstruction of private assets are mostly not available , and even if available , these do not cover the entire costs of recovery and reconstructions. In the developing countries household capacity for buying insurance being limited governments have to shoulder huge burden which is often beyond their means to support. Therefore governments focus on the basic needs of the poor and marginalized population while the rich, the middle class and the private sector have to fend for themselves. Surprisingly insurance penetration among the classes who can afford is also very low in these countries. This provides a challenge as also an opportunity for insurance to expand their business and further calls for creating an enabling environment - legislations, institutions, regulations, incentives and innovative insurance products and services - in which insurance markets can grow and play important role in sharing the burden of burgeoning expenses on disaster management. Many transitional economies are increasingly looking at various insurance options for sustainable financing of disaster management.
Concept of Disaster Insurance
11.2 The rationale of disaster insurance is based on the consideration that it not possible for the households or individuals or the government to recover from catastrophic damages through their own efforts. It requires collective efforts which work best through market intervention in which the risks of disasters are pooled and funds for reconstruction are distributed by insurance 1. Disaster insurance is a mechanism in which a large number of clients pay relatively smaller amount of premium to cover much larger amount of losses. It works on the principle that risks being more wide spread than disasters, the premium paid for risks shall be good enough to meet the claims of losses, after meeting the 1 Andersen T. J., Managing Economic Exposures of Natural Disasters: Exploring Alternative Financial Risk Management Opportunities and Instruments , Special Report, IDB, Washington DC, 2001.

139
administrative costs as well as the margin of profits of the insurance companies. Therefore the success of the entire business model of disaster insurance depends on the affordability of the insured (demand side) to pay the feasible amount of premium worked out by the insurer (supply side). Both the demand and the supply side of insurance can be managed by regulations, fiscal incentives, innovative insurance products and services and sometimes by subsidies and cross subsidies. 11.3 As the economy grows government is able to invest more on prevention, mitigatio n and preparedness which reduce the risks of disasters considerably but still there are huge risks which can not be prevented altogether and these may result in colossal losses of both public and private properties. Our analysis in chapter 2 has shown that with the growth of economy the losses of life and limbs shall reduce but economic value of assets lost shall increase. Household savings and/or relief/ contingency funds of governments can retain the risks of low severity disasters which are more regular and frequent, but these may be totally inadequate to cover the losses of catastrophic disasters which can be better funded by insurance/ reinsurance or insurance liked securities. This is presented in the following diagram.
11.4 Reinhard Mechler has developed an integrated model of risk reduction and risk financing based on the frequency and intensity of disasters 2. It is always economical to invest on prevention and mitigation 2 Mechler Reinhard, Natural Disaster Risk Management and Financing Disaster Losses in Developing Countries, Verlag Versicherungswirtschaft, 2004
Reserves
Insurance/Reinsurance
Insurance Linked Securities
Contingent credit
International Donor Assistance
Risk Retention
Risk Transfer
Low frequency High frequency
High severity
Low severity

140
of high frequency-low intensity disasters, which is largely the responsibility of government. Public investments on risk reduction of high frequency-low intensity disasters is always much more cost effective than post-disaster response, relief and reconstruction. However it is not always economical to reduce the low frequency-high intensity disasters which can be better funded by risk transfers. This model is presented in the diagram below.
11.5 There is a positive co-relationship between the coverage of disaster insurance and the level of economic development of the countries. In the low income countries insurance covers hardly 2-3% of losses and this has more or less remained constant for the past ten years. In the middle income countries insurance is taking larger burden of responsibilities – it has grown from 5% in 1997 to 13% in 2006. In high income countries insurance is covering nearly 40% of the total economic losses of disasters.
Source: Olivier Mahul, Catastrophe Insurance Markets in Developing Countries: Rationale for Public Intervention, 2008
0%
5%
10%
15%
20%
25%
30%
35%
40%
45%
50%
1997 1998 1999 2000 2001 2002 2003 2004 2005 2006
% o
f Est
imat
ed d
irect
eco
nom
ic lo
sses
High Income CountriesMiddle Income Countries
Low Income Countries

141
11.6 Various kinds of insurance products and services have been developed in different countries, particularly in transitional economies, which are briefly summed up as under:
a) Traditional hazard insurance: Traditional insurance products cover hazards on an “indemnity” basis. Policyholder insures against specific hazards and in the event of the insured item being lost or damaged he/she is compensated for the loss. Traditional insurance is effective in case of frequent non-correlated low-consequence events, such as auto accidents, fires, and routine storm damage to residential and commercial property . However natural hazards often tend to impact large areas, thus affecting large portions of the population or risk pool at the same time. This can challenge the resources of a local insurance provider. The other challenges of traditional insurance are lack of adequate actuarial data which make the task of risk assessment difficult , difficulties in verification of a large number of claims, ‘adverse selection’ of high risk insurance cases and chances of ‘moral hazard’ or insurance fraud.
b) Index Based Parametric Insurance Index-based or Parametric insurance woks on physical measurement of a hazard, such as rainfall, temperature or wind speed. It is often used for crop risks, where farmers collect insurance compensation if the index reaches a certain measure or “trigger” regardless of actual losses. Such insurance contracts are sold in standard units by rural development banks, farm cooperatives, or microfinance organisations, and the “premium” varies from crop to crop. Index-based mechanisms are also more transparent, as they are based on a physical trigger and the payout is fixed in advance. The major downside of index insurance is the basis of risk - if the trigger is insufficiently correlated with the losses experienced then no payout may occur, even if the losses are substantial.
c) Public Funded Sovereign Insurance Programmes Spain and France provide public-funded insurance programs to cover natural disaster risks. Similar programs are run in other countries to cover specific types of disasters. The National Flood Insurance Program (NFIP) in the United States covers 20,000 communities by making them adopt and enforce floodplain management In exchange, NFIP makes Federally backed flood insurance available to
142
homeowners, renters, and business owners in these communities. Various public funded insurance operate in many other countries. d) Catastrophic Pools and Bonds
In a catastrophe pool, different but similar entities such as national governments or insurance companies combine resources to form a fund which provides financial protection against catastrophic risks. Catastrophe bonds are risk-linked securities that transfer a specified set of risks from the insured to the global financial markets (investors). There are many success stories of catastrophic bonds from the emerging markets, such as Turkish Catastrophic Insurance Pool (TCIP), Mexican government’s Natural Catastrophic Fund (FONDEN) etc.
e) Turkish Catastrophic Insurance Pool Turkish Catastrophic Insurance Pool (TCIP) has been created by law by the Turkish government to provide coverage of earthquake risks to private residential dwellings through compulsory payment by homeowners. In five years, TCIP has covered approximately 2 million Turkish homeowners, built reserves of approximately $200 million and secured nearly $1 billion in total claims-paying capacity, primarily from the international reinsurance market on competitive terms. This has significantly reduced the government’s fiscal exposure to earthquake risk. Because of its low cost structure and well-managed reinsurance costs, the TCIP has been able to provide affordable catastrophe insurance for low-income urban homeowners.
f) FONDEN of Mexico The Natural Catastrophic Fund (FONDEN) of Mexico was created in 1996 with the primary goal to meet all relief and reconstruction costs in respect of hurricanes, earthquake and volcanic eruptions. The federal government invested a total premium of US$ 4,739 millions during 1996 to 2003 (2006 prices) as premium to insurance companies in return for a guarantee for payment of all costs of relief and reconstruction in 32 Mexican States as well as all Federal buildings and infrastructure which by law are compulsorily insured.
The FONDEN hired through an international public bid Swiss Re Capital Markets (SRCM) as the insurer. SRCM designed, according to the terms of reference, a financial structure where FONDEN
143
transferred the risk to European Finance Reinsurance (EFR), wholly -owned subsidiary of Swiss Re-insurance Company (SRC). EFR transferred 100% of the risk to SRC according to the following breakdown:
• Zone A (EFR transferred to SRC, SRC retain 100%) • Zone B (EFR transferred to SRC, SRC transferred to CAT -
MexLtd, and CAT-Mexto the Capital markets) • Zone C (EFR transferred to SRC, SRC retain 100%)
As per agreement SRCM releases payment for losses to be verified by Event Verification Agent (AIR) after the conditions of parametric triggers (magnitude on the Richter scale, geographic location and depth of the epicentre etc) have been met. g) Caribbean Catastrophe Risk Insurance Facility (CCRIF) Caribbean states are highly susceptible to natural disasters and have only limited options available to respond. With small economies and high debt levels, they often depend on donors to finance post-disaster needs, but donor resources often arrive late or not at all. The CCRIF was launched in June 2007 on behalf of the Caribbean Community (CARICOM) heads of government under the guidance of the World Bank with financial support from international donors. The participating governments are Anguilla, Antigua & Barbuda, Bahamas, Barbados, Belize, Bermuda, Cayman Islands, Dominica, Grenada, Haiti, Jamaica, St Kitts & Nevis, St Lucia, St Vincent & the Grenadines, Trinidad & Tobago, Turks and Caicos Islands.
The CCRIF offers parametrically triggered hurricane and earthquake insurance policies. The policies provide immediate liquidity to participating governments when affected by events with a probability of 1 in 15 years or over. The mechanism will be triggered by the intensity of the event (e.g. winds exceeding a certain speed). This means countries will get automatic payments, without having to wait for an assessment of the damage. Member governments choose how much coverage they need up to an aggregate limit of USD100 million h) Pool Reasuransi Gempa Bumi (PRGB) of Indonesia The Indonesian Earthquake Reinsurance Pool or Pool Reasuransi Gempa Bumi Indonesia (PRGBI) was set up in 2003. Participating in the Earthquake Pool was made compulsory for all general insurance

144
and reinsurance companies. At the same time a compulsory earthquake tariff was introduced and endorsed by the Government. With effect from 1st January 2004 the PRGBI was transformed into a public liability company, PT. Asuransi MAIPARK Indonesia.
i) Micro Insurance The subject of micro-insurance is attracting wide interest due to its coverage of low-income houses and businesses that are traditionally excluded from conventional insurance services. It has grown out of the micro-finance movement which provide savings, credit and other services to low-income communities according to their needs. The first micro-insurance programmes generally focused on health care and funeral cost products, but it has diversified to cover new areas like livelihoods and housing risks. Columna in Guatemala offers a variety of group insurance schemes for cooperatives and micro-insurance schemes targeting micro-enterprises. SEWA in Gujarat provides micro-insurance for informal workers to cover health and livelihood losses. MFIs in Bangladesh are offering a range of micro-insurance products
Disaster Insurance in India 11.7 Although India is the fourth largest economy in the world today with a GDP of $3 trillion measured on a purchasing power parity (PPP) basis 3, growing at the second highest rate after China 4, and India is also the third most disaster prone countries of the world after China and USA 5, the current level of insurance penetration 6 in India for natural or man made disasters is abysmally low – it is less than 1% across the country , which is lower than many least developed countries. Ironically India was probably the first among the developed countries to have an insurance legislation 7 and insurance was one of the important issues before the National Planning Committee (1938-46) under the Chairmanship of Pandit Jawharlal Nehru that developed the blueprint of economic development of independent India. A Sub-Committee on Insurance under the Chairmanship of Sir Chunilal V. Mehta listed the following risks to life and property that needed to be insured:
• Fire, flood, risks in transit of goods by land, sea, and or air 3 https://www.cia.gov/library/publications/the-world-factbook/rankorder/2001rank.html 4 India’s Rising Growth Potential, Global Economics Paper No. 152, Goldman Sachs, 2007 5 Thirty Years of Natural Disasters 1974-2003: The Numbers, CRED, Leuven, Belgium 6 Insurance penetration is measured as ration (in percent) of premium to GDP 7 The Insurance Companies Act was passed in 1912 to regulate the activities of the insurance companies that had grown to 285 by 1874.

145
• Earthquake • Riot or civil commotion, and disturbances • Burglary, Theft or Robbery • Automobile insurance, including loss by theft, fire, collision in
transit, confirmation and liability for compensation of loss etc suffered by third party
• Any "act of God" causing loss or damage to life or property. 11.8 The relatively low level of insurance penetration in India has to some extent been attributed to the fact that the non life insurance industry in India, consisting of 107 domestic and international insurers, was nationalized in 1972, with an eventual loss of service standards and entrepreneurial drive. Upon nationalization the industry was consolidated into two companies, the LIC and the GIC (with four subsidiary companies), to deal with life and non-life insurance respectively. The negative developmental implications of this oligopoly were ultimately recognized in 1994 when the Malhotra Committee recommended that private sector competition be reintroduced and after some resistance the Insurance Regulatory and Development Authority Act was passed in 1999. This facilitated introduction of many as 36 new companies in the business of which 17 are in non-life insurance sector. These companies have been expanding their business aggressively. During 2006-07 the non-life insurance companies have underwritten a premium of Rs.24905.47 crore as against Rs.20359.72 crore in 2005-06 exhibiting a growth rate of 22.33 per cent 8. 11.9 Disaster risk insurance in India is covered under the generic Fire and Special Perils Policy which offers protection against the risks of loss or damage due to ‘Fire, Lightning, Explosion/ Implosion, Aircraft Damage, Riot, Strike, Malicious and Terrorism Damage, Storm, Cyclone, Typhoon, Tempest, Hurricane, Tornado, Flood and Inundation, Impact Damage, Subsidence and Landslide including Rockslide, Bursting and/ or overflowing of Water Tanks, Apparatus and Pipes, Missile Testing operations, Leakage from Automatic Sprinkler Installations, Bush Fire’ 9. Earthquake risk has been included as one of the extended areas of coverage. Therefore only 7 out of 19 natural or man made disasters, namely fire, lightning, cyclone, flood, landslide, bush fire and earthquake are covered under the fire insurance policy. The policy pays for the actual cost of repairs, replacement or setting up of the item lost or damaged. However, claim settlements are subject to the market value of
8 Insurance Regulatory and Development Authority, Annual Report 2006-07, page 19 9 Fire and Special Perils Policy , General Insurance Corporation of India.

146
the property damaged at the time of loss upon an overall limit of the sum insured opted. 5% of each and every claim resulting from the operation of lightning, earthquake, flood and inundation, subsidence and landslide including rockslide is treated as policy excess. This probably could be one of the most attractive disaster insurance policies that give such a wide range of coverage under a single premium, and therefore it is surprising that this has not attracted as much business as it should have. Disaggregated data on the nature of property insured against Fire and Special Peril Policy and actual claims settled for specific types of natural or man made disasters are not maintained by the insuring companies. However the table below shows that fire policy covers only 16.5% of total non life insurance coverage in India. In absolute terms it amounts to only Rs. 4132 crores annually which represents a fraction of total disaster losses in India.
Table-11.1 Coverage of Non-Life Insurance- 2005-06 and 2006-07 2005-06 2006-07 Rs. Crores Percent Rs. Crores Percent Fire 3775 18.54% 4132 16.59% Marine 1284 6.31% 1628 6.54% Motor 8733 42.90% 10697 42.95% Health 2221 10.90% 3310 13.29% Others 4347 21.35% 5139 20.63% Total 20360 100.00% 24906 100.00%
Source: IRDA, Annual Report 2006-07 11.10 This only highlights the tremendous potentiality for the horizontal and vertical growth of disaster insurance business in India. Unfortunately there has not been a single in depth study to analyze the factors responsible for the poor coverage of the fire policy. To some extent, this may be attributed to the ineffective marketing on the part of insurance companies. For decades the sales and the distribution system have been handicapped by a lack of incentives and hence entre preneurship on the part of big four state-owned insurers which predominantly relied on salaried company employees for the sale of fire policies. The private insuring companies have not been able to break any ground either. Therefore Insurance Regulation and Development Authority may be advised to commission a study on fire insurance policy and recommend the enabling policy and incentive framework required for encouraging the wider acceptance of the policy in disaster prone areas of the country. A few such measures are suggested for the consideration of the Commission:
a) All houses reconstructed after disasters must be covered under a
147
comprehensive disaster insurance policy. b) Municipalities and Corporations can add a small levy to the
property tax, which can be used to buy insurance of the property against catastrophes.
c) Flat owner’s cooperative societies in urban areas may be mandated to recover insurance premium along with maintenance charges and arrange insurance against catastrophes.
d) All lending institutions, including housing loan corporations, Central & State Governments, etc must obtain insurance or cause insurance to be obtained, against catastrophes compulsorily.
e) All house building societies and organizations like Urban Development Authority, City Development Authority etc which are involved in constructions must be mandated to insure against catastrophes.
Crop Insurance Scheme
11.11 India has about 100 million farmers who work the hardest and yet seem to suffer the most. Their occupation is fraught with the highest risks as it is totally at the mercy of nature, yet these risks remain largely unprotected. The Government of India experimented with four different types of crop insurance schemes, but none of them could be considered a success.
a) Scheme based on ‘individual’ approach (1972-1978): The first ever scheme started on H-4 cotton in Gujarat, was extended to a few other crops and States. The scheme covered only 3,110 farmers for a premium of Rs. 4.54 lakhs and paid claims of Rs. 37.88 lakhs.
b) Pilot Crop Insurance Scheme (1979-1984): This was introduced
on the basis of report of late Prof. V.M.Dandekar and was based on the ‘Homogeneous Area’ approach. The scheme covered food crops, oilseeds, cotton and potato and was confined to loanee farmers on a voluntary basis. The scheme was implemented in 13 States and covered 6.27 lakh farmers, for a premium of Rs. 196.95 lakhs and paid claims of Rs. 157.05 lakhs.
c) Comprehensive Crop Insurance Scheme (1985-1999): This
scheme was an expansion of PCIS and was made compulsory for loanee farmers. Premium rates were 2% of the sum insured for cereals & millets and 1% for pulses & oilseeds, with premium and claims, shared between the Centre and States in 2:1 ratio. The

148
scheme was implemented in 16 States and 2 UTs and covered 7.63 crore farmers, for a premium of Rs. 403.56 crores and paid claims of Rs. 2,319 crores.
d) National Agriculture Insurance Scheme (1999): This was
introduced during Rabi 1999-00 by improving the scope and content of the erstwhile CCIS. The scheme is available to all States and Union Territories on an optional basis, but a State opting for the scheme will have to continue it for a minimum period of three years. All farmers including sharecroppers and tenant farmers, growing the notified crops in the notified areas are eligible for coverage. However, it is compulsory for farmers availing crop production loans. Small/Marginal farmers are subsidized in premium to the extent of 50%, to be shared equally between the Centre and the States. The premium subsidy is, however, to be phased out over a five year period on a sunset basis. Till Rabi 2005-06, NAIS covered 79.16 million farmers for a premium of Rs. 2,332.50 crores and finalized claims of Rs. 7,255.75 crores.
11.12 Therefore crop insurance in India has not been a success story. It covers hardly about 10% of sown area and suffers from an adverse claims to premium despite heavy doses of subsidy injected by the Central and State governments. There are problems with both the design and delivery of the scheme. These problems could probably be overcome with rainfall insurance with a well developed rainfall measurement infrastructure. Private and public insurers are currently experimenting with rainfall insurance products. Given the current levels of yield and rainfall variability the actuarially fair premium rates are likely to be high and in many cases unattractive or unaffordable. Instead of adopting the easy and unsustainable route of large subsidies, in the long term the government should consider risk mitigation through improvements in the irrigation and water management infrastructure 10.
Views of Finance Commissions 11.13 Finance Commissions generally did not much explore the role insurance can play for sharing the financial burden of government in meeting the expenses on disaster management even though at least two Commissions had specific mandates in their terms of reference to look into the issues of risk insurance. The Sixth Finance Commission was asked to examine the feasibility of establishing a national fund on 10 Sidharth Sinha, Agriculture Insurance in India, Institute of Financial Management and Research, 2007

149
insurance. The Commission felt that in the event of a wide-spread natural calamity the Central government would come under strong pressure to go all out and provide assistance to the affected people and the concept of national fund would break down completely in such situations. The States would view the assistance from the national fund due to them, at least, to the extent of their contribution and therefore there will always be the risk of fund being depleted even in the normal years, while in the years of adversity, it might prove wholly inadequate. The Commission also felt that there were serious operational difficulties in the constitution of such a fund. The determination of contributions of individual States to the fund would pose conceptual and practical problems. No formula, however carefully designed, would be acknowledged as fair by all the States and this would become yet another irritant in Centre-State relations. Unfortunately the Commission looked at insurance as ex-post funding mechanism by the insurance companies for providing relief after disasters, whereas insurance is essentially meant to be an ex-ante mechanism to transfer risks from the households and individuals to the market and the insurance fund was expected to provide the necessary seed money to create opportunities for such risk transfers. 11.14 The Ninth Finance Commission was again asked to examine the feasibility of establishing a national insurance fund to which the State governments may contribute a percentage of their revenue receipts. The Commission asked the Life Insurance Corporation of India (LIC) and the General Insurance Corporation of India (GIC) to examine the possibility of formulating umbrella scheme which could cover the whole range of actual calamities in which relief is currently admissible. The LIC indicated that they could cover only one item namely ex-gratia payment to a bereaved family and for this purpose suggested that the entire population of India in the age group of 18-60 years may be covered for an assured sum of Rs. 1000 per person, which would work out to an annual premium of Rs. 400 crores per annum which does not bear any co-relationship with the maximum expenditure of Rs. 84.5 lakhs incurred by the States for the loss of lives in one year. The GIC was prepared to insure hardly 20% of the total ceilings of expenditure approved for relief during 1982-87. Neither LIC nor GIC had field level organisations down to the village and block levels which could take up the task of assessing damage and losses and therefore would depend heavily on the administrative machinery of the States for assessment of damages as well as settlement of claims, which is bound to be lot more complicated and time consuming and defeat the purpose of providing timely succour the people affected by calamity . Both LIC and GIC however indicated that they could operate a Crop Insurance Scheme with budgetary support to
150
meet the gap between the premium collected and the claims settled. The Commission therefore felt that the concept of an insurance fund for disaster relief is not viable a s it would run into serious practical problems. 11.15 The Ninth Commission like the Sixth looked at insurance as an alternate mechanism for funding relief and missed the core issue of insurance, which is to transfer risks ex-ante to a market mechanism that would pay for the losses to groups of individuals through the collective premiums of a larger groups of individuals. This called for more rigorous analysis of risks, their frequencies and impacts among various income groups on the basis of which innovative products and services could be designed that could benefit both the insurer and the insured. Of course there would be challenges, as many individuals particularly the poor would not have the capacity to pay, but there would be many who could pay and even the sheer number of poor could make it work on an economy of scale particularly through the instruments like the National Insurance Fund which could partly subsidise the premiums. Unfortunately neither LIC nor GIC could come forward with such an analysis or provide a framework for designing an innovative scheme. The public sector controlled insurance industry had little incentive or competition for such innovations. But the outright rejection of the idea by the two Finance Commissions did provide a set back to the growth of disaster risk insurance in the country. Issues before the Thirteenth Commission 11.16 Although disaster insurance is not included in the specific terms of reference of the Thirteenth Finance Commission, it can not ignore the critical issues of insurance in the overall financing of disaster management in the country. By the time the recommendations of the Commission shall come into force the insurance sector reform in India would have completed a decade and the Disaster Management Act would also be completing its first five years. Despite the current slowdown the momentum of economic growth would reach new height while at the same time risks of disasters would increase due to various factors explained in this report. In this scenario innovative ideas on market based risk financing shall make a difference. Finance Commission may have limited role in spearheading such reform, but it can certainly set the ball rolling by its recommendations which may have far reaching implications. In this context it is suggested that the Commission may take a two pronged approach: first it may suggest some policy changes on disaster risk insurance and secondly, it can introduce innovative instruments of catastrophic insurance.

151
11.17 The following policy changes may be recommended by the Commission for the consideration of the government:
a) More than 600 million people of India would not be eligible for any assistance from the government for recovering from disaster losses and their numbers would be on the rise. These people may not always be able to depend on their savings for recovering from losses due to disasters. Therefore an enabling environment must be created through appropriate fiscal and other incentives so that households, individuals and companies are encouraged to buy insurance policies for protection against losses due to disasters. A number of such policy measures have been suggested in para 11.10 above.
b) These policy measures should be introduced in such a manner that
it encourages households, individuals and companies to simultaneously invest on mitigation and at the same it introduces that party inspections for compliance of mitigation standards. For example, if the rate of premium for the protection of an asset is linked with the standard of safety of a building, people would definitely invest more on safety to reduce the burden of premium. This will also encourage the growth of new compliance regime where municipal enforcement would be subjected to cross verification by insurance agencie s, which would in the long run improve the standards off municipal enforcement. Therefore spin off effects of reform will bring in more efficiency and transparency in governance.
11.18 The Commission may like to recommend that a non lapsable catastrophic insurance fund may be created from out of NDRF which may be invested in two different tracks:
a) In Track-I an amount of Rs. 500 crores may be invested annually for a period of five years to provide reinsurance facilities to domestic insurance companies which may be facing resource crunch in meeting claims due to abnormal disasters during specific years. This fund shall be recouped from the insurance companies when they are able to get over the crisis situations. The Ministry of Finance and the Insurance Regulation and Development Authority may be advised to develop a scheme in consultation with National Disaster Management Authority (NDMA) and National Executive Committee (NEC) for providing such reinsurance facilities, which

152
would include inter alia the eligibility conditions, co-lateral securities, period of repayment, rate of interest etc. This will encourage the growth of innovative disaster insurance products and services. A corpus of Rs. 2500 crores shall be maintained for this fund which shall be invested in securities as per guidelines to be laid down by the Ministry of Finance on the basis of the recommendations of the Commission.
b) In Track-II an amount of Rs. 1000 crores may be invested
annually to cover parametric disasters of very severe magnitude, on the pattern of similar funds set up in many countries, which can not be normally be funded from SDRF and NDRF. This fund shall be used for paying annual premiums to international re-insurance companies, selected on global competitive bidding, which will be willing to finance the entire costs of response, relief, rehabilitation and reconstruction of damages due to disasters, crossing the threshold limit, say for example, an earthquake of an intensity of 8 or above in the Richter scale or a cyclone of Category V or a flood caused due to rainfall of certain intensities. The details of such a scheme shall be worked out by the NEC in consultation with experts or on the basis of such further studies as the NEC may consider fit.
153
RECOMMENDATIONS
The recommendations of the study are summarised as below: Defining Disasters
1) Keeping in view the definition of ‘disaster’ in Disaster
Management Act 2005, an event may be considered as disaster for the purpose of federal financial assistance, if it results in death of 10 or more and/or injuries of 100 or more persons or ‘substantial damage’ to property as under:
a. complete damage of 5 or partial damage of 10 structures, or b. death of 10 milch/drought/other animals, or c. 50% damage of crop/plantation/ trees in majority of villages
in at least one development block of a district, or d. loss of 10 fishing boat/ canoe etc.
These conditions may however be relaxed for persons living below poverty line.
Types of Disasters 2) The existing typology of 10 ‘natural calamities’ may be broadened
to include 17 natural and manmade disasters, as under:
Natural Disasters:
Flood, Earthquake, Drought, Cyclone, Tsunami, Hailstorm, Land Slides, Avalanches, Cloud Burst, Heat and Cold Wave, Erosion and Lightning.
Man Made Disasters:
Industrial Accidents and Fire
Biological Disasters: Pest Attack, Epidemics and Pandemics.
National Disaster Response Fund 3) With effect from 1 April 2010 the National Calamity Contingency
Fund (NCCF) may be subsumed in the Natio nal Disaster Response Fund (NDRF) to be constituted by the Central Government as per section 46 of the Act.
154
4) The modalities for the operationalization of NDRF should be the same as the NCCF with the difference that instead of the Inter-Ministerial Group (IMG) it is the National Executive Committee (NEC) that would consider the report of the Joint Team and make recommendations to the High Level Committee (HLC) as per guidelines to be laid down by the Central government in consultation with the National Disaster Management Authority .
State Disaster Response Fund
5) With effect from 1 April 2010 the existing Calamity Relief Fund
(CRF) may be subsumed in the State Disaster Response Fund (SDRF) constituted under section 48 of the Act.
6) A scheme for the management of SDRF shall be notified by the
Ministry of Finance on the basis of recommendations of the Thirteenth Finance Commission.
7) The SDRF shall be made available to the State Executive
Committee (SEC) under the chairmanship of the Chief Secretary of the State constituted under section 20 of the Act.
8) The SEC shall take over the functions of the State Level
Committee under the chairmanship of Chief Secretary which is responsible for the management of the CRF at present.
District Disaster Response Fund 9) The District Disaster Response Fund (DDRF) may comprise of
funds allocated to a district by the SEC on the basis of expenditure incurred on response, relief, rehabilitation and reconstruction during the past five years as per guidelines to be laid down in the SDRF Scheme on the basis of the recommendations of the Commission.
National Disaster Mitigation Fund 10) The National Disaster Mitigation Fund (NDMF) constituted
under section 47 of the Act shall be placed at the disposal of National Disaster Management Authority for implementation of disaster risk mitigation schemes of a residual nature which are not being implemented by the Central Ministries or the State governments at present. The procedure for approval of the scheme,
155
quantum of funds required for implementation and the manner of implementation shall be decided as per the extant rules of the Central government regarding implementation of new plan schemes.
State Disaster Mitigation Fund
11) The State Disaster Management Fund (SDMF) may consist of
such fund as may be released out of the NDMF or allocated by the State government for mitigation of disaster risks of a residual nature which are not being attended under any existing scheme. Such funds shall be placed at the disposal of the State Disaster Management Authority which shall be responsible for the formulation of the scheme and its implementation as per procedure to be laid down by the State government in this regard.
District Disaster Mitigation Fund 12) The District Disaster Management Fund (DDMF) constituted
under section 48 of the Act may consist of such fund as may be released out of the NDMF or SDMF or allocated by the State government for mitigation of disaster risks of a specific nature which are not being attended under any existing scheme being implemented in the district. Such funds shall be placed at the disposal of the District Disaster Management Authority which shall be responsible for the formulation of the scheme and its implementation as per procedure to be laid down by the State government in this regard.
Principles for Allocation of NDRF
13) The existing practice of submission of Memorandum by the
States seeking assistance from the Centre and visit of a Central team for on-the-spot assessment of the damages may be discontinued. Instead a Joint Team of experts drawn from the Central and State government shall be mandated to conduct a comprehensive assessment of the damage, loss and needs of the State. The assessment may be made as per national standard to be developed for this purpose. The Team shall recommend inter alia the extent to which plan funds may be utilized for long term reconstruction of damages.
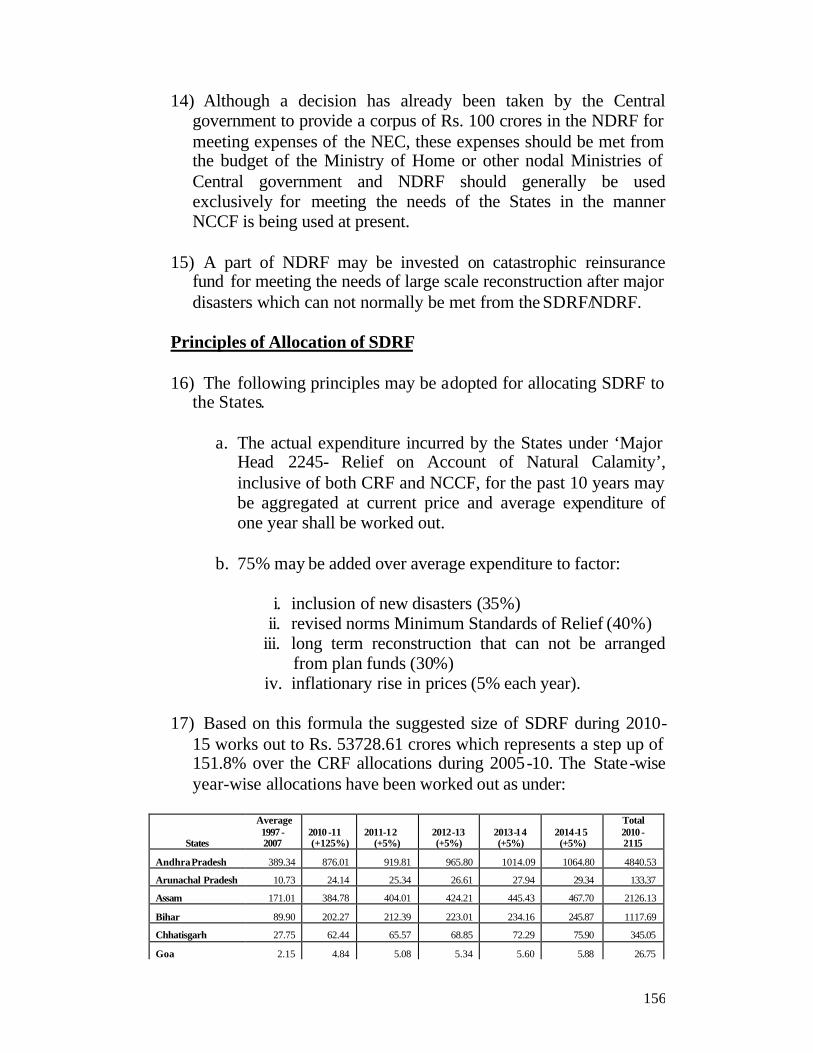
156
14) Although a decision has already been taken by the Central government to provide a corpus of Rs. 100 crores in the NDRF for meeting expenses of the NEC, these expenses should be met from the budget of the Ministry of Home or other nodal Ministries of Central government and NDRF should generally be used exclusively for meeting the needs of the States in the manner NCCF is being used at present.
15) A part of NDRF may be invested on catastrophic reinsurance
fund for meeting the needs of large scale reconstruction after major disasters which can not normally be met from the SDRF/NDRF.
Principles of Allocation of SDRF
16) The following principles may be adopted for allocating SDRF to
the States.
a. The actual expenditure incurred by the States under ‘Major Head 2245- Relief on Account of Natural Calamity’, inclusive of both CRF and NCCF, for the past 10 years may be aggregated at current price and average expenditure of one year shall be worked out.
b. 75% may be added over average expenditure to factor:
i. inclusion of new disasters (35%) ii. revised norms Minimum Standards of Relief (40%)
iii. long term reconstruction that can not be arranged from plan funds (30%)
iv. inflationary rise in prices (5% each year).
17) Based on this formula the suggested size of SDRF during 2010-15 works out to Rs. 53728.61 crores which represents a step up of 151.8% over the CRF allocations during 2005-10. The State-wise year-wise allocations have been worked out as under:
States
Average 1997 - 2007
2010 -11 (+125%)
2011-12 (+5%)
2012-13 (+5%)
2013-14 (+5%)
2014-15 (+5%)
Total 2010 - 2115
Andhra Pradesh 389.34 876.01 919.81 965.80 1014.09 1064.80 4840.53
Arunachal Pradesh 10.73 24.14 25.34 26.61 27.94 29.34 133.37
Assam 171.01 384.78 404.01 424.21 445.43 467.70 2126.13
Bihar 89.90 202.27 212.39 223.01 234.16 245.87 1117.69
Chhatisgarh 27.75 62.44 65.57 68.85 72.29 75.90 345.05
Goa 2.15 4.84 5.08 5.34 5.60 5.88 26.75

157
Gujarat 604.98 1361.20 1429.26 1500.72 1575.76 1654.55 7521.50
Haryana 97.05 218.37 229.28 240.75 252.79 265.43 1206.61
Himachal 50.11 112.75 118.38 124.30 130.52 137.04 623.00
Jaamu & Kashmir 37.02 83.30 87.47 91.84 96.44 101.26 460.31
Jharkhand 81.80 184.06 193.26 202.92 213.07 223.72 1017.03
Karnataka 103.53 232.93 244.58 256.81 269.65 283.13 1287.11
Kerala 115.51 259.89 272.88 286.53 300.85 315.89 1436.04
Madhya Pradesh 189.14 425.57 446.85 469.19 492.65 517.28 2351.53
Maharashtra 345.71 777.85 816.75 857.58 900.46 945.49 4298.13
Manipur 2.93 6.60 6.93 7.28 7.64 8.03 36.49
Meghalaya 6.31 14.21 14.92 15.66 16.45 17.27 78.50
Mizoram 5.46 12.30 12.91 13.56 14.23 14.94 67.94
Nagaland 2.62 5.89 6.18 6.49 6.82 7.16 32.53
Orissa 308.21 693.47 728.14 764.55 802.78 842.92 3831.86
Punjab 137.17 308.63 324.06 340.26 357.28 375.14 1705.38
Rajasthan 357.83 805.11 845.36 887.63 932.01 978.61 4448.72
Sikkim 14.29 32.15 33.76 35.45 37.22 39.08 177.65
Tamil Nadu 89.89 202.26 212.37 222.99 234.14 245.84 1117.59
Tripura 11.49 25.85 27.14 28.49 29.92 31.41 142.81
Uttaranchal 29.19 65.67 68.95 72.40 76.02 79.82 362.86
Uttar Pradesh 203.75 458.45 481.37 505.44 530.71 557.25 2533.21
West Bengal 173.90 391.28 410.85 431.39 452.96 475.61 2162.08
All States 3662.15 8239.84 8651.83 9084.42 9538.64 10015.58 45530.31
18) The Central Government may contribute 75% to the SDRF, as
under:
States
2010- 11
2011- 12
2012- 13
2013- 14
2014- 15
2010- 15
Andhra 657.01 689.86 724.35 760.57 798.60 3630.40
Arunachal 18.11 19.01 19.96 20.96 22.01 100.03 Assam 288.59 303.01 318.16 334.07 350.78 1594.60
Bihar 151.70 159.29 167.26 175.62 184.40 838.27
Chhatisgarh 46.83 49.18 51.64 54.22 56.93 258.79
Goa 3.63 3.81 4.01 4.20 4.41 20.06
Gujarat 1020.90 1071.95 1125.54 1181.82 1240.91 5641.13
Haryana 163.78 171.96 180.56 189.59 199.07 904.96
Himachal 84.56 88.79 93.23 97.89 102.78 467.25
J&K 62.48 65.60 68.88 72.33 75.95 345.23
Jharkhand 138.05 144.95 152.19 159.80 167.79 762.77 Karnataka 174.70 183.44 192.61 202.24 212.35 965.33
Kerala 194.92 204.66 214.90 225.64 236.92 1077.03
MP 319.18 335.14 351.89 369.49 387.96 1763.65
Maharashtra 583.39 612.56 643.19 675.35 709.12 3223.60 Manipur 4.95 5.20 5.46 5.73 6.02 27.37
Meghalaya 10.66 11.19 11.75 12.34 12.95 58.88
Mizoram 9.23 9.68 10.17 10.67 11.21 50.96

158
Nagaland 4.42 4.64 4.87 5.12 5.37 24.40
Orissa 520.10 546.11 573.41 602.09 632.19 2873.90
Punjab 231.47 243.05 255.20 267.96 281.36 1279.04
Rajasthan 603.83 634.02 665.72 699.01 733.96 3336.54
Sikkim 24.11 25.32 26.59 27.92 29.31 133.24
Tamil Nadu 151.70 159.28 167.24 175.61 184.38 838.19
Tripura 19.39 20.36 21.37 22.44 23.56 107.11
Uttaranchal 49.25 51.71 54.30 57.02 59.87 272.15
Uttar Pradesh 343.84 361.03 379.08 398.03 417.94 1899.91 West Bengal 293.46 308.14 323.54 339.72 356.71 1621.56
All States 6179.88 6488.87 6813.32 7153.98 7511.69 34147.73
19) The State Governments may contribute 25% of the SDRF as
under:
States
2010- 11
2011- 12
2012- 13
2013- 14
2014- 15
2010- 15
Andhra 219.00 229.95 241.45 253.52 266.20 1210.13
Arunachal 6.04 6.34 6.65 6.99 7.34 33.34
Assam 96.20 101.00 106.05 111.36 116.93 531.53
Bihar 50.57 53.10 55.75 58.54 61.47 279.42
Chhatisgarh 15.61 16.39 17.21 18.07 18.98 86.26
Goa 1.21 1.27 1.34 1.40 1.47 6.69
Gujarat 340.30 357.32 375.18 393.94 413.64 1880.38
Haryana 54.59 57.32 60.19 63.20 66.36 301.65
Himachal 28.19 29.60 31.08 32.63 34.26 155.75
J&K 20.83 21.87 22.96 24.11 25.32 115.08
Jharkhand 46.02 48.32 50.73 53.27 55.93 254.26
Karnataka 58.23 61.15 64.20 67.41 70.78 321.78
Kerala 64.97 68.22 71.63 75.21 78.97 359.01
MP 106.39 111.71 117.30 123.16 129.32 587.88
Maharashtra 194.46 204.19 214.40 225.12 236.37 1074.53
Manipur 1.65 1.73 1.82 1.91 2.01 9.12
Meghalaya 3.55 3.73 3.92 4.11 4.32 19.63
Mizoram 3.08 3.23 3.39 3.56 3.74 16.99
Nagaland 1.47 1.55 1.62 1.71 1.79 8.13
Orissa 173.37 182.04 191.14 200.70 210.73 957.97
Punjab 77.16 81.02 85.07 89.32 93.79 426.35
Rajasthan 201.28 211.34 221.91 233.00 244.65 1112.18
Sikkim 8.04 8.44 8.86 9.31 9.77 44.41
Tamil Nadu 50.57 53.09 55.75 58.54 61.46 279.40
Tripura 6.46 6.79 7.12 7.48 7.85 35.70
Uttaranchal 16.42 17.24 18.10 19.01 19.96 90.72
Uttar Pradesh 114.61 120.34 126.36 132.68 139.31 633.30
West Bengal 97.82 102.71 107.85 113.24 118.90 540.52
All States 2059.96 2162.96 2271.11 2384.66 2503.90 11382.58

159
Long Term Reconstruction
20) The norms of Central assistance may be reviewed to include all items of expenditure for post-disaster management including response, relief, rehabilitation and reconstruction.
21) While response, relief and reconstruction may be funded entirely
from SDRF/NDRF, reconstruction works may be dovetailed to the extent possible with the existing or future plan schemes. The extent to which plan funds can be utilized for reconstruction purposes without causing any set back to the development goals of the Fiver Year and Annual Plans of the States shall be one of the specific mandates of the Joint Assessment Team. Similar exercises shall be carried out by the States for managing long term reconstruction works after disasters when Central assistance is not sought.
22) The reconstruction works should be designed on the basis of the
principle of ‘build back better’, so that reconstructed assets are able to withstand the future disasters and scarce public resources are not wasted by temporary restoration works that do not meet even the minimum standards of reconstruction.
23) The standards of ‘relief works’ that have only wage components
and do not permit any durable assets to be constructed may be revised so that the wage components available under SDRF/NDRF can be combined with Plan Funds for construction of durable assets that can mitigate future disasters.
24) The Ministry of Home Affairs in consultation with the Planning
Commission and the National Disaster Management Authority may issue comprehensive guidelines on how SDRF/NDRF allocations can be combined with plan funds for holistic management of disasters. The guidelines shall also clearly specify how SDRF/NDRF can be utilized for long terms reconstruction works.
25) However all pre-disaster management initiatives for prevention,
mitigation and preparedness should be met entirely from the Plan budget of the States or the Disaster Mitigation Funds at national, state and district levels as envisaged in the Disaster Management Act. SDRF and NDRF shall not be available for disaster risk reduction activities.
160
External Assistance
26) There are well established international systems for humanitarian, material, technical and financial assistance to countries affected by disasters, which can supplement the national resources for quick response and rehabilitation. While as a sovereign country must always have the prerogative to seek or receive such assistance as and when it may be considered necessary, but this option should always be available, particularly for management of mega disasters.
Risk Transfer, Insurance and reinsurance 27) An enabling environment must be created through appropriate
fiscal and other incentives so that households, individuals and companies are encouraged to buy insurance policies for protection against losses due to disasters.
28) A non lapsable catastrophic insurance fund may be created from
out of NDRF which may be invested in two different tracks:
a) In Track-I an amount of Rs. 500 crores may be invested annually for a period of five years to provide reinsurance facilities to domestic insurance companies which may be facing resource crunch in meeting claims due to abnormal disasters during specific years. This fund shall be recouped from the insurance companies when they are able to get over the crisis situations. The Ministry of Finance and the Insurance Regulation and Development Authority may be advised to develop a scheme in consultation with National Disaster Management Authority (NDMA) and National Executive Committee (NEC) for providing such reinsurance facilities, which would include inter alia the eligibility conditions, co-lateral securities, period of repayment, rate of interest etc. This will encourage the growth of innovative disaster insurance products and services. A corpus of Rs. 2500 crores shall be maintained for this fund which shall be invested in securities as per guidelines to be laid down by the Ministry of Finance on the basis of the recommendations of the Commission.
b) In Track-II an amount of Rs. 1000 crores may be invested
annually to cover parametric disasters of very severe magnitude, on the pattern of similar funds set up in many countries, which can not be normally be funded from SDRF and NDRF. This

161
fund shall be used for paying annual premiums to international re-insurance companies, selected on global competitive bidding, which will be willing to finance the entire costs of response, relief, rehabilitation and reconstruction of damages due to disasters, crossing the threshold limit, say for example, an earthquake of an intensity of 8 or above in the Richter scale or a cyclone of Category V or a flood caused due to rainfall of certain intensities. The details of such a scheme shall be worked out by the NEC in consultation with experts or on the basis of such further studies as the NEC may consider fit.
National Standards for Damage Assessment
29) The entire process of damage, loss and need assessment after
disasters in the country should be reviewed. The National Institute of Disaster Management constituted under section 42 of the Act may be asked to develop a National Standard for Damage, Loss and Need Assessment in consultation with experts in the relevant fields and the State governments. The standard so developed shall be field tested and the concerned State and district officials shall be trained in their use and application. The new standards may be introduced throughout the country with effect from 1 April 2010. Similarly new standards and processes should be laid down for joint damage, loss and need assessment after major disasters.
National Disaster Statistics
30) The National Institute of Disaster Management which has the
statutory responsibility to develop ‘national level information base relating to disaster management’ shall in collaboration with the Ministry of Home Affairs, the Central Statistical Organisation and the State governments develop a comprehensive data base on every aspect of hazards, vulnerabilities, risks and disasters in the States and the districts.
Monitoring of Expenditure
31) The Ministry of Home Affairs in consultation with the Ministry
of Finance may constitute an Expert Committee to review the existing system of administrative and financial monitoring of CRF and NCCF and recommend a full proof financial management system including a computerised system for tracking expenditure, pre-contract system for emergency procurement etc that would

162
ensure that relief assistances are provided to the affected people and communities in a time bound and efficient manner with zero tolerance to irregular and corrupt practices.
*******

163
References Allen K. Settle, Financing Disaster Mitigation, Preparedness, Response, and Recovery , Public Administration Review, Vol. 45, January 1995. Andersen T. J., Managing Economic Exposures of Natural Disasters: Exploring Alternative Financial Risk Management Opportunities and Instruments, Special Report, IDB, Washington DC, 2001. Andersen T. J., and Masci, P., Economic Exposures to Natural Disasters, Public Policy, and Alternative Risk Management Approaches, Infrastructure and Financial Markets Review, 7(4), 2001. Bhatt Mihir, Risk Transfer: Agenda for Micro Insurance, All India Disaster Mitigation Institute, 2007 Bohn J. G., and Hall, B. J., The Moral Hazard of Insuring the Insurers, in Financing of Catastrophe Risk, by Froot, K. A. (ed.), University of Chicago Press, Chicago, 1999. Building Materials and Technology Promotion Council, Government of India, Vulnerability Atlas of India, 1998 and 2006. Centre for Research on Epidemiology of Disasters, Thirty Years of Natural Disasters 1974-2003: The Numbers, Leuven, Belgium. Comptroller and Auditor General of India, Performance Audit of Tsunami Relief and Rehabilitation, 2007. Das K (2002): Social Mobilization for Rehabilitation: Relief Work in Cyclone Affected Orissa, Economic and Political Weekly, Vol. 37, No. 48. Das Sarat and Jha Nandan, Natural Disasters and Relief Provisions in India: Commitments and Ground Realities Centre for Budget and Governance Accountability, 2004. General Insurance Corporation of India, Fire and Special Perils Policy , 2007. Goldman Sachs, India’s Rising Growth Potential, Global Economics Paper No. 152, 2007.
164
Insurance Regulatory and Development Authority, Annual Report 2006-07. JTCDM Working Paper Series, Public Policy and Provisioning Towards Natural Disasters in India: Some Issues and Concerns with Specific Focus on the Calamity Relief Fund, The Tata Institute of Institute of Social Sciences, 2008. Lester Rodney, Gurenko, N. Eugene, Olivier Mahul, Earthquake Insurance in Turkey , The World Bank. Mechler Reinhard, Natural Disaster Risk Management and Financing Disaster Losses in Developing Countries, Verlag Versicherungswirtschaft, 2004. Ministry of Agriculture, Government of India of India, Report of the High Powered Committee Report on Disaster Management, 2001. Ministry of Finance, Government of India, Reports of Second to Twelfth Finance Commissions, 1955-2005. Ministry of Finance, Government of India, Scheme for the Constitution and Administration of the Calamity Relief Fund, 2005. Ministry of Home Affairs, Government of India, Annual Reports, 2005-06 and 2006-07. Ministry of Home Affairs, Government of India, Items and Norms of Expenditure for Assistance from CRF and NCCF, 2004, 2005 and 2007. . Ministry of Law and Justice, Disaster Management Act, 2005. Thirteenth Finance Commission, Memorandums Submitted by the State Governments to the Thirteenth Finance Commission, 2008. National Institute of Disaster Management, Proceedings of the National Workshop on Financing Disaster Management in India, July 2008. National Disaster Management Authority, Draft Guidelines for Application of National Disaster Response Fund, 2008.

165
Parasuraman, S, Relief Assistance and Rehabilitation: Lessons in Disaster Management, Economic and Political Weekly, Vol. 30. No. 27. Parasuraman, S. and P. V. Unnikrishnan eds. India Disasters Report: Towards a Policy Initiative, 2000. Planning Commission, Government of India, Disaster Management: A Development Perspective, Tenth Five Year Plan (2002-07). Planning Commission, Government of India, Report of the Working Group on Risk Management in Agriculture for the Eleventh Five Year Plan, 2006 Planning Commission, Government of India, Report of the Working Group on Disaster Management for the Eleventh Five Year Plan, 2006 Planning Commission, Government of India, Eleventh Five Year Plan (2007-12). Ray, C. N. Earthquake Relief and Rehabilitation in Gujarat: Issues in Disaster Management, Indian Journal of Public Administration, Vol. 47, No.2. Report of the Expert Committee on Multi-Hazard Districts in India , 2008. Reserve Bank of India, Handbook of Statistics on State Finances 2003; Reserve Bank of India, Study of State Budgets 2003-04 and 2007-08. Reserve Bank of India, Occasional Paper on State Finances, 2004. Risk Management and Solutions of India, Disaster Risks in South Asia – Synthesis Report, 2008. Roberto Jovel, Damage and Loss Assessment Handbook , ECLAC, The World Bank. 2006. Sainath, P. Everybody Loves A Good Drought in S. Parasuraman and P. V. Unnikrishnan (eds), India Disasters Report: Towards a Policy Initiative, 2000.

166
Sidharth Sinha, Agriculture Insurance in India, Institute of Financial Management and Research, 2007. Swiss Re, Global Partner for natural Disaster Risk Transfer Solutions, 2008. Swiss Re, Public Private Partnerships in Risk Management, 2008. United Nations International Strategy for Disaster Reduction, http://www.unisdr.org/eng/library/lib-terminology.htm. United Nations International Strategy for Disaster Reduction, Hyogo Framework of Action 2005-15. Wisner, Ben, Piers M Blaikie, Terry Cannon , At Risk: Natural Hazards, People's Vulnerability and Disasters, Taylor and Francis, 2003. The World Bank, Hazards of Nature: Risk to Development, Independent Evaluation Group, 2006. The World Bank, Financing Rapid Onset Natural Disaster Losses in India: A Risk Management Approach , 2003.


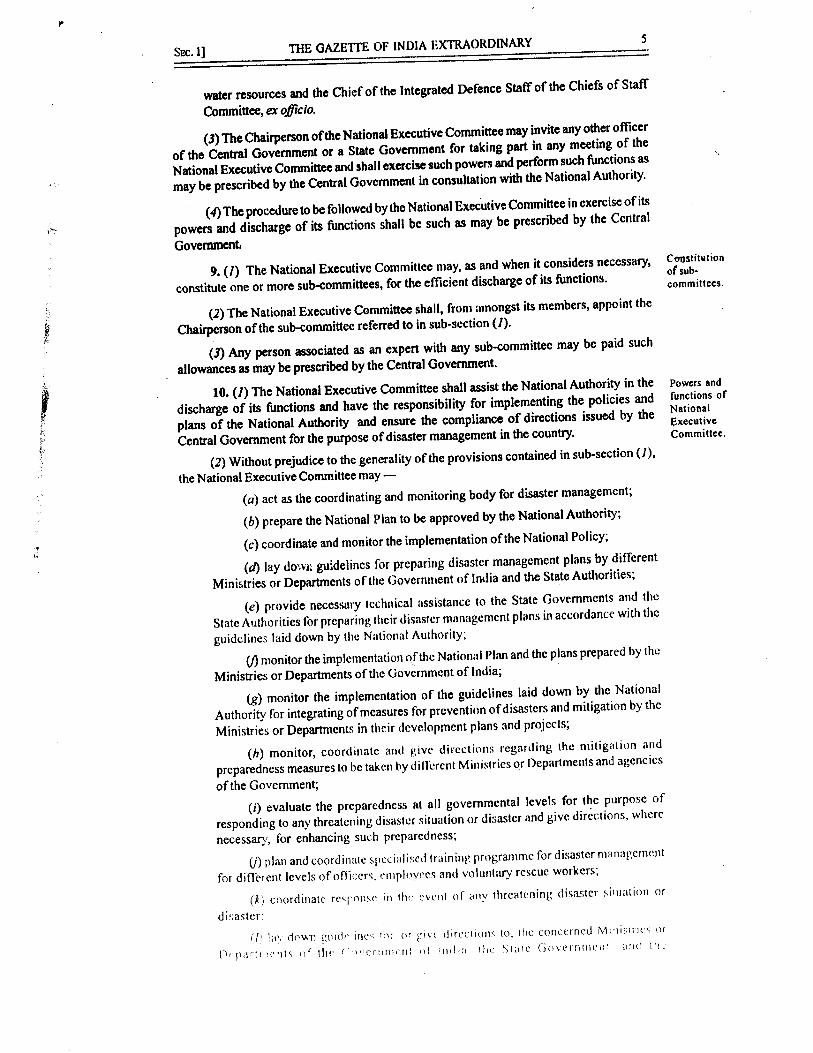


196
ANNEXURE – II
Ministry of Finance Department of Expenditure
Plan Finance Division - I Government of India
SCHEME FOR CONSTITUTION AND ADMINISTRATION OF THE CALAMITY RELIEF FUND 2005-2010
Title of the Scheme 1. The scheme shall be called 'Calamity Relief Fund’ scheme. Period of Operation 2. The scheme will be operative from financial year 2005-06 and continue till the end of the financial year 2009-10. Calamities covered under the Scheme 3. The CRF shall be used only for meeting the expenditure for providing immediate relief to the victims of cyclone, drought, earthquake, fire, flood, tsunami, hailstorm, landslide, avalanche, cloud burst and pest attack. Constitution of Calamity Relief Fund 4. The Calamity Relief Fund will be constituted in the Public Account and classified under the head "8235-General and Other Reserve Funds-111 Calamity Relief Fund" in the accounts of the State Government concerned and would be invested as per provisions of para 9 of the scheme. However, if for some reason, a State is not in a position to invest the fund in a manner prescribed in the said para 9 of the scheme, such State can be permitted by Ministry of Finance to Constitute CRF, under the head "8121- General and Other Reserve Funds – Calamity Relief Fund" in the interest bearing section of the Public Account. Contributions to the Fund 5.1 The amount of annual contribution to the Calamity Relief Fund of each State (hereinafter the “CRF”) for each of the financial years 2005-06 to 2009-10 would be as indicated in Annex-I to this scheme. Of the total contribution indicated, Government of India will contribute 75% of the total yearly allocation in the form of a non-plan grant and the balance 25% amount will be contributed by the State Government concerned. The yearly shares of the Government of India and the State Governments are shown in Annex-II and III respectively. 5.2 The share of the Government of India to the CRF shall be paid as Grants -in-aid and accounted for in the Government of India accounts under the head “3601-

197
Grants-in-aid to State Governments-01 Non-plan grants- 109 Grants towards contribution to Calamity Relief Fund". The State Governments shall take these as receipts in their budget and account under the head "1601- Grants-in-aid from Central Government-01 Non- plan Grant-109 Grants towards contribution to Calamity Relief Fund". 5.3 In order to enable transfer of the total amount of contribution to the CRF (including the State’s share of contribution), the State Governments would make suitable Budget provision on the expenditure side of their budget under the head "2245-Relief on Account of Natural Calamities-05 Calamity Relief Fund -101 Transfers to Reserve Fund and Deposit Accounts-Calamity Relief Fund". Immediately upon receipt of Government of India’s share as per para 5.2 of the scheme, the States would transfer the amount, along with their share if not already transferred, to the Public Account Head indicated in para 4 of the scheme, as the case may be. 5.4 The share of the Central Government shall be remitted to the State Governments in two instalments on June 1, and December 1, in each financial year. Likewise, the State Governments shall also transfer their contribution to the CRF in two instalments in June and December of the same year, provided that if Ministry of Finance is satisfied that exigencies of a particular calamity so warrant, the State shall be able to draw 25% of the funds due to the State in the following year from the Centre to be adjusted against the dues of the subsequent year. Release of Central Contribution to the Fund 6. The share of the Government of India to the CRF due in a year shall be released to the State Governments subject to the following conditions: (i) A 'Calamity Relief Fund' has been duly constituted by the State Government in the manner prescribed in para 4 above. The creation of the Fund duly certified by the Accountant General(A&E) of the State shall be furnished by the State Government to the Ministry of Finance before July 31, 2005. (ii) The State Government shall furnish a certificate to the Ministry of Finance in the months of April and October every year indicating that the amount received earlier has been credited to the Fund along with the State’s share of contribution, accompanied by a statement giving the up-to-date expenditure and the balance amount available in the CRF. This statement should be in the proforma at Annex-IV. (iii) Centre’s contribution due on December 1, shall be released only after the ‘Annual Report on Natural Calamities’ as per provisions of para 11.2 of the scheme is received by the Ministry of Home Affairs and the Ministry of Finance. This Annual Report shall furnish details of expenditure incurred by the State Government on each of the calamities, for each type of expenditure allowed as per the norms of CRF so fixed. (iv) Whenever CRF of a State is replenished with additional grants-in-aid from National Calamity Contingency Fund (NCCF), the State Government would treat the flow of grants from the GoI in the same manner as far as transfer and accounting is

198
concerned and furnish a specific utilization certificate, in proforma at Annex-V, within three months of the Financial year in which such a grant is released. (v) The release of both the instalments shall be made by Ministry of Finance subject to the above conditions being satisfied unless advised by Ministry of Home Affairs for withholding of release to any State. Relationship of Fund with General Revenues/ Public Account 7. The periodic contributions to the CRF as well as the other income of the CRF shall be invested in the manner prescribed in para 9 of the scheme. Wherever Government of India’s concurrence has been provided for constituting interest bearing Public Account as per para 4 above, the State Government shall pay interest to the CRF at the rate applicable to overdrafts under overdraft Regulation scheme of the RBI. The interest will be credited on a half yearly basis. State Level Committee 8.1 A State-level Committee (hereinafter referred to as ‘the Committee’) shall be constituted by the State Government to administer the CRF, by issue of a suitable notification in this behalf. A copy of the notification shall be furnished to Ministry of Finance and Ministry of Home Affairs. Composition of State Level Committees 8.2 The Chief Secretary to the State Government shall be the ex-officio Chairperson of the Committee. The Committee would consist of officials who are normally connected with relief work and experts in various fields in the State affected by natural calamities. Sub-Committee 8.3 The State Governments and/or the State level Committees may constitute sub-committees as may be considered necessary by them in connection with the work of the Committee. Functions of the State Level Committee 8.4 The Committee will decide on all matters connected with the financing of the relief expenditure from CRF. 8.5 The Committee will arrange to obtain the contributions from the concerned Governments, administer the CRF and invest the accretions to the CRF in accordance with the norms approved by the Government of India from time to time. The norms of investment are indicated in para 9.3 of the scheme. 8.6 The Committee shall also be responsible to ensure that the money drawn from the Calamity Relief Fund is actually utilised for the purposes for which the CRF has been set up, and only on items of expenditure and as per norms contained in the guidelines issued by the Ministry of Home Affairs .

199
8.7 The accretions to the CRF, together with the income earned on the investments of the Fund, will be used by the Committee to meet items of expenditure covered by the norms contained in the guidelines. No further financial assistance (beyond the Central Government’s yearly contribution to the CRF) will ordinarily be available for the purpose. Expenditure of Committee 8.8 All administrative and miscellaneous expenses of the Committee shall be borne by the State Government under its normal budgetary provisions and not from the CRF. Administration of the Fund 9.1 As stated in paragraph 8.1 above, the responsibility for the administration of the CRF will rest with the Committee. 9.2 On receipt of the amounts of contributions from the Government of India and/or the State Government, the Committee would take action for investment of the funds as per the norms prescribed in para 9.3 of the scheme. The investment of the funds shall be carried out by the branch of the Reserve Bank of India (having Banking Department ) at the headquarters of the State, or a Bank designated by RBI. In the case of Jammu & Kashmir and Sikkim, these functions shall be carried out by their bankers. Pattern of Investment from the Fund 9.3 The accretions to the Fund togethe r with the income earned on the investment of the Fund shall, till contrary instructions are issued by Government of India under para 8.5, be invested in one or more of the following instruments:
(a) Central Government dated Securities (b) Auctioned Treasury Bills (c) Interest earning deposits and certificates of deposits with Scheduled
Commercial Banks; (d) Interest earning deposits in Co-operative Banks;
Account of Investment Transactions 9.4 The Committee will, from time to time, issue instructions to the concerned local bankers indicated in para 9.2 above to invest specified amount(s) from the CRF in the securities specified in clauses (a) to (d) under paragraph 9.3. Such instructions will be issued by the Chairman or any one of the members of the Committee. The banks will immediately arrange to make the necessary investment locally or through their branches/correspondent banks/RBI at Mumbai or other metropolitan centres. The banks would scroll to the Government the debit on account of the investment and other incidental charges like brokerage, commission etc. in the usual course. However, in order to ensure that the investment transactions of the Fund

200
do not get mixed up with other transactions these may be indicated distinctly in separate scrolls. 9.5 On receipt of the scrolls the investment transactions would be accounted for under the head "8235- General and Other Reserve Fund-112 Calamity Relief Fund." The incidental charges like brokerage, commission etc. shall be accounted for as a charge on the Fund. 9.6 As far as practicable, the investment in the dated securities of the Central Government should be made in their new issues, that is to say, at the time when they are offered for subscription to the public. 9.7 The Bank will arrange to collect interest on these securities/bonds and credit the same to the account of the Government on the due date. These receipts shall form a part of the receipts of the CRF and would be accounted for as such. Further, these would require to be invested by the Committee as in the case of the contributions by the Government i.e. in accordance with the investment norms prescribed in para 9.3 above. On maturity of the securities, the proceeds will be collected and credited to the account of the Government or reinvested on the basis of instructions received from the Committee. As in the case of the debit scrolls the banks shall use separate scrolls for the receipts. 9.8 On receipt of instructions from the Committee, the concerned bank will arrange to sell the securities at the ruling price through its branches/correspondent banks/RBI at Mumbai or any other metropolitan Centre and credit the amount realised, less incidental charges, to the account of the Government. 9.9 The receipts on account of maturity or sale of the securities would be taken to the account of the "Calamity Relief Fund". The incidental charges on sale would be charged on the Fund. 9.10 The auctioned Treasury Bills may be purchased by the bank either at the Treasury B ill auctions on the basis of a non-competitive bid or in the market. Assessing Expenditure Requirements 9.11 The Committee will assess the requirements of assistance from the CRF for financing relief expenditure. The provision for expenditure on relief will be made in the budget of the State Government under the relevant heads. The extent of relief expenditure to be financed from the CRF as decided/ authorised shall be withdrawn from the Fund by the Committee after disposal of the investment holdings in the manner prescribed in para 9.12 and credited to the CRF Account. Encashment of Securities 9.12 To meet liability on account of the claims sanctioned for relief, the Committee will first dispose of its holdings of auctioned Treasury Bills to the extent required, the oldest lot of bills being sold first and so on. If the amount obtained by the sale of auctioned Treasury Bills is not sufficient to meet the liability towards relief sanctioned, the Committee may encash the deposits with the local branches of the
201
scheduled commercial banks and the co-operative banks. The Central Government dated securities may be sold only if the amount realised by the sale of treasury bills and encashment of the deposits is not adequate. 9.13 The concerned State Government will pay to the RBI/SBI/ other banks a commission at the rate determined by RBI in consultation with the concerned State Government. These charges shall also be borne by the Fund as in the case of the charges indicated in paras 9.4 and 9.8. The loss or gain on the sale of securities shall also be taken to the account of the Fund. 10.1 The norms for the amounts to be incurred on each approved item of expenditure shall be prescribed by the Ministry of Home Affairs. Concurrence of Ministry of Finance should be obtained on file on any changes proposed in the norms. In case any State Government exceeds the amount prescribed, the excess expenditure should be borne on the budget of the State Government and not on CRF. 10.2 Expenditure on training of the core multi-disciplinary group created in the State as per the guidelines of the Ministry of Home Affairs, shall be met from CRF. Items and Norms of Expenditure 10.3 The expenditure on restoration of damaged infrastructure and capital assets should be met from the normal budgetary heads, except when it is to be incurred as part of providing immediate relief. The restoration/replacement of damaged infrastructure has to be planned very often to new standards, arrived at after detailed analysis of the phenomena that caused the damage, which cannot be done as part of immediate relief assistance. Such expenditure is, therefore, to be met from plan funds. 10.4 The provision for disaster preparedness and mitigation needs to be built into the State plans, and not as a part of calamity relief. Monitoring by the Ministry of Home Affairs 11.1 The Ministry of Home Affairs will be the nodal Ministry for overseeing the operation of CRF. They shall monitor the scheme of CRF and may advise the State Level Committee from time to time in this regard to ensure proper functioning of the scheme. Further, the Ministry of Home Affairs shall recommend for adjustment/ withholding of release of any instalment to the States in the event of any deficiency/shortcoming in the implementation of the scheme by the States. 11.2 The State Governments shall be expected to furnish every year an Annual Report on Natural Calamities in the format prescribed by the Ministry of Home Affairs. This report shall be sent by every State Government to the Ministry of Home Affairs and to Ministry of Finance positively by September 30, every year. 11.3 The Ministry of Home Affairs shall, inter-alia, undertake evaluation of the expenditure incurred out of CRF. They will get such evaluation done by an independent agency for at least six States in a year, so as to ensure that the evaluation

202
for all States is done at least once in five years. Terms of Reference for the independent evaluation shall be decided by the Ministry of Home Affairs in consultation with Ministry of Finance. Unspent Balance in the Fund. 12. The unspent balance in the CRF as at the end of the Financial year 2004-05 shall be the opening balance of CRF for 2005-06. Any balance available at the end of 2005-10 will be available to the State Government for being used as a resource for the next plan, if the scheme of CRF is discontinued by GoI upon consideration of XIII Finance Commission recommendations. Otherwise, the closing balance would be available for re lief expenditure under CRF in the ensuing period of 2010-2015. Accounts and Audit 13.1 The Accounts of the Fund and the investment shall be maintained by the Accountant General in charge of accounts of the State in the normal course. The Committee will, however, maintain subsidiary accounts in such manner and details as may be considered necessary by the State Government in consultation with the Accountant General. 13.2. Comptroller and Auditor General of India would cause audit of CRF to be conducted every year in terms of the purposes of the CRF scheme. The State Government shall furnish a copy of the audit report of the Comptroller and Auditor General of India in respect of CRF to the Ministry of Finance, which in turn, will provide a copy to the Ministry of Home Affairs. Savings 14. The Ministry of Finance shall issue instructions relating to the provisions of the scheme, as may be considered from time to time, to enable smooth functioning of the scheme. The Ministry of Finance may also alter/modify the scheme, if considered necessary subsequently. In case of any difficulty in the operation of any provision of this scheme, the Central Government, if satisfied, may relax the provisions.

203
ANNEXURE - III
ITEMS AND NORMS OF EXPENDITURE FOR ASSISTANCE FROM CRF AND NCCF 2004-5 and 2007
ITEMS No. 32 -22/2004 - NDM I Government of India
Ministry of Home Affairs 10th September, 2004 and 23rd
November, 2004 and 15th June 2005
No.32 -34/2005-NDM-I Government of India
Ministry of Home Affairs (Disaster Management – I Division)
27th June 2007
% Increase
Gratuitous Relief
1 A Ex-Gratia payment to families of deceased person.
Rs 50,000/ - per deceased Rs. 1.00 lakh per deceased i) It would be necessary to obtain a Certificate of cause of death issued by an appropriate authority designated by the State Government certifying that the death has occurred due to a natural calamity notified by the Ministry of Finance in the Scheme of CRF/NCCF. ii) In the case of a Government employee/relief worker who loses his/her life, while engaged in rescue and relief operations, in the aftermath of a notified natural calamity or during preparedness activities like mock drills etc., his/her family would be paid ex-gratia @ Rs.1.00 lakh per deceased. iii) In case of an Indian citizen who loses his life due to a notified natural calamity in a foreign country, his family would not be
100%

204
paid this relief. iv) Similarly, in the case of a Foreign citizen who loses his life due to a notified natural calamity within the territory of India, his family would also not be paid this relief.
B Ex-Gratia payment for loss of a limb or eyes.
Rs 25,000/ - per person (The Gratuitous relief for loss of limb etc. should be extended only when the disability is more than 40% and certified by Govt. doctor or doctors from panel approved by the Govt.)
i) Rs. 35,000/- per person (when the disability is between 40% and 75% duly certified by a Government doctor or doctor from a panel approved by the Government). ii) Rs.50,000/- per person (when the disability is more than 75% duly certified by a Government doctor or doctor from a panel approved by the Government)
40% to 100%
C Grievous injury requiring hospitalization for more than a week.
Rs 5,000/- per person i) Rs.7,500 per person (grievous injury requiring hospitalization for more than a week) ii) Rs.2,500 per person (grievous injury requiring hospitalization for less than a week)
-50% to +50%
D Relief for the old. Infirm and destitute children.
Rs 20/- per adult. Rs. 10/- per child per day
Rs.20/ - per adult, and Rs15 per child per day
No change
E Clothing and utensils for families for whose house have been washed away.
Rs. 500/ - for clothing and Rs. 500/- for utensils per family
Rs.1000/ - for loss of clothing per family and Rs.1000/- for loss of utensils/household goods per family.
100%
F Gratuitous Relief for families in dire need of immediate sustenance after a calamity. GR should only be given to those who have no food reserves, or whose food
Rs.20/- per adult and Rs.10/ - per child per day, in kind only ( for essential commodities like Atta, foodgrains, kerosene oil, vegetables, match-boxes, coconut oil etc.) maximum for a period of two weeks or as
Rs. 20/- per adult, Rs.15/- per child per day. 0% to 50%

205
reserves have been wiped out in a calamity, and who have no other immediate means of support.
recommended by Central Team
Period for providing gratuitous relief i) Natural Calamities other than drought and pest attack (locust and rodent menace only) a) Upto a maximum period of 15 days b) In the case of above mentioned notified natural calamities of a severe nature, relief can be provided upto 30 days with the approval of State Level Committee for assistance to be provided under CRF and as per the assessment of the Central Team for assistance to be provided under NCCF. ii) Drought/pest attack (locust and rodent menace only) a) The maximum period for which the relief can be provided is upto 60 days and in case of severe drought/pest attack upto 90 days b) In case the drought/pest attack situation persists beyond 90 days, the State Level Committee shall, after a detailed review, decide the further period for which relief can be provided from CRF, on a month to month basis, co-terminus with the actual period of prevailing situation.
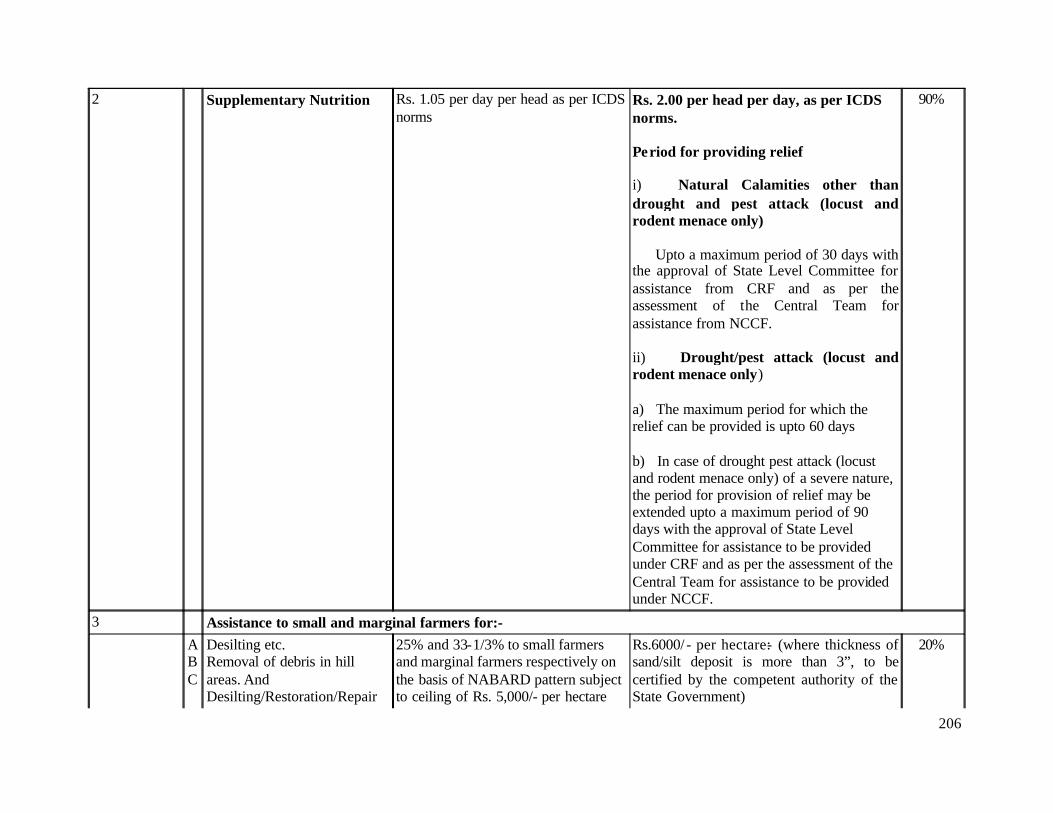
206
2 Supplementary Nutrition Rs. 1.05 per day per head as per ICDS norms
Rs. 2.00 per head per day, as per ICDS norms. Period for providing relief i) Natural Calamities other than drought and pest attack (locust and rodent menace only) Upto a maximum period of 30 days with the approval of State Level Committee for assistance from CRF and as per the assessment of the Central Team for assistance from NCCF. ii) Drought/pest attack (locust and rodent menace only) a) The maximum period for which the relief can be provided is upto 60 days b) In case of drought pest attack (locust and rodent menace only) of a severe nature, the period for provision of relief may be extended upto a maximum period of 90 days with the approval of State Level Committee for assistance to be provided under CRF and as per the assessment of the Central Team for assistance to be provided under NCCF.
90%
3 Assistance to small and marginal farmers for:- A
B C
Desilting etc. Removal of debris in hill areas. And Desilting/Restoration/Repair
25% and 33-1/3% to small farmers and marginal farmers respectively on the basis of NABARD pattern subject to ceiling of Rs. 5,000/- per hectare
Rs.6000/ - per hectare:- (where thickness of sand/silt deposit is more than 3”, to be certified by the competent authority of the State Government)
20%
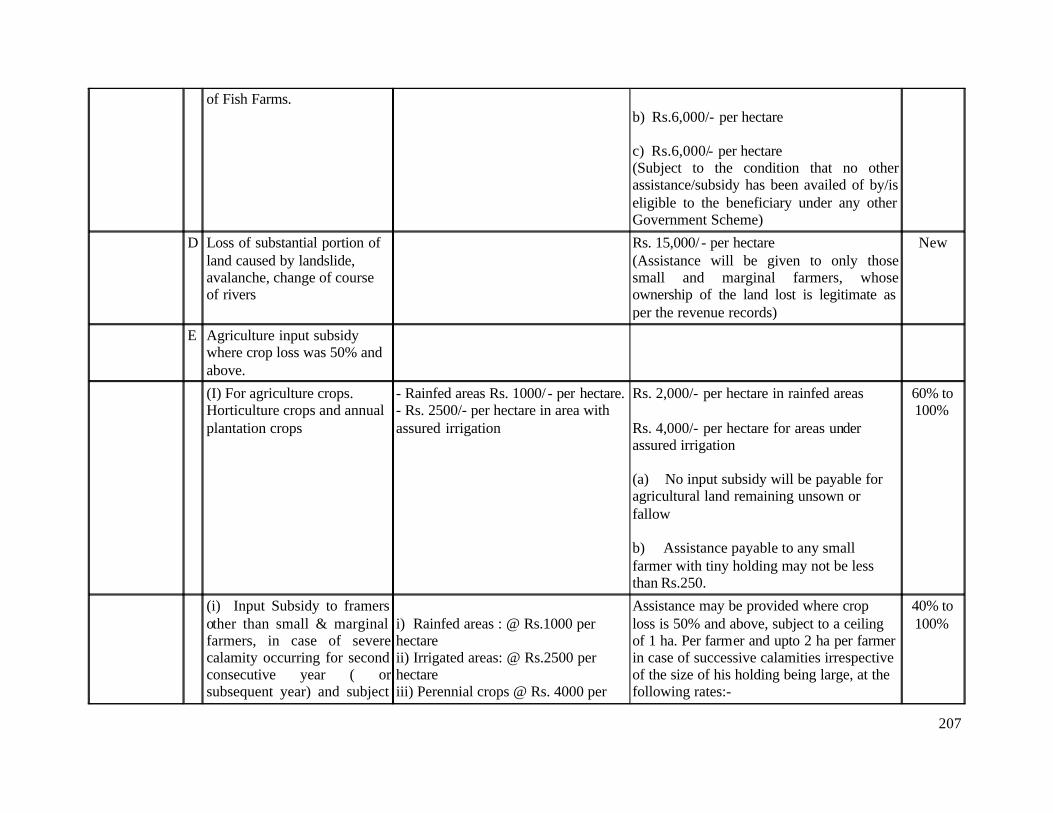
207
of Fish Farms. b) Rs.6,000/- per hectare c) Rs.6,000/- per hectare (Subject to the condition that no other assistance/subsidy has been availed of by/is eligible to the beneficiary under any other Government Scheme)
D Loss of substantial portion of land caused by landslide, avalanche, change of course of rivers
Rs. 15,000/ - per hectare (Assistance will be given to only those small and marginal farmers, whose ownership of the land lost is legitimate as per the revenue records)
New
E Agriculture input subsidy where crop loss was 50% and above.
(I) For agriculture crops. Horticulture crops and annual plantation crops
- Rainfed areas Rs. 1000/ - per hectare. - Rs. 2500/- per hectare in area with assured irrigation
Rs. 2,000/- per hectare in rainfed areas Rs. 4,000/- per hectare for areas under assured irrigation (a) No input subsidy will be payable for agricultural land remaining unsown or fallow b) Assistance payable to any small farmer with tiny holding may not be less than Rs.250.
60% to 100%
(i) Input Subsidy to framers other than small & marginal farmers, in case of severe calamity occurring for second consecutive year ( or subsequent year) and subject
i) Rainfed areas : @ Rs.1000 per hectare ii) Irrigated areas: @ Rs.2500 per hectare iii) Perennial crops @ Rs. 4000 per
Assistance may be provided where crop loss is 50% and above, subject to a ceiling of 1 ha. Per farmer and upto 2 ha per farmer in case of successive calamities irrespective of the size of his holding being large, at the following rates:-
40% to 100%

208
to the condition that the subsidy will be payable at appropriate rate per hectare upto 2 hectares only, irrespective of the size of holdings
hectare
i) Rs. 2,000/- per hectare in rainfed areas ii) Rs. 4,000/- per hectare for areas under assured irrigation iii) Rs. 6,000/- per hectare for all types of perennial crops No input subsidy will be payable for agricultural land remaining unsown or fallow.
(II) Perennial crops Rs. 4,000 per hectare Rs.6,000 per hectare for all types of perennial crops. a) No input subsidy will be payable for agricultural land remaining unsown or fallow . b) Assistance payable to any small farmer with tiny holding may not be less than Rs.500/-.
50%
(III) Assistance to sericulture farmers
Rs. 2000/- Per hectare for muga Rs.1500/- Per hectare for Eri and Mulberry
Rs. 2,000/- per ha. For Eri, Mulberry and Tussar Rs. 2,500/- per ha. For Muga
0% to 66%
F Loss of substantial partition of land caused by landslide, avalanche, change of course of rivers.
Rs. 10,000/- per hectare Rs. 15,000/ - per hectare 50%
4 Employment Generation (only to meet additional requirements after taking into account, funds available under
Daily wages to be at par with minimum wage for unskilled labourers prescribed by the State Government concerned. Contribution
i) Daily wages to be at par with minimum wage for unskilled labourers notified by the State Government concerned.
Same
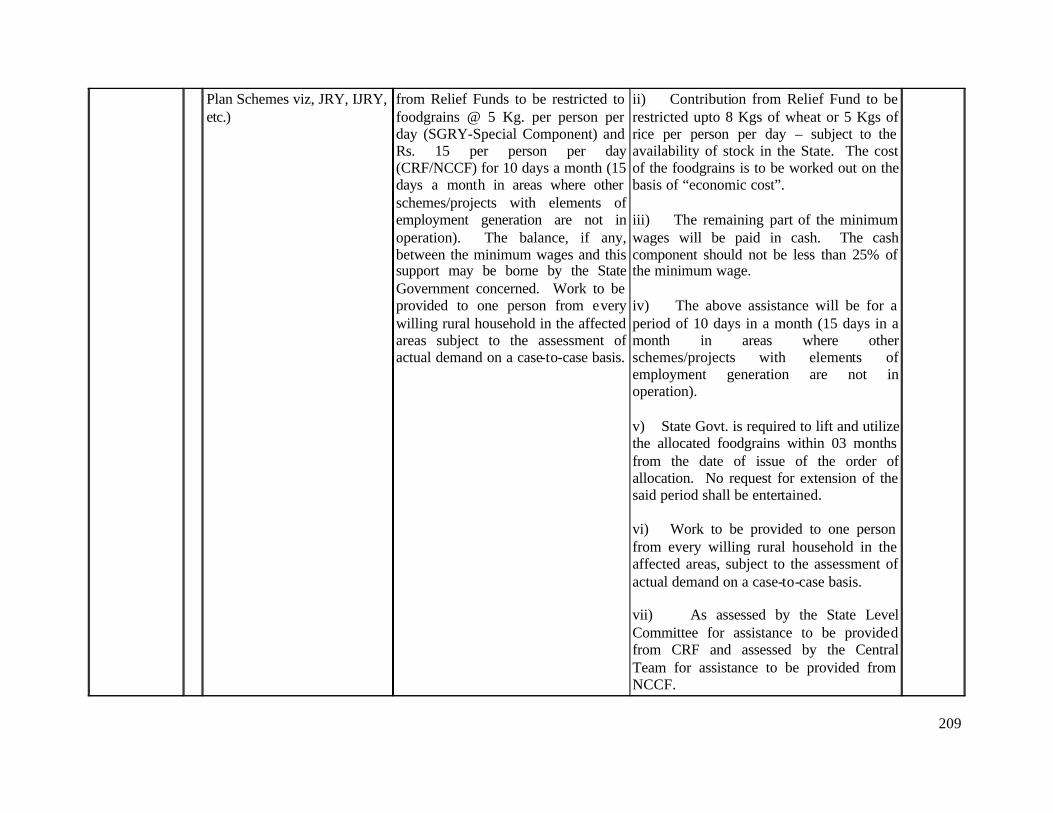
209
Plan Schemes viz, JRY, IJRY, etc.)
from Relief Funds to be restricted to foodgrains @ 5 Kg. per person per day (SGRY-Special Component) and Rs. 15 per person per day (CRF/NCCF) for 10 days a month (15 days a month in areas where other schemes/projects with elements of employment generation are not in operation). The balance, if any, between the minimum wages and this support may be borne by the State Government concerned. Work to be provided to one person from every willing rural household in the affected areas subject to the assessment of actual demand on a case-to-case basis.
ii) Contribution from Relief Fund to be restricted upto 8 Kgs of wheat or 5 Kgs of rice per person per day – subject to the availability of stock in the State. The cost of the foodgrains is to be worked out on the basis of “economic cost”. iii) The remaining part of the minimum wages will be paid in cash. The cash component should not be less than 25% of the minimum wage. iv) The above assistance will be for a period of 10 days in a month (15 days in a month in areas where other schemes/projects with elements of employment generation are not in operation). v) State Govt. is required to lift and utilize the allocated foodgrains within 03 months from the date of issue of the order of allocation. No request for extension of the said period shall be entertained. vi) Work to be provided to one person from every willing rural household in the affected areas, subject to the assessment of actual demand on a case-to-case basis. vii) As assessed by the State Level Committee for assistance to be provided from CRF and assessed by the Central Team for assistance to be provided from NCCF.
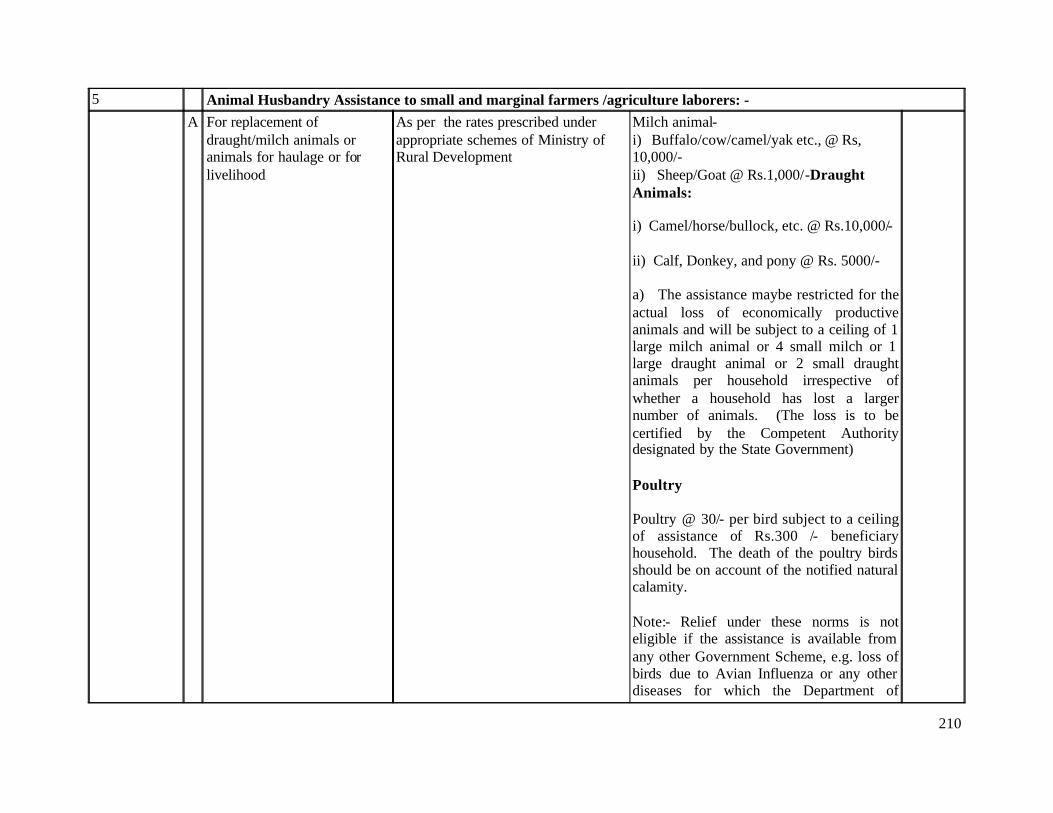
210
5 Animal Husbandry Assistance to small and marginal farmers /agriculture laborers: - A For replacement of
draught/milch animals or animals for haulage or for livelihood
As per the rates prescribed under appropriate schemes of Ministry of Rural Development
Milch animal- i) Buffalo/cow/camel/yak etc., @ Rs, 10,000/- ii) Sheep/Goat @ Rs.1,000/-Draught Animals: i) Camel/horse/bullock, etc. @ Rs.10,000/- ii) Calf, Donkey, and pony @ Rs. 5000/- a) The assistance maybe restricted for the actual loss of economically productive animals and will be subject to a ceiling of 1 large milch animal or 4 small milch or 1 large draught animal or 2 small draught animals per household irrespective of whether a household has lost a larger number of animals. (The loss is to be certified by the Competent Authority designated by the State Government) Poultry Poultry @ 30/- per bird subject to a ceiling of assistance of Rs.300 /- beneficiary household. The death of the poultry birds should be on account of the notified natural calamity. Note:- Relief under these norms is not eligible if the assistance is available from any other Government Scheme, e.g. loss of birds due to Avian Influenza or any other diseases for which the Department of
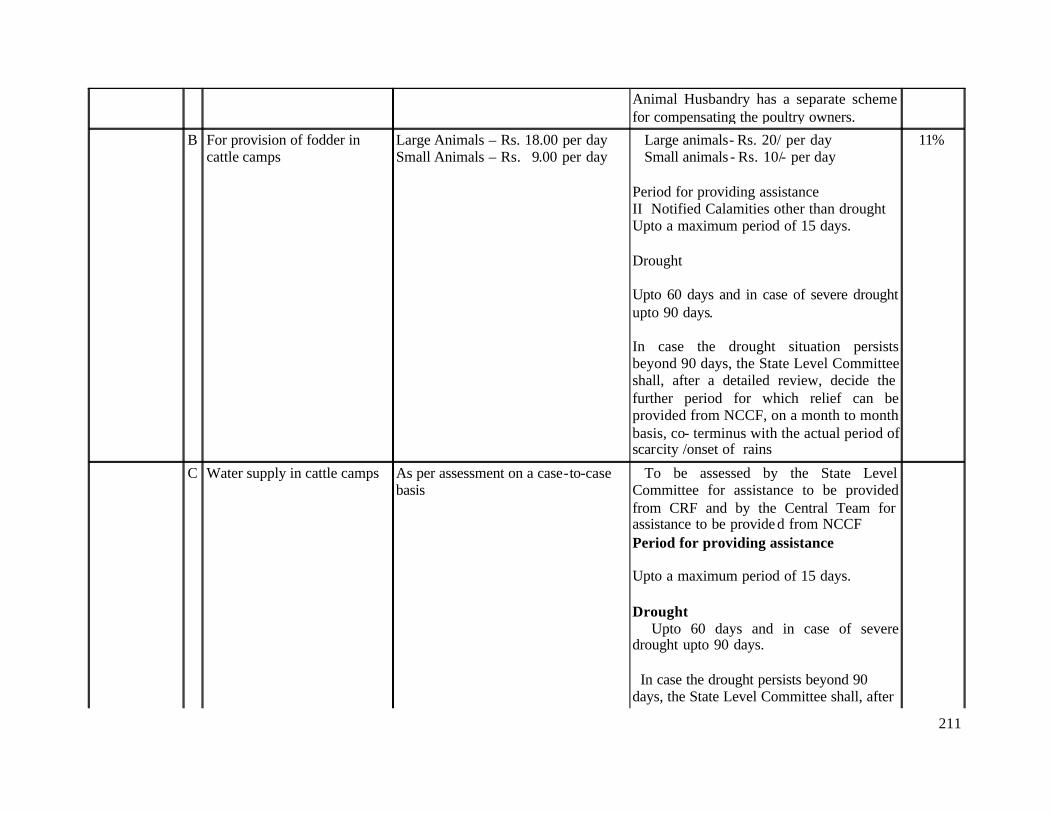
211
Animal Husbandry has a separate scheme for compensating the poultry owners.
B For provision of fodder in cattle camps
Large Animals – Rs. 18.00 per day Small Animals – Rs. 9.00 per day
Large animals- Rs. 20/ per day Small animals - Rs. 10/- per day Period for providing assistance II Notified Calamities other than drought Upto a maximum period of 15 days. Drought Upto 60 days and in case of severe drought upto 90 days. In case the drought situation persists beyond 90 days, the State Level Committee shall, after a detailed review, decide the further period for which relief can be provided from NCCF, on a month to month basis, co- terminus with the actual period of scarcity /onset of rains
11%
C Water supply in cattle camps As per assessment on a case-to-case basis
To be assessed by the State Level Committee for assistance to be provided from CRF and by the Central Team for assistance to be provided from NCCF Period for providing assistance Upto a maximum period of 15 days. Drought Upto 60 days and in case of severe drought upto 90 days. In case the drought persists beyond 90 days, the State Level Committee shall, after
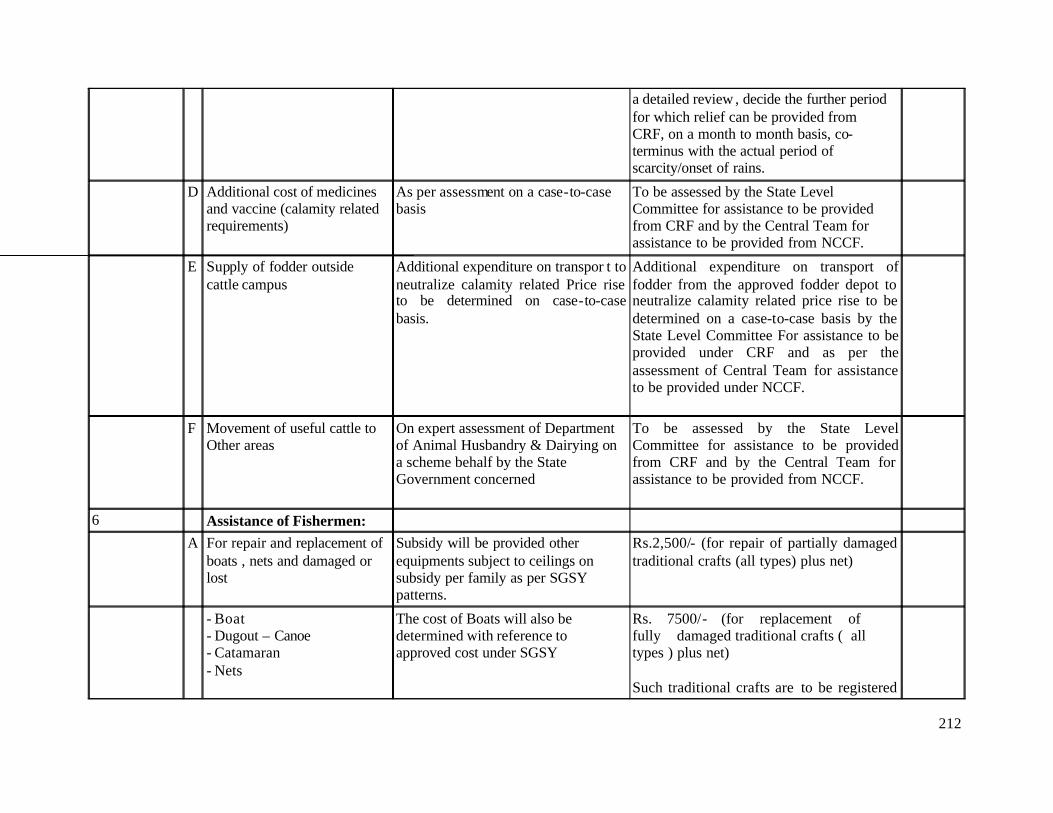
212
a detailed review , decide the further period for which relief can be provided from CRF, on a month to month basis, co-terminus with the actual period of scarcity/onset of rains.
D Additional cost of medicines and vaccine (calamity related requirements)
As per assessment on a case-to-case basis
To be assessed by the State Level Committee for assistance to be provided from CRF and by the Central Team for assistance to be provided from NCCF.
E Supply of fodder outside cattle campus
Additional expenditure on transpor t to neutralize calamity related Price rise to be determined on case-to-case basis.
Additional expenditure on transport of fodder from the approved fodder depot to neutralize calamity related price rise to be determined on a case-to-case basis by the State Level Committee For assistance to be provided under CRF and as per the assessment of Central Team for assistance to be provided under NCCF.
F Movement of useful cattle to Other areas
On expert assessment of Department of Animal Husbandry & Dairying on a scheme behalf by the State Government concerned
To be assessed by the State Level Committee for assistance to be provided from CRF and by the Central Team for assistance to be provided from NCCF.
6 Assistance of Fishermen:
A For repair and replacement of boats , nets and damaged or lost
Subsidy will be provided other equipments subject to ceilings on subsidy per family as per SGSY patterns.
Rs.2,500/- (for repair of partially damaged traditional crafts (all types) plus net)
- Boat - Dugout – Canoe - Catamaran - Nets
The cost of Boats will also be determined with reference to approved cost under SGSY
Rs. 7500/- (for replacement of fully damaged traditional crafts ( all types ) plus net) Such traditional crafts are to be registered

213
with the State Government. Extent of damage (partial or fully) to be determined/certified by a competent authority designated by the State Government.
B Input subsidy for fish farm Rs 2000/- per hectare Rs. 4,000/- per hectare (this assistance will not be provided if the beneficiary is eligible for or has availed of any other Government Scheme except the one time subsidy provided under the Scheme of Department of Animal Husbandry, Dairying and Fisheries, Ministry of Agriculture)
100%
7 Assistance to artisans in Handicrafts sector by way subsidy for repair / replacement of damaged equipments. A Traditional Crafts
(i) For damage equipments. (ii) For raw materials
Rs. 1,000/ - per person Rs. 1,000/ - per person
Rs. 2,000/- per artisan Damaged/replacement to be duly certified by Competnet Authority designated by the State Government. Rs. 2,000/- per artisan Damaged/replacement to be duly certified by Competnet Authority designated by the State Government.
100%
B For Handloom Weavers (i) Repairs/ replacement of loom equipments and accessories
Rs. 1,000/ - per loom
For repair of loom Rs. 1,000/- per loom For replacement of looms Rs.2,000/- per loom Damage/replacement to be certified by Competnet Authority designated by the Government.
100%
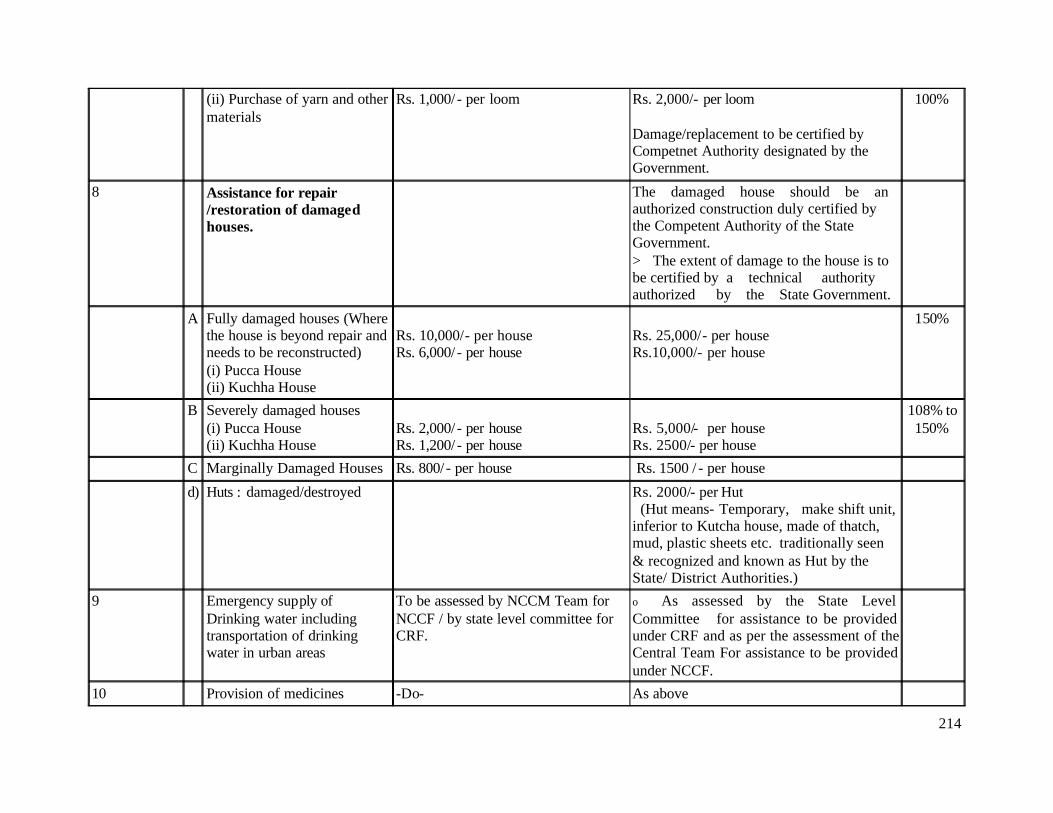
214
(ii) Purchase of yarn and other materials
Rs. 1,000/ - per loom Rs. 2,000/- per loom Damage/replacement to be certified by Competnet Authority designated by the Government.
100%
8 Assistance for repair /restoration of damaged houses.
The damaged house should be an authorized construction duly certified by the Competent Authority of the State Government. > The extent of damage to the house is to be certified by a technical authority authorized by the State Government.
A Fully damaged houses (Where the house is beyond repair and needs to be reconstructed) (i) Pucca House (ii) Kuchha House
Rs. 10,000/- per house Rs. 6,000/ - per house
Rs. 25,000/- per house Rs.10,000/- per house
150%
B Severely damaged houses (i) Pucca House (ii) Kuchha House
Rs. 2,000/ - per house Rs. 1,200/ - per house
Rs. 5,000/- per house Rs. 2500/- per house
108% to 150%
C Marginally Damaged Houses Rs. 800/ - per house Rs. 1500 / - per house
d) Huts : damaged/destroyed Rs. 2000/- per Hut (Hut means- Temporary, make shift unit, inferior to Kutcha house, made of thatch, mud, plastic sheets etc. traditionally seen & recognized and known as Hut by the State/ District Authorities.)
9 Emergency supply of Drinking water including transportation of drinking water in urban areas
To be assessed by NCCM Team for NCCF / by state level committee for CRF.
o As assessed by the State Level Committee for assistance to be provided under CRF and as per the assessment of the Central Team For assistance to be provided under NCCF.
10 Provision of medicines -Do- As above

215
disinfectants, insecticides for prevention of outbreak of epidemics
11 Medical Care for cattle and poultry against epidemics.
-Do- As above
12 Evacuation of people affected/ likely to be affected
-Do- As above
13 Hiring of boats for carrying immediate relief & saving life
-Do- As above The quantum of assistance will be limited to the actual expenditure incurred on hiring boats and essential equipment required for rescuing stranded people and thereby saving human lives during a notified natural calamity.
14 Provision of Temporary accommodation, food clothing, medical care etc., of people affected/evacuated
-Do- As assessed by the State Level Committee for assistance to be provided under CRF and as per the assessment of the Central Team for assistance to be provided under NCCF. Quantum of assistance will be limited to the actual expenditure incurred, during the specified period. Period In case of natural calamities other than drought for a maximum period upto 15 days In case of natural calamities other than drought of a severe nature for a maximum period upto 30 days Drought

216
In case of drought, the maximum period for which the relief can be provided is upto 60 days and in case of severe drought upto 90 days. In case the drought situation persists beyond 90 days, the State Level Committee shall, after a detailed review, decide the further period for which relief can be provided, on a month to month basis, co-terminus with the actual period of scarcity /onset of rams
15 Air Dropping of essential supplies
-Do- As assessed by the State Level Committee for assistance to be provided under CRF and as per the assessment of the Central Team for assistance to be provided under NCCF. > The quantum of assistance will be limited to actual amount raised in the bills by the Air Force/other aircraft providers for airdropping of essential supplies and rescue operations only.
16 Repair/restoration of immediate nature of the damaged infrastructure relating to communication, power, public health, drinking water supply primary education and community owned assets in the social sector.
-Do- Activities of immediate nature > An illustrative list of activities which may be considered as works of an immediate nature are given in the enclosed Appendix. Time Period > The following time limits are indicated for undertaking works of immediate nature :- For Plain areas a) 30 days in case of calamity of normal

217
magnitude. b) 45 days in case of calamity of severe magnitude. For hilly areas and North Eastern States a) 45 days in case of calamity of normal magnitude, b) 60 days in case of calamity of severe magnitude. Assessment of requirements On the basis of assessment made by the State Level Committee for assistance to be provided under CRF and on the basis of the assessment of the Central Team for assistance to be provided under NCCF.
17 Replacement of damaged medical equipments and lost medicines of Govt. hospitals/health centers.
-Do- As assessed by the State Level Committee for assistance to be provided under CRF and as per the assessment of the Central Team for assistance to be provided under NCCF. The quantum of relief will be limited to the actual expenditure incurred.
18 Operational cost (of POL only) for Ambulance Service, Mobile Medical Teams temporary dispensaries.
-Do- As above > The list of items, which fall under operational cost, will generally include:- ¦ Cost of putting up temporary medical camps/ temporary dispensaries. ¦ Hiring of ambulance vehicles. ¦ Hiring of transport vehicles for mobile medical teams only. Actual POL expenditure for ambulance and transport vehicles for mobile medical

218
teams.
19 Cost of clearance of debris -Do- As assessed by the State Level Committee for assistance to be provided under CRF and as per the assessment of the Central Team for assistance to be provided under NCCF. > The quantum of relief will be limited to the actual expenditure incurred. > Cost of clearance of debris includes removal of debris of stones, bricks, steel/iron which is restricted to inhabited areas only.
20 Draining off flood water in affected areas
-Do- As assessed by the State Level Committee for assistance to be provided under CRF and as per the assessment of the Central Team for assistance to be provided under NCCF > The quantum of relief will be limited to the actual expenditure incurred.
21 Cost of search and rescuer measures
-Do- As assessed by the State Level Committee for assistance to be provided under CRF and as per the assessment of the Central Team for assistance to be provided under NCCF. > The quantum of relief will be limited to the actual expenditure incurred on search and rescue operations within a period of two weeks of the notified natural calamity.
22 Disposal of dead bodies/carcasses
-Do- On actual basis, as reported by the State Government or as recommended by the Central Team.
23 Training to core Expenditure to be met from CRF Expenditure is to be incurred from CRF
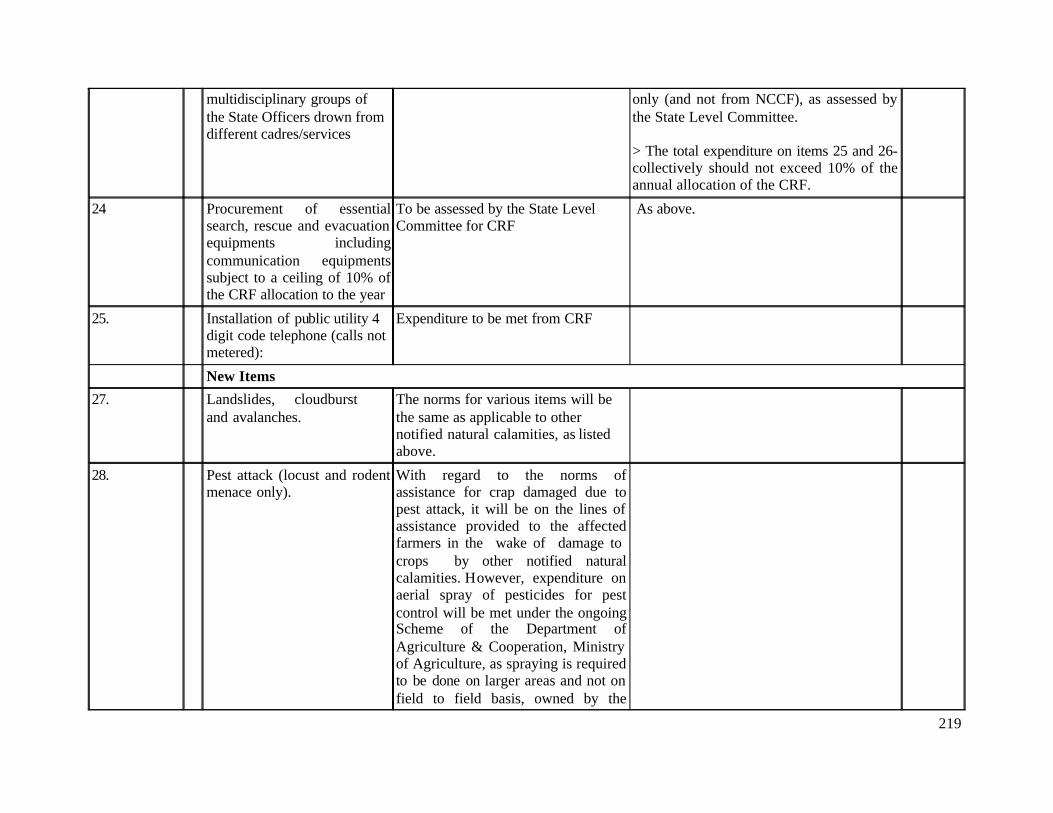
219
multidisciplinary groups of the State Officers drown from different cadres/services
only (and not from NCCF), as assessed by the State Level Committee. > The total expenditure on items 25 and 26- collectively should not exceed 10% of the annual allocation of the CRF.
24 Procurement of essential search, rescue and evacuation equipments including communication equipments subject to a ceiling of 10% of the CRF allocation to the year
To be assessed by the State Level Committee for CRF
As above.
25. Installation of public utility 4 digit code telephone (calls not metered):
Expenditure to be met from CRF
New Items
27. Landslides, cloudburst and avalanches.
The norms for various items will be the same as applicable to other notified natural calamities, as listed above.
28. Pest attack (locust and rodent menace only).
With regard to the norms of assistance for crap damaged due to pest attack, it will be on the lines of assistance provided to the affected farmers in the wake of damage to crops by other notified natural calamities. However, expenditure on aerial spray of pesticides for pest control will be met under the ongoing Scheme of the Department of Agriculture & Cooperation, Ministry of Agriculture, as spraying is required to be done on larger areas and not on field to field basis, owned by the
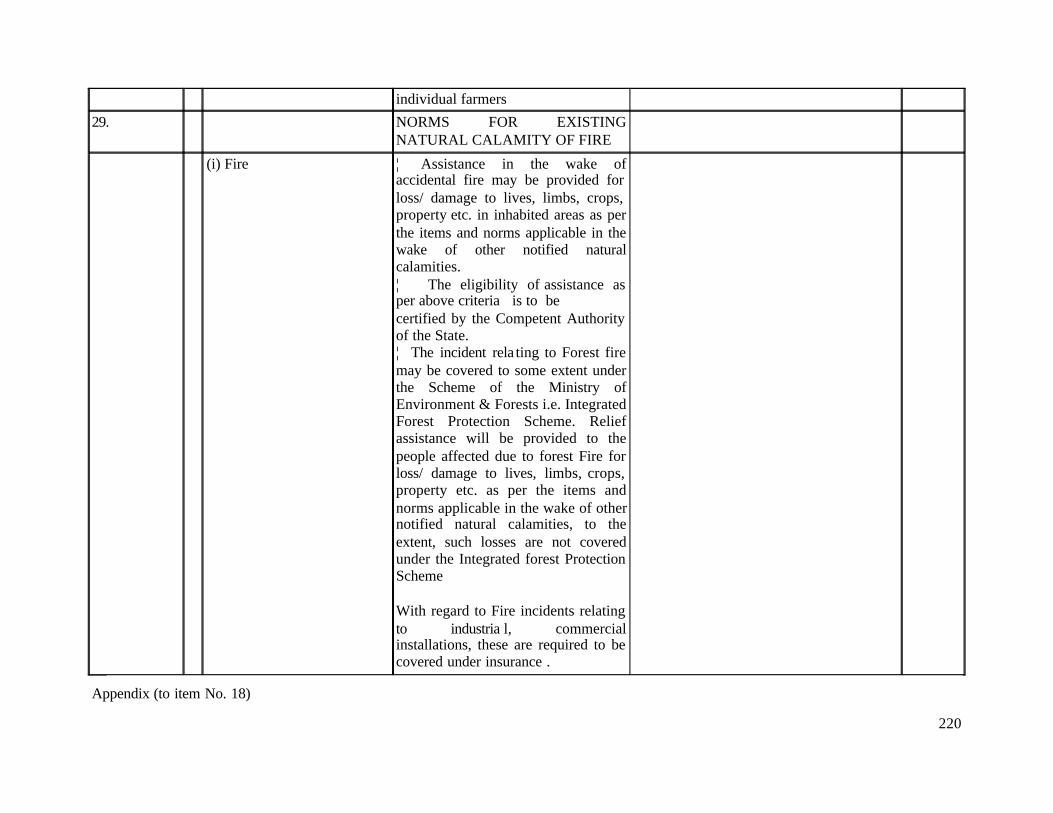
220
individual farmers
29. NORMS FOR EXISTING NATURAL CALAMITY OF FIRE
(i) Fire ¦ Assistance in the wake of accidental fire may be provided for loss/ damage to lives, limbs, crops, property etc. in inhabited areas as per the items and norms applicable in the wake of other notified natural calamities. ¦ The eligibility of assistance as per above criteria is to be certified by the Competent Authority of the State. ¦ The incident rela ting to Forest fire may be covered to some extent under the Scheme of the Ministry of Environment & Forests i.e. Integrated Forest Protection Scheme. Relief assistance will be provided to the people affected due to forest Fire for loss/ damage to lives, limbs, crops, property etc. as per the items and norms applicable in the wake of other notified natural calamities, to the extent, such losses are not covered under the Integrated forest Protection Scheme With regard to Fire incidents relating to industria l, commercial installations, these are required to be covered under insurance .
Appendix (to item No. 18)

221
Illustrative list of activities identified as of an immediate nature -
1. Drinking Water Supply: i) Repair of damaged platforms of Hand pumps/Ring wells/Spring-tapped chambers/Public stand posts, cisterns. ii) Restoration of damaged stand posts including replacement of damaged pipe lengths with new pipe lengths, cleaning of clear water reservoir (to make it leak proof). iii) Repair of damaged pumping machines, leaking overhead reservoirs and water pumps including damaged intake - structures, approach gantries / jetties.
2. Roads (i) Filling up of breaches and potholes, use of pipe for creating waterways, repair and stone pitching of embankments. (ii) Repair of breached culverts. (iii) Providing diversions to the damaged/washed out portions of bridges to restore immediate connectivity. (iv) Temporary repair of approaches to bridges/embankments of bridges., repair of damaged railing bridges, repair of causeways to restore immediate connectivity, granular sub base, over damaged stretch of roads to restore traffic.
3. Irrigation: (i) Immediate repair of damaged canal structures and earthen/ masonry works of tanks and small reservoirs with the use of cement, sand bags and stones. (ii) Repair of weak areas such as piping or rat holes in dam walls/embankments. (iii) Removal of vegetative material/building material/debris from canal and drainage system.
4. Health Repair of damaged approach roads, buildings and electrical lines of PHCs / Community Health Centres.
5. Community assets of Panchoyat a. Repair of village internal roads
b. Removal of debris from drainage/sewerage lines c. Repair of internal water supply lines d. Repair of street lights e. Temporary repair of primary schools, Panchayat ghars, community hall is, anganwadi etc.
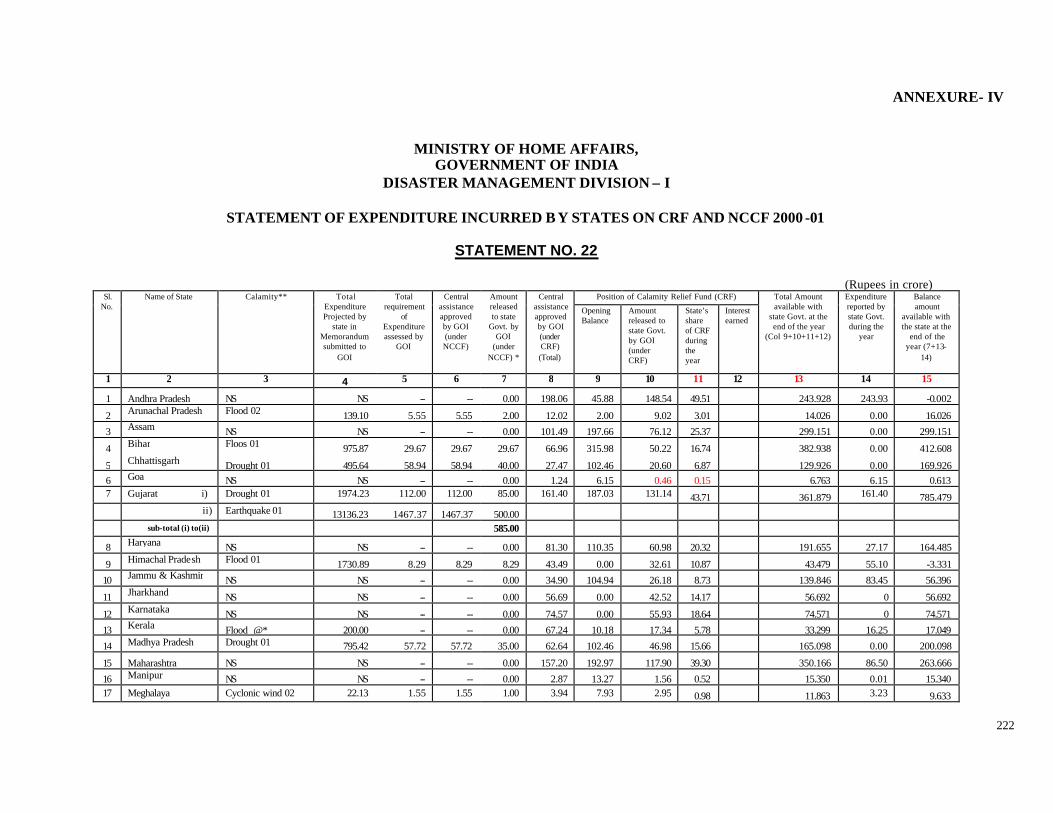
222
ANNEXURE- IV
MINISTRY OF HOME AFFAIRS,
GOVERNMENT OF INDIA DISASTER MANAGEMENT DIVISION – I
STATEMENT OF EXPENDITURE INCURRED B Y STATES ON CRF AND NCCF 2000 -01
STATEMENT NO. 22
(Rupees in crore)
Sl. No.
Name of State Calamity** Total Expenditure Projected by
state in Memorandum submitted to
GOI
Total requirement
of Expenditure assessed by
GOI
Central assistance approved by GOI (under NCCF)
Amount released to state
Govt. by GOI
(under NCCF) *
Central assistance approved by GOI (under CRF) (Total)
Position of Calamity Relief Fund (CRF) Total Amount available with
state Govt. at the end of the year
(Col 9+10+11+12)
Expenditure reported by state Govt. during the
year
Balance amount
available with the state at the
end of the year (7+13-
14)
Opening Balance
Amount released to state Govt. by GOI (under CRF)
State’s share of CRF during the year
Interest earned
1 2 3 4 5 6 7 8 9 10 11 12 13 14 15
1 Andhra Pradesh NS NS -- -- 0.00 198.06 45.88 148.54 49.51 243.928 243.93 -0.002
2 Arunachal Pradesh Flood 02 139.10 5.55 5.55 2.00 12.02 2.00 9.02 3.01 14.026 0.00 16.026
3 Assam NS NS -- -- 0.00 101.49 197.66 76.12 25.37 299.151 0.00 299.151
4 Bihar Floos 01 975.87 29.67 29.67 29.67 66.96 315.98 50.22 16.74 382.938 0.00 412.608
5 Chhattisgarh Drought 01 495.64 58.94 58.94 40.00 27.47 102.46 20.60 6.87 129.926 0.00 169.926 6 Goa NS NS -- -- 0.00 1.24 6.15 0.46 0.15 6.763 6.15 0.613 7 Gujarat i) Drought 01 1974.23 112.00 112.00 85.00 161.40 187.03 131.14 43.71 361.879 161.40 785.479
ii) Earthquake 01 13136.23 1467.37 1467.37 500.00 sub-total (i) to(ii) 585.00
8 Haryana NS NS -- -- 0.00 81.30 110.35 60.98 20.32 191.655 27.17 164.485
9 Himachal Pradesh Flood 01 1730.89 8.29 8.29 8.29 43.49 0.00 32.61 10.87 43.479 55.10 -3.331
10 Jammu & Kashmir NS NS -- -- 0.00 34.90 104.94 26.18 8.73 139.846 83.45 56.396
11 Jharkhand NS NS -- -- 0.00 56.69 0.00 42.52 14.17 56.692 0 56.692
12 Karnataka NS NS -- -- 0.00 74.57 0.00 55.93 18.64 74.571 0 74.571
13 Kerala Flood @* 200.00 -- -- 0.00 67.24 10.18 17.34 5.78 33.299 16.25 17.049
14 Madhya Pradesh Drought 01 795.42 57.72 57.72 35.00 62.64 102.46 46.98 15.66 165.098 0.00 200.098
15 Maharashtra NS NS -- -- 0.00 157.20 192.97 117.90 39.30 350.166 86.50 263.666
16 Manipur NS NS -- -- 0.00 2.87 13.27 1.56 0.52 15.350 0.01 15.340 17 Meghalaya Cyclonic wind 02 22.13 1.55 1.55 1.00 3.94 7.93 2.95 0.98 11.863 3.23 9.633
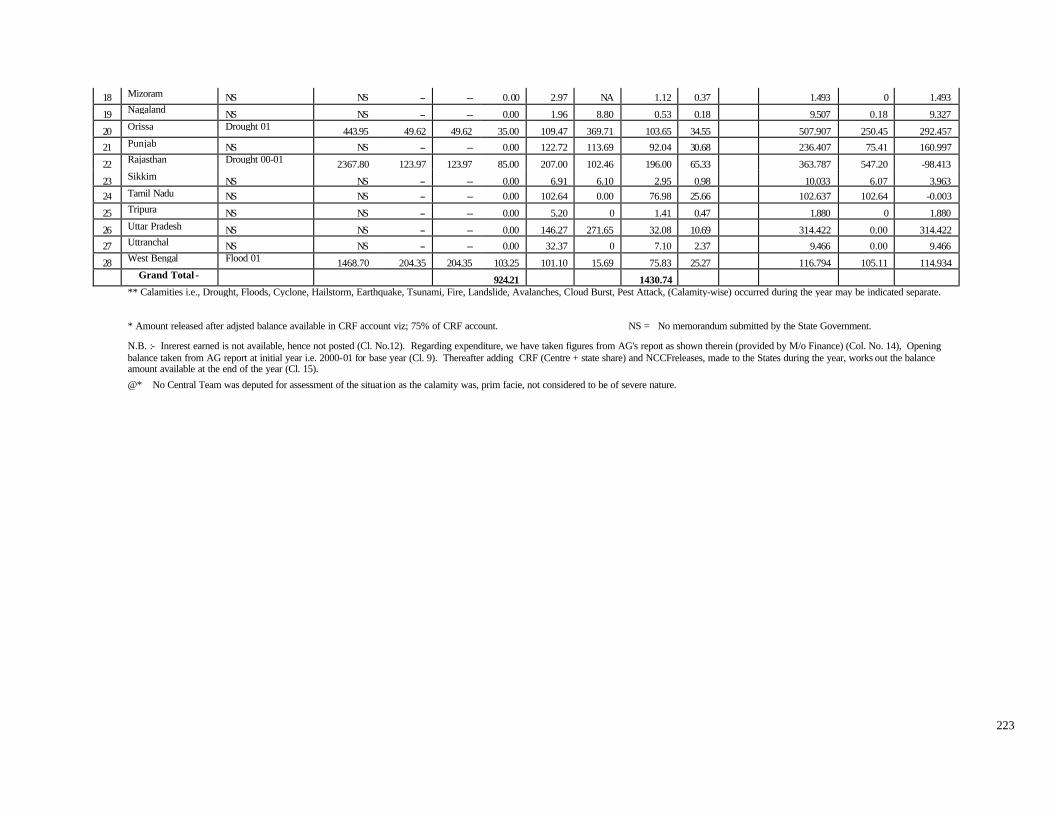
223
18 Mizoram NS NS -- -- 0.00 2.97 NA 1.12 0.37 1.493 0 1.493
19 Nagaland NS NS -- -- 0.00 1.96 8.80 0.53 0.18 9.507 0.18 9.327
20 Orissa Drought 01 443.95 49.62 49.62 35.00 109.47 369.71 103.65 34.55 507.907 250.45 292.457
21 Punjab NS NS -- -- 0.00 122.72 113.69 92.04 30.68 236.407 75.41 160.997
22 Rajasthan Drought 00-01 2367.80 123.97 123.97 85.00 207.00 102.46 196.00 65.33 363.787 547.20 -98.413
23 Sikkim NS NS -- -- 0.00 6.91 6.10 2.95 0.98 10.033 6.07 3.963 24 Tamil Nadu NS NS -- -- 0.00 102.64 0.00 76.98 25.66 102.637 102.64 -0.003
25 Tripura NS NS -- -- 0.00 5.20 0 1.41 0.47 1.880 0 1.880
26 Uttar Pradesh NS NS -- -- 0.00 146.27 271.65 32.08 10.69 314.422 0.00 314.422
27 Uttranchal NS NS -- -- 0.00 32.37 0 7.10 2.37 9.466 0.00 9.466
28 West Bengal Flood 01 1468.70 204.35 204.35 103.25 101.10 15.69 75.83 25.27 116.794 105.11 114.934
Grand Total:- 924.21 1430.74
** Calamities i.e., Drought, Floods, Cyclone, Hailstorm, Earthquake, Tsunami, Fire, Landslide, Avalanches, Cloud Burst, Pest Attack, (Calamity-wise) occurred during the year may be indicated separate.
* Amount released after adjsted balance available in CRF account viz; 75% of CRF account. NS = No memorandum submitted by the State Government.
N.B. :- Inrerest earned is not available, hence not posted (Cl. No.12). Regarding expenditure, we have taken figures from AG's report as shown therein (provided by M/o Finance) (Col. No. 14), Opening balance taken from AG report at initial year i.e. 2000-01 for base year (Cl. 9). Thereafter adding CRF (Centre + state share) and NCCFreleases, made to the States during the year, works out the balance amount available at the end of the year (Cl. 15).
@* No Central Team was deputed for assessment of the situation as the calamity was, prim facie, not considered to be of severe nature.

224
STATEMENT OF EXPENDITURE INCURRED BY STATES ON CRF AND NCCF 2001-02
(Rupees in crore) Sl.
No. Name of State Calamity** Total
Expenditure Projected by
state in Memorandum submitted to
GOI
Total requirement
of Expenditure assessed by
GOI
Central assistance approved by GOI (under NCCF)
Amount released to state
Govt. by GOI
(under NCCF) *
Central assistance approved by GOI (under CRF)
Position of Calamity Relief Fund (CRF) Total Amount available with
state Govt. at the end of the year
(Col. 9+10+11+12)
Expenditure reported by state Govt. during the
year
Balance amount
available with the state at the
end of the year
Opening Balance
Amount released to sta te Govt. by GOI (under CRF)
State’s share of CRF during the year
Interest earned
1 2 3 4 5 6 7 8 9 10 11 12 13 14 15
1 Andhra Pradesh i) Flood 01 777.71 15.84 15.84 10.00 207.96 0.00 196.91 65.63 262.540 213.48 79.500
ii) Flood 01 278.26 56.85 56.85 20.44
sub-total (i) to(ii) 30.44
2 Arunachal Pradesh NS NS -- -- 0.00 12.62 16.026 9.47 3.16 28.653 0.00 28.653
3 Assam NS NS -- -- 0.00 106.57 299.151 79.92 26.64 405.708 0.00 405.708
4 Bihar Drought 01 2295.12 13.56 13.56 0.00 70.31 412.608 26.36 8.79 447.754 0.00 447.754 5 Chhattisgarh i) Drought 02(Review) -- 18.94 18.94 18.94 28.84 169.926 21.63 7.21 198.765 0.00 241.645
ii) Flood 02 158.25 25.00 25.00 23.94
sub-total (i) to(ii) 42.88
6 Goa NS NS -- -- 0.00 1.30 0.613 0.00 0.00 0.613 0.00 0.613 7 Gujarat i) Drought 01(Review) -- -- -- 27.00 169.47 785.479 117.01 39.00 941.488 159.38 1776.478
ii) Earthquake 01 -- -- -- 967.37
sub-total (i) to(ii) 994.37
8 Haryana NS NS -- -- 0.00 85.37 164.485 64.03 21.34 249.856 57.53 192.326 9 Himachal Pradesh i) Flood 01 -- -- -- 25.00 45.66 8.29 34.24 11.41 53.942 72.77 42.652
ii) Flood 02 83.33 36.39 36.39 17.50
iii) Drought 01-02 143.56 18.98 18.98 18.98 sub-total (i)to(iii) 61.48
10 Jammu & Kashmir Drought 01 1880.95 23.20 23.20 23.20 36.65 56.396 0.00 0.00 56.396 70.62 8.976
11 Jharkhand Drought 01 1467.25 42.06 42.06 0.00 59.53 56.692 44.65 14.88 116.224 0.00 116.224
12 Karnataka NS NS -- -- 0.00 78.30 74.571 58.72 19.57 152.863 0 152.863
13 Kerala NS NS -- -- 0.00 70.61 17.049 86.04 28.68 131.767 71.46 60.307
14 Madhya Pradesh Drought 01 -- -- -- 22.72 65.76 200.098 49.32 16.44 265.857 0.00 288.577
15 Maharashtra NS NS -- -- 0.00 165.06 263.666 123.80 41.26 428.729 71.64 357.089
16 Manipur NS NS -- -- 0.00 3.01 15.340 0.00 0.00 15.340 0.00 15.340
17 Meghalaya NS NS -- -- 0.00 4.14 9.633 3.10 1.03 13.766 4.05 9.716
18 Mizoram NS NS -- -- 0.00 3.12 1.493 0.00 0.00 1.493 0 1.493
19 Nagaland NS NS -- -- 0.00 2.06 9.327 2.48 0.83 12.633 2.03 10.603 20 Orissa i) Drought 02 -- -- -- 14.62 114.94 292.457 64.66 21.55 378.668 260.20 233.088

225
ii) Flood 02 NA 100.00 100.00 100.00
sub-total (i)+(ii) 114.62
21 Punjab NS NS -- -- 0.00 128.85 160.997 96.64 32.21 289.847 0.00 289.847
22 Rajasthan i) Drought 00-01 -- -- -- 28.97 217.35 0.000 122.26 40.75 163.009 247.67 -5.691
ii) Drought 00-01 -- -- -- 50.00
sub-total (i)+(ii) 78.97 23 Sikkim NS NS -- -- 0.00 7.25 3.963 4.95 1.65 0.01 10.573 6.42 4.153
24 Tamil Nadu NS NS -- -- 0.00 107.77 0.000 80.83 26.94 107.771 107.77 0.001
25 Tripura NS NS -- -- 0.00 5.46 1.880 6.59 2.20 10.666 0 10.666
26 Uttar Pradesh NS NS -- -- 0.00 153.59 314.422 135.21 45.07 494.698 0.00 494.698
27 Uttranchal NS NS -- -- 0.00 33.98 9.466 29.93 9.98 49.372 0.00 49.372
28 West Bengal NS NS -- -- 0.00 106.16 114.934 39.81 13.27 168.013 122.99 45.023 Grand Total:- 1368.68 1498.56
* Amount released after adjsted 75% of CRF account. @ CRF account opend only during 2002-03.

226
STATEMENT OF EXPENDITURE INCURRED BY STATES ON CRF AND NCCF 2002-03
(Rupees in crore) Sl.
No. Name of State Calamity** Total
Expenditure Projected by
state in Memorandum submitted to
GOI
Total requirement
of Expenditure assessed by
GOI
Central assistance approved by GOI (under NCCF)
Amount released to state
Govt. by GOI
(under NCCF) *
Central assistance approved by GOI (under CRF)
Position of Calamity Relief Fund (CRF) Total Amount available with
state Govt. at the end of the year
(Col. 9+10+11+12)
Expenditure reported by state Govt. during the
year
Balance amount
available with the state at the
end of the year
Opening Balance
Amount released to state Govt. by GOI (under CRF)
State’s share of CRF during the year
Interest earned
1 2 3 4 5 6 7 8 9 10 11 12 13 14 15
1 Andhra Pradesh i) Drought 02 1880.00 174.61 174.61 0.00 218.36 79.500 122.83 40.94 243.269 303.22 -0.011
ii) Drought (subsidy to farmers -- 45.04 45.04 13.72
iii) Drought(freight charges -- 0.47 0.47 0.47
iv) Drought (Review) -- 224.43 224.43 45.75 sub-total (i)to(iv) 59.94
2 Arunachal Pradesh Flood 02 134.63 19.68 19.68 12.78 13.25 28.653 9.94 3.31 41.906 0.00 54.686
3 Assam Flood 02 484.19 118.34 118.34 0.00 111.89 405.708 83.92 27.97 517.599 0.00 517.599
4 Bihar Flood 02 847.72 118.68 118.68 0.00 73.82 447.754 81.74 27.24 556.738 131.78 424.958 5 Chhattisgarh i) Drought 02 880.66 92.73 92.73 45.85 30.29 241.645 22.72 7.57 271.938 89.75 282.868
ii) Drought (subsidy to
farmers) -- 35.67 35.67 35.67 iii) Drought 02(Review) -- 61.89 61.89 19.16
sub-total (i)to(iii) 100.68
6 Goa NS NS -- -- 0.00 1.37 0.613 1.96 0.65 3.227 0.00 3.227
7 Gujarat i) Drought 03 895.34 150.29 150.29 0.00 177.94 1776.48 133.46 44.48 1954.421 177.94 1799.771
ii) Drought (freight charges) -- -- 23.29 23.29
sub-total (i)to(ii) 23.29
8 Haryana i) Drought 02 1895.98 109.65 109.65 0.00 89.64 192.326 67.23 22.41 281.964 83.50 198.464 ii) Drought 02 (Review) -- 0.00 0.00 0.00
sub-total (i)to(ii) 0.00
9 Himachal Pr. i) Drought 02 155.86 39.45 39.45 9.80 47.94 42.652 35.96 11.99 90.598 57.94 46.708
ii) Drought(subsidy to farmer -- 4.05 4.05 4.05
iii) Drought 02(Review) -- 25.67 25.67 0.20
sub-total (i)to(iii) 14.05
10 Jammu&Kashmir i) Drought 02 1623.98 31.75 31.75 0.00 38.48 8.976 56.34 18.78 84.094 4.20 79.894
ii) Drought(Review) -- 0.00 0.00 0.00
sub-total (i)to(ii) 0.00 11 Jharkhand Drought (Review) -- 0.00 0.00 0.00 62.51 116.224 0.00 0.00 116.224 0 116.224
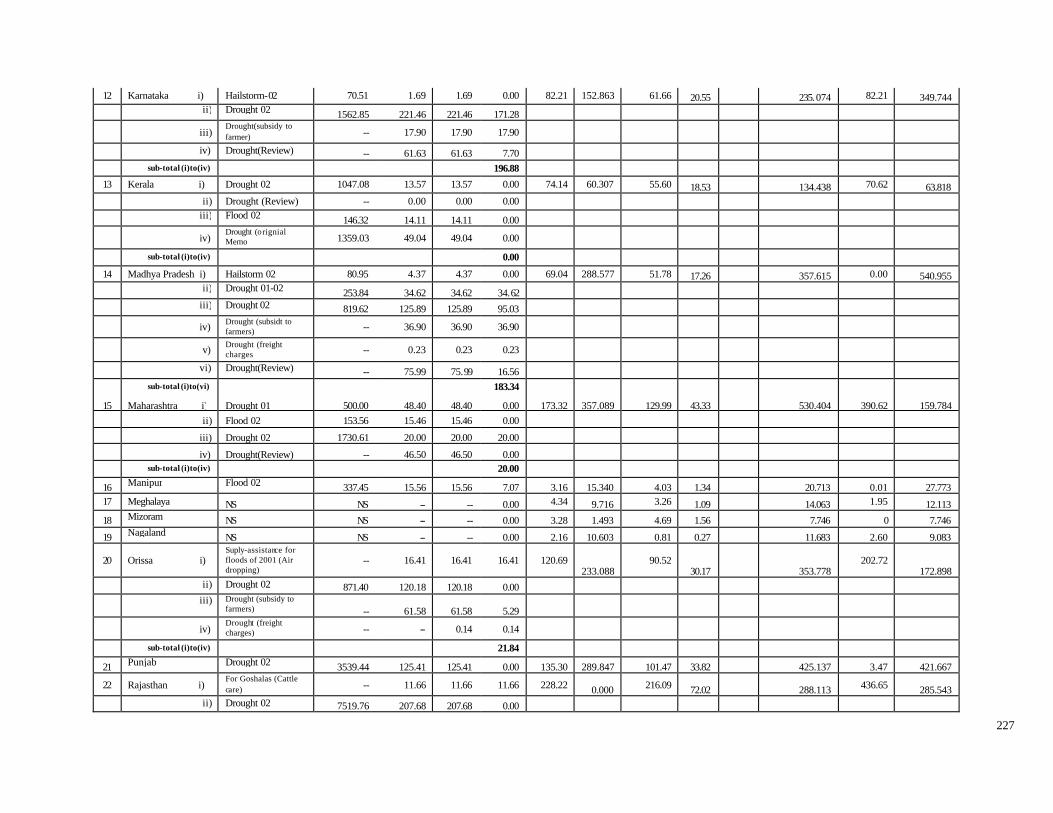
227
12 Karnataka i) Hailstorm-02 70.51 1.69 1.69 0.00 82.21 152.863 61.66 20.55 235.074 82.21 349.744
ii) Drought 02 1562.85 221.46 221.46 171.28
iii) Drought(subsidy to farmer) -- 17.90 17.90 17.90
iv) Drought(Review) -- 61.63 61.63 7.70 sub-total (i)to(iv) 196.88
13 Kerala i) Drought 02 1047.08 13.57 13.57 0.00 74.14 60.307 55.60 18.53 134.438 70.62 63.818 ii) Drought (Review) -- 0.00 0.00 0.00
iii) Flood 02 146.32 14.11 14.11 0.00
iv) Drought (orignial Memo 1359.03 49.04 49.04 0.00
sub-total (i)to(iv) 0.00
14 Madhya Pradesh i) Hailstorm 02 80.95 4.37 4.37 0.00 69.04 288.577 51.78 17.26 357.615 0.00 540.955
ii) Drought 01-02 253.84 34.62 34.62 34.62
iii) Drought 02 819.62 125.89 125.89 95.03
iv) Drought (subsidt to farmers) -- 36.90 36.90 36.90
v) Drought (freight charges -- 0.23 0.23 0.23
vi) Drought(Review) -- 75.99 75.99 16.56 sub-total (i)to(vi) 183.34
15 Maharashtra i) Drought 01 500.00 48.40 48.40 0.00 173.32 357.089 129.99 43.33 530.404 390.62 159.784 ii) Flood 02 153.56 15.46 15.46 0.00
iii) Drought 02 1730.61 20.00 20.00 20.00
iv) Drought(Review) -- 46.50 46.50 0.00 sub-total (i)to(iv) 20.00
16 Manipur Flood 02 337.45 15.56 15.56 7.07 3.16 15.340 4.03 1.34 20.713 0.01 27.773 17 Meghalaya NS NS -- -- 0.00 4.34 9.716 3.26 1.09 14.063 1.95 12.113
18 Mizoram NS NS -- -- 0.00 3.28 1.493 4.69 1.56 7.746 0 7.746
19 Nagaland NS NS -- -- 0.00 2.16 10.603 0.81 0.27 11.683 2.60 9.083
20 Orissa i) Suply-assistance for floods of 2001 (Air dropping)
-- 16.41 16.41 16.41 120.69 233.088
90.52 30.17
353.778
202.72 172.898
ii) Drought 02 871.40 120.18 120.18 0.00
iii) Drought (subsidy to
farmers) -- 61.58 61.58 5.29
iv) Drought (freight charges) -- -- 0.14 0.14
sub-total (i)to(iv) 21.84
21 Punjab Drought 02 3539.44 125.41 125.41 0.00 135.30 289.847 101.47 33.82 425.137 3.47 421.667
22 Rajasthan i) For Goshalas (Cattle care) -- 11.66 11.66 11.66 228.22 0.000 216.09 72.02 288.113 436.65 285.543
ii) Drought 02 7519.76 207.68 207.68 0.00

228
iii) Drought (subsidy to
farmers -- 164.92 164.92 155.68
iv) Drought (freight
charges) -- 7.40 7.40 7.40
v) Drought 03 ® -- 682.35 682.35 259.34
sub-total (i)to(v) 434.08
23 Sikkim NS NS -- -- 0.00 7.62 4.153 5.57 1.86 0.03 11.610 8.47 3.140 24 Tamil Nadu i) Drought 02 1545.76 228.30 228.30 109.70 113.16 0.001 84.87 28.29 113.158 246.22 82.928
ii) Drought (subsidy to farmers) -- 23.36 23.36 23.36
iii) Drought -- 258.44 258.44 82.93 sub-total (i)to(iii) 215.99
25 Tripura NS NS -- -- 0.00 5.73 10.666 4.30 1.43 16.400 0 16.400 26 Uttar Pradesh i) Drought 02 7539.79 481.10 481.10 237.65 161.27 494.698 178.55 59.51 732.758 0.00 1042.818
ii) Drought (subsidy to farmers) -- 72.41 72.41 72.41
iii) Drought (Review) -- 0.00 0.00 0.00 sub-total (i)to(iii) 310.06
27 Uttranchal i) Drought 02 401.81 10.62 10.62 0.00 35.68 49.372 26.13 8.71 84.211 0.00 84.211
ii) Drought (subsidy to farmers) -- 3.78 3.78 0.00
iii) Drought (Review) -- 0.00 0.00 0.00
sub-total (i)to(iii) 0.00
28 West Bengal NS NS -- -- 0.00 111.47 45.023 123.41 41.13 209.565 0.00 209.565
Grand Total:- 1600.00 1758.83
* Amount released after adjsted 75% of CRF account.

229
STATEMENT OF EXPENDITURE INCURRED BY STATES ON CRF AND NCCF - 2003-04
(Rupees in crore) Sl.
No. Name of State Calamity** Total
Expendi ture Projected by
state in Memorandum submitted to
GOI
Total requirement
of Expenditure assessed by
GOI
Central assistance approved by GOI (under NCCF)
Amount released to state
Govt. by GOI
(under NCCF) *
Central assistance approved by GOI (under CRF)
Position of Calamity Relief Fund (CRF) Total Amount available with
state Govt. at the end of the year
(Col. 9+10+11+12)
Expenditure reported by state Govt. during the
year
Balance amount
available with the state at the
end of the year
Opening Balance
Amount released to state Govt. by GOI (under CRF)
State’s share of CRF during the year
Interest earned
1 2 3 4 5 6 7 8 9 10 11 12 13 14 15
1 Andhra Pradesh i) Drought(Review) -- -- -- 64.04 229.28 0.000 171.96 57.31 229.274 346.03 -0.006
ii) Drought 03 859.88 155.50 155.50 50.58
iii) Drought (freight charges) -- 2.13 2.13 2.13
sub-total (i)to(iii) 116.75
2 Arunachal Pr. i) Flood 03 349.06 39.32 39.32 26.79 13.92 54.686 10.44 3.48 68.605 0.00 98.395
ii) Flood 03 -- 3.00 3.00 3.00
sub-total (i)to(ii) 29.79
3 Assam Floos 03 1134.45 70.72 70.72 0.00 117.49 517.599 44.06 14.69 576.344 25.00 551.344
4 Bihar NS NS -- -- 0.00 77.52 424.958 29.07 9.69 463.717 0.00 463.717 5 Chhattisgarh i) Drought -- -- -- 26.83 31.80 282.868 11.92 3.97 298.761 0.00 325.591 ii) Flood 03 296.4 17.92 17.92 0.00
sub-total (i)to(ii) 26.83
6 Goa NS NS -- -- 0.00 1.44 3.227 1.6 0.53 5.360 0.00 5.360
7 Gujarat i) for Gaushalas/ Cattle Camps -- -- 5.15 5.15 186.84 1799.77 140.13 46.71 1986.606 187.12 1831.896
ii) Drought (freight charges) -- 7.18 7.18 7.18
iii) Flood 03 431.02 20.08 20.08 20.08 sub-total (i)to(iii) 32.41
8 Haryana For Gaushalas -- -- 2.2 2.20 94.12 198.464 70.59 23.53 292.581 8.25 286.531 9 Himachal Pradesh i) Drought (Review) --- --- --- 0.30 50.34 46.708 37.75 12.58 97.040 52.11 45.230 ii) Flood 03 131.80 34.81 34.81 0.00
sub-total (i)to(ii) 0.30
10 Jammu & Kashmir NS NS -- -- 0.00 40.40 79.894 30.30 10.10 120.293 15.36 104.933
11 Jharkhand NS NS -- -- 0.00 65.63 116.224 71.49 23.83 211.541 0.00 211.541 12 Karnataka i) Drought (Review) -- -- -- 10.77 86.32 349.744 64.74 21.58 436.062 0.00 752.532
ii) Drought 03 1881.55 167.81 167.81 115.86
iii) Flood 03 34.77 7.54 7.54 7.54 iv) Drought 2878.00 247.62 247.62 50.00
v) Drought (Review) " -- (167.17) 71.85

230
vi) Drought(EG cash compt.) " -- (60.45) 60.45
sub-total (i)to(vi) 316.47
13 Kerala NS NS -- -- 0.00 77.84 63.818 58.38 19.46 141.656 122.73 18.926 14 Madhya Pradesh i) Drought (Review) -- -- -- 23.17 72.51 540.955 54.39 18.13 613.473 0.00 650.193
ii) Halistorm 02 128.16 6.42 6.42 0.00
iii) for Gaushalas/ Cattle camps -- 0.10 0.10 0.10
iv) For Gaushalas -- 0.61 0.61 0.61
v) Flood 03 201.83 12.84 12.84 12.84
sub-total (i)to(v) 36.72
15 Maharashtra i) Drought 03 1715.00 160.61 160.61 44.25 181.98 159.784 172.32 57.43 389.539 181.98 285.019
ii) Drought (EGS- one time) " " 33.21 33.21
sub-total (i)to(ii) 77.46
16 Manipur NS NS -- -- 0.00 3.32 27.773 0.00 0.00 27.773 6.70 21.073
17 Meghalaya NS NS -- -- 0.00 4.56 12.113 3.42 1.14 16.673 6.41 10.263
18 Mizoram NS NS -- -- 0.00 3.44 7.746 2.52 0.84 11.106 0 11.106
19 Nagaland NS NS -- -- 0.00 2.27 9.083 1.66 0.55 11.296 2.73 8.566 20 Orissa i) Drought (Review) -- 61.58 61.58 0.00 126.72 172.898 95.04 31.68 299.615 318.30 85.745
ii) Flood 03 1793.05 173.34 173.34 50.00
iii) Flood 03 " " " 54.43
sub-total (i)to(iii) 104.43
21 Punjab NS NS -- -- 0.00 142.06 421.67 106.55 35.51 563.730 4.28 559.450 22 Rajasthan i) Drought 03 -- -- -- 363.10 239.63 285.54 134.79 44.93 465.258 836.14 141.858
ii) for Gaushalaas /Cattle Camps -- -- -- 14.48
iii) Drought (Composit Team) -- 134.79 134.79 99.83
iv) Drought (freight charges) -- 35.33 35.33 35.33
sub-total (i)to(iv) 512.74
23 Sikkim NS NS -- -- 0.00 8.00 3.140 8.86 2.95 14.953 7.91 7.043 24 Tamil Nadu i) Drought -- -- -- 116.10 118.82 82.928 89.11 29.70 201.738 491.19 -0.002
ii) Drought 03 2283.73 292.95 292.95 50.00
iii) Drought 03 " " " 123.35
sub-total (i)to(iii) 289.45
25 Tripura NS NS -- -- 0.00 6.02 16.400 0.00 0.00 16.400 0 16.400 26 Uttar Pradesh i) For Gaushalas -- -- -- 0.98 169.33 1042.82 127.00 42.33 1212.148 0.00 1254.018
ii) Flood 03 1685.14 222.23 222.23 40.89
sub-total (i)to(ii) 41.87
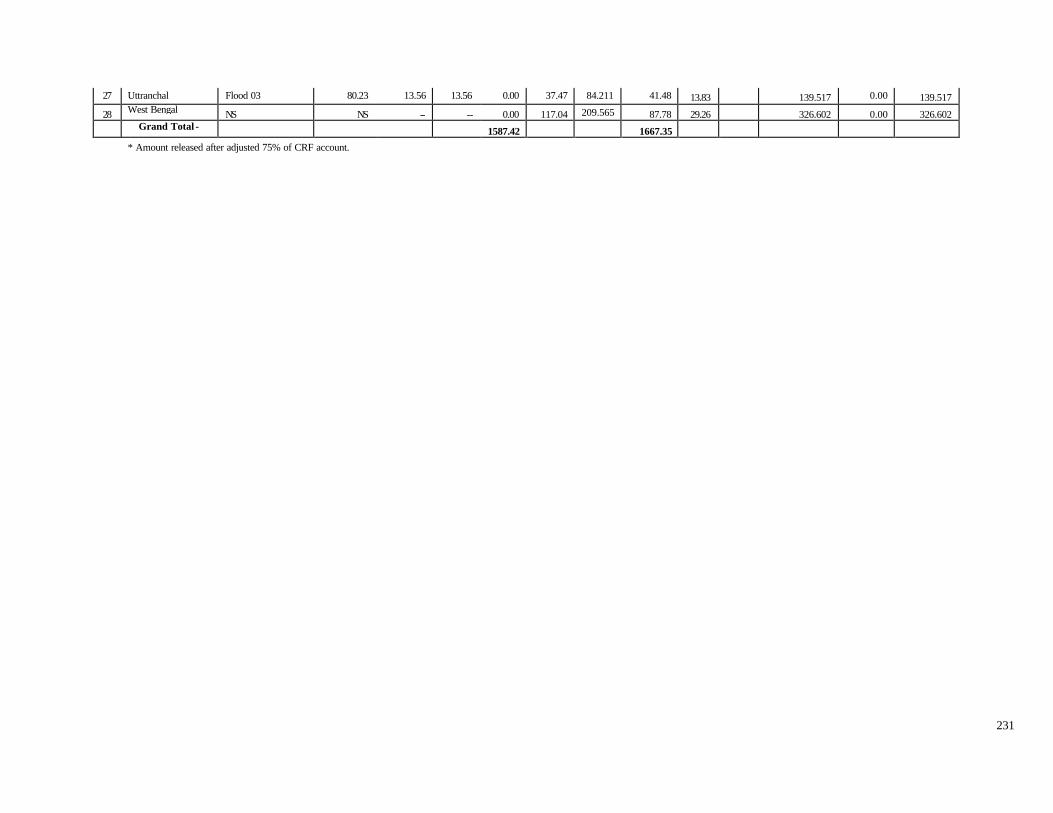
231
27 Uttranchal Flood 03 80.23 13.56 13.56 0.00 37.47 84.211 41.48 13.83 139.517 0.00 139.517
28 West Bengal NS NS -- -- 0.00 117.04 209.565 87.78 29.26 326.602 0.00 326.602
Grand Total:- 1587.42 1667.35 * Amount released after adjusted 75% of CRF account.
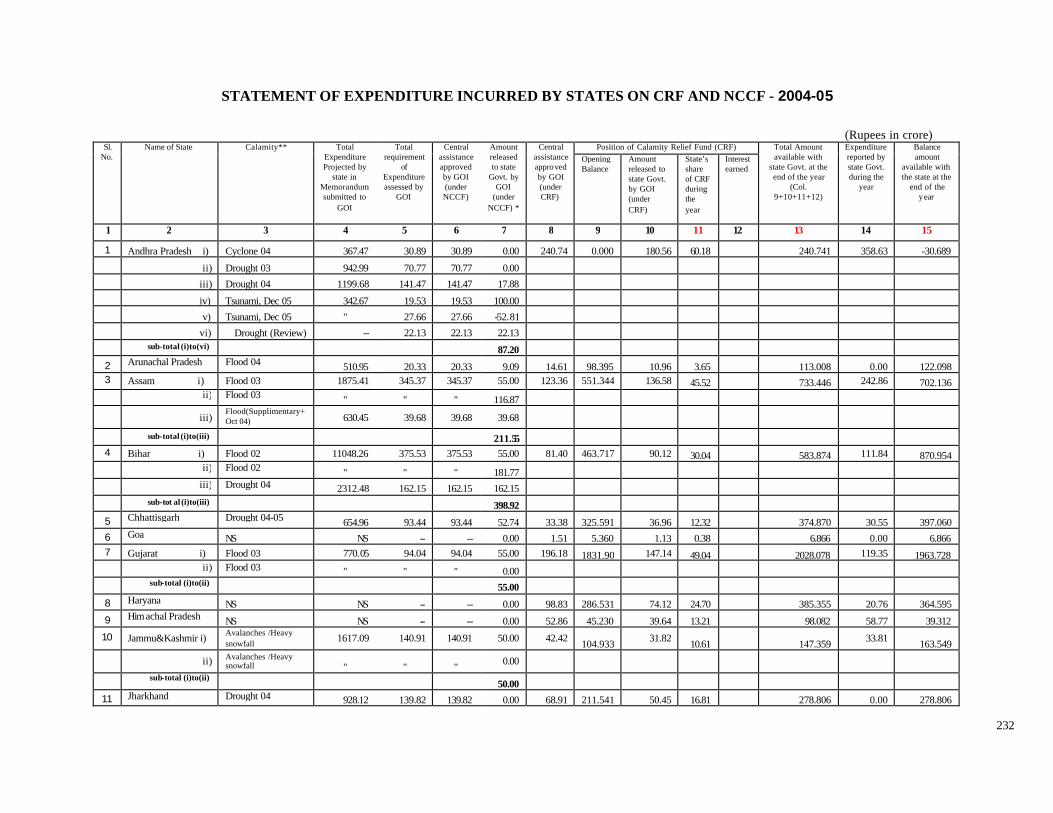
232
STATEMENT OF EXPENDITURE INCURRED BY STATES ON CRF AND NCCF - 2004-05
(Rupees in crore) Sl.
No. Name of State Calamity** Total
Expenditure Projected by
state in Memorandum submitted to
GOI
Total requirement
of Expenditure assessed by
GOI
Central assistance approved by GOI (under NCCF)
Amount released to state
Govt. by GOI
(under NCCF) *
Central assistance approved by GOI (under CRF)
Position of Calamity Relief Fund (CRF) Total Amount available with
state Govt. at the end of the year
(Col. 9+10+11+12)
Expenditure reported by state Govt. during the
year
Balance amount
available with the state at the
end of the year
Opening Balance
Amount released to state Govt. by GOI (under CRF)
State’s share of CRF during the year
Interest earned
1 2 3 4 5 6 7 8 9 10 11 12 13 14 15
1 Andhra Pradesh i) Cyclone 04 367.47 30.89 30.89 0.00 240.74 0.000 180.56 60.18 240.741 358.63 -30.689
ii) Drought 03 942.99 70.77 70.77 0.00 iii) Drought 04 1199.68 141.47 141.47 17.88
iv) Tsunami, Dec 05 342.67 19.53 19.53 100.00 v) Tsunami, Dec 05 " 27.66 27.66 -52.81 vi) Drought (Review) -- 22.13 22.13 22.13
sub-total (i)to(vi) 87.20
2 Arunachal Pradesh Flood 04 510.95 20.33 20.33 9.09 14.61 98.395 10.96 3.65 113.008 0.00 122.098 3 Assam i) Flood 03 1875.41 345.37 345.37 55.00 123.36 551.344 136.58 45.52 733.446 242.86 702.136
ii) Flood 03 " " " 116.87
iii) Flood(Supplimentary+Oct 04) 630.45 39.68 39.68 39.68
sub-total (i)to(iii) 211.55 4 Bihar i) Flood 02 11048.26 375.53 375.53 55.00 81.40 463.717 90.12 30.04 583.874 111.84 870.954
ii) Flood 02 " " " 181.77 iii) Drought 04 2312.48 162.15 162.15 162.15
sub-tot al (i)to(iii) 398.92
5 Chhattisgarh Drought 04-05 654.96 93.44 93.44 52.74 33.38 325.591 36.96 12.32 374.870 30.55 397.060 6 Goa NS NS -- -- 0.00 1.51 5.360 1.13 0.38 6.866 0.00 6.866 7 Gujarat i) Flood 03 770.05 94.04 94.04 55.00 196.18 1831.90 147.14 49.04 2028.078 119.35 1963.728 ii) Flood 03 " " " 0.00 sub-total (i)to(ii) 55.00
8 Haryana NS NS -- -- 0.00 98.83 286.531 74.12 24.70 385.355 20.76 364.595
9 Himachal Pradesh NS NS -- -- 0.00 52.86 45.230 39.64 13.21 98.082 58.77 39.312
10 Jammu&Kashmir i) Avalanches /Heavy snowfall 1617.09 140.91 140.91 50.00 42.42 104.933 31.82 10.61 147.359 33.81 163.549
ii) Avalanches /Heavy snowfall " " " 0.00
sub-total (i)to(ii) 50.00 11 Jharkhand Drought 04 928.12 139.82 139.82 0.00 68.91 211.541 50.45 16.81 278.806 0.00 278.806

233
12 Karnataka i) Drought(Supl. Nutrition-FCI) --- --- 20.00 14.48 90.64 752.532 67.98 22.66 843.170 0.00 906.790
ii) Drought 03 1147.72 83.67 83.67 24.57 iii) Drought 03 " " " 24.57 sub-total (i)to(iii) 63.62
13 Kerala i) Drought(additional Memo) 2844.9 28.53 28.53 0.00 81.73 18.926 61.30 20.43 100.657 233.26 73.397
ii) Tsunami, Dec 05 1358.77 84.10 84.10 100.00 iii) Tsunami, Dec 05 " 44.85 44.85 0.00
iv) Drought 04 (Spl.
Relief) 106.00 106.00 106.00 53.00
v) Drought 04 (Spl. Relief) " " " 53.00
sub-total (i)to(v) 206.00
14 Madhya Pradesh Drought 04 725.69 36.30 36.30 1.70 76.13 650.193 57.10 19.03 726.325 0.00 728.025
15 Maharashtra i) Drought 04 680.96 201.16 201.16 165.33 191.08 285.019 107.48 35.82 428.322 191.08 410.472 ii) Drought 04 -- 201.16 201.16 7.90
sub-total (i)to(ii) 173.23
16 Manipur NS NS -- -- 0.00 3.49 21.073 0.00 0.00 21.073 7.98 13.093 17 Meghalaya Flood 04 212.50 12.30 12.30 6.16 4.79 10.263 3.59 1.20 15.049 4.56 16.649
18 Mizoram Flood 04 51.15 13.29 13.29 10.68 3.61 11.106 4.00 1.33 16.440 0 27.120 19 Nagaland Flood 04 21.45 3.36 3.36 1.81 2.38 8.566 2.64 0.88 12.086 1.49 12.406 20 Orissa i) Flood 04 348.78 53.40 53.40 0.00 133.06 85.745 99.79 33.26 218.795 271.01 1.225
ii) Air lifting charges for Super Cyclone 1999 on actual basis
53.44 53.44 53.44 53.44
sub-total (i)to(ii) 53.44 21 Punjab Flood 04 557.67 14.58 14.58 0.00 149.17 559.450 111.87 37.29 708.606 16.13 692.476 22 Rajasthan i) Drought 04-05 2378.64 332.27 332.27 108.00 251.61 141.858 188.71 62.90 393.465 190.55 419.705
ii) Drought 04-05 " " " 108.79 sub-total (i)to(ii) 216.79
23 Sikkim Flood 04 50.55 13.05 13.05 9.90 8.40 7.043 6.30 2.10 0 15.442 17.93 7.412 24 Tamil Nadu i) Drought 04 1910.58 156.84 156.84 117.27 124.76 0.000 93.57 31.19 124.757 859.23 48.667 ii) Tsunami, Dec 05 4528.66 617.20 617.20 250.00
iii) Tsunami, Dec 05 " " " 367.20
iv) Tsunami, Dec 05
(subsidy) " 441.08 441.08 0.00 v) Flood 04 411.73 48.67 48.67 48.67
sub-total (i)to(v) 783.14
25 Tripura Flood 04 75.46 8.67 8.67 0.05 6.32 16.400 9.25 3.08 28.733 0 28.783 26 Uttar Pradesh Drought 04 7226.10 360.94 360.94 192.10 177.81 1254.02 133.36 44.45 1431.826 0.00 1623.926
27 Uttranchal Drought 04 411.87 3.24 3.24 0.00 39.34 139.517 29.50 9.83 178.849 0.00 178.849

234
28 West Bengal NS NS -- -- 0.00 122.89 326.602 92.17 30.72 449.493 47.66 401.833
Grand Total:- 2583.12 1868.09
* Amount released after adjusted 75% of CRF account.
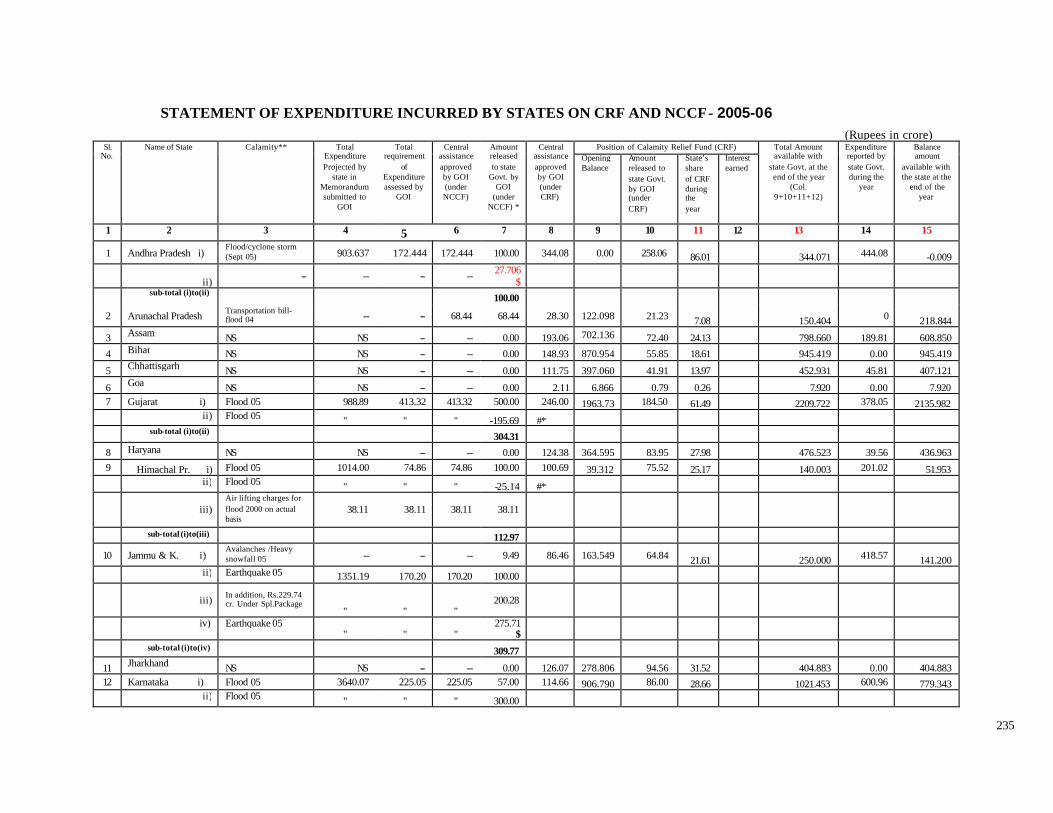
235
STATEMENT OF EXPENDITURE INCURRED BY STATES ON CRF AND NCCF - 2005-06
(Rupees in crore) Sl.
No. Name of State Calamity** Total
Expenditure Projected by
state in Memorandum submitted to
GOI
Total requirement
of Expenditure assessed by
GOI
Central assistance approved by GOI (under NCCF)
Amount released to state
Govt. by GOI
(under NCCF) *
Central assistance approved by GOI (under CRF)
Position of Calamity Relief Fund (CRF) Total Amount available with
state Govt. at the end of the year
(Col. 9+10+11+12)
Expenditure reported by state Govt. during the
year
Balance amount
available with the state at the
end of the year
Opening Balance
Amount released to state Govt. by GOI (under CRF)
State’s share of CRF during the year
Interest earned
1 2 3 4 5 6 7 8 9 10 11 12 13 14 15
1 Andhra Pradesh i) Flood/cyclone storm (Sept 05) 903.637 172.444 172.444 100.00 344.08 0.00 258.06 86.01 344.071 444.08 -0.009
ii) -- -- -- -- 27.706 $
sub-total (i)to(ii) 100.00
2 Arunachal Pradesh Transportation bill- flood 04 -- -- 68.44 68.44 28.30 122.098 21.23 7.08 150.404 0 218.844
3 Assam NS NS -- -- 0.00 193.06 702.136 72.40 24.13 798.660 189.81 608.850
4 Bihar NS NS -- -- 0.00 148.93 870.954 55.85 18.61 945.419 0.00 945.419
5 Chhattisgarh NS NS -- -- 0.00 111.75 397.060 41.91 13.97 452.931 45.81 407.121
6 Goa NS NS -- -- 0.00 2.11 6.866 0.79 0.26 7.920 0.00 7.920 7 Gujarat i) Flood 05 988.89 413.32 413.32 500.00 246.00 1963.73 184.50 61.49 2209.722 378.05 2135.982
ii) Flood 05 " " " -195.69 #*
sub-total (i)to(ii) 304.31
8 Haryana NS NS -- -- 0.00 124.38 364.595 83.95 27.98 476.523 39.56 436.963 9 Himachal Pr. i) Flood 05 1014.00 74.86 74.86 100.00 100.69 39.312 75.52 25.17 140.003 201.02 51.953
ii) Flood 05 " " " -25.14 #*
iii) Air lifting charges for flood 2000 on actual basis
38.11 38.11 38.11 38.11
sub-total (i)to(iii) 112.97
10 Jammu & K. i) Avalanches /Heavy snowfall 05 -- -- -- 9.49 86.46 163.549 64.84 21.61 250.000 418.57 141.200
ii) Earthquake 05 1351.19 170.20 170.20 100.00
iii) In addition, Rs.229.74 cr. Under Spl.Package
" " " 200.28
iv) Earthquake 05
" " " 275.71
$
sub-total (i)to(iv) 309.77
11 Jharkhand NS NS -- -- 0.00 126.07 278.806 94.56 31.52 404.883 0.00 404.883 12 Karnataka i) Flood 05 3640.07 225.05 225.05 57.00 114.66 906.790 86.00 28.66 1021.453 600.96 779.343
ii) Flood 05 " " " 300.00

236
iii) Flood 05 " " " -158.15 #* iv) Flood (Sept- Oct 05) 1256.90 160.52 160.52 160.00
sub-total (i)to(iv) 358.85 13 Kerala i) Flood 05 196.40 26.98 26.98 17.94 85.50 73.397 64.13 21.37 158.902 127.73 49.112
ii) Flood 05 " " " 12.72$
sub-total (i)to(ii) 17.94
14 Madhya Pradesh NS NS -- -- 0.00 254.23 728.025 190.67 63.55 982.245 0.00 982.245
15 Maharashtra i) Drought 05 1117.99 174.66 174.66 91.07 222.90 410.472 167.18 55.72 633.373 219.40 1071.223
ii) Hailstorm 05 79.45 12.00 12.00 12.00
iii) Flood 05 8740.66 697.45 697.45 500.00
iv) Flood 05 " " " 416.41
v) Flood 05 " " " -362.23 #*
sub-total (i)to(v) 657.25
16 Manipur NS NS -- -- 0.00 5.56 13.093 0.00 0.00 13.093 2.31 10.783
17 Meghalaya NS NS -- -- 0.00 11.29 16.649 4.24 1.41 22.296 10.95 11.346
18 Mizoram NS NS -- -- 0.00 6.58 27.120 2.47 0.82 30.413 0 30.413
19 Nagaland NS NS -- -- 0.00 3.83 12.406 1.44 0.48 14.320 3.20 11.120
20 Orissa NS NS -- -- 0.00 301.54 1.225 226.16 75.38 302.764 231.72 71.044
21 Punjab NS NS -- -- 0.00 146.03 692.476 54.76 18.25 765.488 22.68 742.808 22 Rajasthan i) Drought 05 939.37 106.30 106.30 0.00 415.64 419.705 311.73 103.90 835.335 364.11 471.225
ii) Hailstorm 05 210.85 49.57 49.57 0.00
iii) Drought 06 1544.63 146.50 146.50 0.00
sub-total (i)to(iii) 0.00
23 Sikkim NS NS -- -- 0.00 17.53 7.412 13.15 4.38 24.945 12.10 12.845
24 Tamil Nadu i) Tsunami - providing subsidy to fishermen 131.91 131.91 131.91 131.91 209.08 48.667 78.41 26.13 153.204 1236.45 48.664
ii) Flood 05 (Oct-Nov) 13457.62 787.90 787.90 500.00
iii) Flood 05 (Suppl.
report) " 20.45 20.45 500.00
iv) Flood 05 (Suppl.
report) " " " 191.65
$
sub-total (i)to(iv) 1131.91
25 Tripura NS NS -- -- 0.00 12.85 28.783 0.00 0.00 28.783 0 28.783
26 Uttar Pradesh NS NS -- -- 0.00 295.94 1623.93 221.95 73.98 1919.852 0.00 1919.852
27 Uttranchal NS NS -- -- 0.00 94.69 178.849 71.02 23.67 273.540 0.00 273.540
28 West Bengal NS NS -- -- 0.00 234.73 401.833 176.05 58.68 636.560 114.88 521.680
Grand Total:- 3061.44 2,622.94
* Amount released after adjusted 75% of CRF account. $ This amount will adjust against State Government lone terms requirement of fund assesed by IMG, recommended by HLC and approved by Cabinet.
#* Excess amount recovered from the State.
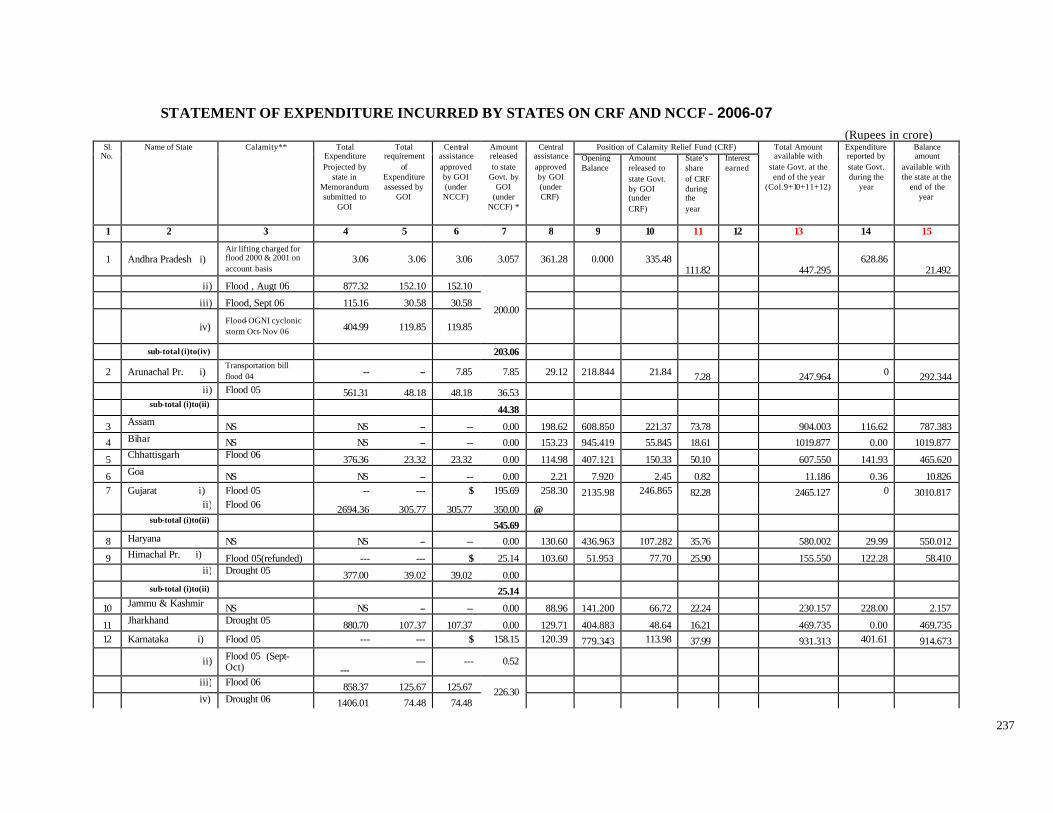
237
STATEMENT OF EXPENDITURE INCURRED BY STATES ON CRF AND NCCF - 2006-07
(Rupees in crore) Sl.
No. Name of State Calamity** Total
Expenditure Projected by
state in Memorandum submitted to
GOI
Total requirement
of Expenditure assessed by
GOI
Central assistance approved by GOI (under NCCF)
Amount released to state
Govt. by GOI
(under NCCF) *
Central assistance approved by GOI (under CRF)
Position of Calamity Relief Fund (CRF) Total Amount available with
state Govt. at the end of the year
(Col.9+10+11+12)
Expenditure reported by state Govt. during the
year
Balance amount
available with the state at the
end of the year
Opening Balance
Amount released to state Govt. by GOI (under CRF)
State’s share of CRF during the year
Interest earned
1 2 3 4 5 6 7 8 9 10 11 12 13 14 15
1 Andhra Pradesh i) Air lifting charged for flood 2000 & 2001 on account basis
3.06 3.06 3.06 3.057 361.28 0.000 335.48 111.82
447.295
628.86 21.492
ii) Flood , Augt 06 877.32 152.10 152.10
200.00
iii) Flood, Sept 06 115.16 30.58 30.58
iv) Flood- OGNI cyclonic storm Oct- Nov 06 404.99 119.85 119.85
sub-total (i)to(iv) 203.06
2 Arunachal Pr. i) Transportation bill flood 04 -- -- 7.85 7.85 29.12 218.844 21.84 7.28 247.964 0 292.344
ii) Flood 05 561.31 48.18 48.18 36.53
sub-total (i)to(ii) 44.38
3 Assam NS NS -- -- 0.00 198.62 608.850 221.37 73.78 904.003 116.62 787.383
4 Bihar NS NS -- -- 0.00 153.23 945.419 55.845 18.61 1019.877 0.00 1019.877
5 Chhattisgarh Flood 06 376.36 23.32 23.32 0.00 114.98 407.121 150.33 50.10 607.550 141.93 465.620
6 Goa NS NS -- -- 0.00 2.21 7.920 2.45 0.82 11.186 0.36 10.826 7 Gujarat i) Flood 05 -- --- $ 195.69 258.30 2135.98 246.865 82.28 2465.127 0 3010.817
ii) Flood 06 2694.36 305.77 305.77 350.00 @
sub-total (i)to(ii) 545.69
8 Haryana NS NS -- -- 0.00 130.60 436.963 107.282 35.76 580.002 29.99 550.012
9 Himachal Pr. i) Flood 05(refunded) --- --- $ 25.14 103.60 51.953 77.70 25.90 155.550 122.28 58.410
ii) Drought 05 377.00 39.02 39.02 0.00
sub-total (i)to(ii) 25.14
10 Jammu & Kashmir NS NS -- -- 0.00 88.96 141.200 66.72 22.24 230.157 228.00 2.157
11 Jharkhand Drought 05 880.70 107.37 107.37 0.00 129.71 404.883 48.64 16.21 469.735 0.00 469.735 12 Karnataka i) Flood 05 --- --- $ 158.15 120.39 779.343 113.98 37.99 931.313 401.61 914.673
ii) Flood 05 (Sept-Oct) ---
--- --- 0.52
iii) Flood 06 858.37 125.67 125.67 226.30
iv) Drought 06 1406.01 74.48 74.48
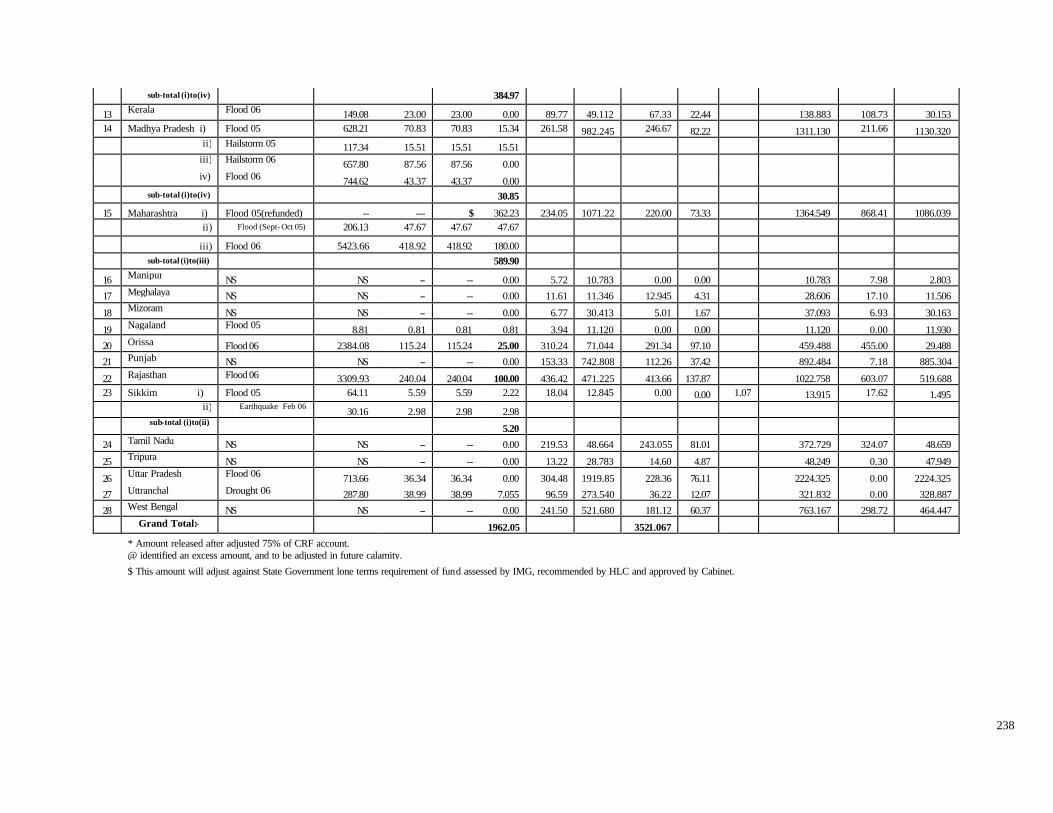
238
sub-total (i)to(iv) 384.97
13 Kerala Flood 06 149.08 23.00 23.00 0.00 89.77 49.112 67.33 22.44 138.883 108.73 30.153 14 Madhya Pradesh i) Flood 05 628.21 70.83 70.83 15.34 261.58 982.245 246.67 82.22 1311.130 211.66 1130.320
ii) Hailstorm 05 117.34 15.51 15.51 15.51
iii) Hailstorm 06 657.80 87.56 87.56 0.00
iv) Flood 06 744.62 43.37 43.37 0.00 sub-total (i)to(iv) 30.85
15 Maharashtra i) Flood 05(refunded) -- --- $ 362.23 234.05 1071.22 220.00 73.33 1364.549 868.41 1086.039 ii) Flood (Sept- Oct 05) 206.13 47.67 47.67 47.67
iii) Flood 06 5423.66 418.92 418.92 180.00 sub-total (i)to(iii) 589.90
16 Manipur NS NS -- -- 0.00 5.72 10.783 0.00 0.00 10.783 7.98 2.803
17 Meghalaya NS NS -- -- 0.00 11.61 11.346 12.945 4.31 28.606 17.10 11.506
18 Mizoram NS NS -- -- 0.00 6.77 30.413 5.01 1.67 37.093 6.93 30.163
19 Nagaland Flood 05 8.81 0.81 0.81 0.81 3.94 11.120 0.00 0.00 11.120 0.00 11.930
20 Orissa Flood 06 2384.08 115.24 115.24 25.00 310.24 71.044 291.34 97.10 459.488 455.00 29.488
21 Punjab NS NS -- -- 0.00 153.33 742.808 112.26 37.42 892.484 7.18 885.304
22 Rajasthan Flood 06 3309.93 240.04 240.04 100.00 436.42 471.225 413.66 137.87 1022.758 603.07 519.688 23 Sikkim i) Flood 05 64.11 5.59 5.59 2.22 18.04 12.845 0.00 0.00 1.07 13.915 17.62 1.495
ii) Earthquake Feb 06 30.16 2.98 2.98 2.98
sub-total (i)to(ii) 5.20
24 Tamil Nadu NS NS -- -- 0.00 219.53 48.664 243.055 81.01 372.729 324.07 48.659
25 Tripura NS NS -- -- 0.00 13.22 28.783 14.60 4.87 48.249 0.30 47.949
26 Uttar Pradesh Flood 06 713.66 36.34 36.34 0.00 304.48 1919.85 228.36 76.11 2224.325 0.00 2224.325
27 Uttranchal Drought 06 287.80 38.99 38.99 7.055 96.59 273.540 36.22 12.07 321.832 0.00 328.887
28 West Bengal NS NS -- -- 0.00 241.50 521.680 181.12 60.37 763.167 298.72 464.447
Grand Total:- 1962.05 3521.067 * Amount released after adjusted 75% of CRF account. @ identified an excess amount, and to be adjusted in future calamity. $ This amount will adjust against State Government lone terms requirement of fund assessed by IMG, recommended by HLC and approved by Cabinet.
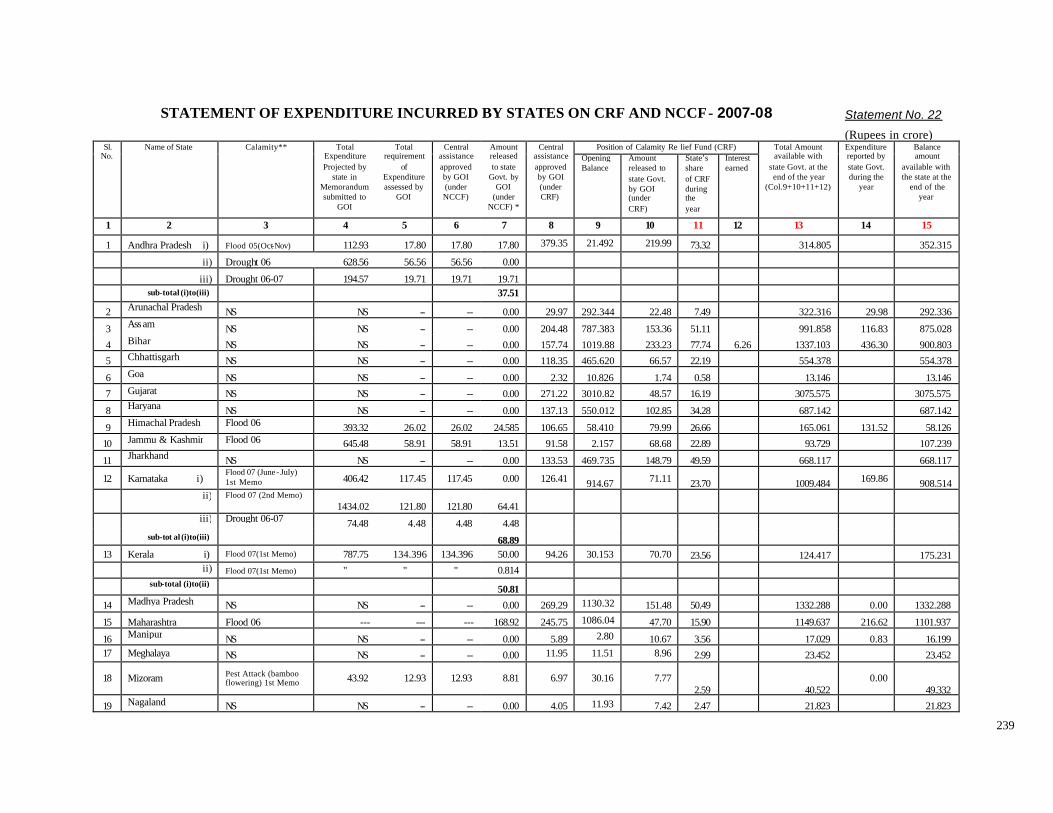
239
STATEMENT OF EXPENDITURE INCURRED BY STATES ON CRF AND NCCF - 2007-08 Statement No. 22
(Rupees in crore) Sl.
No. Name of State Calamity** Total
Expenditure Projected by
state in Memorandum submitted to
GOI
Total requirement
of Expenditure assessed by
GOI
Central assistance approved by GOI (under NCCF)
Amount released to state
Govt. by GOI
(under NCCF) *
Central assistance approved by GOI (under CRF)
Position of Calamity Re lief Fund (CRF) Total Amount available with
state Govt. at the end of the year
(Col.9+10+11+12)
Expenditure reported by state Govt. during the
year
Balance amount
available with the state at the
end of the year
Opening Balance
Amount released to state Govt. by GOI (under CRF)
State’s share of CRF during the year
Interest earned
1 2 3 4 5 6 7 8 9 10 11 12 13 14 15
1 Andhra Pradesh i) Flood 05(Oct-Nov) 112.93 17.80 17.80 17.80 379.35 21.492 219.99 73.32 314.805 352.315
ii) Drought 06 628.56 56.56 56.56 0.00
iii) Drought 06-07 194.57 19.71 19.71 19.71 sub-total (i)to(iii) 37.51
2 Arunachal Pradesh NS NS -- -- 0.00 29.97 292.344 22.48 7.49 322.316 29.98 292.336
3 Assam NS NS -- -- 0.00 204.48 787.383 153.36 51.11 991.858 116.83 875.028
4 Bihar NS NS -- -- 0.00 157.74 1019.88 233.23 77.74 6.26 1337.103 436.30 900.803
5 Chhattisgarh NS NS -- -- 0.00 118.35 465.620 66.57 22.19 554.378 554.378
6 Goa NS NS -- -- 0.00 2.32 10.826 1.74 0.58 13.146 13.146
7 Gujarat NS NS -- -- 0.00 271.22 3010.82 48.57 16.19 3075.575 3075.575
8 Haryana NS NS -- -- 0.00 137.13 550.012 102.85 34.28 687.142 687.142
9 Himachal Pradesh Flood 06 393.32 26.02 26.02 24.585 106.65 58.410 79.99 26.66 165.061 131.52 58.126
10 Jammu & Kashmir Flood 06 645.48 58.91 58.91 13.51 91.58 2.157 68.68 22.89 93.729 107.239
11 Jharkhand NS NS -- -- 0.00 133.53 469.735 148.79 49.59 668.117 668.117
12 Karnataka i) Flood 07 (June- July) 1st Memo 406.42 117.45 117.45 0.00 126.41 914.67 71.11 23.70 1009.484 169.86 908.514
ii) Flood 07 (2nd Memo)
1434.02 121.80 121.80 64.41
iii) Drought 06-07 74.48 4.48 4.48 4.48
sub-tot al (i)to(iii) 68.89 13 Kerala i) Flood 07(1st Memo) 787.75 134.396 134.396 50.00 94.26 30.153 70.70 23.56 124.417 175.231
ii) Flood 07(1st Memo) " " " 0.814
sub-total (i)to(ii) 50.81
14 Madhya Pradesh NS NS -- -- 0.00 269.29 1130.32 151.48 50.49 1332.288 0.00 1332.288
15 Maharashtra Flood 06 --- --- --- 168.92 245.75 1086.04 47.70 15.90 1149.637 216.62 1101.937
16 Manipur NS NS -- -- 0.00 5.89 2.80 10.67 3.56 17.029 0.83 16.199 17 Meghalaya NS NS -- -- 0.00 11.95 11.51 8.96 2.99 23.452 23.452
18 Mizoram Pest Attack (bamboo flowering) 1st Memo 43.92 12.93 12.93 8.81 6.97 30.16 7.77
2.59
40.522 0.00
49.332
19 Nagaland NS NS -- -- 0.00 4.05 11.93 7.42 2.47 21.823 21.823
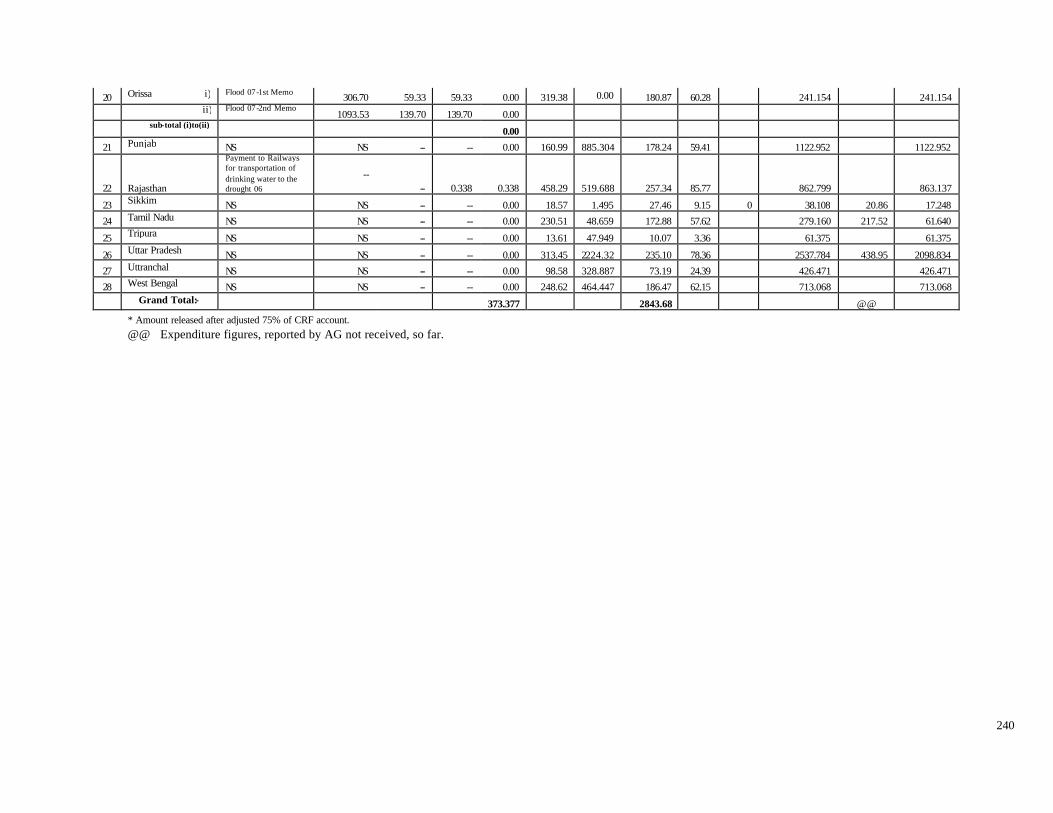
240
20 Orissa i) Flood 07-1st Memo 306.70 59.33 59.33 0.00 319.38 0.00 180.87 60.28 241.154 241.154
ii) Flood 07-2nd Memo 1093.53 139.70 139.70 0.00
sub-total (i)to(ii) 0.00
21 Punjab NS NS -- -- 0.00 160.99 885.304 178.24 59.41 1122.952 1122.952
22 Rajasthan
Payment to Railways for transportation of drinking water to the drought 06
-- -- 0.338 0.338 458.29 519.688 257.34 85.77 862.799 863.137
23 Sikkim NS NS -- -- 0.00 18.57 1.495 27.46 9.15 0 38.108 20.86 17.248
24 Tamil Nadu NS NS -- -- 0.00 230.51 48.659 172.88 57.62 279.160 217.52 61.640
25 Tripura NS NS -- -- 0.00 13.61 47.949 10.07 3.36 61.375 61.375
26 Uttar Pradesh NS NS -- -- 0.00 313.45 2224.32 235.10 78.36 2537.784 438.95 2098.834
27 Uttranchal NS NS -- -- 0.00 98.58 328.887 73.19 24.39 426.471 426.471
28 West Bengal NS NS -- -- 0.00 248.62 464.447 186.47 62.15 713.068 713.068
Grand Total:- 373.377 2843.68 @@ * Amount released after adjusted 75% of CRF account. @@ Expenditure figures, reported by AG not received, so far.
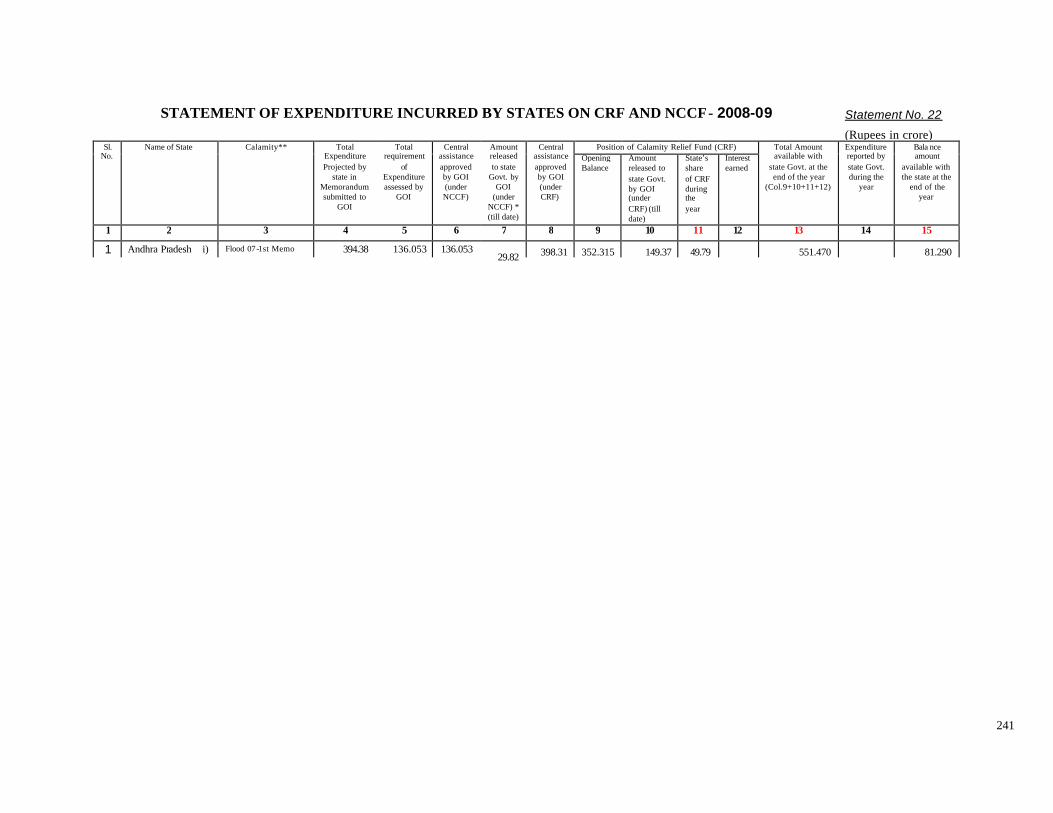
241
STATEMENT OF EXPENDITURE INCURRED BY STATES ON CRF AND NCCF - 2008-09 Statement No. 22
(Rupees in crore) Sl.
No. Name of State Calamity** Total
Expenditure Projected by
state in Memorandum submitted to
GOI
Total requirement
of Expenditure assessed by
GOI
Central assistance approved by GOI (under NCCF)
Amount released to state
Govt. by GOI
(under NCCF) * (till date)
Central assistance approved by GOI (under CRF)
Position of Calamity Relief Fund (CRF) Total Amount available with
state Govt. at the end of the year
(Col.9+10+11+12)
Expenditure reported by state Govt. during the
year
Bala nce amount
available with the state at the
end of the year
Opening Balance
Amount released to state Govt. by GOI (under CRF) (till date)
State’s share of CRF during the year
Interest earned
1 2 3 4 5 6 7 8 9 10 11 12 13 14 15
1 Andhra Pradesh i) Flood 07-1st Memo 394.38 136.053 136.053 29.82 398.31 352.315 149.37 49.79 551.470 81.290

Opening Balance Receipts
Expen-diture
Closing Balance
Opening Balance Receipts
Expen-diture
Closing Balance
Opening Balance Receipts
Expen-diture
Closing Balance
Opening Balance Receipts
Expen-diture
Closing Balance
Opening Balance Receipts
Expen-diture
Closing Balance
Opening Balance Receipts
Expen-diture
Closing Balance
0 1 2 3 4 5 6 7 8 9 10 11 12 13 14 15 16 17 18 19 20 21 22 23 24 25 261 Andhra Pradesh 45.88 198.05 243.93 0.00 0.00 279.34 213.48 65.86 65.86 237.36 303.22 0.00 0.00 346.03 346.03 0.00 0.00 358.63 358.63 0.00 0.00 444.08 444.08 0.002 Arunachal Pradesh 2.00 0.00 0.00 2.00 2.00 0.00 0.00 2.00 2.00 0.00 0.00 2.00 2.00 0.00 0.00 2.00 2.00 0.00 0.00 2.00 2.00 2.003 Assam 197.66 22.00 0 219.66 219.66 53.28 0 272.94 272.94 111.89 0 384.83 384.83 38.75 25.00 398.58 398.58 433.59 242.86 589.31 589.31 5.47 189.81 404.974 Bihar* 315.98 38.18 0 354.16 354.16 66.96 0 421.12 421.12 144.13 131.78 433.47 433.47 0 0 433.47 433.47 188.59 111.84 510.22 510.22 439.62 0 949.845 Chhattisgarh ** 102.46 46.87 0.00 46.87 46.87 71.72 0.00 118.59 118.59 160.04 89.75 188.88 188.88 38.12 0.00 227.00 227.00 30.55 30.55 227.00 227.00 108.61 45.81 289.80
Inv. 0.35 0.35 0.65 0.65 0.68 0.68 0.79 0.79 4.42 4.42 6.37 6.37Cr. 6.15 0.66 6.15 0.66 0.66 0.07 0.00 0.73 0.73 2.67 0.00 3.40 3.40 2.19 0.00 5.59 5.59 1.55 0.00 7.14 7.14 1.58 0.00 8.72
7 Gujarat 187.03 171.49 161.40 197.12 197.12 159.38 159.38 197.12 197.12 177.94 177.94 197.12 197.12 224.87 187.12 234.87 234.86 196.31 119.35 311.82 311.82 550.31 378.05 484.088 Haryana Cr. 110.35 81.30 27.17 164.48 164.48 110.37 57.53 217.32 217.32 89.64 83.50 223.46 223.45 96.32 8.25 311.52 311.52 98.83 20.76 389.59 389.59 111.94 39.56 461.97
Inv. 48.34 25.60 15.00 37.74 Missing finance accounts 115.80 38.00 9.14 86.94 86.94 0 128.86 215.80 215.80 0 0 215.80 215.80 253.56 324.41 286.659 Himachal Pradesh 0.00 63.39 55.10 8.29 8.29 72.59 72.78 8.10 8.10 64.87 57.94 15.03 15.03 50.30 52.10 13.23 13.23 52.87 58.77 7.33 7.33 213.77 201.02 20.08
8235 104.94 0.07 76.68 28.33 28.33 0.02 0 28.35 28.35 0 0 28.35 28.35 0 0 28.35 28.35 0 0 28.35 28.35 0 0 28.358121 0 36.29 6.77 29.52 29.52 41.53 70.62 0.43 0.43 42.37 4.20 38.60 38.60 58.03 15.36 81.27 81.27 49.44 33.81 96.90 96.90 445.94 418.57 124.27
11 Jharkhand Inv. 0 0.00 0 0.00 0 0 116.22 -116.22 116.22 0 0 116.22 116.22 NA NA 116.22 116.22 116.22Cr. 0 0.00 0 56.69 56.69 56.69 59.53 0 116.22 116.22 62.51 178.73 178.73 NA NA 247.80 247.80 160.85 104.40 304.25
12 Karnataka 0 NA NA NA 0 0.00 0 0.00 1.00 1.00 1.00 1.00 1.00 1.0013 Kerala 10.18 23.13 16.25 17.06 17.06 114.71 71.46 60.31 60.32 74.13 70.62 63.83 63.83 77.84 122.73 18.94 18.93 287.73 233.26 73.40 73.40 103.44 127.73 49.11
14 Madhya Pr. 102.46 0.00 0.00 102.46 102.46 0.00 0.00 102.46 102.46 0.00 0.00 102.46 102.46 0.00 0.00 102.46 102.46 0.00 0.00 102.46 0.00 254.23 0.00 254.2315 Maharashtra 192.97 157.20 86.50 263.67 263.67 165.07 71.64 357.10 357.10 173.32 390.62 139.80 139.80 181.99 181.98 139.81 139.81 47.77 191.08 -3.50 -3.50 222.90 219.40 0.0016 Manipur 13.27 0.39 0.01 13.65 13.65 0.00 0.00 13.65 13.65 1.17 0.01 14.81 14.81 5.16 6.70 13.27 13.27 7.40 7.98 12.69 12.69 10.35 2.31 20.7317 Meghalaya 7.93 3.94 3.23 8.64 8.64 4.12 4.05 8.71 8.71 4.35 1.95 11.11 11.11 4.56 6.41 9.26 9.26 10.95 4.56 15.65 15.65 11.29 10.95 15.9918 Mizoram @ N.A. NA N.A. NA N.A. NA N.A. NA N.A. NA N.A. NA
Inv. 8.80 8.80 9.74 9.74 8.21 8.21 11.75 11.75 12.60 12.60 11.96 11.96Cr. 2.76 0.84 0.18 3.42 3.42 0.51 2.03 1.90 1.90 3.56 2.60 2.86 2.86 0.85 2.73 0.98 0.98 0.85 1.49 0.34 0.34 4.62 3.20 1.76
8235 369.71 0.21 250.45 119.47 119.47 0 301.55 231.72 171.228121 0 249.95 260.20 172.57 172.57 142.39 202.72 112.24 112.24 339.74 318.31 133.67 133.67 186.50 271.01 49.16 49.16 52.23 0
Inv. 0 0.00 0 0.00 0 0.00 0 0.00 0 0.00 0 301.54 301.54Inv. 111.58 0 4.30 107.28 A 0 0 116.10 0 2.73 113.37 118.83 0 0 118.83 118.83 0 0 118.83 118.83 0 0 118.83Cr. 113.69 79.81 75.41 118.09 B 0 0 0.00 319.65 18.52 3.47 334.70 334.70 212.54 4.28 542.96 542.96 440.05 16.13 966.88 966.89 210.60 22.68 1154.81Cr. 102.46 449.94 547.20 5.20 5.20 242.47 247.67 0.00 0 462.86 436.65 26.21 26.21 956.10 836.14 146.17 146.17 475.03 190.55 430.65 430.65 344.44 364.11 410.98Inv. 33.87 14.80 53.87 -5.20 -5.20 5.69 0.49 0.00 0 104.10 104.10 0.00 0 0.00 0 286.73 286.73 0.00 0 0 0 0.00Inv. 0 0.00 0.00 2.50 2.50 2.50 2.50 2.50 2.50 2.50 2.50Cr. 6.10 4.68 6.07 4.71 4.71 6.77 6.42 5.06 5.07 7.50 8.47 4.10 4.10 10.85 7.91 7.04 7.04 18.30 17.93 7.41 7.40 15.25 12.10 10.55
24 Tamilnadu 0 102.64 102.64 0.00 0 107.77 107.77 0.00 0 329.15 246.22 82.93 82.93 408.26 491.19 0.00 0 859.23 859.23 0.00 0 1236.45 1236.45 0.0025 Tripura N.A. NA NA NA NA NA N.A. NA N.A. NA N.A. NA N.A. NA
Inv. 0.00 0.00 0.00 0.00 0.17 0.17 0.26 0.26 0.26 0.26 0.26 0.26Cr. 271.65 0 0 271.65 271.65 0 0 271.65 271.65 0 0 271.65 271.65 0 0 271.65 271.65 0 0 271.65 271.65 296.17 0 567.82
27 Uttarakhand 271.65 0 0 271.65 271.65 0 0 271.65 271.65 0 0 271.65 271.65 0 0 271.65 271.65 0 0 271.65 271.65 0 0 271.658235 15.69 0 0 15.69 15.69 0 0 15.69 15.69 0 0 15.69 15.69 0 0 15.69 15.69 0 0 15.69 15.69 15.698121 0 105.11 105.11 0 0 158.09 122.99 35.10 35.10 73.28 -84.16 192.54 301.89 168.70 47.66 422.93 422.93 272.90 114.88 580.95
49068.00 2755.91 1626.59 1843.42 2415.42 2153.55 1967.10 1468.51 2715.49 3268.23 2522.77 2359.69 3373.59 3423.68 3115.01 2741.10 4055.31 4361.66 4199.60 3104.18 5526.15 5425.00 6072.15 4792.78 7449.15
N.B. Amount retained in Madhya Pradesh for want of details pending apportionment between the two successor States.* Bihar : Opening balance on 15.11.2000 Inv. = Investment Account @ 8235 Head CRF figures not available. ** composite balance of Madhya Pradesh Jharkhand (Rs.56.69 crore) - Includs Rs.42.52 crore relating to the year 2000-01 A Punjab : A excludes Rs.115.88 crore (debit) from the closing balance due to performa transfer of balance on the request of State Government B : Excludes Rs.118.09 crore from closing balance due to proforma transfer of balances on the request of State Government. Source : Finance Accounts of States
Sikkim23
Rajasthan
20
22
StateSl.
No.
Goa6
Nagaland
21
(Compiled by FC Division of Department of Expenditure, Government of India
West Bengal
2001-022000-01
Uttar Pradesh
Jammu & Kashmir
Punjab
Expenditure on Natural Calamity in the States - Finance Accounts of States (2000-01 to 2006-07)
2002-03
28
2005-06
19
2004-052003-04
Orissa
26
10

(Rs. in crore)
Opening Balance Receipts
Expen-diture
Closing Balance
27 28 29 300.00 628.86 628.86 0.00
0.00404.97 194.28 116.62 482.63949.84 0 0 949.84289.80 200.44 141.93 348.31
0.30 0.308.72 3.30 0.36 11.66
0.00461.97 143.04 29.99 575.02286.65 0 198.65 485.3020.08 20.0828.35 28.35
124.27 373.29 228.00 269.56116.22 0 0 116.22304.25 156.93 0 461.18
0.0049.11 105.73 108.73 46.11254.23 &
102.46 312.06 211.68 354.610.00 868.41 868.41 0.00
20.73 0.75 7.98 13.5015.99 11.61 17.10 10.50-1.63 13.66 6.93 5.1016.58 16.581.76 1.76
171.22 425.33 455.00 141.55
301.54 758.03 456.50 0.00118.83 0 0 118.83
1154.81 312.41 7.18 1460.04410.98 651.54 603.07 459.45
0 0.002.50 6.53 6.03 2.00
10.55 10.78 17.62 3.710.00
18.98 18.54 0.3 37.220.00
567.82 0 0 567.82271.65 0 0 271.6515.69 0 0 15.69
580.95 311.82 298.72 594.056723.48 5507.34 4409.66 7868.62
2006-07

Source: Reserve Bank of India, A Handbook of Statistics on State Finances 2003, A Study of State Budgets 2003 -04, 2007-08 240
Annexure -VI Expenditure Incurred by the States on Relief on Account of Natural Calamities 1987-88 to 2007-08 (Rs. In Lakhs)
1987-
88 1988-
89 1989-
90 1990-
91 1991-
92 1992-
93 1993-
94 1994-
95 1995-
96 1996-
97 1997-
98 1998-
99 1999-
00 2000-
01 2001-
02 2002-
03 2003-
04 2004-
05 2005-
06 2006-
07 2007-
08 (RE) 2008-
09 (BE)
Andhra Pradesh 3405 1700 6037 13615 5917 7071 7225 7089 15395 31495 17509 25706 22202 31518 29274 46125 37680 50943 55319 71021 31922 40161 Arunachal Pradesh 439 387 639 213 211 536 200 200 664 1709 1049 786 2140 1403 1263 1572 5239 2353 9668 7278 2997 3087 Assam
4254 5033 1858 4184 6047 4449 7220 3707 4193 4727 7156 7177 4559 10808 7035 15320 11679 42772 58 19319 40310 21063 Bihar
2909 7049 1300 3500 3500 3510 3500 1641 2293 4715 2555 14876 10406 6064 8000 11240 9502 26622 44892 5086 67684 62998 Chhattisgarh
0 0 0 0 0 0 0 0 0 0 0 0 0 9085 9797 8686 7117 658 11346 20330 17335 17640 Goa
1 1 2 104 106 118 104 128 131 162 123 166 200 98 6 271 230 180 153 375 263 284 Gujarat
8089 4195 3683 6255 7771 -2092 1828 1251 3296 5373 30243 17163 43801 147608 250389 31931 35044 25499 55826 115511 29988 32713 Haryana
1076 2328 157 1710 1764 1728 2488 1265 39042 2595 2913 2863 4939 7986 8703 9335 9620 10189 15443 21680 26496 19436 Himachal Pradesh
1423 2911 859 2086 1854 1836 2257 1415 4049 2626 4988 2353 3358 6161 8238 6280 5030 5286 21371 12874 10665 10987 Jammu & Kashmir
2421 2488 117 1211 1205 1657 757 1208 1966 2013 2124 3170 2590 3509 6009 3871 4067 4263 64618 37355 10535 9467 Jharkhand
0 0 0 0 0 0 0 0 0 0 0 0 0 0 7789 16001 8591 13782 8000 22772 28839 7161 Karnataka
221 1001 697 3646 7261 5999 5477 3267 4608 4391 6636 10430 9337 7877 11385 19221 36363 24020 47488 61215 27868 13273 Kerala
391 930 2370 3100 3100 5562 3179 3328 8347 2886 7254 6260 6521 2312 11471 7413 7784 28773 10208 8978 19433 9898 Madhya Pradesh
2167 1203 720 2145 3886 4328 4347 7517 6422 8239 20374 9028 6345 10915 12428 37354 25341 10120 42108 34354 35097 34191
Maharashtra 1006 4801 5032 12073 10951 10077 11184 26559 33778 46920 33942 42568 6246 12210 16538 18557 49701 41127 152497 164122 83746 25709 Manipur 13 78 337 100 76 100 100 100 256 54 196 282 668 39 0 117 487 707 0 83 1805 666
Meghalaya 19 244 35 98 298 201 400 200 263 1132 303 309 323 394 512 435 456 1095 1129 1161 1195 1195 Mizoram 96 148 94 147 158 100 622 88 786 101 133 135 790 297 108 439 338 1158 370 1366 1578 719 Nagaland 0 0 0 100 100 100 100 100 160 171 189 197 214 196 205 356 -23 85 462 564 892 416 Orissa
973 1108 2658 4744 4919 4691 7742 3906 7946 7528 8991 4558 82764 14365 26839 20669 34581 30365 39655 45775 39717 49147 Punjab
11236 11286 1953 2983 2899 2896 5069 3249 15194 1534 4222 3115 23 7859 22617 1094 13530 29123 7301 14982 38182 45808 Rajasthan
6272 3533 969 12400 12400 12400 12400 12400 17246 20223 19202 20132 23256 52672 32096 46532 95461 47065 42287 72492 39878 48416 Sikkim
239 387 42 83 301 287 309 303 601 480 1758 533 1319 474 684 757 1095 1840 1534 983 3677 1925 Tamil Nadu
587 537 896 2691 3899 9417 11223 1950 6463 26915 9404 5548 3064 1077 12607 37732 40854 100680 157455 -2206 42509 19558 Tripura
42 104 82 369 434 81 387 180 128 149 94 1172 1146 932 59 1186 459 1409 1330 2194 1857 1403 Uttarakhand
0 0 0 0 0 0 0 0 0 0 0 0 0 507 1702 6509 3505 4592 5642 9265 9702 11752 Uttar Pradesh
1889 3339 2106 8526 20353 17279 5471 6991 12217 15184 10736 20061 13424 6599 10088 49845 10285 39226 37315 12843 33359 33412 West Bengal
6287 2812 733 1569 8202 4838 1162 1875 7260 4973 5513 11839 11287 44787 5308 16455 11704 12714 23484 24172 20986 26588
All States 55455 57602 33374 87652 107612 97169 94770 89944 192785 196418 197681 210577 261221 387845 501210 416918 465816 556814 857246 785945 668515 549073

245
Annexure – VII
Damage and Loss Assessment from the States -2005-06 to 2007-08
Name of the State Year Type of Calamity
Population Affected (Lakhs)
Human Deaths (Numbers)
Livestock Loss (Numbers)
Houses Damaged (Numbers)
Cropped Area Affected (Ha)
Estimated Value of Loss (Rs. Crores)
Andhra Pradesh 2005-06 Heavy Rains 350 107 14416 118618 551966 2697.97 2006-07 Floods 13.84 165 20530 276567 219897 3455.23
Floods due to heavy rains 0.23 52 4849 29837 219950 188.44
Ogni Cyclone 13.85 41 350000 95218 384555 7173.25 Drought 663671 Total 27.92 258 375379 401622 1488073 10816.92 2007-08 Flash Floods 9.19 52 9316 175640 17426 1539.11
Floods due to Heavy Rains
30.66 122 3871 654394 87127 1308.44
Unseasonal Heavy Rains
40 4643 3678 426410 244.71
Total 39.85 214 17830 833712 530963 3092.26
Data is not available Arunachal Pradesh Assam 2005-06 Floods 7.04 27 74737 Drought 5
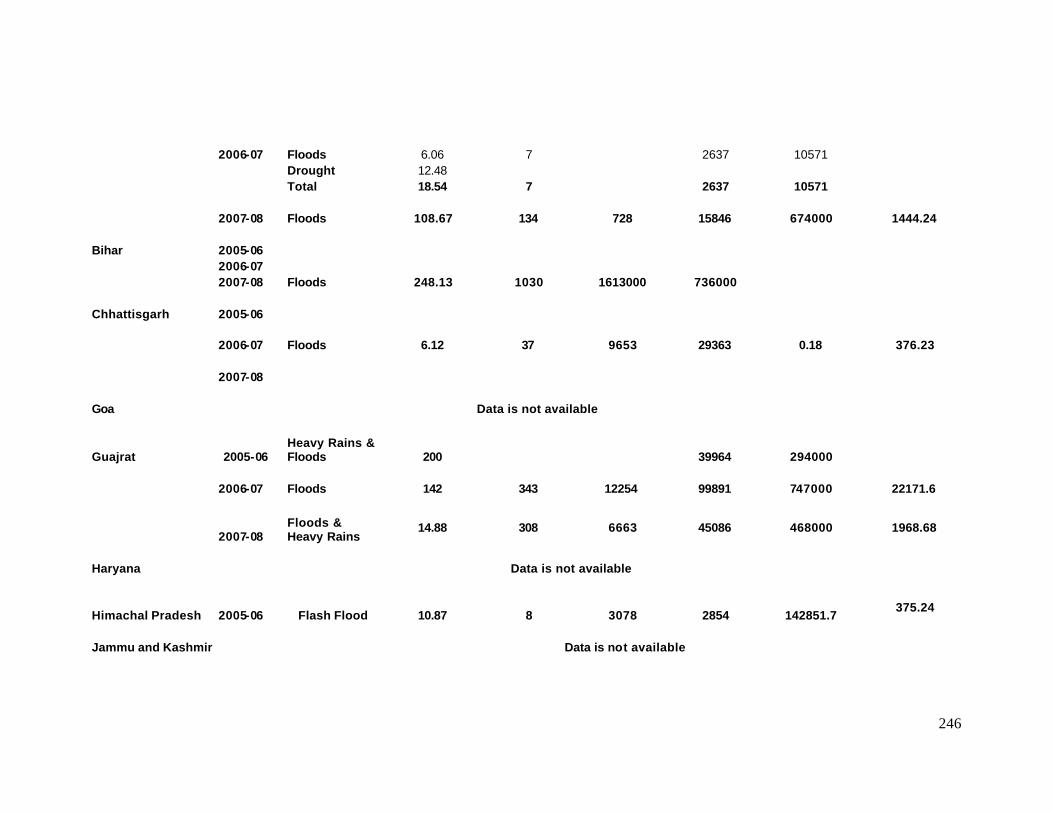
246
2006-07 Floods 6.06 7 2637 10571 Drought 12.48 Total 18.54 7 2637 10571 2007-08 Floods 108.67 134 728 15846 674000 1444.24 Bihar 2005-06 2006-07 2007-08 Floods 248.13 1030 1613000 736000 Chhattisgarh 2005-06 2006-07 Floods 6.12 37 9653 29363 0.18 376.23 2007-08 Goa Data is not available
Guajrat 2005-06 Heavy Rains & Floods 200 39964 294000
2006-07 Floods 142 343 12254 99891 747000 22171.6
2007-08 Floods & Heavy Rains
14.88 308 6663 45086 468000 1968.68
Haryana Data is not available
Himachal Pradesh 2005-06 Flash Flood 10.87 8 3078 2854 142851.7 375.24
Jammu and Kashmir Data is not available

247
Jharkhand 2005-06 2006-07 16.97 90 200 75101 119000 78.18 2007-08 Karnataka Data is not available Kerala 2005-06 15.05 177 165 51792 333310.051 279.31 2006-07 23.59 207 2873 55263 30452 436 2007-08 Madhya Pradesh 2005-06 Drought 27.2
Heavy Rains & Floods
41.73 176 2552 148496 157000 5146.82
Hailstorms 17.68 90 1168 11211 680000 12593.06 Total 86.61 266 3720 159707 837000 17739.88 2006-07 2007-08 Draught 250
Heavy Rains & Floods
8.68 76 243 4652 5042 119.2
Hailstorms 30 908779 744.43 Pest Attack 39.8 776044

248
Total 328.48 76 243 4652 1689865 863.63
Maharashtra 2005-06 Heavy Rains & Floods
1500 31000 825000 1300000 6000
2006-07 2007-08 Manipur Data is not available Meghalaya 2005-06 Cyclone 0.09019 0 0 2045 1.82
Floods & Flash Floods
0.05741 1 0 876 125 0.1593
Fire 0.02266 3 0 453 0.9625 Hailstorms 0.03809 0 0 50 Landslides 0.00019 2 0 18
Thunder Lightning
0.00042 8 2 0
Total 0.11877 14 2 3442 125 2.9418 2006-07 Cyclone 0.44 2 0 6314 2246 21.23 Hailstorm 0.43 0 0 513 6423.85 1.08 Fire 0.037 0 0 656 0 2.22 Landslide 0.00007 1 2 Heavy Rain 0.0539 0 0 0 4400 0.16
Thunder Ligntning
0 10 18 0 0 0.014
Drought 0.11 0 0 0 3569.62 0.36 Total 1.07097 13 18 7485 16639.47 25.064 2007-08

249
Mizoram 2005-06
Cyclone, fire, hailstorm, drought, landslide, cloudburst, pest attack
1.99 21 115 12750 20300 7.73
Mizoram 2006-07
Cyclone, fire, hailstorm, drought, landslide, cloudburst, pest attack
0.61 26 1300 14710 259 9.92
2007-08 Nagaland 2005-06
2006-07
Landslide, cloud burst, flash flood, hailstorm, fire
0.56 1 897 4320 74.67 6.03
Orissa 2005-06 2006-07
2007-08 Heavy rain & floods
13.32 32 19495 27810 120761 306.7
Punjab 2005-06
Floods, heavy rains, hailstorm, drought, fire
12 100 729 0.54
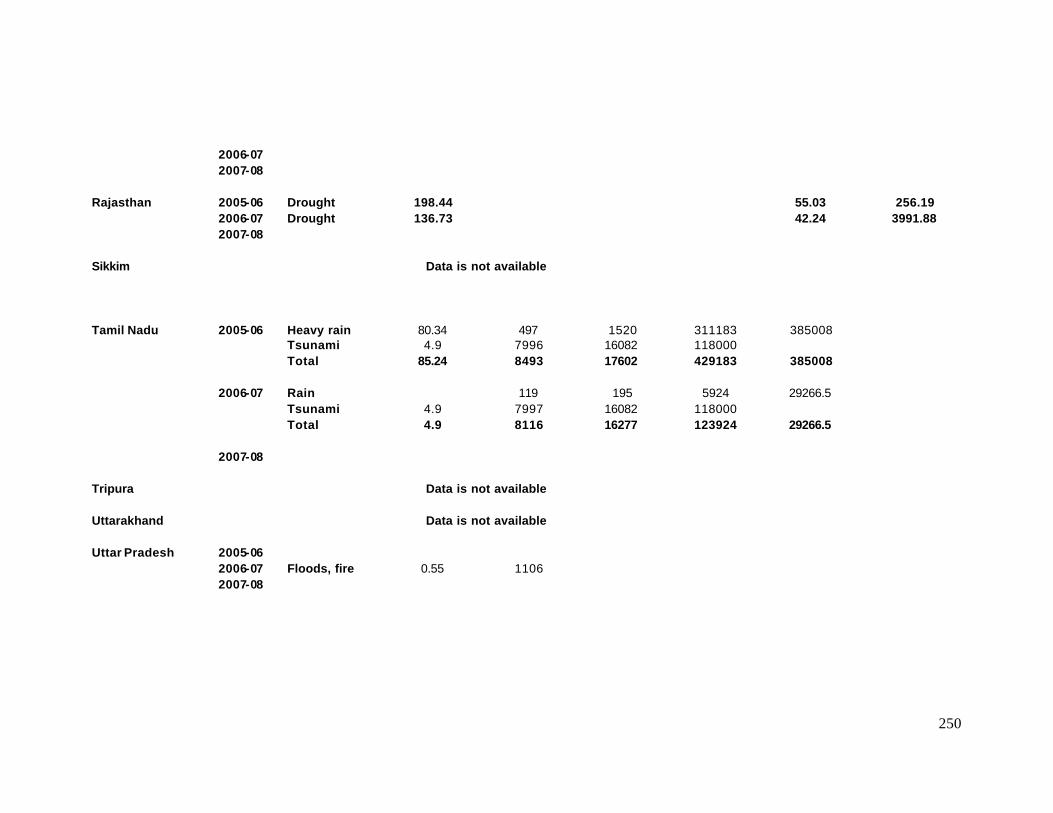
250
2006-07 2007-08 Rajasthan 2005-06 Drought 198.44 55.03 256.19 2006-07 Drought 136.73 42.24 3991.88 2007-08 Sikkim Data is not available Tamil Nadu 2005-06 Heavy rain 80.34 497 1520 311183 385008 Tsunami 4.9 7996 16082 118000 Total 85.24 8493 17602 429183 385008 2006-07 Rain 119 195 5924 29266.5 Tsunami 4.9 7997 16082 118000 Total 4.9 8116 16277 123924 29266.5 2007-08 Tripura Data is not available
Data is not available
Uttarakhand Uttar Pradesh 2005-06 2006-07 Floods, fire 0.55 1106 2007-08
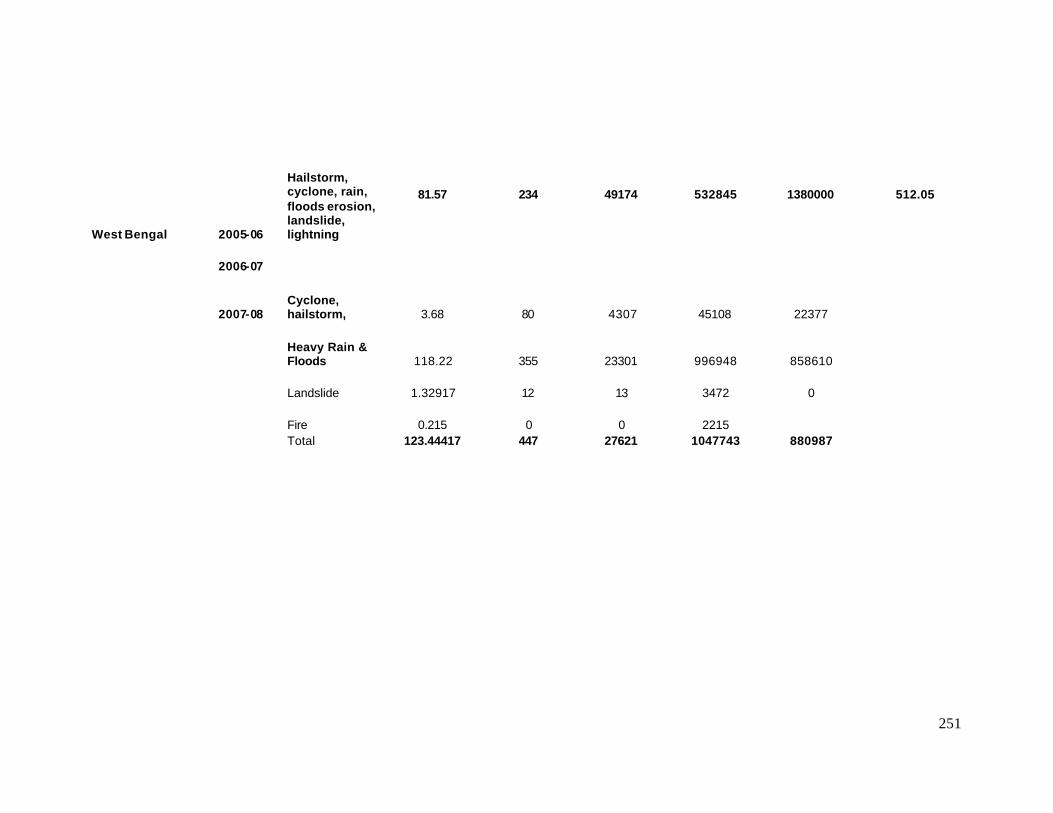
251
West Bengal 2005-06
Hailstorm, cyclone, rain, floods erosion, landslide, lightning
81.57 234 49174 532845 1380000 512.05
2006-07
2007-08 Cyclone, hailstorm, 3.68 80 4307 45108 22377
Heavy Rain & Floods 118.22 355 23301 996948 858610
Landslide 1.32917 12 13 3472 0 Fire 0.215 0 0 2215 Total 123.44417 447 27621 1047743 880987
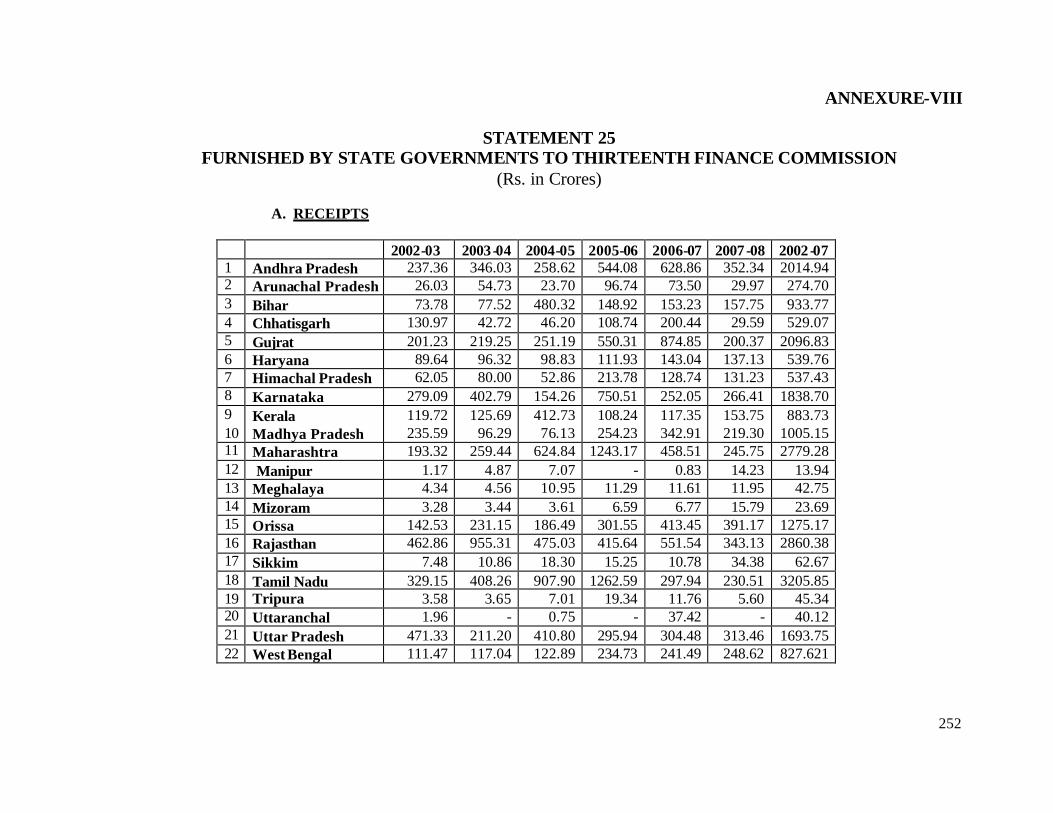
252
ANNEXURE-VIII
STATEMENT 25 FURNISHED BY STATE GOVERNMENTS TO THIRTEENTH FINANCE COMMISSION
(Rs. in Crores)
A. RECEIPTS
2002-03 2003-04 2004-05 2005-06 2006-07 2007-08 2002-07 1 Andhra Pradesh 237.36 346.03 258.62 544.08 628.86 352.34 2014.94 2 Arunachal Pradesh 26.03 54.73 23.70 96.74 73.50 29.97 274.70 3 Bihar 73.78 77.52 480.32 148.92 153.23 157.75 933.77 4 Chhatisgarh 130.97 42.72 46.20 108.74 200.44 29.59 529.07 5 Gujrat 201.23 219.25 251.19 550.31 874.85 200.37 2096.83 6 Haryana 89.64 96.32 98.83 111.93 143.04 137.13 539.76 7 Himachal Pradesh 62.05 80.00 52.86 213.78 128.74 131.23 537.43 8 Karnataka 279.09 402.79 154.26 750.51 252.05 266.41 1838.70 9 Kerala 119.72 125.69 412.73 108.24 117.35 153.75 883.73 10 Madhya Pradesh 235.59 96.29 76.13 254.23 342.91 219.30 1005.15 11 Maharashtra 193.32 259.44 624.84 1243.17 458.51 245.75 2779.28 12 Manipur 1.17 4.87 7.07 - 0.83 14.23 13.94 13 Meghalaya 4.34 4.56 10.95 11.29 11.61 11.95 42.75 14 Mizoram 3.28 3.44 3.61 6.59 6.77 15.79 23.69 15 Orissa 142.53 231.15 186.49 301.55 413.45 391.17 1275.17 16 Rajasthan 462.86 955.31 475.03 415.64 551.54 343.13 2860.38 17 Sikkim 7.48 10.86 18.30 15.25 10.78 34.38 62.67 18 Tamil Nadu 329.15 408.26 907.90 1262.59 297.94 230.51 3205.85 19 Tripura 3.58 3.65 7.01 19.34 11.76 5.60 45.34 20 Uttaranchal 1.96 - 0.75 - 37.42 - 40.12 21 Uttar Pradesh 471.33 211.20 410.80 295.94 304.48 313.46 1693.75 22 West Bengal 111.47 117.04 122.89 234.73 241.49 248.62 827.621
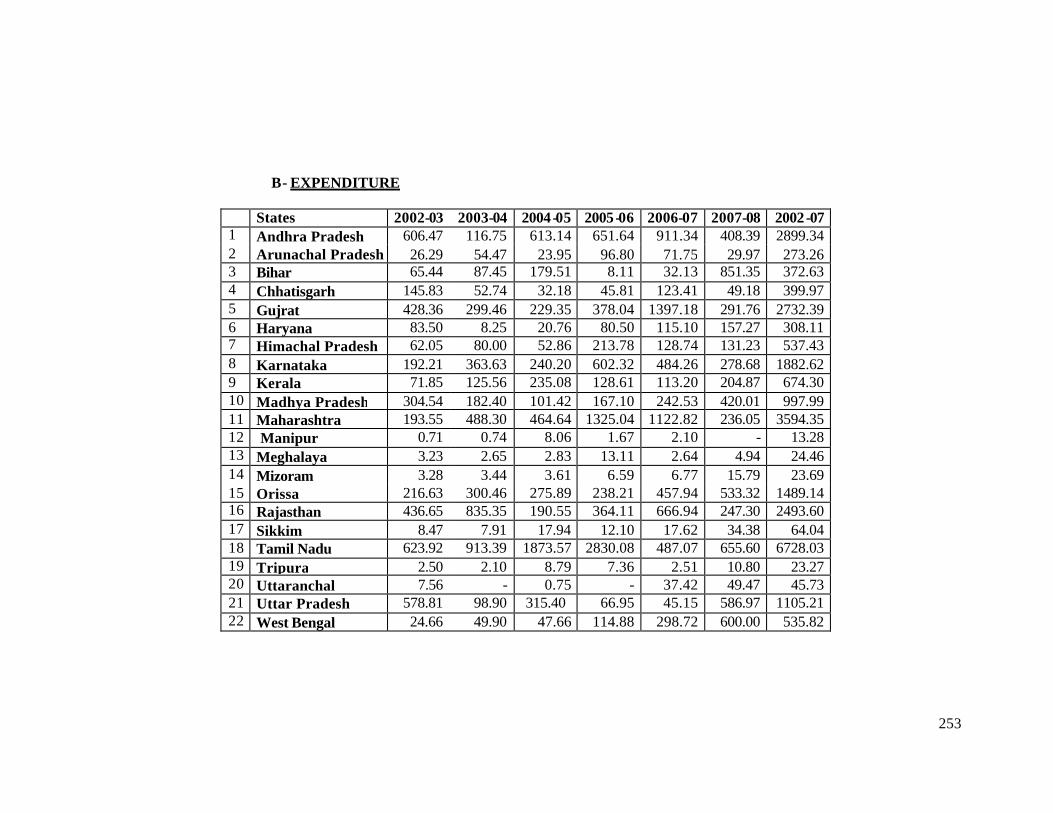
253
B- EXPENDITURE
States 2002-03 2003-04 2004-05 2005-06 2006-07 2007-08 2002-07 1 Andhra Pradesh 606.47 116.75 613.14 651.64 911.34 408.39 2899.34 2 Arunachal Pradesh 26.29 54.47 23.95 96.80 71.75 29.97 273.26 3 Bihar 65.44 87.45 179.51 8.11 32.13 851.35 372.63 4 Chhatisgarh 145.83 52.74 32.18 45.81 123.41 49.18 399.97 5 Gujrat 428.36 299.46 229.35 378.04 1397.18 291.76 2732.39 6 Haryana 83.50 8.25 20.76 80.50 115.10 157.27 308.11 7 Himachal Pradesh 62.05 80.00 52.86 213.78 128.74 131.23 537.43 8 Karnataka 192.21 363.63 240.20 602.32 484.26 278.68 1882.62 9 Kerala 71.85 125.56 235.08 128.61 113.20 204.87 674.30 10 Madhya Pradesh 304.54 182.40 101.42 167.10 242.53 420.01 997.99 11 Maharashtra 193.55 488.30 464.64 1325.04 1122.82 236.05 3594.35 12 Manipur 0.71 0.74 8.06 1.67 2.10 - 13.28 13 Meghalaya 3.23 2.65 2.83 13.11 2.64 4.94 24.46 14 Mizoram 3.28 3.44 3.61 6.59 6.77 15.79 23.69 15 Orissa 216.63 300.46 275.89 238.21 457.94 533.32 1489.14 16 Rajasthan 436.65 835.35 190.55 364.11 666.94 247.30 2493.60 17 Sikkim 8.47 7.91 17.94 12.10 17.62 34.38 64.04 18 Tamil Nadu 623.92 913.39 1873.57 2830.08 487.07 655.60 6728.03 19 Tripura 2.50 2.10 8.79 7.36 2.51 10.80 23.27 20 Uttaranchal 7.56 - 0.75 - 37.42 49.47 45.73 21 Uttar Pradesh 578.81 98.90 315.40 66.95 45.15 586.97 1105.21 22 West Bengal 24.66 49.90 47.66 114.88 298.72 600.00 535.82
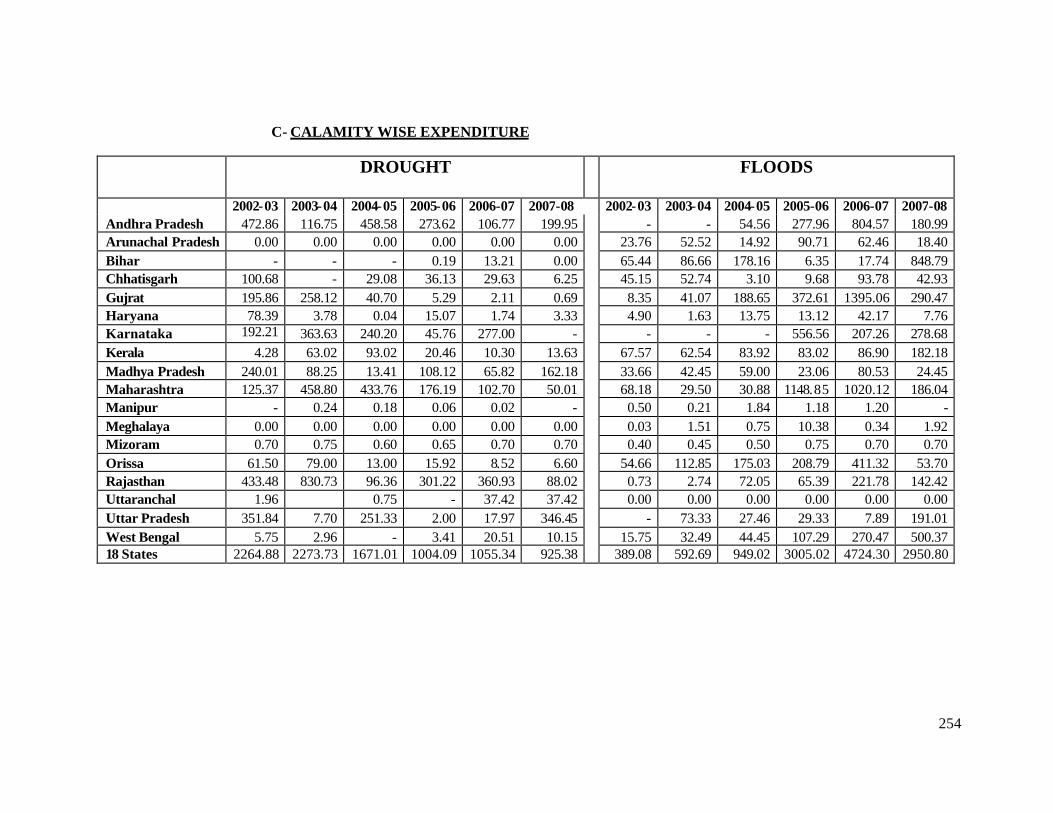
254
C- CALAMITY WISE EXPENDITURE
DROUGHT
FLOODS
2002-03 2003-04 2004-05 2005-06 2006-07 2007-08 2002-03 2003-04 2004-05 2005-06 2006-07 2007-08 Andhra Pradesh 472.86 116.75 458.58 273.62 106.77 199.95
- - 54.56 277.96 804.57 180.99 Arunachal Pradesh 0.00 0.00 0.00 0.00 0.00 0.00 23.76 52.52 14.92 90.71 62.46 18.40 Bihar - - - 0.19 13.21 0.00 65.44 86.66 178.16 6.35 17.74 848.79 Chhatisgarh 100.68 - 29.08 36.13 29.63 6.25 45.15 52.74 3.10 9.68 93.78 42.93 Gujrat 195.86 258.12 40.70 5.29 2.11 0.69 8.35 41.07 188.65 372.61 1395.06 290.47 Haryana 78.39 3.78 0.04 15.07 1.74 3.33 4.90 1.63 13.75 13.12 42.17 7.76 Karnataka 192.21 363.63 240.20 45.76 277.00 - - - - 556.56 207.26 278.68 Kerala 4.28 63.02 93.02 20.46 10.30 13.63 67.57 62.54 83.92 83.02 86.90 182.18 Madhya Pradesh 240.01 88.25 13.41 108.12 65.82 162.18 33.66 42.45 59.00 23.06 80.53 24.45 Maharashtra 125.37 458.80 433.76 176.19 102.70 50.01 68.18 29.50 30.88 1148.85 1020.12 186.04 Manipur - 0.24 0.18 0.06 0.02 - 0.50 0.21 1.84 1.18 1.20 - Meghalaya 0.00 0.00 0.00 0.00 0.00 0.00 0.03 1.51 0.75 10.38 0.34 1.92 Mizoram 0.70 0.75 0.60 0.65 0.70 0.70 0.40 0.45 0.50 0.75 0.70 0.70 Orissa 61.50 79.00 13.00 15.92 8.52 6.60 54.66 112.85 175.03 208.79 411.32 53.70 Rajasthan 433.48 830.73 96.36 301.22 360.93 88.02 0.73 2.74 72.05 65.39 221.78 142.42 Uttaranchal 1.96 0.75 - 37.42 37.42 0.00 0.00 0.00 0.00 0.00 0.00 Uttar Pradesh 351.84 7.70 251.33 2.00 17.97 346.45 - 73.33 27.46 29.33 7.89 191.01 West Bengal 5.75 2.96 - 3.41 20.51 10.15 15.75 32.49 44.45 107.29 270.47 500.37 18 States 2264.88 2273.73 1671.01 1004.09 1055.34 925.38 389.08 592.69 949.02 3005.02 4724.30 2950.80

255
CYCLONES
2002- 03
2003- 04
2004- 05
2005- 06
2006 -07
2007- 08
Andhra Pradesh 133.61 - - 100 - -
Gujrat 224.15 0.27 0 0.14 0.01 0.60
Manipur - 0.11 0.02 0.05 0.09 - Meghalaya 2.35 0.47 1.05 0.68 1 1.15
Mizoram 0.4 0.4 0.35 0.6 0.65 0.65
Uttar Pradesh - 2.48 3.39 0.87 4.10 2.08 West Bengal 3.02 13.87 3.21 4.01 7.74 80.15 7 States 363.53 17.6 8.02 106.35 13.59 84.63
HAIL STORMS
2002-03
2003- 04
2004- 05
2005- 06
2006- 07
2007- 08
Andhra Pradesh - - - - - 27.27
Madhya Pradesh 24.33 24.87 8.83 22.28 77.85 58.13
Manipur - - - 0.01 0.58 - Meghalaya 0.35 0.17 0.51 0.32 0.76 1.51
Mizoram 0.35 0.33 0.4 0.5 0.42 0.44 Rajasthan 1.10 0.46 20.87 -4.04 82.76 14.39
Uttar Pradesh - 5.05 23.88 6.38 4.34 28.66 7 States 26.14 31.36 61.3 76.9 237.56 276.23
FIRE
2002-03 2003-04 2004-05 2005-06 2006-07 2007-08 Andhra Pradesh - - - 0.06 - 0.18 Arunachal Pradesh 1.32 0.11 3.64 2.06 0.33 1.8 Bihar 0.7813 1.3516 1.5684 1.18 2.5585 Haryana 0.20 0.16 0.16 0.86 34.8 35.32 Madhya Pradesh 6.54 26.83 20.18 13.64 18.33 19.85 Manipur 0.06 0.18 5.52 0.04 0.07 - Meghalaya 0.05 0.14 0.15 0.22 0.26 0.06 Mizoram 0.35 0.43 0.6 0.39 0.4 0.38 Rajasthan 1.34 1.42 1.27 1.54 1.47 2.47 Uttar Pradesh - 10.28 8.08 28.37 8.80 11.52 West Bengal 0.14 0.58 - 0.17 - 9.33 11 States 10 40.911 40.952 48.9184 65.64 83.469

256
Annexure -IX
NCCF - Demands of States, Approved and Released by Centre 2000-01 to 2006-07 (Rs. in Crores) Sl. No.
Name of State Year Calamity Demand Approval Release
1 Andhra Pradesh 2001-02 Flood 01 777.71 15.84 10.00 Flood 01 278.26 56.85 20.44 2002-03 Drought 02 1880 174.61 0 Subsidy to farmers -- 45.04 13.72 Freight charges -- 0.47 0.47 Drought (Review) -- 224.43 45.75 2003-04 Drought(Review) -- -- 64.04 Drought 03 859.88 155.5 50.58 Drought (freight charges) -- 2.13 2.13 2004-05 Cyclone 04 367.47 30.89 0 Drought 03 942.99 70.77 0 Drought 04 1199.68 141.47 17.88 Tsunami, Dec 05 342.67 19.53 100.00 Tsunami, Dec 05 " 27.66 -52.81 2005-06 Flood/cyclone storm 05 903.637 172.444 100.00 -- -- -- 27.706
2006-07 Air lifting charged for flood 2000 & 2001 on account basis 3.06 3.06 3.057 Flood , Augt 06 877.32 152.1
200.00 Flood, Sept 06 115.16 30.58 Flood-OGNI cyclonic storm Oct-Nov 06 404.99 119.85 2007-08 Flood 05(Oct -Nov) 112.93 17.8 17.8 Drought 06 628.56 56.56 0 Drought 06-07 194.57 19.71 19.71 2008-09 Flood 07-1st Memo 394.38 136.053
29.82 Flood 07-2nd Memo 584.32 174.86
2 Arunachal Pradesh 2000-01 Flood 02 139.10 5.55 2.00
2002-03 Flood 02 134.63 19.68 12.78
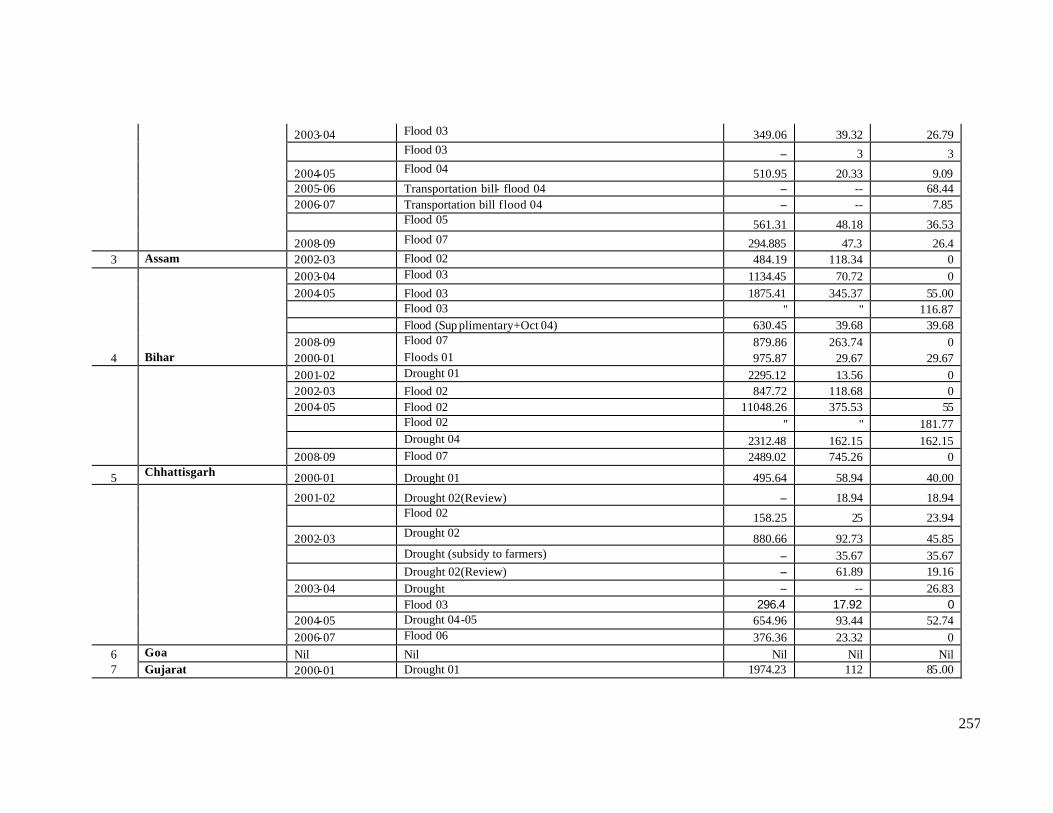
257
2003-04 Flood 03 349.06 39.32 26.79
Flood 03 -- 3 3
2004-05 Flood 04 510.95 20.33 9.09 2005-06 Transportation bill- flood 04 -- -- 68.44 2006-07 Transportation bill flood 04 -- -- 7.85
Flood 05 561.31 48.18 36.53
2008-09 Flood 07 294.885 47.3 26.4 3 Assam 2002-03 Flood 02 484.19 118.34 0 2003-04 Flood 03 1134.45 70.72 0 2004-05 Flood 03 1875.41 345.37 55.00 Flood 03 " " 116.87 Flood (Sup plimentary+Oct 04) 630.45 39.68 39.68 2008-09 Flood 07 879.86 263.74 0 4 Bihar 2000-01 Floods 01 975.87 29.67 29.67 2001-02 Drought 01 2295.12 13.56 0 2002-03 Flood 02 847.72 118.68 0 2004-05 Flood 02 11048.26 375.53 55 Flood 02 " " 181.77 Drought 04 2312.48 162.15 162.15 2008-09 Flood 07 2489.02 745.26 0
5 Chhattisgarh 2000-01 Drought 01 495.64 58.94 40.00
2001-02 Drought 02(Review) -- 18.94 18.94
Flood 02 158.25 25 23.94
2002-03 Drought 02 880.66 92.73 45.85 Drought (subsidy to farmers) -- 35.67 35.67 Drought 02(Review) -- 61.89 19.16 2003-04 Drought -- -- 26.83 Flood 03 296.4 17.92 0 2004-05 Drought 04-05 654.96 93.44 52.74 2006-07 Flood 06 376.36 23.32 0 6 Goa Nil Nil Nil Nil Nil 7 Gujarat 2000-01 Drought 01 1974.23 112 85.00
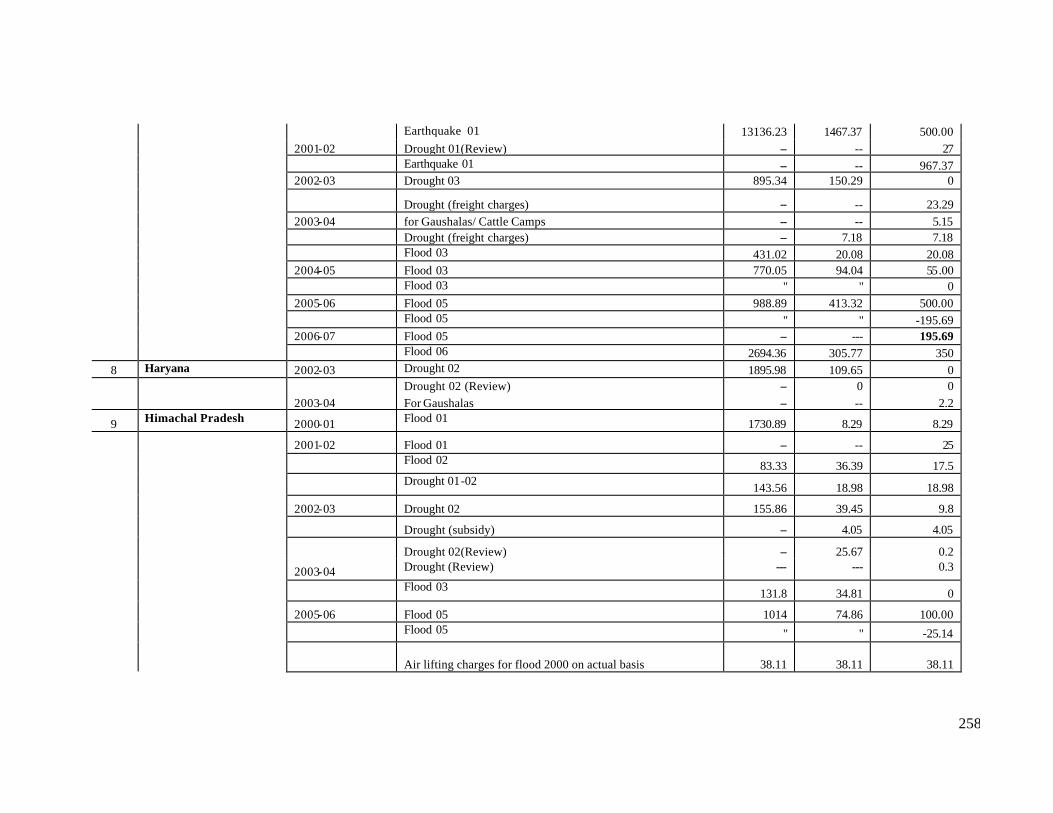
258
Earthquake 01 13136.23 1467.37 500.00 2001-02 Drought 01(Review) -- -- 27 Earthquake 01 -- -- 967.37 2002-03 Drought 03 895.34 150.29 0
Drought (freight charges) -- -- 23.29 2003-04 for Gaushalas/ Cattle Camps -- -- 5.15 Drought (freight charges) -- 7.18 7.18 Flood 03 431.02 20.08 20.08 2004-05 Flood 03 770.05 94.04 55.00 Flood 03 " " 0 2005-06 Flood 05 988.89 413.32 500.00 Flood 05 " " -195.69 2006-07 Flood 05 -- --- 195.69 Flood 06 2694.36 305.77 350 8 Haryana 2002-03 Drought 02 1895.98 109.65 0 Drought 02 (Review) -- 0 0 2003-04 For Gaushalas -- -- 2.2
9 Himachal Pradesh 2000-01 Flood 01 1730.89 8.29 8.29
2001-02 Flood 01 -- -- 25
Flood 02 83.33 36.39 17.5
Drought 01-02 143.56 18.98 18.98
2002-03 Drought 02 155.86 39.45 9.8
Drought (subsidy) -- 4.05 4.05
Drought 02(Review) -- 25.67 0.2
2003-04 Drought (Review) --- --- 0.3
Flood 03 131.8 34.81 0
2005-06 Flood 05 1014 74.86 100.00
Flood 05 " " -25.14
Air lifting charges for flood 2000 on actual basis 38.11 38.11 38.11

259
2006-07 Flood 05(refunded) --- --- 25.14
Drought 05 377 39.02 0
2007-08 Flood 06 393.32 26.02 24.585
2008-09 Flood 07 1234.12 59.89 9.84
10 Jammu & Kashmir 2001-02 Drought 01 1880.95 23.2 23.2
2002-03 Drought 02 1623.98 31.75 0
Drought(Review) -- 0 0
2004-05 Avalanches /Heavy snowfall 1617.09 140.91 50.00
Avalanches /Heavy snowfall " " 0
2005-06 Avalanches /Heavy snowfall 05 -- -- 9.49
Earthquake 05 1351.19 170.2 100
In addition, Rs.229.74 cr. Under Spl.Package " " 200.28
Earthquake 05 " " 275.71
2007-08 Flood 06 645.48 58.91 13.51 11 Jharkhand 2001-02 Drought 01 1467.25 42.06 0 Drought (Review) -- 0 0 2004-05 Drought 04 928.12 139.82 0 2006-07 Drought 05 880.7 107.37 0
12 Karnataka 2002-03 Hailstorm-02 70.51 1.69 0 Drought 02 1562.85 221.46 171.28
Drought (subsidy to farmer) -- 17.9 17.9 Drought (Review) -- 61.63 7.7 2003-04 Drought (Review) -- -- 10.77 Drought 03 1881.55 167.81 115.86 Flood 03 34.77 7.54 7.54 Drought 2878 247.62 50 Drought (Review) " -- 71.85 Drought (EG cash compt.) " -- 60.45
2004-05 Drought (Supl. Nutrition-FCI) --- --- 14.48 Drought 03 1147.72 83.67 24.57

260
Drought 03 " " 24.57 2005-06 Flood 05 3640.07 225.05 57 Flood 05 " " 300.00 Flood 05 " " -158.15 Flood (Sept-Oct 05) 1256.9 160.52 160.00 2006-07 Flood 05 --- --- 158.15 Flood 05 (Sept-Oct) --- --- 0.52 Flood 06 858.37 125.67
226.3 Drought 06 1406.01 74.48 2007-08 Flood 07 (June-July) 1st Memo 406.42 117.45 0 Flood 07 (2nd Memo) 1434.02 121.8 64.41 Drought 06-07 74.48 4.48 4.48 2008-09 Flood 07-3rd Memo 838.78 140.4 109.91
13 Kerala 2000-01 Flood 200 -- -- 2002-03 Drought 02 1047.08 13.57 0 Drought (Review) -- 0 0 Flood 02 146.32 14.11 0 Drought (original Memo 1359.03 49.04 0 2004-05 Drought (additional Memo) 2844.9 28.53 0 Tsunami, Dec 05 1358.77 84.1 100.00 Tsunami, Dec 05 " 44.85 0 Drought 04 (Spl. Relief) 106 106 53.00 Drought 04 (Spl. Relief) " " 53.00 2005-06 Flood 05 196.4 26.98 17.94 Flood 05 " " 12.72 2006-07 Flood 06 149.08 23 0 2007-08 Flood 07(1st Memo) 787.75 134.396 50.00 Flood 07(1st Memo) " " 0.814
14 Madhya Pradesh 2000-01 Drought 01 795.42 57.72 35 2001-02 Drought 01 -- -- 22.72 2002-03 Hailstorm 02 80.95 4.37 0
Drought 01-02 253.84 34.62 34.62
Drought 02 819.62 125.89 95.03
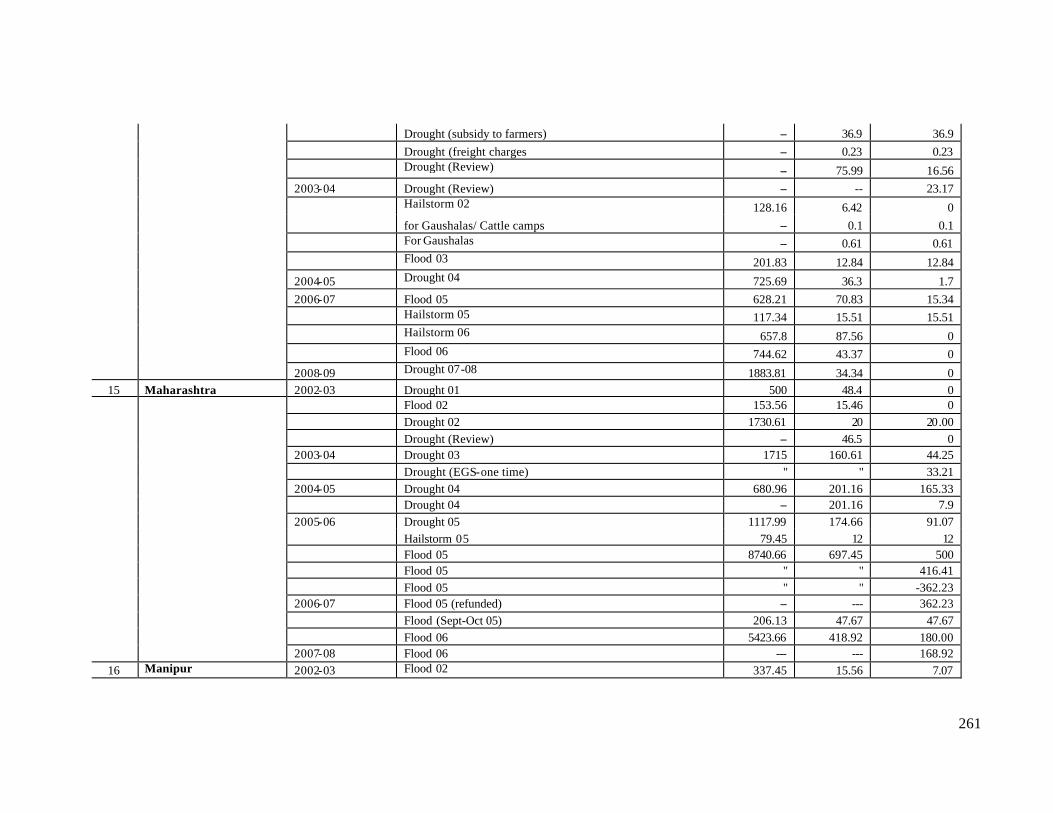
261
Drought (subsidy to farmers) -- 36.9 36.9 Drought (freight charges -- 0.23 0.23
Drought (Review) -- 75.99 16.56 2003-04 Drought (Review) -- -- 23.17
Hailstorm 02 128.16 6.42 0 for Gaushalas/ Cattle camps -- 0.1 0.1 For Gaushalas -- 0.61 0.61
Flood 03 201.83 12.84 12.84
2004-05 Drought 04 725.69 36.3 1.7 2006-07 Flood 05 628.21 70.83 15.34 Hailstorm 05 117.34 15.51 15.51
Hailstorm 06 657.8 87.56 0 Flood 06 744.62 43.37 0
2008-09 Drought 07-08 1883.81 34.34 0 15 Maharashtra 2002-03 Drought 01 500 48.4 0 Flood 02 153.56 15.46 0 Drought 02 1730.61 20 20.00 Drought (Review) -- 46.5 0 2003-04 Drought 03 1715 160.61 44.25 Drought (EGS-one time) " " 33.21 2004-05 Drought 04 680.96 201.16 165.33 Drought 04 -- 201.16 7.9 2005-06 Drought 05 1117.99 174.66 91.07 Hailstorm 05 79.45 12 12 Flood 05 8740.66 697.45 500 Flood 05 " " 416.41 Flood 05 " " -362.23 2006-07 Flood 05 (refunded) -- --- 362.23 Flood (Sept-Oct 05) 206.13 47.67 47.67 Flood 06 5423.66 418.92 180.00 2007-08 Flood 06 --- --- 168.92
16 Manipur 2002-03 Flood 02 337.45 15.56 7.07

262
2008-09 Pest attack (bamboo flowering) 07 50.02 16.67 5.445
17 Meghalaya 2000-01 Cyclonic wind 02 22.13 1.55 1 2004-05 Flood 04 212.5 12.3 6.16
18 Mizoram 2004-05 Flood 04 51.15 13.29 10.68
2007-08 Pest Attack (bamboo flowering) 1st Memo 43.92 12.93 8.81 2008-09 Pest attack (bamboo flowering) 07-08(2nd Memo) 591.63 49.37 39.82 Flood 07 129.34 23.52 9.78
19 Nagaland 2004-05 Flood 04 21.45 3.36 1.81 2006-07 Flood 05 8.81 0.81 0.81
20 Orissa 2000-01 Drought 01 443.95 49.62 35 2001-02 Drought 02 -- -- 14.62 Flood 02 NA 100 100.00
2002-03 Supply-assistance for floods of 2001 (Air dropping) -- 16.41 16.41 Drought 02 871.4 120.18 0
Drought (subsidy to farmers) -- 61.58 5.29 Drought (freight charges) -- -- 0.14 2003-04 Drought (Review) -- 61.58 0 Flood 03 1793.05 173.34 50.00 Flood 03 " " 54.43 2004-05 Flood 04 348.78 53.4 0
2004-05 Air lifting charges for Super Cyclone 199 9 on actual basis 53.44 53.44 53.44 2006-07 Flood 06 2384.08 115.24 25.00 2007-08 Flood 07-1st Memo 306.7 59.33 0 Flood 07-2nd Memo 1093.53 139.7 0
21 Punjab 2002-03 Drought 02 3539.44 125.41 0 2004-05 Flood 04 557.67 14.58 0
22 Rajasthan 2000-01 Drought 00-01 2367.8 123.97 85 2001-02 Drought 00-01 -- -- 28.97 Drought 00-01 -- -- 50.00 2002-03 For Goshalas (Cattle care) -- 11.66 11.66

263
Drought 02 7519.76 207.68 0 Drought (subsidy to farmers -- 164.92 155.68 Drought (freight charges) -- 7.4 7.4 2003-04 Drought 03 -- -- 363.1 for Gaushalaas /Cattle Camps -- -- 14.48 Drought (Composite Team) -- 134.79 99.83 Drought (freight charges) -- 35.33 35.33 2004-05 Drought 04-05 2378.64 332.27 108.00 Drought 04-05 " " 108.79 2005-06 Drought 05 939.37 106.3 0 Hailstorm 05 210.85 49.57 0 Drought 06 1544.63 146.5 0 2006-07 Flood 06 3309.93 240.04 100.00
2007-08 Payment to Railways for transportation of drinking water to the drought 06 -- -- 0.338
23 Sikkim 2004-05 Flood 04 50.55 13.05 9.9 2006-07 Flood 05 64.11 5.59 2.22 Earthquake Feb 06 30.16 2.98 2.98 2008-09 Flood 07 104.92 17.26 8.36
24 Tamil Nadu 2002-03 Drought 02 1545.76 228.3 109.7 Drought (subsidy to farmers) -- 23.36 23.36 Drought -- 258.44 82.93 2003-04 Drought -- -- 116.1 Drought 03 2283.73 292.95 50.00 Drought 03 " " 123.35 2004-05 Drought 04 1910.58 156.84 117.27 Tsunami, Dec 05 4528.66 617.2 250.00 Tsunami, Dec 05 " " 367.2 Tsunami, Dec 05 (subsidy) " 441.08 0 Flood 04 411.73 48.67 48.67 2005-06 Tsunami - subsidy to fishermen 131.91 131.91 131.91 Flood 05 (Oct -Nov) 13457.62 787.9 500.00 Flood 05 (Suppl. report) " 20.45 500.00 Flood 05 (Suppl. report) " " 191.65
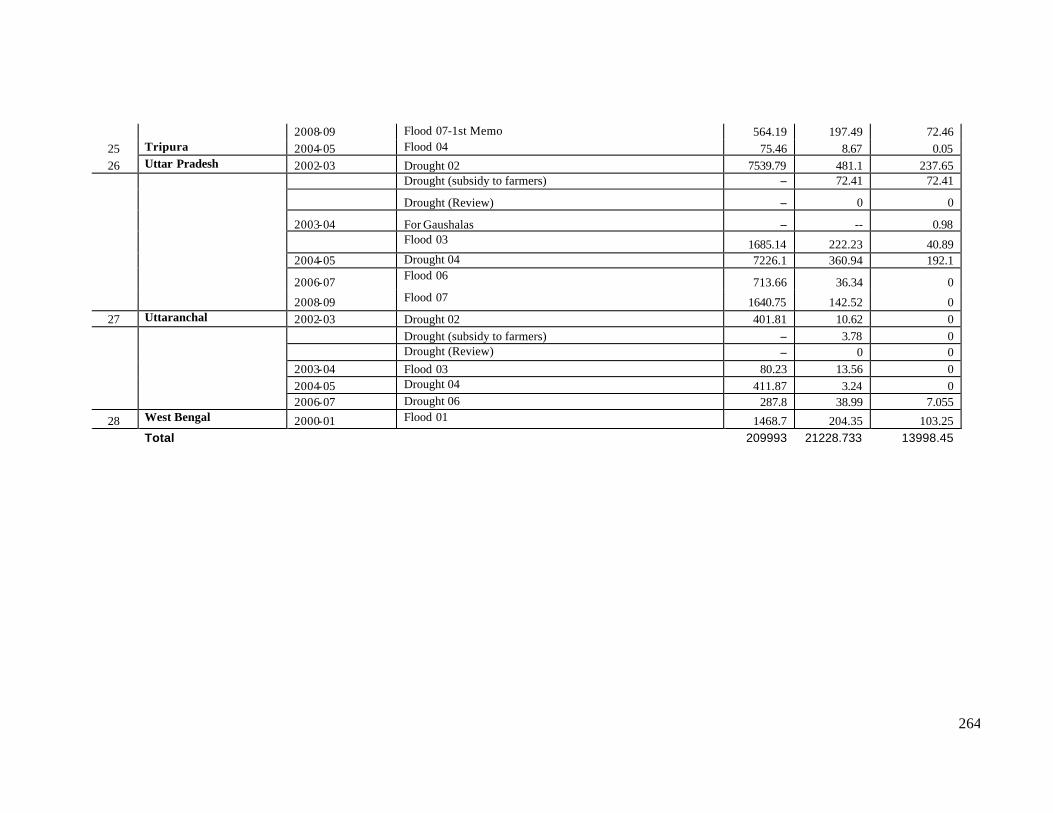
264
2008-09 Flood 07-1st Memo 564.19 197.49 72.46 25 Tripura 2004-05 Flood 04 75.46 8.67 0.05 26 Uttar Pradesh 2002-03 Drought 02 7539.79 481.1 237.65 Drought (subsidy to farmers) -- 72.41 72.41
Drought (Review) -- 0 0
2003-04 For Gaushalas -- -- 0.98
Flood 03 1685.14 222.23 40.89 2004-05 Drought 04 7226.1 360.94 192.1
2006-07 Flood 06 713.66 36.34 0
2008-09 Flood 07 1640.75 142.52 0 27 Uttaranchal 2002-03 Drought 02 401.81 10.62 0 Drought (subsidy to farmers) -- 3.78 0 Drought (Review) -- 0 0 2003-04 Flood 03 80.23 13.56 0 2004-05 Drought 04 411.87 3.24 0 2006-07 Drought 06 287.8 38.99 7.055
28 West Bengal 2000-01 Flood 01 1468.7 204.35 103.25 Total 209993 21228.733 13998.45
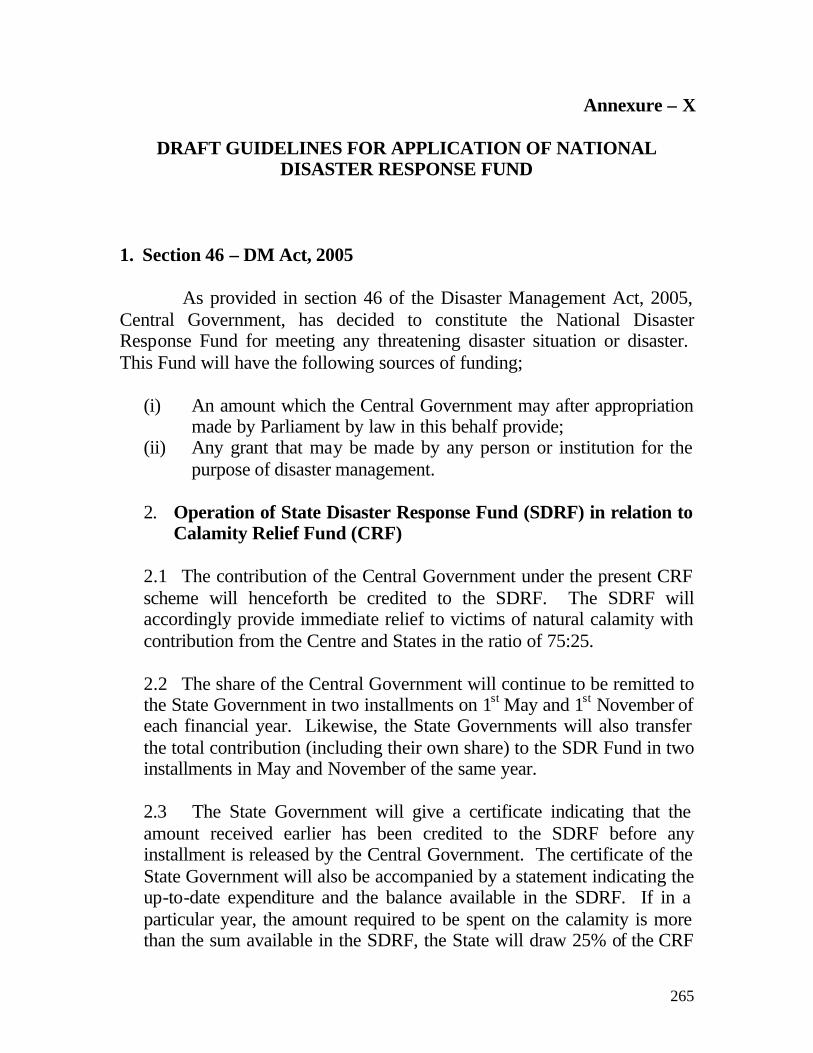
265
Annexure – X
DRAFT GUIDELINES FOR APPLICATION OF NATIONAL DISASTER RESPONSE FUND
1. Section 46 – DM Act, 2005 As provided in section 46 of the Disaster Management Act, 2005, Central Government, has decided to constitute the National Disaster Response Fund for meeting any threatening disaster situation or disaster. This Fund will have the following sources of funding;
(i) An amount which the Central Government may after appropriation made by Parliament by law in this behalf provide;
(ii) Any grant that may be made by any person or institution for the purpose of disaster management.
2. Operation of State Disaster Response Fund (SDRF) in relation to
Calamity Relief Fund (CRF) 2.1 The contribution of the Central Government under the present CRF scheme will henceforth be credited to the SDRF. The SDRF will accordingly provide immediate relief to victims of natural calamity with contribution from the Centre and States in the ratio of 75:25. 2.2 The share of the Central Government will continue to be remitted to the State Government in two installments on 1st May and 1st November of each financial year. Likewise, the State Governments will also transfer the total contribution (including their own share) to the SDR Fund in two installments in May and November of the same year. 2.3 The State Government will give a certificate indicating that the amount received earlier has been credited to the SDRF before any installment is released by the Central Government. The certificate of the State Government will also be accompanied by a statement indicating the up-to-date expenditure and the balance available in the SDRF. If in a particular year, the amount required to be spent on the calamity is more than the sum available in the SDRF, the State will draw 25% of the CRF
266
due to the State in the following year from the Centre, to be adjusted against dues of the subsequent year. 2.4 The investment of the funds, as hithertofore, will be carried out by the branch of RBI, having a banking department at the headquarters of the State. 3. Definition of “Calamity” 3.1 The definition of a calamity will include occurrence of cyclone, drought, earthquake, fire, flood, hailstorm, landslides, avalanches, cloud burst, pest attack and Chemical, Biological, Radiological an Nuclear (CBRN) emergencies/disasters. 4. Objectives and Scope of NDRF 4.1 The National Disaster Response Fund is being set up so as to ensure that in case of severe disaster which is beyond the coping capacity of affected areas and for which the resources available in SDRF are inadequate, Central Government may meet expenses for emergency response and render suitable immediate relief and assistance to State Governments within a reasonable period. For this purpose, the Central Government has created a Fund in the Public Account, which can be used in case of emergent situations to handle any severe disaster or disaster like situation. This will be a non-plan fund called the National Disaster Response Fund. 4.2 The National Disaster Response Fund will be constituted under the administrative control of the Ministry of Home Affairs. To begin with, there will be a corpus of Rs. 100 (one hundred) crore in the National Disaster Response Fund. This will be re-couped by appropriations as stipulated in section 46 of the Disaster Management Act, 2005. 4.3 Besides, the contributions made by individuals or institutions whether by domestic or foreign donors will be credited to the NDRF. All these contributions will be received only through bank drafts for which suitable records will be maintained and formal receipts will be issued to the donors.
267
4.4 The NDRF will be operated by the National Executive Committee (NEC) under the guidance of NDMA.
5. Operationalisation of NDRF 5.1 In the event that the State Governments find it difficult to manage the disaster within the resources available in the SDRF, the State Government may approach the Central Government for seeking assistance from the National Disaster Response Fund. 5.2 On occurrence of a disaster, as soon as the damage report is furnished by the State Government(s) in accordance with MHA’s letter No. 32-34/2007-NDM-I dated the 27th June, 2007, a Central Team notified by the MHA will be deputed to the respective states. 5.3 The Central Team will invariably be an Inter-Ministerial Team, having representatives of Ministries of Agriculture, Road Transport Highways, Health & Family Welfare, Rural Development (Department of Drinking Water Supply), Power, Finance, and Shipping. Representatives of Planning Commission, CWC and NDMA will also be included in the Central Team. It will visit the respective States on mutually convenient dates. After the field visits, on-the-spot verification and discussion with the State Governments at appropriate levels, the Central Team will furnish its report within a fortnight of its visit, along with its recommendations to NEC. 5.4 The report will be considered by the NEC which after due deliberations will finalize its recommendations to the High Level Empowered Committee (HLEC) for release of funds from out of NDRF. In case NEC is not able to suggest the total relief/assistance to be given to the State Government(s) for want of full details of damages occurred/properties/lives lost, persons injured etc, it may recommend at least part payment as on ‘on account’ payment to the concerned State(s) so as to enable them to take up urgent relief work in hand. 5.5 The HLEC will have the Union Agriculture Minister as Chairman and Home Minister, Finance Minister, Deputy Chairman Planning Commission, Vice Chairman, NDMA as Members and special invitees. The HLEC will review the recommendations of the NEC and finalize its own recommendations to be referred to Cabinet for approval. After the

268
proposal is approved by the Cabinet, necessary funds will be released to the concerned States. It will be desirable that such ‘on account’ relief/assistance is made available to the affected States within a maximum of two months of occurrence of disaster, pending consideration of total amount to be released to the affected States. 6. Release of payments from out of NDRF 6.1 State Government will give information regarding time frame in which various contracts will be concluded for award of work by the State Government authorities with respect to damaged infrastructure such as roads, bridges, drinking water supply, primary education centres, community assets owned by Panchayats etc. 6.2 The proposed sanctioned amount from out of NDRF will be intimated to the States and will be released in two installments; the first installment being 75% of the sanctioned amount. Thereafter, on receipt of certificate for having incurred the expenditure upto 75%, the balance 25% will be released. 6.3 State Governments receiving the funds from NDRF will render monthly report till all works are completed duly indicating the amounts released, expenditures incurred and balance available under each sub-head. These reports will include the progress of work in the district/town where rehabilitation work has been undertaken. 6.4 The State Governments will carry out independent evaluation of relief efforts to ensure that relief has reaches the target groups.

269
Annexure – XI
Distribution of Houses by Predominant Materials of Roof and Wall and
Level of Damage Risk
Wall/ Roof
Census Houses Level of Risk Under No. of
Houses
(%)
EQ Zone Wind Velocity m/s Flood Prone
Area in % V IV III II 55 & 50 47 44 & 39 33
Area in % Area in % 10.9 17.3 30.4 41.4 5.0 40.2 48.0 6.7 7.9
Wall A1- Mud & Unburnt Brick Wall
Rural 65,807,212 26.4 Urban 7,991,950 3.2 Total 73,799,162 29.6 VH H M L VH H M L VH
A2- Stone Wall
Rural 20,347,899 8.2 Urban 5,133,918 2.1 Total 25,481,817 10.3 VH H M L H M L VL VH
Total- Category A 99,280,979 39.9 B- Burnt Bricks Wall
Rural 62,715,919 25.2 Urban 49,175,710 19.7 Total 111,891,629 44.9 H M L VL H M L VL H/M
Total Category B 111,891,629 44.9 C1- Concrete Wall
Rural 2,253,979 0.9 Urban 4,286,359 1.7 Total 6,540,338 2.6 M L VL VL L VL VL VL L/VL
C2- Wood Wall
Rural 2,363,200 0.9 Urban 833,792 0.3 Total 3,196,992 1.2 M L VL VL VH H M L H
Total Category C 9,737,330 3.9 X- Other Material
Rural 24,049,304 9.7 Urban 4,136,627 1.7 Total 28,185,931 11.4 M VL VL VL VH H M L VH
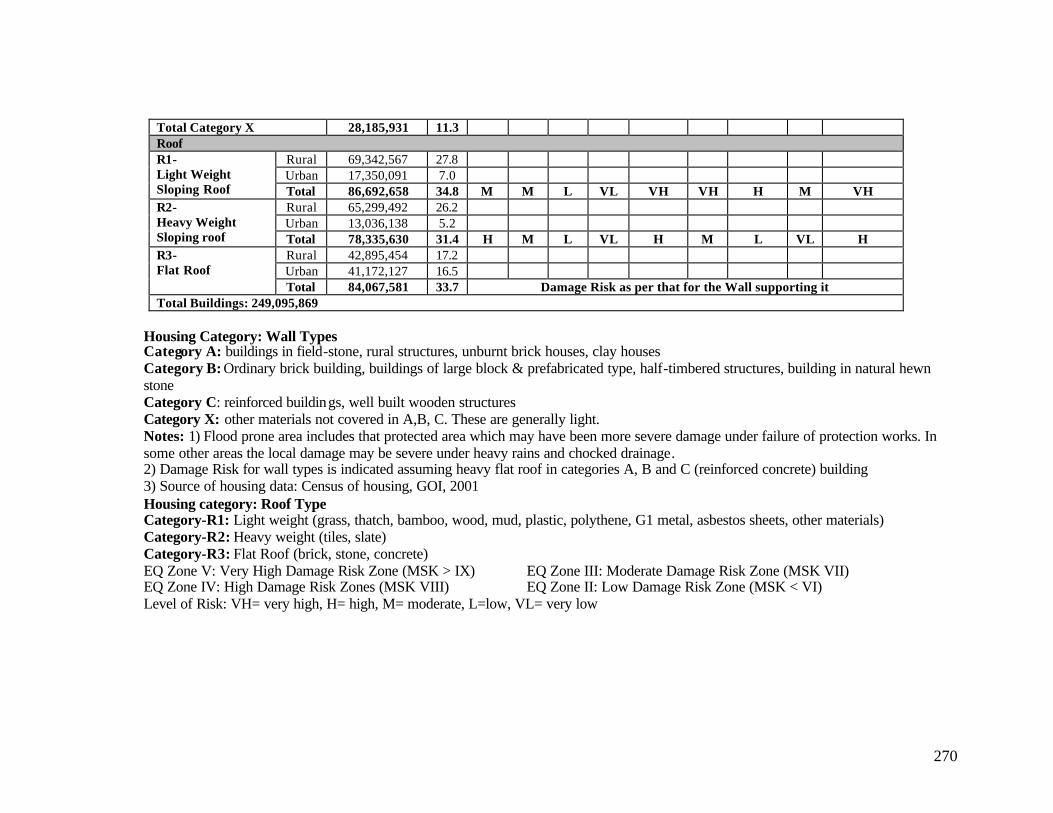
270
Total Category X 28,185,931 11.3 Roof R1- Light Weight Sloping Roof
Rural 69,342,567 27.8 Urban 17,350,091 7.0 Total 86,692,658 34.8 M M L VL VH VH H M VH
R2- Heavy Weight Sloping roof
Rural 65,299,492 26.2 Urban 13,036,138 5.2 Total 78,335,630 31.4 H M L VL H M L VL H
R3- Flat Roof
Rural 42,895,454 17.2 Urban 41,172,127 16.5 Total 84,067,581 33.7 Damage Risk as per that for the Wall supporting it
Total Buildings: 249,095,869
Housing Category: Wall Types Category A: buildings in field-stone, rural structures, unburnt brick houses, clay houses Category B: Ordinary brick building, buildings of large block & prefabricated type, half-timbered structures, building in natural hewn stone Category C: reinforced buildings, well built wooden structures Category X: other materials not covered in A,B, C. These are generally light. Notes: 1) Flood prone area includes that protected area which may have been more severe damage under failure of protection works. In some other areas the local damage may be severe under heavy rains and chocked drainage. 2) Damage Risk for wall types is indicated assuming heavy flat roof in categories A, B and C (reinforced concrete) building 3) Source of housing data: Census of housing, GOI, 2001 Housing category: Roof Type Category-R1: Light weight (grass, thatch, bamboo, wood, mud, plastic, polythene, G1 metal, asbestos sheets, other materials) Category-R2: Heavy weight (tiles, slate) Category-R3: Flat Roof (brick, stone, concrete) EQ Zone V: Very High Damage Risk Zone (MSK > IX) EQ Zone III: Moderate Damage Risk Zone (MSK VII) EQ Zone IV: High Damage Risk Zones (MSK VIII) EQ Zone II: Low Damage Risk Zone (MSK < VI) Level of Risk: VH= very high, H= high, M= moderate, L=low, VL= very low

271
ANNEXURE-XII
AVERAGE ANNUAL PER CAPITA RELIEF EXPENDITURE (RS.)
1990-91 to
1994-95 1995-96 to 1999-00
2000-01 to 2003-04
2005-06 to 2007-08
1990-2008
Andhra Pradesh 11.9 30.0 34.0 61.6 32.1 Arunachal Pradesh 29.9 123.5 149.1 563.6 194.2 Assam 21.9 21.5 37.4 57.4 32.6 Bihar 3.5 7.0 10.2 30.7 10.8 Goa 9.2 11.6 12.7 17.3 12.4 Gujrat 7.0 42.8 291.3 106.6 109.2 Haryana 10.4 55.0 40.3 66.4 42.3 Himachal Pradesh 35.2 58.8 103.6 216.6 94.2 Jammu & Kashmir 15.0 26.4 42.0 333.8 91.5 Karnataka 11.1 14.2 16.8 61.7 23.3 Kerala 12.2 19.5 22.4 29.8 20.1 Madhya Pradesh 6.4 13.3 29.0 59.4 22.6 Maharashtra 17.3 36.2 16.8 112.2 41.7 Manipur 4.9 13.5 12.7 17.1 11.7 Meghalaya 12.9 22.3 19.0 46.5 24.0 Mizoram 10.4 45.3 35.3 84.7 31.5 Nagaland 7.8 12.3 10.8 20.9 12.8 Orissa 15.8 62.3 78.3 106.9 62.3 Punjab 16.4 21.5 59.6 93.8 44.2 Rajasthan 27.0 39.5 56.7 75.1 48.2 Sikkim 59.1 184.2 124.0 324.3 165.9 Tamil Nadu 10.2 17.2 25.4 94.0 31.9 Tripura 10.0 16.6 16.7 51.2 21.5 Uttar Pradesh 8.1 9.1 7.3 18.2 10.3 West Bengal 5.0 10.7 24.0 24.5 15.2 All States 10.9 22.1 39.5 63.7 31.9
AVERAGE ANNUAL PER CAPITA CRF ALLOCATION (RS.)
1990-91 to
1994-95 1995-96 to
1999-00 2000-01 to
2003-04 2005-06 to 2007-08
1990-2008
Andhra Pradesh 12.5 17.5 27.5 44.3 23.7 Arunachal Pradesh 22.0 72.1 115.7 246.1 105.2 Assam 12.8 20.4 40.1 68.4 32.7 Bihar 3.9 5.5 15.6 16.6 9.2 Goa 8.2 8.4 9.7 14.3 9.9 Gujrat 19.8 31.5 33.5 46.3 32.0 Haryana 9.9 13.9 40.2 55.0 28.3 Himachal Pradesh 33.5 48.0 75.6 158.8 72.5 Jammu & Kashmir 14.9 23.1 36.2 80.2 36.3 Karnataka 5.8 8.8 14.9 21.2 12.0 Kerala 10.4 18.2 22.4 26.8 18.6 Madhya Pradesh 5.4 7.1 15.6 38.7 13.9 Maharashtra 5.4 8.0 17.1 22.0 12.4 Manipur 5.2 12.1 14.0 24.5 13.1

272
Meghalaya 10.8 14.1 18.0 46.5 20.9 Mizoram 4.7 15.5 35.4 70.7 20.8 Nagaland 7.8 11.8 10.4 18.4 12.0 Orissa 14.3 14.4 31.5 79.0 31.0 Punjab 13.4 25.4 53.2 58.1 35.8 Rajasthan 27.0 37.2 38.3 68.9 41.5 Sikkim 69.2 97.3 135.0 309.4 142.7 Tamil Nadu 6.8 10.5 17.5 33.5 15.6 Tripura 10.4 14.6 17.2 38.3 18.6 Uttar Pradesh 6.2 8.4 11.2 16.3 10.2 West Bengal 5.7 7.1 13.3 28.1 12.4 All States 9.2 13.2 20.4 36.3 18.6
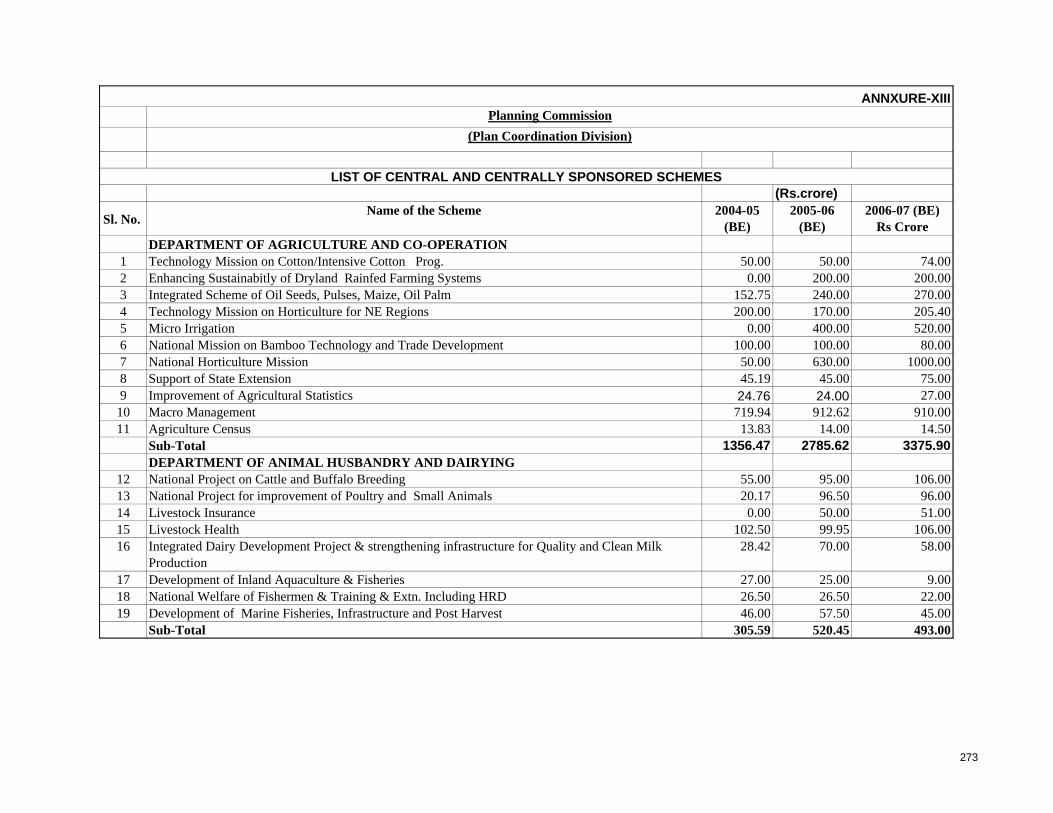
Planning Commission
(Plan Coordination Division)
(Rs.crore)
Sl. No. Name of the Scheme 2004-05
(BE)2005-06
(BE)2006-07 (BE)
Rs Crore DEPARTMENT OF AGRICULTURE AND CO-OPERATION
1 Technology Mission on Cotton/Intensive Cotton Prog. 50.00 50.00 74.002 Enhancing Sustainabitly of Dryland Rainfed Farming Systems 0.00 200.00 200.003 Integrated Scheme of Oil Seeds, Pulses, Maize, Oil Palm 152.75 240.00 270.004 Technology Mission on Horticulture for NE Regions 200.00 170.00 205.405 Micro Irrigation 0.00 400.00 520.006 National Mission on Bamboo Technology and Trade Development 100.00 100.00 80.007 National Horticulture Mission 50.00 630.00 1000.008 Support of State Extension 45.19 45.00 75.009 Improvement of Agricultural Statistics 24.76 24.00 27.00
10 Macro Management 719.94 912.62 910.0011 Agriculture Census 13.83 14.00 14.50
Sub-Total 1356.47 2785.62 3375.90DEPARTMENT OF ANIMAL HUSBANDRY AND DAIRYING
12 National Project on Cattle and Buffalo Breeding 55.00 95.00 106.0013 National Project for improvement of Poultry and Small Animals 20.17 96.50 96.0014 Livestock Insurance 0.00 50.00 51.0015 Livestock Health 102.50 99.95 106.0016 Integrated Dairy Development Project & strengthening infrastructure for Quality and Clean Milk
Production28.42 70.00 58.00
17 Development of Inland Aquaculture & Fisheries 27.00 25.00 9.0018 National Welfare of Fishermen & Training & Extn. Including HRD 26.50 26.50 22.0019 Development of Marine Fisheries, Infrastructure and Post Harvest 46.00 57.50 45.00
Sub-Total 305.59 520.45 493.00
LIST OF CENTRAL AND CENTRALLY SPONSORED SCHEMES
ANNXURE-XIII
273

(Rs.crore)
Sl. No. Name of the Scheme 2004-05
(BE)2005-06
(BE)2006-07 (BE)
Rs Crore DEPARTMENT OF COMMERCE
20 Assistance to States for Infrastructure Develoment for Exports (ASIDE) 425.00 500.00 550.00Sub-Total 425.00 500.00 550.00DEPARTMENT OF DRINKING WATER SUPPLY.
21 Accelerated Rural Water Supply Programme 2900.00 4050.00 5200.0022 Central Rural Sanitation Programme 400.00 700.00 800.00
Sub-Total 3300.00 4750.00 6000.00DEPARTMENT OF ELEMENTARY EDUCATION AND LITERACY
23 National Programme of Nutritional Support to Primary Education (MDM) 1675.00 3345.26 5348.0024 Sarva Shiksha Abhiyan(including DPEP) 3657.08 8400.00 11200.0025 Kasturba Gandhi Balika Vidyalaya 100.00 250.00 128.0026 Restructuring & Reorganisation of Teacher Education 207.00 200.00 180.0027 Literacy Campaigns and Operation Restoration 26.00 25.00 30.0028 PL&CE ( Conti. Education for new literates) 157.24 184.45 149.5029 Mahila Samakhya (EAP) 30.00
Sub-Total 5822.32 12404.71 17065.50MINISTRY OF ENVIRONMENT AND FORESTS
30 Common Effluent Treatment Plant 4.00 4.40 4.4031 Environment Management in Heritage, Pilgrimage and Tourist Centres including Taj Protection
Mission 1.00 0.01 0.0132 Biosphere Reserves 8.00 8.00 8.2033 National River Conservation Plan (NRCP) 254.20 300.00 290.0034 NRCP(EAP) 62.00 50.00 80.0035 National Lake Conservation Plan(NLCP) 45.00 70.00 60.0036 Project Tiger 30.00 32.00 32.0037 Project Elephant 13.00 15.59 15.5938 Conservation and Management of Mangroves, Coral Reefs and Wet Lands 11.00 12.00 12.0039 Development of N.P. & Sanctuaries 43.00 59.00 53.5040 National Afforestation Scheme (NAS) 230.00 284.85 325.0041 Integrated Forest Protection Scheme (IFP) 100.00 0.00 71.6542 Gregarious Flowering of Mull Bamboos 35.00 25.00
Sub-Total 801.20 870.85 977.35
274

(Rs.crore)
Sl. No. Name of the Scheme 2004-05
(BE)2005-06
(BE)2006-07 (BE)
Rs Crore DEPARTMENT OF ISM&H (now AYUSH)
43 Development Of Institutions 26.20 37.56 50.0144 Hospitals and Dispensaries 20.02 90.00 110.0245 Drugs Quality Control 7.03 10.00 11.00
Sub-Total 53.25 137.56 171.03DEPARTMENT OF HEALTH
46 National Leprosy Eradication Programme. 55.00 41.75 42.2547 National Tuberculosis Control Programme. 140.00 186.00 202.1748 National AIDS Control Programme incuding Blood Safety Measures and National S.T.D. Control
Programme 476.00 533.50 905.67
49 National Programme for Control of Blindness 88.00 89.00 90.0050 National Vector Borne Disease Control Prog 296.00 348.45 371.5851 National Cancer Control Programme. 60.00 70.00 87.0052 National Iodine Deficiency Disorders Control Programme. 8.00 12.00 15.0053 National Mental Health Programme 33.00 40.00 50.0054 New Initiatives (Tele Medicine, Diabets and Defness 35.0055 Assistance to States for Capacity building (drug quality) 20.00 35.00 45.0056 Assistance to states for Capacity Building for drug & PFA 23.50 85.50 75.35
Sub-Total 1199.50 1441.20 1919.02DEPTT. OF INDUSTRIAL POLICY & PROMOTION
57 Growth Centre Scheme 25.00 1.00 14.9558 Central Capital Investment Scheme-NER 0.01 0.01 5.0159 Central Interest Subsidy Scheme-NER 0.01 0.01 5.0160 Comprehensive Insurance Scheme 0.01 0.00 2.5161 Package for Special category States J&K. 70.00 25.00 10.9362 Capital InvestmentSubsidy (old) 0.25 0.00 0.20
Sub-Total 95.28 26.02 38.61MINISTRY OF LABOUR
63 Rehabilitation of Bonded Labour 3.00 1.17 2.0064 Estt. of new ITIs in North Eastern States & Sikkim & J&K (100% assistance) 19.10 22.69 35.0065 Testing and Certification of skills of workers in the informal sector 0.40 0.40 0.4066 Upgradation of 100 ITIs 20.00 58.00
Sub-Total 22.50 44.26 95.40
275

(Rs.crore)
Sl. No. Name of the Scheme 2004-05
(BE)2005-06
(BE)2006-07 (BE)
Rs Crore DEPTT. OF LAND RESOURCES
67 Integrated Wasteland Development Programme (IWDP) 368.00 485.00 485.0068 Drought Prone Area Programme (DPAP) 300.00 353.00 360.0069 Desert Development Programme (DDP) 215.00 268.00 270.0070 Modernisation of Revenue and Land Admn 70.00 140.00 150.0071 Bio-fuels 0.00 50.00 50.0072 Others schemes - EAP etc. 80.00 80.00 80.00
Sub-Total 1033.00 1376.00 1395.00MINISTRY OF LAW & JUSTICE (Deptt. Of Justice)
73 Development of Infrastructure Facilities for the Judiciary 135.00 5.00 44.60Sub-Total 135.00 5.00 44.60MINISTRY OF NON CONVENTIONAL ENERGY SOURCES
74 Small Hydro Power 30.00 30.00 38.0075 SPV Demonstration 33.00 25.00 34.0076 National Project on Bio-gas Development (NPBD). 41.00 15.00 41.0077 IREP(Integrated Rural Energy Programmes) 22.00 18.00
Sub-Total 126.00 70.00 131.00DEPARTMENT OF ROAD TRANSPORT AND HIGHWAYS
78 Roads / Bridges of Inter-State and Economic Importance 96.00 170.59 280.6179 Model Driver Training School 6.50 7.50 9.80
Sub-Total 102.50 178.09 290.41DEPARTMENT OF RURAL DEVELOPMENT
80 Rural Housing/ IAY 2500.00 2750.00 2920.0081 SGSY 1000.00 1000.00 1200.0082 DRDA Admn. 230.00 220.00 220.0083 SGRY 5100.00 5500.00 3000.0084 Training 24.40 24.00 30.0085 PMGSY 2468.00 4220.00 5225.6286 Food For Work (National Rural Employment Gurantee Scheme) 2020.00 4500.00 11300.0087 Provision for urban aminities in Rural Areas (PURA) 10.00 10.00 10.00
Sub-Total 13352.40 18224.00 23905.62
276

(Rs.crore)
Sl. No. Name of the Scheme 2004-05
(BE)2005-06
(BE)2006-07 (BE)
Rs Crore DEPARTMENT OF WOMEN AND CHILD DEVE LOPMENT
88 Integrated Child Development Services 1837.44 3510.30 4454.5289 World Bank Assisted ICDS Projects 270.00 135.00 1.4890 Integrated Women's Empowerment Programme (Swayamsiddha) 20.00 20.00 30.0091 Training of ICDS functionaries(UDISHA) 60.00 40.00 87.0092 Swashakti Project 25.00 5.00 2.0093 Balika Samridhi Yojana 0.03 0.03 0.0394 National Nutrition Mission 0.03 0.03 0.03
Sub-Total 2212.50 3710.36 4575.06MINISTRY OF TRIBAL AFFAIRS
95 Scheme of PMS,Book banks and Upgradation of Merit of ST Students 91.47 230.65 224.5896 Research & Mass Education, Tribal Festivals and Others 7.50 5.85 7.0097 Ashram Schools in TSP areas 14.00 6.00 16.0098 Scheme of Hostels for ST girls and boys 24.00 14.00 32.0099 Information Technology 1.00 0.75 2.00
Sub-Total 137.97 257.25 281.58DEPARTMENT OF SECONDARY & HIGHER EDUCATION
100 Integrated Education for Disabled Children (IEDC) 39.00 45.00 60.00101 National Merit Scholarship Scheme 3.00 11.00 13.00102 Area Intensive Modernisation of Madarasas Programme 29.00 29.00 50.00103 Vocational Education & Training 50.00 20.00 20.00104 Access and Equity 30.00 10.00 10.00105 Information and Communication in Schools (ICT in Schools) 97.00 50.00 67.00106 Development of Sanskrit Edn. 18.00 19.00 16.00107 Appointment of Language Teachers 13.00 16.00 20.00108 Assistance to states for new polytechnics 5.00
Sub-Total 279.00 200.00 261.00DEPARTMENT OF SHIPPING
109 Inland Water Transportation Scheme implemented by States 20.00 15.00 17.00Sub-Total 20.00 15.00 17.00
277
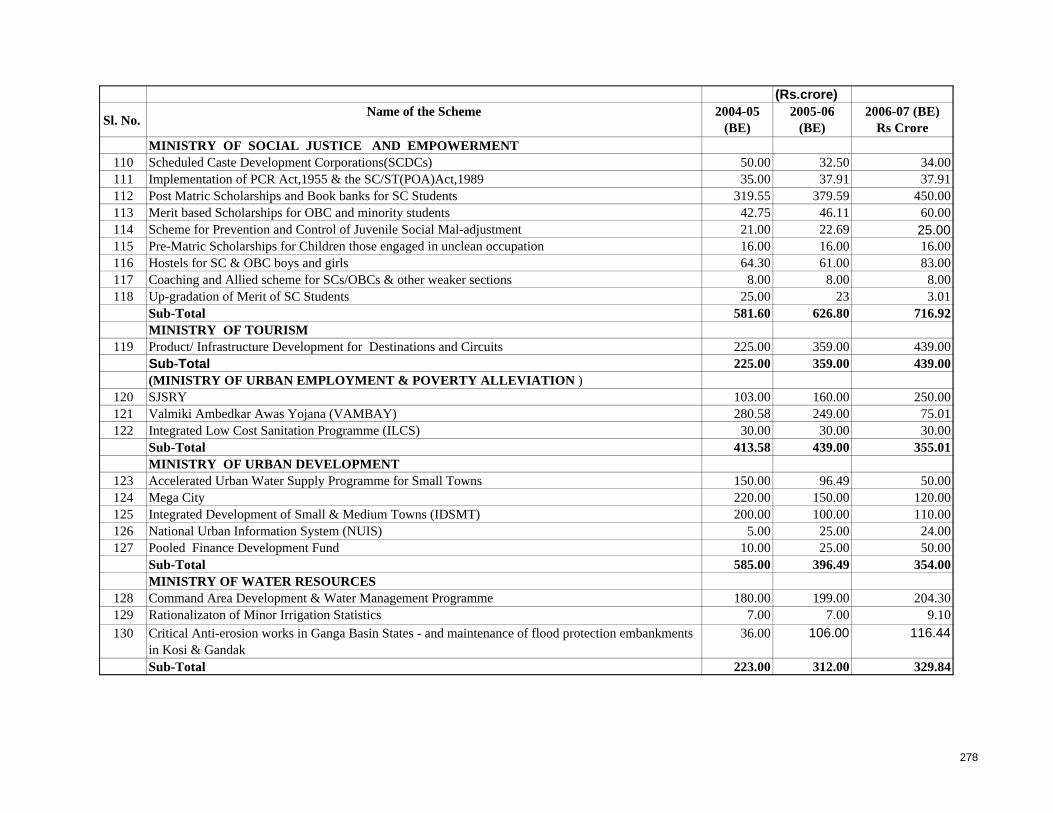
(Rs.crore)
Sl. No. Name of the Scheme 2004-05
(BE)2005-06
(BE)2006-07 (BE)
Rs Crore MINISTRY OF SOCIAL JUSTICE AND EMPOWERMENT
110 Scheduled Caste Development Corporations(SCDCs) 50.00 32.50 34.00111 Implementation of PCR Act,1955 & the SC/ST(POA)Act,1989 35.00 37.91 37.91112 Post Matric Scholarships and Book banks for SC Students 319.55 379.59 450.00113 Merit based Scholarships for OBC and minority students 42.75 46.11 60.00114 Scheme for Prevention and Control of Juvenile Social Mal-adjustment 21.00 22.69 25.00115 Pre-Matric Scholarships for Children those engaged in unclean occupation 16.00 16.00 16.00116 Hostels for SC & OBC boys and girls 64.30 61.00 83.00117 Coaching and Allied scheme for SCs/OBCs & other weaker sections 8.00 8.00 8.00118 Up-gradation of Merit of SC Students 25.00 23 3.01
Sub-Total 581.60 626.80 716.92MINISTRY OF TOURISM
119 Product/ Infrastructure Development for Destinations and Circuits 225.00 359.00 439.00Sub-Total 225.00 359.00 439.00(MINISTRY OF URBAN EMPLOYMENT & POVERTY ALLEVIATION )
120 SJSRY 103.00 160.00 250.00121 Valmiki Ambedkar Awas Yojana (VAMBAY) 280.58 249.00 75.01122 Integrated Low Cost Sanitation Programme (ILCS) 30.00 30.00 30.00
Sub-Total 413.58 439.00 355.01MINISTRY OF URBAN DEVELOPMENT
123 Accelerated Urban Water Supply Programme for Small Towns 150.00 96.49 50.00124 Mega City 220.00 150.00 120.00125 Integrated Development of Small & Medium Towns (IDSMT) 200.00 100.00 110.00126 National Urban Information System (NUIS) 5.00 25.00 24.00127 Pooled Finance Development Fund 10.00 25.00 50.00
Sub-Total 585.00 396.49 354.00MINISTRY OF WATER RESOURCES
128 Command Area Development & Water Management Programme 180.00 199.00 204.30129 Rationalizaton of Minor Irrigation Statistics 7.00 7.00 9.10130 Critical Anti-erosion works in Ganga Basin States - and maintenance of flood protection embankments
in Kosi & Gandak36.00 106.00 116.44
Sub-Total 223.00 312.00 329.84
278
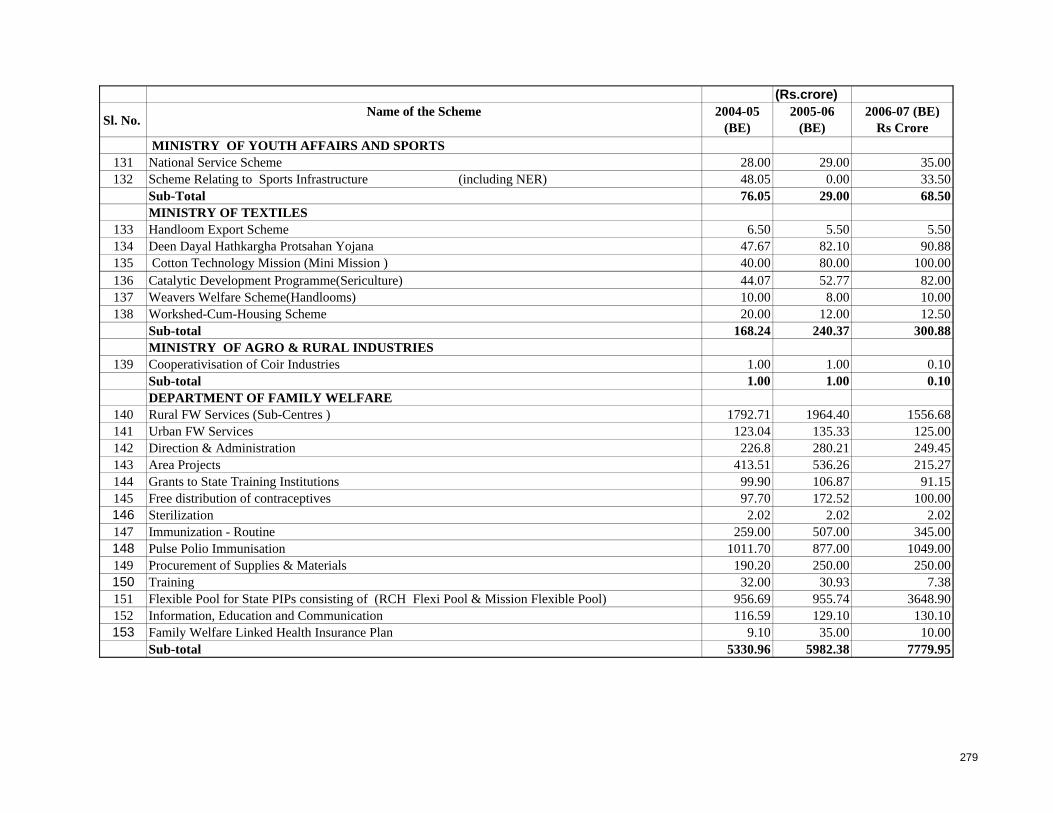
(Rs.crore)
Sl. No. Name of the Scheme 2004-05
(BE)2005-06
(BE)2006-07 (BE)
Rs Crore MINISTRY OF YOUTH AFFAIRS AND SPORTS
131 National Service Scheme 28.00 29.00 35.00132 Scheme Relating to Sports Infrastructure (including NER) 48.05 0.00 33.50
Sub-Total 76.05 29.00 68.50MINISTRY OF TEXTILES
133 Handloom Export Scheme 6.50 5.50 5.50134 Deen Dayal Hathkargha Protsahan Yojana 47.67 82.10 90.88135 Cotton Technology Mission (Mini Mission ) 40.00 80.00 100.00136 Catalytic Development Programme(Sericulture) 44.07 52.77 82.00137 Weavers Welfare Scheme(Handlooms) 10.00 8.00 10.00138 Workshed-Cum-Housing Scheme 20.00 12.00 12.50
Sub-total 168.24 240.37 300.88MINISTRY OF AGRO & RURAL INDUSTRIES
139 Cooperativisation of Coir Industries 1.00 1.00 0.10Sub-total 1.00 1.00 0.10DEPARTMENT OF FAMILY WELFARE
140 Rural FW Services (Sub-Centres ) 1792.71 1964.40 1556.68141 Urban FW Services 123.04 135.33 125.00142 Direction & Administration 226.8 280.21 249.45143 Area Projects 413.51 536.26 215.27144 Grants to State Training Institutions 99.90 106.87 91.15145 Free distribution of contraceptives 97.70 172.52 100.00146 Sterilization 2.02 2.02 2.02147 Immunization - Routine 259.00 507.00 345.00148 Pulse Polio Immunisation 1011.70 877.00 1049.00149 Procurement of Supplies & Materials 190.20 250.00 250.00150 Training 32.00 30.93 7.38151 Flexible Pool for State PIPs consisting of (RCH Flexi Pool & Mission Flexible Pool) 956.69 955.74 3648.90152 Information, Education and Communication 116.59 129.10 130.10153 Family Welfare Linked Health Insurance Plan 9.10 35.00 10.00
Sub-total 5330.96 5982.38 7779.95
279
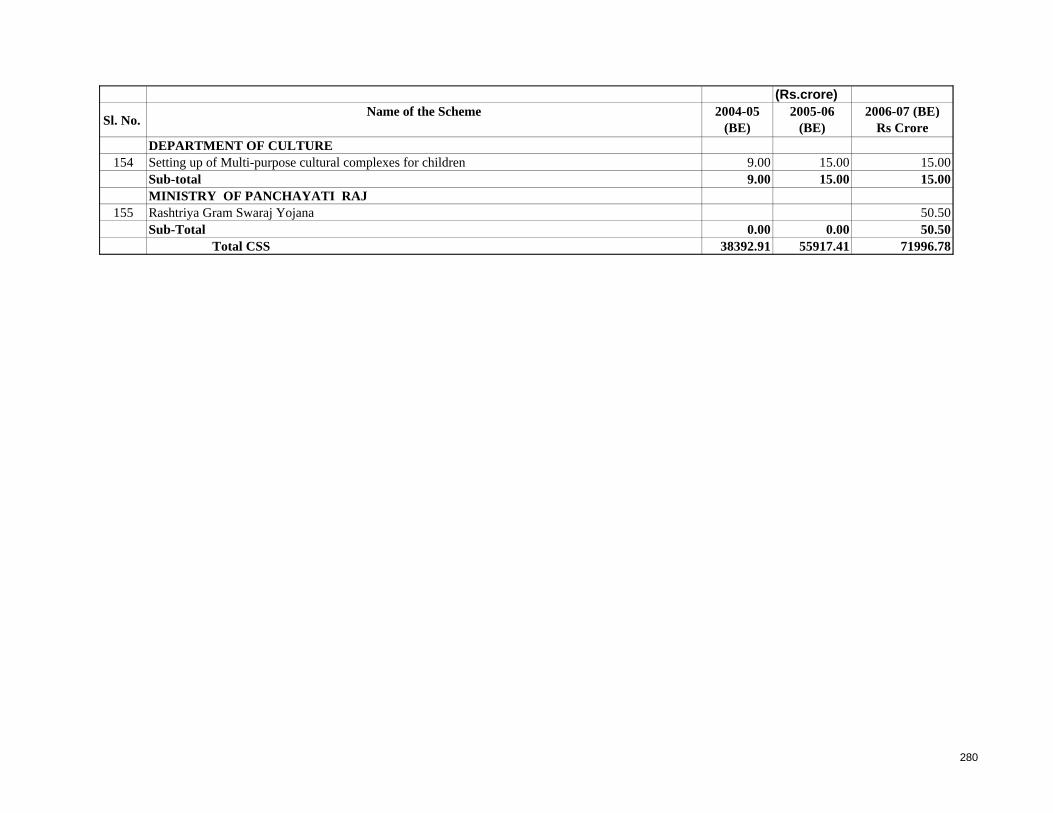
(Rs.crore)
Sl. No. Name of the Scheme 2004-05
(BE)2005-06
(BE)2006-07 (BE)
Rs Crore DEPARTMENT OF CULTURE
154 Setting up of Multi-purpose cultural complexes for children 9.00 15.00 15.00Sub-total 9.00 15.00 15.00MINISTRY OF PANCHAYATI RAJ
155 Rashtriya Gram Swaraj Yojana 50.50Sub-Total 0.00 0.00 50.50 Total CSS 38392.91 55917.41 71996.78
280