FINANCIAMIENTO DE INICIATIVAS DE EMPRENDIMIENTO EN EL MUNDO JUAN ANTONIO LILLO, MBA.
14
FINANCIAMIENTO DE INICIATIVAS DE EMPRENDIMIENTO EN EL MUNDO JUAN ANTONIO LILLO, MBA
-
Upload
robert-rodgers -
Category
Documents
-
view
214 -
download
0
Transcript of FINANCIAMIENTO DE INICIATIVAS DE EMPRENDIMIENTO EN EL MUNDO JUAN ANTONIO LILLO, MBA.

FINANCIAMIENTO DE INICIATIVAS DE EMPRENDIMIENTOEN EL MUNDO
JUAN ANTONIO LILLO, MBA

Bygrave & Zacharakis, Entrepreneurship, New York: Wiley, 2011. ©
Growth in the Implementation of Microcredit 1997-2007
YearNumber of
Institutions ReportingTotal Number of Clients
ReachedNumber of 'poorest' clients
reported1997 618 13,478,797 7,600,0001998 925 20,938,899 12,221,9181999 1,065 23,555,689 13,779,8722000 1,567 30,681,107 19,327,4512001 2,186 54,932,235 26,878,3322002 2,572 67,606,080 41,594,7782003 2,931 80,868,343 54,785,4332004 3,164 92,270,289 66,614,8712005 3,133 113,261,390 81,949,0362006 3,316 133,030,913 92,922,5742007 3,552 154,825,825 106,584,679Daley-Harris, S. "State of the Microcredit Summit Campaign Report 2009." Page 24. http://www.microcreditsummit.org/uploads/socrs/SOCR2009_English.pdf
Microfinancing by Region 2007
2007 Asia Africa & Middle EastLatin America &
Caribbean Europe
Number of Poorest Families 123 60.4 9.4 0.8
Number Reached by Microfinance 96.5 7.5 2.2 0.2
Percent Coverage 78% 12% 24% 29%
2007 Source: Daley-Harris, S. "State of the Microcredit Summit Campaign Report 2009." Page 30.
http://www.microcreditsummit.org/uploads/socrs/SOCR2009_English.pdf
Microfinanzas & Microcrédito

Bygrave & Zacharakis, Entrepreneurship, New York: Wiley, 2011. ©
0%
2%
4%
6%
8%
10%
12%
Pre
vale
nce R
ate
Informal Investor Prevalence Rate, 2009
12.2
%18
.6 %
Inversionistas Informales
Henry
x-axis labels were not legible at a 7.5 font, but not all countries fit when the font size is large enough to read
Bygrave & Zacharakis, Entrepreneurship, New York: Wiley, 2011. ©
0
1
2
3
4
5
6
7
Am
ou
nt o
f In
form
al C
ap
ital, %
GD
P
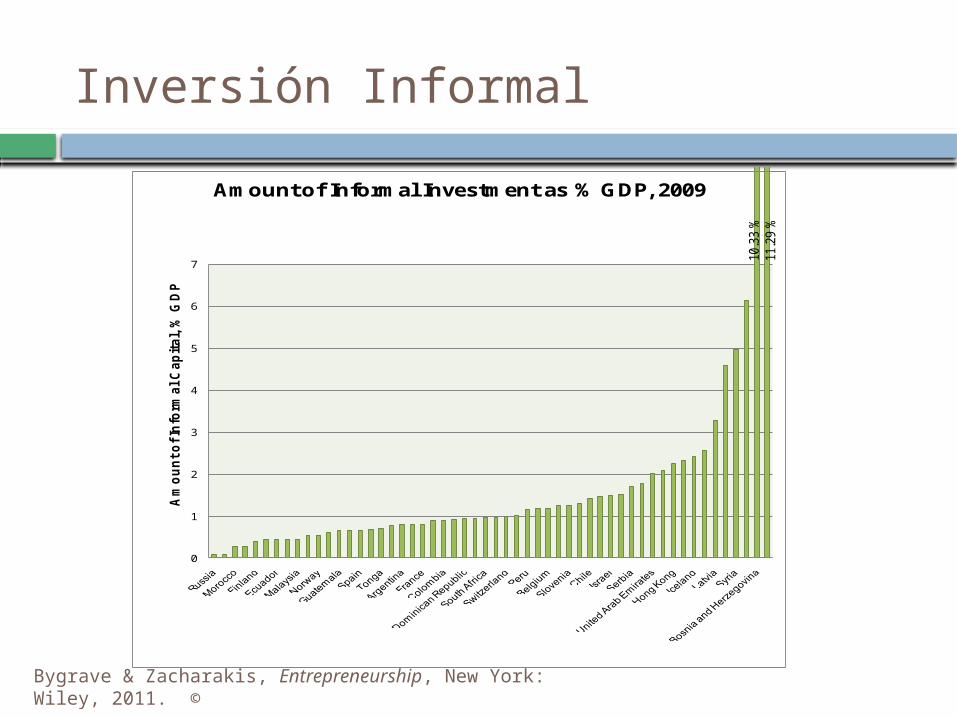
Amount of Informal Investment as % GDP, 2009
10.3
3 %
11.2
9 %
Inversión Informal
Henry
x-axis labels were not legible at a 7 font, but now not all countries fit when the font size is large enough to read

Bygrave & Zacharakis, Entrepreneurship, New York: Wiley, 2011. ©
Montos anuales por Inversionista Informal
Bygrave & Zacharakis, Entrepreneurship, New York: Wiley, 2011. ©
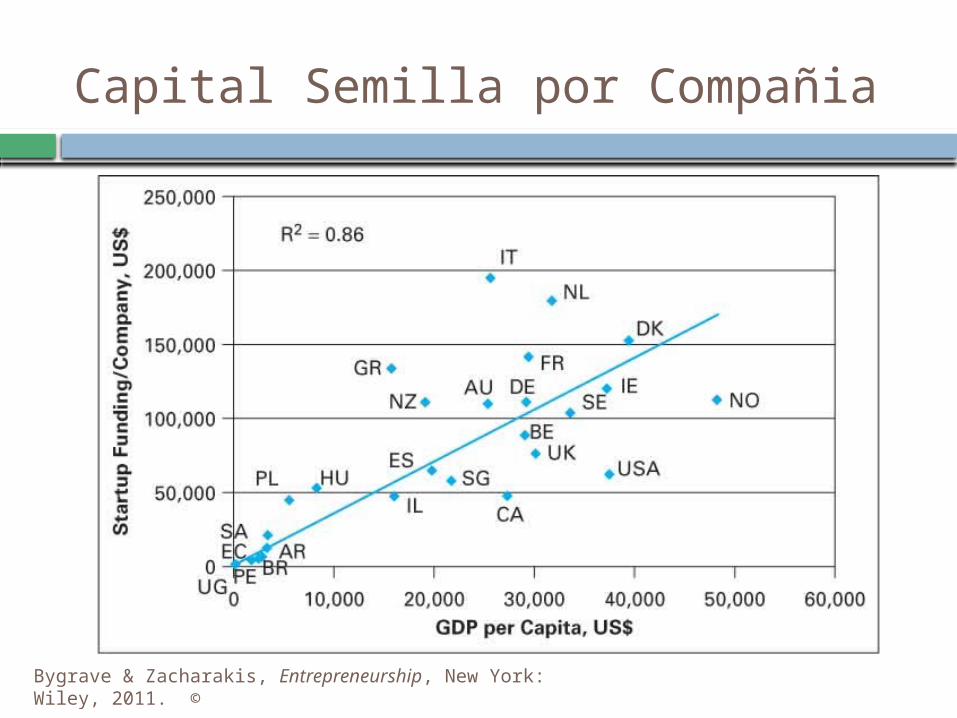
Capital Semilla por Compañia
Bygrave & Zacharakis, Entrepreneurship, New York: Wiley, 2011. ©
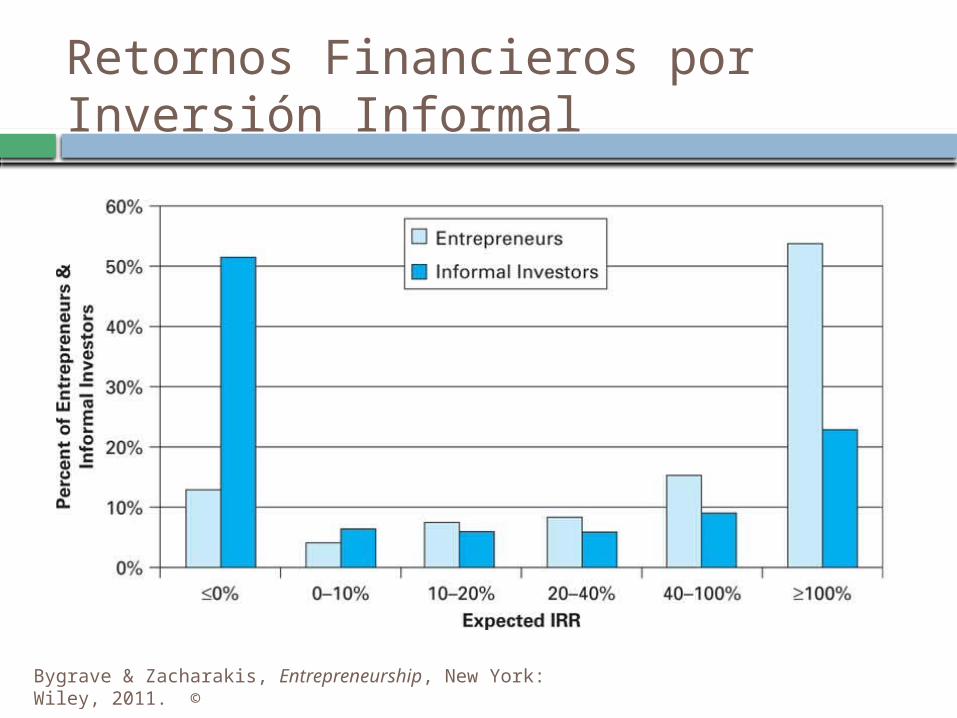
Retornos Financieros por Inversión Informal

Bygrave & Zacharakis, Entrepreneurship, New York: Wiley, 2011. ©
Oferta/Demanda por Financiamiento Semilla
Bygrave & Zacharakis, Entrepreneurship, New York: Wiley, 2011. ©
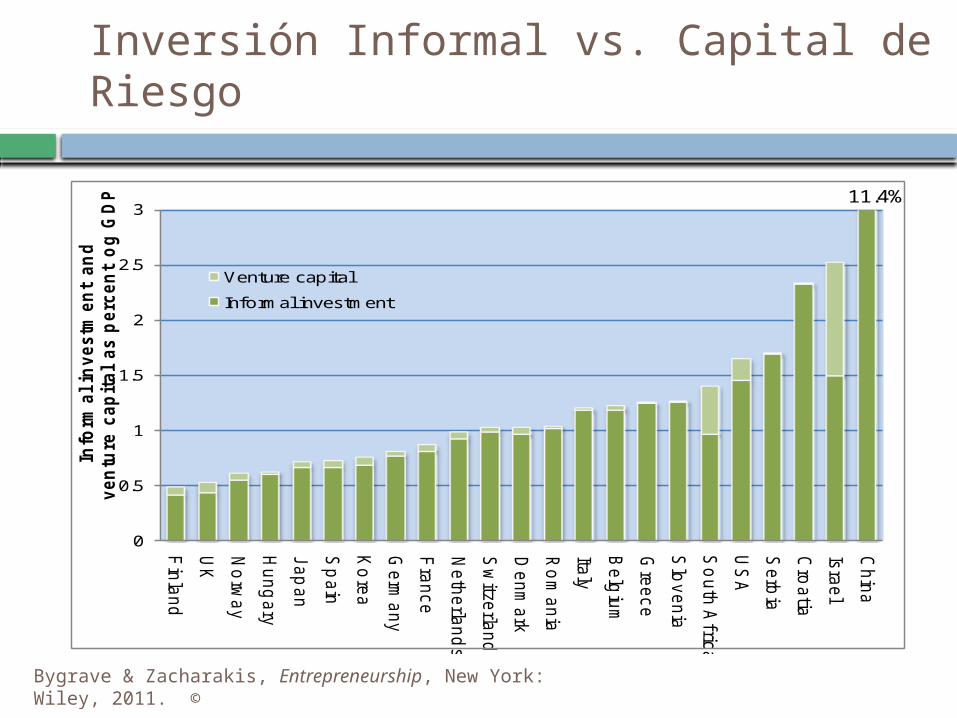
Inversión Informal vs. Capital de Riesgo
0
0.5
1
1.5
2
2.5
3
Fin
land
UK
No
rway
Hung
ary
Jap
an
Sp
ain
Ko
rea
Germ
any
Fra
nce
Neth
erla
nd
s
Sw
itzerla
nd
Denm
ark
Ro
mania
Italy
Belg
ium
Gre
ece
Slo
venia
So
uth
Afric
a
US
A
Serb
ia
Cro
atia
Isra
el
Chin
aIn
form
al in
vestm
en
t an
d
ven
ture
cap
ital
as p
erc
en
t o
g G
DP
Venture capital
Informal investment
11.4%
Bygrave & Zacharakis, Entrepreneurship, New York: Wiley, 2011. ©
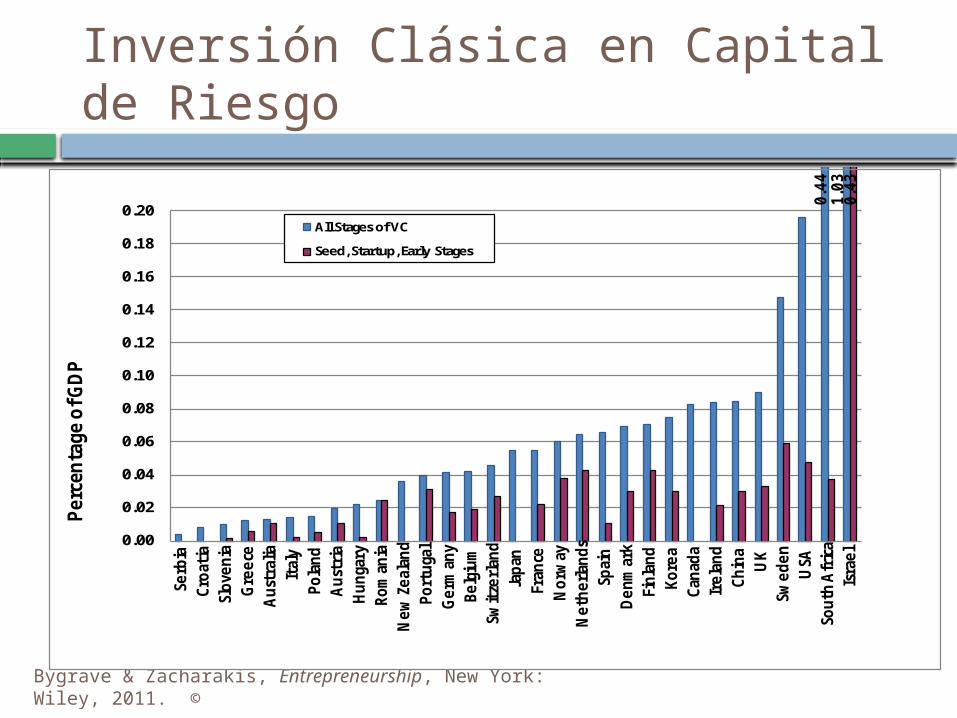
Inversión Clásica en Capital de Riesgo
0.00
0.02
0.04
0.06
0.08
0.10
0.12
0.14
0.16
0.18
0.20
Serb
ia
Cro
atia
Slo
ven
ia
Gre
ece
Au
stra
lia
Ital
y
Po
lan
d
Au
stri
a
Hu
nga
ry
Ro
man
ia
Ne
w Z
eal
and
Po
rtu
gal
Ge
rman
y
Be
lgiu
m
Swit
zerl
and
Jap
an
Fran
ce
No
rway
Ne
the
rlan
ds
Spai
n
De
nm
ark
Fin
lan
d
Ko
rea
Can
ada
Ire
lan
d
Ch
ina
UK
Swe
de
n
USA
Sou
th A
fric
a
Isra
el
Per
cen
tage
of G
DP
All Stages of VC
Seed, Startup, Early Stages
0.4
41
.03
0.4
3

Bygrave & Zacharakis, Entrepreneurship, New York: Wiley, 2011. ©
Inversión Clásica en Capital de Riesgo
0
2,000
4,000
6,000
8,000
10,000
12,000Po
rtug
al
Finl
and
Japa
n
Aus
tria
Ger
man
y
Aus
tral
ia
Belg
ium
Irel
and
Pola
nd
Nor
way
Swed
en
Den
mar
k
Euro
pe
Switz
erla
nd
Fran
ce
Cana
da
Net
herl
ands UK
Isra
el
Spai
n
Rom
ania
Hun
gary
Italy
USA
Chin
a
US
$ (1
,000
)
Nominal (2008) US$
Adjusted for PPP
16,414
Henry
The two graphs become hard to read when I size them to fit side by side, so I added two animations. On the first mouse click, the slide zooms in on the "% of GDP" graph, and then the "investment per company" graph on the second mouse click.

Bygrave & Zacharakis, Entrepreneurship, New York: Wiley, 2011. ©
GLAMOROUS
AMBITIOUSECONOMIC
CORE
CONSTRAINED
Innovation
GrowthHighLow
High
Low
SuperStars
Classic venture capital
Informal investments by family,friends, and foolhardy strangers
$199 billion to millions of ventures
$28.4billionto 3,192ventures
Financing Entrepreneurial Ventures, U.S., 2008
Financiamiento de Iniciativas Emprendedoras
Bygrave & Zacharakis, Entrepreneurship, New York: Wiley, 2011. ©
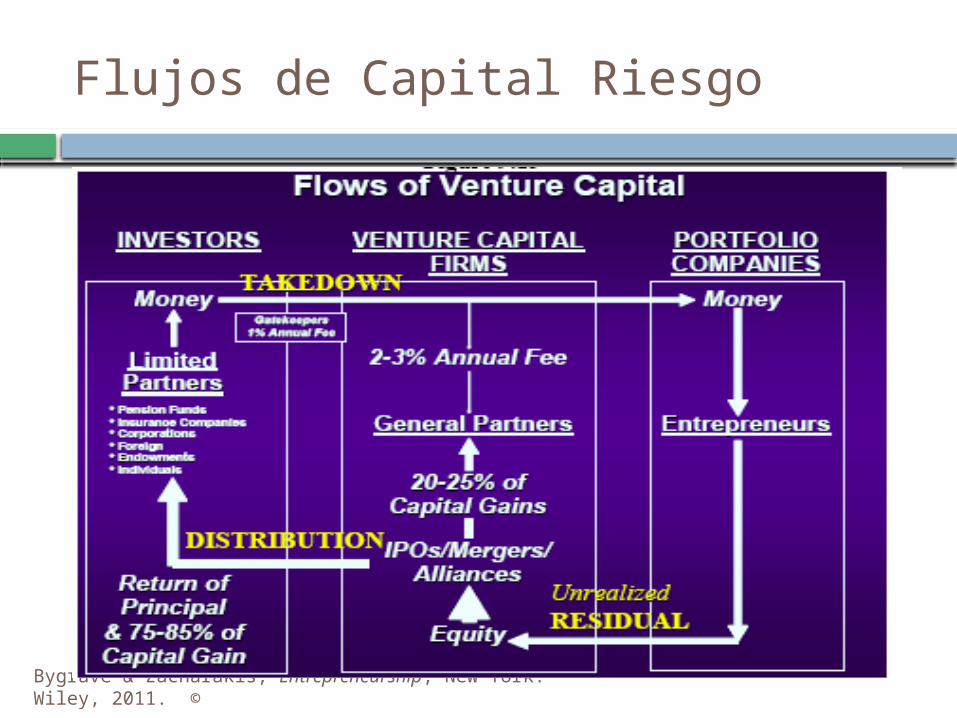
Flujos de Capital Riesgo
Bygrave & Zacharakis, Entrepreneurship, New York: Wiley, 2011. ©
0
10
20
30
40
50
60
70
0
5,000
10,000
15,000
20,000
25,000
30,000
85 86 87 88 89 90 91 92 93 94 95 96 97 98 99 00 01 02 03 04 05 06 07 08
Tota
l Rai
sed
by V
C-Ba
cked
IPO
s, $
Mill
ions
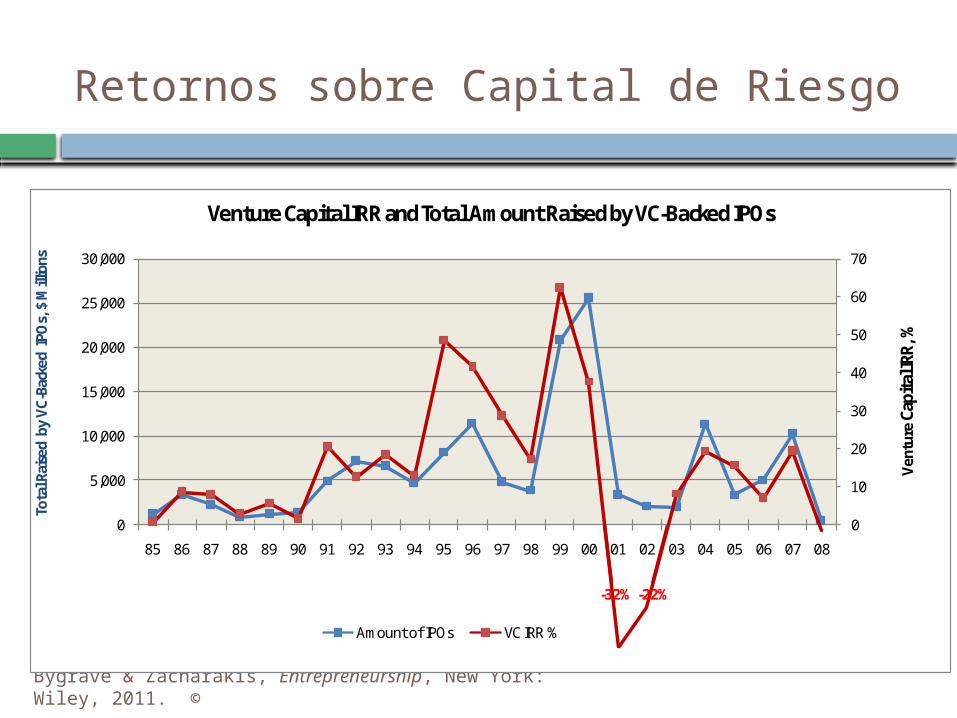
Venture Capital IRR and Total Amount Raised by VC-Backed IPOs
Amount of IPOs VC IRR %
Ven
ture
Capi
tal I
RR, %
-32% -22%
Retornos sobre Capital de Riesgo