
FINANCIALSECTION - Oceanside, California
143
FINANCIAL SECTION
Transcript of FINANCIALSECTION - Oceanside, California

FINANCIAL SECTION


~ DIEHL, EVANS &: COMPANY, LLP!:::!J CERTIFIED PUBLIC ACCOUNTANTS IiI CONSULTANTS
A PARTNERSHIP INCLUDING ACCOUNTANCY CORPORAnONS
5 CORPORATE PARK, SUITE 100IRVINE, CALIFORNIA 92606-5165(949) 399-0600. FAX (949) 399-0610www.di_ehlevans.com
December 5, 2008
INDEPENDENT AUDITORS' REPORT
City Council MembersCity ofOceansideOceanside, California
MICHAEL R. UJDIN, CPA.CRAIG W. SPRAKER, CPANITIN P. PATEL, CI'AROBERTJ. CALLANAN, CPA
*PHILIP H. HOLTKAMP, CPA*THOMAS M. PERLOWSKI, CPA*HARVEY J. SCHROEDER, CI'AKENNETH R. A.IvIES, CPA
*WILLlAM C. PENTZ, CPA
"A PROFESS10NAL CORPORATION
We have audited the accompanying financial statements of the governmental activities, thebusiness-type activities, each major fund, and the aggregate remaining fund information of the City ofOceanside, as of and for the year ended June 30, 2008, which collectively comprise the City's basicfinancial statements as listed in the table of contents, These financial statements are the responsibilityof the City of Oceanside's management Our responsibility is to express opinions on these financialstatements based on our audit,
We conducted our audit in accordance with auditing standards generally accepted in the United Statesof America and the standards applicable to financial audits contained in Government AuditingStandards issued by the Comptroller General of the United States, Those standards require that weplan and perform the audit to obtain reasonable assurance about whether the financial statements arefree of material misstatement An audit includes examining, on a test basis, evidence supporting theamounts and disclosures in the financial statements, An audit also includes assessing the accountingprinciples used and significant estimates made by management, as well as evaluating the overallfinancial statement presentation. We believe that our audit provides a reasonable basis for our0plillons.
In our opinion, the financial statements referred to above present fairly, in all material respects, therespective financial position of the governmental activities, the business-type activities, each majorfund, and the aggregate remaining fund information of the City of Oceanside, as of June 30, 2008, andthe respective changes in financial position and cash flows, where applicable, thereof for the year thenended in conformity with accounting principles generally accepted in the United States of America.
- I -
OTHER OFFICES AT: 2965 ROOSEVELT STREETCARLSBAD, CALIFORNIA 92008-2389(760) 729-2343. FAX (760) 729-2234
613 W. VALLEY PARKWAY, SUITE 330ESCONDIDO, CALIFORNIA 92025-2598(760) 741-3141. FAX (760) 741-9890

In accordance with Government Auditing Standards, we have also issued our report datedDecember 5, 2008 on our consideration of the City of Oceanside's internal control over financialreporting and our tests of its compliance with certain provisions of laws, regulations, contracts andgrant agreements and other matters. The purpose of that report is to describe the scope of our testingof internal control over financial reporting and compliance and the results of that testing, and not toprovide an opinion on the internal control over financial reporting or on compliance. That report is anintegral part of an audit performed in accordance with Government Auditing Standards and should beconsidered in assessing the results of our audit.
The managem.ent's discussion and analysis and the other required supplementary informationidentified in the accompanying table of contents are not a required part of the basic financialstatements but are supplementary information required by the accounting principles generally acceptedin the United States of America. We have applied certain limited procedures to the management'sdiscussion and analysis and the California Public Employees Retirement System's Schedule ofFunding Progress, which consisted principally of inquiries of management regarding the methods ofmeasurement and presentation of this required supplementary information. However, we did not auditthe management's discussion and analysis and the California Public Employees Retirement System'sSchedule of Funding Progress and express no opinions on them. The budgetary comparison schedulesand related note have been subjected to the auditing procedures applied in the audit of the basicfinancial statement and, in our opinion are fairly stated in all material respects in relation to the basicfinancial statements taken as a whole.
Our audit was conducted for the purpose of forming opmlOns on the financial statements thatcollectively comprise the City of Oceanside's basic financial statements. The introductory section,supplementary information and statistical section as listed in the table of contents are presented forpurposes of additional analysis and are not a required part of the basic financial statements. Thesupplementary information has been subjected to the auditing procedures applied in the audit of thebasic financial statements and, in our opinion is fairly stated in all material respects in relation to thebasic financial statements taken as a whole. The introductory section and statistical section have notbeen subjected to the auditing procedures applied in the audit of the basic financial statements and,accordingly, we express no opinion on them.
-2-

MANAGEMENT'S DISCUSSION AND ANALYSISFiscal Year Ended June 30, 2008
This discussion and analysis of the City of Oceanside's financial perfonnanee provides an overview of the fiscalyear ended June 30, 2008. Please read it in conjunction with the accompanying transmittal letter, the basicfinancial statements and the accompanying notes to those financial statements.
THE FINANCIAL STATEMENTS
The financial statements presented herein include all the activities of the City of Oceanside (City) and thecomponent units using the integrated approach as prescribed by GASB Statement No. 34.
The Govermuent-Wide Financial Statements present the financial picture of the City from the economicresources measurement focus using the accrual basis of accounting. They present govermuental activities andbusiness-type activities separately. These statements include all assets of the City (including infrastructure) aswell as all liabilities (including long-term debt). Additionally, certain eliminations have occurred as prescribedby the statement in regards to interfund activity, payables and receivables.
The Fund Financial Statements include statements for each of the three categories of activities - governmental,business-type and fiduciary. The govermuental activities (other than internal service activities) are prcparedusing the current financial resources measurement focus and modified accrual basis of accounting. Thebusiness-type activities are prepared using the economic resources measurement focus and the accrual basis ofaccounting. The fiduciary activities are agency funds which only report a balance sheet and do not have ameasurement focus. A reconciliation of the Fund Financial Statements to the Government-Wide FinancialStatements is provided to explain the differences creatcd by the integrated approach.
REPORTING THE CITY AS A WHOLE
The Statement of Net Assets and the Statement of Activities and Changes in Net Assets
The Statement ofNet Assets and the Statement of Activities and Changes in Net Assets report infonnation aboutthe City as a whole and about its activities. These statements include all assets and liabilities of the City usingthe accrual basis C!f accounting. which is similar to the accounting used by most private-sector companies. Allof the current year's revenues and expenses are taken into account regardless ofwhen cash is received or paid.
See independent auditors' report.- 3 -

These two statements report the City's net assets and changes in them. Net assets are the difference betweenassets and liabilities, which is one way to measure the City's financial health, or financial position. Over time,increases or decreases in the City's net assets are one indicator of whether its financial health is improving ordeteriorating.
In the Statement of Net Assets and the Statement of Activities and Changes in Net Assets, we separate the Cityactivities as follows:
Governmental activities-Most of the City's basic services are reported in this category, including GeneralGovermnent, Fire, Police, Public Works, Community Development and Community/Cultural Services(including Recreation and Library). Property and sales taxes, user fees, interest income, franchise fees, and stateand federal grants finance these activities.
Bnsiness-type activities-The City charges a fee to customers to cover all or most of the cost of certain servicesit provides. The City's Water, Wastewater, Waste Disposal, Special Aviation and Harbor District activities arereported in this category.
REPORTING THE CITY'S MOST SIGNIFICANT FUNDS
Fund Financial Statements
The fund financial statements provide detailed information about the most significant funds, not the City as awhole. Some funds are required to be established by State Law or by bond covenants. However, managementestablishes many other funds to help it control and manage money for particular purposes or to show that it ismeeting legal responsibilities for using certain taxes, grants, and other money.
Governmental funds-Most of the City's basic services are reported in govermnental funds, which focus on howmoney flows into and out of those funds and thc balances left at year-end that are available for spending. Thesefunds are reported using an accounting method called modified accrual accounting, which measures cash and allother financial assets that can readily be converted to cash. The govermnental fund statements provide a detailedshort-term view of the City's general govermnental operations and the basic services it provides. Govermnentalfund information helps detcrmine whether there are more or fewer financial resources that can be spent in thenear future to finance the City's programs. The differences of results in the Govermnental Fund financialstatements and those in the Government-Wide financial statements are explained in a reconciliation followingeach Govermnental Fund financial statement
Proprietary funds-When the City charges customers for the services it provides (whether to outside customersor to other units of the City), these services are generally reported in proprietary funds. Proprietary funds arereported in the same way that all activities are reported in the Statement of Net Assets and the Statement ofRevenues, Expenses and Changes in Fund Net Assets. In fact, the City's enterprise funds are the same as thebusiness-type activities we report in the govermnent-wide statements but provide more detail and additionalinformation, such as cash flows. We use internal service funds (such as the City's Self-Insurance, FleetOperations and Information Technology funds) to report activities that provide supplies and services to theCity's other programs and activities. The Internal Service funds are reported with governmental activities in theGovernment-Wide financial Statements.
See independent auditors' report.-4-

THE CITY AS TRUSTEE
Reporting the City's Fiduciary ResponsibilitiesThe City is the trustee, or fiduciary, for certain funds held on behalf of other agencies and organizations, TheCity's fiduciary activities are reported in separate Statements of Fiduciary Net Assets. We exclude theseactivities from the City's other financial statements because the City cannot use these assets to finance itsoperations. The City is responsible for ensuring that the assets reported in these funds are used for their intendedpurposes.
THE CITY AS A WHOLE
The City's combined Net Assets for the fiscal year ended June 30, 2008 are eompared to results for 2007 inTable L
Table ICity of Oceanside Net Assets
(in thonsands of donars)
Governmental Bnsiness-typeActivities Acitivites Total
2008 2007 2008 2007 2008 2007
Current & other assets $ 223,150 $ 214,841 $ 78,075 $ 82,224 $ 301,225 $ 297,065Net pension assets 39,406 39,773 39,406 39,773Capital assets 331,621 298,993 290,559 288,389 622,180 587,382Total assets 594,177 553,607 368,634 370,613 962,811 924,220
Long-tenn debt outstanding 174,692 176,177 98,893 104,585 273,585 280,762Other liabilities 21,207 17,333 11,937 12,489 33,144 29,822Total liabilities 195,899 193,510 110,830 117,074 306,729 310,584
Net assetsInvested in capital assetst
net of related debt 223,022 192,580 196,363 187,894 419,385 380,474Restricted 130,217 123,853 2,253 1,900 132,470 125,753Unrestricted 45,039 43,664 59,188 63,745 104,227 107,409Total net assets $ 398,278 $ 360,097 $ 257,804 $ 253,539 $ 656,082 $ 613,636
Net assets represent the most simple test of financial health for the City, indicating the excess (or deficit) ofassets over liabilities. Net assets for the City as a whole increased 6.9% from $613.6 million at June 30, 2007 to$656.0 million at June 30, 2008 due to an increase of $38.1 million in Governmental Activities net assets and anincrease of $4,3 million in the Business-type Activities.
Governmental current assets increased by $8.3 million due to an increase in notes receivable for low andmoderate income housing projects, while at the same time Business-type current assets decreased by$4.1 million due to expenditures for capital assets and scheduled long-term debt payments. Governmentalcapital assets increased by $32.6 million due to infrastructure additions of $18.1 including $14.5 million for thePacific Street Bridge. Business-type capital assets increased by $2.2 million due to Water and Wastewaterinfrastructure improvements.
See independent auditors' report- 5 -
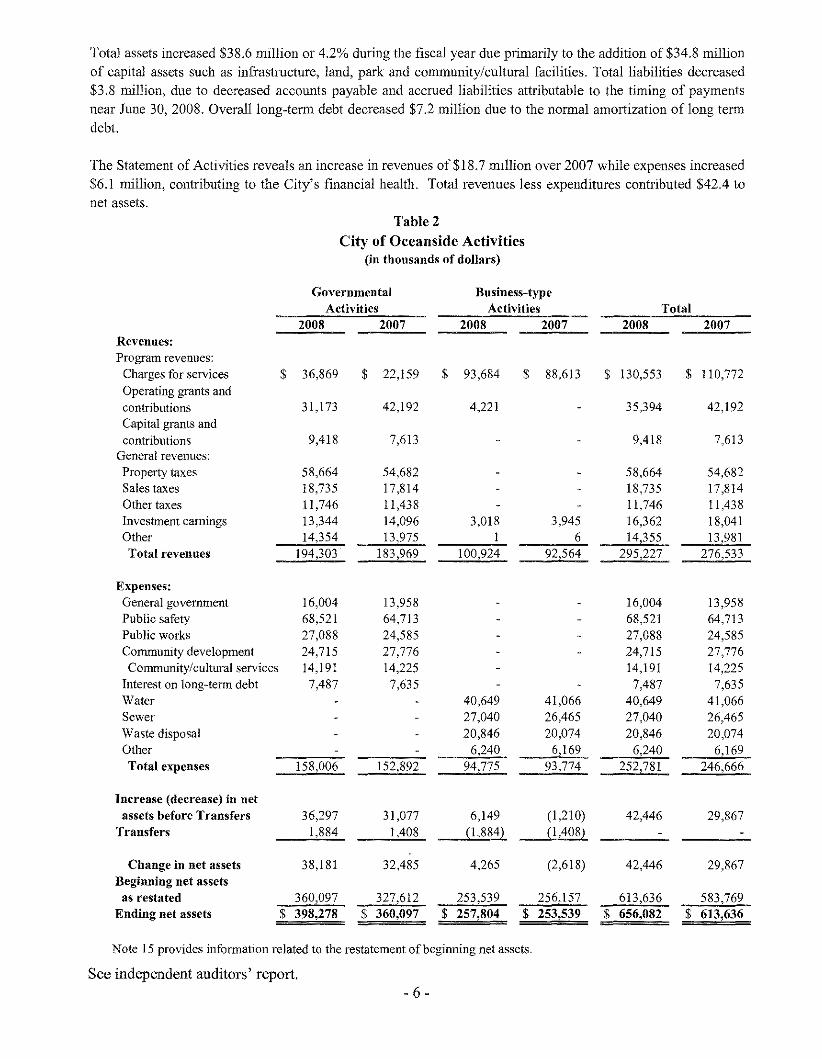
Total assets increased $38,6 million or 42% during the fiscal year due primarily to the addition of $34,8 million
of capital assets such as infrastructure, land, park and community/cultural facilities, Total liabilities decreased
$3,8 million, due to decreased accounts payable and accrued liabilities attributable to the timing of payments
near June 30, 2008, Overall long-term deht decreased $72 million due to the normal amortization of long term
debt
The Statement of Activities reveals an increase in revenues of$18,7 million over 2007 while expenses increased
$6,1 million, contributing to the City's financial health, Total revenues less expenditures contributed $42,4 to
net assets,
Table 2
City of Oceanside Activities(in thousands of dollars)
GovernmentalActivities
2008 2007
Business-typeActivities
2008 2007Total
2008 2007Revenues:Program revenues:
Charges for servicesOperating grants andcontributionsCapital grants andcontributions
General revenues:Property taxesSales taxesOther taxesInvestment earningsOtherTotal revenues
Expenses:General governmentPublic safetyPublic worksConununity developmentCommunity/cultural services
Interest on long-term debtWaterSewerWaste disposalOtherTotal expenses
Increase (decrease) in netassets before Transfers
Transfers
Change in net assetsBeginning net assets
as restatedEnding net assets
$ 36,869
3i,173
9,418
58,664i8,73511,74613,34414,354
194,303
16,00468,52127,08824,71514,1917,487
158,006
36,2971,884
38,181
360,097$ 398,278
$ 22,159
42,192
7,613
54,68217,81411,43814,09613,975
183,969
13,95864,71324,58527,77614,225
7,635
152,892
31,0771,408
32,485
327,612$ 360,097
$ 93,684
4,221
3,018I
100,924
40,64927,04020,846
6,24094,775
6,149(1,884)
4,265
253,539$ 257,804
$ 88,613
3,9456
92,564
41,06626,46520,074
6,16993,774
(1,210)(1,408)
(2,618)
256,157$ 253,539
S 130,553
35,394
9,418
58,66418,73511,74616,36214,355
295,227
16,00468,52127,08824,71514,191
7,48740,64927,04020,846
6,240252,781
42,446
42,446
613,636$ 656,082
$ 110,772
42,192
7,613
54,68217,81411,43818,04113,981
276,533
13,95864,71324,58527,77614,225
7,63541,06626,46520,074
6,169246,666
29,867
29,867
583,769$ 613,636
Note 15 provides information related to the restatement of beginning net assets,
See independent auditors' report
- 6 -
Governmental activities increased net assets $38.1 million compared to $32.4 million in 2007 as identified inTable 2, Increases in program revenues such as charges for service and general revenues including property taxand sales tax offset increases in expenses,
Expenses increased by $5.1 million in 2008, Public Works expense increased $2,5 million, and expenses forPolice Department Field Operations and Fire Supprcssion increased $3,8 million,
Overall, the increased contribution to net assets can be attributed to an increase in rcvenues and transfers of$10,9 million while expenses increased only $5.1 million over the prior fiscal year.
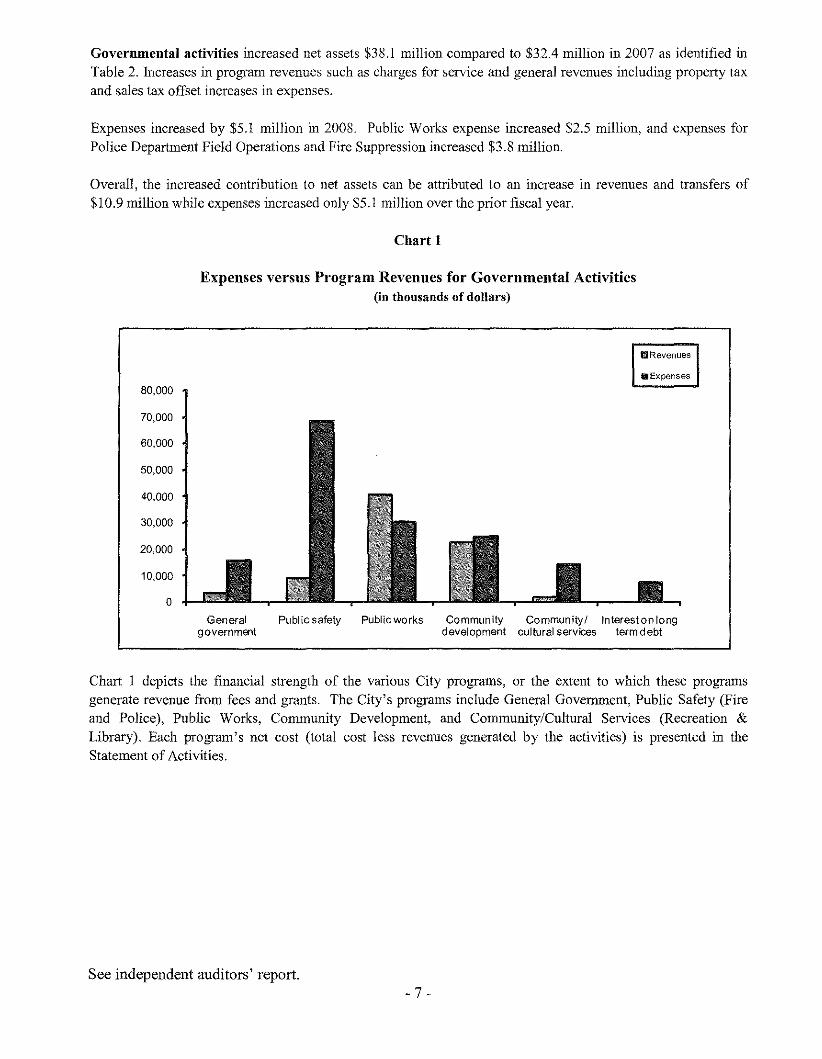
Chart 1
Expenses versus Program Revenues for Governmental Activities(in thonsands of dollars)
ElRevenues
.Expenses80,000
70,000
60,000
50,000
40,000
30,000
20,000
10,000
oGeneral Public safety Public works Community Community! Interest on long
government development cultural services term d ebt
Chart 1 depicts the financial strength of the various City programs, or the extent to which these programsgencrate revenue from fees and grants, The City's programs include General Government, Public Safety (Fireand Police), Public Works, Commnnity Development, and Community/Cultural Services (Recreation &Library), Each program's net cost (total cost less revenues generated by the activities) is presented in theStatement of Activities,
See independent auditors' report.- 7 -
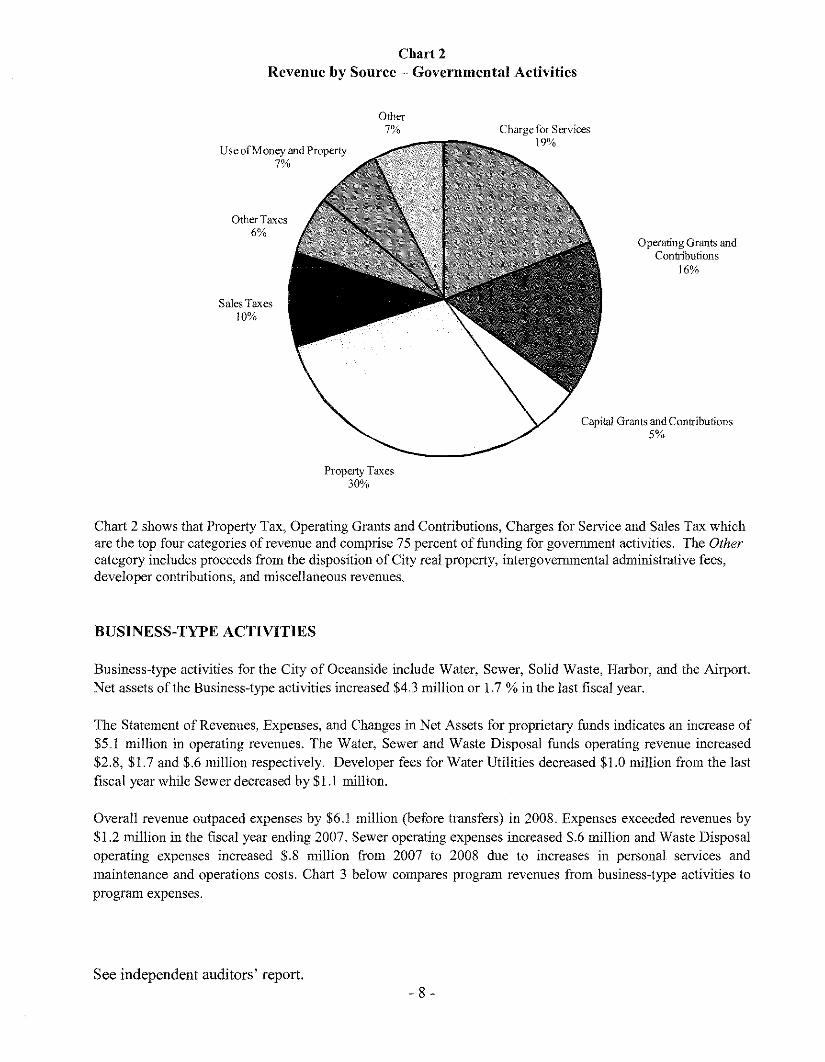
Chart 2Revenue by Source ,. Governmental Activities
Other7%
Use ofMoney and Property7%
Other Taxes6%
Sales Taxes10%
Property Taxes30%
Charge for Services19%
Operating Grants andContributions
16%
Capital Grants and Contributions5%
Chart 2 shows that Property Tax, Operating Grants and Contributions, Charges for Service and Sales Tax whichare the top four categories of revenue and comprise 75 percent of funding for government activities, The Othercategory includes proceeds from the disposition of City real property, intergovernmental administrative fees,developer contributions, and miscellaneous revenues,
BUSINESS-TYPE ACTIVITIES
Business-type activities for the City of Oceanside include Water, Sewer, Solid Waste, Harbor, and the Airport,Net assets of the Business-type activities increased $43 million or 1.7 % in the last fiscal year,
The Statement of Revenues, Expenses, and Changes in Net Assets for proprietary funds indicates an increase of$5,1 million in operatiug revenues. The Water, Sewer and Waste Disposal funds operating revenue increased$2.8, $1.7 and $,6 million respectively, Developer fees for Water Utilities decreased $1.0 million from the lastfiscal year while Sewer decreased by $1.1 million,
Overall revenue outpaced expenses by $6,] million (before transfers) in 2008. Expenses exceeded revenues by$1.2 million in the fiscal year ending 2007. Sewer operating expenses increased $,6 million and Waste Disposaloperating expenses increased $.8 million from 2007 to 2008 due to increases in personal services andmaintenance and operations costs. Chart 3 below compares program revenues from business-type activities toprogram expenses.
See independent auditors' report.- 8 -

Chart 3
Expenses versus Program Revenues for Business-type Activities(in thousands of dollars)
40,000
30,000
20,000
10,000
o
mRevenues
.. Expenses
Water Sewer Waste disposal Special aviation Harbor district
Fees charged for these services make up 97% of the revenues collected with interest income of $3.0 million andgrant revenue of $4.2 million accounting for the remainder. The Sewer and Harbor enterprises operated at adeficit, as referenced in the Statement of Activities and Changes in Net Assets.
FINANCIAL ANALYSIS OF THE CITY'S FUNDS
The fund balance of $44.1 million at year-end for the City's General Fund, as shown on the Statement ofRevenues, Expenditures and Changes in Fund Balances, is a decrease of $6.2 million from 2007. Revenues(excluding sales of real property) increased $4.6 million or 4.1% due, in part, to a $3.5 milliou increase inproperty tax revenue. Expenditures increased overall $7.7 million or 7.6% with increases in public safetyexpenses accounting for $4.2 million. Other Financing Sources-proceeds from the sale of real propertydecreased $1.7 million due to non-recurring transactions included in 2007 results. Net transfers out to otherfunds increased $5.0 million.
The fund balance of the General Improvements Capital Projects Fund decreased $.8 million during 2008.Revenues increased $16.0 million from 2007 due to increased intergovernmental revenue for reimbursement ofexpenses associated with the Pacific Street Bridge Project. Expenses for capital projects, including the PacificStreet Bridge increased $19.9 million. Net transfers in from other funds were $1.4 million.
The fund balance of $27.9 million at year-end 2008 for total Other Governmental Funds is an increase of $4.3million from 2007. Revenues in the Asset Seizure Special Revenue Fund increased $0.8 million and the GasTax Special Revenue Fund net transfers out to other funds decreased $6.8 million.
See independent auditors' report- 9 -

DEBT ADMINISTRATION
Debt of governmental activities (including the Redevelopment Agency) realized a net decrease of $1.5 million,due to normal amortization. More detail about the City's long-term liabilities is presented in Note 8 to thefinancial statements.
Table 3
aty ofOceanside
Governmental Debt Outstanding(induding the Redewlopment Agcucy)
Balance Incurred or Satisfied or BalanceJulyl,200L Issued Matured --"-lIDe 30, 2008
Governmental Aclivities:Bonds Pa)llble $ 56,950,000 $ $ (1,975,000) $ 54,975,000Certificates ofParticiration 54,345,000 (2,810,000) 51,535,000Capital Leases Payable 1,914,195 (250,097) 1,664098Nltes Payable 640,000 3,500,000 (215,000) 3,925,000PensionObligation Bonds 43,298,887 ($1,644) 42,707,243Oaims Pa)llble 9,587,636 18,831 9,60(\467Compensated Absences 9,441,278 967,674 (129,550) 10,279,402
Total Govemuental Activities $ 176,176,996 $ 4,486,505 $ (5,971,291) $ 174,692,210
Debt of the business-type activities decreased in the fiscal year ending 2008 by $5.7 million. Table 4 is asynopsis of detail presented in Note 8 of the financial statements.
Table 4
City of OceansideBusiness-Type Activities Debt Outstanding
Balance Incurred or Satisfied or BalanceJuly 1, 2007 Issued Matured June 30, 2008
Business-Type Activities:Bonds Payable $ 8,525,000 $ $ (620,000) $ 7,905,000Certificates ofParticipation 21,215,000 (1,880,000) 19,335,000Notes Payable 72,654,206 (3,445,743) 69,208,463Compensated Absences 2,190,580 264,712 (11,163) 2,444,129
Total Business-Type Activities $ 104,584,786 $ 264,712 $ (5,956,906) $ 98,892,592
CAPITAL ASSETS
The capital assets of the City are those assets that are used in the performanee of the City's funetions, includinginfrastructure. At June 30, 2008, net capital assets of the governmental activities totaled $332 million and the neteapital assets of the business-type activities totaled $291 million. Depreciation on capital assets is recognized inthe Government-Wide finaneial statements. The $34.8 million increase in total Capital Assets from 2007 to2008 is indieative of the City's continuing investment in infrastructure and other eapital assets.
See independent auditors' report.- 10-

Table 5City of Oceanside
Capital Assets (including Redevlopment Agency)
Governmental Activities Business-Type ActivitiesDescription 2008 2007 2008 2007
Land $ 57,843,987 $ 57,843,987 $ 20,836,745 $ 20,836,745Buildings 78,698,579 64,274,349 137,476,425 134,532,225Improvements 8,652,043 8,652,043 217,609,795 216,459,136Equipment 56,099,439 52,735,271 12,059,079 1l,983,282Construction in Progress 44,065,679 36,236,170 46,738,623 38,324,701Infrastructure 283,073,387 264,985,092
Capital Assets 528,433,1l4 484,726,912 434,720,667 422,136,089Accumulated Depreciation (196,811,938) (185,734,166) (144,162,048) (133,747,353)
Total Capital Assets $ 331,621,176 $ 298,992,746 $ 290,558,619 $ 288,388,736
Additional information on Capital Assets can be found in Note 6 of this report
Table 6City of Oceanside
General Fund Comparisou-Aetual aud Budget
Amended VarianceBudget Actual Pos/(Neg)
Resources (inflows)Taxes $ 78,497,030 $ 79,061,958 $ 564,928Licenses and permits 2,158,990 1,776,875 (382,1l5)Intergovenunental revenues 1,675,570 1,725,083 49,513Charges for services 10,261,286 9,132,237 (1,129,049)Fines and forfeitures 3,894,110 4,344,699 450,589Investment and rentals 4,341,91l 6,385,835 2,043,924Other revenues 14,232,291 13,960,151 (272,140)Transfers in 1,588,849 991,675 (597,174)Amount available for appropriation 116,650,037 117,378,513 728,476
Charges to appropriations (outflows)General government 16,201,246 14,239,772 1,961,474Public Safety 71,650,259 67,878,888 3,771,371Public Works 10,878,060 9,901,604 976,456Community development 7,048,428 5,887,324 1,161,104Community/cultural services 12,945,961 1l,945,378 1,000,583Charges to appropriations 118,723,954 109,852,966 8,870,988
Transfers out 19,556,827 13,752,830 5,803,997Total charges to appropriations andtransfers 138,280,781 123,605,796 14,674,985
Excess of resources over (under) chargesto appropriations and transfers $ (21,630,744) $ (6,227,283) $ 15,403,461
Resources exceeded budget due to greater than expected investment earnings and rental revenue, Charges to
appropriations were under budget due to the delay of budgeted transfers out to other funds, Unused
appropriations may be carried over to the next fiscal year with appropriate approvals,
See independent auditors' report.
- 11 -

BUDGETS AND BUDGETARY ACCOUNTING
Policies:
The City uses the following procedures in establishing the budgetary data reflected in the financial statements:
I. During May of even numbered fiscal years, the City Manager submits to the City Council a proposedbiennial operating budget for the two fiscal years commencing the following July I. The operatingbudget includes proposed expenditures and the means of financing them.
2. A public hearing is conducted to obtain public comment.3. The budget is subsequently adopted through passage of a resolution and is published separately.4. All appropriations are as originally adopted or as amended by the City Council and all budgeted
amounts lapse at year-end unless the adopting resolutions specifically allows the carryover of specificunexpended amounts into the next fiscal year.
5. The City Manager may approve carry-over appropriations for incomplete projects and programs. TheCity Council may approve carry-over appropriations for reallocated funds to different projects andprograms.
6. Legally adopted budget appropriations are set for all funds.7. The City Manager is authorized to transfer funds appropriated within the same fund. Revisions that alter
the total appropriations of any fund must be approved by the City CounciL8. The Budget is adopted on a basis consistent with generally accepted accounting prineiples.
General Fund Budget
Comparing the FY 2007-08 original budget (as adopted) General Fund amount of $119.9 million to the finalbudget amount of$138.3 million shows a net increase of $18.4 million, as delineated below.
Table 7
City of OceansideGeneral Fuud Budget Comparison
As Adopted and as Amended
Adopted Amended VarianceGeneral Government
Operational $ 11,333,674 $ 13,090,930 $ 1,757,256Non-Departmental 2,065,250 3,110,316 1,045,066
Public SafetyPolice 48,052,949 48,882,822 829,873Fire 22,590,762 22,767,437 176,675
Public Works 10,746,236 10,878,060 131,824
Community Development 6,732,497 7,048,428 315,931
Commnnity & Cultural ServicesLibrary 6,245,810 6,368,840 123,030Beach & Recreation 6,584,671 6,577,i21 (7,550)
Transfers 5,535,846 19,556,827 14,020,981
Total Budget $ 119,887,695 $ 138,280,781 $ 18,393,086
See independent auditors' report.- 12 -

General Fund Budget
The $18.4 million variance between the adopted and amended budget is due, in large part, to transfers, including$14.8 million to Capital Improvement Funds for various projects including $6.8 million to partially fundconstruction of Senior Centers and $5.2 million to partially fund construction of fire stations.
The Annual Budget assures the efficient, effective and economic use of the City's resources, as well asestablishing that the highest priority objectives are accomplished. Through the budget, the City Council sets thedirection of the City, allocates its resources and establishes its priorities. The adopted budget for all City fundsfor the fiscal year 2008-09 is $356 million and is summarized as follows:
Table 8City of Oceanside
Adopted Budget Fiscal 3108-09
Governmental and Intemal Service FundsGereral FundSpec ial Revenue Fundsinternal Service FundsCapital Project FundsDobt ServiceSubtotal Gereral Operatiors
Enterprise FundsWater uti lityWastewater UtilityWaste DisposalSpecial AviationHalbor Di strict Operati oosSubtotal Entelprise QJerations
Total Budget
$
S
CONTACTING THE CITY'S FINANCIAL MANAGEMENT
This financial report is designed to provide our citizens, taxpayers, customers, investor and creditors with ageneral overview of the City's finances and to show the City's accountability for the money it receives. Tfyouhave questions about this report, separate reports of the City's component units or need any additional financialinfonnation, contact the Office of the Director of Financial Services at 300 North Coast Highway, Oceanside,California, 92054 or phone (760) 435-3832.
See independent auditors' report.- 13-

This page intentionally left blank
- 14 -

BASIC FINANCIAL STATEMENTS
- 15 -

This page intentionally left blank
- 16 -
GOVERNMENT-WIDE FINANCIAL STATEMENTS
- 17 -

This page intentionally left blank
- 18 -

City of Oceanside
Statement of Net AssetsJnne 30, 2008
Governmental Business-typeActivities Activities Total
ASSETS:
Cash and investments (Note 2) $ 161,299,463 $ 62,355,314 $ 223,654,777Restricted cash and investments (Note 2) 8,948,993 2,252,846 1l,201,839
Accounts receivable 6,044,955 10,496,656 16,541,611
Notes receivable (Note 4) 22,422,636 22,422,636Interest receivable 2,283,334 2,283,334
Taxes receivable 1,954,258 1,954,258Other receivable 9,843,321 150,108 9,993,429
Due from other governments 1,681,900 1,681,900
Internal balances (1,225,574) 1,225,574Prepaid items 15,500 10,289 25,789
Inventm)' 388,801 1,441,082 1,829,883Other assets 143,435 143,435
Land and buildings held for resale (Note 7) 9,492,993 9,492,993Net pension assets (Note 12) 39,405,523 39,405,523
Capital assets (Note 6):Non depreciable assets 101,909,666 67,575,368 169,485,034Depreciable assets, net 229,711,510 222,983,251 452,694,761
TOTAL ASSETS 594,177,279 368,633,923 962,811,202
LIABILITIES:Accounts payable 10,079,107 8,050,831 18,129,938
Accrued liabilities 4,294,706 651,701 4,946,407
Accrued interest payable 2,496,791 915,911 3,412,702Deposits 1,020,008 1,283,250 2,303,258
Unearned revenue 2,778,341 1,035,755 3,814,096
Due to other govermnents 166,764 166,764Net OPEB payable (Note 13) 370,963 370,963
Long-tenn liabilities (Note 8):Due within one year 6,683,827 6,244,105 12,927,932Due in more than one year 168,008,383 92,648,486 260,656,869
TOTAL LIABILITIES 195,898,890 110,830,039 306,728,929
NET ASSETS:Invested in capital assets,
net of related debt 223,022,078 196,363,003 419,385,081
Restricted for:Debt service 9,401,419 9,401,419
Capital projects 75,302,178 2,252,846 77,555,024
Specific projects and programs 45,513,582 45,513,582Unrestricted 45,039,132 59,188,035 104,227,167
TOTAL NET ASSETS $ 398,278,389 $ 257,803,884 $ 656,082,273
See independent auditors' report and notes to basic financial statements.
- 19-

City of OceansideStatement of ActivitiesFor the year ended June 30, 2008
FunctionslPrograrnsGovernmental Activities:
General government
Public safety
Public worksCommunity developmentCommunity/cultural services
Interest on long-tenn debt
Expenses
$ 16,004,01368,521,17327,088,207
24,715,20914,191,135
7,486,339
Program Revenues
Charges Operating Capital
for Grants and Grants and
Services Contributions Contributions
$ 2,910,185 $ 326,033 $ 128,094
5,546,313 3,632,43021,137,007 10,066,790 9,290,066
5,992,226 16,559,537
1,283,498 588,440
Total governmental activities
Business-type Activities:WaterSewerWaste disposalSpecial aviationOceanside Small Craft Harbor District
Total business-type activities
Total
158,006,076
40,649,20827,039,628
20,846,158432,432
5,807,752
94,775,178
$ 252,781,254
36,869,229
42,185,950
24,749,37120,961,319
464,7745,322,666
93,684,080
$ 130,553,309
31,173,230
4,220,677
4,220,677
$ 35,393,907
9,418,160
$ 9,418,160
General revenues:
Taxes:PropertySales
OtherIntergovernmental unrestrictedInvestment earningsMiscellaneousGain on sale of capital assets
Transfers
Total general revenues and transfers
Change in net assets
Net assets - beginning afyear, as restated (Note 15)
Net assets - end of year
See independent auditors! report and notes to basic financial statements.
- 20-

Net (Expense) Revenue andChanges in Net Assets
Governmental Business-typeActivities Activities Total
$ (12,639,701) $ $ (12,639,701)(59,342,430) (59,342,430)13,405,656 13,405,656(2,163,446) (2,163,446)
(12,319,197) (12,319,197)(7,486,339) (7,486,339)
(80,545,457) (80,545,457)
5,757,419 5,757,419(2,290,257) (2,290,257)
115,161 115,16132,342 32,342
(485,086) (485,086)
3,129,579 3,129,579
(80,545,457) 3,129,579 (77,415,878)
58,663,948 58,663,94818,734,655 18,734,65511,746,323 11,746,32313,633,572 13,633,57213,343,619 3,017,902 16,361,521
563,443 563,443157,154 1,475 158,629
1,883,945 (1,883,945)
118,726,659 1,135,432 119,862,091
38,181,202 4,265,011 42,446,213
360,097,187 253,538,873 613,636,060
$ 398,278,389 $ 257,803,884 $ 656,082,273
- 21 -

This page intentionally left blank
- 22-

FUND FINANCIAL STATEMENTS
Governmental Fund Financial StatementsProprietary Fund Financial StatementsFiduciary Fund Financial Statements
- 23 -

This page intentionally left blank
- 24-

GOVERNMENTAL FUND FINANCIAL STATEMENTS
The City reports the following major governmental funds:
The General Fund is used to account for resources traditionally associated with government which arenot required legally or by sound financial management to be accounted for in another fund.
The Housing Assistance Program Special Revenue Fund is used to account for the operation of theCity's low and moderate income housing program. Financing is provided by HUD (Section 8),Community Development Block Grants, and service fees on mortgage revenue bonds.
The Redevelopment Agency Debt Service Fund is used to account for the payment of interest andprincipal on debt of the Community Development Commission.
The Redevelopment Agency Capital Projects Fund is used to account for administrative costs andcapital improvements funded by long-term debt issued by the Community Development Commission.
The General Improvement Capital Projects Fund is used to account for general purpose capitalprojects funded primarily from developer impact fees.
The Other Governmental Funds are the aggregate of all the other governmental funds.
- 25-

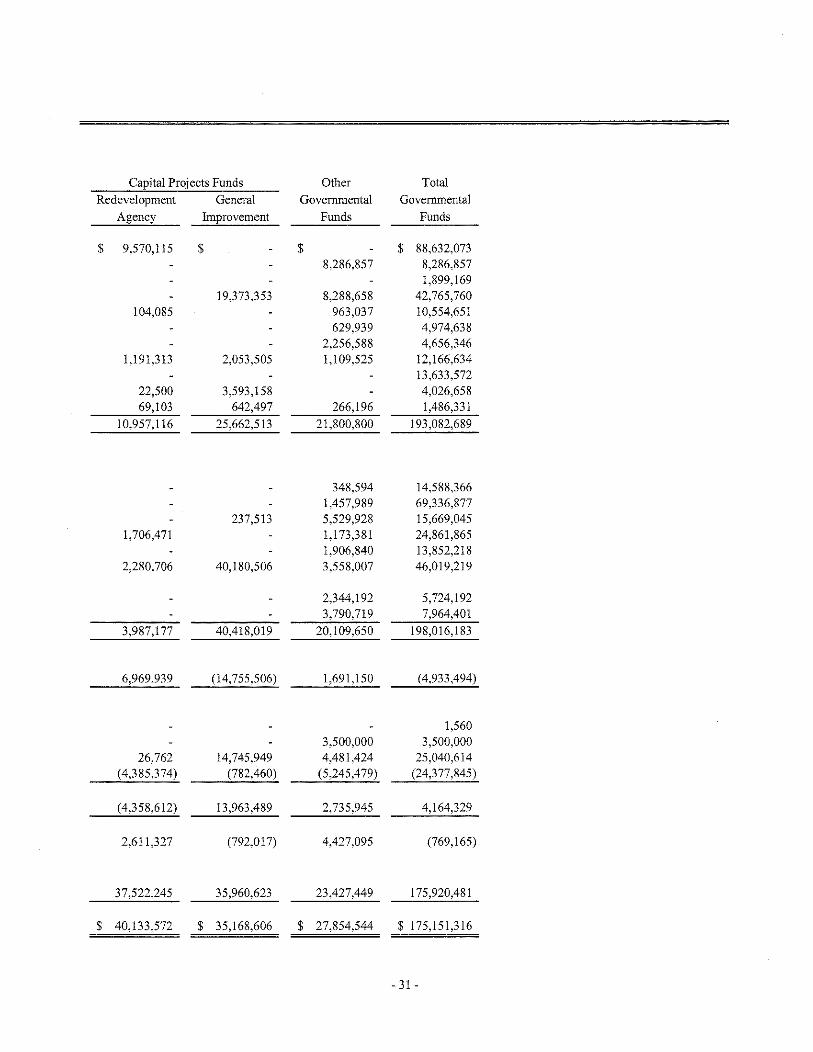
City of Oceanside
Balance SheetGovernmental FundsJune 30, 2008
Housing Redevelopment
Assistance Agency
Program Debt
General Special Revenue Service
ASSETS
Cash and investments $ 37,265,708 $ 14,417,216 $ 861,157
Restricted cash and investments 4,422,143
Receivables:
Accounts 1,517,344 10,500
Notes 22,367,826
Interest 2,157,669
Taxes 445,463
Other 5,107,723 28,174
Due from other funds 554,288
Due from other governments 28,320
Advances to other funds 9,167,419
Inventory 19,866
Prepaid items 8,171
Land and buildings held for resaleTOTAL ASSETS $ 56,243,651 $ 36,852,036 $ 5,283,300
LIABILITIES AND FUND BALANCES
LIABILITIES:
Accounts payable $ 1,915,025 S 47,035 $
Accrued liabilities 3,401,700 94,042
Deposits 483,719 425,882
Due to other funds
Due to other governments 166,764
Deferred revenue 6,319,389
Advances from other funds 13,530,837
TOTAL LIABILITIES 12,119,833 13,530,837
FUND BALANCES (DEFICIT):
Reserved 3,607,416 22,367,826 4,422,143
Unreserved, designated 35,804,645
Unreserved, undesignated Reported In:General fund 4,711,757
Special revenue funds 13,750,487
Debt service funds (12,669,680)
Capital projects funds
TOTAL FUND BALANCES (DEFICIT) 44,123,818 36,118,313 (8,247,537)
TOTAL LIABILITIES AND FUND BALANCES $ 36,852,036 $ 5,283,300
See independent auditors! report and notes to basic financial statements.
- 26-

Capital Projects Funds Other TotalRedevelopment General Governmental Governmental
Agency Improvement Funds Funds
$ 26,330,188 $ 35,546,824 $ 23,322,106 $ 137,743,199
2,319,133 2,207,717 8,948,993
500 187,139 2,501,579 4,217,06254,810 22,422,636
125,665 2,283,334
278,736 166,570 890,769
4,677,511 29,913 9,843,321
554,2881,653,580 1,681,900
3,976,517 13,143,936
19,8661,365 5,368 14,904
9,492,993 9,492,993$ 40,260,774 $ 42,730,607 $ 29,886,833 $ 211,257,201
$ 108,675 $ 6,250,343 $ 969,199 $ 9,290,27718,527 122,894 3,637,163
29,443 80,964 1,020,008
94,455 94,455
166,7641,282,215 764,777 8,366,381
13,530,837127,202 7,562,001 2,032,289 36,105,885
13,525,685 4,984,644 48,907,71421,812,104 57,616,749
4,711,757
1,057,796 14,808,283(12,669,680)
26,607,887 35,168,606 61,776,49340,133,572 35,168,606 27,854,544 175,151,316
$ 40,260,774 $ 42,730,607 $ 29,886,833 $ 211,257,201
- 27-

This page intentionally left blank
- 28 -

City of OceansideReconciliation of the Governmental Funds Balance Sheet to Statement of Net Assets
Jnne 30, 2008
Fund balances - total governmental funds
Amounts reported for governmental activities in the Statement of Net Assets are different because:
Capital assets used in governmental activities are not current financial resources
and therefore are not reported in the governmental funds balance sheet.
Pension contributions were expenditures in the fund financial statements but are deferred
and subject to capitalization and amortization on the Government-wide statements.
$ 175,151,316
318,178,594
39,405,523
Deferred revenues recorded in governmental fund financial statements resulting from
activities in which revenues were earned but funds were not available are recognized
as revenues in the Government-Wide Financial Statements.
Accrued interest $
Sales tax
Internal service funds are used by management to charge the costs of
self-insurance, information services and capital replacements to individual funds.The assets and liabilities of the internal service funds are included in governmental
activities in the Statement of Net Assets.
Long-term liabilities are not due and payable in the current period and, accordingly,are not reported as fund liabilities. All liabilities, both current and long-term are
reported in the Statement ofNet Assets:
Tax allocation honds payable
Certificate of participation
Pension obligation bonds payableCapitalleascs payable
Notes payable
Bond premiumrotallong-term liabilities
Interest on long-tenn debt is not accrued in governmental funds, but rather is
recognized as an expenditure when due.
OPEB obligation is not accrued in governmental funds, but rather is recognized as an
expenditure when paid.
Compensated absences are not due and payable in the current period and therefore
were not reported in the governmental funds.
Net assets of governmental activities
See independent auditors' report and notes to basic financial statements.
- 29-
5,588,040
1,063,489
(54,975,000)
(51,535,000)
(41,825,000)
(1,522,465)
(3,925,000)
(882,243)
6,651,529
25,853,116
(154,664,708)
(2,495,925)
(370,963)
(9,430,093)
$ 398,278,389

City of OceansideStatement of Revenues, Expenditures and Changes in Fund BalancesGovernmental FundsFor the year ended June 30,2008
Housing RedevelopmentAssistance AgencyProgram Debt
General Special Revenue ServiceREVENUES:
Taxes $ 79,061,958 $ $Special assessmentsLicense and permits 1,776,875 122,294Intergovernmental revenues 1,725,083 13,378,666Charges for services 9,132,237 355,292Fines and forfeitures 4,344,699Lease revenue 2,399,758Interest and rentals 6,385,835 1,153,959 272,497Administrative and in lieu charges 13,633,572Developer fees 411,000Other revenues 325,019 183,516
TOTAL REVENUES 116,385,278 15,604,727 2,672,255
EXPENDITURES:Current:
General government 14,239,772Public safety 67,878,888Public works 9,901,604Community development 5,887,324 16,094,689Community/cultural services 11,945,378
Capital outlayDebt service:
Principal retirement 3,380,000Interest and fees 4,173,682
TOTAL EXPENDITURES 109,852,966 16,094,689 7,553,682
EXCESS OF REVENUES OVER(UNDER) EXPENDITURES 6,532,312 (489,962) (4,881,427)
OTHER FINANCING SOURCES (USES):Proceeds from sale of real property 1,560Loan proceedsTransfers in 991,675 476,041 4,318,763Transfers out (13,752,830) (184,940) (26,762)
TOTAL OTHERFINANCING SOURCES (USES) (12,759,595) 291,101 4,292,001
NET CHANGE IN FUND BALANCES (6,227,283) (198,861) (589,426)
FUND BALANCES (DEFICIT) - BEGINNING OF YEAR,AS RESTATED 50,351,101 36,317,174 (7,658,111)
FUND BALANCES (DEFICIT) - END OF YEAR $ 44,123,818 $ 36,118,313 $ (8,247,537)
See independent auditors! report and notes to basic financial statements.
- 30-
Capital Projects Funds Other Total
Redevelopment General Governmental GovernmentalAgency Improvement Funds Funds
$ 9,570,115 $ $ $ 88,632,0738,286,857 8,286,857
1,899,16919,373,353 8,288,658 42,765,760
104,085 963,037 10,554,651629,939 4,974,638
2,256,588 4,656,3461,191,313 2,053,505 1,109,525 12,166,634
13,633,57222,500 3,593,158 4,026,65869,103 642,497 266,196 1,486,331
10,957,116 25,662,513 21,800,800 193,082,689
348,594 14,588,3661,457,989 69,336,877
237,513 5,529,928 15,669,0451,706,471 1,173,381 24,861,865
1,906,840 13,852,2182,280,706 40,180,506 3,558,007 46,019,219
2,344,192 5,724,1923,790,719 7,964,401
3,987,177 40,418,019 20,109,650 198,016,183
6,969,939 (14,755,506) 1,691,150 (4,933,494)
1,5603,500,000 3,500,000
26,762 14,745,949 4,481,424 25,040,614(4,385,374) (782,460) (5,245,479) (24,377,845)
(4,358,612) 13,963,489 2,735,945 4,164,329
2,611,327 (792,017) 4,427,095 (769,165)
37,522,245 35,960,623 23,427,449 175,920,481
$ 40,133,572 $ 35,168,606 $ 27,854,544 $ 175,151,316
- 31 -

City of Oceanside
Reconciliation of the Statement of Revenues, Expenditures and Changes inFund Balances of Governmental Funds to the Statement of ActivitiesFor the year ended .June 30, 2008
Net change in fund halances - total governmental funds $ (769,165)
Amounts reported for governmental activities in the Statement of Activities are different because:
$ 41,863,116
(9,843,518)
(21,000)
Governmental funds report capital outlays as expenditures. However, in the Statementof Activities, the cost of those assets is allocated over their estimated useful livesas depreciation expense. In addition, losses arising from the disposal of capital assetsare reported in the Statement of Activities, while the governmental funds do not. Thisis the amount by which capitalizable capital outlays exceeded depreciation and losseson disposition of capital assets in the current period.
Capital outlayDepreciation expense
Dispositions
31,998,598Some revenues reported in the Statement of Activities are not considered to be
available to finance current expenditures and therefore are not reported as
revenues in the governmental funds.
Investment earnings
Sales tax347,348
1,063,489
1,410,837Payment of unfunded pension liahilities are expenditures at the fund level hut are deferred
and subject to capitalization and amortization on the Government-Wide Statement of NetAssets. (367,530)
Compensated absences are reported in the Government-Wide Statement of Activities, butthey do not require the use of current financial resources. Therefore, long-term claims,judgments payable and compensated absences were not reported as expenditures ingovenlmental funds. (754,416)
The issuance of long-tenn debt provides current financial resources to governmental funds,while the repayment of the principal of long-term debt consumes the current financialresources of governmental funds. Neither transaction, however, has any effect on netassets. These amounts are the net effect of these differences in the treatment of
long-tenn deht:
Principal paymentsProceeds from notes
5,724,192
(3,500,000)
2,224,192Some expenses reported in the Statement of Activities do not require the use of current
financial resources and therefore are not reported a.... expenditures in the governmental
funds:
Interest expense and related itemsOPEB contrihutions
Amortization of bond premium
88,816(370,963)
51,644
Internal service funds are used by management to charge the costs of self-insurance,information services and capital replacements to individual funds. A portion of thenet income of the internal service funds is reported with governmental activities.
(230,503)
4,669,189
Change in net assets of governmental activities $ 38,181,202
See independent auditors! report and notes to basic financial statements.
- 32-

PROPRIETARY FUND FINANCIAL STATEMENTS
The City reports the following major proprietary funds:
The Water Fund is used to account for the operation of the City's water utility, a self-supportingactivity which provides services on a user charge basis.
The Sewer Fund is used to account for the operation (including waste water treatment) of the City'ssewer facility, a self-supporting activity which provides services on a user charge basis.
The Waste Disposal Fund is used to account for the collection and disposal of solid waste (includingwaste collected from street sweeping). Monthly service charges to all Oceanside property owners fundthe above services.
The Special Aviation Fund is used to account for the operation of the Oceanside (General Aviation)Airport.
The Oceanside Small Craft Harbor District Fund is used to account for the operation andmaintenance of the Oceanside Small Craft Harbor. Funding for operating expenses is provided by usercharges.
- 33 -

City of OceansideStatement of Net AssetsProprietary FnndsJune 30, 2008
Business-type Activities Enterprise FundsWaste
ASSETS Water Sewer DisposalCURRENT ASSETS:
Cash and investments $ 39,355,121 $ 14,044,331 $ 1,908,174Receivables:
Accounts 6,709,355 2,439,805 1,310,036Other 580 149,528
Prepaid items 6,402 1,786Inventory 669,440 716,649Other assets 143,435
TOTAL CURRENT ASSETS 46,884,333 17,352,099 3,218,210
NONCURRENT ASSETS:Restricted cash and investments 324,272 1,928,574Advance to other funds 4,936,023Capital assets:
Land 16,096,364 843,552 35,328Construction in progress 26,291,061 17,181,954Depreciable buildings and structures 21,717,958 114,763,059 27,630Depreciable improvements other than buildings 97,703,709 95,599,314 526Depreciable machinery and equipment . 3,249,444 7,463,841 282,148Less accumulated depreciation (61,012,570) (65,393,707) (248,280)
TOTAL NONCURRENT ASSETS 109,306,261 172,386,587 97,352TOTAL ASSETS 156,190,594 189,738,686 3,315,562
LIABILITIESLIABILITIES:
CURRENT LIABILITIES:Accounts payable 5,325,768 1,239,509 1,426,941Accrued liabilities 239,554 253,964 42,939Interest payable 254,286 494,417Deposits from others 1,011,046Due to other fundsDeferred revenue 113,365 749,465Bonds payable, current portion 640,000Notes payable, current portion 3,233,344Certificates ofparticipation, current portion 1,430,000 520,000Compensated absences, current portion 42,558 49,235 7,827
TOTAL CURRENT LIABILITIES 9,056,577 5,790,469 2,227,172
NONCURRENT LIABILITIES:Bonds payable 7,265,000Notes payable 61,723,040Certificates of participation 9,180,000 8,205,000Advances from other funds 4,300,000Claims and judgments payableCompensated absences 808,602 935,462 148,725
TOTAL NONCURRENT LIABILITIES 17,253,602 75,163,502 148,725TOTAL LIABILITIES 26,310,179 80,953,971 2,375,897
NET ASSETS:Invested in capital assets, net of related debt 85,855,238 98,705,203 97,352Restricted for capital projects 324,272 1,928,574Unrestricted 8,150,938 842,313
TOTAL NET ASSETS $ 129,880,415 $ 108,784,715 $ 939,665
Adjustment to reHect the consolidation of internal service fund activities related to enterprise funds
Net assets of business-type activities
See independent auditors' report and notes to basic financial statements.
·34·

Business~type Activities - GovernmentalEnterprise Funds (Continued) Activities
SpecIal OceansIde Small Total InternalAviation Craft Harbor District Enterprise Funds Service Funds
$ $ 7,047,688 $ 62,355,314 $ 23,556,264
650 36,810 10,496,656 1,827,893150,108
2,101 10,289 59654,993 1,441,082 368,935
143,43555,643 7,086,599 74,596,884 25,753,688
2,252,8464,936,023
3,835,398 26,103 20,836,7453,265,608 46,738,623 653,965
66,286 901,492 137,476,4251,601,656 22,704,590 217,609,795
46,249 1,017,397 12,059,079 30,039,015(512,569) (16,994,922) (144,162,048) (17,250,398)
5,037,020 10,920,268 297,747,488 13,442,5825,092,663 18,006,867 372,344,372 39,196,270
2,358 56,255 8,050,831 788,8308,840 106,404 651,701 657,543
20,561 146,647 915,911 86618,139 254,065 1,283,250
459,833 459,833172,925 1,035,755
640,00047,222 251,333 3,531,899 69,129
1,950,0002,446 20,140 122,206 169,862
559,399 1,007,769 18,641,386 1,686,230
7,265,000649,776 3,303,747 65,676,563 72,504
17,385,000249,122 4,549,122
9,606,46746,471 382.663 2,321,923 679,447
945,369 3,686,410 97,197,608 10,358,4181,504,768 4,694,179 115,838,994 12,044,648
4,340,022 7,365,188 196,363,003 13,300,9492,252,846
(752,127) 5,947,500 57,889,529
$ 3,587,895 256,505,378 $ 27,151,622
- 35 -

City of Oceanside
Statement of Revenues, Expenses and Changes in Net AssetsProprietary FundsFor the year ended June 36, 20G8
Business-type Activities - Enterprise Funds
Waste
Water Sewer DisposalOPERATING REVENUES:
Charges for services $ 40,372,213 $ 23,534,153 $ 20,928,918License and permits 461,185Developer fees 1,215,015 1,213,464
Slip rental and other related feesOther revenues 32,401
TOTAL OPERATING REVENUES 42,185,950 24,749,371 20,961,319
OPERATING EXPENSES:
Personal services 5,629,219 5,883,900 1,361,839
Maintenance and operations 11,203,352 13,886,724 19,518,351
Cost of purchased water 19,394,108Insurance premium
Depreciation 3,964,267 5,638,359 34,012TOTAL OPERATING EXPENSES 40,190,946 25,408,983 20,914,202
OPERATING INCOME (LOSS) 1,995,004 (659,612) 47,117
NONOPERATING REVENUES (EXPENSES):
Investment income 2,005,604 686,818
Gain from disposal of assetsGrants and contributions 4,220,677Interest expense (792,356) (1,885,435)
TOTAL NONOPERATING REVENUES (EXPENSES) 5,433,925 (1,198,617)
INCOME (LOSS) BEFORE TRANSFERS 7,428,929 (1,858,229) 47,117
TRANSFERS:Transfers in
Transfers out (1,426,872) (174,489) (182,942)TOTAL TRANSFERS (1,426,872) (174,489) (182,942)
CHANGE IN NET ASSETS 6,002,057 (2,032,718) (135,825)
TOTAL NET ASSETS - BEG1l'<'NING OF YEAR 123,878,358 110,817,433 1,075,490
TOTAL NET ASSETS - END OF YEAR $ 129,880,415 $ 108,784,715 $ 939,665
Adjustment to reflect the consolidation of internal service fund activities related to enterprise funds
Changes in net assets of business-type activities
See independent auditors' report and notes to basic financial statements.
- 36-

Business-type Activities - GovernmentalEnterprise Funds (Continued) Activities
Oceanside Total InternalSpeeial Small Craft Enterprise Service
Aviation Harbor District Funds Funds
$ 450,961 $ $ 85,286,245 $ 48,564,686461,185
2,428,4795,311,619 5,311,619
13,813 11,047 817,265464,774 5,322,666 93,684,080 49,381,951
141,447 2,635,827 15,652,232 5,136,414245,404 2,321,781 47,175,612 15,448,101
19,394,10822,348,716
13,234 777,127 10,426,999 2,418,949400,085 5,734,735 92,648,951 45,352,180
64,689 (412,069) 1,035,129 4,029,771
325,480 3,017,9021,475 1,475 176,594
4,220,677(36,162) (160,880) (2,874,833) (9,746)(36,162) 166,075 166,848
28,527 (245,994) 5,400,350 4,196,619
1,254,793(931) (98,711) (1,883,945) (33,617)(931) (98,711 ) (1,883,945) 1,221,176
27,596 (344,705) 3,516,405 5,417,795
3,560,299 13,657,393 21,733,827
$ 3,587,895 $ 13,312,688 $ 27,151,622
748,606
$ 4,265,011
- 37-

City of OceansideStatement of Cash FlowsProprietary FnndsFor the year ended June 30, 2008
Business-type Activities - Enterprise Funds
WasteWater Sewer Disposal
CASH FLOWS FROM OPERATL'lG ACTIVITIES,
Receipts from customers S 39,774,539 S 24,532,545 S 21,004,388
Payments to suppliers (29,796,975) (14,638,295) (19,613,858)
Payments to employees (5,490,902) (5,767,166) (1,380,022)
Insurance premiums and settlements
NET CASH PROVIDED BY
OPERATING ACTIVITIES 4,486,662 4,127,084 10,508
CASH FLOWS FROM
NONCAPITAL FINANCING ACTIVITIES,
Cash received from other funds
Advances to/from other funds (4,278,919) 4,300,000
Cash paid to other funds (1,426,872) (174,489) (182,942)
Grants received 4,220,677
NET CASH PROVIDED (USED) BY
NONCAPITAL FINANCING ACTIVITIES (1,485,114) 4,125,511 (182,942)
CASH FLOWS FROM CAPITAL AND
RELATED FINANCING ACTIVITIES,
Acquisition of capital assets - capital replacement (8,877,884) (3,324,824)
Proceeds from sale of assets
Retirement of debt (1,995,000) (3,666,788)
Interest paid (821,860) (1,937,863)
NET CASH USED BY CAPITAL AND
RELATED FINANCING ACTIVITIES (11,694,744) (8,929,475)
CASH FLOWS FROM INVESTING ACTIVITIES,
Investment income 2,005,604 686,818
NET CASH PROVIDED BY
INVESTING ACTIVITIES 2,005,604 686,818
NET INCREASE (DECREASE) IN
CASH A.ND CASH EQUIVALENTS (6,687,592) 9,938 (172,434)
CASH AND CASH EQUIVALENTS
BEGINNING OF YEAR 46,366,985 15,962,967 2,080,608
CASH AND CASH EQUIVALENTS - END OF YEAR S 39,679,393 $ 15,972,905
See independent auditors! report and notes to basic financial statements.
- 38 -

Business~type Activities - GovernmentalEnterprise Funds (Continued) Activities
Oceanside Total Internal
Special Small Craft Enterprise Service
Aviation Harbor District Funds Funds
$ 465,923 $ 5,325,704 $ 91,103,099 $ 47,849,594
(318,636) (2,436,020) (66,803,784) (15,523,703)
(126,558) (2,585,566) (15,350,214) (4,599,373)
(22,329,885)
20,729 304,118 8,949,101 5,396,633
(437,049) (12,639,757) (3,048,779)
42,875 1,475 44,350 176,594
(43,446) (240,509) (5,945,743) (65,905)
(37,443) (170,800) (2,967,966) (10,149)
(38,014) (846,883) (21,509,116) (2,948,239)
325,480 3,017,902
325,480 3,017,902
(315,996) (7,166,084) 3,669,570
7,363,684 71,774,244 19,886,694
$ $ 7,047,688 $ 64,608,160 $ 23,556,264
(Continued)
- 39-

City of OceansideStatement of Cash FlowsProprietary FundsFor the year ended June 30, 2008
Business-type Activities ~ Enterprise Funds
WasteWater Sewer Disposal
RECONCILIATION OF OPERATING INCOME (LOSS)
TO NET CASH PROVIDED BY OPERATING ACTIVITIES,
Operating income (loss) $ 1,995,004 $ (659,612) $ 47,117
Depreciation 3,964,267 5,638,359 34,012
Change in assets and liabilities:
(Increase) decrease in accounts receivable (1,939,170) (216,826) 18,353
(Increase) decrease in inventory (80,271) (67,778)
(Increase) decrease in prepaid items 17,648 7,860 25
(Increase) decrease in other current assets 14,343
Increase (decrease) in accounts payable 884,452 (691,653) (95,532)
Increase (decrease) in accrued liabilities 35,096 26,471 (28,132)
Increase (decrease) in compensated absences 103,221 90,263 9,949
Increase (decrease) in deferred revenue (472,241) 24,716
Increase (decrease) in deposits (35,687)
Increase (decrease) in claims andjudgrnents payable
NET CASH PROVIDED
BY OPERATING ACTIVITIES $ 4,486,662 $ 4,127,084 $ 10,508
See independent auditors' report and notes to basic financial statements.
- 40-

SpecialAviation
Business-type Activities
Enterprise Funds (Continued)
OceansideSmall Craft
Harbor District
Total
EnterpriseFunds
GovernmentalActivities
InternalService
Funds
$ 64,689 $ (412,069) $ 1,035,129 $ 4,029,771
13,234 777,127 10,426,999 2,418,949
1,149 (27,962) (2,164,456) (1,532,357)
(34,132) (182,181) (45,844)
(726) 24,807 6,365
14,343
(43,285) (122,367) (68,385) (36,123)
4,038 10,997 48,470 453,334
10,851 39,265 253,549 83,707
31,000 (416,525)
4,185 8,853 (22,649)
18,831
$ 20,729 $ 304,118 $ 8,949,101 $ 5,396,633
- 41 -

This page intentionally left blank
- 42-

FIDUCIARY FUND FINANCIAL STATEMENTS
Fiduciary fund types are accounted for according to the nature of the fund. The City has only agencyfunds, which are purely custodial in nature (assets equal liabilities) and thus do not involvemeasurement of results of operations.
- 43 -

City of OceansideStatement of Fiduciary Assets and LiabilitiesJnne 30, 2008
TotalASSETS:
Cash and investments $ 7,886,586Restricted cash and investments 16,777,397Accounts receivable 20,254
TOTAL ASSETS $ 24,684,237
LIABILITIES:Accounts payable $ 174,276Deposits 3,815,584Due to bondholders 20,694,377
TOTAL LIABllJTIES $ 24,684,237
See independent auditors' report and notes to basic financial statements.
- 44-

City of OceansideNotes to Basic Financial StatementsJune 30, 2008
1. SUMMARY OF SIGNIFICANT ACCOUNTING POLICIES:
The basic financial statements of the City of Oceanside, California (the City) have been prepared inconformity with accounting principles generally accepted in the United States of America (GAAP)as applied to governmental agencies. The Governmental Accounting Standards Board (GASB) isthe accepted standard setting body for establishing governmental accounting and financialreporting principlcs. The more significant of the City's accounting policies are described below.
A. Financial Reporting Entity:
The City was incorporated on January 3, 1888, under the general laws of the State ofCalifornia. The City operates under a Council-Manager form of government and providesbasic local governmental services including public safety (Police, Fire and Beach Lifeguard),maintenance and construction of public improvements, cultural, recreation planning, zoning,and general administration. In addition, the City operates five enterprise activities: Water,Sewer, Waste Disposal, General Aviation Airport and a Harbor District.
As required by GAAP, these basic financial statements present the City and its componentunits, entities for which the City is considered to be financially accountable. The followingblended component units, although legally separate entities are, in substance, part of the City'soperations and data from these units are combined with data of the City. Discretely presentedcomponent units, on the other hand, are reported in a separate column in the basic financialstatements to emphasize their legal separateness from the City. Each blended component unithas a June 30 year-end. The City had no discretely presented component units. The followingentities are reported as blended component units since the governing board is substantively thesame as the primary government:
Oceanside Community Development Commission - The Oceanside CommunityDevelopment Commission (the Commission) was established on July 16,1980, andincludes all activities previously performed by the Oceanside Redevelopment Agency andthe Oceanside Housing Authority. The Oceanside Redevelopment Agency was originallyestablished on February 20, 1974, pursuant to the State of California Health and SafetyCode entitled "Community Redevelopment Law". Its purpose is to eliminate blighted areasby encouraging the development of residential, commercial, industrial, recreational andpublic facilities. The Oceanside Housing Authority was originally established onFebruary 24, 1971, and dissolved April 9, 1975, due to inactivity. It was reactivated onApril 9, 1980, pursuant to the State of California Health and Safety Code. This departmentis responsible for all assisted housing projects within the City. The operations of theCommission are reported as government funds of the City.
See independent auditors' report.- 45-
City of OceansideNotes to Basic Financial Statements, ContinnedJnne 30, 2008
1. SUMMARY OF SIGNIFICANT ACCOUNTING POLICIES (CONTINUED):
A. Financial Reporting Entity (Continued):
Blended Component Units (Continued):
Oceanside Small Craft Harbor District - The Oceanside Small Craft Harbor District (theHarbor District) was established on July 6, 1959, pursuant to the State of California Harborand Navigation Code, Part 7, Section 7000 entitled "Small Craft Harbor District". Itspurpose is to finance, construct, organize and operate a small craft berthing facility andleaseholds within the harbor area. The operations of the Harbor District are reported asbusiness-type activity and are a proprietary fund of the City.
Oceanside Building Authority - The Oceanside Building Authority (the Building Authority)was established on December 1,1966, pursuant to the State of California Government CodeSection 6506. The Building Authority was initially established to acquire, construct,maintain, operate and lease public safety buildings. The operations of the BuildingAuthority are reported as governmental funds of the City.
Oceanside Public Financing Authority - The Oceanside Public Financing Authority (theFinancing Authority) was established January 23,2002 under the Joint Exercise of PowersLaw of the State of California (constituting Chapter 5 of Division 7 of Title 1 of theCalifornia Government Code) to assist in the financing of public capital improvements tobe owned by any of its members (the City and the Commission). The operations of theFinancing Authority are reported as governmental funds of the City.
Complete financial statements for the above entities may be obtained from the FinancialServices Department, 300 North Coast Highway, Oceanside, California 92054.
B. Basis of Accounting and Measurement Focus:
The accounts of the City are organized on the basis of funds, each of which is considered aseparate accounting entity. The operations of each fund are accounted for with a separate set ofself-balancing accounts that comprise its assets, liabilities, fund equity, revenues, andexpenditures or expenses as appropriate. Government resources are allocated to and accountedfor in individual funds based upon the purpose for which they are to be spent and the means bywhich spending activities are controlled.
Government-Wide Financial Statements:
The City's government-wide financial statements include a Statement of Net Assets and aStatement of Activities. These statements present summaries of governmental andbusiness-type activities for the City, the primary government, accompanied by a total column.Fiduciary activities of the City are not included in these statements.
See independent auditors' report.- 46-

City of OceansideNotes to Basic Financial Statements, ContinuedJune 30, 2008
1. SUMMARY OF SIGNIFICANT ACCOUNTING POLICIES (CONTINUED):
B. Basis of Accounting and Measurement Focus (Continued):
Government-Wide Financial Statements (Continued):
These basic financial statements arc presented on an "economic resources" measurement focusand the accrual basis of accounting. Accordingly, all of the City's assets and liabilities,including capital assets and related infrastructure assets and long-term liabilities, are includedin the accompanying Statement of Net Assets. The Statement of Activities presents changes innet assets. Under the accrual basis of accounting, revenues are recognized in the period inwhich they are earned while expenses are recognized in the period in which the liability isincurred.
Certain types of transactions are reported as program revenues for the City in three categories:
• Charges for services• Operating grants and contributions• Capital grants and contributions
Certain eliminations have been made as prescribed by GASB Statement No. 34 in regard tointerfund activities, payables and receivables. All internal balances in the Statement of NetAssets have been eliminated except those representing balances between the governmentalactivities and the business-type activities, which are presented as internal balances andeliminated in the total primary government column. (In the Statement of Activities, internalservice frmd transactions have been eliminated). However, those transactions betweengovernmental and business-type activities have not been eliminated. The following interfundactivities have been eliminated:
• Due to/from other frmds• Advances to/from other funds• Transfers in/out
The City applies all applicable GASB pronouncements (including all NCGA Statements andInterpretations currently in effect) as well as the following pronouncements issued on or beforeNovember 30, 1989, to the business-type activities, unless those pronouncements conflict withor contradict GASB pronouncements: Financial Accounting Standards Board (FASB)Statements and Interpretations, Accounting Principles Board (APB) Opinions, and AccountingResearch Bulletins (ARB) of the committee on Accounting Procedure. The City applies allapplicable FASB Statements and Interpretations issued after November 30, 1989, except thosethat conflict with or contradict GASB pronouncements.
See independent auditors' report.- 47-

City of OceansideNotes to Basic Financial Statements, ContinuedJnne 30, 2008
1. SUMMARY OF SIGNIFICANT ACCOUNTING POLICIES (CONTINUED):
B. Basis of Accounting and Measurement Focus (Continued):
Governmental Fund Financial Statements:
Governmental fund financial statements include a Balance Sheet and a Statement of RevenuesExpenditures and Changes in Fund Balances for all major governmental funds and othergovernmental funds aggregated. An accompanying schedule is presented to reconcile andexplain the differences in net assets as presented in these statements to the net assets presentedin the government-wide financial statements. The City has presented all major funds that metthe applicable criteria.
All governmental funds are accounted for on a spending or "current financial resources"measurement focus and the modified accrual basis of accounting. Accordingly, only currentassets and current liabilities are included on the Balance Sheet. The Statement of Revenues,Expenditures and Changes in Fund Balances present increases (revenues and otber financingsources) and decreases (expenditures and other financing uses) in net current assets. Under themodified accrual basis of accounting, revenues are recognized in the accounting period inwhich they become both measurable and available to finance expenditures of the currentperiod.
Revenues are recorded when received in cash, except those revenues subject to accrual(generally 60 days after year-end) and recognized when due. The primary revenue sources,which have been treated as susceptible to accrual by the City, are property tax, sales tax,intergovernmental revenues and other taxes. Expenditures are generally recorded in theaccounting period in which the related fund liability is incurred, except for principal andinterest on long-term liabilities, and compensated absences which are recognized asexpenditures only when payment is due.
Deferred revenues arise when potential revenues do not meet both the "measurable" and"available" criteria for recognition in the current period. Deferred revenues also arise when thegovernment receives resources before it has a legal claim to them, as when grant monies arereceived prior to incurring qualifying expenditures. In subsequent periods when both revenuerecognition criteria are met or when the government has a legal claim to the resources, thedeferred revenue is removed from the balance sheet and revenue is recognized.
The Reconciliation of the Fund Financial Statements to the Government-Wide FinancialStatements is provided to explain the differences created by the integrated approach of GASBStatement No. 34.
See independent auditors' report.- 48-

City of OceansideNotes to Basic Financial Statements, ContinuedJune 30, 2008
I. SUMMARY OF SIGNIFICANT ACCOUNTING POLICIES (CONTINUED):
B. Basis of Accounting and Measurement Focus (Continued):
Governmental Fund Financial Statements (Continued):
The funds designated as major funds are detennined by a mathematical calculation consistentwith GASB Statement No. 34. The City reports the following major governmental funds:
The General Fund is used to account for resources traditionally associated with governmentwhich are not required legally or by sound financial management to be accounted for in anotherfund.
The Housing Assistance Program Special Revenue Fund is used to account for the operation ofthe City's low and moderate income housing program. Financing is provided by HUD(Section 8), Community Development Block Grants, and service fees on mortgage revenuebonds.
The Redevelopment Agency Debt Service Fund is used to account for the payment of interestand principal on debt of the Community Development Commission.
The Redevelopment Agency Capital Projects Fund is used to account for administrative costsand capital improvements funded by long-tenn debt issued by the Community DevelopmentCommission.
The General Improvement Capital Projects Fund is used to account for general purpose capitalprojects funded primarily from developer impact fees.
Proprietary Fund Financial Statements:
Proprietary fund financial statements include a Statement of Net Assets, a Statement ofRevenues, Expenses and Changes in Net Assets, and a Statement of Cash Flows for allproprietary funds.
A separate column representing internal service funds is also presented in these statements.Internal service funds account for activities involved in rendering risk management, automotiveequipment maintenance, City building maintenance and central data processing servicesprovided to other departments of the City on a cost-reimbursement basis. Because the principalusers of the internal service funds are the City's governmental entities, the assets and liabilitiesof the internal service funds are consolidated into the governmental activities column of theGovernment-wide Statement ofNet Assets.
See independent auditors' report.- 49-

City of OceansideNotes to Basic Financial Statements, ContinnedJune 30, 2008
1. SUMMARY OF SIGNIFICANT ACCOUNTING POLICIES (CONTINUED):
B. Basis of Accounting and Measurement Focus (Continued):
Proprietary Fund Financial Statements (Continued):
Proprietary funds are accounted for using the "economic resources" measurement focus and theaccrual basis of accounting. Accordingly, all assets and liabilities (whether current ornoncurrent) are included on the Statement of Net Assets. The Statement of Revenues,Expenses and Changes in Net Assets presents increases (revenues) and decreases (expenses) intotal net assets. Under the accrual basis of accounting, revenues are recognized in the period inwhich they are earned while expenses are recognized in the period in which liability is incurred.
Operating revenues in the proprietary funds are those revenues that are generated from theprimary operations of the fund. All other revenues are reported as nonoperating revenues.Operating expenses are those expenses that are esscntial to the primary operations for the fund.All other expenses are reported as nonoperating expenses.
The City reports the following major enterprise funds:
The Water Fund is used to account for the operation of the City's water utility, a self-supportingactivity which provides services on a user charge basis.
The Sewer Fund is used to account for the operation (including waste water treatment) of theCity's sewer facility, a self-supporting activity which provides services on a user charge basis.
The Waste Disposal Fund is used to account for the collection and disposal of solid waste(including waste collected from street sweeping). Monthly service charges to all Oceansideproperty owners fund the above services.
The Special Aviation Fund is used to account for the operation of the Oceanside (GeneralAviation) Airport.
The Oceanside Small Craft Harbor District Fund is used to account for the operation andmaintenance of the Oceanside Small Craft Harbor. Funding for operating expenses is providedby user charges.
Fiduciary Fund Financial Statements:
Fiduciary fund types are accounted for according to the nature of the fund. The City has onlyagency funds, which are purely custodial in nature (assets equal liabilities) and thus do notinvolve measurement of results of operations. Agency funds are accounted for using accrualbasis accounting.
See independent auditors' report.- 50-

City of OceansideNotes to Basic Financial Statements, ContinuedJune 30, 2008
1. SUMMARY OF SIGNIFICANT ACCOUNTING POLICIES (CONTINUED):
B. Basis of Accounting and Measurement Focus (Continued):
Fiduciary Fund Financial Statements (Continued):
The Agency funds are used to account for the (l) receipt of special taxes and assessments usedto pay principal and interest on related bonds with no direct City liability as well as receipt anddisbursement of capital project bond proceeds related to bonds for which the City has no directliability and (2) money and property held by the City as trustee or custodian such as refundabledeposits.
C. Use of Restricted and Unrestricted Net Assets:
When an expense is incurred for purposes for which both restricted and unrestricted net assetsare available, the City's policy is to apply restricted net assets first.
D. Encumbrances:
Encumbrance accounting, under which purchase orders, contracts and other commitments forthe expenditure of monies are recorded in order to reserve that portion of the applicableappropriation, is employed as an extension of formal budgetary integration in the general,special revenue and capital projects funds. Unexpended and unencumbered appropriations ofthese governmental funds automatically lapse at the end of the fiscal year.
E. Cash, Cash Equivalents and Investments:
The City pools its available cash for investment purposes. The City considers pooled cash andinvestment amounts with original maturities of three months or less to be cash equivalents.
Investments are stated at fair value. Market value is used as fair value for those securities forwhich market quotations are readily available.
F. Inventory:
Inventory is recorded at cost, which approximates market, using the first-in, first-out (FIFO)method. Inventory in the General Fund consists of expendable supplies held for consumption.The cost is recorded as an expenditure at the time individual items are used. Inventories in theproprietary funds are recorded at cost, which approximates market, and include variousaccessories used for repair and maintenance of equipment.
See independent auditors' report.- 51 -

City of OceansideNotes to Basic Financial Statements, ContinuedJune 30, 2008
1. SUMMARY OF SIGNIFICANT ACCOUNTING POLICIES (CONTINUED):
G. Land and Buildings Held for Resale:
Land and buildings held for resale is carried at the lower of cost or market, but not greater thanthe net realizable value. An amount equal to the carrying value of land is reserved in fundbalance because such assets are not available to finance the City's current operations.
H. Capital Assets:
Capital assets are valued at historical cost or estimated historical cost if actual historical costwas not available. Donated fixed assets are valued at their estimated fair market value on thedate donated. City policy has set the capitalization threshold for reporting infrastructure at$100,000, all other capital assets are set at $10,000. Depreciation is recorded on a straight-linebasis over estimated useful lives of the assets as follows:
BuildingsImprovements other than buildingsMachinery and equipmentInfrastructure
50 - 60 years30 - 50 years
5 - 20 years15 - 50 years
The City defines infrastructure as the basic physical assets that allow the City to function. Theassets include streets, storm drains, park lands, and buildings. Each major infrastructure systemcan be divided into subsystems. For example, the street system can be subdivided intopavement, curb and gutters, sidewalks, medians, streetlights, landscaping and land. Thesesubsystems were not delineated in the basic financial statements. The appropriate operatingdepartment maintains information regarding the subsystems.
Interest accrued during capital assets construction, if any, is capitalized for the business-typeand proprietary funds as part of the asset cost.
For all infrastructure systems, the City elected to use the Basic Approaeh as defined by GASBStatement No. 34 for infrastructure reporting. The City commissioned an appraisal of Cityowned infrastructure and property as of June 30, 2002. This appraisal determined the originalcost, which is defined as the actual cost to acquire new property in accordance with marketprices at the time of first construction/acquisition. Original costs were developed in one ofthree ways: (1) historical records; (2) standard unit costs appropriate for theconstruction/acquisition date; or (3) present cost indexed by a reciprocal factor of the priceincrease from the construction/acquisition date to the current date. The accumulateddeprcciation, defined as the total depreciation from the date of construction/acquisition to thecurrent date on a straight-line, unrecovered cost method was computed using industry acceptedlife expectancies for each infrastructure subsystem. The book value was then computed bydeducting the accumulated depreciation from the original cost.
See independent auditors' report.- 52-

City of OceansideNotes to Basic Financial Statements, ContinuedJune 30, 2008
1. SUMMARY OF SIGNIFICANT ACCOUNTING POLICIES (CONTINUED):
1. Net Pension Assets:
A pension asset is created when an employer pays into a retirement plan amounts in excess ofits annual required contribution (ARC). The ARC is an actuarially calculated amount that issufficient to fund future costs and extinguish any existing unfunded actuarial accrued liability(UAAL). In August 2005, the City made a payment of $42,072,326 to CalPERS from theproceeds of the issuance of pension obligation bonds to reduce the City's UAAL as calculatedat that time. The prepaid pension asset will be amortized over the life of the bonds on astraight-line basis. Unamortized balance of the net pension assets at June 30, 2008 was$39,405,523.
J. Long-Term Debt:
Government-Wide Financial Statements:
Long-term debt and other financed obligations are reported as liabilities in the appropriatefunds.
Bond premiums and discounts, as well as issuance costs, are deferred and amortized over thelife of the bonds on a straight-line basis. Bonds payable are reported net of the applicablepremium or discount. Issuance costs are reported as deferred charges.
Fund Financial Statements:
The fund financial statements do not present long-term debt. Therefore, it is shown in theReconciliation of the Governmental Funds Balance Sheet to the Government-Wide StatementofNet Assets.
K. Net Assets:
Government-Wide Financial Statements:
The net assets reported on the Statement ofNet Asscts consist of the following three categories:
Invested in Capital Assets, Net of Related Debt - This amount consists of capital assets, netof accumulated depreciation and reduced by outstanding debt attributed to the acquisition,construction, or improvement of the assets.
Restricted Net Assets - This amount is restricted by external creditors, grantors,contributors, or laws or regulations of other governments.
Unrestricted Net Assets - This amount is all net assets that do not meet the definition of"invested in capital assets, net of related debt" or "restricted net assets".
See independent auditors' report.- 53 -

City of OceansideNotes to Basic Financial Statements, ContinnedJune 30, 2008
I. SUMMARY OF SIGNIFICANT ACCOUNTING POLICIES (CONTINUED):
K. Net Assets (Continued):
Fund Financial Statements:
Fund Equity - Reservations of fund balances of governmental funds are created to eithersatisry legal covenants, including State laws, that require a portion of the fund equity besegregated or identify the portion of the fund equity not available for future expenditures.
L. Compensated Absences:
Government-Wide Financial Statements:
For governmental and business-type activities, compensated absences are recorded as incurredand the related expenses and liabilities are reported.
Fund Financial Statements:
In governmental funds, compensated absences are recorded as expenditures in the years paid,as it is the City's policy to liquidate any unpaid compensated absences at June 30 from futureresources, rather than currently available financial resources. In proprietary funds,compensated absences are expensed to the various funds in the period they are earned, and suchfund's share of the unpaid liability is recorded as a long-term liability of the fund. Vested oraccumulated compensated absences of proprietary funds are recorded as an expense andliability of those funds as the benefits accrue to employees.
M. Use of Estimates:
The preparation of financial statements in conformity with accounting principles generallyaccepted in the United States of America requires management to make estimates andassumptions that affect the reported amounts of assets and liabilities and disclosure ofcontingent assets and liabilities at the date of the financial statements and the reported amountsof revenues and expenditures during the reporting pcriod. Actual results could differ fromthose estimates and assumptions.
See independent auditors' report.- 54-

City of OceansideNotes to Basic Financial Statements, ContinuedJune 30, 2008
2. CASH AND INVESTMENTS:
Cash and Investments:
The City maintains a cash and investment pool, which includes cash balances and authorizedinvestments of all funds, which the City Treasurer invests to enhance interest earnings. The pooledinterest earned is allocated to the funds based on average month-end cash and investment balancesin these funds.
The following is a summary of cash and investments at June 30,2008:
Cash and investmentsRestricted cash and investments
Total cash and investments
GovernmentWide
Statement ofNet Assets
$ 223,654,77711,201,839
:£ 234.856,616
FiduciaryFunds
Statement ofAssets andLiabilities
$ 7,886,58616,777,397
$ 24,663,983
$ 231,541,36327,979,236
Cash and investments at June 30, 2008 consisted of the following:
Demand depositsEscrow depositsInvestments
Total cash and investments
See independent auditors' report.- 55-
$ 369,9082,649,237
256,501,454
$ 259,52J1599

City of OceansideNotes to Basic Financial Statements, ContinnedJune 30, 2008
2. CASH AND INVESTMENTS (CONTINUED):
Investments Authorized by the California Government Code and the City's InvestmentPolicy:
The table below identifies the investment types that are authorized for the City by the CaliforniaGovernment Code (or the City's investment policy, where more restrictive). The table alsoidentifies certain provisions of the California Government Code (or the City's investment policy,where more restrictive) that address interest rate risk, credit risk, and concentration of credit risk.This table does not address investments of debt proceeds held by bond trustees that are governedby the provisions of bond indentures of the City, rather than the general provisions of theCalifornia Government Code or the City's investment policy.
Authorized Investment Type
United States (US.) Treasury Obligations
MaximumMaturity
5 years
MaximumPercentage
ofPortfolio*
None
MaximumInvestment
in One Issuer
None
U.S. Government SponsoredEnterprise Securities
Banker's Acceptances
Time Deposits
Repurchase Agreements
Reverse Repurchase Agreements
Commercial Paper
Corporate Medium Term Notes
Loeal Agency Investment Fund (LAIF)
N/A - Not Applicable
5 years None 25%
180 days 20% 5%
I year 15% None
30 days 30% None
60 days 15% None
270 days 15% 5%
5 years 15% 5%
N/A None None
* - Excluding amounts held by bond trustees that are not subject to California Government Coderestrictions.
See independent auditors' report.- 56-

City of OceansideNotes to Basic Financial Statements, ContinuedJune 30, 2008
2. CASH AND INVESTMENTS (CONTINUED):
Investments Authorized by Debt Agreements:
Investments of debt proceeds held by bond trustees are goverued by provisions of the debtagreements, rather than the general provisions of the California Government Code or the City'sinvestment policy. The table below identifies the investment types that are authorized forinvestments held by bond trustees. The table also identifies certain provisions of these debtagreements that address interest rate risk, credit risk, and concentration of credit risk.
Authorized Investment TyPe
U.S. Treasury Obligations
U.S. Government SponsoredEnterprise Securities
Banker's Acceptances
Commercial Paper
Money Market Mutual Funds
Investment Contracts
N/A- Not Applicable
Maximum MaximumMaximum Percentage InvestmentMaturity Allowed in One Issuer
None None None
None None None
180 days None None
270 days None None
N/A None None
30 years None None
In accordance with GASB Statement No. 31, "Accounting and Financial Reporting for CertainInvestments and for External Investment Pools", investments were stated at fair value using theaggregate method in all funds and component units.
See independent auditors' report.- 57 -

City of OceansideNotes to Basic Financial Statements, ContinuedJnne 30, 2008
2. CASH AND INVESTMENTS (CONTINUED):
Disclosures Relating to Interest Rate Risk:
Interest rate risk is the risk that changes in market interest rates will adversely affect the fair valueof an investment. Generally, the longer the maturity of an investment, the greater the sensitivity ofits fair value to changes in market interest rates. One of the ways that the City manages itsexposure to interest rate risk is by purchasing a combination of shorter term and longer tcrminvestments and by timing cash flows from maturities so that a portion of the portfolio is maturingor coming close to maturity evenly over time as necessary to provide the cash flow and liquidityneeded for operations.
Information about thc sensitivity of the fair values of the City's investments (including investmentsheld by bond trustees) to markct interest rate fluctuations is provided by the following table thatshows the distribution of the City's investments by maturity:
Remaining Maturity (in Months)
12 Months 13 - 24 25 - 60 More Than
Investment Type or Less Months Months 60 Months Total
U.S. Treasury Obligations $ 2,035,460 $ 5,933,900 $ $ $ 7,969,360
u.s. Government Sponsored
Enterprise Securities 28,746,887 23,700,961 133,310,110 185,757,958
Local Agency Investment Fund (LAIF) 37,444,136 37,444,136
Held by Bond Trustees:
Money Market Mutual Funds 23,872,822 23,872,822
Investment Contracts 1,457,178 1,457,178
$~92,099~~ $ 29 634,861 $133.310.U.D $--L457,17B. $2i6~Ql,:ti,!
Investments with Fair Values Highly Sensitive to Interest Rate Fluctuations:
The City holds investments in callable federal agency securities that are highly sensitive to interestrate fluctuations. These securities are subject to early payment in a period of declining interestrates. The resultant reduction in expected total cash flows affects thc fair value of these securitiesand makes their fair values highly sensitive to changes in interest rates. The fair value of callableinvestments in the City's portfolio at June 30, 2008 is $136,445,269 or 63.09% of the City'sportfolio (excluding held by bond trustees).
See independent auditors' report.- 58-
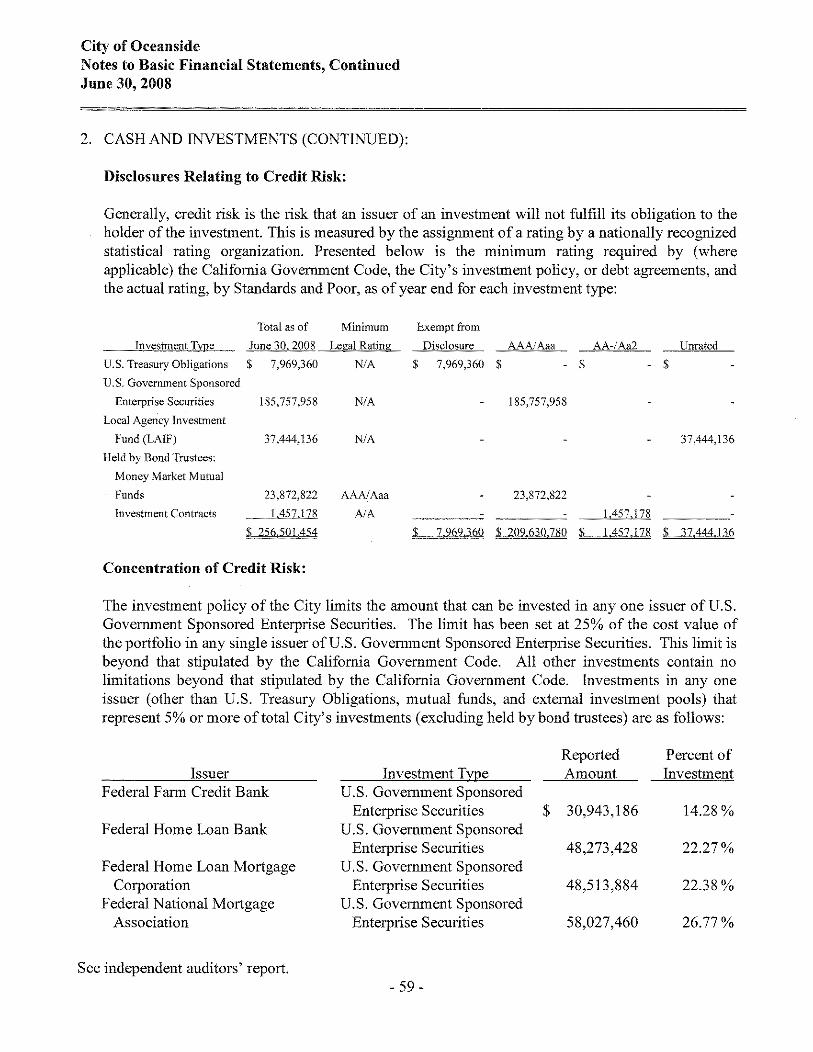
City of OceansideNotes to Basic Financial Statements, ContinnedJnne 30, 2008
2. CASH AND INVESTMENTS (CONTINUED):
Disclosures Relating to Credit Risk:
Generally, credit risk is the risk that an issuer of an investment will not fulfill its obligation to theholder of the investment. This is measured by the assignment of a rating by a nationally recognizedstatistical rating organization. Presented below is the minimum rating required by (whereapplicable) the California Government Code, the City's investment policy, or debt agreements, andthe actual rating, by Standards and Poor, as of year end for each investment type:
Total as of Minimum Exempt from
Investment Type June 30. 2008 Legal Rating Disclosure AAAlAaa AA·/Aal Unrated
U.S. Treasury Obligations $ 7,969,360 NlA $ 7,969,360 $ $ . $
U.S. Government Sponsored
Enterprise Securities 185,757,958 N/A 185,757,958
Local Agency Investment
Fund (LAIF) 37,444,136 N/A 37,444,136
Held by Bond Trustees:
Money Market Mutual
Funds 23,872,822 AAAlAaa 23,872,822
Investment Contracts 1,457,178 AlA 1,457,178
$ 256 50Lc454 LJ~9JI~§Q Ji.2J2~j)J£O lL L45U28 $ TI,444J3li
Concentration of Credit Risk:
The investment policy of the City limits the amount that can be invested in anyone issuer of U.S.Government Sponsored Enterprise Securities. The limit has been set at 25% of the cost value ofthe portfolio in any single issuer of U.S. Government Sponsored Enterprise Securities. This limit isbeyond that stipulated by the California Government Code. All other investments contain nolimitations beyond that stipulated by the California Government Code. Investments in anyoneissuer (other than U.S. Treasury Obligations, mutual funds, and external investment pools) thatrepresent 5% or more of total City's investments (excluding held by bond trustees) are as follows:
IssuerFederal Farm Credit Bank
Federal Home Loan Bank
Federal Home Loan MortgageCorporation
Federal National MortgageAssociation
Reported Percent ofInvestment Type Amount Investment
U.S. Government SponsoredEnterprise Securities $ 30,943,186 14.28 %
U.S. Government SponsoredEnterprise Securities 48,273,428 22.27%
U.S. Government SponsoredEnterprise Securities 48,513,884 22.38%
U.S. Government SponsoredEnterprise Securities 58,027,460 26.77%
See independent auditors' report.- 59-

City of OceansideNotes to Basic Financial Statements, ContinuedJune 30, 2008
2. CASH AND INVESTMENTS (CONTINUED):
Custodial Credit Risk:
Custodial credit risk for deposits is the risk that, in the event of the failure of a depository financialinstitution, a government will not be able to recover its deposits or will not be able to recovercollateral securities that are in the possession of an outside party. The custodial credit risk forinvestments is the risk that, in the event of the failure of the counterparty (e.g., broker-dealer) to atransaction, a government will not be able to recover the value of its investment or collateralsecurities that are in the possession of another party. The California Government Code requiresthat a financial institntion secure deposits made by state or local governmental units by pledgingsecurities in an undivided collateral pool held by a depository regulated under state law (unless sowaived by the governmental unit). The market value of the pledged securities in the collateral poolmust equal at least 110% of the total amount deposited by the public agencies. California law alsoallows financial institntions to secure deposits by pledging first trust deed mortgage notes having avalue of 150% of the secured public deposits. The City's investment policy does not contain anyadditional provisions that would limit the exposure to custodial credit risk for deposits. Howeverthe policy does stipulate that mortgage collateral cannot be used to secure deposits, and that the useofa third party bank trust department is to act as the City's safekeeping agent for investments.
On June 30, 2008, $735,700 of the bank value of the City's deposits with financial institntionswere in excess of federal depository insurance limits and were collateralized in accordance withCalifornia Law. The actnal amount of deposits reflected on the City's records at year-end isreduced for outstanding obligations. As of June 30, 2008, the City's investments in the followinginvestment types were held by the City's safekeeping agent:
Investment TypeU.S. Treasury ObligationsU.S. Government Sponsored Enterprise Securities
Market Value$ 7,969,360
185,757,958
The following cash and investments were held by the bond trustee:
Investment TypeMoney Market Mutual FundsInvestment Contracts
Investment in State Investment Pool:
Market Value$ 23,872,822
1,457,178
The City is a voluntary participant in the Local Agency Investment Fund (LAIF) that is regulatedby California Government Code Section 16429 under the oversight of the Treasurer of the State ofCalifornia. The fair value of the City's investment in this pool is reported in the accompanyingfinancial statements at amounts based upon the City's pro-rata share of the fair value provided byLAIF for the entire LAIF portfolio (in relation to the amortized cost of that portfolio). The balanceavailable for withdrawal is based on the accounting records maintained by LAIF, which arerecorded on an amortized cost basis.
See independent auditors' report.- 60-

City of OceansideNotes to Basic Financial Statements, ContinuedJune 30, 2008
3. PROPERTY TAXES:
Property taxes attach a legal enforceable lien on property as of January I. Taxes are levied onJuly I and are payable in two installments on December 10 and April 10. The County of SanDiego (the County) bills and collects the property taxes and remits them to the City in installmentsduring the year. City property tax revenues are recognized when an enforceable legal lien isattached to the property.
The County is permitted by State Law (Proposition 13) to levy taxes at 1% of full market value (attime of purchase) and can increase the property assessed value not more than 2% per year. TheCity receives a share of this basic levy proportionate to what it received in the 1976 to 1978 period.
4. NOTES RECEIVABLE:
A. Government-Wide Financial Statements:
The following is a summary of notes receivable at June 30, 2008:
Government-WideStatement ofNet Assets
Governmental Activities:Notes
B. Fund Financial Statements:
$ 22,422.636
At June 30, 2008, the City had notes receivable reported in the following funds:
Housing Assistance Program Special Revenue FundRedevelopment Agency Capital Projects Fund
Total
$
$
22,367,82654.810
22,422,63(j
The City made several housing rehabilitation, rental rehabilitation and long-term loans totaling$22,367,826 to qualified applicants using Community Development Block Grants andInclusionary-in-lieu fees. The rehabilitation loans bear interest up to 3% and are repaid eitherby monthly payments or when there is a change of title. The rental rehabilitation loans areforgiven after a ten-year period. The long-term loans are paid back based on residual receiptsagreements.
The City has made loans fTom low and moderate income housing program funds in the amountof $54,810 for a home buyer program.
See independent auditors' report.- 61 -

City of OceansideNotes to Basic Financial Statements, ContinuedJune 30, 2008
5. INTERF1JND TRANSACTIONS:
Interfund Receivables and Payables:
At June 30, 2008, the City had the following short-tenn interfund receivables and payables:
General FundDue To Due From
Other Governmental FundsSpecial Aviation Enterprise Fund
Amount$ 94,455
459,833
$ ..Yi4.28B
The outstanding balances between funds result mainly from temporary operating cash loans.
Long-Term Advances:
At June 30, 2008, the City had the following interfund long-tenn advances:
Advances ToRedevelopment Agency Debt
Service Fund
Sewer Enterprise FundSpecial Aviation Enterprise Fund
Advances FromGeneral FundRedevelopment Agency Capital
Projects FundWater Enterprise FundWater Enterprise FundGeneral Fund
Amount$ 8,918,297
3,976,517636,023
4,300,000
$ 18,079.959
The Commission entered into a loan agreement with the City to restructure unpaid loans made tothe Commission in 1986 and 1989 to fund downtown redevelopment projects. The loan representsthe unpaid principal portion of $2,000,000 and $1,443,011 of the 1986 and 1989 loans,respectively, and the accumulated unpaid interest on those loans. The loan is payable in years 2015through 2025 from tax increment revenue. As of June 30, 2008 the outstanding balance of the loanwas $8,918,297.
The Low and Moderate Income Housing Fund advanced funds to the Redevelopment Agency DebtService Fund to fund redevelopment projects. The loan is payable from tax increment revenues. Asof June 30,2008 the outstanding balance of the loan was $3,976,517.
The Water Fund advanced funds to the Commission and the Sewer Enterprise Fund for operationalpurposes. As of June 30,2008 the outstanding balance of the loan was $4,936,023.
The General Fund advanced funds to the Special Aviation Enterprise Fund for operationalpurposes. As oOune 30, 2008 the outstanding balance of the loan was $249,122.
See independent auditors' report.- 62-
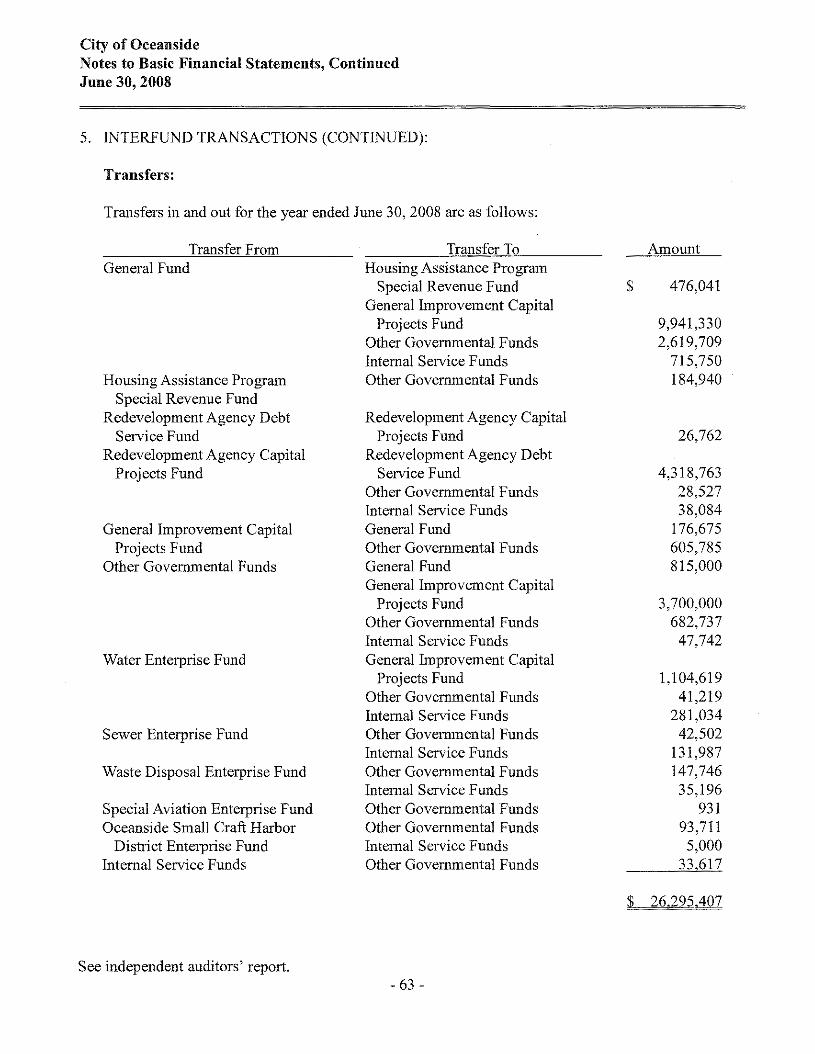
City of OceansideNotes to Basic Financial Statements, ContinuedJune 30, 2008
5. INTERFUND TRANSACTIONS (CONTINUED):
Transfers:
Transfers in and out for the year ended June 30, 2008 are as follows:
Transfer FromGeneral Fund
Housing Assistance ProgramSpecial Revenue Fund
Redevelopment Agency DebtService Fund
Redevelopment Agency CapitalProjects Fund
General Improvement CapitalProjects Fund
Other Governmental Funds
Water Enterprise Fund
Scwer Enterprise Fund
Waste Disposal Enterprise Fund
Special Aviation Enterprise FundOceanside Small Craft Harbor
District Enterprise FundInternal Service Funds
See independent auditors' report.
Transfer ToHousing Assistance Program
Special Revenue FundGeneral Improvement Capital
Projects FundOther Governmental FundsInternal Service FundsOther Governmental Funds
Redevelopment Agency CapitalProjects Fund
Redevelopment Agency DebtService Fund
Other Governmental FundsInternal Service FundsGeneral FundOther Governmental FundsGeneral FundGeneral Improvement Capital
Projects FundOther Governmental FundsInternal Service FundsGeneral Improvement Capital
Projects FundOther Governmental FundsInternal Service FundsOther Governmental FundsInternal Service FundsOther Governmental FundsInternal Service FundsOther Governmental FundsOther Governmental FundsInternal Service FundsOther Governmental Funds
- 63 -
Amount
$ 476,041
9,941,3302,619,709
715,750184,940
26,762
4,318,76328,52738,084
176,675605,785815,000
3,700,000682,737
47,742
1,104,61941,219
281,03442,502
131,987147,74635,196
93193,7115,000
33,617
L.26.295'A07

City of OceansideNotes to Basic Financial Statements, ContinnedJnne 30, 2008
5. INTERFUND TRANSACTIONS (CONTINUED):
Transfers (Continned):
The General Fund, Other Governmental Funds and the Water Enterprise Fund transferred$9,941,330, $3,700,000 and $1,104,619, respectively, to the General Improvement Capital ProjectsFund for capital improvement projects.
The Redevelopment Agency Debt Service Fund transferred $26,762 to the Redevelopment AgencyCapital Projects Fund for specific projects.
The Redevelopment Agency Capital Projects Fund transferred $4,318,763 to the RedevelopmentAgency Debt Service Fund for debt service payments.
6. CAPITALASSETS:
A summary of changes in the Governmental Activities capital assets at June 30, 2008 is as follows:
Balance at Balance atGovernmental Activities: July I, 2007 Additions Deletions June 30. 2008
Capital assets. not being depreciated:Land $ 57,843.987 $ $ $ 57,843,987Construction in progress 36.236,170 23.930,461 (16,1 00,952) 44,065,679
Total capital assets,not being depreciated 94,080,157 23,930,461 (16.100,952) 101,909.666
Capital assets, being depreciated:Buildings and structures 64,274,349 14,424,230 78,698,579Improvements other than buildings 8,652,043 8,652,043Machinery and equipment 52,735,271 4,569,863 (1,205,695) 56,099,439Infrastructure 264,985,092 18,088,295 283,073,387
Total capital assets,being depreciated 390,646.755 37,082,388 (1,205,695) 426,523 ,448
Less accumulated depreciation for:Buildings and structures (20,311,122) (1,648,051) (21,959,173)Improvements other than buildings (3,639,099) (375,967) (4,015,066)Machinery and equipment (33,080,285) (3,405,550) 1,184,695 (35,301,140)Infrastructure 028,703,660) (6,832,899) 035,536,559)
Total accumulated depreciation (]85,734.166) 02,262,467) 1,184,695 (] 96,811,938)
Total capital assets,being depreciated, net 204.912,589 24.819,921 (21,000) 229,711,510
Governmental activitiescapital assets, net $ 298,992,14§ ,$3s,15Q,382 $(lIi,J2L~2) ~__J3L621,17§
See independent auditors' report.- 64-
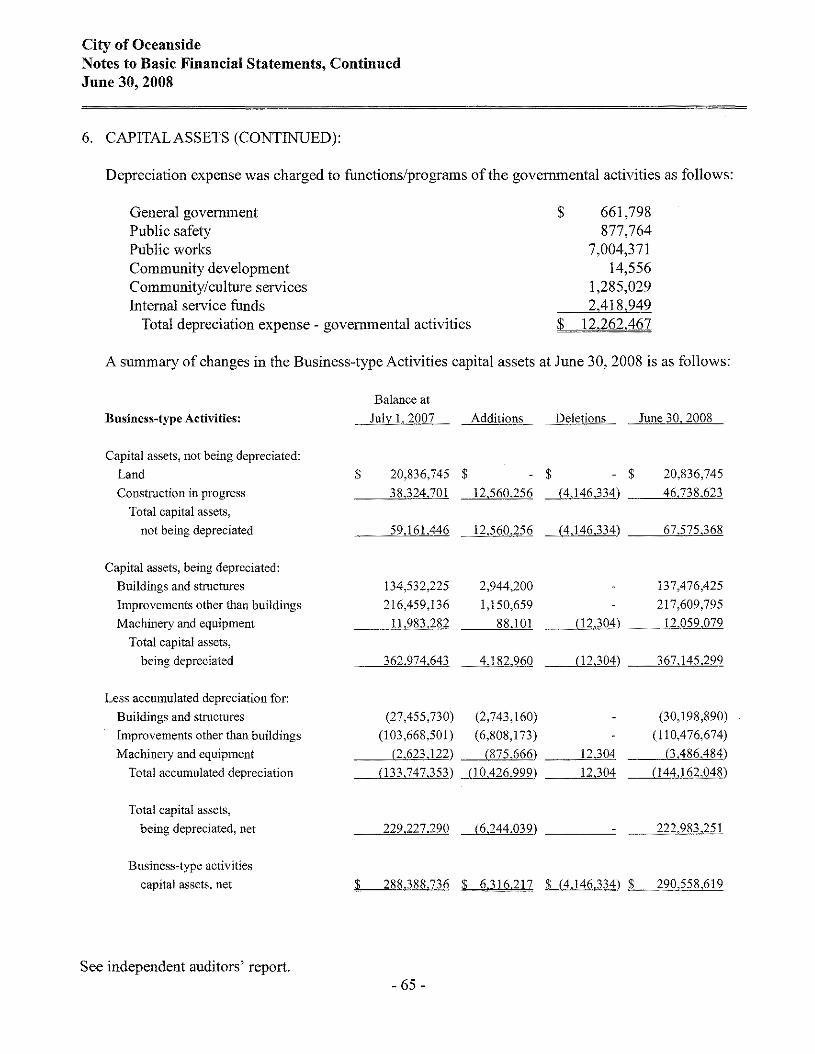
City of OceansideNotes to Basic Financial Statements, ContinuedJune 30, 2008
6. CAPITAL ASSETS (CONTINUED):
Depreciation expense was charged to functions/programs of the governmental activities as follows:
General governmentPublic safetyPublic worksCommunity developmentCommunity/culture servicesInternal service funds
Total depreciation expense - governmental activities
$ 661,798877,764
7,004,37114,556
1,285,0292,418,949
$ I2,262,4{1(
A summary of changes in the Business-type Activities capital assets at June 30, 2008 is as follows:
Business-type Activities:
Balance at
July I, 2007 Additions Deletions June 30. 2008
20,836,745 $38,324,701 12,560,256
Capital assets, not being depreciated:
Land
Construction in progress
Total capital assets,
not being depreciated
$
59,161.446 12,560,256
$ $ 20,836,745
(4,146,334) _----'4"-'6"".7232.08,,,,62,,,,3
(4,146,334) _---'6""7~,5'-'-7"_'5,,,,36'-28
Capital assets, being depreciated:
Bui]dings and structures
Improvements other than buildings
Machinery and equipment
Total capital assets,
being depreciated
]34,532,225 2,944,200 137,476,425
216,459,136 1,150,659 217,609,795
11,983,282 88.]01 (12,304) 12,059,079
362,974,643 4,182,960 (12,304) 367,145,299
Less accumulated depreciation for:
Buildings and structures
Improvements other than buildings
Machinery and equipment
Total accumulated depreciation
Total capital assets,
being depreciated, net
(27,455,730)
(103,668,501)
(2,623,122)
(133.747,353)
229,227,290
(2,743,]60)
(6,808,173)
(875,666) __",12=.3"0,,,-4
(10,426,999) _---'1""'2.""30""4
(6,244,039) _
(30,198,890)
(110,476,674)
(3,486,484)
(144.162,048)
222,983,25]
Business-type activities
capital assets, net
See independent auditors' report.
:L_2-S8,,18V3J~ ~ 6,Jb6 2) 7 $ (4,146.334) $ 22Q,?58.612
- 65-

City of OceansideNotes to Basic Financial Statements, ContinuedJune 30, 2008
6. CAPITAL ASSETS (CONTINUED):
Depreciation expense was charged to functions/programs of the business-type activities as follows:
WaterSewcrWaste disposalSpecial aviationOceanside Small Craft Harbor District
Total depreciation expcnse - business-type activities
7. LAND AND BUILDINGS HELD FOR RESALE:
$ 3,964,2675,638,359
34,01213,234
777,127
$ 10.426,999
Land and buildings held for resale are recorded in the Redevelopment Agency Capital ProjectsFund at the lower of cost or market, but not greater than net realizable value. The available fundbalance is reserved in amount equal to the carrying value of land and buildings held for resalebecause such assets are not available to finance current operations. The amount recorded as assetsheld for resale and the corresponding fund balance reserved as of June 30, 2008, was $9,492,993.
8. LONG-TERM LIABILITIES:
A. Governmental Activities Long-Term Debt:
The following is a summary of changes in governmental activities long-term debt for the yearended June 30, 2008:
Balance Balance Due Due in
July 1. June 30, Within More Than
2007 Additions Deletions 2008 One Year One Year
Bonds payable $ 56,950,000 $ $ (1.975.000) $ 54,975,000 $ 2,050,000 $ 52,925,000
Certificates of
participation 54,345,000 (2,810,000) 51,535.000 2,970,000 48,565,000
Capital leases
payable 1,914,195 (250,097) 1.664.098 259,857 1,404,241
Notes payable 640,000 3,500,000 (215,000) 3,925,000 215,000 3,710.000
Pension obligation
bonds 43,298,887 (591,644) 42,707,243 675.000 42,032,243
Claims payable 9.587,636 18,831 9,606,467 9.606,467
Compensated
absences 9,441,278 967,674 (129.550) 10,279,402 513,970 9.765,432
Total $ 176 176,996 $ ~486505 t.£..271 291) $ 17,\,g9,2,210 $ 6.~;\J>,2'1 $ 168 QQ!U83
See independent auditors' report.- 66-

City of OceansideNotes to Basic Financial Statements, ContinuedJune 30, 2008
8. LONG-TERM LIABILITIES (CONTINUED):
A. Governmental Activities Long-Tenn Debt (Continued):
Bonds Payable:
At June 30, 2008, bonds payable consisted of the following:
Balance Balance Due Due in
July 1, June 30, Within More Than
2007 Additions Deletions 2008 One Year One Year
2002 Tax Allocation
Refunding Bonds $ 20,085,000 $ $ (655,000) $ 19,430,000 $ 685,000 $ 18,745,000
2003 Tax Allocation
Refunding Bonds 6,495,000 (435,000) 6,060,000 450,000 5,610,000
Subordinate 2003
Tax Allocation
Bonds 17,510,000 (570,000) 16,940,000 595.000 16,345,000
2004 Tax Allocation
Refunding Bonds 12,860,000 (315,000) 12,545,000 320.000 12,225,000
Totals $ ,5.6~QJl0!l $ LLL9LiQOO) .L"~,2,25 000 $ 2,0~g,000 $ 5292S.QDQ
2002 Tax Allocation Refunding Bonds - Original Issue $22,030,000
The 2002 Tax Allocation Refunding Bonds were issued to finance the Commission's projects inthe Downtown Redevelopment Project pursuant to the Redevelopment Plan, to provide for fundreserves, and pay for the costs of the bond issuance.
The bonds mature annually through 2020, in amounts ranging from $685,000 to $1,240,000.Interest rates vary from 3.0% to a maximum of 5.5% and are payable semiannually onSeptember I and March I. The bonds can be redeemed prior to maturity if notice of suchredemption is mailed and. trustee is satisfied with such procedure. Bonds maturing beforeSeptember 1,2013, are not subject to redemption prior to maturity. Bonds maturing on or afterSeptember 1,2013, are subject to redemption in whole or in part on September 1, 2012, andeach interest date thereafter. At June 30, 2008, the outstanding balance of these bonds was$19,430,000.
See independent auditors' report.- 67-

City of OceansideNotes to Basic Financial Statements, ContinuedJune 30, 2008
8. LONG-TERM LIABILITIES (CONTINUED):
A. Governmental Activities Long-Tenn Debt (Continued):
Bonds Payable (Continued):
2002 Tax Allocation Refunding Bonds - Original Issue $22,030,000 (Continued)
The annual debt service requirements on these bonds are as follows:
Year EndingJune 30, Principal Interest Total
2009 $ 685,000 $ 1,033,088 $ 1,718,0882010 715,000 1,000,694 1,715,6942011 750,000 965,900 1,715,9002012 785,000 928,463 1,713,4632013 825,000 888,213 1,713,213
2014 - 2018 4,790,000 3,746,581 8,536,5812019 - 2023 6,225,000 2,258,419 8,483,4192024 - 2026 4,655,000 411,557 5,066,557
Totals ~ I9.430.000 $ . 11.232.915 $ .. 30,662,915
2003 Tax Allocation Refunding Bonds - Original Issue $7,740,000
The 2003 Tax Allocation Refunding Bonds were issued to defease the Commission'soutstanding $7,725,000 Downtown Redevelopment Project, 1993 Tax Allocation RefundingBonds, to acquirc a municipal bond issuance policy and to pay costs of issuance.
The bonds mature annually through 2019, in amounts ranging from $450,000 to $670,000.Interest rates vary from 2.0% to a maximum of 4.0% and are payable semiannually onSeptember I and March 1, The bonds can be redeemed prior to maturity if notice of suchredemption is mailed and trustee is satisfied with such procedure. Bonds maturing beforeSeptember 1, 2014, are not subject to redemption prior to maturity. Bonds maturing on or afterSeptember I, 2014, are subject to redemption in whole or in part on September I, 2013, andeach interest date thereafter. At June 30, 2008, the outstanding balance of these bonds was$6,060,000.
See independent auditors' report.- 68-

City of OceansideNotes to Basic Financial Statements, ContinnedJnne 30, 2008
8. LONG-TERM LIABILITIES (CONTINUED):
A. Governmental Activities Long-Tenn Debt (Continued):
Bonds Payable (Continued):
2003 Tax Allocation Refunding Bonds - Original Issue $7,740,000 (Continued)
The annual debt service requirements on these bonds are as follows:
Year EndingPrincipal Interest Total
2009 $ 450,000 $ 219,500 $ 669,5002010 460,000 205,850 665,8502011 485,000 189,250 674,2502012 505,000 169,450 674,4502013 525,000 148,850 673,850
2014 - 2018 2,965,000 430,975 3,395,9752019 670,000 13,400 683,400
Totals $ 6.060.QOO $ J,377.275 $ 7,437.275
Subordinate 2003 Tax Allocation Bonds - Original Issue $17,800,000
The Subordinate 2003 Tax Allocation Bonds were issued to finance the Commission'sundertakings in the Downtown Redevelopment Project pursuant to the Redevelopment Plan, tofund a reserve account, to pay costs of issuance and to fund capitalized interest on the2003 Escrow Tenn Bonds.
The bonds mature annually through 2026, in amounts ranging from $595,000 to $1,425,000.Interest rates vary from 2.0% to a maximum of 5.2% and are payable semiannually onSeptember I and March 1. The bonds can be redeemed prior to maturity if notice of suchredemption is mailed and trustee is satisfied with such procedure. Bonds maturing beforeSeptember 1, 2013, are not subject to redemption prior to maturity. Bonds maturing on or afterSeptember 1,2013, are subject to redemption in whole or in part on September 1, 2012, andeach interest date thereafter. At June 30, 2008, the outstanding balance of these bonds was$16,940,000.
See independent auditors' report.- 69-

City of OceansideNotes to Basic Financial Statements, ContinuedJnne 30, 2008
8. LONG-TERM LIABILITIES (CONTINUED):
A. Governmental Activities Long-Term Debt (Continued):
Bonds Payable (Continued):
Subordinate 2003 Tax Allocation Bonds - Original Issue $17,800,000 (Continued)
The annual debt service requirements on these bonds are as follows:
Year EndingJune 30, Principal Interest
2009 $ 595,000 $ 894,939 $ 1,489,9392010 620,000 865,505 1,485,5052011 655,000 834,350 1,489,3502012 685,000 801,220 1,486,2202013 720,000 766,058 1,486,058
2014-2018 4,180,000 3,229,326 7,409,3262019 - 2023 5,435,000 1,945,601 7,380,6012024 - 2026 4,050,000 352,676 4,402,676
Totals $ 16,940.000 $ 9.689.675 $ 2M22,6}5
2004 Tax Allocation Refunding Bonds - Original Issue $13,510,000
The 2004 Tax Allocation Refunding Bonds were issued to defease the Commission'soutstanding $14,935,000 Downtown Redevelopment Project, 1994 Tax Allocation RefundingBonds outstanding, to acquire a municipal bond issuance policy and to pay costs of issuance.
The bonds mature annually through 2024, in amounts ranging from $320,000 to $1,550,000.Interest rates vary from 2.5% to a maximum of 4.5% and are payable semiannually on March Iand September I, commencing March 1,2005. The bonds can be redeemed prior to maturity ifnotice of such redemption is mailed and trustee is satisfied with such procedure. Bondsmaturing before September I, 2015, are not subject to redemption prior to maturity. Bondsmaturing on or after September I, 2015, are subject to redemption in whole or in part onSeptember I, 2014, and each interest date thereafter. At June 30, 2008, the outstanding balanceof these bonds was $12,545,000.
See independent auditors' report.- 70-

City of OceansideNotes to Basic Financial Statements, ContinuedJune 30, 2008
8. LONG-TERM LIABILITIES (CONTINUED):
A. Governmental Activities Long-Tenn Debt (Continued):
Bonds Payable (Continued):
2004 Tax Allocation Refunding Bonds - Original Issue $13,510,000 (Continued)
The annual debt service requirements on these bonds are as follows:
Year EndingJune 30, Principal Interest Total
2009 $ 320,000 $ 528,954 $ 848,9542010 340,000 517,354 857,3542011 340,000 503,754 843,7542012 355,000 489,854 844,8542013 370,000 476,279 846,279
2014 - 2018 2,000,000 2,158,437 4,158,4372019 - 2023 5,785,000 1,416,313 7,201,3132024 - 2025 3,035,000 138,037 3,1 73,037
Totals :L. )2.545.000 $ 6.228.982 $ 18.773.982
Certificates of Participation:
At June 30, 2008, certificates ofparticipation (COP) payable consisted of the following:
Balance Balance Due Due in
July 1, June 30, Within More Than
2007 Additions Deletions 2008 One Year One Year
1995 Refunding COP $ 4,055,000 $ $ (1,275,000) $ 2,780,000 $ 1,350,000 $ 1,430,000
1998 COP 9,020,000 (325,000) 8,695,000 350,000 8,345,000
2003 COP 21,225,000 (l,080,OOO) 20,145,000 1,135,000 19,010,000
2005 Refunding COP 20,045.000 mo.OOO) 19,915,000 135,000 19.780,000
Totals L~.llQQ $ (2.810.000) $.. 51 535000 $ 29700QQ ~. 485!25.QQil
See independent auditors' report,- 71 -

City of OceansideNotes to Basic Financial Statements, ContinuedJune 30, 2008
8. LONG-TERM LIABILITIES (CONTINUED):
A. Governmental Activities Long-Term Debt (Continued):
Certificates of Participation (Continued):
1995 Refunding Certificates of Participation - Original Issue $34,300,000
The 1995 Refunding Certificates of Participation were issued by the Commission to refund the1991 Refunding Certificates of Participation, which was used for the City's Civic CenterProject. The certificates consist of serial certificates in the amount of $14,555,000 due inannual installments of $1 ,350,000 to $1,430,000. Interest rates range from 4.0% to 6.07% andare payable semiannually on February 1 and August 1. Certificates maturing beforeAugust 1, 2015, are not subject to redemption prior to maturity. Certificates maturing on orafter August 1,2015, are subject to redemption prior to maturity on August 1,2005, and eachinterest payment date thereafter. At June 30, 2007, a certificate was partially defeased by the2005 Refunding Certificates of Participation and the outstanding balance of the1995 Certificates was $2,780,000.
The annual debt service requirements on these certificates are as follows:
Year EndingJune 30, Principal Interest Total
2009 $ 1,350,000 $ 119,150 $ 1,469,1502010 1,430,000 39,325 1,469,325
Totals $ 2,7-80,000 $ 15M75. $..... 2,938.475
1998 Certificates of Participation - Original Issue $10,750,000
The 1998 Certificates of Participation were issued by the Building Authority for the purpose ofreimbursing the City for costs of acquisition of certain real property and improvements to beused as police and library facilities. The certificates are due in annual installments of$350,000to $875,000 through 2022. Interest rates range from 4.5% to 5.2% and are payablesemiannually on June 1 and December 1. Certificates maturing on or after December 1, 2008,are subject to redemption in whole or in part on December 1, 2007, and each interest datethereafter. At June 30, 2008, the outstanding balance of these certificates was $8,695,000.
See independent auditors' report.- 72-

City of OceansideNotes to Basic Financial Statements, ContinuedJune 30, 2008
8. LONG-TERM LIABILITIES (CONTINUED):
A. Governmental Activities Long-Tenn Debt (Continued):
Certificates of Participatiou (Continued):
1998 Certificates of Participation - Original Issue $10,750,000 (Continued)
The annual debt service requirements on these certificates are as follows:
Year EndingJune 30, Principal Interest Total
2009 $ 350,000 $ 431,025 $ 781,0252010 375,000 413,988 788,9882011 400,000 395,775 795,7752012 430,000 376,055 806,0552013 460,000 354,465 814,465
2014-2018 2,810,000 1,380,358 4,190,3582019 - 2023 3,870,000 528.150 4,398.150
Totals $ 8,695,000 $. 3,879,816 L 12,574,816
2003 Certificates of Participation - Original Issue $25.185,000
The 2003 Certificates of Participation were issued by the Financing Authority to refinance$24,510,000 outstanding 1993 Series A Refunding Certificates of Participation. The City hasentered into an agreement with the Financing Authority to lease certain facilities and projectsfrom the Financing Authority at an amount necessary to meet the annual debt service andrelated costs.
The certificates are due in annual installments of $1,135,000 to $1,770,000 through 2023.Interest rates range from 4.5% to 5.2% and are payable semiannually on September 15 andMarch 15. Certificates maturing before April I, 2013,are not subject to redemption prior tomaturity. Certificates maturing on or after April 1,2013, are subject to redemption in whole orin part on April 1, 2012, and each interest date thereafter. At June 30, 2008, the outstandingbalance of these certificates was $20,145,000.
See independent auditors' report.- 73 -

City of OceansideNotes to Basic Financial Statements, ContinnedJnne 30, 2008
8. LONG-TERM LIABILITIES (CONTINUED):
A. Governmental Activities Long-Tenn Debt (Continued):
Certificates of Participation (Continued):
2003 Certificates of Participation - Originallssue $25,185,000 (Continued)
The annual debt service requirements on these certificates are as follows:
Year EndingJune 30,
2009201020 II20122013
2014 - 20182019 - 2023
Totals
Principal$ 1,135,000
1,185,0001,245,0001,310,0001,375,0008,015,0005,880,000
$ 20,145,000
Interest$ 1,039,853
983,103923,853861,603796,103
2,837,712875,965
$ 8.318,192
Total$ 2,174,853
2,168,1032,168,8532,171,6032,171,103
10,852,7126,755,965
~.. 28.463,192
2005 Refunding Certificates of Participation - Original Issue $20,170,000
The 2005 Refunding Certificates of Participation were issued by the Commission to partiallyrefund the 1995 Refunding Certificates of Participation, which was used for the City's CivicCenter Project and to pay the costs of issuance. The certificates consist of serial certificates inthe amount of $20,170,000 due in annual installments of $135,000 to $2,350,000. Interest ratesrange from 3% to 5% and are payable semiannually on February I and August 1. Certificatesmaturing before August 1,2016, are not subject to redemption prior to maturity. Certificatesmaturing on or after August I, 2016, are subject to redemption in whole or in part onAugust I, 2015, and each interest date thereafter. At June 30, 2008, the outstanding balance ofthese certificates was $19,915,000.
The annual debt service requirements on these certificates are as follows:
Year EndingJune 30,
2009201020 II20122013
2014 - 20182019 - 2020
Totals
See independent auditors' report.
Principal$ 135,000
135,0001,650,0001,705,0001,765,0009,940,0004,585,000
L 19.915~OOQ
- 74-
Interest$ 799,288
795,238768,463716,006653,000
2,157,126232,124
L 6,121.245
Total$ 934,288
930,2382,418,4632,421,0062,418,000
12,097,1264,817,124
$ .26,036,245

City of OceansideNotes to Basic Financial Statements, ContinuedJune 30, 2008
8. LONG-TERM LIABILITIES (CONTINUED):
A. Governmental Activities Long-Term Debt (Continued):
Capital Lease Obligations:
At June 30, 2008, capital lease obligations payable consisted of the following:
Balance Balance Due Due in
July 1. June 30, Within More Than
2007 Additions Deletions 2008 One Year One Year
2004 Streetlight
Lease/Purchase
Agreement $ 1.706,657 $ - $ (184,192) $ 1,522,465 $ 190,728 $ 1,331,737
2005 Vactor Truck
Lease 207,538 (65,905) 141,633 69,129 72,504
Totals $ I 914,195 $ $-illll~) :L 1,66~ 098 $ 259857 $ 1.404241
The gross amount of assets acquired under capital leases is $2,411,009 and is classified asmachinery and equipment within capital assets. The amortization of the leased assets isincluded as part of depreciation expense.
2004 Streetlight Lease/Purchase Agreement
On October I, 2004, the Authority entered into a lease/purchase agreement with Zion FirstNational Bank in the amount of $2,064,583 for the streetlight improvement and appurtenancecurrently existing upon public streets and right of way within the boundaries of the City ofOceanside. The lease is due in annual installments of $190,728 to $246,772. The lease bearsan interest rate of 4.2% and is payable semiannually on March 1 and September 1. AtJune 30,2008, the outstanding balance ofthis lease was $1,522,465.
The future minimum lease payments are as follows:
Year EndingJune 30, Principal Interest
2009 $ 190,728 $ 59,9382010 201,713 51,6972011 206,985 43,1152012 216,608 34,2192013 225,631 24,932
2014-2015 480,800
Totals $.. 1.522.465 ~. 234,362
See independent auditors' report.- 75-
Total$ 250,666
253,410250,100250,827250,563501.261
$ 1.756,827

City of OceansideNotes to Basic Financial Statements, ContinnedJune 30, 2008
8. LONG-TERM LIABILITIES (CONTINUED):
A. Governmental Activities Long-Tenn Debt (Continued):
Capital Lease Obligations (Continued):
2005 Vactor Truck Lease
On May 16, 2006, the City entered into a lease/purchase agreement with VactorManufacturing, Inc. for the Vactor Sewer Cleaner Truck. The lease is due in annualinstallments of $76,054, commencing on May 17, 2006. The lease bears an interest rate of4.89% and is payable annually. At June 30, 2008, the outstanding balance of this lease was$141,633.
The future minimum lease payments are as follows:
Year EndingJune 30,
20092010
SubtotalLess interest portion
Totals
Notes Payable:
AnnualPayment
$ 76,054
152,108(10,475)
$ 141.633
At June 30, 2008, notes payable consisted of the following:
Balance Balance
July 1, June 30.
2007 Additions Deletions 2008
HUD 108 Loans $ 640,000 $ $ (215,000) $ 425,000
HUD 108 Loans 3500.000 3.500.000
$ 640000 $ _. 3 5.ill).Oilll .L {215000) $ 3,925JlOQ
Due Due in
Within More Than
One Year One Year
$ 215,000 $ 210,000
3.500,000
$ 215000 L :4110000
HUD 108 Loans - Original Issue $1.500,000
In July 2001, the City entered into a contract with the U.S. Department of Housing and UrbanDevelopment for the Loan Guarantee Assistance under Section 108 of the Housing andCommunity Development Act of 1974, as amended, 42 U.S.C. Section 5308 for Series HUD2002-A Certificates. The loans are due in annual installments of $215,000. Interest rates varyfrom 3.15% to 4.43% and are payable on February 1 and August 1. At June 30, 2008, theoutstanding balance of the loans was $425,000.
See independent auditors' report.- 76-
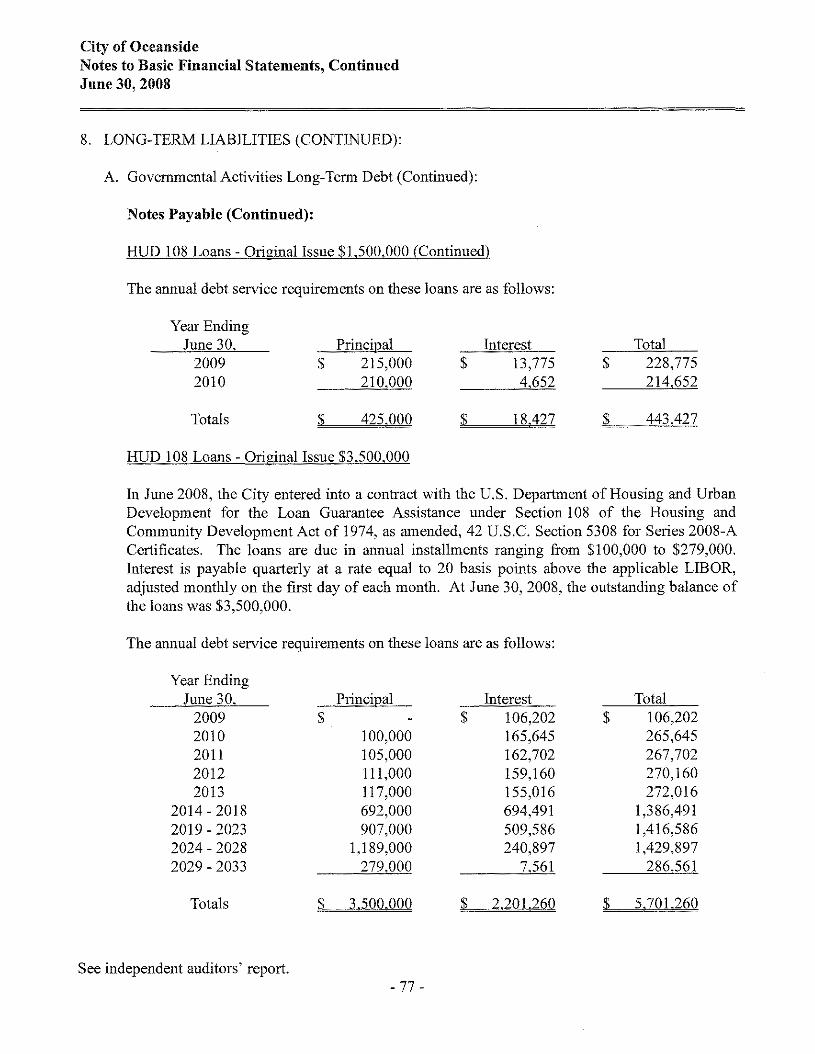
City of OceansideNotes to Basic Financial Statements, ContinnedJnne 30, 2008
8. LONG-TERM LIABILITIES (CONTINUED):
A. Governmental Activities Long-Term Debt (Continued):
Notes Payable (Continued):
HUD 108 Loans - Original Issue $1,500,000 (Continued)
The annual debt service requirements on these loans are as follows:
Year EndingJune 30, Principal Interest
2009 $ 215,000 $ 13,7752010 210,000 4,652
Totals $ 425.,000 $ 18,427
Total$ 228,775
214,652
.$ 443,427
HUD 108 Loans - Original Issue $3,500,000
In June 2008, the City entered into a contract with the U.S. Department of Housing and UrbanDevelopment for the Loan Guarantee Assistance uuder Section 108 of the Housing andCommunity Development Act of 1974, as amended, 42 U.S.C. Section 5308 for Series 2008-ACertificates. The loans are due in annual installments ranging from 8100,000 to 8279,000.Interest is payable quarterly at a rate equal to 20 basis points above the applicable LIBOR,adjusted monthly on the first day of each month. At June 30, 2008, the outstanding balance ofthe loans was 83,500,000.
The annual debt service requirements on these loans are as follows:
Year EndingJune 30, Principal Interest Total
2009 $ $ 106,202 8 106,2022010 100,000 165,645 265,6452011 105,000 162,702 267,7022012 111,000 159,160 270,1602013 117,000 155,016 272,016
2014 - 2018 692,000 694,491 1,386,4912019 - 2023 907,000 509,586 1,416,5862024 - 2028 1,189,000 240,897 1,429,8972029 - 2033 279,000 286,561
Totals ~3,500,000 L 2.201,,260 $ 5,~()L260
See independent auditors' report.- 77-

City of OceansideNotes to Basic Financial Statements, ContinuedJune 30, 2008
8. LONG-TERM LIABILITIES (CONTINUED):
A. Governmental Activities Long-Tenn Debt (Continued):
Pension Obligation Bonds:
At June 30, 2008, pension obligation bonds consisted of the following:
Balance Balance Due Due in
July 1, June 30, Within More Than
2007 Additions Deletions 2008 One Year One Year
2005 Taxable Pension
Obligation Bonds $ 42,365,000 $ $ (540,000) $ 41,825,000 $ 675,000 $ 41,150,000
Bond premium 933.887 (51,644) 882.243 882,143
Totals $ 43,298887 $ .1591 644) LA2.lllL243 $ fiI5.00Q $ 42032241
2005 Taxable Pension Obligation Bonds - Original Issuance $42,780,000
On August I, 2005, the City issued $42,780,000 Taxable Pension Obligation Bonds,Series 2005 for the purpose of paying the City's currently, unamortized, unfunded accruedactuarial liability to the California Public Employees' Retirement System (CaIPERS) for thebenefit of the City's employees. The bonds are due in annual installments of $675,000 toS4,975,000. Interest rates range from 4.17% to 5.25% and are payable semiannually onFebruary 15 and August 15. At June 30, 2008, the outstanding balance of the bonds was$41,825,000.
The annual debt service requirements on these bonds are as follows:
Year Ending
20092010201120122013
2014-20182019 - 20232024 - 2026
SubtotalAdd: Bond premium
Totals
See independent auditors' report.
Principal$ 675,000
825,000980,000
1,150,0001,335,0007,470,000
15,455,00013,935,00041,825,000
882,243
$ 42J07,243
- 78 -
Interest$ 2,124,691
2,090,4612,048,7011,998,9491,940,4756,968,7855,902,6831,187.026
24,261,771
$ 24.261.771
Total$ 2,799,691
2,915,4613,028,7013,148,9493,275,475
14,438,78521,357,68315,122,02666,086,771
882,243
$ 66.969.014

City of OceansideNotes to Basic Financial Statements, ContinuedJune 30, 2008
8. LONG-TERM LIABILITIES (CONTINUED):
A. Governmental Activities Long-Tenn Debt (Continued):
Claims Payable:
Claims payable have been accrued. Amounts detennined to be debts of either the business-typeand/or the proprietary funds have been recorded as liabilities in those funds. There is no fixedpayment schedule to pay these liabilities. Total amount of claims payable for the governmentalactivities at June 30, 2008, was $9,606,467.
Compensated Absences:
The City's liability for vested and unpaid compensated absences (accrued vacation and sickpay) in the governmental activities has been accrued and amounts to $10,279,402 atJune 30, 2008. The general fund typically has been used in prior years to liquidate the liabilityfor governmental compensated absences.
B. Business-Type and Proprietary Funds Long-Tenn Debt:
The following is a summary of changes in business-type and proprietary funds activitieslong-tenn debt for the year ended June 30, 2008:
Balance Balance Due Due in
July 1, June 30, Within More Than
2007 Additions Deletions 2008 One Year One Year
Bonds payable $ 8.525,000 $ $ (620,000) $ 7,905,000 $ 640,000 $ 7,265,000
Certificates of
participation 21,215.000 (1,880,000) 19,335,000 1,950.000 17,385,000
Notes payable 72,654,206 (3,445,744) 69,208,462 3,531,899 65,676,563
Compensated
absences 2.190,580 264.712 o l.l 63) 2,444.129 122,206 2,321,923
Total $ 104.?~8Q L~~~Q4.m $ 0,226,2Q7) $ 98892591 t 6244105 $ 92Q48486
See independent auditors' report.- 79-

City of OceansideNotes to Basic Financial Statements, ContinnedJune 30, 2008
8. LONG-TERM LIABILITIES (CONTINUED):
B. Business-Type and Proprietary Funds Long-Term Debt (Continued):
Bonds Payable:
At June 30, 2008, bonds payable consisted of the following:
Balance Balance Due Due in
July I. June 30. Within More Than
2007 Additions Deletions 2008 One Year One Year
1998 Water Revenue
Refunding Bonds $ 8525 000 $ $ (620000) $_e~9ll5±QQQ $ 640000 $ 7265000.
1998 Water Revenue Refunding Bonds - Original Issue $11,445,000
The bonds were issued to refund a portion of the outstanding 1992 Series A Certificates ofParticipation, which were originally used to finance the acquisition, expansion, constructionand improvement of certain water facilities within the City. The bonds are due in annualinstallments of $640,000 to $965,000 through 2017. Interest rates range from 3.5% to 5.0%and are payable semiannually on April I and October 1. Bonds maturing beforeOctober I, 2008, are not subject to redemption prior to maturity. Bonds maturing on or afterOctober 1,2008, are subject to redemption in whole or in part on October I, 2007, and eachinterest date thereafter. At June 30, 2008, the outstanding balance of these bonds was$7,905,000.
The annual debt service requirements on thesc bonds are as follows:
Year EndingJune 30, Principal Interest
2009 $ 640,000 $ 360,279 $ 1,000,2792010 670,000 331,779 1,001,7792011 705,000 301,176 1,006,1762012 725,000 268,548 993,5482013 765,000 233,805 998,805
2014 - 2018 4,400,000 4,964,771
Totals $ 1905,QOO $ 2,060,358 $ 9,9654 35£
See independent auditors' report.- 80-

City of OceansideNotes to Basic Financial Statements, ContinnedJune 30, 2008
8. LONG-TERM LIABILITIES (CONTINUED):
B. Business-Type and Proprietary Funds Long-Term Debt (Continued):
Certificates of Participation:
At June 30, 2008, certificates ofparticipation (COP) payable consisted of the following:
9,130,000
• $ (1,375,000) S 10,610,000 S 1,430,000 $ 9,180,000
Balance
July 1,
2007
Revenue COP (1993
Water System
Refunding Project)
Series 2003 $ 11,985,000 $
Revenue COP (1993
Wastewater System
Refunding Project)
Series 2003
Additions Deletions
(505,000)
Balance
June 30,
2008
8,725,000
Due
Within
One Year
520.000
Due in
More Than
One Year
8,205,000
Totals $~(1 880 Qoo) S...J2:J?2 OOQ $.-1 95..QJlQQ $ 17 385 000
Revenue Certificates of Participation 0993 Water System Refunding Project) Series 2003 Original Issue $15.855,000
The 2003 Revenue Certificates of Participation were issued by the Oceanside Public FinancingAuthority (the Authority) to refinance $14,835,000 outstanding 1993 Water System RefundingPlan Certificates of Participation. The City has entered into an installment sale agreement withthe Authority which provides for the payment by the City from the pledged revenues derivedfrom the operation of the water system equivalent to the principal and interest on thecertificates and related costs. Annual payments of $540,000 to $1,430,000 will be madethrough August 1, 2021; interest ranges from 2.00% to 4.13%. Certificates maturing beforeAugust 1,2014, are not subject to redemption prior to maturity. Certificates maturing on orafter August 1, 2014, are subject to redemption in whole or in part on August 1, 2013, and eachinterest date thereafter. At June 30, 2008 the outstanding balance of these certificates was$10,610,000.
See independent auditors' report.- 81 -

City of OceansideNotes to Basic Financial Statements, ContinuedJune 30, 2008
8. LONG-TERM LIABILITiES (CONTINUED):
B. Business-Type and Proprietary Funds Long-Tenn Debt (Continued):
Certificates of Participation (Continued):
Revenue Certificates of Participation (1993 Water System Refunding Project) Series 2003 Original Issue S15,855,000 (Continued)
The annual debt service requirements on these certificates are as follows:
Year EndingJune 30, Principal Interest Total
2009 $ 1,430,000 $ 357,263 $ 1,787,2632010 1,015,000 313,438 1,328,4382011 1,045,000 282,538 1,327,5382012 540,000 258,762 798,7622013 560,000 241,913 801,913
2014 - 2018 3,095,000 903,369 3,998,3692019 - 2022 2,925,000 245,419 3,170,419
Totals LJjl,6LO.000 $ __ 2,602.702 $ 13.212.702
Revenue Certificates of Participation (1993 Wastewater System Refunding Project)Series 2003 - Original Issue $11,080,000
The 2003 Revenue Certificates of Participation were issued by the Oceanside Public FinancingAuthority (the Authority) to refinance $10,960,000 outstanding 1993 Wastewater SystemRefunding Plan Certificates of Participation. The City has entered into an installment saleagreement with the Authority which provides for the payment by the City from the pledgedrevenues derived from the operation of the sewer system equivalent to the principal and intereston the certificates and related costs. Annual payments of $520,000 to $865,000 will be madethrough May 1, 2021; interest ranges from 2.25% to 5.00%. Certificates maturing beforeMay 1, 2014, are not subject to redemption prior to maturity. Certificates maturing on or afterMay 1, 2014, are subject to redemption in whole or in part on May 1, 2013, and each interestdate thereafter. At June 30, 2008 the outstanding balance of these certificates was $8,725,000.
See independent auditors' report.- 82-

City of OceansideNotes to Basic Financial Statements, ContinuedJune 30, 2008
8. LONG-TERM LIABILITIES (CONTINUED):
B. Business-Type and Proprietary Funds Long-Tenn Debt (Continued):
Certificates of Participation (Continued):
Revenue Certificates of Participation (1993 Wastewater System Refunding Project)Series 2003 - Original Issue $11,080,000 (Continued)
The annual debt service requirements on these certificates are as follows:
Year EndingJune 30, Principal Interest Total
2009 $ 520,000 $ 385,750 $ 905,7502010 540,000 367,550 907,5502011 565,000 345,950 910,9502012 585,000 323,350 908,3502013 605,000 299,950 904,950
2014 - 2018 3,435,000 1,108,050 4,543,0502019 - 2021 2,475,000 251,500 2,726,500
Totals :to 8,725,00Q L-3,,082.100 :t 11,807,100
Notes Payable:
At June 30, 2008, notes payable consisted of the following:
Balance Balance Due Due in
July 1, June 30, Within More Than
2007 Additions Deletions 2008 One Year One Year
State revolving loan $ 46,725.979 $ $ (2,083,923) $ 44,642,056 $ 2,121,495 $ 42,520,561
State Water Resources
Control Board 5,197,194 (517,866) 4,679,328 531,849 4,147,479
Department of
Boating and
Waterways 3,795,589 (240,509) 3,555,080 251,333 3,303,747
Department of
Transportation 740,444 (43,446) 696,998 47,222 649,776
1998 Wateruse
Purchase Contract 16,195,000 (560,000) 15.635,000 580,000 15,055,000
Totals ~65.4.2Q6 $ 1344.5 744) $ 692.0~ $ 3531 B92 ~ ..{i5 676 563
See independent auditors' report.- 83 -

City of OceansideNotes to Basic Financial Statements, ContinuedJune 30, 2008
8. LONG-TERM LIABILITIES (CONTINUED):
B. Business-Type and Proprietary Funds Long-Term Debt (Continued):
Notes Payable (Continued):
State Revolving Loan Regarding the State Water Resources Control Board Loan for the SanLuis Rev Wastewater Treatment Plan Interim Expansion - Original Issue $35,074,673
This loan is a State Revolving Loan Fund Program contract between the State Water ResourcesControl Board and the City with a maximum loan amount of $60,000,000 to fund the San LuisRey Wastewater Treatment Plant generally consisting of upgrades to control odors and improveprocess performance. The loan is due in installments of $2,926,391 commencing inJanuary 2007 through 2026. The interest rate is 1.803% payable annually on January 26. AtJune 30, 2008, the outstanding balance of these notes was $44,642,056.
The annual debt service requirements on this loan are as follows:
Year EndingJune 30, Principal Interest Total
2009 $ 2,121,495 $ 804,896 $ 2,926,3912010 2,159,746 766,645 2,926,3912011 2,198,686 727,705 2,926,3912012 2,238,328 688,063 2,926,3912013 2,278,685 647,706 2,926,391
2014 - 2018 12,024,715 2,607,242 14,631,9572019 - 2023 13,148,544 1,483,414 14,631,9582024 - 2026 8,471,857 307,315 8,779,172
Totals ~ 44.642,056 $ 8.032.986 $ 52.675.042
State Water Resources Control Board - Original Issue $9,204,539
This loan is a State Revolving Loan Fund Program contract between the State Water ResourcesControl Board and the City with a maximum loan amount of $9,861,068 to fund the San LuisRey Wastewater Treatment Plant generally consisting of upgrades to control odors and improveprocess performance. The loan is due in installments of $531,849 to $658,191 through 2015.The interest rate is 2.7% payable annually on November I. At June 30, 2008, the outstandingbalance of this note was $4,679,328.
See independent auditors' report.- 84-

City of OceansideNotes to Basic Financial Statements, ContinuedJuue 30, 2008
8. LONG-TERM LIABILITIES (CONTINUED):
B. Business-Type and Proprietary Funds Long-Tenn Debt (Continued):
Notes Payable (Continued):
State Water Resources Control Board - Original Issue $9,204,539 (Continued)
The annual debt service requirements on this note are as follows:
Year EndingJune 30, Principal Interest Total
2009 $ 531,849 $ 126,342 $ 658,1912010 546,209 111,982 658,1912011 560,956 97,235 658,1912012 576,103 82,088 658,1912013 591,657 66,534 658,191
2014 - 2016 1,872,554 102,015 1,974,569
Totals ~. 4,679.3;!8 $ 586.196 L 5,265,524
Department of Boating and Waterways
At June 30, 2008, the Department of Boating and Waterways loans payable consisted of thefollowing:
Balance Balance Due Due in
July I, June 30, Within More Than
2007 Additions Deletions 2008 One Year One Year
1984 loan payable $ 468,764 $ $ (43,396) $ 425,368 $ 45,349 $ 380,019
1986 loan payable 1,968,286 (142,205) 1,826,081 148,604 1,677,477
1994 loan payable 1,358,539 (54,908) 1,303,631 57,380 1,246.251
Totals ~79.i,5M $ $ .124050.2) $ 3555080 L._;l51,:l]1 :L..3.303 747
These loans werc issued as follows: (1) the 1984 loan payable is due in annual installments of$64,490 through 2015, including interest of 4.5% per annum, (2) the 1986 loan payable is duein annual installments of $230,778 through 2017, including interest of 4.5% per annum, and(3) the 1994 loan payable is due in annual installments of $116,043 through 2023, includinginterest of 4.5% per annum.
See independent auditors' report.- 85 -

City of OceansideNotes to Basic Financial Statements, ContinuedJune 30, 2008
8. LONG-TERM LIABILITIES (CONTINUED):
B. Business-Type and Proprietary Funds Long-Term Debt (Continued):
Notes Payable (Continued):
Department of Boating and Waterways (Continued)
The annual debt service requirements on this agreement are as follows:
Year EndingJune 30, Principal Interest
2009 $ 251,333 $ 159,978 $ 411,3112010 262,643 148,668 411 ,3112011 274,461 136,850 411,3112012 286,812 124,499 411,3112013 299,719 111,592 411,311
2014-2018 1,581,577 345,998 1,927,5752019 - 2023 487,490 92,726 580,216
2024 111,045 5,000 116,045Totals ~3",55.~080 $ 1,125.311 .L 4,,6.80,391
Department of Transportation - Original Issue $850,000
On June 9, 2003, the City entered into a California Airport Loan Agreement with the CaliforniaDepartment of Transportation for the purpose of planning, acquisition, construction,improvement, maintenance or operation of the airport located in the City of Oceanside. Theinterest on the agreement is 5.0569%; annual principal payments range from $47,222 to$81,222 through 2020. At June 30, 2008, the outstanding balance of this note was $696,998.
The annual debt service requirements on this agreement are as follows:
Year EndingJune 30, Principal Interest
2009 $ 47,222 $ 35,2472010 51,000 32,8592011 54,778 30,2802012 58,556 27,5102013 62,333 24,547
2014 - 2018 368,333 71,6392019 - 2020 2,770
Totals $. 696,998 $. 224,852
Total$ 82,469
83,85985,05886,06686,880
439,97257,546
$ 921,850
See independent auditors' report.- 86-

City of OceansideNotes to Basic Financial Statements, ContinnedJnne 30, 2008
8. LONG-TERM LIABILITIES (CONTINUED):
B. Business-Type and Proprietary Funds Long-Term Debt (Continued):
Notes Payable (Continued):
1998 Wateruse Finance Authority Installment Purchase Contract - Original Issue $55,785,000
This installment purchase contract was issued to finance the acquisition, construction andexpansion of the City's San Luis Rey Wastewater Treatment Facility. The interest on thepurchase contract is variable; annual principal payments range from $580,000 to $1,005,000through 2028. At June 30, 2008, the outstanding balance of this note was $15,635,000.
The annual debt service requirements on this purchase contract (assuming 1.32% interest) areas follows:
Year EndingJune 30,
20092010201120122013
2014 - 20182019 - 20232024 - 2028
Totals
Compensated Absenees:
Principal$ 580,000
595,000615,000630,000655,000
3,590,0004,185,0004,785,000
$ 1~&l5,QQO
Interest$ 206,382
198,726190,872182,754174,438737,154484,836190,806
~2.365.2.68.
Total$ 786,382
793,726805,872812,754829,438
4,327,1544,669,8364,975,806
t . 18.000.968
In proprietary funds, the liability for vested and unpaid compensated absences (accruedvacation and sick pay) is reported in the fund as the benefits vest and are earned. AtJune 30, 2008, compensated absences in the proprietary funds were as follows:
Business-Type Activities:WaterSewerWaste DisposalSpecial AviationOceanside Small Craft
Harbor DistrictTotals
Balance at Balance atJuly 1, 2007 Additions Deletions June 30, 2008
$ 747,939 $ 104,160 $ (939) $ 851,160894,434 93,162 (2,899) 984,697146,603 9,949 156,55238,066 11 ,826 (975) 48,917
363,538 45,615 (6,350) 402,8031.__ 1JJlO,:;80 $ 264712 $ flL163) $ 2.444.129
See independent auditors' report.- 87-

City of OceansideNotes to Basic Financial Statements, ContinuedJune 30, 2008
8. LONG-TERM LIABILITIES (CONTINUED):
C. Debt Without City Commitment - Mortgage Revenue Bonds and Special District Bonds:
The following Mortgage Revenue and Special District Bonds bearing the City's name wereissued to finance various projects; however, neither the faith and credit nor the general taxingpower of the City or Commission have been pledged to the payment of the bonds. Furthermore,neither the City nor the Commission has any obligation for the payment of the bonds in thecase of default. Therefore, none of the following obligations were included in theaccompanying basic financial statements.
Issuing Amount Balance at
Agency Date ofIssue of Issue June 30. 2008
City of Oceanside Assessment
District No. 4-1998
(Mission Square) City of Oceanside May 1, 1994 320,830 $ 120,000
1990 Residential Mortgage
Revenue Bonds City of Oceanside July 1, 1990 21,000,000 14,570,000
1994 Multi-Family Housing
Revenue Refunding Bonds
Lakeridge City of Oceanside December 1, 1994 43,240,000 43,240,000
1996 Multi-Family Housing
Revenue Bonds City ofOceanside December 1, 1996 29,430,000 28,999,166
2001 Multi-Family Rental
Housing Refunding Revenue
Bonds Vista Del Oro City ofOceanside Marcb 1,2001 13,325,000 13,325,000
2002 Multi-Family Housing
Revenue Bonds Vintage Point 11
Senior Apartments City of Oceanside December 1, 2002 11,300,000 10,998,638
2008 Multi-Family Housing
Revenue Bonds Country
Club apartments City of Oeeanside June 12, 2008 11,707,272 11,707,272
Trendwest CFD 2001-2 Owners
Participation Agreement City of Oceanside December 1, 2002 1,500,000 545,000
Oeean Raneh CFD 2000-1 Ocean
Ranch Corporate Centre City of Oceanside December 30,2002 12,265,000 12,190,000
Morro Hill CFD 2002 City of Oceanside December 1, 2002 16,085,000 15,345,000
Ocean Ranch CFD 2004 City of Oceanside February 1,2004 12,735,000 12,735,000
Morro Hills CFD 2001-1 Speeia1
Tax Bonds Series A of 2002 City of Oeeanside November 14, 2002 9,915,000 9,165,000
Morro Hills CFD 2004
Improvement Area #1 City of Oceanside February 1, 2004 11,000,000 10,245,000
Pacific Coast Business
Park CFD 2008 City of Oceanside May 20,2008 8,880,000 8,880,000
See independent auditors' report.- 88 -

City of OceansideNotes to Basic Financial Statements, ContinnedJnne 30, 2008
9. RESERVES AND DESIGNATIONS OF FUND BALANCES:
A City may set up reserves of fund equity to segregate fund balances which are appropriable forexpenditure in future periods, or which are legally set aside for a specific future use. Fund"designations" also may be established to indicate tentative plans for financial resource utilizationin a future period.
Housing
Assistance Redevelopment Redevelopment
Program Agency Agency Other Total
Special Debt Capital Governmental Governmental
General Revenue Service Projects Funds Funds
Reserves:
Noncurrent assets $ $ 22,367,826 $ $ 54,810 $ $ 22,422,636
Advances to other funds 3,579,379 3.976.517 7,555,896
Inventory 19,866 19,866
Prepaid items 8,171 1,365 5,368 14,904
Land and buildings
held for resale 9,492,993 9,492,993
Debt service 4,422,143 4,979.276 9,401,419
Total Reserves L--~ggl"i\§ $ 22 367 826 $ 4 422 143 $ 13 525 685 L 4.2&4.641 $ 48907.114
Designations:
Cash :f1owslhealthy cities $ 14,500.000 $ $ $ $ $ 14,500,000
Economic stabilization 5,800,000 5,800,000
Capital projects!
infrastructure 12,255,000 12,255,000
Continuing appropriations 3,249,645 21,812,104 25,061,749
Total Designations $ 35,804 64~ $ $ $ 2J 812 1M ~6161'!2
A. Reserved for Noncurrent Assets:
This reserve is provided to indicate amounts for noncurrent assets such as notes receivable thatare not available as a resource to meet expenditures of the current year.
B. Reserved for Advances to Other Funds:
This reserve is provided to indicate that amounts advanced to other funds are not available as aresource to meet expenditures of the current year.
C. Reserved for Inventory:
This reserve is provided to indicate that the inventory balance is not available as a spendableresource to meet expenditures of the current year.
D. Reserved for Prepaid Items:
This reserve is provided to indicate that prepaid items are not available as a resource to meetexpenditures of the current year.
See independent auditors' report.- 89-

City of OceansideNotes to Basic Financial Statements, ContinuedJune 30, 2008
9. RESERVES AND DESIGNATIONS OF FUND BALANCES (CONTINUED):
E. Reserved for Land and Buildings Held for Resale:
This reserve is provided to indicate that laod aod buildings held for resale is not available as aresource to meet expenditures of the current year.
F. Reserved for Debt Service:
This reserve is provided to indicate amounts are to be used for future debt service, includingamounts held in accordaoce with bond indenture or similar covenants.
G. Designated for Cash Flows/Healthy Cities:
This designation is to maintain a stable tax aod revenue structure aod provide for orderlyprovision of services to the Citizens of Oceaoside; aod to establish a process for the use ofthese funds in the event of fiscal adversity.
H. Designated for Economic Stabilization:
This designation is to deal with chaoging and sometimes volatile funding sources or to continuenormal operations aod maintain service levels in the case of short-term revenue losses.
L Designated for Capital Projects/Infrastructure:
This designation is for continued capital aod infrastructure projects that were approved by CityCouncil last fiscal year aod not yet completed.
J. Designated for Continuing Appropriations:
These funds have been designated for capital projects in prior years, but carried over to the nextyear.
10. OTHER REQUIRED INDIVIDUAL FUND DISCLOSURES:
Deficit Fund Balances:
The following funds reported deficits in fund balances at June 30,2008:
Major Fund:Redevelopment Agency Debt Service Fund
Other Governmental Fund:Storm Damage Special Revenue Fund
$ (8,247,537)
(49,910)
The deficit in the Redevelopment Agency Debt Service Fund will be eliminated through collectionof tax increments. The deficit in the Storm Damage Special Revenue Fund will be eliminatedthrough reimbursements of costs from FEMA.
See independent auditors' report.- 90-

City of OceansideNotes to Basic Financial Statements, ContinuedJune 30, 2008
10. OTHER REQUIRED INDIVIDUAL FUND DISCLOSURES:
Excess of Expenditures over Appropriations:
The following funds reported expenditures exceeding appropriations at June 30, 2008:
BudgetVariance withFinal Budget
Major Fund:Redevelopment Agency Capital
Projects Fund - Community development $ 1,626,400 $ 1,706,471 $Other Governmental Funds:
Asset Seizure Special Revenue Fund:Public safety 33,099
Library Special Revenue Fund:Community/cultural services 439,376 446,729
Gas Tax Special Revenue Fund:Public works 2,757,562 3,286,052
II. RISK MANAGEMENT:
(80,071)
(33,099)
(7,353)
(528,490)
The City is a member of the San Diego Pooled Insurance Program Authority (SANDPIPA) whichprovides general liability insurance. As a member, the City carries a self-insured retention of$250,000 and is insured through SANDPIPA from $250,000 to $2,000,000. In addition,SANDPIPA has purchased excess insurance coverage from $2,000,000 to $28,000,000 for all of itsmembers, including the City. There have been no significant changes in insurance coverage duringthe current year and settlements have not exceeded coverage in each of the past three fiscal years.
The workers' compensation and general and auto liability claims payable of $9,606,467 reported atJune 30, 2008, are based on the requirements of GASB Statement No. 10, which requires that aliability for claims be reported if information prior to the issuance of the financial statementsindicates that it is probable that a liability has been incurred at the date of the financial statementsand the amount of the loss can be reasonably estimated. Changes in the claims liability amountswere as follows:
Fiscal YearYear Claims Claims and Claims
Ended Payable Changes in Claims PayableJune 30, July 1. Estimates Pavrnents June 30,
2006 $ 8,940,159 $ 3,622,880 $ (1,851,117) $ 10,711,9222007 10,711,922 (483,108) (641,178) 9,587,6362008 9,587,636 3,756,927 (3,738,096) 9,606,467
See independent auditors' report.- 91 -

City of OceansideNotes to Basic Financial Statements, ContinnedJune 30, 2008
II. RISK MANAGEMENT (CONTINUED):
SANDPIPA is a joint powers agency of twelve cities located within San Dicgo County. Each cityhas equal representation on the Board of Directors, which consists of a city staff memher (and analternate) appointed by each City Council. The Board of Directors has total responsibility for allactions ofSANDPIPA.
The Board of Directors elects three members (including a President and Vice-President) to theExecutive Committee, which has the responsibility for overseeing all operations of SANDPIPA,including preparation and submission of the annual operating budget to the Board of Directors forits approval and modification, if deemed neccssary.
Annual premiums and assessments are approved by the Board of Directors and are adjusted eachyear based on each City's share of:
• Incurred losses• Such losses and other expenses as a proportion of all cities' such losses• The contribution to reserves, including reserves for incurred-but-not-reported (IBNR)losses• Costs to purchase excess insurance• Costs to purchase any additional coverage
Detailed financial information may be obtained from SANDPIPA.
If and when SANDPIPA is dissolved, the remaining assets, after all premiums and assessmentshave been paid and final disposition of all claims has been determined, will be distributed tomembers proportionate to each city's cash contributions made during the life of SANDPIPA. Untildissolution, however, no city has identifiable equity in SANDPIPA.
12. RETIREMENT PLANS:
Pension Plan Description:
The City contributes to the California Public Employees' Retirement System (CaIPERS), an agentmultiple-employer public employee defined benefit pension plan. CalPERS provides retirementand disability benefits, annual cost-of-living adjustments, and death benefits to plan members andbeneficiaries. CalPERS acts as a common investment and administrative agent for participatingpublic entities within the State of California. Benefit provisions and all other requirements areestablished by State statute and City ordinance. Copies of CaIPERS' annual financial report maybe obtained from the CalPERS Executive Office: 400 P Street, Sacramento, CA 95814.
See independent auditors' report.- 92 -

City of OceansideNotes to Basic Financial Statements, ContinuedJune 30, 2008
12. RETIREMENT PLANS (CONTINUED):
Funding Policy:
Active plan members are required by State statue to contribute 7% for miscellaneous and 9% forsafety employees of their annual covered salary. The City employer makes the contributionsrequired ofCity employees on their behalf and for their account, which amounted to $5,731,920 forthe year ended June 30, 2008. The City employer is required to contribute at actuariallydetermined rates, the rates for fiscal year 2007-2008, were 8.133% and 18.835% of annual coveredpayroll for the miscellaneous and safety employees, respectively.
Annual Pension Cost:
The City's annual pension cost and net pension asset to the current year were as follows:
Miscellaneous SafetyAnnual required contribution $ 3,379,989 $ 5,537,143 $ 8,917,132Interest on net pension asset (1,171,316) (1,911,096) (3,082,412)Adjustment to annual
required contribution 1,310,978 2,138,964 3,449,942Annual pension cost 3,519,651 5,765,011 9,284,662
Contributions made (3,379,989) (5,537,143) (8,917,132)Increase in net pension asset 139,662 227,868 367,530
Net pension asset - beginning of year (15,113,760) (24,659,293) (39,773,053)
Net pension asset - end of year $ -04.274,098) $ (24.43 L425) :I; -02",405,523)
The required contribution for the fiscal year 2007-2008 was determined as part of theJune 30, 2004 actuarial valuation using the entry age normal actuarial cost method with thecontributions determined as a percent of payroll. The actuarial assumptions included (a) 7.75%investment rate of return (net of administrative expenses), (b) projected annual salary increasesranging from 3.75% to 14.45% for miscellaneous and 3.75% to 13.15% for safety employees, and(c) 2% per year cost-of-living adjustments. Both (a) and (b) included an inflation componentof3%. The actuarial value of CalPERS assets was determined using techniques that smooth theeffects of short-term volatility in the market value of investments over a three-year pcriod.CalPERS unfunded actuarial accrued liability (or surplus) is being amortized as a level percentageof projected payroll on a closed basis. The amortization period at June 30, 2004, was 30 years forboth miscellaneous and safety employees.
See independent auditors' report.- 93 -

City of OceansideNotes to Basic Financial Statements, ContinuedJune 30, 2008
12. RETIREMENT PLANS (CONTINUED):
Annual Pension Cost (Continued):
Three-Year Trend Information for CalPERS - Miscellaneous
FiscalYear200620072008
AnnualPension Cost
(APC)$ 2,922,844
3,295,1183,519,651
ActualContribution
$ 20,105,8833,154,1543,379,989
PercentageofAPC
Contributed688%96%96%
Net Pension(Assets)
Obligation$ (15,254,724)
(15,113,760)(14,974,098)
Three-Year Trend Information for CalPERS - Safety
Annual Percentage Net PensionFiscal Pension Cost Actual ofAPC (Assets)Year (APC) Contribution Contributed Obligation2006 $ 4,768,850 $ 29,658,137 622% $ (24,889,287)2007 5,280,060 5,050,066 96% (24,659,293)2008 5,765,011 5,537,143 96% (24,431,425)
Funded Status and Funding Progress:
As of June 30, 2007, the most recent actuarial valuation date, the miscellaneous and safety planswere 97.5% and 92.8% funded, respectively. The actuarial accrued liability for bcncfits was$197,099,559 and $268,872,924 for miscellaneous and safety, respectively, and the actuarial valueof assets was $192,236,398 and $249,466,759 for miscellaneous and safety, respectively, resultingin an unfunded actuarial accrued liability (UAAL) of $4,863,161 and $19,406,165 formiscellaneous and safety, respectively. The covered payroll (annual payroll of active employeescovered by the plans) were $39,800,897 and $28,502,999 for miscellaneous and safety,respectively, and the ratios of the UAAL to the covered payroll were 12.2% and 68.1 % formiscellaneous and safety, respectively.
The schedule of funding progress, presented as RSI following the notes to the basic financialstatements, presents multiyear trend information about whether the actuarial value of plan assets isincreasing or decreasing over time relative to the actuarial accrued liability for benefits.
See independent auditors' report.- 94-

City of OceansideNotes to Basic Financial Statements, ContinnedJune 30, 2008
13. POSTEMPLOYMENT BENEFITS OTHER THAN PENSIONS:
A. The Retiree Health Plan:
Plan Description:
The City administers a single-employer defined benefit healthcare plan (the Retiree HealthPlan). The plan provides healthcare insurance for eligible retirees and their covereddependents, other than those retirees belonging to the Firefighters Association (OFA), throughthe City's group health insurance plans, which cover both active and retired employees. NonOFA retirees under the age of 65 are eligible to join one of four plan options. Upon attainingage 65, Medicare-eligible non-OFA retirees must join one of three plan options and assign theirMedicare Part A and Part B benefits to the plan chosen. The ability to participate in the City'sgroup insurance health plans by self-paying the premium extends for a period equal to thenumber of years of service at retirement (with a minimum of one-year). Non-OFA retirees withat least 15 years of service may continue to self-pay for this coverage as long as the Citycontinues to offer this benefit. Benefit provisions are established through negotiations betweenthe City and the non-OFA employee associations and are renegotiated periodically. The RetireeHealth Plan does not issue a publicly available financial report.
Funding Policy:
Contribution requirements are also negotiated between the City and the non-OFA employeeassociations. Eligible non-OFA retirees and their covered dependents receiving benefitscontribute 100% of their premium costs. For the year ended June 30, 2008, the total retireecontributions were $771,006. While the City does not directly contribute towards the cost ofpremiums for non-OFA retirees, the ability to obtain coverage at an active employee rateconstitutes a significant economic benefit to the non-OFA retirees, called an "implicit subsidy".This implicit subsidy is considered to be an other post employment benefit (OPEB) obligationof the City. The City is currently funding this OPEB obligation on a pay-as-you-go basis. Forthe year ended June 30, 2008, the City estimated that it paid $222,418 in health care costs forits non-OFA retirees and their covered dependents.
Annual OPEB Cost and Net OPEB Obligation:
The City's annual OPEB cost (expense) is calculated based on the annual required contributionof the employer (ARC), an amount actuarially determined in accordance with parameters ofGASB Statement 45. The ARC represents a level offunding that, ifpaid on an ongoing basis, isprojected to cover normal cost each year and to amortize any unfunded liabilities of the planover a period not to exceed thirty years.
See independent auditors' report.- 95 -

City of OceansideNotes to Basic Financial Statements, ContinuedJune 30, 2008
13. POSTEMPLOYMENT BENEFITS OTHER THAN PENSIONS (CONTINUED):
A. The Retiree Health Plan (Continued):
Annual OPEB Cost and Net OPEB Obligation (Continued):
The following table shows the components of the City's annual OPEB cost for the year, theamount actually contributed to the plan, and changes in the City's net OPEB obligation to theRetiree Health Plan:
Annual required contributionInterest on net OPEB obligationAdjustment to annual required contribution
Annual OPEB cost (expense)Implicit subsidy made
Increase in net OPEB obligationNet OPEB Obligation - beginning of year
Net OPEB Obligation - end of year
$
$
489,847
489,847222,418267,429
267,429
The City's annual OPEB cost, the percentage of annual OPEB cost contributed to the plan, andthe net OPEB obligation for the year ended June 30, 2008, the first year in which GASBStatement 45 is required to be implemented, were as follows:
FiscalYear
Ended
6/30108 $
AnnualOPEB
489,847
PercentageofAunual
OPEB CostsContributed
45.4 % $
NetOPEB
Obligation
267,429
Funded Status and Funding Progress:
As of July 1, 2007, the first actuarial valuation date, the plan was zero percent funded. Theactuarial accrued liability for benefits was $3,787,718, and the actuarial value of assets waszero, resulting in an unfunded aeerued liability (UAL) of $3,787,718. The covered payroll(annual payroll of aetive employees covered by the plan) was $63,551,511 and the ratio of theUAL to the covered payroll was 5.96 percent.
See independent auditors' report.- 96-

City of OceansideNotes to Basic Financial Statements, ContinuedJune 30, 2008
13. POSTEMPLOYMENT BENEFITS OTHER THAN PENSIONS (CONTINUED):
A. The Retiree Health Plan (Continued):
Funded Status and Funding Progress (Continued):
Actuarial valuations of an ongoing plan involve estimates of the value of reported amounts andassumptions about the probability of occurrence of events far into the future. Examples includeassumptions about rates of employee turnover, retirement, mortality, as well as economicassumptions regarding claim costs per retiree, healthcare inflation and interest rates. Amountsdetermined regarding the funded status of the plan and the annual required contributions of theemployer are subject to continual revision as actual results are compared with past expectationsand new estimates are made about the future. The schedule of funding progress, presented asrequired supplementary information following the notes to the financial statements, presentsmulti-year trend information about whether the actuarial value of plan assets is increasing ordecreasing over time relative to the actuarial accrued liabilities for benefits.
Actuarial Methods and Assumptions:
Projections of benefits for financial reporting purposes are based on the substantive plan (theplan as understood by the employer and the plan mcmbers) and include the types of benefitsprovided at the time of each valuation and the historical pattern of sharing of benefit costsbetween the employer and plan members to that point. The actuarial methods and assumptionsused include techniques that are designed to reduce the effects of short-term volatility inactuarial accrued liabilities and the actuarial value of assets, consistent with the long-termperspective of the calculations. In the July 1, 2007 actuarial valuation, the projected unit creditcost method was used. The actuarial assumptions included a discount rate of 6% per annum, arate of return on assets of 5.0% per annum and a healthcare cost trend rate of 9.0% initially,reduced by annual decrements of 1% to an ultimate rate of 5.0% after four years.
See independent auditors' report.- 97-

City of OceansideNotes to Basic Financial Statements, ContinuedJune 30, 2008
13. POSTEMPLOYMENT BENEFITS OTHER THAN PENSIONS (CONTINUTED):
B. The PERS Health Program:
Plan Description:
In connection with the retirement benefits for safety employees described in Note 12, the Cityprovides post-retirement health care benefits to retirees belonging to the FirefightersAssociation (OFA) through the California Public Employees' Retirement System HealthBenefits program (the PERS Health program). The program is a agent multiple-employerdefined benefit health care plan that provides healthcare insurance for eligible OFA retirees andtheir covered dependents, through the City'S group plans, which cover both active and retiredOFA employees. OFA employees become eligible to retire and receive City-paid healthcarebenefits upon attainment of age 50 and 5 years of covered PERS service, or by qualifyingdisability retirement status. Retired OFA members over the age of 65 may join one of thesupplemental (Medicare-coordinated) options under the PERS Health Program. Benefits arcpaid for the lifetime of the retiree. Benefit provisions are established by city ordinance whichreferences state statutes (the Public Employees' Medical and Hospital Care Act). The PERSHealth Program does not issue a publicly available financial report.
Funding Policy:
The City's contribution on behalf of all OFA retires is determined under the "unequalcontribution method" as described in California Government Code Section 22892(c). Thecurrent rate for retirees is $22.70/month. Effective January 1, 2008, the unequal contributionmethod was amended by Assembly Bill 2544 to require a catch-up calculation each year, butnot to exceed $IOO/month increase per retiree in anyone year. The City is currently fundingthis OPEB obligation on a pay-as-you-go basis. For the year ended June 30, 2008, the Citypaid $22,484 in health care costs for its OFA retirees and their covered dependents.
Annual OPEB Cost and Net OPEB Obligation:
The City's annual OPEB cost (expense) is calculated based on the annual required contributionof the employer (ARC), an amount actuarially determined in accordance with parameters ofGASB Statement 45. The ARC represents a level of funding that, ifpaid on an ongoing basis, isprojected to cover normal cost each year and to amortize any unfunded liabilities of the planover a period not to exceed thirty years.
See independent auditors' report.- 98 -

City of OceansideNotes to Basic Financial Statements, ContinuedJune 30, 2008
13. POSTEMPLOYMENT BENEFITS OTHER THAN PENSIONS (CONTINUED):
B. The PERS Health Program (Continued):
Annual OPEB Cost and Net OPEB Obligation (Continued):
The following table shows the components of the City's annual OPEB cost for the year, theamount actually contributed to the plan, and changes in the City's net OPEB obligation to thePERS Health Program:
Annual required contributionInterest on net OPEB obligationAdjustment to annual required contribution
Annual OPEB cost (expense)Contributions made
Increase in net OPEB obligationNet OPEB Obligation - beginning of year
Net OPEB Obligation - end of year
$
$
126,018
126,01822,484
103,534
103,534
The City's annual OPEB cost, the percentage of annual OPEB cost contributed to the plan, andthe net OPEB obligation for the year ended June 30, 2008, the first year in which GASBStatement 45 is required to be implemented, were as follows:
FiscalYear
Ended
6/30/08 $
AnnualOPEB
126,018
PercentageofAnnual
OPEB CostsContributed
17.8 % $
NetOPEB
Obligation
103,534
Funded Status and Funding Progress:
As of July I, 2007, the first actuarial valuation date, the plan was zero percent funded. Theactuarial accrued liability for benefits was $1,214,849, and the actuarial value of assets waszero, resulting in an unfunded accrued liability (UAL) of $1,214,849. The covered payroll(annual payroll of active employees covered by the plan) was $11,823,069 and the ratio of theUAL to the covered payroll was 10.28 percent.
See independent auditors' report.- 99-

City of OceansideNotes to Basic Financial Statements, ContinuedJune 30, 2008
13. POSTEMPLOYMENT BENEFITS OTHER THAN PENSIONS (CONTINUED):
B. The PERS Health Program (Continued):
Funded Status and Funding Progress (Continued):
Actuarial valuations of an ongoing plan involve estimates of the value of reported amounts andassumptions ahout the probability of occurrence of events far into the future. Examples includeassumptions about rates of employee turnover, retirement, mortality, as well as economicassumptions regarding claim costs per retiree, healthcare inflation and interest rates. Amountsdetennined regarding the funded status of the plan and the annual required contributions of theemployer are subject to continual revision as actual results are compared with past expectationsand new estimates are made about the future. The schedule of funding progress, presented asrequired supplementary infonnation following the notes to the financial statements, presentsmulti-year trend infonnation about whether the actuarial value of plan asscts is increasing ordecreasing over time relative to the actuarial accrued liabilities for benefits.
Actuarial Methods and Assumptions:
Projections of benefits for financial reporting purposes are based on the substantive plan (theplan as understood by the employer and the plan members) and include the types of bencfitsprovided at the time of each valuation and the historical pattern of sharing of benefit costsbetween the employer and plan members to that point. The actuarial methods and assumptionsused include techniques that are designed to reduce the effects of short-tenn volatility inactuarial accrued liabilities and the actuarial value of assets, consistent with the long-tennperspective of the calculations. In the July I, 2007 actuarial valuation, the projected unit creditcost method was used. The actuarial assumptions included a discount rate of 6% per annum, arate of return on assets of 5.0% per annum and a healthcare cost trend rate of 9.0% initially,reduced by annual decrements of I% to an ultimate rate of 5.0% after four years.
14. CONTINGENT LIABILITIES:
The City is involved in certain matters of litigation that have arisen in the normal course ofconducting City business. City management believes, based upon consultation with the CityAttorney, tbat these cases, in the aggregate, are not expected to result in a material adverse financialimpact on the City. Additionally, City management believes that the City's insurance programs aresufficient to cover any potential losses should an unfavorable outcome be realized.
See independent auditors' report.- 100-

City of OceansideNotes to Basic Financial Statements, ContinnedJnne 30, 2008
IS. RESTATEMENT OF NET ASSETSIFUND BALANCES:
Restatement of Net Assets - Government-wide Financial Statements:
Beginning net assets balances in the government-wide financial statements were restated asfollows:
GovernmentalActivities
Net assets as previously reportedFund statements adjustments (see schedule below)
Net assets as restated
$ 361,537,191(] ,440,004)
$ 360.097.187
Restatement of Fund Balances - Governmental Fnnd Financial Statements:
Beginning fund balances in the governmental fund financial statements were restated as follows:
Major FundsHousing
Assistance Redevelopment GeneralProgram Agency Improvement
Special Capital Capital OtherGeneral Revenue Projects Projects Governmental
Fund Fund Fund Fund FundsFund balances as previously
reported $ 49,942,834 $ 36,147,373 $ 38,791,816 $ 36,544,106 $ 23,592,467
To record tax increment
pass through for prior years 408,267 (1,269,571)
To reclassify developer fees
revenues recorded in
incorrect funds 169,801 (169,801)
To correct revenue received
in error (amount should have
been recorded as a liability) (583,483)
To correct various asset and
liability accounts as a result
of gas tax program audit 4,783
Fund balances as restated LsO 351101 .$ 36317174 $..... 37,,;;22,245 ~. 3S4 960Y23 $ ~3 427 449
See independent auditors' report.- 101 -

This page intentionally left blank
- 102-

REQUIRED SUPPLEMENTARY INFORMATION
- 103 -
City of OceansideNote to Required Supplementary InformationJune 30, 2008
1. BUDGETARY INFORMATION:
The City follows these procedures in establishing the budgetary data reflected in the financialstatements.
• During May of even numbered fiscal years, the City Manager submits to the City Council aproposed biennial operating budget for the two fiscal years commencing the followingJuly 1. The operating budget includes proposed expenditures and the means of financingthem.
• Public hearings are conducted at City Council meetings to obtain taxpayer comments priorto and after May.
• Prior to July 1, the budget is legally adopted through passage of an appropriation resolution.
The City Manager is authorized to transfer funds appropriated within the same department.Revisions that alter the total appropriations of any department or fund must be approved by theCity Council.
Budgets are adopted for the general, special revenue and capital project funds on a basis consistentwith accounting principles generally accepted in the United States of America. Budgeted amountsare as originally adopted and as further amended by the City Council. All annual appropriationslapse at year-end.
Formal budgetary integration is employed as a management control device during the year for thegovernmental fund types other than the debt service funds. Expenditures may not legally exceedappropriations at the activity level.
See independent auditors' report.- 104-
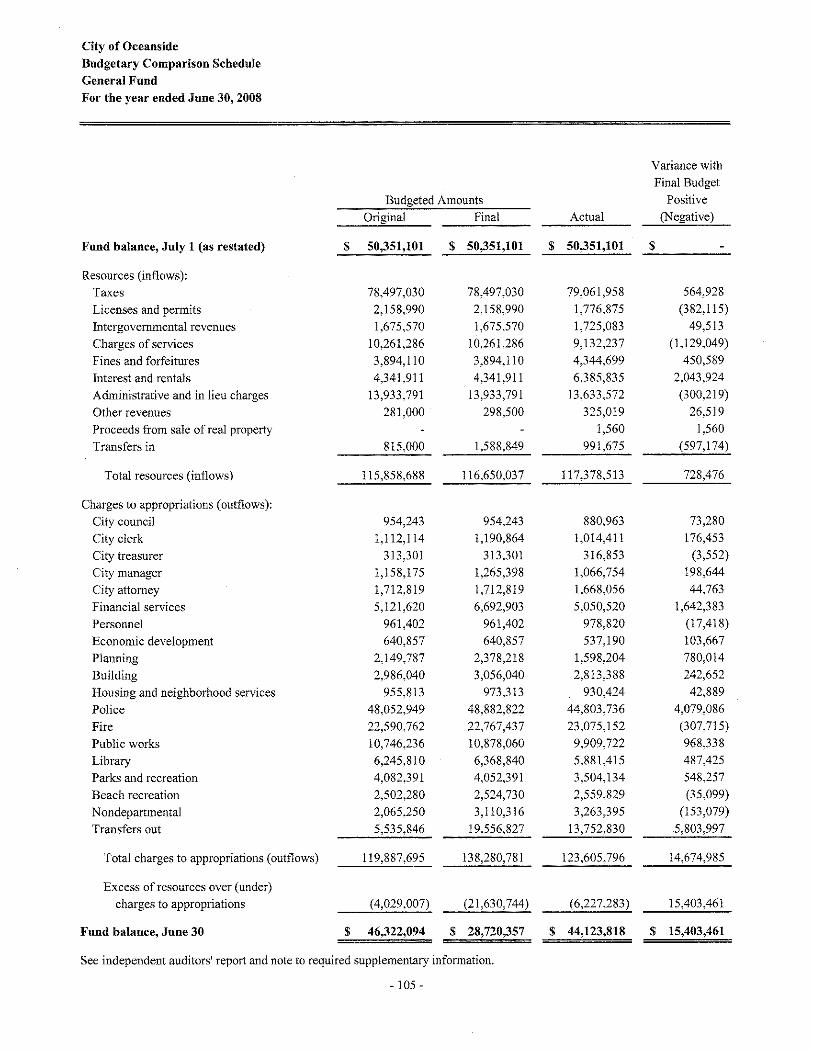
City of Oceanside
Budgetary Comparison Schedule
General Fund
For the year ended June 30, 2008
Variance withFinal Budget
Budgeted Amounts PositiveOriginal Final Actual (Negative)
Fund balance, July 1 (as restated) $ 50,351,101 $ 50,351,101 $ 50,351,101 $
Resources (inflows):Taxes 78,497,030 78,497,030 79,061,958 564,928
Licenses and permits 2,158,990 2,158,990 1,776,875 (382,115)
Intergovernmental revenues 1,675,570 1,675,570 1,725,083 49,513
Charges of services 10,261,286 10,261,286 9,132,237 (1,129,049)
Fines and forfeitures 3,894,110 3,894,110 4,344,699 450,589
Interest and rentals 4,341,911 4,341,911 6,385,835 2,043,924
Administrative and in lieu charges 13,933,791 13,933,791 13,633,572 (300,219)
Other revenues 281,000 298,500 325,019 26,519
Proceeds from sale of real property 1,560 1,560
TTansfers in 815,000 1,588,849 991,675 (597,174)
Total resources (inflows) 115,858,688 116,650,037 117,378,513 728,476
Charges to appropriations (outflows):
City council 954,243 954,243 880,963 73,280
City clerk 1,112,114 1,190,864 1,014,411 176,453
City treasurer 313,301 313,301 316,853 (3,552)
City manager 1,158,175 1,265,398 1,066,754 198,644
City attorney 1,712,819 1,712,819 1,668,056 44,763
Financial services 5,121,620 6,692,903 5,050,520 1,642,383
Personnel 961,402 961,402 978,820 (17,418)
Economic development 640,857 640,857 537,190 103,667
Planning 2,149,787 2,378,218 1,598,204 780,014
Building 2,986,040 3,056,040 2,813,388 242,652
Housing and neighborhood services 955,813 973,313 930,424 42,889
Police 48,052,949 48,882,822 44,803,736 4,079,086
Fire 22,590,762 22,767,437 23,075,152 (307,715)
Public works 10,746,236 10,878,060 9,909,722 968,338
Library 6,245,810 6,368,840 5,881,415 487,425
Parks and recreation 4,082,391 4,052,391 3,504,134 548,257
Beach recreation 2,502,280 2,524,730 2,559,829 (35,099)
Nondepartmental 2,065,250 3,110,316 3,263,395 (153,079)
Transfers out 5,535,846 19,556,827 13,752,830 5,803,997
Total charges to appropriations (outflows) 119,887,695 138,280,781 123,605,796 14,674,985
Excess of resources over (under)charges to appropriations (4,029,007) (21,630,744) (6,227,283) 15,403,461
Fund balance, June 30 $ 46,322,094 $ 28,720,357 $ 44,123,818 $ 15,403,461
See independent auditors' report and note to required supplementary infonnation.
- 105-

City of Oceanside
Budgetary Comparison Schedule
Housing Assistance Program Special Revenue FundFor the year ended .June 30, 2008
Variance withFina] Budget
Budgeted Amounts PositiveOriginal Final Actua] (Negative)
Fund halance, July 1 (as restated) $ 36,317,174 $ 36,317,174 $ 36,317,174 $
Resources (inflows):
Licenses and permits ]20,509 ]20,509 ]22,294 ],785
Intergovernmental revenues ]4,258,09] ]5,402,79] 13,378,666 (2,024,]25)Charges of services 3]0,886 2]9,]96 355,292 136,096Interest and rentals 62,240 62,240 ],153,959 1,091,719Developer fees 177,025 411,000 233,975Other revenues 549,568 182,500 183,516 1,016Transfers in 611,869 611,869 476,041 (135,828)
Tota] resources (inflows) 15,913,163 16,776,130 16,080,768 (695,362)
Charges to appropriations (outflows):Community development:
Housing and neighborhood services 16,335,784 36,221,825 16,094,689 20,127,136Transfers out 184,940 (184,940)
Total charges to appropriations (outflows) 16,335,784 36,221,825 ]6,279,629 19,942,196
Excess of resources over (under)charges to appropriations (422,621) (19,445,695) (198,861) 19,246,834
Fund balance, Jnne 30 $ 35,894,553 $ 16,871,479 $ 36,118,313 S 19,246,834
See independent auditors' report and note to required supplementary infonnation.
- ]06-

City of Oceanside
Required Supplementary Information, ContinuedFor the year ended June 30, 2008
PUBLIC EMPLOYEE RETIREMENT SYSTEM PENSION PLANS
SCHEDULE OF FUNDING PROGRESS
Miscellaneous Employees
Actuarial Value Unfunded
Actuarial Accrued of Assets Liability
Valuation Liability (AVA) (UL)
Date (a) (b) (a) - (b)
06/30/05 $ 162,831,419 $ 157,958,947 $ 4,872,472
06/30/06 177,606,330 176,754,615 851,715
06/30/07 197,099,559 192,236,398 4,863,161
Safety Employees
Funded
Ratio
(b)/(a)
97.01%
99.52%
97.53%
Annual
Covered
Payroll
(c)
$ 32,821,215
33,929,574
39,800,897
ULasa% of Payroll
Percentage of
[(a)-(b)]/(c)
14.85%
2.51%
12.22%
Actuarial
Valuation
Date
06/30/05
06/30/06
06/30/07
Actuarial Value Unfunded Annual ULasa
Accrued of Assets Liability Funded Covered % of Payroll
Liability (AVA) (UL) Ratio Payroll Percentage of
(a) (b) (a) - (b) (b)/(a) (c) [(a)-(b)]/(c)
$ 222,688,992 $ 180,235,494 $ 42,453,498 80.94% $ 21,940,504 193.49%
244,592,900 230,235,864 14,357,036 94.13% 25,447,560 56.42%
268,872,924 249,466,759 19,406,165 92.78% 28,502,999 68.08%
NOTE: In 2006, the City issued Pension Ohligation Bonds for $42,780,000. The proceeds of these honds were forwarded
to CalPERS to reduce the City's unfunded liabilities.
OTHER POSTEMPLOYMENT BENEFIT PLANS
SCHEDULE OF FUNDING PROGRESS
Retiree Health Plan
Actuarial Value Unfunded
Actuarial Accrued of Assets Liability
Valuation Liability (AVA) (UL)
Date (a) (b) (a) - (h)
06/30/08 $ 3,787,718 $ $ 3,787,718
PERS Health Program
Actuarial Value Unfunded
Actuarial Accrued of Assets Liability
Valuation Liability (AVA) (UL)
Date (a) (b) (a) - (b)
06/30/08 $ 1,214,849 $ $ 1,214,849
Annual ULasa
Funded Covered % of Payroll
Ratio Payroll Percentage of
(b )/(a) (c) [(a)-(b)]/(c)
0.00% $ 63,551,511 5.96%
Annual ULasaFunded Covered % of Payroll
Ratio Payroll Percentage of
(b)/(a) (c) [(a)-(b)]/(c)
0.00% $ 11 ,823,069 10.28%
See independent auditors! report and note to required supplementary information.
- 107 -

This page intentionally left blank
- 108-

SUPPLEMENTARY INFORMATION
- 109-

This page intentionally left blank
- 110-

OTHER GOVERNMENTAL FUNDS
SPECIAL REVENUE FUNDS
The Asset Seizure Fund is used to account for funds received as a result of seizure of assets fromthose convicted of violations of drug laws. Funds are used to enhance law enforcement services andactivities.
The Library Fund is used to account for grant revenues and purchases of books. The fund is requiredby Section 18951 of the California Education Code.
The Gas Tax Fund is used to account for the maintenance and capital improvements associated withmotor vehicle travel. Financing is provided primarily from the City's share of State gasoline taxes.
The Community Development Block Grant Fund is used to account for funds received from theFederal Government for use on federally approved projects.
The Recreation Fund is used to account for the operation of the City's special recreation programs.
The Maintenance Districts Fund is used to account for street lighting and landscape maintenanceservices. Financing is provided by service charges to benefiting properties.
The Strategic Traffic Offender Program (STOP) Fund is used to account for funds received fromthe impoundment of vehicles under California Vehicle Code Section 22651 (h)(l), (h)(2), (0)(1), (p),22655.3 (a) & (b), 14602.6 (a), and 14607.6 (a).
The Storm Damage Fund is used to account for federal disaster assistance funds received to covercosts ofmajor storm damage.
The Grants Fund is used to account for funds received from federal, state and county governments foruse on approved projects.
DEBT SERVICE FUNDS
The Oceanside Public Financing Authority Fund is used to account for payment of interest andprincipal on debt of the Public Financing Authority.
The Oceanside Building Authority Fund is used to account for payment of interest and principal onthe certificates ofparticipation and revenue bonds of the Oceauside Building Authority.
The Oceanside Lighting District Fund is used to account for payment of interest and principal on theStreet-Lighting LeaselPurchase Agreement of the Oceanside Lighting District.
The Pension Obligation Bonds Fund is used to account for the payment of interest and principal ofdebt of the City's Pension Obligation Bonds.
- 111 -

City of Oceanside
Combining Balance Sbeet
Other Governmental Funds
June 30, 2008
Total
Special Debt Other
Revenue Service Governmental
Funds Funds Funds
ASSETS
Cash and investments $ 20,550,561 $ 2,771,545 $ 23,322,106
Restricted cash and investments 2,207,717 2,207,717
Receivables:
Accounts 2,501,579 2,501,579
Interest
Taxes 166,570 166,570
Other 29,899 14 29,913
Due from other governments 1,653,580 1,653,580
Prepaid items 5,368 5,368
TOTAL ASSETS S 24,907,557 S 4,979,276 S 29,886,833
LIABILITIES AND FUND BALANCES
LIABILITIES:
Accounts payable S 969,199 S S 969,199
Accrued liabilities 122,894 122,894
Deposits 80,964 80,964
Due to other funds 94,455 94,455
Deferred revenue 764,777
TOTAL LIABILrrIES 2,032,289 2,032,289
FUND BALANCES:
Reserved for:
Prepaid items 5,368 5,368
Debt service 4,979,276 4,979,276
Unreserved, designated 21,812,104 21,812,104
Unreserved, undesignatcd, reported in:
Special revenue funds 1,057,796
TOTAL FUND BALANCES 22,875,268 4,979,276 27,854,544
TOTAL LIABILITIESAND FUND BALANCES S 24,907,557 S 4,979,276
See independent auditors' report.
- 112-

City of Oceanside
Combining Statement of Revenues, Expenditures andChanges in Fnnd Balances - Other Governmental Fnnds
For the year ended Jnne 30, 2008
Total
Special Debt Otber
Revenue Service Governmental
Funds Funds FundsREVENUES:
Special assessments $ 8,286,184 $ 673 $ 8,286,857Intergovernmental revenues 8,288,658 8,288,658Charges for services 963,037 963,037Fines and forfeitures 629,939 629,939Lease revenue 2,256,588 2,256,588Interest and rentals 984,399 125,126 1,109,525Other revenues 266,196 266,196
TOTAL REVENUES 19,418,413 2,382,387 21,800,800
EXPENDITURES:
Current:
General government 348,594 348,594
Public safety 1,457,989 1,457,989Public works 5,529,928 5,529,928Community development 1,173,381 1,173,381
Community/cultural services 1,906,840 1,906,840Capital outlay 3,558,007 3,558,007Debt service:
Principal retirement 215,000 2,129,192 2,344,192Interest and fees 22,332 3,768,387 3,790,719
TOTAL EXPENDITURES 14,212,071 5,897,579 20,109,650
EXCESS OF REVENUES OVER
(UNDER)EXPENDlruRES 5,206,342 (3,515,192) 1,691,150
OTHER FINANCING SOURCES (USES):
Loan proceeds 3,500,000 3,500,000Transfers in 932,561 3,548,863 4,481,424Transfers out (5,245,479) (5,245,479)
TOTAL OTHER FINANCING SOURCES (USES) (812,918) 3,548,863 2,735,945
NET CHANGE IN FUND BALANCES 4,393,424 33,671 4,427,095
FUND BALANCES - BEGINNING OF YEAR, AS RESTATED 18,481,844 4,945,605 23,427,449
FUND BALANCES - END OF YEAR $ 22,875,268 $ 27,854,544
See independent auditors' report.
- 113 -

City of OceansideCombining Balance SheetOther Special Revenne FnndsJune 30, 2008
AssetSeizure Library Gas Tax
ASSETSCash and investments $ 1,104,930 $ 29,040 $ 15,800,008Receivables:
AccountsInterestAssessmentsTaxesOther 352
Due from other governments 1,036,122Prepaid items 4,648
TOTAL ASSETS $ 1,]05,282 $ 33,688 $ 16,836,130
LlABIL1T1ES AND FUND BALANCES
LlABlLITlES:Accounts payable $ $ 26,616 $ 332,212Accrued liabilities 64,528DepositsDue to other fundsDeferred revenue 110,003
TOTAL LlABILITlES 26,616 506,743
FUND BALANCES (DEFIClT):Reserved for:
Prepaid items 4,648Unreserved:
Designated for:Continuing appropriations 16,329,387
Undesignated 1,105,282
TOTAL FUND BALANCES (DEFICIT) 1,105,282 7,072 16,329,387
TOTAL LlABILITlES AND FUND BALANCES $ 1,105,282 $ 16,836,130
See independent auditors! report.
- 114-

Community
Development Maintenance StormBlock Grant Recreation Districts STOP Damage Grants Totals
$ $ 670,247 $ 1,571,552 $ 1,094,106 $ $ 280,678 $ 20,550,561
2,501,579 2,501,579
166,570 166,570
12,998 16,549 29,899617,458 1,653,580
720 5,368
$ 683,245 $ 1,588,101 $ 1,094,106 $ $ 3,400,435 $ 24,907,557
$ 117,620 $ 27,003 $ 205,108 $ 1,325 $ $ 259,315 $ 969,199
4,405 33,316 19,787 858 122,89480,964 80,964
44,545 49,910 94,455
115,163 539,611 764,777
166,570 256,446 205,108 21,112 49,910 799,784 2,032,289
720 5,368
426,799 1,382,993 1,072,994 2,599,931 21,812,104
(49,910) 1,057,796
426,799 1,382,993 1,072,994 (49,910) 2,600,651 22,875,268
$ 166,570 $ 683,245 $ 1,588,101 $ 1,094,106 $ 3,400,435 $ 24,907,557
- 115-

City of OceansideCombining Statement of Revenues, Expenditures andChanges in Fund Balauces - Other Special Revenue FundsFor the year ended June 30, 2008
Asset
Seizure Library Gas TaxREVENUES:
Special assessments $ $ $ 5,934,360Intergovernmental revenues 808,324 68,311 3,737,374Charges for services 103,388
Fines and forfeituresInterest and rentals 28,194 802,577Other revenues 41,244 25,009
TOTAL REVENUES 836,518 212,943 10,499,320
EXPENDITURES:
Current:General governmentPublic safety 33,099
Public works 3,286,052
Community developmentCommunity/cultural services 446,729
Capital outlay 3,452,474Debt service:
Principal retirementInterest and fees
TOTAL EXPENDITURES 33,099 446,729 6,738,526
EXCESS OF REVENUES OVER
(UNDER) EXPENDITURES 803,419 (233,786) 3,760,794
OTHER FINANCING SOURCES (USES):Loan proceedsTransfers in 232,600 140,160Transfers out (1,056,652)
TOTAL OTHER FINANCINGSOURCES (USES) 232,600 (916,492)
NET CHANGE IN FUND BALANCES 803,419 (1,186) 2,844,302
FUND BALANCES (DEFICIT) -BEGINNING OF YEAR, AS RESTATED 301,863 8,258 13,485,085
FUND BALANCES (DEFICIT) - END OF YEAR $ 1,105,282 $ 7,072 $ 16,329,387
See independent auditors' report.
- 116-

CommunityDevelopment Maintenance StonnBlock Grant Recreation Districts STOP Damage Grants Totals
$ $ $ 2,351,824 $ $ $ $ 8,286,1841,449,230 30,995 2,194,424 8,288,658
859,649 963,037629,939 629,939
27,856 52,518 52,732 20,522 984,39924,488 36,956 138,499 266,196
1,449,230 9]],993 2,441,298 682,671 30,995 2,353,445 19,418,413
348,594 348,594694,863 730,027 1,457,989
2,050,710 193,166 5,529,928706,691 466,690 1,173,38149,409 1,055,072 355,630 1,906,840
105,533 3,558,007
215,000 215,00022,332 22,332
1,447,559 1,055,072 2,050,710 694,863 1,745,513 14,212,071
1,671 (143,079) 390,588 (12,192) 30,995 607,932 5,206,342
3,500,000 3,500,000390,000 169,801 932,561
(3,501,671) (4,587) (658,887) (23,009) (673) (5,245,479)
(1,671) (4,587) (268,887) (23,009) 169,128 (812,918)
(147,666) 121,701 (35,201) 30,995 777,060 4,393,424
574,465 1,261,292 1,108,195 (80,905) 1,823,591 18,481,844
$ $ 426,799 $ 1,382,993 $ 1,072,994 $ (49,910) $ 2,600,651 $ 22,875,268
- 117 -

City of OceansideSchednle of Revenues, Expenditures and Changes in Fund Balance - Budget and ActnalAsset Seizure Special Revenue FundFor the year ended june 30, 2008
Variance withFinal Budget
Budgeted Amounts PositiveOriginal Final Actual (Negative)
Fund balance, July I S 301,863 $ 301,863 $ 301,863 $
Resources (inflows):Intergovernmental revenues 100,000 100,000 808,324 708,324Interest and rentals 28,194 28,194
Total resources (inflows) 100,000 100,000 836,518 736,518
Charges to appropriations (outflows):Public safety 33,099 (33,099)
Excess of resources over (under)charges to appropriations 100,000 100,000 803,419 703,419
Fund balance, June 30 $ 401,863 $ 401,863 $ 1,105,282 $ 703,419
See independent auditors' report.
- 118 -

City of OceansideSchedule of Revenues, Expenditures and Changes in Fund Balance· Budget and ActualLibrary Special Revenue FundFor the year ended June 30, 2008
Variance withFinal Budget
Budgeted Amounts PositiveOriginal Actual (Negative)
Fund balance, July 1 $ 8,258 $ 8,258 $ 8,258
Resources (inflows):Intergovernmental revenues 69,250 69,250 68,311 (939)Charges for services 100,410 100,410 103,388 2,978Other revenues 40,000 40,000 41,244 1,244Transfers in 232,600 232,600 232,600
Total resources (inflows) 442,260 442,260 445,543 3,283
Charges to appropriations (outflows):Community/cultural services:
Library 438,348 439,376 446,729
Excess of resources over (under)charges to appropriations 3,912 2,884 (1,186) (4,070)
Fund balance, June 30 $ 12,170 $ 11,142 $ 7,072 $ (4,070)
See independent auditors' report.
- 119 -

City of OceansideSchednle of Revenues, Expenditures and Changes in Fund Balance· Budget and ActualCas Tax Special Revenue FundFor the year ended June 30, 2008
Variance withFinal Budget
Budgeted Amounts PositiveOriginal Final Actual (Negative)
Fund balance, July 1 (as restated) $ 13,485,085 $ 13,485,085 $ 13,485,085
Resources (inflows):Special assessments 4,500,000 4,500,000 5,934,360 1,434,360Intergovernmental revenues 4,573,830 4,573,830 3,737,374 (836,456)Interest and rentals 183,000 183,000 802,577 619,577Other revenues 25,009 25,009Transfers in 305,000 308,441 140,160 (168,281)
Total resources (inflows) 9,561,830 9,565,271 10,639,480 1,074,209
Charges to appropriations (outflows):Public works 2,668,740 2,757,562 3,286,052 (528,490)Capital outlay 14,860,003 13,375,126 3,452,474 9,922,652Transfers out 1,005,000 1,050,242 1,056,652 (6,410)
Total charges to appropriations (outflows) 18,533,743 17,182,930 7,795,178 9,387,752
Excess of resources over (under)charges to appropriations (8,971,913) (7,617,659) 2,844,302 10,461,961
Fund balance, June 30 $ 4,513,172 $ 5,867,426 $ 16,329,387 $ 10,461,961
See independent auditors' report.
• 120 -

City of OceansideSchednle of Revenues, Expenditures and Chauges in Fuud Balance - Budget and ActualCommunity Developmeut Block Grant Special Revenue FundFor the year ended June 30, 2008
Variance withFinal Budget
Budgeted Amounts PositiveOriginal Final Actual (Negative)
Fund halauce, July 1 $ $ $ $
Resources (inflows):Intergovernmental revenues 1,865,865 3,097,644 1,449,230 (1,648,414)Loan proceeds 3,500,000 3,500,000
Total resources (inflows) 1,865,865 3,097,644 4,949,230 1,851,586
Charges to appropriations (outflows):Current:
General government 739,413 531,474 348,594 182,880Community development 1,084,489 1,490,853 706,691 784,162Community/cultural services 56,159 199,460 49,409 150,051
Capital outlay 638,525 105,533 532,992Debt service:
Principal retirement 215,000 215,000 215,000Interest and fees 22,332 22,332 22,332
Transfers out 3,501,671 (3,501,671)
Total charges to appropriations (outflows) 2,1l7,393 3,097,644 4,949,230 (1,851,586)
Excess of resources over (under)charges to appropriations (251,528)
Fund balance, June 30 $ (251,528) $ $ $
See independent auditors' report.
- 121 -

City of OceansideSchednle of Revennes, Expenditures and Chauges iu Fund Balance - Budget and ActualRecreation Special Revenue FundFor the year ended June 30, 2008
Variance withFinal Budget
Budgeted Amounts PositiveOriginal Final Actual (Negative)
Fund balance, July 1 $ 574,465 $ 574,465 $ 574,465
Resources (inflows):Charges for services 765,080 765,080 859,649 94,569Interest and rentals 27,500 27,500 27,856 356Other revenues 121,200 236,200 24,488 (211,712)
Total resources (inflows) 913,780 1,028,780 911,993 (116,787)
Charges to appropriations (outflows):Community/cultural services:
Parks and recreation 852,831 967,831 910,753 57,078Beach recreation 185,462 185,462 144,319 41,143
Tranfers out 4,587 (4,587)
Total charges to appropriations (outflows) 1,038,293 1,153,293 1,059,659 93,634
Excess of resources over (under)charges to appropriations (124,513) (124,513) (147,666) (23,153)
Fund balance, .Iune 30 $ 449,952 $ 449,952 $ 426,799 $ (23,153)
See independent auditors' report.
- 122 -

City of OceansideSchednle of Revenues, Expeuditurcs aud Chauges in Fuud Balauce - Budgct and ActualMaintenance Districts Special Revenue FundFor the year ended .June 30, 2008
Variance withFinal Budget
Budgeted Amounts PositiveOriginal Final Actual (Negative)
Fund balance, July I $ 1,261,292 $ 1,261,292 $ 1,261,292 $
Resources (inflows):Special assessments 2,325,362 2,325,638 2,351,824 26,186Interest and rentals 17,800 19,800 52,518 32,718Other revenues 10,000 15,000 36,956 21,956Transfers in 390,000 390,000 390,000
Total resources (inflows) 2,743,162 2,750,438 2,831,298 80,860
Charges to appropriations (outflows):Public works 2,290,711 2,209,741 2,050,710 159,031Transfers out 657,003 657,003 658,887 (1,884)
Total charges to appropriations (outflows) 2,947,714 2,866,744 2,709,597 157,147
Excess of resources over (under)charges to appropriations (204,552) (116,306) 121,701 238,007
Fund balance, June 30 $ 1,056,740 $ 1,144,986 $ 1,382,993 $ 238,007
See independent auditors! report.
- 123 -

City of OceansideSchednle of Revennes, Expenditures and Changes in Fund Balance - Budget and Actnal
STOP Special Revenne Fund
For the year ended June 30, 2008
Variance withFinal Budget
Budgeted Amounts Positive
Original Final Actual (Negative)
Fund balance, July 1 $ 1,108,195 $ 1,108,195 $ 1,108,195 $
Resources (inflows):Fines and forfeitures 455,000 455,000 629,939 174,939
Interest and rentals 52,732 52,732
Total resources (inflows) 455,000 455,000 682,671 227,671
Charges to appropriations (outflows):
Public safety:
Police 655,670 695,205 694,863 342
Transfers out 2,500 23,009 (20,509)
Total charges to appropriations (outflows) 655,670 697,705 717,872 (20,167)
Excess ofresQurces over (under)
charges to appropriations (200,670) (242,705) (35,201) 207,504
Fund balance, June 30 $ 907,525 $ 865,490 $ 1,072,994 $ 207,504
See independent auditors! report.
- 124-

City of OceansideSchedule of Revenues, Expenditures and Changes in Fund Balauce - Budget and Actua!Storm Damage Special Revenne FundFor the year ended June 30, 2008
Variance withFinal Budget
Budgeted Amounts PositiveOriginal Final Actual (Negative)
Fund halance (deficit), July 1 $ (80,905) $ (80,905) $ (80,905) $
Resources (inflows):Intergovernmental revenues 30,995 30,995
Fund halance (deficit), June 30 $ (80,905) $ (80,905) $ (49,910) $ 30,995
See independent auditors' report.
- 125 -

City of OceansideSchedule of Revenues, Expenditures and Changes in Fund Balance - Budget and ActualGrants Special Revenue FundFor the year ended June 30, 2008
Variance withFinal Budget
Budgeted Amounts PositiveOriginal Final Actual (Negative)
Fund halance, July 1 (as restated) $ 1,823,591 $ 1,823,591 $ 1,823,591 $
Resources (inflows):Intergovernmental revenues 1,552,]27 5,659,150 2,194,424 (3,464,726)Interest and rentals 3,000 19,000 20,522 1,522Other revenues 104,200 149,271 138,499 (10,772)Transfers in 169,801 169,801
Tota resources (inflows) 1,659,327 5,827,421 2,523,246 (3,304,175)
Charges to appropriations (outflows):Public safety:
Police 463,899 895,096 676,284 218,8]2Fire 3,000 111 ,082 53,743 57,339
Public works 17,584 350,681 193,166 157,515Community development:
Housing and neighborhood services 1,073,358 3,704,462 466,690 3,237,772Community/cultural services:
Library 25,913 707,795 355,630 352,165Transfers out 673 (673)
Total charges to appropriations (outflows) 1,583,754 5,769,116 1,746,186 4,022,930
Excess of resources over (under)charges to appropriations 75,573 58,305 777,060 718,755
Fund balance, June 30 $ 1,899,164 $ 1,881,896 $ 2,600,651 $ 718,755
See independent auditors' report.
- 126-

City of Oceanside
Combining Balance Sbeet
Otber Debt Service Fnnds
June 30, 2008
Total
Oceanside Other
Public Oceanside Oceanside Pension Debt
Financing Building Lighting Obligation Service
Authority Authority District Bonds Funds
ASSETS
Cash and investments $ 1,921,788 $ 743,234 $ 30,735 $ 75,788 $ 2,771,545
Restricted cash and investments 2,182,616 1,677 23,424 2,207,717
Receivables:
Other 14 14
TOTAL ASSETS $ 4,104,404 $ 744,925 $ 30,735 $ 99,212 $ 4,979,276
LIABILITIES AND FUND BALANCES
LIABILITIES:
Accounts payable $ $ $ $ $
FUND BALANCES:
Reserved for:
Debt service 4,104,404 744,925 30,735 99,212 4,979,276
TOTAL LIABILITIESAND FUND BALANCES $ 4,104,404 $ 744,925 $ 30,735 $ 99,212 $ 4,979,276
See independent auditors' report.
- 127 -

City of Oceanside
Combining Statement of Revenues, Expenditures and
Changes in Fund Balances - Other Debt Service FundsFor the year ended June 30, 2008
TotalOceanside Other
Public Oceanside Oceanside Pension DebtFinancing Building Lighting Obligation ServiceAuthority Authority District Funds Funds
REVENUES:
Special asses,sments $ $ 673 $ $ $ 673Lease revenue 2,085,912 170,676 2,256,588Interest and rentals 67,606 33,990 23,530 125,126
TOTAL REVENUES 2,153,518 205,339 2,382,387
EXPENDITURES:
Debt service:Principal retirement 1,080,000 325,000 184,192 540,000 2,129,192Interest and fees 1,093,853 452,756 67,812 2,153,966 3,768,387
TOTAL EXPENDITURES 2,173,853 777,756 252,004 2,693,966 5,897,579
EXCESS OF REVENUES OVER
(UNDER) EXPENDITURES (20,335) (572,417) (252,004) (2,670,436) (3,515,192)
OTHER FINANCING SOURCES:
Transfers in 605,143 252,004 2,691,716 3,548,863
NET CHANGE IN
FUND BALANCES (20,335) 32,726 21,280 33,671
FUND BALANCES -
BEGINNING OF YEAR 4,124,739 712,199 30,735 77,932 4,945,605
FUND BALANCES - END OF YEAR $ 4,104,404 $ 744,925 $ 30,735 $ 99,212 $
See independent auditors' report.
- 128 -

City of OceansideSchednle of Revennes, Expenditures and Chauges in Fund Balance - Budget and Actual
Redevelopment Agency Capital Projects FundFor the year ended June 30, 2008
Variance withFinal Budget
Budgeted Amounts PositiveOriginal Final Actual (Negative)
Fund balance, July 1 (as restated) $ 37,522,245 $ 37,522,245 $ 37,522,245 $
Resources (inflows):
Taxes 8,557,742 8,557,742 9,570,115 1,012,373
Charges of services 60,000 60,000 104,085 44,085
Interest and rentals 39,200 39,200 1,191,313 1,152,113
Developer fees 90,000 90,000 22,500 (67,500)
Other revenues 69,103 69,103
Transfers in 2,488,000 2,488,000 26,762 (2,461,238)
Total resources (inflows) 11,234,942 11,234,942 10,983,878 (251,064)
Charges to appropriations (outflows):
Community development:Redevelopment 2,029,067 1,626,400 1,706,471 (80,071)
Capital outlay 18,202,366 19,194,160 2,280,706 16,913,454
Transfers out 4,552,979 5,190,153 4,385,374 804,779
Total charges to appropriations (outflows) 24,784,412 26,010,713 8,372,551 17,638,162
Excess of resources over (under)charges to appropriations (13,549,470) (14,775,771) 2,611,327 17,387,098
Fund balance, .June 30 $ 23,972,775 $ 22,746,474 $ 40,133,572 $ 17,387,098
See independent auditors! report.
- 129-

City of Oceanside
Schedule of Revenues, Expeuditures and Changes in Fund Balance - Budget and ActualGeneral Improvement Capital Projects Fund
For the year ended June 30, 2008
Variance with
Final BudgetBudgeted Amounts Positive
Original Final Actual (Negative)
Fund balance, July 1 (as restated) $ 35,960,623 $ 35,960,623 $ 35,960,623 $
Resources (inflows):
Intergovernmental revenues 5,000,000 8,149,844 19,373,353 11,223,509Interest and rentals 599,343 599,343 2,053,505 1,454,162Developer fees 2,888,197 2,950,205 3,593,158 642,953Other revenues 642,497 642,497Loan proceeds 3,500,000 (3,500,000)Transfers in 5,225,000 23,610,268 14,745,949 (8,864,319)
Total resources (inflows) 13,712,540 38,809,660 40,408,462 1,598,802
Charges to appropriations (outflows):Public works 1,904,872 1,904,872 237,513 1,667,359Capital outlay 46,865,138 69,482,831 40,180,506 29,302,325Transfers out 605,143 5,881,818 782,460 5,099,358
Total charges to appropriations (outflows) 49,375,153 77,269,521 41,200,479 36,069,042
Excess of resources over (under)
charges to appropriations (35,662,613) (38,459,861) (792,017) 37,667,844
Fund balauce, June 30 $ 298,010 $ (2,499,238) $ 35,168,606 $ 37,667,844
See independent auditors l report.
- 130-

INTERNAL SERVICE FUNDS
The Loss Prevention Fund is used to account for the costs of the City's risk management andself-insurance programs. Funds are provided primarily from charges to programs and projects.
The General Services Fund is used to account for the costs of maintenance of automotive equipment,City buildings, and the costs of operating central data processing operations. Funds are provided fromcharges to programs and projects.
- 131 -

City of OceansideCombining Statement of Net AssetsInternal Service FundsJune 30, 2008
Loss GeneralPrevention Services Total
ASSETS
CURRENT ASSETS:
Cash and investments $ 14,902,190 $ 8,654,074 $ 23,556,264Accounts receivable 1,810,724 17,169 1,827,893Prepaid items 596 596Inventory 368,935 368,935
TOTAL CURRENT ASSETS 16,712,914 9,040,774 25,753,688
NONCURRENT ASSETS:Capital assets:
Machinery and equipment 234,104 29,804,911 30,039,015Construction in progress 653,965 653,965Less: accumulated depreciation (20,098) (17,230,300) (17,250,398)
TOTAL NONCURRENT ASSETS 214,006 13,228,576 13,442,582
TOTAL ASSETS 16,926,920 22,269,350 39,196,270
LIABILITIES
CURRENT LIABILITIES:Accounts payable 109,211 679,619 788,830Accrued liabilities 473,298 184,245 657,543Interest payable 866 866Notes payable, current portion 69,129 69,129Compensated absences, current portion 25,746 144,116 169,862
TOTAL CURRENT LIABILITIES 608,255 1,077,975 1,686,230
NON CURRENT LIABILITIES:Notes payable 72,504 72,504Claims and judgments payable 9,606,467 9,606,467Compensated absences 102,984 576,463 679,447
TOTAL NONCURRENT LIABILITIES 9,709,451 648,967 10,358,418
TOTAL LIABILITIES 10,317,706 1,726,942 12,044,648
NET ASSETS
Invested in capital assets, net of related debt 214,006 13,086,943 13,300,949Unrestricted 6,395,208 7,455,465 13,850,673
TOTAL NET ASSETS $ 6,609,214 $ 20,542,408 $ 27,151,622
See independent auditors' report.
- 132-

City of OceansideCombining Statement of Revenues, Expenses andChanges in Net Assets - Internal Service FundsFor the year ended June 30, 2008
Loss GeneralPrevention Services Total
OPERATING REVENUES:Charges for services $ 29,431,599 $ 19,133,087 $ 48,564,686Other revenues 805,279 11,986 817,265
TOTAL OPERATING REVENUES 30,236,878 19,145,073 49,381,951
OPERATING EXPENSES:Personal services 832,471 4,303,943 5,136,414Maintenance and operations 4,614,954 10,833,147 15,448,101Insurance premium 22,348,716 22,348,716Depreciation 605 2,418,344 2,418,949
TOTAL OPERATING EXPENSES 27,796,746 17,555,434 45,352,180
OPERATING L"ICOME 2,440,132 1,589,639 4,029,771
NONOPERATING REVENUES (EXPENSES):Gain from disposal of assets 176,594 176,594Interest expense (9,746) (9,746)
TOTAL NONOPERATING REVENUES (EXPENSES) 166,848 166,848
INCOME BEFORE TRANSFERS 2,440,132 1,756,487 4,196,619
TRANSFERS:Transfers in 1,254,793 1,254,793Transfers out (6,103) (27,514) (33,617)
TOTAL TRANSFERS (6,103) 1,227,279 1,221,176
CHANGE IN NET ASSETS 2,434,029 2,983,766 5,417,795
TOTAL NET ASSETS - BEGINNING OF YEAR 4,175,185 17,558,642 21,733,827
TOTAL NET ASSETS - END OF YEAR $ 6,609,214 $ 20,542,408 $ 27,151,622
See independent auditors' report
- 133-

City of OceansideCombining Statement of Casb FlowsInternal Service FundsFor the yeai' ended June 30, 2008
Loss GeneralPrevention Services Total
CASH FLOWS FROM OPERATING ACTIVITIES:
Receipts from customers $ 28,670,606 $ 19,178,988 $ 47,849,594
Payments to suppliers (4,599,610) (10,924,093) (15,523,703)
Payments to employees (392,752) (4,206,621) (4,599,373)
Insurance premiums and settlements (22,329,885) (22,329,885)
NET CASH PROVIDED BY OPERATING ACTIVITIES 1,348,359 4,048,274 5,396,633
CASH FLOWS FROMNONCAPITAL FINANCING ACTIVITIES:
Cash received from other funds 1,254,793 1,254,793
Cash paid to other funds (6,103) (27,514) (33,617)
NET CASH PROVIDED (USED) BYNONCAPITAL FINANCING ACTIVITIES (6,103) 1,227,279 1,221,176
CASH FLOWS FROM CAPITALAND RELATED FINANCING ACTIVITIES:
Acquisition of capital assets - capital replacement (3,048,779) (3,048,779)
Proceeds from sale of assets 176,594 176,594
Retirement of debt (65,905) (65,905)
Interest paid (10,149) (10,149)
NET CASH USED BY CAPITAL AND
RELATED FINANCING ACTIVITIES (2,948,239) (2,948,239)
NET INCREASE IN CASHAND CASH EQUIVALENTS 1,342,256 2,327,314 3,669,570
CASH AND CASH EQUIVALENTS - BEGINNING OF YEAR 13,559,934 6,326,760 19,886,694
CASH AND CASH EQUIVALENTS - END OF YEAR $ 14,902,190 $ 8,654,074 $ 23,556,264
RECONCILIATION OF OPERATING INCOME TO NETCASH PROVIDED BY OPERATING ACTlVrrIES:
Operating income $ 2,440,132 $ 1,589,639 $ 4,029,771
Depreciation 605 2,418,344 2,418,949
Change in assets and liabilities:
(Increase) decrease in accounts receivable (1,566,272) 33,915 (1,532,357)
(Increase) decrease in inventory (45,844) (45,844)
(Increase) decrease in prepaid items 1,950 4,415 6,365
Increase (decrease) in accounts payable 13,394 (49,517) (36,123)
Increase (decrease) in accrued liabilities 431,556 21,778 453,334
Increase (decrease) in compensated absences 8,163 75,544 83,707
Increase (decrease) in claims and judgments payable 18,831 18,831
NET CASH PROVIDEDBY OPERATING ACTIVITIES $ 1,348,359 $ 4,048,274 $ 5,396,633
See independent auditors' report.
- 134-

FIDUCIARY FUNDS
The Special Assessment District Fund is used to account for special assessment collections and theirdisbursement to bondholders.
The Deposits Fuud is used to account for deposits received and held by the City as an agent forindividuals, developers, private organizations, and other governmental agencies.
- 135-

City of OceansideCombining Statement of Assets and LiabilitiesFiduciary FundsJune 30, 2008
SpecialAssessment
District Deposits Total
ASSETS:
Cash and investments $ 4,051,178 $ 3,835,408 $ 7,886,586
Restricted cash and investments 16,777,397 16,777,397
Accounts receivable 20,254 20,254
TOTAL ASSETS $ 20,848,829 $ 3,835,408 $ 24,684,237
LIABILITIES:Accouuts payable $ 152,769 $ 21,507 $ 174,276
Deposits 1,683 3,813,901 3,815,584
Due to bondbolders 20,694,377 20,694,377
TOTAL LIABILITIES $ 20,848,829 $ 3,835,408 $ 24,684,237
See independent auditors' report.
- 136-

City of OceansideCombining Statement of Changes in Assets and LiabilitiesFidnciary FundsJune 30, 2008
Balance BalanceJuly 1, 2007 Additions Deletions June 30, 2008
Special Assessment Districts
ASSETS:Cash and investments $ 3,422,621 $ 5,440,706 $ 4,812,149 $ 4,051,178Restricted cash and investments 12,765,617 12,544,512 8,532,732 16,777,397Accounts receivable 30,949 121,780 132,475 20,254
TOTAL ASSETS $ 16,219,187 $ 18,106,998 $ 13,477,356 $ 20,848,829
LIABILITIES:Accounts payable $ 279,994 $ 4,844,156 $ 4,971,381 $ 152,769Accrued liabilities 408 408Deposits 1,683 1,683Due to bondholders 15,938,785 14,663,342 9,907,750 20,694,377
TOTAL LIABILITIES $ 16,219,187 $ 19,509,181 $ 14,879,539 $ 20,848,829
Deposits
ASSETS:Cash and investments $ 4,053,233 $ 74,402,893 $ 74,620,718 $ 3,835,408
TOTAL ASSETS $ 4,053,233 $ 74,402,893 $ 74,620,718 $ 3,835,408
LIABILITIES:Accounts payable $ 42,636 $ 43,555,306 $ 43,576,435 $ 21,507Deposits 4,010,597 896,568 1,093,264 3,813,901
TOTAL LIABILITIES $ 4,053,233 $ 44,451,874 $ 44,669,699 $ 3,835,408
Total- All Agency Funds
ASSETS:Cash and investments $ 7,475,854 $ 79,843,599 $ 79,432,867 $ 7,886,586Restricted cash and investments 12,765,617 12,544,512 8,532,732 16,777,397Accounts receivable 30,949 121,780 132,475 20,254
TOTAL ASSETS $ 20,272,420 $ 92,509,891 $ 88,098,074 $ 24,684,237
LIABILITIES:Accounts payable $ 322,630 $ 48,399,462 $ 48,547,816 $ 174,276Accrued liabilities 408 408Deposits 4,010,597 898,251 1,093,264 3,815,584Due to bondholders 15,938,785 14,663,342 9,907,750 20,694,377
TOTAL LIABILITIES $ 20,272,420 $ 63,961,055 $ 59,549,238 $ 24,684,237
See independent auditors' report.
- 137 -

This page intentionally left blank
- 138 -

CAPITAL ASSETS USED IN THEOPERATING OF GOVERNMENTAL FUNDS
- 139-

City of OceansideCapital Assets Used in the Operation of Governmental FnndsSchednle by Sonrce *June 30, 2008
GOVERNMENTAL FUNDS CAPITAL ASSETS:
LandBuildings, structures and improvements other than buildings
Machinery and equipment
InfrastructureConstruction in progress
Total governmental funds capital assets
Less: accumulated depreciation
Total governmental funds capital assets, net
INVESTMENTS IN GOVERNMENTAL FUNDS CAPITAL ASSETS BY SOURCE:
State grantsFederal grantsGeneral fund revenueSpecial revenue funds revenuesCapital proj eets funds revenues
Special assessmentsEnterprise funds revenues
Totnl governmental funds capital assets
$ 57,843,987
87,350,62226,060,424
283,073,38743,411,714
497,740,134
(J 79,561,540)
$ 318,178,594
$ 789,649
5,573,023
27,764,75929,107,190
249,944,888
4,897,791101,294
$ 318,178,594
* This schedule presents only the capital asset balances related to governmental funds. Accordingly, the capital assets reportedin the internal service funds are excluded from the above amounts.
See independent auditors! report.
- 140-

City of OceansideCapital Assets Used in the Operation of Governmental FnndsSchednle of Changes in Capital Assets - By Fnnction and ActivityFor the year ended June 30, 2008
Capital CapitalAssets Assets
July I, 2007 Additions Deletions June 30,2008Function and Activity:
General government $ 76,034,223 $ 204,405 $ (270,124) $ 75,968,504Public safety 21,047,726 6,730,499 (632,475) 27,145,750Public works 144,850,538 20,686,837 (7,208,866) 158,328,509Community development 14,813,448 13,675,725 (545,165) 27,944,008Community/cultural services 29,434,060 460,649 (1,102,886) 28,791,823
Total capital assets $ 286,179,995 $ 41,758,115 $ (9,759,516) $ 318,178,594
See independent auditors! report.
- 141 -