Financial Year 2015 Results - Brambles · PDF fileFinancial highlights (Continuing operations,...
52
Financial Year 2015 Results 20 August 2015
Transcript of Financial Year 2015 Results - Brambles · PDF fileFinancial highlights (Continuing operations,...

Financial Year 2015 Results
20 August 2015

Overview and Results Highlights
Tom Gorman, CEO
2
Key points: FY15 result
Sales revenue up 8% and Underlying Profit up 10% at constant FX
Pallets result reflects strong Europe profit but US cost pressures remain
Strong sales and profit growth delivered in RPCs
Solid contribution from Ferguson since September 2014 acquisition
Final dividend of AU14.0¢ per share, up AU0.5¢ on 2014
Non-underwritten DRP reactivated at 1.5% discount
In line with guidance amid challenging conditions
3

Key points: outlook
FY16 sales revenue and Underlying Profit growth expected at 6-8% at constant FX
FY16 Underlying Profit guidance range: US$1,000-1,020M at 30 June 2015 FX
FY16 ROCI will reflect short-term impact of increased investment
FY19 objective reaffirmed for 20% ROCI (before impacts of acquisitionssince December 2013)
Organic growth investment to FY19 of US$1.5B supports longer-term objectives
Reflects increased scope of investment opportunity
4

Group safety performance
0
5
10
15
20
25
FY11 FY12 FY13 FY14 FY15
Brambles Injury Frequency Rate (per million man hours)
Continuing businesses Reported
Continued positive trend in injury frequency rate
5
1 Operations owned continuously throughout FY11 to FY15, excluding businesses acquired or divested during that period.2 Includes restatements in FY12 to incorporate acquired operations and, in FY13 and FY14, the demerged Recall business.
1 2

Financial highlights
(Continuing operations, US$M) FY15 result Change vs. FY14
Actual FX Constant FX
Sales revenue 5,465 1% 8%
Operating profit 939 1% 8%
Profit after tax 586 - 7%
Underlying Profit 986 3% 10%
Return on Capital Invested (ROCI) 15.7% (0.6)pp (0.5)pp
- Prior to acquisitions since December 2013 16.6% 0.3pp 0.3pp
Brambles Value Added 272 -
Cash Flow from Operations 729 (99)
Efficiencies deliver leverage to bottom line
6

Delivery scorecard
FY15 Guidance FY15 Outcome
Constant FX sales revenue growth of 8-9% Achieved 8%
Delivery of Global Supply Chain efficienciesUS$34M delivered in FY15
Full US$100M program achieved
Underlying Profit: US$1,055-1,085M (30 June 2014 FX – reflecting growth of 9-12%)
FY15 result translates to US$1,065Mat 30 Jun 2014 FX (10% growth)
Improvement in Group ROCI prior to acquisition impacts ROCI up 0.3pp ex-acquisitions
Positive Free Cash Flow after dividends US$45M result for FY15
Key FY15 objectives met despite challenging conditions
7

Key 2H15 actionsShort-term priorities to drive long-term value
8
What we said – Feb 2015 What we did…
Cost Mitigate transport inflation; deploy pallet durability actions in CHEP USA
- US transport surcharge Feb 2015- US pallet durability actions underway
BrandRefresh brand in CHEP Pallets; roll-out of new customer solution strategy to begin in USA
- “This is the supply change” go-to-market strategy launched June 2015
InnovationDeploy new technologies/leverage data to build customer relationships and further strengthen asset management
- Key pilot programs being undertaken in collaboration with customers
- Analysis continuing of formal structure to support opportunities
Growth strategy
Expand in under-penetrated verticalsand segments and new geographies
- Organic growth capex: ~US$350M- RPCs acquisitions: Chile, Japan- Africa expansion: South Africa
plantations, Zambia, Morocco
3
2
4
1

Pallets segment result summaryStrong Europe result more than offsets US cost challenges
FY15 Change vs. FY14
(US$M) Actual FX
Constant FX
Americas 2,358 2% 5%
EMEA 1,381 (5)% 5%
Asia-Pacific 344 (5)% 3%
Sales revenue 4,082 (1)% 5%
Operating profit 812 (1)% 5%
Underlying Profit 832 (1)% 6%
ROCI 21.2% - 0.2pp
Net new business, like-for-like volumes and price/mix broadly equal contributors to sales growthEmerging markets constant FX sales growth of 12% was lower than recent trend, reflecting softer Latin America Increased profit
Delivery of targeted efficiencies worldwide under Global Supply Chain and One Better programsOutstanding Europe result reflects mix improvements, specific pricing actions and efficienciesUS plant and transport cost pressures remain despite slight moderation in 2H15 vs. 1H15
9

RPCs segment result summaryImproved margins reflect scale benefits on European growth
FY15 Change vs. FY14
(US$M) Actual FX
Constant FX
Europe 582 - 12%
North America 192 10% 10%
ANZ & South Africa 118 (1)% 9%
South America 26 20% 44%
Sales revenue 918 2% 12%
Operating profit 131 5% 15%
Underlying Profit 132 6% 15%
ROCI 8.5% 0.6pp 0.7pp
Strong sales revenue growth in all regions driven by conversions with existing and new retailers Profit and ROCI improvements
Scale-related network and transportation efficiencies in Europe driven by continued disciplined expansion
Non-recurrence of one-off retirement payments, impairments and marketing costs that occurred in FY14
Increased depreciation costs as a result of investment to fund pool growth
10

Containers segment result summaryDiverse result reflects broadly positive 2H15 trends
FY15 Change vs. FY14
(US$M) Actual FX
Constant FX
Ex-acquisitions
(constant FX)
Automotive 147 (9)% (1)% N/A
IBCs 130 11% 22% 9%
Oil & Gas 111 168% 193% (5)%
Aerospace 78 19% 25% 14%
Sales revenue 466 21% 31% 4%
Operating profit 58 62% 79%
Underlying Profit 59 56% 72% 10%
ROCI 6.8% (2.0)% (1.9)pp 0.6pp
Ongoing challenges in European and Australian automotive businesses weighs on growthContinued solid growth in IBCs with stronger second half in AerospaceFerguson pro forma1 FY15 constant FX sales revenue growth of 7% amid challenging conditionsProfit growth reflects continued cost disciplinesROCI diluted by Ferguson acquisition
11
1 Compares sales revenue for 12 months ended 30 June 2015 with prior corresponding period.

Financial Analysis
Zlatko Todorcevski, CFO
12

Continued sales growth momentumKey drivers of sales revenue growth (US$M)
13
5,405
5,828
5,465
64 131105
16 107(363)
FY14 Pallets:net newbusiness
Pallets:volume, price,
mix
RPCs(excluding
acquisitions)
Containers(excluding
acquisitions)
Acquisitions FY15(constant FX)
FX FY15
Reflects solid result from Ferguson despite oil and gas sector challenges
Translation impacts reflect strong US dollar against other operating currenciesContribution from largest
operations ahead of underlying industry growth
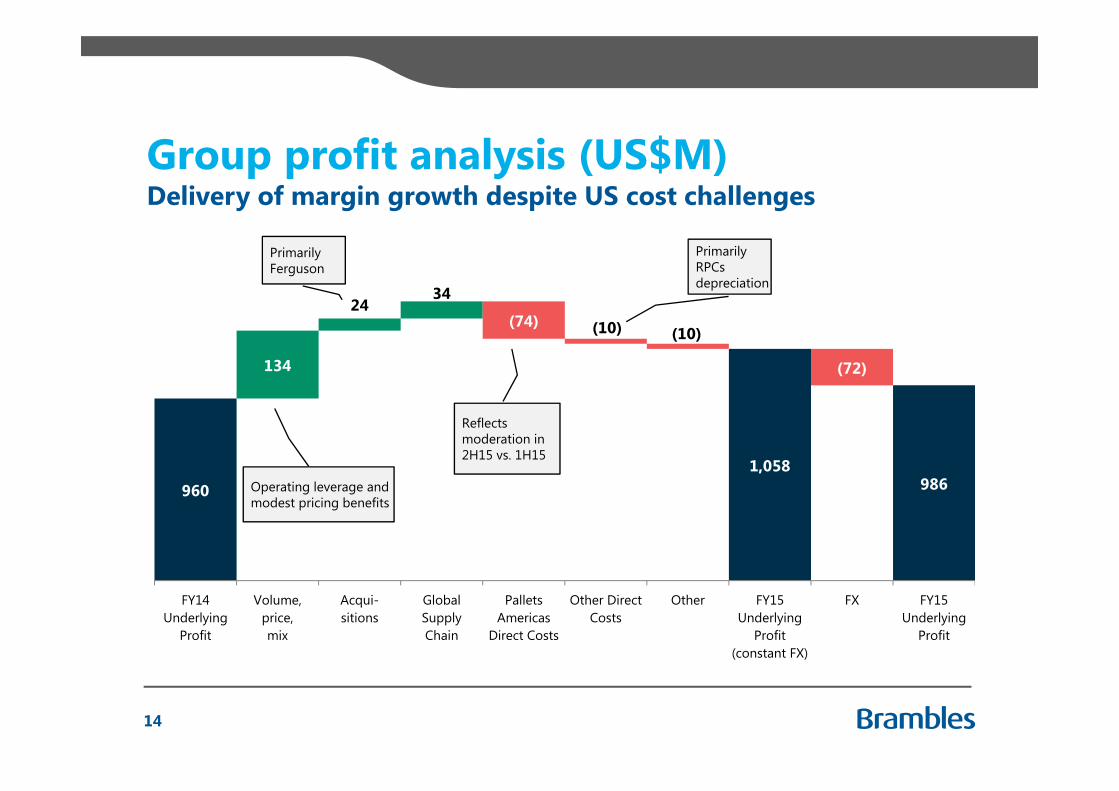
Group profit analysis (US$M)Delivery of margin growth despite US cost challenges
14
9601,058
986
134
2434
(74) (10) (10)
(72)
FY14Underlying
Profit
Volume,price,mix
Acqui-sitions
GlobalSupplyChain
PalletsAmericas
Direct Costs
Other DirectCosts
Other FY15Underlying
Profit(constant FX)
FX FY15Underlying
Profit
Primarily Ferguson
Operating leverage and modest pricing benefits
Reflects moderation in 2H15 vs. 1H15
Primarily RPCs depreciation

Key transport cost trendsStrong EMEA broadly offsets spike in US carrier rates
12%
14%
16%
18%
20%
FY11 FY12 FY13 FY14 FY15
Pallets: net transport costs/sales revenue
Americas EMEA Asia-Pacific Total
EMEA FY15 reduction reflects logistics efficiencies and some benefit of lower fuel costsAmericas carrier rates reflect 8% inflation in third-party freight rates throughout the industryKey carrier suppliers impacted by:
Insufficient fleet availability
Reduced labour availability
Increased regulatory measures
15

Key plant cost trendsDivergent trends in Americas and EMEA continue
24%
28%
32%
36%
40%
44%
FY11 FY12 FY13 FY14 FY15
Pallets: net plant costs/sales revenue
Americas EMEA Asia-Pacific Total
Americas challenges continue to reflect:
Improved asset recovery practices
Commitment to meeting customer repair quality requirements
Positive EMEA trend continues to reflect:
Growing use of managed exchange
Lower damage rates on fractional and display pallets
16

Indirect cost reduction updateOne Better program underway and delivering benefits
14%
15%
16%
17%
18%
FY11 FY12 FY13 FY14 FY15
Overhead costs/sales revenue US$11M cost-outs delivered from quick wins in FY15On track to deliver US$30M total reduction by end FY16On track to deliver FY19 targets
US$100M total cost-outAt least 2 percentage point reduction in overheads to sales ratio vs. FY14
Key initiatives:Better for the Customer: focus on simplification and ease of doing businessBetter for the Business: alignment and simplification of Finance, HR and IT functionsBetter Purchasing: driving scale benefits from procurement
17

Reconciliation to statutory profit
(US$M, continuing operations) FY15 FY14 Change
Actual FX Constant FX
Underlying Profit 986 960 3% 10%
Significant Items (47) (31)
Operating profit 939 930 1% 8%
Net finance costs (112) (113) 1% (7)%
Tax expense (241) (232) (4)% (12)%
Profit after tax 586 585 - 7%
Weighted average number of shares 1,566 1,561
Basic earnings per share (US¢) 37.4¢ 37.5¢ - 7%
Small increase in Significant Items and tax expense
18

Cash flow reconciliation
(US$M) FY15 FY14 Change
EBITDA 1,535 1,488 47
Capital expenditure (984) (854) (130)
Proceeds from sale of property, plant and equipment 78 78 -
Working capital movement 5 11 (6)
IPEP expense 80 88 (8)
Other 15 17 (2)
Cash Flow from Operations 729 828 (99)
Significant Items and discontinued operations (52) (67) 15
Financing costs and tax (272) (330) 58
Free Cash Flow 404 431 (27)
Dividends paid (359) (394) 35
Free Cash Flow after dividends 45 37 8
Higher capital expenditure to support growth
19

Group capital expenditure analysis
0
100
200
300
400
500
600
700
800
900
1,000
1,100
FY11 FY12 FY13 FY14 FY15 FY16F
Capital expenditure on pooling equipment (US$M)
Replacement Pallets growth RPCs growth Containers growth
Gradual increase driven by acquisitions and customer growth
20
Containers demand driven by investment in acquired businessesInvestment in RPCs growth
post IFCO acquisition
Gradual supply-chain restocking now driving increased demand for pool growth in AmericasEquipment purchased to replace
irrecoverable and scrapped equipment largely stable despite business growth

US inventories and pallet demand
0
2
4
6
8
10
12
14
1.20
1.21
1.22
1.23
1.24
1.25
1.26
1.27
1.28
Mar-12 Jun-12 Sep-12 Dec-12 Mar-13 Jun-13 Sep-13 Dec-13 Mar-14 Jun-14 Sep-14 Dec-14 Mar-15
US retail trade inventories1/sales vs. CHEP USA plant stock
Total retail trade inventories to sales ratio, excluding auto, seasonally-adjusted (LHS)Plant stock, seasonally-adjusted (M pallets) (RHS)
Increased inventories are a key short-term capex driver
21
1 Source: US Census Bureau
Efficient plant stock management has supported recent growth
Inventories are now at their highest ratio since the Financial Crisis

Balance sheet position
June 2015 June 2014
Net debt (US$M) 2,689 2,362
Average term of committed facilities (years) 3.9 4.1
Within key ratios despite use of debt to fund acquisition
22
FY15 FY14
EBITDA/net finance costs (x) 13.7 13.2
Net debt/EBITDA (x) 1.75 1.59

Summary and Outlook
Tom Gorman, CEO
23
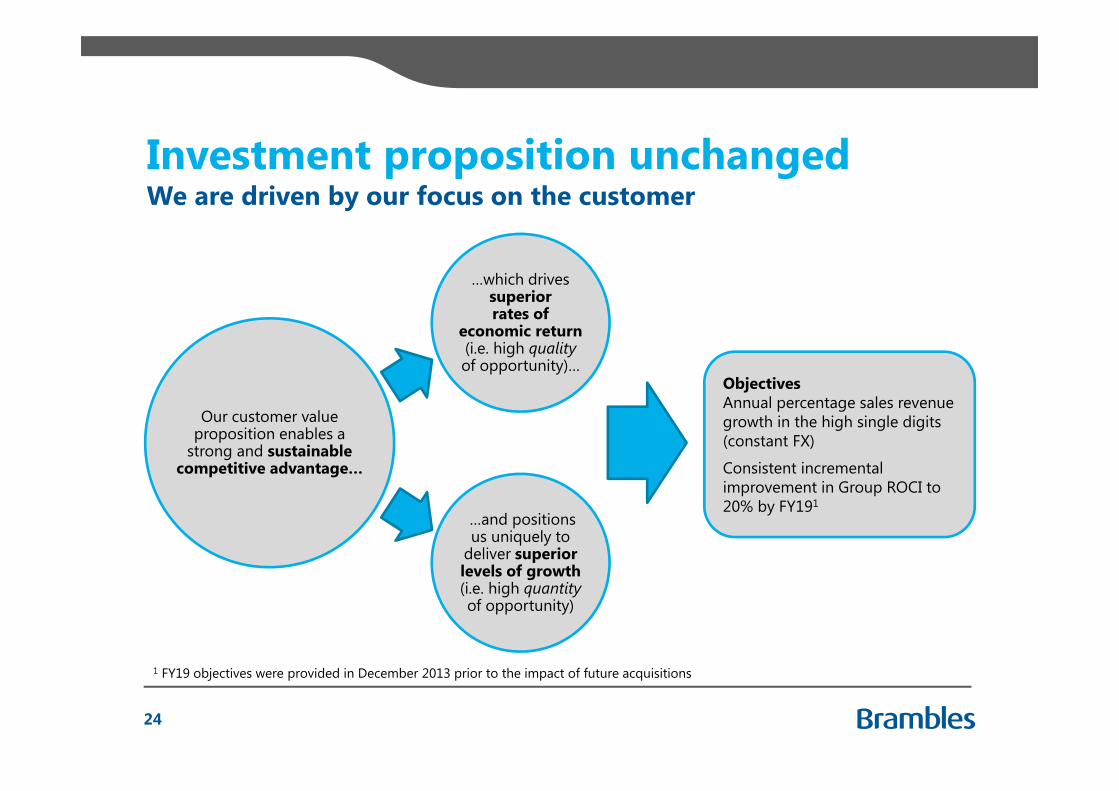
Investment proposition unchangedWe are driven by our focus on the customer
ObjectivesAnnual percentage sales revenue growth in the high single digits (constant FX)
Consistent incremental improvement in Group ROCI to 20% by FY191
…which drives superiorrates of
economic return(i.e. high quality of opportunity)…
…and positions us uniquely to
deliver superior levels of growth (i.e. high quantityof opportunity)
Our customer value proposition enables a
strong and sustainable competitive advantage…
1 FY19 objectives were provided in December 2013 prior to the impact of future acquisitions
24

What has changed since December 2013?
Assumptions – December 2013 Additional assumptions – August 2015
Macro- Flat growth in major economies- Challenging environment for political leadership- Cost pressures
- Impacts of improved US pallet pool managementand support for increased retail inventories
- IFCO pool growth and crate diversification
- Pervasive impact of weak global growth outlook
- Intensifying competitor activity
- Scale of opportunity for differentiated offering
Industry- New store formats and multi-channel fulfilment- SKU proliferation and promotional complexity- Growth of private label, online and omni-channel- Global flows and standardization
Customer- Demand for solutions providers- Outsourcing of non-core activities- Sustainability focus- Competitor activity Higher rate of investment growth as Brambles,
given superior scale and funding capability, invests proactively to support customers and enhance
network advantage~5% compound annual growth rate
in Average Capital Invested
Increased investment opportunity despite challenges
25

More investment to drive valueOrganic growth capex opportunity to FY19 of US$1.5B
0
100
200
300
400
500
600
FY15 FY16F FY17F FY18F FY19F
Approximate organic growth capex expectations by year (US$M)
Pallets RPCs Containers Group
Key FY16-FY19 organic growth investment focus areas:
Expansion and replenishment of US pallet pool to support supply-chain restockingDifferentiation of RPC offerings in support of major retail partner merchandising programsRollout of new pallet platforms to provide better solutions for customers Emerging markets expansion
Investment heavily weighted towards opportunities with incremental returns well above Brambles’ cost of capital
26

Disciplined capital allocation focusManaging the portfolio for maximisation of value
27
Average Capital Invested growth
Retu
rn o
n Ca
pita
l Inv
este
d
Notes: Return on Capital Invested and Average Capital invested growth based on FY15 organic trends but not shown to scale; bubble sizes reflect FY15 Average Capital Invested; operating business unit structures used (i.e. ANZ and South Africa RPCs and Auto shown within CHEP); arrows represent incremental Return on Capital Invested excluding acquired intangibles.
North America
Latin America
EuropeAIME
Asia-Pacific
Europe
North America
South America
Auto
IBCs
Oil & Gas AerospaceLeanLogistics
CHEP
Containers
IFCO
Legend

Guidance and outlook summary
FY19 objectivesCommitment remains to 20% ROCI target, prior to acquisition impactsAverage Capital Invested CAGR likely to exceed original 5% expectationOrganic growth investment now anticipated at US$1.5B from FY16 to FY19
FY16 expectationsSales revenue and Underlying Profit growth expected at 6-8% at constant FXTranslates to Underlying Profit of US$1,000-1,020M at 30 June 2015 FXROCI to be down slightly, reflecting short-term impact of increased investment and FY15 acquisitionsInterest costs of approximately US$120-125M, at 30 June 2105 FX ratesEffective tax rate of approximately 29%
Increased investment to support long-term objectives
28

Q&A

Full-Year Results
20 August 2015

Appendices

Appendix 1
Except where noted, common terms and measures used in this document are based upon the following definitions:
Actual currency/FX Results translated into US dollars at the applicable actual monthly exchange rates ruling in each period.
Average Capital Invested (ACI)
Average Capital Invested (ACI) is a twelve-month average of capital invested.Capital invested is calculated as net assets before tax balances, cash and borrowings but after adjustment for accumulated pre-tax Significant Items, actuarial gains and losses and net equity adjustments for equity-settled share-based payments.
Brambles Injury Frequency Rate (BIFR)
Safety performance indicator that measures the combined number of fatalities, lost time injuries, modified duties and medical treatments per million hours worked.
Brambles Value Added (BVA) Represents the value generated over and above the cost of the capital used to generate that valueIt is calculated using fixed June 2014 exchange rates as:• Underlying Profit; plus• Significant Items that are part of the ordinary activities of the business; less• Average Capital Invested, adjusted for accumulated pre-tax Significant Items that are part of the
ordinary activities of the business, multiplied by 12%.
Capital expenditure (capex) Unless otherwise stated, capital expenditure is presented on an accruals basis and excludes intangible assets, investments in associates and equity acquisitions. It is shown gross of any fixed asset disposals proceeds.
Cash Flow from Operations Cash flow generated after net capital expenditure but excluding Significant Items that are outside the ordinary course of business.
Constant currency/FX Current period results translated into US dollars at the actual monthly exchange rates applicable in the comparable period, so as to show relative performance between the two periods before the translation impact of currency fluctuations.
Glossary of terms and measures
32

Appendix 1
Except where noted, common terms and measures used in this document are based upon the following definitions:
DIN The sum in a period of:- Depreciation expense;- Irrecoverable Pooling Equipment Provision expense; and - Net book value of compensated assets and scraps (disposals).Used as a proxy for the cost of leakage and scraps in the income statement and estimating replacement capital expenditure.
Earnings per share (EPS) Profit after tax, minority interests and Significant Items, divided by weighted average number of shares on issue during the period.
Earnings before interest, tax, depreciation and amortisation (EBITDA)
Operating profit from continuing operations after adding back depreciation and amortisation and Significant Items outside the ordinary course of business.
Free Cash Flow Cash flow generated after net capital expenditure, finance costs and tax, but excluding the net cost of acquisitions and proceeds from business disposals.
Global Supply Chain Program launched in FY12 for completion in FY15 to reduce global direct costs by US$100 million through Pallets supply chain and logistics efficiencies and IFCO integration synergies. The target has been achieved at the end of FY15.
Irrecoverable Pooling Equipment Provision (IPEP)
Provision held by Brambles to account for pooling equipment that cannot be economically recovered and for which there is no reasonable expectation of receiving compensation.
Glossary of terms and measures (continued)
33
Appendix 1
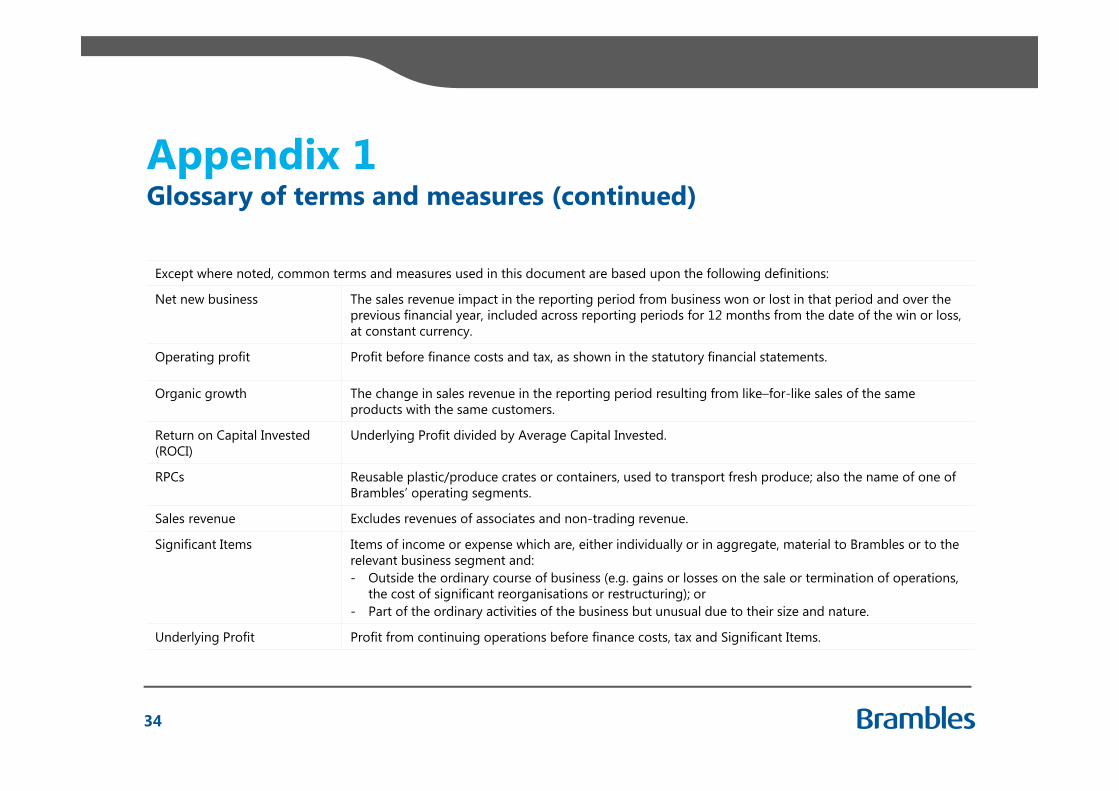
Except where noted, common terms and measures used in this document are based upon the following definitions:
Net new business The sales revenue impact in the reporting period from business won or lost in that period and over the previous financial year, included across reporting periods for 12 months from the date of the win or loss, at constant currency.
Operating profit Profit before finance costs and tax, as shown in the statutory financial statements.
Organic growth The change in sales revenue in the reporting period resulting from like–for-like sales of the same products with the same customers.
Return on Capital Invested (ROCI)
Underlying Profit divided by Average Capital Invested.
RPCs Reusable plastic/produce crates or containers, used to transport fresh produce; also the name of one of Brambles’ operating segments.
Sales revenue Excludes revenues of associates and non-trading revenue.
Significant Items Items of income or expense which are, either individually or in aggregate, material to Brambles or to the relevant business segment and: - Outside the ordinary course of business (e.g. gains or losses on the sale or termination of operations,
the cost of significant reorganisations or restructuring); or - Part of the ordinary activities of the business but unusual due to their size and nature.
Underlying Profit Profit from continuing operations before finance costs, tax and Significant Items.
Glossary of terms and measures (continued)
34

Appendix 2
965
1,065
960986
943
FY14 result(30 June2014 FX)
FY15 result(30 June2014 FX)
FY14 result(actual FX)
FY15 result(actual FX)
FY15 result(30 June2015 FX)
FY16 guidance(30 June2015 FX)
Underlying Profit currency reconciliation (US$M)
35
Growth: 10%
Growth: 6-8%Growth: 3%
FY15 guidance FY15 reported FY16 guidance
1,000 – 1,020
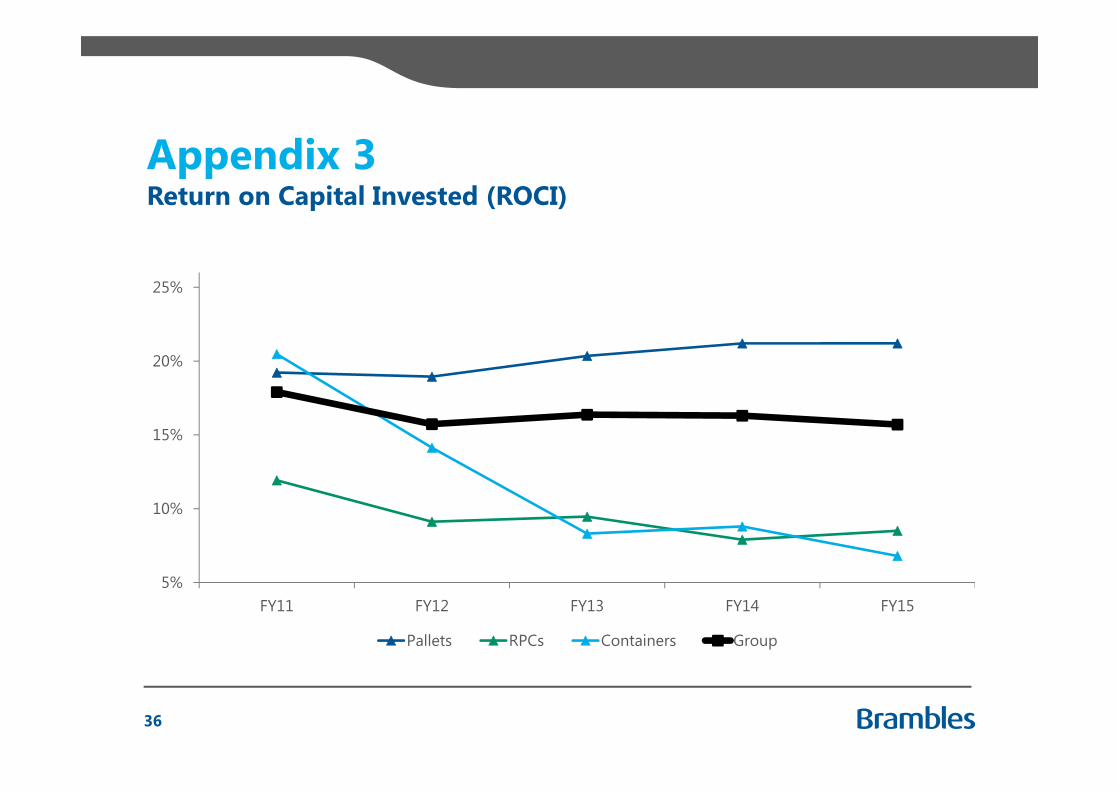
Appendix 3
5%
10%
15%
20%
25%
FY11 FY12 FY13 FY14 FY15
Pallets RPCs Containers Group
Return on Capital Invested (ROCI)
36

Appendix 4
(US$M) Total USD EUR GBP AUD CAD MXN ZAR CHF BRL Other1
Pallets 4,082 1,818 761 349 264 274 155 112 11 66 271
RPCs 918 192 426 74 80 - - 23 55 13 55
Containers 466 69 145 86 66 14 - 12 22 2 50
Sales revenue 5,465 2,079 1,332 509 410 288 155 147 88 81 376
Share 100% 38.0% 24.4% 9.3% 7.5% 5.3% 2.8% 2.7% 1.6% 1.5% 6.9%
Net debt2 2,689 1,298 1,476 260 (480) (58) (19) 60 11 27 114
FY15 currency mix
37
1 No individual currency within ‘Other’ exceeds 1% of FY15 Group sales revenue at actual FX rates2 Net debt shown after adjustments for impact of financial derivatives

Appendix 5
USD exchange rate: USD EUR GBP AUD CAD MXN ZAR CHF BRL
Average
FY15 1.0000 1.1946 1.5734 0.8301 0.8505 0.0697 0.0876 1.0605 0.3748
FY14 1.0000 1.3587 1.6331 0.9142 0.9334 0.0765 0.0961 1.1089 0.4373
As at
30 Jun 15 1.0000 1.1220 1.5729 0.7673 0.8056 0.0637 0.0816 1.0800 0.3207
30 Jun 14 1.0000 1.3643 1.7033 0.9415 0.9375 0.0772 0.0943 1.1222 0.4559
Major currency exchange rates1
38
1 Includes all currencies that exceed 1.0% of FY15 Group sales revenue, at actual FX rates

Appendix 6
Maturity Type Committed facilities
Uncommitted facilities Debt drawn Headroom
(US$B at 30 June 2015)
<12 months Bank/USPP1/Other 0.1 0.2 0.1 0.2
1 to 2 years Bank/USPP1/Other 0.8 - 0.4 0.4
2 to 3 years Bank/EMTN2/Other 1.0 - 0.8 0.2
3 to 4 years Bank/USPP1/Other 0.3 - 0.1 0.2
4 to 5 years Bank/144A3/Other 0.9 - 0.8 0.1
>5 years EMTN2/Other 0.6 - 0.6 -
Total 3.7 0.2 2.8 1.1
Credit facilities and debt profile
1 US Private Placement notes2 European Medium Term Notes3 US 144A bonds
39
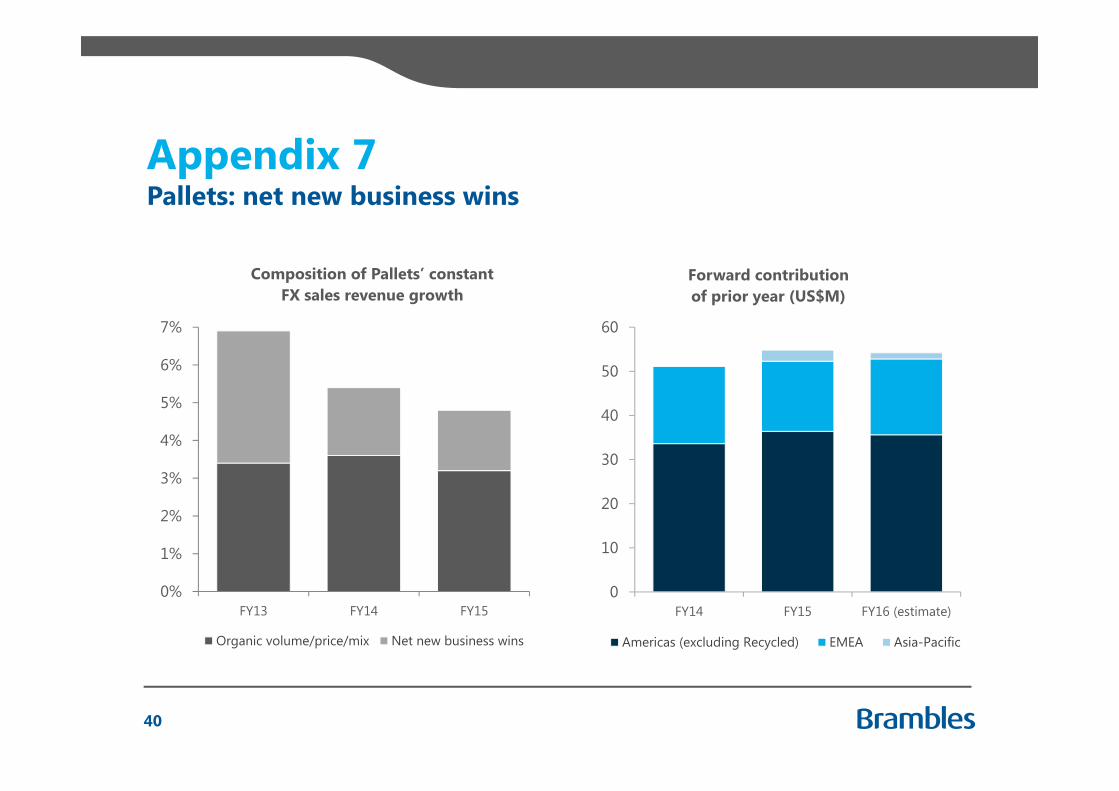
Appendix 7Pallets: net new business wins
0%
1%
2%
3%
4%
5%
6%
7%
FY13 FY14 FY15
Composition of Pallets’ constant FX sales revenue growth
Organic volume/price/mix Net new business wins
0
10
20
30
40
50
60
FY14 FY15 FY16 (estimate)
Forward contribution of prior year (US$M)
Americas (excluding Recycled) EMEA Asia-Pacific
40

Appendix 8
80%
90%
100%
110%
120%
FY11 FY12 FY13 FY14 FY15
Americas EMEA Asia-Pacific Total
Pallets sales revenue/Average Capital Invested
41

Appendix 9
0%
2%
4%
6%
8%
10%
12%
14%
0
100
200
300
400
500
600
700
800
FY11 FY12 FY13 FY14 FY15
Replacement capex (US$M, LHS) Growth capex (US$M, LHS) DIN/sales revenue (RHS)
Pallets capital expenditure: growth vs. replacement
42
Note: data excluded USA recycled pallet operations
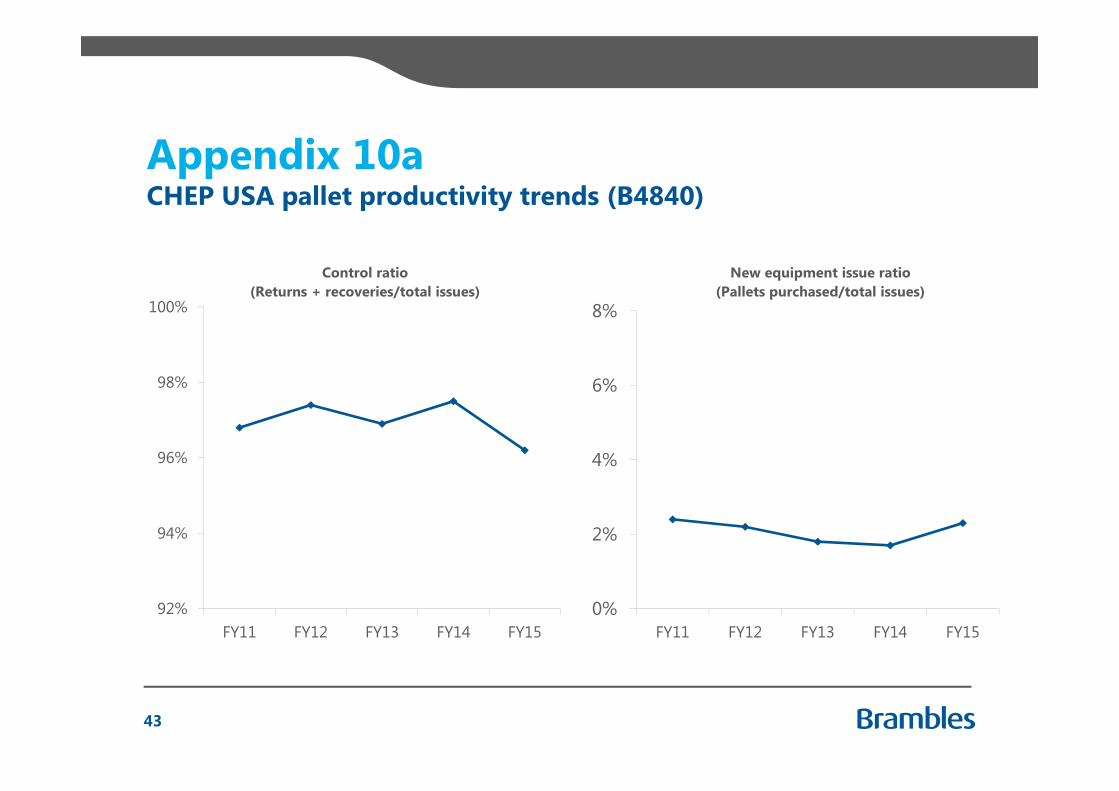
Appendix 10aCHEP USA pallet productivity trends (B4840)
43
92%
94%
96%
98%
100%
FY11 FY12 FY13 FY14 FY15
Control ratio(Returns + recoveries/total issues)
0%
2%
4%
6%
8%
FY11 FY12 FY13 FY14 FY15
New equipment issue ratio(Pallets purchased/total issues)

Appendix 10bCHEP Europe pallet productivity trends (B1210 and B1208)
44
92%
94%
96%
98%
100%
FY11 FY12 FY13 FY14 FY15
Control ratio(Returns + recoveries/total issues)
0%
2%
4%
6%
8%
FY11 FY12 FY13 FY14 FY15
New equipment issue ratio(Pallets purchased/total issues)

Appendix 11a
435 430 417
51
16
2(74)
(13)
FY14 Volume,price, mix
GlobalSupplyChain
Directcosts
Other FY15(constant FX)
FX FY15
Pallets Americas: Underlying Profit analysis (US$M)
45

Appendix 11b
326
378
344
44
15 3 (10)
(34)
FY14 Volume,price, mix
GlobalSupplyChain
Directcosts
Other FY15(constant FX)
FX FY15
Pallets EMEA: Underlying Profit analysis (US$M)
46

Appendix 11c
7679
72
8
3 (3)
(5)
(7)
FY14 Volume,price, mix
GlobalSupplyChain
Directcosts
Other FY15(constant FX)
FX FY15
Pallets Asia-Pacific: Underlying Profit analysis (US$M)
47

Appendix 11d
124
144132
30
(10)
(12)
FY14 Volume,price, mix
Directcosts
FY15(constant FX)
FX FY15
RPCs: Underlying Profit analysis (US$M)
48

Appendix 11e
38
6559
12
24
(6)
FY14 Volume,price, mix
Other Acquisitions FY15(constant FX)
FX FY15
Containers: Underlying Profit analysis (US$M)
49

Disclaimer
The release, publication or distribution of this presentation in certain jurisdictions may be restricted by law and therefore persons in such jurisdictions into which this presentation is released, published or distributed should inform themselves about and observe such restrictions.This presentation does not constitute, or form part of, an offer to sell or the solicitation of an offer to subscribe for or buy any securities, nor the solicitation of any vote or approval in any jurisdiction, nor shall there be any sale, issue or transfer of the securities referred to in this presentation in any jurisdiction in contravention of applicable law.Persons needing advice should consult their stockbroker, bank manager, solicitor, accountant or other independent financial advisor. Certain statements made in this presentation are forward-looking statements.These forward-looking statements are not historical facts but rather are based on Brambles’ current expectations, estimates and projections about the industry in which Brambles operates, and beliefs and assumptions. Words such as "anticipates," "expects," "intends," "plans," "believes," "seeks,” "estimates," and similar expressions are intended to identify forward-looking statements.These statements are not guarantees of future performance and are subject to known and unknown risks, uncertainties and otherfactors, some of which are beyond the control of Brambles, are difficult to predict and could cause actual results to differ materially from those expressed or forecasted in the forward-looking statements. Brambles cautions shareholders and prospective shareholders not to place undue reliance on these forward-looking statements, which reflect the view of Brambles only as of the date of this presentation.The forward-looking statements made in this presentation relate only to events as of the date on which the statements are made. Brambles will not undertake any obligation to release publicly any revisions or updates to these forward-looking statements to reflect events, circumstances or unanticipated events occurring after the date of this presentation except as required by law or by any appropriate regulatory authority
50

Investor Relations contacts
James HallVice President, Investor Relations & Corporate [email protected]+61 2 9256 5262+61 401 524 645
Raluca ChiriacescuManager, Investor [email protected]+61 2 9256 5211+61 427 791 189
51

Full-Year Results
20 August 2015