Financial time series analysis
19
Indian Institute of Science Education & Research, Kolkata Analysis of Financial Time Series Data Nitish Kumar(09EE63) Department of Electrical & Electronics Engineering National Institute of Technology Surathkal, Karanatka under the supervision of Prof. Prasanta K.Panigrahi Department of Physical Sciences
-
Upload
nitish1111 -
Category
Documents
-
view
47 -
download
2
description
The world is driven by the resources it can afford. In the modern world which can best be described as a complex network of interdependent organizations, money has ascended to the position of being an important component of life. The different organizations have to share their resources and thus money becomes all the more important. Where you put your money is thus a very important question. As it turns out, Science can help you make a better judgment in such cases. The purpose of studying science is to understand your world better. Using modern analysis techniques, it becomes easy for us to analyse the trends that a particular organizations shows. The trends of different organizations can be subsequently compared and some conclusions can be drawn regarding their performance. The aim of this work is to study different organizations in a common time period, and see how they evolved over the said period. We try and pick out some trends which are common and search for a reason. The knowledge of how an organization performed under the influence of external factors can help a buyer make a better judgment as to where he should invest his money. Thus analyzing the history and trends assumes a significant value.
Transcript of Financial time series analysis

Indian Institute of Science Education & Research, Kolkata
Analysis of Financial
Time Series Data
Nitish Kumar(09EE63)
Department of Electrical & Electronics Engineering
National Institute of Technology Surathkal, Karanatka
under the supervision of
Prof. Prasanta K.Panigrahi
Department of Physical Sciences
Indian Institute of Science Education & Research, Kolkata
Mohanpur, Nadia dist., West Bengal, India

Certificate
This is to certify that the project report entitled “Analysis of financial time series data” being submitted to the Department of Physical Sciences, Indian Institute of Science Education and Research, Kolkata, India for Summer Internship Programme 2012, embodies the research work done by Nitish Kumar (09EE63) under my supervision at IISER- Kolkata. The work presented here is original and has not been submitted so far, in part or full, for any degree or diploma at any other university/institute.
Date: Prof. Prasanta K. Panigrahi
(Supervisor)
Acknowledgement
The driving force behind the choice of the project title was the wonderful encouragement that my supervisor Prof. Prasanta K. Panigrahi provided. Prof. Panigrahi had an enriching prior experience in this field and the starting point therefore became easier. This work would have not been possible without his experience on my side. Over the course of the period of the work, Prof. Panigrahi provided valuable inputs as to how I should move forward. My parents were a constant driving force for me, as there were times when I felt exhausted but they kept me going.
Introduction

The world is driven by the resources it can afford. In the modern world which can best be described as a complex network of interdependent organizations, money has ascended to the position of being an important component of life. The different organizations have to share their resources and thus money becomes all the more important. Where you put your money is thus a very important question. As it turns out, Science can help you make a better judgment in such cases. The purpose of studying science is to understand your world better. Using modern analysis techniques, it becomes easy for us to analyse the trends that a particular organizations shows. The trends of different organizations can be subsequently compared and some conclusions can be drawn regarding their performance. The aim of this work is to study different organizations in a common time period, and see how they evolved over the said period. We try and pick out some trends which are common and search for a reason. The knowledge of how an organization performed under the influence of external factors can help a buyer make a better judgment as to where he should invest his money. Thus analyzing the history and trends assumes a significant value.
Wavelet Transform

From Fourier Theory, it is known that a signal can be expressed as the sum of possibly infinite,
series of sines and cosines. This sum is also referred to as Fourier expansion. FT gives the
frequency information of the signal, which means that the frequency components exist in the
signal can be known. But, it does not give any information about at the time of these frequency
components exist. This information is not required when the signal is stationary. Most of the
waveforms associated with fast electromagnetic transients are non-stationary signals which
contain both high frequency oscillations and localized impulses super imposed on the power
frequency and its harmonics. With FT, it is impossible to find a particular fault location. It is very
much needed in transient signals. This is a serious drawback of Fourier Transform.
Wavelet transform is useful in finding out the time localization of a particular frequency.
In order to do that, wavelet transform breaks down the time signal into various wavelets and
expresses it as a sum of it all. In order to understand wavelet transform, it is important to
understand what a wavelet is. The properties of a wavelet are as follows –
1. These are small localized waves. This property is important since the particular frequency
that the wavelet represents could be localized in a short localized time. In order to faithfully
represent that, the wavelets themselves have to be small and localized.
2. Finite in size. The finite size of the wavelet allows us to represent data which is also
finite is size.
3. Orthogonal. The wavelets are orthogonal to each other and they form basis vectors. As a
result, the whole signal can be expressed as a sum of various frequencies represented by the
wavelets.
4. Integrable. Any function which satisfies all these criterion can be called a wavelet.
Some common wavelets are Morlet, Harr and Daubechies.

Time series
In terms of probability theory, a time series is defined as a sequence of random variables
that explicitly depend on time. The price of a stock which can change every day, also forms a
time series. A time series is a condensed representation of the entire history of the entity
involved. For our study we have taken the daily closing price data of different stock markets all
over the world, and subsequently the daily closing price data for ninety nine companies listed in
BSE 100.
Stock Market Basics
The stock of a business entity represents the original capital paid into or invested in the
business by its founders. It serves as a security for the creditors of a business since it
cannot be withdrawn to the detriment of the creditors. Stock is different from the
property and the assets of a business which may fluctuate in quantity and value. A stock
market or equity market is a public entity for the trading of company stock (shares) and
derivatives at an agreed price; these are securities listed on a stock exchange as well as those
only traded privately. The stock market is one of the most important sources for
companies to raise money. This allows businesses to be publicly traded, or raise
additional financial capital for expansion by selling shares of ownership of the company in a
public market. The liquidity that an exchange affords the investors gives them the ability to
quickly and easily sell securities. This is an attractive feature of investing in stocks, compared
to other less liquid investments such as real estate. Some companies actively increase liquidity
by trading in their own shares. History has shown that the price of shares and other assets is an

important part of the dynamics of economic activity, and can influence or be an
indicator of social mood. An economy where the stock market is on the rise is considered to
be an up-and-coming economy. In fact, the stock market is often considered the primary
indicator of a country's economic strength and development. Rising share prices, for instance,
tend to be associated with increased business investment and vice versa. Share prices also
affect the wealth of households and their consumption. Therefore, central banks tend to keep
an eye on the control and behavior of the stock market and, in general, on the smooth
operation of financial system functions. Financial stability is the raison d'être of central banks.
Exchanges also act as the clearinghouse for each transaction, meaning that they collect
and deliver the shares, and guarantee payment to the seller of a security. This eliminates the
risk to an individual buyer or seller that the counterparty could default on the transaction. The
smooth functioning of all these activities facilitates economic growth in that lower costs
and enterprise risks promote the production of goods and services as well as possibly
employment. In this way the financial system is assumed to contribute to increased prosperity.
A stock market crash is often defined as a sharp dip in share prices of equities listed on
the stock exchanges. In parallel with various economic factors, a reason for stock market
crashes is also due to panic and investing public's loss of confidence. Often, stock market
crashes end speculative economic bubbles.
We looked at the ninety nine ompanies listed in BSE 100 and analyzed their trends. The companies that were studied are along with their ‘’company index’’ as used are –
1 Aban Offshore 26 Financial Technologies (India)
2 ABB 27 GAIL (India)
3 ACC 28 Glenmark Pharmaceuticals
4 Adani Enterprises 29 GMR Infrastructure
5 Aditya Birla Nuvo 30 Grasim Industries
6 Ambuja Cements 31 HCL Technologies
7 Ashok Leyland 32 HDFC Bank
8 Asian Paints 33 Hero Honda Motors
9 Axis Bank 34 Hindalco Industries
10 Bajaj Auto 35 Hindustan Petroleum Corporation
11 Bank of Baroda 36 Hindustan Unilever
12 Bank of India 37 Housing Development &Infrastructure
13 Bharat Forge 38 Housing Development Finance Corporation
14 Bharat Heavy Electricals 39 ICICI Bank
15 Bharat Petroleum Corporation 40 IDBI Bank
16 Bharti Airtel 41 Idea Cellular
17 Cairn India 42 India Cements
18 Century Textiles & Industries 43 Indiabulls Financial Services
19 Cipla 44 Indiabulls Real Estate
20 Crompton Greaves 45 Indian Hotels Company
21 Divi's Laboratories 46 Indian Oil Corporation
22 DLF 47 Infosys
23 Dr. Reddy's Laboratories 48 Infrastructure Development Finance Company
24 Educomp Solutions 49 ITC
25 Essar Oil 50 IVRCL Infrastructure & Projects

51 Jaiprakash Associates 76 Reliance Power
52 Jindal Steel & Power 77 Sesa Goa
53 JSW Steel 78 Shriram Transport Finance Company
54 Kotak Mahindra Bank 79 Siemens
55 Larsen & Toubro 80 State Bank of India
56 Lupin 81 Steel Authority of India
57 Mahindra & Mahindra 82 Sterlite Industries (India)
58 Maruti Suzuki India 83 Sun Pharmaceutical Industries
59 MMTC 84 Suzlon Energy
60 Mundra Port & Special Economic Zone 85 Tata Chemicals
61 National Aluminium Company 86 Tata Communications
62 Nestle India 87 Tata Consultancy Services
63 NHPC 88 Tata Global Beverages
64 NMDC 89 Tata Motors
65 NTPC 90 Tata Power Company
66 Oil & Natural Gas Corporation 91 Tata Steel
67 Power Finance Corporation 92 Torrent Power
68 Power Grid Corporation of India 93 UltraTech Cement
69 Punj Lloyd 94 Union Bank of India
70 Punjab National Bank 95 Unitech
71 Ranbaxy Laboratories 96 United Phosphorus
72 Reliance Capital 97 United Spirits
73 Reliance Communications 98 Welspun Corp
74 Reliance Industries 99 Wipro
75 Reliance Infrastructure
Result and Discussions
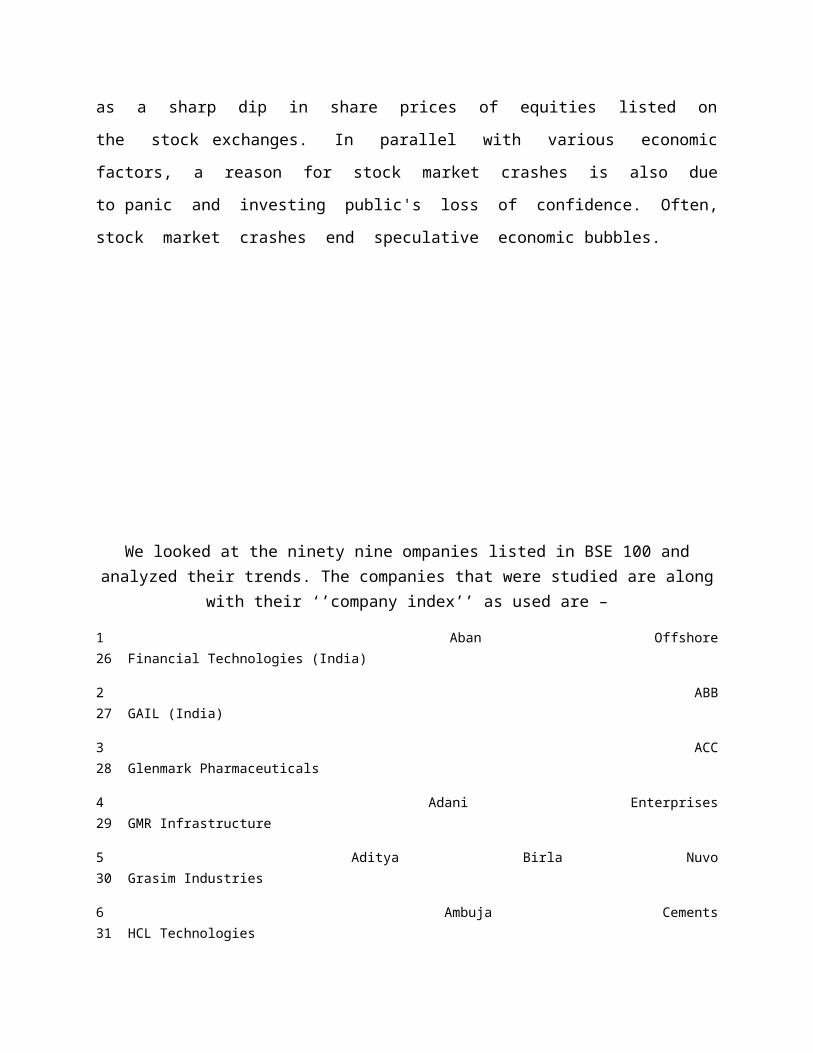
The period of the study was Jan 2008 to April 2012. The same has been done for all the other companies. Then, once we found some prevalent trends, we looked at possible causes for those by looking at newspaper article of around the time that the wavelet picture suggests for the event.
Wavelet Coefficients of ACC
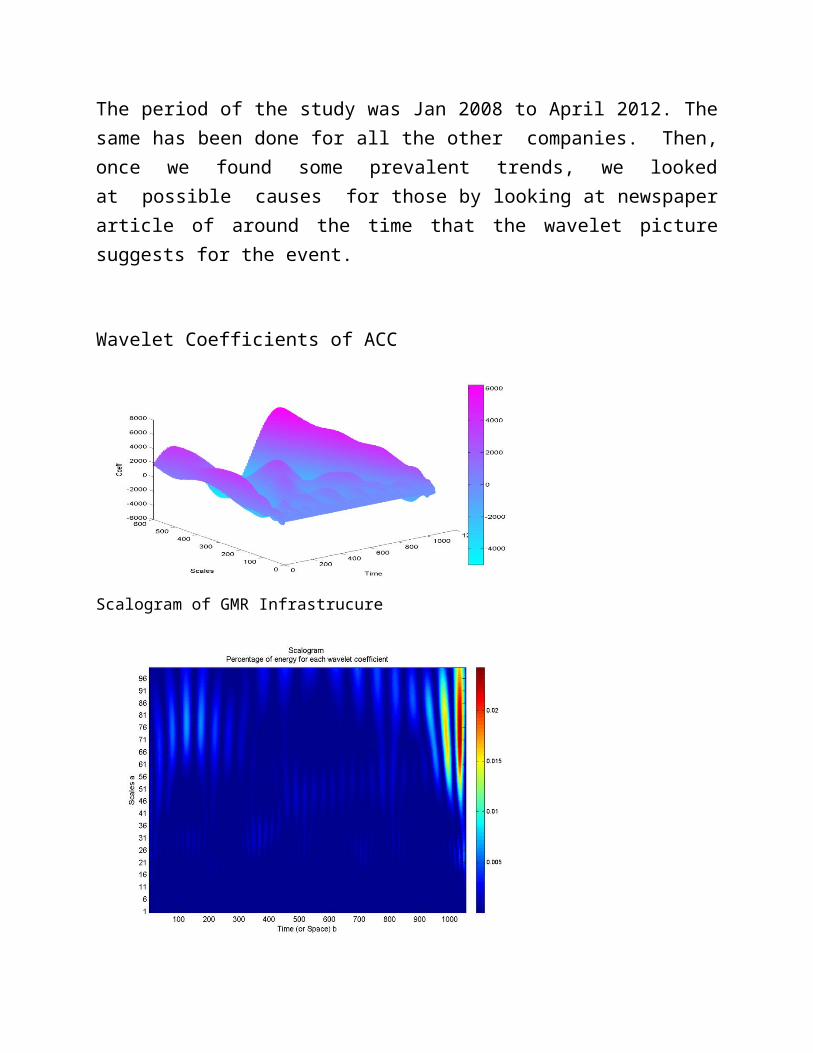
Scalogram of GMR Infrastrucure
The semi- log plot of wavelet power summed over all time at different scales ( time period ) . Here also one sees the variations at 15 and 31 months.

These three plots were plotted for all 99 companies of BSE 100. And we find out that some companies had approximately same Time Period through Semi-log plot.

Companies with Companies with
Time period of 15 weeks Time period of 31 weeks
Company Index Company Index
Plotting 15 weeks period over the data
Plotting 31 weeks period over the data
We can see that the trend maxima and minima are following are approximately 15 and 31 weeks period respectively. The correlation Values of these companies also shows that some companies are closely related.
Codes
function stockmarket()load data;z(:,:)=data;for j=97:97;size(z(:,j))n=1:1053;
m=mean(z(:,j));s=std(z(:,j));i=1:length(z(:,j));z(:,j)=(z(i,j)-m)./s;
y=j;figure(1)
title('company market value'); figure(1)
plot(n,z(:,j));saveas(gcf, ['C',num2str(j),'1'], 'tiffn') xlabel('years');xlim([1 1053]); [c,l] = wavedec(z(:,j),2,'db4');z1 = wrcoef('a',c,l,'db4',2);
031219222425344753697089909197
031112131520252930405053547075788992

figure(2);c=cwt(z1,1:1:100,'morl','3Dplot');saveas(gcf,['C',num2str(j),'2'], 'tiffn') title('3D plot showing wavelet coefficients from scales 1-100');figure(3);w=wscalogram('image',c);saveas(gcf,['C',num2str(j),'a'], 'tiffn')figure(10)k=cwt(z(:,j),1:100,'morl');w=wscalogram('image',k);saveas(gcf,['output4',num2str(j)], 'tiffn') hold off x=1:1053; %15 weeks period figure(4) subplot(2,2,1); c1=cwt(z1,30,'morl'); plot(x,c1); title('plotting 15 weeks period'); z=transpose(z(:,j)); n=1:1053; zw=[z(n);c1(n)]; zw=transpose(zw); subplot(2,2,2); plot(x,zw); saveas(gcf,['output',num2str(j),'c'], 'tiffn')title('plotting 15 weeks period over the data');R1 = corr2(z,c1) %31 weeks period figure(5) subplot(2,2,1); c1=cwt(z1,60,'morl'); plot(n,c1); title('plotting 31 weeks period '); n=1:1053; zw=[z(n);c1(n)]; zw=transpose(zw); subplot(2,2,2); plot(x,zw); saveas(gcf, ['output',num2str(j),'d'], 'tiffn') title('plotting 31 weeks period over the data'); figure(4) report2 saveas(gcf,['C',num2str(y),'b'], 'tiffn')end
% report2%clca(:,:)=data;b=length(a(:,j));c=cwt(a(:,j),1:100,'morl','plot');for i=1:100
d=c(i,:); for j=1:1053; if (d(j)<=0) d(j)=-1*d(j); end; end p(1,i)=sum(d); semilogy(i,p(1,i),'r*-') hold on grid onend hold off
function stockmarket1()load data;z(:,:)=data; for i=1:99; y=i; for j=1:1052; r(j,i)=log(z(j+1,i))-log(z(j,i)); end R(:,i)=(r(:,i)-mean(r(:,i)))/std(r(:,i));endc=corr(R)
References
1. Prof. Prasanta K. Panigrahi , Physica A papers
2.Wavelet Toolbox For Use with MATLAB® by Zichel Misiti Yves Misiti Georges Oppenheim Jean-Michel Poggi.
3. Oppenheim and Wilsky: Signals and Systems(2004).
4.A practical guide to wavelet analysis- Torrence and Compo.