Financial Terms and Royalty Rates in Pharmaceutical...
109
Report on Financial Terms and Royalty Rates in Pharmaceutical Deals Produced, Published and Distributed by
-
Upload
dangkhuong -
Category
Documents
-
view
220 -
download
0
Transcript of Financial Terms and Royalty Rates in Pharmaceutical...

Report on
Financial Terms
and
Royalty Rates
in Pharmaceutical Deals
Produced, Published and Distributed by

Medius Associates
© MEDIUS ASSOCIATES 2

ACKNOWLEDGEMENTS Medius Associates would like to thank Pharmalicensing for its valued assistance in sourcing data for this project. All rights reserved. No part of this publication may be reproduced or transmitted, in any form or by any means, electronic, mechanical, photocopying, recording or otherwise, or stored in any retrieval system of any nature, without the written permission of the copyright holder and publisher, application for which shall be made to the publisher. Authors: Sharon Finch and Elizabeth McNabb. Published by: Medius Associates Ltd. 47 Upfield Croydon CR0 5DR, UK Tel: +44 (0) 20 8654 6040
Fax: +44 (0) 20 8654 6046 www.medius-associates.com www.mediuspublications.com www.mediustraining.com The Authors' Rights to be identified have been asserted in accordance with the Copyright, Designs and Patents Act 1988. This work may not be photocopied or otherwise reproduced within the terms of any licence granted by the Copyright Licensing Agency Ltd or the Publishers Licensing Society Ltd This management report may not be reproduced in any form or for any purpose without prior knowledge and consent of the publisher. The views and opinions expressed in this report are not necessarily those of the publisher. While information, advice or comment is believed to be correct at the time of publication, no responsibility can be accepted by the publisher or the authors for its completeness or accuracy. ISBN No: 0-9542237-0-5 Typeset, printed and bound in Great Britain by: Printrite, 316 Pickhurst Lane, West Wickham, Kent, BR4 0HT, UK. www.printrite.net
© MEDIUS ASSOCIATES 3

LIST OF CONTENTS
EXECUTIVE SUMMARY..................................................................................10
INTRODUCTION...........................................................................................12
QUESTIONNAIRE..........................................................................................13
THE PARTNER COMPANIES ....................................................................................14 THE DEAL TYPE..................................................................................................15 THE DEGREE OF EXCLUSIVITY.................................................................................16 TERRITORIAL EXTENT...........................................................................................17 INTELLECTUAL PROPERTY RIGHTS (IPR) ....................................................................17 Variation of royalty rates ..............................................................................19 PROJECT DEVELOPMENT STATUS.............................................................................20 THERAPEUTIC FIELD ............................................................................................21 FINANCIAL MODELS ............................................................................................21 FINANCIAL ASSESSMENT.......................................................................................22 KEY FINANCIAL TERMS.........................................................................................23 Upfront payments.........................................................................................24 Milestone payments......................................................................................24 Equity investment .........................................................................................25 Royalty levels................................................................................................26 PERFORMANCE CRITERIA ......................................................................................27 ADDITIONAL INFORMATION ..................................................................................27
METHODOLOGY ..........................................................................................28
COMPANY INCLUSION CRITERIA .............................................................................28 EXCLUSION CRITERIA...........................................................................................29 Diagnostic companies...................................................................................29 OTC companies ............................................................................................30 Japanese company participation ...................................................................30
REVIEW OF RESULTS.....................................................................................31
DIRECT MAIL VS. WEB RESPONSES...........................................................................31 REVIEW OF RESPONSES ........................................................................................33 REVIEW OF GEOGRAPHICAL SPREAD .........................................................................34 RESPONSE RATES ...............................................................................................37 PARTNER COMPANY ...........................................................................................38 DEAL TYPE.......................................................................................................41 EXCLUSIVITY & TERRITORY ...................................................................................42 Exclusivity ....................................................................................................42 Territory .......................................................................................................43
© MEDIUS ASSOCIATES 4

INTELLECTUAL PROPERTY RIGHTS............................................................................44 DEVELOPMENT STATUS ........................................................................................47 THERAPEUTIC FIELDS ..........................................................................................48 FINANCIAL MODELS............................................................................................49 ANTICIPATED PEAK SALES ....................................................................................51 ANTICIPATED DEVELOPMENT COSTS ........................................................................52 HEADLINE VALUE ...............................................................................................54 UP FRONT FEES .................................................................................................57 MILESTONE PAYMENTS ........................................................................................58 EQUITY ...........................................................................................................59 COMPARISON OF EQUITY, MILESTONE AND UP FRONT FEES ...........................................61 ROYALTIES.......................................................................................................63 Agreement Type ...........................................................................................64 Development status......................................................................................65 ROYALTY BY THERAPEUTIC FIELD ............................................................................66 PERFORMANCE CRITERIA ......................................................................................66 TIME TO DEAL COMPLETION..................................................................................68
PUBLISHED DATA ANALYSIS .........................................................................70
Recombinant Capital.....................................................................................70 Parameters of data analysed .........................................................................70 Headline Value..............................................................................................71 Impact of divestment and acquisition deals on headline value ......................74 ROYALTY RATES................................................................................................76 PROJECT STATUS ...............................................................................................76
DEAL ANALYSES ..........................................................................................77
EARLY STAGE DEAL PROFILE...................................................................................77 Exceptions to the norm ................................................................................79 Influential Factors.........................................................................................80 ACQUISITION/DIVESTMENT DEAL PROFILE.................................................................81 PARTNER OVERVIEWS..........................................................................................83 Pharma-Pharma Deals ..................................................................................83 Pharma-SME Deals .......................................................................................85 SME-SME DEALS .............................................................................................86 DEAL VALUE ANALYSIS ..................................................................................88 Conclusions..................................................................................................93
FUTURE ISSUES ............................................................................................95
QUESTIONNAIRE IMPROVEMENT..............................................................................95 PARTNER COMPANY............................................................................................95 CROs ............................................................................................................95 DEAL TYPE .......................................................................................................95 Option agreements.......................................................................................95 TERRITORY ......................................................................................................96
© MEDIUS ASSOCIATES 5

PROJECT STATUS................................................................................................96 FINANCIAL TERMS ..............................................................................................96 Linking royalties to life cycles .......................................................................96 Audit of royalties ..........................................................................................96 RISK ASSESSMENT ..............................................................................................97 OTHER ISSUES ...................................................................................................97 GUIDANCE NOTES..............................................................................................97
CONCLUSIONS.............................................................................................98
Responses ....................................................................................................98 Deal type ......................................................................................................98 IPRs ..............................................................................................................99 Development status......................................................................................99 Therapeutic field ..........................................................................................99 Financial models.........................................................................................100 Peak sales / development costs ..................................................................100 Headline value ............................................................................................100 Upfront fees and milestones.......................................................................100 Equity .........................................................................................................101 Royalties.....................................................................................................101 Performance criteria ...................................................................................101 Deal completion .........................................................................................101 Published data............................................................................................101
GLOSSARY.................................................................................................102
THE AUTHORS...........................................................................................105
SHARON FINCH ...............................................................................................105 ELIZABETH MCNABB .........................................................................................106
COMPANY PROFILES ..................................................................................107
MEDIUS ASSOCIATES LIMITED..............................................................................107 PHARMALICENSING...........................................................................................108
© MEDIUS ASSOCIATES 6

TABLES
TABLE 1 DIFFERENT TYPES OF STRATEGIC ALLIANCES.........................................................15 TABLE 2 DURATION OF IP RIGHTS ................................................................................18 TABLE 3 KEY FINANCIAL ASPECTS OF A DEAL ...................................................................23 TABLE 4 EXAMPLES OF EVENTS USED TO TRIGGER MILESTONE PAYMENTS ................................24 TABLE 5 EXAMPLES OF PERFORMANCE CRITERIA ...............................................................27 TABLE 6 RANGE OF COMPANIES INVOLVED IN THE SURVEY ..................................................28 TABLE 7 DATA REJECTION CRITERIA ..............................................................................31 TABLE 8 RESPONSE TO EQUITY QUESTION.......................................................................32 TABLE 9 LOW RESPONSE RATE QUESTIONS ......................................................................37 TABLE 10 BIOGLAN – DEALS 2000 ................................................................................39 TABLE 11 CHARACTERISTICS OF FIELD EXCLUSIVE DEALS......................................................42 TABLE 12 RESPONSES ON TERRITORY .............................................................................43 TABLE 13 THERAPEUTIC FIELD - LOW LEVEL RESPONSES.......................................................48 TABLE 14 HEADLINE VALUE AND THERAPEUTIC FIELDS ........................................................55 TABLE 15 DISPARITY IN HEADLINE REPORTING ..................................................................56 TABLE 16 FEATURES OF THE TOP FOUR FINANCIAL DEALS ....................................................57 TABLE 17 RANGE OF MILESTONE PAYMENTS .....................................................................58 TABLE 18 RESPONSES ON EQUITY ..................................................................................60 TABLE 19 REWARD MECHANISMS ...................................................................................63 TABLE 20 RANGE AND AVERAGE ROYALTIES FOR DIFFERENT STRATEGIC ALLIANCES ....................64 TABLE 21 RANGE AND AVERAGE ROYALTY FOR DEVELOPMENT STATUS....................................65 TABLE 22 OTHER REPORTED PERFORMANCE CRITERIA .........................................................67 TABLE 23 LONG DURATION DEALS .................................................................................68 TABLE 24 RANGE AND AVERAGE PUBLISHED ROYALTIES........................................................76 TABLE 25 TYPICAL FEATURES OF AN EARLY STAGE DEAL ......................................................77 TABLE 26 TYPICAL FEATURES OF AN ACQUISITION/DIVESTMENT............................................81 TABLE 27 TYPICAL FEATURES OF PHARMA-PHARMA DEALS...................................................83 TABLE 28 TYPICAL FEATURES OF A PHARMA/SME DEAL......................................................85 TABLE 29 TYPICAL FEATURES OF AN SME/SME DEAL.........................................................86 TABLE 30 RANGE OF ESTIMATED PEAK SALES $ M ..............................................................88 TABLE 31 SUMMARY TABLE OF PEAK SALES AND FINANCIAL TERMS .........................................93
© MEDIUS ASSOCIATES 7

FIGURES FIGURE 1 COMPANY INFORMATION...............................................................................14 FIGURE 2 DEAL TYPES................................................................................................16 FIGURE 3 DEGREE OF EXCLUSIVITY ................................................................................16 FIGURE 4 TERRITORIAL REACH.....................................................................................17 FIGURE 5 TYPES OF INTELLECTUAL PROPERTY RIGHTS .......................................................19 FIGURE 6 DEVELOPMENT STATUS..................................................................................20 FIGURE 7 THERAPEUTIC FIELD......................................................................................21 FIGURE 8 FINANCIAL ANALYSIS ....................................................................................22 FIGURE 9 PROJECT PROFITABILITY.................................................................................22 FIGURE 10 FINANCIAL TERMS........................................................................................23 FIGURE 11 FEE RANGES WITHIN THE QUESTIONNAIRE ..........................................................24 FIGURE 12 RANGE OF MILESTONE PAYMENTS ....................................................................25 FIGURE 13 RANGE OF EQUITY INVESTMENT.......................................................................25 FIGURE 14 ROYALTY RANGES IN THE QUESTIONNAIRE .........................................................26 FIGURE 15 PERFORMANCE CRITERIA ...............................................................................27 FIGURE 16 DISTRIBUTION OF COMPANIES FROM THE SURVEY.................................................33 FIGURE 17 GRAPH SHOWING SUMMARY RESPONSE BY GEOGRAPHICAL AREA ..............................34 FIGURE 18 GRAPH SHOWING BREAKDOWN OF NORTH AMERICAN RESPONSES ............................34 FIGURE 19 GRAPH SHOWING BREAKDOWN OF EUROPEAN & SCANDINAVIAN RESPONSES...............35 FIGURE 20 GRAPH SHOWING BREAKDOWN OF ASIAN RESPONSES ............................................35 FIGURE 21 GRAPH SHOWING BREAKDOWN OF ROW RESPONSES .............................................36 FIGURE 22 WHO PARTNERS WITH WHOM ?........................................................................38 FIGURE 23 RESPONSES BY TYPE OF AGREEMENT .................................................................41 FIGURE 24 PIE CHART SHOWING DEAL EXCLUSIVITY ............................................................43 FIGURE 25 PIE CHART SHOWING DEAL TERRITORY ..............................................................44 FIGURE 26 RESPONSES ON INTELLECTUAL PROPERTY RIGHTS.................................................45 FIGURE 27 ASSOCIATION OF DIFFERENT IPRS....................................................................46 FIGURE 28 RESPONSES BY PROJECT STATUS ......................................................................47 FIGURE 29 RESPONSES BY THERAPEUTIC FIELD...................................................................48 FIGURE 30 REPORTED FINANCIAL MODELS........................................................................49 FIGURE 31 ASSOCIATION OF FINANCIAL MODELS ...............................................................50 FIGURE 32 RESPONSES FOR ANTICIPATED PEAK SALES .........................................................51 FIGURE 33 RANGE OF FUTURE DEVELOPMENT COSTS...........................................................52 FIGURE 34 FUTURE DEVELOPMENT COSTS AND ASSOCIATED PROJECT STATUS ...........................52 FIGURE 35 REPORTED HEADLINE VALUES..........................................................................55 FIGURE 36 REPORTED HEADLINE VALUES COMPARED WITH UP FRONT FEES AND MILESTONES.........56 FIGURE 37 REPORTED UP FRONT PAYMENTS .....................................................................57 FIGURE 38 COMPARISON OF MILESTONE WITH UP FRONT PAYMENTS .......................................58 FIGURE 39 RANGE OF REPORTED EQUITY PAYMENTS ...........................................................59 FIGURE 40 COMPARISON OF FINANCIAL TERMS FOR EACH DEVELOPMENT STAGE ........................61 FIGURE 41 COMPARISON OF FINANCIAL TERMS FOR DIFFERENT THERAPEUTIC FIELDS...................62 FIGURE 42 RANGES OF REPORTED ROYALTY RATES .............................................................63 FIGURE 43 AVERAGE ROYALTY RATES BY DEVELOPMENT STATUS............................................65 FIGURE 44 AVERAGE ROYALTY RATES BY THERAPEUTIC FIELD ................................................66 FIGURE 45 PERFORMANCE CRITERIA RESPONSES ................................................................66 FIGURE 46 GRAPH SHOWING THE TIME TO DEAL COMPLETION ...............................................68 FIGURE 47 GRAPH OF NORMALISED TIME TO DEAL COMPLETION ...........................................69 FIGURE 48 OVERVIEW OF PUBLISHED DEALS FROM RECAP ....................................................71 FIGURE 49 RANGE OF HEADLINE VALUES FROM PUBLISHED DATA............................................71 FIGURE 50 COMPARISON OF HEADLINE VALUES (PUBLISHED AND SURVEY DATA) ........................72
© MEDIUS ASSOCIATES 8

FIGURE 51 HEADLINE VALUE FOR DIFFERENT DEAL TYPES .....................................................73 FIGURE 52 QUOTED HEADLINE VALUES BY THERAPEUTIC FIELD ..............................................74 FIGURE 53 THERAPEUTIC FIELD : HEADLINE VALUE COMPARED WITH AVERAGE FINANCIAL TERMS ...75 FIGURE 54 RANGE OF ROYALTY RATES FROM PUBLISHED DATA ..............................................76 FIGURE 55 COMPARISON OF IPR IN EARLY STAGE WITH THE TOTAL RESPONSE...........................78 FIGURE 56 COMPARISON OF EARLY STAGE FINANCIAL TERMS WITH TOTAL SURVEY RESPONSE ......79 FIGURE 57 COMPARISON OF FINANCIAL VALUES FOR DEALS WITH/WITHOUT KNOW HOW.............80 FIGURE 58 COMPARISON OF UPFRONT PAYMENTS : DIVESTMENT/ACQUISITION AND ALL DEALS.....82 FIGURE 59 COMPARISON OF ROYALTY RATES : DIVESTMENT/ACQUISITION DEALS AND ALL DEALS..87 FIGURE 60 ANTICIPATED SALES OF $ 0-25M WITH ASSOCIATED DEVELOPMENT COSTS ...............88 FIGURE 61 ANTICIPATED SALES OF $ 25-100 M WITH ASSOCIATED DEVELOPMENT COSTS ..........89 FIGURE 62 ANTICIPATED SALES OF $100-250M WITH ASSOCIATED DEVELOPMENT COSTS..........90 FIGURE 63 ANTICIPATED SALES OF $ 250-500M WITH ASSOCIATED DEVELOPMENT COSTS .........91 FIGURE 64 ANTICIPATED SALES OF $ 500+M WITH ASSOCIATED DEVELOPMENT COSTS ..............92 FIGURE 65 AVERAGE ROYALTY FOR ANTICIPATED PEAK SALES ...............................................93 FIGURE 66 COMPARISON OF TYPICAL FINANCIAL TERMS WITH ANTICIPATED PEAK SALES ..............94
© MEDIUS ASSOCIATES 9

Executive Summary
EXECUTIVE SUMMARY The most notable conclusions from this report based on our primary research match the trends indicated in the findings of the 1999-2000 survey. The overall deal values, for royalties, upfront and milestones are lower than one would be led to expect from reading the deal headlines in the press. It is interesting to consider that that our survey reflects real deals as reported in detail directly by pharma companies which we believe represents the mainstream, every day, ongoing, business development activity. It is likely that companies elected not to report deals that were already published. In this regard, the findings of this report will play a role in moderating the high expectations of potential licensors who study the headline deals alone for parallel deal examples, which do not necessarily reflect the whole picture of the market place. Another issue to consider is that cash may not be the sole driver behind closing the deal; there are other political and strategic considerations. For example, a deal may be concluded at less than the perceived maximum market value; in the case of an early stage deal, the main aim can be to gain scientific endorsement of its technology. This “loss leader” approach can pay benefits, as it can be possible to gain additional return through subsequent deals or rounds of financing. This philosophy also applies to a “first in class” product or technology, where the scientific risk is perceived as high. The detailed question of valuation is not addressed in this report.1 However, if a deal has been precisely valued and then, on these proposed terms, marketed to appropriate partners, all of whom decline, then clearly the market demand will not support this valuation. Under such circumstances, the deal may well be settled at a lower value. Lower value deals can also apply to late stage or launched products. If the product is for example the fifth in class to reach the market and does not have a hugely superior profile, a company may relax its terms simply to ensure that the product secures a partner and reaches the market at all. Other strategic reasons may include fit with the financing or partnering strategy. A partner offering lower than perceived optimal terms may provide a cash injection at a crucial point, enabling the next round of financing to occur at a later point when it may be more successful. In all of these cases, the companies concerned may operate a selective publications policy because they do not wish to release details of low value deals that may form a future precedent.
1 Valuation is addressed in the Successful Licensing & Business Development report also published by Medius
© MEDIUS ASSOCIATES 10

Executive Summary The key findings are as follows:
• That financial terms and royalty rates are clearly influenced by a number of different factors including:
− external market factors : headlines and competition − strategic need and fit with the partner long term − the strength of the IPR − the risk and balance of the reward package − grant of rights : territory and exclusivity
Each of the above is considered in further detail within this report.
• There is little detailed information available in the public domain from
real deal makers; any perceived competitive advantage gained during either the negotiation or in constructing the deal is kept firmly confidential.
• Despite having conducted primary market research, not many deals are
directly comparable; i.e. same therapeutic field, same development status, same IPR so there is still a danger of comparing "apples" with "pears".
• “Identical” i.e. broadly matched deals did not show equivalent financial
terms.
• Although there are overall trends, there was no statistical correlation between the phase of development and the royalty rate. The royalty rate was also not affected by the overall size of the deal.
• Market forces (the supply and demand for the technology) determine the
going royalty rate and interest in technology acquisition is driving companies to secure deals at earlier stages.
Ultimately, the key question is whether the financial terms available represent the best return for the opportunity available at that moment in time. It is intended to run this survey on an annual basis to allow for year by year comparisons of trends.
© MEDIUS ASSOCIATES 11

Introduction
INTRODUCTION
In 1999, Medius was commissioned to undertake primary research to investigate the level of royalties that were being concluded in a range of technology transfer deals. This study proved to be very valuable in exploring a wide range of factors that influence deals and it was decided that this study should be repeated on an annual basis to determine any major changes in deal trends. The main objective of the second year of this study was to continue the investigation of the key financial terms for technology deals in the pharma industry and to compare the findings with those of the previous year. Hopefully this then provides an insight into the prevalent deal trends. As before, the study was carried out by means of a worldwide survey of all the main pharmaceutical companies, inviting the companies to self report a summary of the key features of at least one recently concluded pharmaceutical deal. To extend the outreach and level of participation in this year’s study, the questionnaire was also placed on the Pharmalicensing website and included in the Pharmalicensing newsletter. Pharmalicensing is a well established tool, which is widely employed by business development executives (See Company Profiles). The site has been established since 1999 and is used by many pharma and biotech companies to place their technology transfer opportunities. The site has excellent traffic volume and global penetration of the business development community and so offers an excellent medium for gathering data. This database was then supplemented by an analysis of additional published data on pharmaceutical deals that had been concluded over the past eighteen months.
© MEDIUS ASSOCIATES 12

Questionnaire
QUESTIONNAIRE The original project commenced by identifying the basic information that would be required from the primary research to undertake a comparison of the key financial features of a typical pharmaceutical deal. These basic parameters for measuring the value of pharma deals were redeployed for this study with one or two minor updates to the questionnaire design. The major factors that were considered relevant to the valuation of a deal are as follows:
• Partner companies
• Deal type
• Degree of exclusivity
• Territorial extent
• Intellectual property rights (IPR)
• The development status of the project
• Therapeutic field
• Financial models employed
• Anticipated peak sales
• Future development costs
• Financial elements
• Performance criteria
A simple question was designed for each of these factors, bearing in mind the fine balance between the need to gain valuable information and the participating company’s need to protect the privacy of their commercial transactions. So for the financial questions, different value bandings were determined to allow companies to give a meaningful response without releasing too much detail. The questionnaire design was also intended to maximise the ease of response, so the format had to be simple and quick to complete. There were some issues that did not lend themselves to pre-formatted replies, such as performance criteria. In such cases, the most obvious responses were included, leaving additional space for further comments. The questionnaire used in the survey for the year 2001 was adapted from the original used in 1999/2000. These changes were put in place to improve the quality of the data collected and to enhance the analysis. In doing so however, there are some parallels where the data cannot be precisely matched to the original database. One field - the financial criteria – remained exempt from change. As this is the essence of the survey, no changes were made to this part of the questionnaire.
© MEDIUS ASSOCIATES 13

Questionnaire The questionnaire in full is included in the Appendices, each of the main questions is considered in turn in the rest of this Section and the changes made from the original survey noted accordingly.
THE PARTNER COMPANIES The aim of this question was to investigate where most deal making is taking place within the industry. For example, it is generally assumed that most biotech companies partner with multinational companies. However, with a diminishing number of multinational companies being available as potential partners (due to the trend of mega-mergers); recently reported deals imply a shift towards biotech – biotech deals. An example of this is the recent licensing deal for US rights to some topoisomerase inhibitors between the biotech companies Xenova and Millennium, which provides Millennium with a more robust development portfolio. The choice for Partner Company responses was a range of readily identifiable groupings (see table below); one answer was required to describe the respondent company and another to describe the partner company.
Figure 1 Company information RESPONDENT COMPANY
multi - national
medium
SME
PARTNER COMPANY
multi national
regional/ medium
national drug delivery
SME
The definition was broadened to include SME (small medium enterprise) from the original survey. The term “biotech” is also employed in the general rather than precise manner i.e. to mean a small start up company rather than one that employs fermentation technology for its products. (Full definitions are noted in the Glossary).
© MEDIUS ASSOCIATES 14

Questionnaire
THE DEAL TYPE The definition of a Strategic Alliance that was employed for this study is that coined by John Ansell2 -
“Strategic alliances are co-operative agreements between companies to work together in specified ways to increase the chances of successfully developing and commercialising their products.”
However, strategic alliances can be further defined as noted in the table below.
Table 1 Different types of strategic alliances
Research co-operation
Marketing co-operation
Equity participation
research alliance product licensing joint venture co-development co-marketing corporate acquisition patent licensing co-promotion product licensing product fostering product acquisition
The different types of deals noted in the table above do tend to have different reward structures. For example, joint ventures most frequently have an equitable split of rewards, usually 50:50 or 60:40 depending on the balance of ownership of the shares in the joint venture company. Hence it would be important to split joint venture royalties away from the royalties reported for other deals, as there would be an adverse effect on any calculated averages. In contrast to this, licensing arrangements reflect a project's diminishing risk as it progresses through its clinical development with milestone payments escalating towards product launch. Milestones do not feature significantly in co-promotion agreements so again differentiation between the agreement types would be required to allow precise analysis.
2 Ansell, J. Pharmaceutical Strategic Alliances, Part 1, Spectrum Healthcare Industry Overview, Decision Resources Inc. March 1993
© MEDIUS ASSOCIATES 15

Questionnaire
Thus the choice of deal types used in the questionnaire was as follows:
Figure 2 Deal types
Research Alliance
Patent licence
Product Licensing
Co- Development
Co-
marketing Co-
Promotion Product
Fostering Joint Venture Divestment/
acquisition
By using this format, it is entirely possible for respondents to complete more than one category, giving a clearer picture of the key components within the deal.
THE DEGREE OF EXCLUSIVITY The degree of exclusivity of rights granted by the Licensor to the Licensee in any agreement has a significant bearing on its reward structure. Clearly, an exclusive licence commands a higher royalty level than a sole or non-exclusive licence. This difference in value will however depend on the particular market sector concerned and the relative strengths of the other Licensees in a non exclusive situation. The category “field exclusive” was included to take account of platform or drug delivery deals where the exclusivity can be field specific and although thus limited, will be of greater value that a broad non-exclusive licence.
Figure 3 Degree of exclusivity EXCLUSIVITY
exclusive
non exclusive Combination/field exclusive
© MEDIUS ASSOCIATES 16

Questionnaire
TERRITORIAL EXTENT The extent of the territorial rights granted under the licence will also have a bearing on the value of the deal and hence the financial package concluded in an agreement. Although there may be a more limited impact on the royalty rate per se (depending on the pricing policy that is prevalent in the relevant territory) the upfront fees and stage payments will be relative to the market size that the product might command. Our findings from the original study were that most deals were global deals, however the other categories included are regional (to account for North America, Asia and Europe) or national (for single territory deals).
Figure 4 Territorial Reach TERRITORY Worldwide Regional National
INTELLECTUAL PROPERTY RIGHTS (IPR) The extent of the intellectual property rights, (i.e. usually the know how, patent protection and trademarks) relating to the opportunity also have a major bearing on the overall value of the deal. For example, if there is only data exclusivity on the product registration package, this gives less protection in the market place than being able to sue for infringement of a patent or a trademark. Firstly, one needs to consider what constitutes the IPR. Patents and trademarks carry a higher value than know how simply because one can more easily enforce these rights. Know how is only of value when it remains confidential. Also under EU competition law (technology transfer regulations) an agreement to pay royalties must not go beyond 10 years from when the Licensee first markets the product using the know how in the EU. In principle, IPR can also include Registered Designs, Design Rights, Trade Secrets, Copyright and Databases. However in terms of technology transfer; patents (and applications), know how and trade marks are the most frequently traded assets.
© MEDIUS ASSOCIATES 17

Questionnaire
In contrast, royalties payable for patents, registered designs and trademarks are payable for the duration that the protection remains in place. (See table below).
Table 2 Duration of IP rights
IP rights Duration
patents 20 years from filing3
(plus possible Supplementary Protection Certificates)
registered designs 25 years, renewable
trade marks indefinite4
copyright 70 years following author’s death
know how as long as it remains confidential
The strength of the IP rights is of vital importance. If the essence of the product or technology is not well protected, the patent or other IPRs may be of limited commercial value. Similarly, if the patent is valid but unenforceable against third party competition it may prove again to be of little value. One important element is how easy it may be for competitors to circumvent the IPR; this can occur if the technology is easily discoverable or replicable. Successful licensing endorses the strength of the IPR as it implies that another company finds it necessary or desirable to license rather than re-invent the technology. Ideally there should be a patent portfolio in place providing a "ring fence" of cover to the compound per se, composition, analogues, and methods of manufacture. The range of the patent cover is increasingly important. For example, covering the most cost-effective method of manufacture will ensure the effective patent cover subsists beyond the life of the patent for the compound per se.
3 (see page 15) : duration of SPCs vary from country to country in Europe. 4 subject to the payment of renewal fees
© MEDIUS ASSOCIATES 18

Questionnaire
The territorial extent of the intellectual property rights will link through into the grant of territorial rights. If the patents do not extend to the whole area where the product is to be marketed, then it is reasonable that different royalty rates should apply to the patented and non patented territories. Because of the limited duration of patent rights (twenty years from the date of filing an application in Europe), there may be only a limited amount of time to protect the product from competition in the market place. Thus the duration of the contract needs careful consideration bearing in mind the development time for the technology. Because of the extensive development times required for pharmaceutical products, it was considered that the duration of the monopoly was insufficient to be able to obtain a return on the investment made. Thus there is now the right for the holders of the relevant Market Authorisation for a given product or technology to apply for Supplementary Protection Certificates in certain territories. However the duration of these extensions does vary from country to country.
Figure 5 Types of Intellectual Property Rights INTELLECTUAL PROPERTY RIGHTS :
Patent application
Granted patent
Regional patent
Global patent
Know how
Trade mark
In designing the questionnaire, as for other questions there is the option to answer in more than one box, as often a technology is the subject of more than one type of IPR.
Variation of royalty rates Varying the royalty rate is a standard tactic to encourage performance under an agreement. For example, if the patent protection is not sufficient to keep unauthorised competition at bay there may be grounds for a drop in the royalty rate as having a licence to the patent is not conferring any market advantage. Similarly, it is quite usual to see clauses in agreements encouraging the Licensor to enforce any relevant intellectual property rights by the withholding of royalty payments until any infringement actions have been resolved. One needs to very carefully review any third party patents that may impinge on the product or technology. Allowances may also be made in the event that it is necessary to pay a third party royalty to allow the technology to be marketed. Considering all the issues surrounding intellectual property rights, there are sufficient topics to merit an individual study on their impact on royalty rates alone in isolation of all the other factors considered in this report.
© MEDIUS ASSOCIATES 19

Questionnaire
PROJECT DEVELOPMENT STATUS There is a strong rationale behind the principle that as a project progresses through its clinical development, the developing company is adding value and also diminishing risk. In principle therefore this should then translate into a higher overall value for the deal and in particular as seen in the royalty rate. A recent example of this was the renegotiation of the licensed rights to the monoclonal antibody product for ovarian cancer, Theragyn from Antisoma to Abbott.5 Additional clinical studies are required for this product, which is currently in phase III studies. Antisoma need to assist with the financing of these studies and so in recognition of this, the royalties due from Abbott to Antisoma have been increased from the original range of 20-30% to a flat 30%. There is also a commensurate increase of $ 6m in milestone payments, bringing the total filing and approval milestone payments to $ 48m.6
There is also a perceived movement towards signing deals later than phase II clinical development. Companies may allow the Licensor (often a biotech company) to continue to carry the risk and will in turn be prepared to pay a higher price for the technology (assuming it is still available at phase III). This is particularly the case for new or first in class developments that remain unproven.
Figure 6 Development status
PRODUCT / PROJECT STATUS:
research lead
pre- clinical
phase I phase II
phase III pre-
registration product
licence
The response options are noted in the figure above. Although there was an option for free comments (under OTHER, please specify) in the Questionnaire 2002 we will be including an additional field, for feasibility studies.
5 Reported in Scrip no 2710 6 Abbott had already paid $ 25m to cover 70% of the development costs.
© MEDIUS ASSOCIATES 20

Questionnaire
THERAPEUTIC FIELD The level of competition varies significantly from niche markets such as infertility treatment to major therapeutic fields such as cardiovascular or anti-infectives. The entry costs, average volume and value of products as well as the degree of novelty required for new technologies all impact on the potential return for new opportunities. As the profit margin varies so does the amount available for royalty payments. In the previous survey, only a limited choice was offered for therapeutic fields, such as: niche area, major field, drug delivery and other. During the analysis of the results, it was clear that there was some disparity in what participants perceived as “major” or “minor” fields. Therefore the categories were extended to include a wider range of specific therapeutic fields. This has improved the quality of analysis as we can now isolate deals within given therapeutic fields as well as by the peak sales potential.
Figure 7 Therapeutic field THERAPEUTIC FIELD
Formulation
Platform enabling technology
Medical device
OTC Derma Sensory
Metabolic
CNS Anti-
infective Oncology GI CVS
Due to limitations on space, the most commonly occurring fields were denoted, with additional space to include other fields.
FINANCIAL MODELS Increasingly, companies are concerned that the value of the deal and the return on the technology asset gives the maximum return that one can achieve. Consequently, more sophisticated financial models are being employed to analyse the return on investment. It is extremely helpful during negotiations to be aware of the financial hurdles that potential partners may employ while evaluating an opportunity. This specific question was not included as few if any companies were likely to divulge such information. However, this survey was considered be an excellent opportunity to review which if any financial models are being employed as a standard across the industry.
© MEDIUS ASSOCIATES 21

Questionnaire
The options offered for responses are listed in the figure below. The usual models employed are net present value (NPV) and discounted cash flow (DCF). Option valuation is being increasingly used, the level of which use will be determined by the responses. Again a box for “other” was included.
Figure 8 Financial analysis FINANCIAL MODELS USED :
NPV DCF
option valuation
FINANCIAL ASSESSMENT Together the projected market revenues and the anticipated development costs give a basic overall picture of the profitability of the project. To make sense of the financial data provided by the participating companies on the deal structure, it was essential to have an understanding of the background project profitability. The response ranges were determined to capture the wide range of deals from national product licences to larger acquisitions.
Figure 9 Project profitability
ANTICIPATED PEAK SALES for PRODUCT :
RANGE US $ m
0 - 25
25 - 50
50 - 100
100-150
150-200
200-250
250-300 300-400 400-500 500+ ANTICIPATED FUTURE DEVELOPMENT COSTS : RANGE US $ m 0 -10 10-20 20-30 30-40 40-50 50 +
© MEDIUS ASSOCIATES 22

Questionnaire
KEY FINANCIAL TERMS The basic financial aspects of the deal, as listed in the table below, were investigated:
Table 3 Key financial aspects of a deal
headline value
upfront payments
milestone payments
equity investment
royalty levels
As noted before, because financial information is highly confidential, the questionnaire was designed to provide some degree of anonymity by identifying different bands of data. This would allow for some disguise of the deal in question. One factor that was added in to this year’s survey was a question on “headline value”. The PR value of a deal and its commensurate effect on share price via the quoted headline value cannot be underestimated. These headline values then in turn set shareholder expectation, which can have an inflationary effect. The key question is how does the headline value compare with the real terms of the deal. So for example in a quoted $ 100m deal; is this an upfront fee of $ 1m with subsequent milestones, research payments and an estimate of royalties all rolled up to give an impressive headline? By including a question on this point, it would be possible to comment on the degree of optimism included in the headline values.
Figure 10 Financial terms
FINANCIAL PACKAGE: RANGE US $
0 -1m
1 -5m
5 -10m
10-15m
15-20m
20m +
Headline Value
© MEDIUS ASSOCIATES 23

Questionnaire
Upfront payments The level of upfront payments is always a difficult issue. For the Licensee, it represents the sum at most risk whereas for the Licensor it represents a commitment to the project by the Licensee. Depending on the value of the technology, there may be cash flow demands that dictate that the upfront should be more that just a nominal fee (assuming the upfront would be wholly deployed to the project in question). Alternatively, if the upfront fee is simply securing an Option to subsequent rights (i.e. an Option fee) then the fee is likely to be fairly modest. The bands selected for the responses in the questionnaire were defined thus:
Figure 11 Fee ranges within the questionnaire RANGE US $
0 -1m
1 -5m
5 -10m
10-15m
15-20m
20m +
Upfront payments
Milestone payments The main interest in milestone payments is to find the frequency and level of the payments. The table below denotes some events that can attract a milestone payment.
Table 4 Examples of events used to trigger milestone payments
• filing a patent • granting of patent • identification of a lead within a discovery programme • commencing pre-clinical development • commencing / completing phase I clinical development • commencing / completing phase II clinical development • commencing / completing phase III clinical development • submitting the regulatory dossier to relevant authorities • grant of the marketing authorisation • pricing approval for the product • product launch
© MEDIUS ASSOCIATES 24
Questionnaire
Within each of the potential milestone events listed above, there are further possible events, such as : ethics committee approval, completing recruitment for given clinical studies. Also the grant of the marketing authorisation can be on a territory by territory basis. Due to constraints on the spacing of the questionnaire, it was difficult to elicit this level of information. Also, this would potentially allow the identification of the deal in question and remove the cloak of anonymity. So the questionnaire included similar banding as for upfront payments.
Figure 12 Range of milestone payments RANGE US $
0 -1m
1 -5m
5 -10m
10-15m
15-20m
20m +
Milestone payments
Equity investment Increasingly companies seek to capitalise their investment in R&D by placing some of the lump sum payments as equity investment. This can, (depending on the level of investment made) have the added benefit of giving some degree of control within the company as the equity investment will enable representation on the Board. Clearly if the company then performs well then there is the added bonus of any increase in the share price. There can also be an added competitive advantage for the Licensee; as it may prove difficult for other companies to invest in the same opportunity, or even company (depending on the degree of equity held). For example, it may well be the first stage point in a “slow” take over strategy. This in turn can then be a negative point for the Licensor as it may prove a constraining factor on future partnering activities. However, exchange of equity is also one means by which biotech companies can consider consolidating without impacting on their cash position.
Figure 13 Range of equity investment RANGE US $
0 -1m
1 -5m
5 -10m
10-15m
15-20m
20m +
Equity payments
© MEDIUS ASSOCIATES 25

Questionnaire
Royalty levels Royalty rates are generally the most flexible part of the financial package as these are being made from revenue when there is only the commercial risk remaining for the project. However some allowance should always be made for adverse marketing conditions e.g. pricing approval, price changes, reimbursement changes and generic competition. Often the royalties are set and agreed before the final cost of goods is clear, so assumptions have to be made on the eventual profitability of the product. The amount of revenue "available" for royalties will depend on the payback required on the other investment components for the overall project. Besides the mathematical basis for setting royalty rates, there are emotive issues as well as company precedents to be considered. During negotiations, companies may claim that their company either never pays a double-digit royalty or only in exceptional cases. Other companies will quote a fixed royalty - particularly when the licence is non-exclusive and no more favourable terms can be offered for additional Licensees. Drug delivery companies in particular tend to have fairly fixed terms linked through to the supply of either active or finished product. When considering the payments, one may need to take account of royalty stacking. This is usual in a "licensing-in : licensing-on" model, for example, a small company in-licences from a university and then licences on to a regional or multinational company. The negotiating position in the latter case is limited by the need to cover any royalty to the originator of the technology. Universities are more frequently looking at taking equity in their start up companies and licensing partners, which then offers a logical route to avoid this issue. Occasionally a product may bear multiple royalties for different components; for example the active ingredient and the delivery technology. In such cases or where there is a need to pay a third party a royalty (e.g. for patent infringement) it may be possible to reduce the royalties due in a proportional manner in order to maintain the economic viability of the product. The figure below shows the presentation of the royalties question in the final questionnaire. As low royalties were strongly reported in our previous study, it was considered important to split the <5% group into two bands, 0-2% and 3-5%.
Figure 14 Royalty ranges in the questionnaire
RANGE %
0-2
3-5
6-9
10-12
13-16
17-20 Royalties
© MEDIUS ASSOCIATES 26

Questionnaire
PERFORMANCE CRITERIA It was also decided to include a question on performance criteria on the basis that licences in general, and exclusive licences in particular, are rarely granted without the Licensee being required to give an undertaking to perform to a specific level. Performance criteria can take various forms as noted in the table below.
Table 5 Examples of performance criteria
research to be completed within a specific timeframe minimum royalty return minimum off take of product minimum promotional spend fixed number of promotional calls target market share
The most popular criteria were included as noted below. However to try and capture additional comments an “Other, please specify” space was included.
Figure 15 Performance criteria PERFORMANCE CRITERIA :
min royalties
promotional spend
ADDITIONAL INFORMATION With the increase in volume and increase in pressure on deal making it was considered appropriate to look at the frequency of time taken to close a deal. In the future we also plan to consider the resource deployed by each company to its business development activities. Thus an additional question on “Time to deal completion” was included. To ensure that this would be comparable, this was specified as being from the time of signature of the Confidential Disclosure Agreement to the time of signature of the full contract.
© MEDIUS ASSOCIATES 27

Methodology
METHODOLOGY These basic information requirements were then formatted into a draft questionnaire for peer review. After receiving feedback from various business development opinion leaders several modifications were made and the final version (included in this report as Appendix 1) was employed to generate a database of deal information. This questionnaire was despatched to a representative range of companies within the pharmaceutical industry, addressed to contacts known personally to the executive staff at Medius Associates. The personal approach was considered essential to the success of the project – without good quality information any subsequent analysis would be meaningless. Companies were offered complete anonymity – i.e. any identifying marks (such as fax return numbers) would be erased on request. Alternatively the questionnaire could be returned by mail. Several companies elected to use this route to disguise their return. For those replies received via the Pharmalicensing web site, the data was separated from its source before being analysed at Medius. As an incentive to respond to the survey, companies were offered access to a summary level of information, (Example attached as Appendix 2) in addition to a discount for the final report. To supplement the data acquired via direct personal contact, details of deals finalised and reported over the last two years in published sources (Recombinant Capital, Scrip, Windhover etc.) were also reviewed and analysed.
COMPANY INCLUSION CRITERIA The questionnaire was sent out to a range of companies representative of the pharmaceutical industry. As a base point, the survey included coverage of Scrip's top 60 companies7 however other companies were also included from the following categories :
Table 6 Range of companies involved in the survey
multinational companies regional companies national companies drug delivery companies biotech companies venture capitalist technology brokers Universities
7 Subject to the exclusion criteria
© MEDIUS ASSOCIATES 28

Methodology
In the case of the multinational companies, questionnaires were sent to both the corporate headquarters as well as the operating units. By using multiple entry points it was hoped to obtain data on both corporate and local deals. For regional and national companies, questionnaires were sent in to the main business development department. In the case of some biotech companies, the questionnaire was directed to the CEO. The questionnaire was sent out on a global basis, the complete details of the company contact list are included as Appendix 3. A break down of the spread of companies by type of company is also included in this report as Appendices 4 - 7.
EXCLUSION CRITERIA In selecting the direct mail target base, certain exclusion criteria were applied to focus the integrity and comparability of the data thus obtained. However by placing the survey questionnaire on the Pharmalicensing website, the following exclusion criteria could not apply. As a result, we did receive a report of one or two diagnostic deals. The focus via exclusion criteria may be relaxed in future surveys.
Diagnostic companies With lower development costs, a shorter product life cycle, a very dynamic and competitive market as well as generally lower potential revenues for diagnostic products, this translates into different deal structures, which vary considerably to those for pharmaceutical products. Diagnostic deals can also be quite complex with royalty stacking and links required to software and other allied equipment as well as often including a royalty payment to Roche for the use of PCR. Consequently, these deals are not strictly comparable to pharma deals and so no stand-alone diagnostic companies were approached.
© MEDIUS ASSOCIATES 29

Methodology
OTC companies Similar to diagnostic companies, the profit life cycle and promotional costs are very different for OTC products when compared to ethical products. Thus the survey did not extend specifically into the OTC field.
Japanese company participation Several major Japanese companies were approached to complete the international basis of the survey. However, despite excellent personal contacts none of those companies approached responded. As a result of this, it was decided not to send the direct mail questionnaire to the mid size and smaller Japanese companies as it seemed unlikely that they would be able to participate in our survey. This is understandable because any data concerning the company's business activities is deemed to be highly confidential and its release to any external party would be unlikely to be sanctioned.
© MEDIUS ASSOCIATES 30

Review of Results
REVIEW OF RESULTS As indicated in the Introduction, there were two methods employed to collect the survey data used for this report:
• Method 1: a direct mail questionnaire • Method 2: a web-based questionnaire
All responses, from both the web and direct mail, were checked for validity. It was important to maintain the integrity of the data and to ensure that deals were not double counted, which might be possible if reported by both companies involved. Listed below are some of the main reasons why a response was considered invalid and therefore rejected.
Table 7 Data rejection criteria
The deal had not yet been signed
The deal had not been completed within the survey period (i.e. during the last twelve months).
Duplicates of a submission
Incorrect completion
The remaining valid responses, 115 in total were then tabulated for analysis to produce the results in this Section and as the basis for analysis in the subsequent Sections.
DIRECT MAIL VS. WEB RESPONSES The impact of using the web is clearly evident in the increase by 69% in numbers of responses. In the original survey all 68 responses were collected via direct mail only. Web responses also differed from the direct mail responses in that all categories and questions had to be answered before electronic submission would be accepted. This was beneficial in ensuring a high response rate to all of the questions as well as maintaining the quality and accuracy of the resulting data.
© MEDIUS ASSOCIATES 31

Review of Results So where a respondent in the direct mail approach could, if it were not applicable to the deal they were reporting ignore a question (i.e. give no answer), the web respondent was still required to make an entry. This difference is most apparent in the question relating to Equity as noted below :
Table 8 Response to equity question
• 76% of mail respondents did not provide an answer to this question
and 18% gave the value US $ 0-1m. • In the web returns, 100% of the respondents gave an equity value,
however 84% quoted the lowest value of US $ 0-1m. It is likely that this high percentage of web responses (US $ 0-1m) and the high percentage direct mail ‘no answers’ relate to deals that have no equity component.
Table 9 Total responses received
Number sent Replies received Direct Mail 316 45 Web N/A 70 Total 316 115
© MEDIUS ASSOCIATES 32

Review of Results
REVIEW OF RESPONSES The responses were reviewed on the basis of data source, web or direct mail, in order to allow a comparison. The number of replies for each type of company grouping received by each method of data collection is noted in the figure below:
Figure 16 Distribution of companies from the survey
0 10 20 30 4
no of replies
0
Web
Direct Mail
MN Medium SME DD Other
The apparently large number of responses from Medium sized companies is because all respondents who identified themselves as either medium, regional or national in size are included. Biotech companies are incorporated in the classification of ‘SME’. Most biotech companies are SMEs and many SMEs are biotechs, therefore it makes sense to consider these as one entity. The direct mail questionnaire did not provide the respondent with the company classification of "Drug Delivery" therefore Drug Delivery companies responding to the direct mail will have used another classification; most probably SME (Small or Medium sized Enterprises) in most cases. This again will enhance the number of Medium sized companies. In reviewing the responses received by direct mail, these were mainly European in origin. This reflects Medius’ highly active contact base in this region. This potential bias in data collection was compensated by the fact that the responses received via the Pharmalicensing web site had a higher proportion from North America (US and Canada) at just over 60%.
© MEDIUS ASSOCIATES 33

Review of Results
REVIEW OF GEOGRAPHICAL SPREAD The responses were also reviewed on the basis of geographical spread to ascertain the degree of international reach of the survey. The percentage of responses in each geographical region are noted in the figures below:
Figure 17 Graph showing summary response by geographical area
0 10 20 30 40 50
% responses
North America
Europe & Scandinavia
Asia
Others
Figure 18 Graph showing breakdown of North American responses
0 10 20 30 40
no of replies
USA
Canada
© MEDIUS ASSOCIATES 34

Review of Results
Figure 19 Graph showing breakdown of European & Scandinavian responses
0 5 10 15 20 25
no of replies
UK
Switzerland
Belgium
Portugal
Spain
France
Germany
Italy
Denmark
Sweden
Figure 20 Graph showing breakdown of Asian responses
0 1 2
no of replies
Taiwan
Hong Kong
Korea
China
India
Review of Results
© MEDIUS ASSOCIATES 35
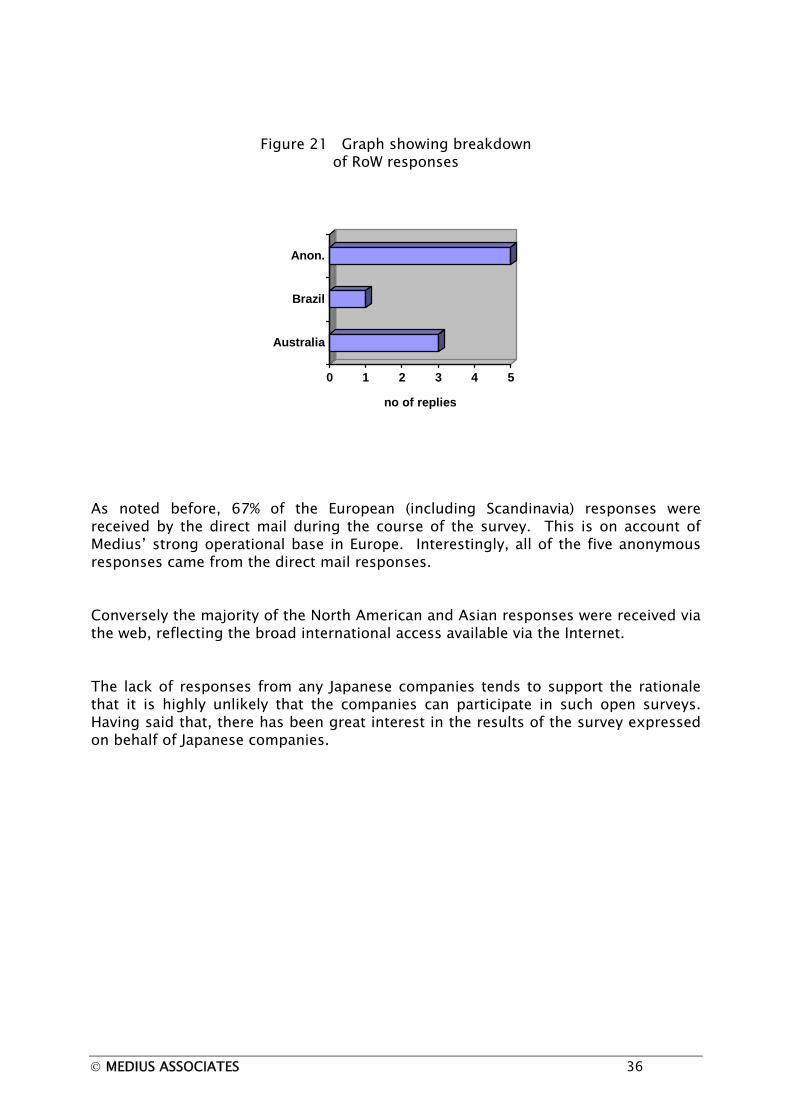
Figure 21 Graph showing breakdown of RoW responses
0 1 2 3 4 5
no of replies
Australia
Brazil
Anon.
As noted before, 67% of the European (including Scandinavia) responses were received by the direct mail during the course of the survey. This is on account of Medius’ strong operational base in Europe. Interestingly, all of the five anonymous responses came from the direct mail responses. Conversely the majority of the North American and Asian responses were received via the web, reflecting the broad international access available via the Internet. The lack of responses from any Japanese companies tends to support the rationale that it is highly unlikely that the companies can participate in such open surveys. Having said that, there has been great interest in the results of the survey expressed on behalf of Japanese companies.
© MEDIUS ASSOCIATES 36
Review of Results
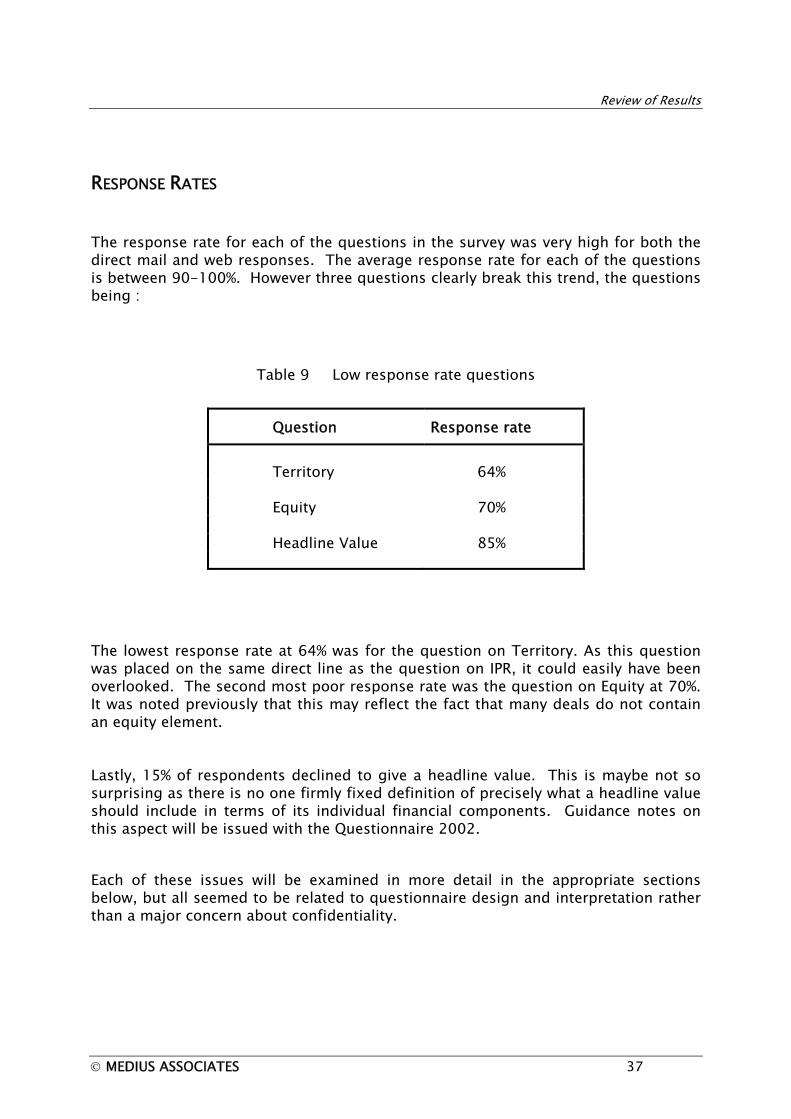
RESPONSE RATES The response rate for each of the questions in the survey was very high for both the direct mail and web responses. The average response rate for each of the questions is between 90-100%. However three questions clearly break this trend, the questions being :
Table 9 Low response rate questions
Question Response rate
Territory 64% Equity 70% Headline Value 85%
The lowest response rate at 64% was for the question on Territory. As this question was placed on the same direct line as the question on IPR, it could easily have been overlooked. The second most poor response rate was the question on Equity at 70%. It was noted previously that this may reflect the fact that many deals do not contain an equity element. Lastly, 15% of respondents declined to give a headline value. This is maybe not so surprising as there is no one firmly fixed definition of precisely what a headline value should include in terms of its individual financial components. Guidance notes on this aspect will be issued with the Questionnaire 2002. Each of these issues will be examined in more detail in the appropriate sections below, but all seemed to be related to questionnaire design and interpretation rather than a major concern about confidentiality.
© MEDIUS ASSOCIATES 37

Review of Results
PARTNER COMPANY Classic licensing strategy often implies that companies partner with opposites. So multinationals seek biotech technologies to boost their R&D and biotech companies seek multinationals for their development expertise and marketing strength. However, increasingly often biotechs are consolidating or adopting a regional licensing policy. Using the information from the survey, a comparison was made to identify where most of the deal making activity is within the industry.
Figure 22 Who partners with whom ?
0
5
10
15
20
25
30
35
40
45
50
no o
f rep
lies
MN Medium SME DD OtherRespondent
Other DD SME Medium MN
© MEDIUS ASSOCIATES 38

Review of Results
The majority of activity was seen to take place between medium sized companies (regional and national companies). As noted before, this is a very broad category and is therefore likely to capture more responses. Also, with a limited amount of resource to deploy in R&D, regional and national companies tend to be more deal active acquiring both new technologies and line extensions. Furthermore, it is simpler to address the needs of one market or one therapeutic field, so the deals tend to be commensurately smaller and less complex. Also there are proportionately more opportunities on a smaller scale than the major blockbusters sought by the multinationals. Companies such as Bioglan are very deal active and in the year 2000 closed some 33 deals as follows :
Table 10 Bioglan – deals 2000
20
out or in licenses or disposals
8 technology in and out licences
5 other types
However classic partnering from small to big pharma (as was evident in last year’s survey) is still very important. SMEs partnered with multinationals in almost 50% of cases, and partnered with multinationals or medium sized companies in 60% of deals. An example of a classic licensing deal is that between GSK and Scios. The product, Natrecor (a B type natriurectic peptide) was already launched in the USA and licensed to GSK for Europe only. The deal comprised upfront fees, milestone payments and ongoing royalties. There was a moderate amount of activity between the multinationals reported, probably accounted for by some of the divestment programmes post merger. There is a similar large amount of activity between medium-sized companies. Alliances between companies of similar size and philosophy often produce more rewarding collaborations, as there is a similar company culture and corporate objective.
© MEDIUS ASSOCIATES 39

Review of Results
There is not surprisingly little deal activity between the drug delivery companies (only one deal reported), as such companies tend to compete rather complement in terms of their technologies. However, there can be alliances where there is a common need as evidenced by the recent deal between Weston Medical and Bespak.8 In this agreement, Bespak are taking on the assembly of Weston’s needle free injection device, the Intraject. There is also a significant amount of SME / biotech consolidation evident. Even new start up companies need to acquire new technologies to build their portfolios. This consolidation occurs across a range of sizes of biotech companies from the recent acquisition of Matrix Pharmaceutical by Chiron (for an estimated $ 61m) to the acquisition of Synapse (a Vancouver based private company) by BioMarin for $10m. Portfolio construction of course is not the only driver for consolidation as often an acquisition can defer the immediate need for funding. Any subsequent rounds of funding may also be boosted by the enhanced offering. More biotech companies appear to be seeking alliances rather than partnering all of their assets via licensing. This is similar to the change in strategy adopted by Japanese national companies who switched from traditional licensing out to joint ventures and then to acquisitions to grow their businesses internationally. Interestingly all of the SME-SME deals reported were for research alliances.
8 Reported in Scrip issue 2711
© MEDIUS ASSOCIATES 40

Review of Results
DEAL TYPE
Figure 23 Responses by type of agreement
0 20 40 60 80
responses %
alliance
co-dev
licence
co-mktg
jv
acquire
other
2001 2000
The category "Other" includes two co-promotion and two product fostering deals from this year’s results. It also includes three product fostering agreements from the 2000 results. The most notable change this year is that deals appear to be more complex, i.e. they include different aspects. For example, 52% of the research alliance agreements incorporated a patent or product licence element. Also 30% of these research alliances incorporated co-development arrangements.
Research alliances, licences and co-developments often incorporate other types of agreement, whereas co-marketing; co-promotion, product fostering, acquisition & divestments tend more to be stand alone deals. This reflects the nature of the relationship, as the latter types do not require any close collaboration during the research stages. This is in contrast to the early stage deal, which positively benefit from close co-operation. The majority of deals reported were licences. This is in line with expectations as licences are one of the most widely employed and flexible forms of strategic alliance. In keeping with the evident portfolio rationalisation post mergers, 11% of deals were either divestments or acquisitions.
© MEDIUS ASSOCIATES 41

Review of Results
EXCLUSIVITY & TERRITORY Both Exclusivity and Territory show similar trends to those seen in the survey carried out last year.
Exclusivity
From the responses received, it is clear that the majority of the deals (65%) were based on the grant of exclusive rights. However this year, combination or field exclusive deals accounted for 9% of responses, as opposed to one single response received last year. Contrary to intuition, this does not appear to be due to the increase in percentage of divestments from the recent spate of merging multinational companies, (where products are generally divested on a territory-by-territory basis rather than globally) as none of the combination/field exclusive deals in the survey related to divestments or acquisitions. Instead, all of the responses were for licence agreements or research alliances. Also, interestingly, the following characteristics that differentiate the deals from other groups were noted:
Table 11 Characteristics of field exclusive deals
• all agreements contained patents or patent applications • 70% of the deals related to either formulations or platform
enabling technologies • all of the reported royalty rates were for more than 3%. in 70% of the responses, the rate was 6-9%.
It is implied of course that the technology in question does by its inherent nature, split readily into different discrete and well defined fields of use. Furthermore, it is apparent that the companies that employ field exclusive deals for their partnering strategy are well aware of the technology’s market potential and hence are able to maximise the total return on their asset. Once the first field exclusive deal is placed, there is then market endorsement of the technology, which helps to secure the market value for any subsequent deals. Also the deal structure is well defined so in principle, deals can be concluded promptly and efficiently.
© MEDIUS ASSOCIATES 42

Review of Results
Figure 24 Pie chart showing deal exclusivity
64%17%
9%
10%
Exclusive Non-excl.Combination No response
Territory Similarly, but to a lesser extent when compared to the grant of exclusivity, the majority of deals (36%) were for worldwide rights. Regional deals accounted for a further 10% and National deals 18% of the reported deals.
Table 12 Responses on Territory
Territorial extent
Response %
Worldwide 36% Regional 10% National 18% No replies 36%
A large proportion of respondents did not answer the territorial question, the lowest response rate for the entire survey. This is most probably due to questionnaire design rather than concerns relating to confidentiality (See page 36).
© MEDIUS ASSOCIATES 43

Review of Results
Figure 25 Pie chart showing deal territory
36%
10%18%
36%
Worldwide RegionalNational No response
At first sight, the extensive use of exclusive, worldwide deals seems to fit with the responses on the type of partner company, as many of the deals involved multinational companies. When multinational companies need to commit development resource, it generally requires exclusive access to worldwide marketing rights to be able to recoup an appropriate return on the investment made during the development phase of the project.
INTELLECTUAL PROPERTY RIGHTS As noted from the previous survey, where some 79% of deals were based on patents (or patent applications) the results on this topic (see graph below) are overwhelming with 82% of deals being based on patents (or patent applications). This clearly shows that patents are the “hard currency” for technology transfer. Also the fact that this question was answered by 96% of respondents reinforces the essential nature of IPRs.
© MEDIUS ASSOCIATES 44

Review of Results
Figure 26 Responses on intellectual property rights
0 20 40 60 80
% responses
patent
application
trade mark
know how
2001 2000
Know how was noted as a contributing factor in the reported deals (34%) but granted patents accounted for some 58% of deals. Patent applications accounted for a much larger proportion of deals than reported in the previous survey, at 35% compared with less than 10%. However deals associated with patent applications still apply to early stage alliances and early stage product development. Trademarks were more likely to be involved in late stage product development and least likely to be involved in research alliances or patent (as opposed to product) licensing. This is entirely logical as trade marks tend to be filed post Phase II in clinical development. 40% of deals involved more than one type of intellectual property. This contrasts starkly with the previous year where respondents gave a single response. This is thought to be due to a change in the questionnaire design rather than a fundamental change in the structure of deals. Based on the data from the survey, the graph below illustrates for each type of IPR the percentage potential that it will be associated with one of the other types of IPR in a deal.
© MEDIUS ASSOCIATES 45

Review of Results
Figure 27 Association of different IPRs
0% 20% 40% 60% 80% 100%
patent
application
trade mark
knowhow
IP alone trade mark knowhow
patent application In all but four cases, know how was associated with other forms of IPR, notably patent applications (42%). Know how is the least tangible form of IP, and is only valuable when maintained as confidential. Due to its limitations in terms of protection, know how tends to command fairly low level royalties. These findings therefore are in line with expectations as know how alone is not often sufficient to support a major deal. Similarly trademarks were usually (73%) associated with other forms of IPR. It is interesting to note that 50% of the time trademarks were associated with know how. This was not expected as know how tends to be most important in early stage development deals and trade marks evolve as a product moves closer to market. The exception to this however is in drug delivery where know how is of great importance and often the delivery system may carry a trademark. Patent applications are least likely to be associated with trademarks, again fitting the profile that patent applications relate to early stage development deals where the IP is still evolving. Patents and patent applications were most often the sole form of IPR in a deal, at 40% for both types.
© MEDIUS ASSOCIATES 46

Review of Results
DEVELOPMENT STATUS
Figure 28 Responses by project status
0 10 20 30
% responses
lead
pc
P I
P II
P 3
pre-reg
product
20002001
There are two peaks in the chart; showing most deals being signed either early at phase I, or late i.e. for products that are already on the market. This year product launch remains a major area of activity accounting for 30% of responses. In contrast however only 8% of deals were for phase I developments compared with 17% in the previous survey. The graph also shows a second peak of activity at phase II (14%). This is in line with "Classic" licensing strategy, which focuses on partnering at or around phase II clinical development when the product profile is sufficiently well defined to allow reasonable market forecasting and the risk can also be well characterised. The majority of deals at phase II involve multinational companies (81%). This year there is a further increase in early stage deals, at both the research lead and pre-clinical stages. When combined, these represent 36% of deals. This is reflected in the increase in the number of patent applications seen in this survey and increased reporting of know how as both of these forms of IP are more relevant in early phase deals. Very few deals (6%) involved projects at the later stages of clinical development i.e. phase III or pre-registration. As acquiring new technologies becomes increasingly competitive, there are far fewer opportunities that remain unpartnered by the pre-registration stage.
© MEDIUS ASSOCIATES 47

Review of Results
THERAPEUTIC FIELDS To allow a more detailed analysis than the previous survey, a range of twelve different therapeutic fields were provided from which respondents could select the most appropriate response. There was also the opportunity to specify another therapeutic field if those provided did not cover the technology.
Figure 29 Responses by therapeutic field
0 5 10 15 20
% response
formulation
platform
OTC
derma
CNS
A-I
oncology
GI
CVS The response rate for this question was high at 97%. Only 14% of the deals were reported to cross into multiple therapeutic areas. Platform/enabling technologies and oncology were the most frequently reported therapeutic fields at more than 15% of the number of deals. Cardiovascular, CNS and formulations also featured heavily, each accounting for 13-14% of the deals. Other therapeutic fields less frequently reported are denoted in the table below.
Table 13 Therapeutic field - low level responses
Sensory area 3 Metabolics 4 Respiratory 2 Urology 1 Diagnostics 2 Veterinary 1 Other 6
© MEDIUS ASSOCIATES 48

Review of Results
FINANCIAL MODELS It is evident from the responses received that one model Net Present Value (NPV) is almost universally favoured despite some drawbacks. This is similar to the results reported in the original survey.
Figure 30 Reported financial models
0 20 40 60 80
% responses
NPV
DCF
Option
Other
Of those who answered this question, 76% used NPV. Second in popularity was Discounted Cash Flow (DCF) at 26% of usage, followed by Option Valuations at 20%. In the previous survey, Options valuation was only used by one respondent however another respondent replied that the company had also written its own software for deal valuation. A few companies are employing other techniques, and these included:
seeking royalty ranges from the Recombinant Capital site9 decision trees market value internal rate of return (IRR)
Interestingly, two respondents reported that no financial models had been used.
9 this site now requires subscription access.
© MEDIUS ASSOCIATES 49

Review of Results
NPV can show a large difference between the figures produced now and those two years hence. The usual working practice is often simply to run the NPV only at the time of acquiring the technology. This appears to be so in the majority of the reported deals. In the remaining cases NPV is used in conjunction with other models. The chart below shows for each main type of financial model, the relative percentage that it will be used by itself or with one of the other financial models.
Figure 31 Association of financial models
0% 20% 40% 60% 80% 100%
NPV
DCF
Option
alone NPV DCF Option
NPV was most often used in isolation. In contrast, DCF was least often used by itself, and was most often used in conjunction with NPV. Three respondents employed all three models. It is possible that larger companies may be better resourced in terms of financial advice so are able to carry out far more sophisticated financial analyses than smaller companies. However most business development departments now even in small and biotech companies have a dedicated business analyst whose main responsibility is to undertake financial modelling of deals.
© MEDIUS ASSOCIATES 50

Review of Results
ANTICIPATED PEAK SALES Figure 32 Responses for anticipated peak sales
0
5
10
15
20
25
30
% re
plie
s
<25 <50 <100 <150 <200 <250 <300 <400 <500 500+
range US $m
The majority of the deals reported (59%) were for technologies with anticipated peak sales of less than US $ 250 million. With multinational companies quoting their in-licensing hurdle of peak sales in excess of US $ 600m, this shows that few of these technologies would meet that criterion. Projects in the late phase of development, pre-registration and launched products, make up 87% of the <US $ 10m sales category. In line with this observation that most are for late stage deals, 40% of the deals involve trademarks or know how. Similarly, other characteristics of this <US $ 10m sales category are low future development costs, low upfront and milestone payments and commensurately low headline values. This group represents the single territory, one product deals by medium sized companies.
The US $ 500+m category is predominately comprised of mid to early phase development projects, for example 81% of the deals in this category are between research lead and phase II in development. For this >US $ 500m category, 50% of the partners are multinationals, compared to the survey average of 39%. This is in line with the need for multinationals to find major revenue opportunities. In line with the high anticipated return, this category also featured high future development costs.
Other observations include the fact that over 50% of the respondents were SME or Drug Delivery companies. Also, just over a 25% of the deals were in phase II development.
© MEDIUS ASSOCIATES 51

Review of Results
ANTICIPATED DEVELOPMENT COSTS
Figure 33 Range of future development costs
05
101520253035
% re
plie
s
<10 <20 <30 <40 <50 50+
US $ m
2001 2000
The peak of deals with proportionally low development costs correlates well with the significant number of reported deals for launched products, where little or no development is required.
Figure 34 Future development costs and associated project status
0 10 20 30 40
no. of replies
0-10m
>10-50m
50+m
US$
lead & pre-clinical phase I phase IIphase III pre-reg & product
© MEDIUS ASSOCIATES 52

Review of Results
Low anticipated development costs are closely related to the late stage development project. Also, the deals with projected development costs of greater than US $10m have similar development status profile. There is a high proportion of early stage projects where the anticipated development costs exceed $ 50m, there are also some late stage projects with high development costs. This can be accounted for by the increasing need for cost benefit studies and line extension or formulation developments of launched products. As the combination of peak sales and development terms give a sense of the profitability of a given project, these aspects in relation to the deal terms they may attract are considered in greater depth in the Analysis section.
© MEDIUS ASSOCIATES 53

Review of Results
HEADLINE VALUE Headline values are important when writing the press release and in particular in encouraging a positive impact on the share price. Also a major concern for companies is the potential creation of a deal value precedent that may be set by publishing the headline deal value. This can work favourably when trying to set a market price for a new technology that will be partnered on a field exclusive basis. The survey response for headline value did not give the results that were expected. In several cases, respondents gave unexpectedly low returns for headline value, often the same as the upfront fee, but ignoring the effects of both milestone and equity components of the deals. It is generally accepted practice to add together all the key financial components of a deal when formulating the headline value. There could be several reasons, which may account for this observation:
• Certain companies set the headline value low for some specific strategic reason.
• No previous publicity had been given announcing the deals, therefore no
headline value had been set (this is not likely in the case of biotech companies but may be for privately owned or family businesses).
• The term “Headline Value” might not be recognised by some respondents, thus
an arbitrary value was given, often the same value as the up front fee. Intuitively, the last reason appears to be the most probable explanation, particularly in the light of the low response rate to this question by the direct mail respondents. In order to clarify this issue, future surveys will provide a zero or “not applicable” option for this question and guidance notes on the definition of headline value will be given.
© MEDIUS ASSOCIATES 54
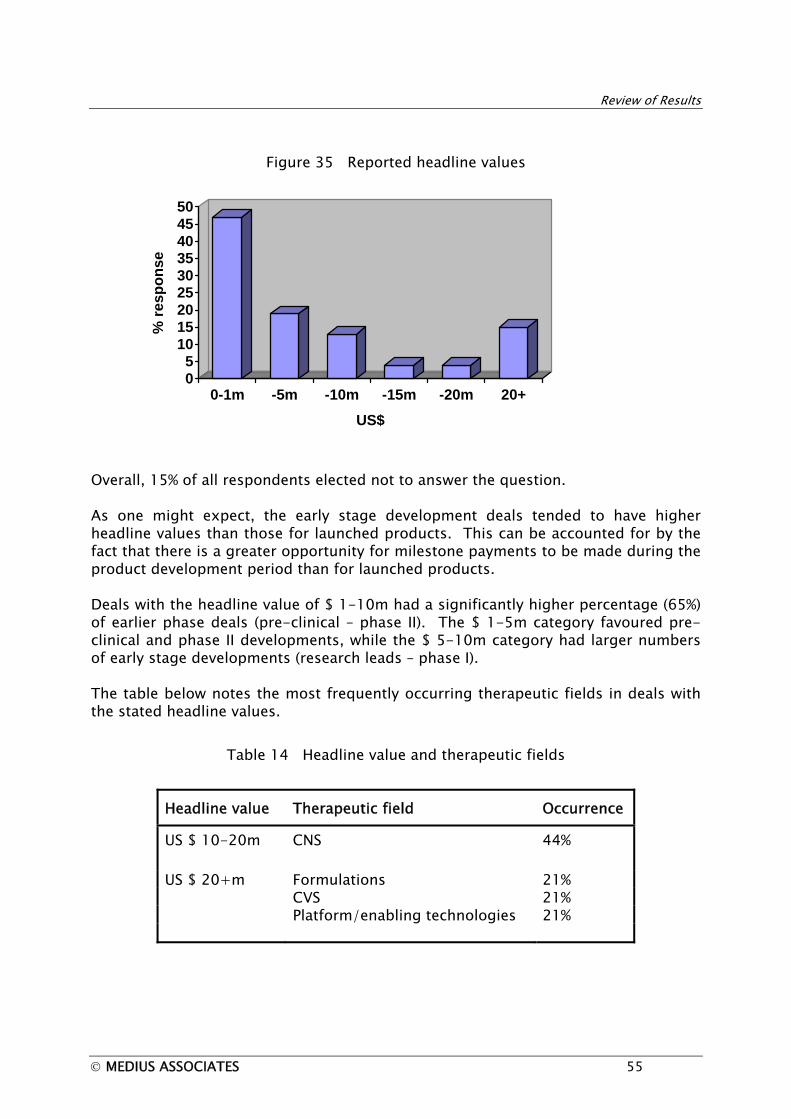
Review of Results
Figure 35 Reported headline values
05
101520253035404550
% re
spon
se
0-1m -5m -10m -15m -20m 20+
US$
Overall, 15% of all respondents elected not to answer the question. As one might expect, the early stage development deals tended to have higher headline values than those for launched products. This can be accounted for by the fact that there is a greater opportunity for milestone payments to be made during the product development period than for launched products. Deals with the headline value of $ 1-10m had a significantly higher percentage (65%) of earlier phase deals (pre-clinical – phase II). The $ 1-5m category favoured pre-clinical and phase II developments, while the $ 5-10m category had larger numbers of early stage developments (research leads – phase I). The table below notes the most frequently occurring therapeutic fields in deals with the stated headline values.
Table 14 Headline value and therapeutic fields
Headline value Therapeutic field Occurrence
US $ 10-20m CNS
44%
US $ 20+m Formulations 21% CVS 21% Platform/enabling technologies 21%
© MEDIUS ASSOCIATES 55

Review of Results
Figure 36 Reported headline values compared with up front fees and milestones
010203040506070
% re
spon
se
0-1m -5m -10m -15m -20m 20+
headline up front
milestone
US$
It is important to note the disparity in the first bar of the graph where the value of the upfront fee is greater than the quoted headline values. It is clear that the quoted headline values of less than $ 1m did not necessarily reflect the financial terms of the deal. This could be due to misinterpretation of the question or where no headline value has been defined. Further evidence of a fundamental misunderstanding of this concept is the data presented in the table below where a large proportion of the deals clearly had either up fronts or milestones greater than the quoted headline value.
Table 15 Disparity in headline reporting
Reported headline value
Up front fees or milestone payments
% of deals
$ 0-1m > $ 1m 44%
$ 0-1m > $ 5m 23%
Where the headline values were greater than $ 1m, the reporting did more accurately reflect the financial terms of the deal. In the analysis of published data, the survey headline value results will be compared with those headline values that appear in the press.
© MEDIUS ASSOCIATES 56

Review of Results
UP FRONT FEES In general, these tend to be proportional to the overall headline value of the deal.
Figure 37 Reported up front payments
0
20
40
60
80
% re
spon
se
0-1m -5m -10m -15m -20m 20+2001
US$
The response rate, at 95% was a significant improvement over the response rate for the previous survey, which was only 75%. The majority of the up front fees were for less than US $ 1m, with 81% of the deals reporting the upfront fee of less than US $ 5m. This is similar in proportion to the original survey results. On considering the deals with up front payments that were greater than US $ 10m five of the reported seven were deals that involved respondents from the USA. Similarly for deals with up front payments in the range of $ 5-10m, five out of nine were in later stage, phase II or phase III clinical trials. The four highest reported up front payments were characterised by the traits denoted in the table below : these were the top four deals in financial terms. This however was not reflected in the reported headline values.
Table 16 Features of the top four financial deals
• three were from US respondents • three were for platform/enabling technologies • three were in early stage development • the stated royalty range was 3-9%, giving an average of 6.6% • all involved milestone payments of between $ 5-20+m, giving an
average of $ 16.9m • three involved an equity component with an average value of $
12.5m
© MEDIUS ASSOCIATES 57
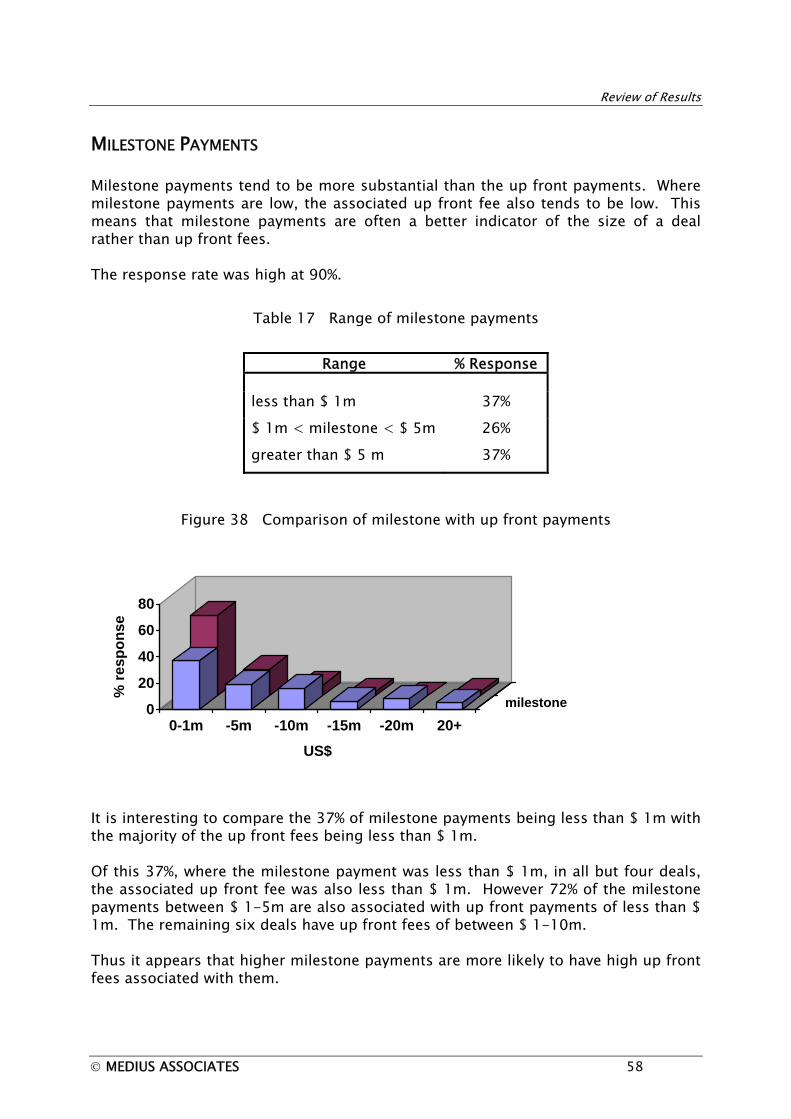
Review of Results
MILESTONE PAYMENTS Milestone payments tend to be more substantial than the up front payments. Where milestone payments are low, the associated up front fee also tends to be low. This means that milestone payments are often a better indicator of the size of a deal rather than up front fees. The response rate was high at 90%.
Table 17 Range of milestone payments
Range % Response
less than $ 1m 37%
$ 1m < milestone < $ 5m 26%
greater than $ 5 m 37%
Figure 38 Comparison of milestone with up front payments
0
20
40
60
80
% re
spon
se
0-1m -5m -10m -15m -20m 20+milestone
US$
It is interesting to compare the 37% of milestone payments being less than $ 1m with the majority of the up front fees being less than $ 1m. Of this 37%, where the milestone payment was less than $ 1m, in all but four deals, the associated up front fee was also less than $ 1m. However 72% of the milestone payments between $ 1-5m are also associated with up front payments of less than $ 1m. The remaining six deals have up front fees of between $ 1-10m. Thus it appears that higher milestone payments are more likely to have high up front fees associated with them.
© MEDIUS ASSOCIATES 58

Review of Results
EQUITY For 59% of the reported deals, the value of the equity component was less than $ 1m so cash clearly remains an important factor in deals. The survey also indicated a geographical divide where European respondents were least likely to have deals containing an equity component greater than $ 1m.
Figure 39 Range of reported equity payments
0 10 20 30 40 50 60
no. of replies
no answer
0-1m
>1-5m
>5-10m
>10-15m
>15-20m
>20m
US$
direct mail web
Most of the reported deals had low or no equity element. The previous survey reported 30% of deals with an equity component. The overall response was poor at 70% and all of the abstentions came from the direct mail approach where 76% did not respond to the question. In contrast, all of the web respondents answered the question, but 84% quoted the lowest value at $ 0-1m.
© MEDIUS ASSOCIATES 59

Review of Results
Additional data on the responses is noted in the table below.
Table 18 Responses on equity
• only 13% of respondents reported an equity component of
more than $ 1m • nearly 50% of these respondents were from the USA
• only 3 were identified as European, however 1 was anonymous
so this may increase the European numbers. • of the remainder of responses, 2 were Asia and one from
Brazil • 6% of the deals had an equity payment of greater than $ 5m,
only one of which was European • 2 deals reported an equity component of $ 20m+, neither
were European
© MEDIUS ASSOCIATES 60

Review of Results
COMPARISON OF EQUITY, MILESTONE AND UP FRONT FEES
Figure 40 Comparison of financial terms for each development stage
0
1
2
3
4
5
6
7
8
US$
m
lead pre-c p I p II p III pre -r prod.
equityup front
milestone
From the graph above, the deal values appear to increase steadily as projects progress through the early stages of development from research lead to phase I. The Phase I deals have the highest average values for each of the components and also have one of the highest averages for royalty rate. Deals at the pre-registration stage had the lowest average values, but had the highest average royalty rate at 8.1% . Equity is clearly not a major feature in late stage deals, it is far more apparent in early stage projects where the risk is significantly higher.
© MEDIUS ASSOCIATES 61

Review of Results
Figure 41 Comparison of financial terms for different therapeutic fields
0123456789
US$
m
platform oncology CVS
equityup front
milestone
The average values for deals in different therapeutic fields vary substantially so no general conclusions can be drawn. This reflects the fact that most of the major markets such as CNS and oncology contain many sub markets that have highly variable values from niche markets to blockbuster potential.
© MEDIUS ASSOCIATES 62

Review of Results
ROYALTIES The response rate for this question was 97%, which contrasts strongly with the previous survey where 30% of survey respondents elected not to provide this key information.
Figure 42 Ranges of reported royalty rates
0
510
1520
2530
35
%re
spon
ses
<2 3-5 6-9 10-12 13-16 >16royalty rates %
2001 2000
With the exception of the 10-12% bracket, the graph mirrors the findings in the original survey. This year, 59% of companies reported royalties below 5% compared with 35% the previous year. Of the companies that reported a royalty below 5%, this corresponds to the large number of early stage alliances or co-development agreements. Half of the respondents in the 0-2% category provided the additional information to the effect that their deal did not contain royalties. A number of other methods of reward distribution were used, which included -
Table 19 Reward mechanisms
• % of Cost of Goods
• via manufacturing supply agreement
• profit sharing
• research funding
© MEDIUS ASSOCIATES 63

Review of Results
Only 13% of the reported returns had a double digit royalty rate. This supports the view that very few true high level royalty rates are concluded. Often where there is a double digit royalty agreed, this is frequently not a true royalty as it may include the supply of active ingredient in the royalty structure or it may be payable within a joint venture company. The average royalty rate for the survey overall was 5.4%. Also from the entire survey, only five returns recorded a royalty rate greater than 20%. This compares with only one received previously. Of these five returns, four of the deals were for a product in late stage development.
Agreement Type The type of agreement often reflects the development status of the project. It also has a major influence on the reward structure of the contract as it reflects the contribution made by each of the parties to the success of the product or technology.
Table 20 Range and average royalties for different strategic alliances
Agreement type
Royalty %
Range Average
Alliance 0-20 % 5.7% Co-development 0-20 % 5.8%
Licence 0-20+% 6.1% Co-marketing
0-20+% 10.4%
Co-promotion 20+% 20+%
The royalties quoted in co-marketing and co-promotion agreements in several cases were not true royalties. In at least two cases they included a cost of goods.
© MEDIUS ASSOCIATES 64

Review of Results
Development status The survey shows that there is fluctuation in royalty rate according to the phase of development.
Figure 43 Average royalty rates by development status
0
2
4
6
8
10
% ro
yalty
lead pre-c p I p II p III pre-r prod
Not surprisingly, the deals involving research leads had the lowest average royalty payments. However, later stage developments did not necessarily command the highest royalty rates. The differences between the rates in each phase were not as clearly defined as for the other financial elements.
Table 21 Range and average royalty for development status
Phase of development
Royalty
Range
% Average
% Research lead 0 – 20 4.2 Pre-clinical 0 - 20+ 6.3 Phase I 0 – 20 7.4 Phase II 0 – 10 5.0 Phase III 0 – 10 5.4 Pre-registration 0 - 20+ 8.1 Launched product 0 – 20 6.4
The range of royalty values was high for nearly all of the phases of development. The exception to this is for phases II and III. Deals completed at these stages of development both had a very tight range of royalty values making the average an accurate reflection of the actual deals.
© MEDIUS ASSOCIATES 65

Review of Results
ROYALTY BY THERAPEUTIC FIELD
Figure 44 Average royalty rates by therapeutic field
0
2
4
6
8
% ro
yalty
platform form. oncology CNS CVS
PERFORMANCE CRITERIA Several respondents provided comments and information on the performance criteria that applied to the reported deal. The most frequently reported performance criterion was that a level of minimum royalties had to be achieved to retain the granted rights. The next most reported performance criteria was promotional spend.
Figure 45 Performance Criteria responses
0 10 20 30 40 50 60
% responses
minimum royalties
promotional spend
none
other
52% of respondents reported minimum royalty clauses as part of their deal. Promotional spend was also used as a means of performance criteria in 17% of deals.
© MEDIUS ASSOCIATES 66

Review of Results
Interestingly, 14% of deals did not use performance criteria
Table 22 Other reported performance criteria
identifying a lead candidate for development
presentation of development plan
reaching certain development hurdles
time specific targets for registration
minimum purchase of products
minimum sales
a specific number of promotional calls
maintaining field force cover
© MEDIUS ASSOCIATES 67
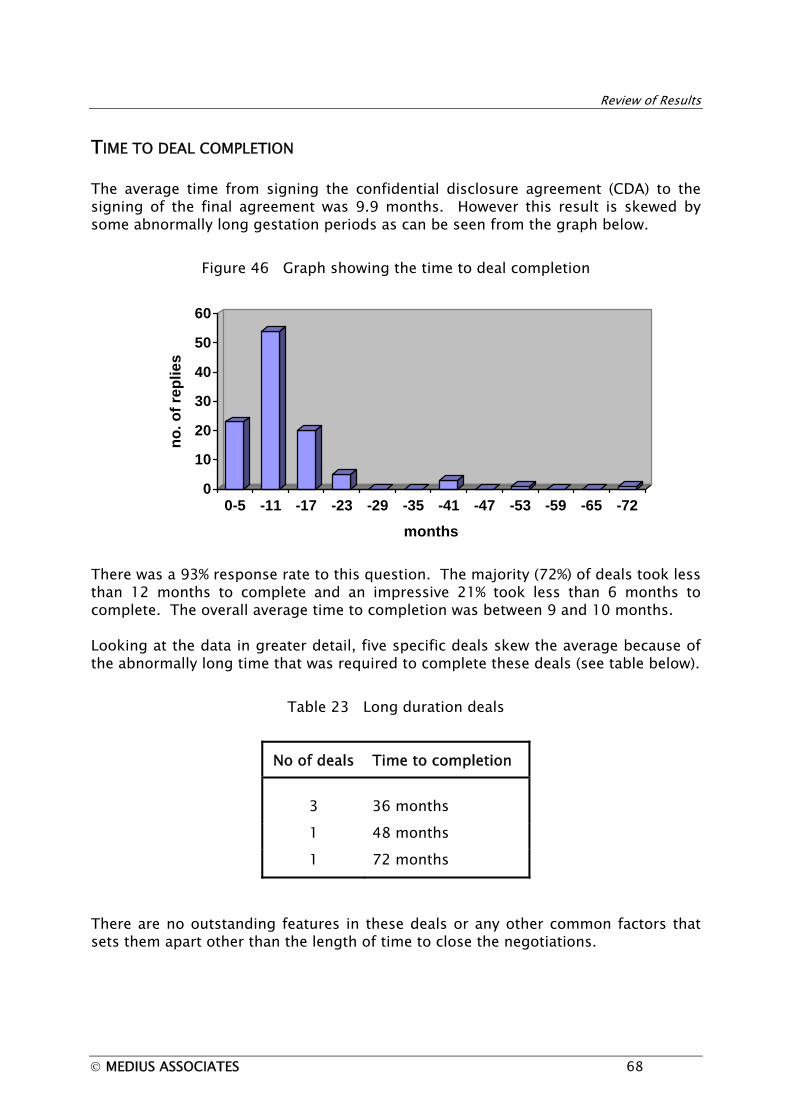
Review of Results
TIME TO DEAL COMPLETION The average time from signing the confidential disclosure agreement (CDA) to the signing of the final agreement was 9.9 months. However this result is skewed by some abnormally long gestation periods as can be seen from the graph below.
Figure 46 Graph showing the time to deal completion
0
10
20
30
40
50
60
no. o
f rep
lies
0-5 -11 -17 -23 -29 -35 -41 -47 -53 -59 -65 -72
months
There was a 93% response rate to this question. The majority (72%) of deals took less than 12 months to complete and an impressive 21% took less than 6 months to complete. The overall average time to completion was between 9 and 10 months. Looking at the data in greater detail, five specific deals skew the average because of the abnormally long time that was required to complete these deals (see table below).
Table 23 Long duration deals
No of deals Time to completion
3
36 months
1 48 months
1 72 months
There are no outstanding features in these deals or any other common factors that sets them apart other than the length of time to close the negotiations.
© MEDIUS ASSOCIATES 68

Review of Results
Figure 47 Graph of normalised time to deal completion 10
0
10
20
30
40
50
60
no. o
f rep
lies
0-5 -11 -17 -23
months
By excluding the five highest and five lowest values, the effects of the extreme values are removed in a statistically acceptable manner. This has the effect of reducing the average time to complete a deal to 8.5 months.
10 excluding the five highest and five lowest values
© MEDIUS ASSOCIATES 69

Published Data Analysis
PUBLISHED DATA ANALYSIS The source of the published data used for comparisons in this survey was from the Recombinant Capital web site (ReCap). In the original survey, a number of other sources of published data including Scrip and Windhover were also used. However it was decided that for this year a single comprehensive source of published data would be used. This was to ensure that:
the same deals were not recorded in multiforms from different sources
all deals were recorded in a similar manner using similar parameters thus providing a sound basis for analysis
Recombinant Capital Recombinant Capital (ReCap) is a consulting firm specializing in biotechnology alliances, earned alliance revenues, product sales, employment agreements, company information and capitalization. From press releases received and industry published articles, ReCap compiles a database of deals and their declared financial terms. On their website, Recombinant Capital (ReCap) summarise and publish details of all relevant published reports that come into their possession. This makes the ReCap website a good source for obtaining a published deal information.
Parameters of data analysed All published deals in the ReCap website for the 12 month ending October 2001 were reviewed. This period was chosen to provide a comparable base between the published data and the survey results. For this period a total of 578 deals appeared in the database.
© MEDIUS ASSOCIATES 70

Published Data Analysis
Figure 48 Overview of published deals from ReCap
0 20 40 60 80
% reported deals
no financial details
headline value
royalty
It is clearly evident from the graph that the majority of published deals contain no financial information about the deal in question. Indeed, only 24% of the published details contained headline values and only 3% of the deals contained information about royalty rates.
Headline Value As the analysis showed, some of our data on Headline values was not reliable but reviewing the published data would allow a comparison of headline values.
Figure 49 Range of headline values from published data
05
1015202530354045
no. o
f rep
lies
0-1m -10m -30m -50m -100m +100m
US$
© MEDIUS ASSOCIATES 71

Published Data Analysis
The average headline value was US $ 223m however this was affected by four major deals. These four deals combined quoted a headline value greater than $ 1000m. Looking at these in greater detail, three of the deals were corporate acquisitions thus the Headline reflected the purchase price of the business and assets. The fourth deal was a co-promotion deal in the oncology field, reflecting the joint anticipated promotion budget rather than a cash payment. On removal of these four exceptional deals, the average headline value drops to US $ 70m.
Figure 50 Comparison of headline values (published and survey data)
0
10
20
30
40
50
% re
spon
se
0-1m -5m -10m -15m -20m 20+
surveypublish
US$
Observations Except for the highest and lowest values, the survey and published data have a similar profile. It is worth noting that the lowest category is overstated in the survey data group. At the other end of the scale, in relation to the top level deals, a high headline value is very newsworthy and therefore more likely to be published.
© MEDIUS ASSOCIATES 72

Published Data Analysis
Figure 51 Headline value for different deal types
0 20 40 60 80
responses %
co-dev
license
co-mktg
jv
acquire
survey publish
25% of the published data related to divestment and acquisition deals. Primary data indicates that only 11% of the deals that were reported are of this type. The main audience for the direct mail approach and the likely audience for the Pharmalicensing website are persons actively involved in business development and licensing. This activity does not always include corporate acquisition work (depending on the company). So it is not surprising to see that the survey under reports this deal type when compared with published information. Other factors that may account for this disparity are that acquisitions are “headline news” and publishing basic details is fairly essential. The parties involved in such deals view the publicity as beneficial to the share price and hence produce a press release. In such cases, releasing financial data is important as evidenced by the fact that 49% of the published deals, which quoted a headline value, were divestments or acquisitions. Of the remaining deals including financial data, 17% of the published headline value deals were classified as collaborative agreements; however, the precise type of collaborative deal was not specified. The most common form of deal in the published data sample is a licence agreement, which occurred in twelve of the deals.
© MEDIUS ASSOCIATES 73

Published Data Analysis
Impact of divestment and acquisition deals on headline value Analysis of the published data revealed that divestment and acquisition deals had a disproportionate affect on the average headline value. This is because divestments and acquisitions accounted for almost 50% of the values quoted and the headline values were much higher than average. By removing the divestments and acquisitions from the sample, the average headline value reduces to US $ 40m. It is obvious that a corporate acquisition which includes purchase of shares and assets (potentially with premises) rather than a technology opportunity will have a significantly higher headline value.
Figure 52 Quoted headline values by therapeutic field
0 10 20 30 40 50
% response
platform
oncology
CVS
AI
metabolic
other
divest
Divestment deals did not provide reliable information on the specific therapeutic field. However, these deals accounted for 49% of the deals where headline value was quoted but will not be used for the analysis of headline values with regard to therapeutic use. Similar to the survey data, platform technologies featured strongly accounting for over 20% of these deals. Oncology, CVS and AI each accounted for 7%.
© MEDIUS ASSOCIATES 74

Published Data Analysis
Figure 53 Therapeutic field : headline value compared with average financial terms
0
10
20
30
40
US$
m
platform oncology CVS AI
upfrontmilestone
headline
From the survey data it was evident that the published headline values do not reflect the average deal value. This is reflected in the published data where the headline values are substantially larger than combined average milestone payments and up front fees. Looking at more detail at those headline deals with a value greater than $ 100m, 74% of deals were divestments and acquisitions. Three of the remaining deals were in the therapeutic field of metabolics, specifically the treatment of diabetes and obesity. This is an area where there is great demand for new technologies and certainly in deal terms this remains one of the key areas to watch. 50% of deals with headline values greater than US $ 50m and lower than US $ 100m were divestment and acquisitions. Three of the deals in this category were CVS developments. One of these agreements was that between Bayer and Avigen for the gene therapy treatment of haemophilia B (Coagulin-B) with a headline value of US $ 60m. For headline values in the range between $ 20m and $ 50m, divestments and acquisitions continue to account for 50% of the deals. Platform technologies form the next most important therapeutic field, closely followed by CVS. For example, Scios had an agreement reported in this category with Innovex / Quintiles Transnational, which had a headline value of $ 35m. For headline values below $ 20m, the percentage of divestment and acquisition deals drop to 40%. Platform technologies account for 31% of the deals; and oncology for 8% of the deals.
© MEDIUS ASSOCIATES 75

Published Data Analysis
ROYALTY RATES Only 3% of the published deals quoted a royalty rate, which equates to 17 deals in total. It is clear therefore that published data alone is not a good source for gaining access to royalty information. Also unlike the survey, the published deals had a higher proportion of double digit royalties. This fits with companies publishing what appear to be newsworthy values.
Figure 54 Range of royalty rates from published data
0
1
2
3
4
5
no. o
f dea
ls
<2 3-5 6-9 10-12 13-16 17-20 20+
royalty rates %
In looking at these deals there was a very great range of royalty payments, with two deals reported with royalties of over 70%. However in both cases, these were collaborative / joint venture arrangements and as such represented more of a profit share arrangement than a true royalty. With these two profit share deals removed from the sample, the range and average published royalty rate is:
Table 24 range and average published royalties
Range 0.5 – 17.4%
Average 8.8%
Interestingly, the two lowest royalties both related to platform technologies.
PROJECT STATUS The published information did not give any information relating to the project development status.
© MEDIUS ASSOCIATES 76

Deal Analysis
DEAL ANALYSES In this section of the report there is a more detailed analysis of certain sub sets of data. Each year, one or two specific areas are considered in greater depth. This year, we have addressed :
• a profile of two “typical” deals based on the database information.
o an early stage licence o a divestment / acquisition
• a range of typical partnering options by company type.
• deal analysis with reference to peak sales and development costs.
EARLY STAGE DEAL PROFILE Definition: a deal signed ahead of when a product reaches the pre-clinical development phase i.e. when the project status is at “Research Lead” stage.
Table 25 Typical features of an early stage deal
Feature Comment
Partner
Of any size
Deal Type Research Alliance or Patent Licence
Exclusivity Exclusive
Territory Worldwide
IPR Patent Application or Granted Patent with accompanying Know how
Project Status Research Lead
Up front fees Generally low, average US $ 2.3m
Milestone Payment Medium, average US $ 5.5m
Royalties Low, average 4.2%
© MEDIUS ASSOCIATES 77

Deal Analysis
This information is based on the 17% of reported deals that were concluded at the research lead stage. Research Alliances were the most common type of Research Lead deal of making an appearance in 54% of the deals. Research Alliances are risk and reward sharing arrangements where the partners share technology and expertise. This compares with 20% in the total deal population. Licences appeared in 38% of deals. Licences are a more arms’ length arrangement than an alliance with the responsibility passing from one partner to the other. This compares with 55% in the total deal population.
Figure 55 Comparison of IPR in early stage with the total response
0102030405060
% re
spon
se
pat. app. patent trademark knowhow
leadtotal
Patent applications were a common feature appearing in 60% of Research Lead deals whereas Patent applications appeared in only 37% of the total survey responses. Know how was also extremely important (50%). Not surprisingly, trademarks did not figure in any of the deals, yet trademarks were in present in 23% of the total deal population. In terms of therapeutic fields, oncology and platform enabling technologies were the most featured. Together they appeared in half of the research lead deals.
© MEDIUS ASSOCIATES 78

Deal Analysis
Figure 56 Comparison of early stage financial terms with total survey response
0
5
10
15
% re
spon
se
0-1m -5m -10m -15m -20m 20+m
equityup front
milestone
Large up front fees are not usual nor are being made for deals at this stage of product development. 58% of deals had up front fees of between $ 0-1m, i.e. either a low or no upfront payment.
Exceptions to the norm Within our survey results, one or two deals did break the trend usually seen for early stage deals. The two largest up front payments, of between $10-15m, are probably not true “up front” payments. One is for the acquisition of a company, and therefore represents the purchase price. The other is for a joint venture and is therefore unlikely to represent hard currency for a technology alone. Equity was not a common feature; only 4 deals quote equity values greater than US $ 1m. All deals that had equity components also featured upfront payments and/or milestone payments of greater than $ 1m. Milestone payments of greater than US $ 1m featured half the deals with the average milestone value being US $ 5.5m.
© MEDIUS ASSOCIATES 79

Deal Analysis
Influential Factors The presence of solid know how in a research alliance deal increases the value of the deal as does the quality of the data package. A high quality data package will shift the royalty rate upwards.
Figure 57 Comparison of financial values for deals with/without know how
0123456789
US$
m
upfront equity milestone
both with knowhow without know how
The average upfront fees increase to US $ 3.5m when the deal includes know how; for deals that do not include know how the average is US $ 1.6m. Interestingly, equity and milestone payments follow a similar trend. Royalties also increase in the presence of know how to an average of 8.3% Know how is a reasonable indicator of added value to a technology package. This would explain the shift in value of the deals.
© MEDIUS ASSOCIATES 80

Deal Analysis
ACQUISITION/DIVESTMENT DEAL PROFILE
Table 26 Typical Features of an acquisition/divestment
Feature Comment
Partnering Multinational with Multinational or Medium
Exclusivity Exclusive
Territory National or Regional
IPR Know how, possibly trademarks
Project Status Registered Product
Upfront payments High, average US $ 3.5-5m
Royalties Low, generally between 0-2%
11% of deals were either divestments or acquisitions. Nine of the deals involved the divestment of finished products.
Multinational companies, as either respondents or partners, were involved in all but 2 of the deals. This fits with the portfolio rationalisation that takes place on either a national or international basis post merger such as the divestment programme undertaken by GSK during summer 2001. Multinational and medium sized companies together made up 92% of respondents and 85% of partners. 11 of the 13 deals were exclusive in nature, but the deals were more likely to be national or regional (46%) in territorial terms than worldwide (31%). International divestment projects are few, unless a global blockbuster, (in which case divestment is only likely under guidance of antitrust legislation) products vary in their national potential and so tend to be divested on a regional or national basis. Patent cover, application or granted, was relevant in substantially less than half the deals (39%). Far more important were trademarks (58%) and know how (77%). This implies that the products are probably at the end of their patent life, which is likely for divested products. Of the remaining deals, two were late stage development, both involving a non-typical respondent or partner (a drug delivery company and an SME), both were global in territory and one was non-exclusive. The other two were early stage development projects, equally non-typical in that these were the only two Multinational with Multinational deals. This deal may represent a strategic withdrawal from a therapy area.
© MEDIUS ASSOCIATES 81

Deal Analysis
These four deals were also different in their financial terms (see below). In the majority of cases both the anticipated peak sales and the future development costs were in the lowest brackets of $ 0-25m and $ 0-10m respectively. For three of the four exceptions to this anticipated peak sales norm and two of the three exceptions to the future development costs norm were related to the four deals discussed above. The remaining exception to each was related to the only divestment that was also a patent licence. It was an exclusive worldwide arrangement that had the greatest variety of IPR related to it, granted patents, patent applications and know how. It also commanded the largest upfront payment and highest royalties.
Figure 58 Comparison of upfront payments : divestment/acquisition and all deals
0 1 2 3 4 5 6
ave upfront payment, US$ m
w/o divest
all survey
divest
For divestments, upfront payments tend to be larger than the average for the whole survey, at US $ 5.2m compared to US $ 2.7m. Even with the removal of the highest upfront payment the average is still higher at US $ 3.5m. However, the average upfront payment drops to US $ 2.4m with the removal of divestments and acquisitions from the survey results. Equity payments were non-existent in these deals.
© MEDIUS ASSOCIATES 82

Deal Analysis
PARTNER OVERVIEWS The survey results were further analysed to identify any common or distiguishing features in results between companies of different sizes. This year the overview is of deals between Medium sized and Multinational companies (jointly referred to as Pharma) and Biotech or smallers companies (jointly refered to as SME). These are intended as a snapshot view of the survey from a different perspective.
Pharma-Pharma Deals
Table 27 Typical features of pharma-pharma deals
Feature Comment
Partnering
Multinational or Medium with Multinational or Medium
Deal Type Any
Exclusivity Exclusive
Territory Worldwide or National
IPR Patent or Patent application, possibly Know how
Project Status Early or Late phase
Upfront payments Moderate to high, average US $ 3.2m
Milestone payments Moderate, average US $ 5.3m
Royalties Moderate, average 5.7%, normal range 0-9%
© MEDIUS ASSOCIATES 83

Deal Analysis
58% of deals were between multinational and/or medium sized companies. The majority of deals were exclusive with 23% non- exclusive. The territory granted is either global or national. The majority of deals are based on patents and patent applications. Know how features in 40% of deals and trademarks in 30%. The development status of the projects tends to be either early (30% research lead and pre-clinical) or late (41% launched product). Up front fees and milestone payments both have a wide range of values from $ 0-20+m; deal values are highly variable. 75% of royalties are between 0-9%. A recent published example11 of a pharma-pharma deal is that between Eli Lilly and 3M for the immune response modifier, Resiquimod. 3M are due to receive a $ 100m up front fee with milestone and royalty payments. However, 3M are to continue the development through to regulatory approval. Lilly in return gain worldwide marketing rights; 3M retain the option to co-promote to specific customer groups. This deal is sparing on Lilly’s development resources but improves the product pipeline long term.
11 Scrip issue 2683
© MEDIUS ASSOCIATES 84

Deal Analysis
Pharma-SME Deals
Table 28 Typical Features of a Pharma/SME deal
Feature Comment
Partnering Multinational with SME
Deal Type Licence
Exclusivity Exclusive
Territory Worldwide
IPR Patent or Patent application
Project Status
Any, but probably Phase II or earlier
Upfront payments Low, average US $ 1.6m
Milestone payments High, average US $ 9.4m
Royalties Moderate, average 5.1%, normal range 0-9%
18% of deals were Pharma–SME deals and Multinationals constituted 67% of the partnering companies. Medium sized companies do not partner as frequently with SMEs. This is entirely logical, as medium sized companies generally cannot invest as heavily in R&D. Licensing is the most common deal type (71%). Co-development was the next most favoured deal type (14%). Patents or patent applications feature in most deals and know how in one third. Trademarks are relatively rare. Products tend to be in earlier in development phases, for example 33% are in phase II. The range of up front fees is narrow and low, e.g. US $ 0-5m. Only one deal was reported outside this range, this deal had a value within US $ 5-10m. However, 62% of deals have milestone payments greater than US $ 5m. With the exception of three deals, all royalties are between 0-9%. A recent published example of a pharma SME deal is the deal between Pharmagene and BMS where BMS have subscribed to Pharmagene’s gene expression database, Target Evaluator. This is a classic platform deal, as Bayer already have an agreement with Pharamgene for the Target Evaluator.
© MEDIUS ASSOCIATES 85

Deal Analysis
SME-SME DEALS
Table 29 Typical Features of an SME/SME deal
Feature
Comment
Partnering
SME with SME
Deal Type
Research Alliance
IPR
Patent or Patent application
Project Status
Early
Upfront payments
Moderate, average US $ 2.9m
Milestone payments
Low, average US $ 1.0m
Royalties
Variable, average 6.5%, normal range 0-20%
There were only four deals in this category, all of which were research alliances. Two deals were based on patents and two on patent applications. One deal involved know how, this had the highest upfront payments and royalties. All were in the research lead or pre-clinical development phase. Three were platform/enabling technology in oncology.
A notable published example of biotech consolidation is the recent merger between Millennium and COR. Therapeutics 12. This stock transaction is valued at $ 2 billion – the largest biotech-biotech merger reported to date. The deal fits with Millennium’s strategy to become a FIPCo (fully integrated pharmaceutical company) and brings cash into the new company. The cash injection will provide backing for further product and technology acquisitions.
12 Scrip issue2703
© MEDIUS ASSOCIATES 86

Deal Analysis
Figure 59 Comparison of royalty rates : divestment/acquisition deals and all deals
0 2 4 6 8
ave royalty rate
w/o divest
all survey
divest
The range of royalties is 0-9%. Generally, royalties were either low or non-existent, the averaging being just 1.9%. Only four deals reported royalties of greater than 3%. With the removal of highest royalty the average drops to 1.4%. This is in contrast to the average royalty rate for all deals in the survey, which was 5.3%. However, divestments are often one of transactions and do not always attract a running royalty. This is seen I how the divestment deals pull down the calculation of the overall average as the average royalty rate increases to 6.1% with the removal of divestments and acquisitions from the survey.
© MEDIUS ASSOCIATES 87

Deal Analysis
DEAL VALUE ANALYSIS In simple terms, the deal profitability can be estimated by the measure of the peak sales less the anticipated development costs, so this year these data sets were analysed in greater detail. Thus, each of the potential sales categories was considered in turn in relation to the development costs and the deal value that each could command. In order to ensure that there was sufficient data in each category, the deals were placed into wider groups (see table below.)
Table 30 Range of estimated peak sales $ m
0 - 25 25 - 50 50 - 100 100-150 150-200 200-250 250-300 300-400 400-500 500+
0-25 25-100 100-250 250-500 500+
Group 1 Group 2 Group 3 Group 4 Group 5
The graphs and commentary for the five band analyses (Groups 1-5) are noted in the following text. Group 1 review
Figure 60 Anticipated sales of $ 0-25m with associated development costs
0
5
10
15
20
25
no. o
f rep
lies
0-10m -20m -30m -40m -50m 50+m
US $
© MEDIUS ASSOCIATES 88

Deal Analysis
Group 1 had 30 deals with anticipated peak sales of US $ 0-25m and the average development costs were US $ 12m. However, three deals had an anticipated development cost of US $ 50+. These three skewed the average. By removing these from the calculation the average is reduced to US $ 5.5m. The average royalty rate is 5.7%, however the two deals had royalties of 20+%, which again skewed the average. By removing these the average royalty drops to 4.0% which a more normal reflection of a ‘typical’ deal in this category. The majority of deals in this category involved launched products. Both milestone payments and up front fees were lower than average at US $ 2.9m and US $ 2.0m respectively. Group 2 review
Figure 61 Anticipated sales of $ 25-100 m with associated development costs
02468
10121416
no. o
f rep
lies
0-10m -20m -30m -40m -50m 50+m
US $
In Group 2 there were 25 deals with anticipated peak sales of US $ 25 -100m, with associated average development costs of US $ 21.7m. However, six deals in this group had an anticipated development cost of over $ 50m. These represent 25% of the deals in this field therefore cannot be considered exceptional. It appears that either development costs will be very low or fairly high. As one would expect, early stage products made up the greatest percentage with high development costs i.e. more than US $ 20m. The average royalty rate was 6.3% and the range of royalties was from 0-20+%. Five deals had royalty rates of greater than 10%. The average milestone payments and up front fees were very similar to those in the $ 0-25 category at US $ 2.9m and US $ 1.9m respectively. Late stage development products still appear more frequently in this group than average.
© MEDIUS ASSOCIATES 89

Deal Analysis
Group 3 review
Figure 62 Anticipated sales of $100-250m with associated development costs
00.5
11.5
22.5
33.5
44.5
5
no. o
f rep
lies
0-10m -20m -30m -40m -50m 50+m
US $
In this group, 19 deals had anticipated peak sales of US $ 100-250m with average development costs of US $ 32m. As shown above, the deals were distributed fairly evenly across the complete range of values. The majority of deals in this category involved early phase developments, mainly research leads and pre-clinical. No deals involved launched products. The average royalty rate was lower than in the earlier categories at 4.7%. This may be as a consequence of the large number of early phase deals. Except for one deal with a royalty of 20+%, the royalty range was 0-9%. Removal of the exceptional deal further reduces the average royalty to 3.6%. Up front fees remained low at US $ 1.9m but the milestone payments increased in size significantly to US $ 5.3m.
© MEDIUS ASSOCIATES 90

Deal Analysis
Group 4 review
Figure 63 Anticipated sales of $ 250-500m with associated development costs
0123456789
10
no. o
f rep
lies
0-10m -20m -30m -40m -50m 50+m
US $
Group 4 had 15 deals with anticipated peak sales of US $ 250-500m. The average development cost were the highest in this group at US $ 50m. One deal had an anticipated development cost of US $ 0-10m, making it an exception and therefore skewing the average. The removal of this exceptional deal increases the average to US $ 53m. The average royalty rate was the highest at 6.3%. Only two deals had a royalty of less than 2% and only two deals had a royalty of greater than 10%. This group also had the largest percentage of phase I and phase II developments. No deals involved launched products. These deals featured both the highest average up front fees at US $ 7.1m and milestone payments at US $ 10.1m. However both were skewed by three exceptional payments of US $ 20+m. The removal of the exceptional payments reduces the average upfront fees and milestone payments to US $ 2.7m and US $ 5.7m respectively.
© MEDIUS ASSOCIATES 91

Deal Analysis
Group 5 review
Figure 64 Anticipated sales of $ 500+m with associated development costs
024
6
8101214
no. o
f rep
lies
0-10m -20m -30m -40m -50m 50+m
US $
Group 5 included 26 deals with anticipated peak sales of US $ 500+m. The average development costs were US $ 46m. The majority of the deals with high anticipated peak sales are associated with high development costs. The average royalty rate was 5.8%, however 1 deal had a royalty of 20+%, which skewed the average. By removing this, the average royalty drops to 5.0%, which better reflects the ‘typical’ deal in this category The majority of deals in this group involved research lead developments through to phase II developments. The only exceptions were four deals, which involved launched products. The average up front fee was US $ 2.7m. However one exceptional deal had a value of US $ 20+m effecting the average, this is the only value greater than US $ 10m. The removal of this value reduces the average to US $ 1.8m. The average milestone payment is US $ 9.3m.
© MEDIUS ASSOCIATES 92

Deal Analysis
Table 31 Summary table of peak sales and financial terms
Group 1 2 3 4 5
Est. peak sales $m 0-25 25-100 100-250 250-500 500+
Average development costs
12 21.7 32 50 46
Average royalty
4.0 6.3 4.7 6.3 5.8
Average upfront 2.0 1.9 1.9 2.7 2.7
Average milestones 2.9 2.9 5.3 5.7 9.3
Conclusions The graph below shows that the typical average royalty rates do not appear to increase in size as the anticipated peak sales increase. There are clearly other factors such as the development phase and associated risk which impact on the reward structure.
Figure 65 Average royalty for anticipated peak sales
0
1
2
3
4
5
6
7
% ro
yalty
0-25m -100m -250m -500m 50+m
US $
Similar to the royalties, in the graph below the typical up front fees do not change significantly as the anticipated peak sales increase. The range for these typical fees is between US $ 1.8 – 2.7m.
© MEDIUS ASSOCIATES 93

Deal Analysis
Typical average milestone payments do steadily increase from US $ 2.9-9.3m as the anticipated peak sales increase.
Figure 66 Comparison of typical financial terms with anticipated peak sales
02468
10
% re
spon
ses
0-25m -100m -250m -500m 50+m
up frontmilestone
US $
© MEDIUS ASSOCIATES 94

Future Issues
FUTURE ISSUES
QUESTIONNAIRE IMPROVEMENT During the research for this report, several areas have been identified for future investigation or response improvement in subsequent surveys. Some of these are noted below.
PARTNER COMPANY As there is now increasing complexity within the industry, to assist with the correct allocation of company type, for Questionnaire 2002 (next year’s survey), a guidance list will be issued giving examples of which companies fit into which categories.
CROs CROs (Contract research organisations) are increasingly becoming deal active. Since Quintiles acquired a marketing arm (Innovex) it is entirely possible for such companies to offer an integrated development and marketing operation. Indeed for some SMEs this may be a very viable alternative to partnering with a multinational. Thus a category for CROs will be included in the section on company / partner type.
DEAL TYPE A refinement, which will be incorporated into Questionnaire 2002 will be the grouping of the deal types according to field of activity i.e. whether it is research led or marketing focused. Also due to the increasing amount of divestment and acquisition activity it is important to differentiate between corporate and product acquisitions
Option agreements Option agreements are not frequently seen but this style of contract offers real advantages in situations where there is a high level of risk. The advantages are many; for the licensor there is the possibility of announcing a deal at an early stage and of moving the technology forward with the support of a partner. For the Licensee, there is access to the technology with limited financial exposure so that a decision on any major commitment can be made with the benefit of further data. The downside for the Licensor is that the partner may elect not to proceed with the full licence agreement, but assuming there are full rights of access to the data generated during the option arrangement then this adds value to the project for future licensing discussions.
© MEDIUS ASSOCIATES 95
Future Issues
TERRITORY Future questionnaires will more clearly differentiate to ensure the questions relating to exclusivity and territory are not overlooked by being adjacent on the form.
PROJECT STATUS An additional field, for feasibility studies will be included in future surveys. This option is relevant to drug delivery deals where testing the drug delivery system for compatibility with the active drug is key.
FINANCIAL TERMS Zero boxes will be included for all of the financial terms to separate the true zero responses from the “less than $ 1m” responses. Also an optional open question will be included. We will also include an additional 20%+ category for the royalties question accompanied by a note - “do the royalties contain transfer of active or product” to ensure that we can determine any true 20%+ royalty payments. For equity we will ensure that as well as a zero a "not applicable" option is available.
Linking royalties to life cycles During negotiations there is a concentration on the more immediate cash payments (the upfront fees and milestones) but long term the royalty payments have more impact on the profitability of the product in the marketplace. Recent reports suggest that the product life cycles are changing, so possibly the royalties should be more flexible and adjust to take account of the product life cycle.
Audit of royalties Once the agreement is signed, most companies do not pass on a clear understanding of the royalty rates and errors can occur in the payment of royalties. Audit provisions should be fully employed to the relevant accounts department to ensure the correct revenues are received and paid. It would be interesting to note how many companies have formal audit provisions.
© MEDIUS ASSOCIATES 96

Future Issues
RISK ASSESSMENT The survey has only taken account of projected figures for development cost and market revenues, it would be valuable to add in a risk assessment for R&D and commercial success which is normally included in a project valuation. Similarly few joint ventures have appeared to be outstandingly successful and this encourages the question as to whether appropriate risk analysis is being carried out before entering a joint venture arrangement. Depending on the calibre of the partner company, there may not actually be less risk than 'going it alone'. There is sufficient material for a study into joint ventures alone; for example, how many successful joint ventures have been created, and how many still exist?
OTHER ISSUES Major companies are noting the value of external collaborations and are now deploying resource not only in business development but also in structuring deals and in deal implementation and management. The resource behind the business develoment activity has therefore changed considerably. It would be useful to check the numbers of persons who are employed in a business development role and to know how budgets are run for financing deal activity.
GUIDANCE NOTES More full and complete guidance notes will be available with the questionnaire and also posted on the websites (both Pharmalicensing and Medius).
© MEDIUS ASSOCIATES 97

Conclusions
CONCLUSIONS In essence, the findings of this year’s survey were entirely consistent with those of the previous year. However, in many respects the data has provided a stronger base for analysis.
Responses There are areas of improvement noted for the questionnaire design and distribution, which are detailed in the section on Future Issues. This year the response rate is far superior giving a wider range of deals for review. The international spread has improved and is likely to continue to do so with the continued use of the Internet as a survey information source. The survey has benefited hugely from the co-operation with Pharmalicensing, the enhanced outreach and improved response rate have had a direct and positive impact on the quality of data. This collaboration will be extended in future surveys. There does seem to be a notable variance in the deals reviewed from the USA and Europe. Although the headline value is not as reliable as one would like, there seems to be a higher value written up in the US deals. This may of course simply reflect the fact that there are fewer corporate business development personnel based in Europe and so the majority of the European deals reported will be either for markets smaller than that of the USA or regional and national deals i.e. excluding the corporate mega deals.
Deal type As seen before, the main focus of the survey has been on licences, although there was an upturn in acquisitions and divestments. To eliminate the bias by value of corporate acquisitions, there will be the option to differentiate between corporate and product acquisitions in future surveys. Not surprisingly, the most typical of the licence deals was the global, exclusive licence and there was strong deployment of field exclusive licences, which one expects with platform and enabling technologies, which featured strongly in our results.
© MEDIUS ASSOCIATES 98

Conclusions
IPRs Intellectual property rights are clearly an essential factor in technology transfer deals. Patents and know how feature most heavily in the early stage deals and trademarks play a role in the late stage deals. With the introduction of new IP legislation, there is some concern that the major pharmaceutical companies in Europe are increasingly filing for second medical use patents on products that have been on the market for some time. This then delays any generic competition and extends the product protection in the market. For example so far 19 second medical use patents have been filed for paroxetine (Seroxat) of which three have been granted13. Certainly the use of SPCs has strongly increased with some 6,000 applications for SPCs being filed since January 1991 to date. Therefore we anticipate seeing patents in more of the late stage deals.
Development status The peaks relating to deal activity appeared in development status both for early and late stage deals. This reflects the growing competitive nature of technology transfer where more and more opportunities are secured as early as possible. An example of this is how several European companies are now going to the venture capitalist to see which companies are securing investment and thus being able to form an alliance with a start up company before it has even finalised its partnering strategy. The late stage deals reported in our survey are mostly for already launched products. Again this is an area of increasing competition as new marketing companies vie with the operating units of multinational companies for product opportunities. Although one does generally see an increase in deal value as the project moves up the development chain towards launch, from the data obtained the precise proportion of increase in value is not too clear. Looking at the average royalty rates across the different phase, the pre-registration royalties did average out at the highest level (average 8.1% - which is still rather lower than one would expect for a deal concluded at this point).
Therapeutic field There was a fairly even spread of the deals across the various fields however as usual oncology was an area of peak activity. As there is strong market interest in finding new approaches and opportunities in diabetes at present this did not translate into more deals being reported in this field of metabolic disease. Proportionally, there were far more platform or enabling technologies reported this year. There was no obvious difference in the value of deals in the different market sectors.
13 for anti obesity, expiry 2005; mood disturbance on nicotine withdrawal, expiry 2009 and treatment of pain expiry 2007
© MEDIUS ASSOCIATES 99

Conclusions
Financial models NPV continues to dominate the financial analysis field but option valuation has appeared more strongly. Arguably, option valuation may be of more relevance to larger companies who may have a wider range of partnering options as they are less tightly constrained by funding options.
Peak sales / development costs In combining the data from these two fields the overall picture was not as clear as one might expect. (See table 31). The one feature that does increase in line with increasing anticipated peak sales and development costs is the value of the milestone payments. Royalties appear to be relatively unaffected with changing sales and development costs.
Headline value There is evidence that the headline values for the deals reported in this survey do not truly reflect the sum of the actual deal components. In contrast the published data shows a far higher value for headlines, in line with other key financial terms. This will be an area for greater scrutiny in subsequent surveys.
Upfront fees and milestones Up front fees do in general tend to be proportional to the overall headline value. But despite the strong appearance of late stage deals, 81% of the up front payments were for less than $ 1m. The milestone payments were more substantial than the upfront payments with only 37% reporting the lowest level of less than $ 1m. From the data it appears that the larger milestone payments were also more likely to have larger associated up front fees.
© MEDIUS ASSOCIATES 100

Equity There was evidence of a geographical divide here with European respondents being less likely to have a major equity component in the deal. Having said that, most of the reported deals had little or no equity. This is not so surprising as equity is not necessarily available from established companies and so mainly relates to the start up and SME deals. Again as equity is limited to one area of company type, within those companies there may be reluctance from existing shareholders to dilute the shareholding. Also VCs may not encourage equity participation as their exit strategy may include a trade sale at a later point (trade sales being more favoured at present due to unreceptive market conditions for IPOs) and for whom another corporate shareholding would prove to be a deterrent to other purchasers.
Royalties The response on this question was very consistent with the previous year’s survey showing the majority (79%) of royalties below 10% and 59% of responses below 5%. This of course may well reflect the large number of early stage deals in the data base.
Performance criteria The range of performance criteria reported fitted well with the types of deals that were reported. The only disparity is that only 4% reported no performance criteria applied to the deal in question. This then implies that for the large number of divestments / acquisitions reported, the agreement attracted some type of performance provision.
Deal completion The adjusted average time for deal completion was 8.5 months, but the range was extensive from 5 to 72 months.
Published data Published data remains a limited source of information. In particular it is difficult to gauge what other issues lay behind the headline. There was stronger reporting of acquisitions in the published data, but very little information on royalty rates. Overall published rates appeared higher in most categories.
© MEDIUS ASSOCIATES 101

Glossary
GLOSSARY
ADRs Adverse Drug Reactions AR Assessment Report CDA Confidentiality disclosure agreement CoGs Cost of Goods CPMP The Committee for Proprietary Medicinal Products, the committee
within the EMEA responsible for preparing the EMEA's opinion when evaluating medicinal products for human use.
CRO Contract Research Organisation CTX Clinical Trials Exemption Certificate EC European Commission EMEA European Medicines Evaluation Agency, the agency controlling the
safety and approval of drugs in Europe FDA Food and Drug Administration, the agency controlling the safety and
approval of drugs in the USA FIPCo Fully integrated pharmaceutical company GCP Good Clinical Practice GLP Good Laboratory Practice GMP Good Manufacturing Practice ICH International Conference on Harmonisation IMS Intercontinental Medical Statistics IPO Initial Public Offering IPR Intellectual Property Rights LESI Licensing Executives Society International MAA Marketing Authorisation Application, an application to the EMEA for
approval of a drug MCA Medicines Control Agency NCE New Chemical Entity NICE National Institute for Clinical Excellence NPV Net Present Value NSV Net Sales Value
© MEDIUS ASSOCIATES 102

Glossary
Phase I Trials
Phase I clinical trials are the first studies of a drug in man (“healthy volunteers"). They are designed to test the safety of a potential drug and its handling in the body. In these studies, up to 100 healthy human volunteers may be given the drug.
Phase II Trials
If Phase I is successful, the drug will enter pilot efficacy trials in patients, which are known as Phase II. At this stage, the drug may be evaluated as a treatment for one or several clinical conditions and the optimum dosage and frequency of administration will be established. A series of Phase II studies may be undertaken involving between 50 and 300 patients for each indication.
Phase III Trials
For a new drug to be approved for marketing it must undergo trials in the target patient population of sufficient scale to demonstrate statistically significant benefit and long term safety. During these Phase III trials, typically involving a few hundred to several thousand patients (dependent on the indication), the drug's effectiveness is compared with placebo and often with recognised treatments under conditions reflecting normal clinical practice.
Phase IV Trials
Following the regulatory approval of a drug, it may be necessary to conduct further clinical trials, which are referred to as Phase IV trials.
Pivotal Trials
These are normally Phase III trials but could also be a Phase II study as long as the study is randomised and controlled. The designation of a study as "pivotal" is usually agreed with the FDA before a study starts. The oncology division of the FDA has at times used different designations for clinical trials with cytotoxic drugs, as they cannot be given to healthy volunteers. The first trial in patients is referred to as Phase I, by the oncology division of the FDA and to differentiate the various stages of clinical trials reference is at times made to Phase I9b) and Phase I/II.
PLA Product Licence Application PLV Product Licence Variation PMS Post Market Surveillance QA Quality Assurance QC Quality Control R&D Research and Development ReCap Recombinant Capital RMS Reference Member State RoW Rest of World SEC The Securities and Exchange Commission of the USA
© MEDIUS ASSOCIATES 103

Glossary
SmPC Summary of Product Characteristics. SOP Standard Operating Procedure SME Small to Medium Enterprise SPC Supplementary Protection Certificate Strategic Alliance
Strategic alliances are co-operative agreements between companies to work together in specified ways to increase the chances of successfully developing and commercialising their products.
© MEDIUS ASSOCIATES 104

Authors
THE AUTHORS
SHARON FINCH Sharon Finch started Medius Associates, a pharmaceutical business development consultancy company in 1994. During her work with Medius Sharon has worked on a wide range of assignments including licensing deals and product acquisition projects for various clients. Sharon holds a BSc (Hons.) in Chemistry and Administrative Sciences and during her career commenced post graduation with The Wellcome Foundation where she studied for an MA in Business Law. Her industry experience spans a period of some sixteen years in international pharmaceutical business development working in a range of different business development roles in Wellcome Research, Wellcome Diagnostics and Group Marketing. Her next post in industry was with Medeva as an International Licensing Manager before joining the London office of Ono Pharmaceutical. During this time, Sharon acquired a comprehensive knowledge of business development and licensing in the pharmaceutical industry and she has extensive experience of identifying, creating, implementing and directing international business opportunities. She also has experience of negotiating and drafting a wide range of agreements with both global, national and biotech companies. Her speciality is in negotiation and strategic direction in business development. As a leading authority on Business Development, Sharon has spoken at numerous international licensing conferences and run workshops and training courses in negotiation and business development. She also co-authored the FT report on Successful Licensing and Business Development with Paul Ranson. Sharon is the current Chairman of the Pharmaceutical Licensing Group and European Pharma Licensing Group Council; and a committee member of the Licensing Executives Society Healthcare Group.
© MEDIUS ASSOCIATES 105

Authors
ELIZABETH MCNABB Elizabeth has a background encompassing business development, technology assessment, attorney management and licensing. She is a successful commercial licensing manager with experience in sourcing, assessing and selecting technologies and negotiating licence agreements. She has a proven track record in acquiring technologies and creating value for those technologies. Elizabeth has worked in a variety of industries and with a wide range of technologies. She is comfortable working at small business, corporate and government levels. She has broad international experience working at a high level with large international corporations, NGO’s and governments. The countries she has worked in include UK, EU, Mexico, USA, Middle East, Malaysia, Singapore, South Korea, Japan, and New Zealand. She has an in-depth knowledge of the process of technological development, from concept through protection to commercialisation. This includes an understanding of patents and other IPR, working with inventive sources and attorney management. Her specialist areas of interest include neutraceuticals, devices and environmental technologies. Elizabeth has more than thirteen years industry experience in business development, deal making and consultancy, six of which were spent with British Technology Group (BTG plc) as one of their licensing executives. During the period with British Technology Group, she was responsible for both the in licensing and out licensing of a varied technology portfolio. Previous roles have included :- Manager of Business Development and Marketing, for a leading international consultancy; with the primary function to bring value to the company via diversification into non-core areas and strategic alliances. Responsible for licence negotiation and contract management. Setting up a business intelligence unit to carry out due diligence on market sectors, competitors and potential clients. This information was used to give added value and a competitive edge to contracts quoted. Elizabeth holds a BSc from Otago University, New Zealand and a Strategic Business qualification from Henley School of Management. Elizabeth is also a Member of the Licensing Executive Society.
© MEDIUS ASSOCIATES 106

Company Profiles
COMPANY PROFILES
Medius
A s s o c i a t e s
MEDIUS ASSOCIATES LIMITED Medius Associates Limited is an independent business development consultancy company serving the pharmaceutical and healthcare sectors. The company provides a full range of business development services on a client specific basis with particular emphasis on the European and Japanese markets. The range of services includes :
• portfolio analysis • business development strategy • market intelligence and research • technology assessment • competitor analysis • partnering • identifying product and acquisition opportunities • contract negotiation • communications programmes • legal services
Medius was started ten years ago by Sharon Finch who has some 20 years experience in business development, in multinational, small pharma and Japanese companies. Medius employs a wide range of highly experienced associates to ensure that the best skills are deployed to each project. Medius also provides business development training and publication activities. For further information please see our website addresses below.
Medius Associates Ltd 47 Upfield, Croydon, CR0 5DR, U.K.
Tel: +44 (0) 20 8654 6040 Fax: +44 (0) 20 8654 6046
www.medius-associates.comwww.mediustraining.com
www.mediuspublication.com
© MEDIUS ASSOCIATES 107

Company Profiles
PHARMALICENSING
pharmalicensing
www.pharmalicensing.com Pharmalicensing is the leading global marketplace for life sciences business development and licensing:
Number one life sciences IP exchange Pharmalicensing was recently rated highest among online intellectual property (IP) exchange sites for the life science industry by an independent report commissioned
and published by Argus Insights, a major business publisher, in March 2001 Pharmalicensing provides a unique marketplace for the global life sciences business development and licensing community.
• Global reach - providing a truly global marketplace
• Unparalleled access - all the major pharma/biotech corporations use pharmalicensing
• No commission - we do not charge commission or introduction fees (unlike our competitors!)
• No membership fees - access to browse and search pharmalicensing is completely free and unhindered
• Direct contact - all the contact details for each opportunity are provided online (there is no need to contact us)
• Anonymity - profile without disclosing identity if you choose
• Confidential - any information you provide to pharmalicensing remains with pharmalicensing. We will not share any confidential details with any third party
• Delivering results – responses to a recent survey indicate that pharmalicensing has facilitated at least 200 deals
Streamlined Marketing Pharmalicensing facilitates and broadens your access to the leading pharmaceutical and biotechnology companies globally. Pharmalicensing regularly presents your latest partnering interests to senior decision -makers worldwide. Pharmalicensing re-enforces your existing marketing efforts to ensure that all prospective partners review your company.
© MEDIUS ASSOCIATES 108

Company Profiles
Effective Presentation to Decision Makers Information about your partnering opportunities is presented in an easy to read and consistent format. This enables prospective partners to make conclusive decisions fast. The ability for a prospective partner to contact you for further information is just a click away. We actively work with leading pharma and biotech companies to ensure we present your information in the optimal format to facilitate rapid decision-making. For licensors: We help innovators market their licensing opportunities to decision makers at Licensee organisations worldwide. Our goal is to facilitate your efforts in doing the best deal for your organisation, by maximising your global reach - letting you focus on structuring and negotiating the best deal with the best partner to develop and commercialise your innovations. For Licensees: We facilitate global pharmaceutical/biotechnology companies, investors, and research organisations in identifying, tracking and securing of technology opportunities, actively communicating licensing needs, and forming better partnerships. Licensing and business development professionals are able to identify and focus on high value tasks such as access the best technology, negotiate and implement the deal. This allows you to act fast on the best opportunities whilst reaching rapid no-go decisions on those innovations not matched to your requirements. For outsourced service providers: We market service providers, their skills and expertise to decision makers in pharmaceutical/biotechnology companies worldwide. The industry is becoming increasingly reliant on the expertise of third parties, in order to reduce the time to market and provide access to know-how worldwide To find out more about how pharmalicensing can facilitate your business development activities, and the profiling options available contact Business Development Team now for details: Telephone: +44 1904 477902 Email: [email protected] Web: www.pharmalicensing.com/info Address: Pharmalicensing Ltd KL House, 1st Floor Kettlestring Lane Clifton Moor York, YO30 4XF United Kingdom
© MEDIUS ASSOCIATES 109