Financial System Stability Review 2020
115
Financial System Stability Review 2020 Central Bank of Sri Lanka
Transcript of Financial System Stability Review 2020
Financial System Stability Review
2020
ISBN-978-955-575-411-8 Central Bank of Sri Lanka
Financial System Stability Review 2020
Central Bank of Sri LankaDecember 2020
PUBLISHER:
Central Bank of Sri Lanka 30, Janadhipathi MawathaColombo 1 Sri Lanka
The Financial System Stability Review – 2020 mainly focuses on nine months data ending September 2020. However, selected developments up to date of publication are also reported. Data may include calculations made specially for this publication based on information obtained from various sources.
Download a PDF version of the report from the Central Bank of Sri Lanka website: www.cbsl.gov.lk
For inquiries, comments and feedback please contact:Macroprudential Surveillance Department Central Bank of Sri Lanka30, Janadhipathi MawathaColombo 1 Email: [email protected]
ISBN-978-955-575-411-8
Abbreviations viGovernor’s Foreword ixExecutiveSummary xi
Chapters1. MacrofinancialConditions
1.1. Overview 11.2. International Economic Environment and Financial Condition 21.3 Domestic Macrofinancial Conditions 10
2. Financial Markets2.1. Overview 312.2. Financial Market Stability Index 322.3. Equity Market 332.4. Treasury Bond Market 362.5. Corporate Bond Market 382.6. Domestic Money Market 402.7. Treasury Bill Market 422.8. Domestic Foreign Exchange Market 43
3. FinancialInstitutions3.1. Overview 533.2. Banking Sector 543.3. Licensed Finance Companies and Specialised Leasing Companies Sector 633.4. Insurance Sector 70
4. Household Sector and Corporate Sector4.1. Overview 734.2. Household Sector Credit and Vulnerabilities 744.3. Credit to Institutional Sector 764.4. Non-Financial Corporate Sector Risk Assessment 77
5. Financial Infrastructure5.1. Overview 815.2. Payment and Settlement Systems 825.3. Strengthening Legal Framework to Maintain Stability 855.4. Resolution and Enforcement and Deposit Insurance Scheme 865.5. Anti-Money Laundering and Countering the Financing of Terrorism 875.6. Surveillance on Foreign Exchange Transactions 875.7. Financial Inclusion 88
ListofBoxArticles Box 01 – Key Policy Changes and Regulatory Actions Implemented for the Financial Sector in 2020 21 Box 02 – Financial Stress Index for Sri Lanka 47 Box 03 – Systemic Risk Survey – 2020 50 Box 04 – Strengthening the Macroprudential Framework of Sri Lanka 90
Appendices 92
CONTENTS
I
1 MacrofinancialConditionsChart 1.1 World Uncertainty and World Pandemic Uncertainty Indices 2Chart 1.2 Working Hour Losses as a Percentage Compared to 2019 Q4 3Chart 1.3 Global Purchasing Managers’ Index 3Chart 1.4 Global Economic Growth 4Chart 1.5 Policy Measures Taken Regarding the COVID-19 Pandemic as a Percentage of GDP 4Chart 1.6 Bloomberg Financial Conditions Index 5Chart 1.7 Global Inflation 5Chart 1.8 Gold Prices and USD JPY Exchange Rate Fluctuation 5Chart 1.9 Commodity Prices 5Chart 1.10 Annual Change of Credit to Non-Bank Borrowers 6Chart 1.11 10-year Government Bond Yields 7Chart 1.12 US Treasury Yield Curve 7Chart 1.13 US Dollar Denominated Bonds and Capital Flows of EMDEs 7Chart 1.14 US Corporate Bond Spread 8Chart 1.15 MSCI Share Price Indices 8Chart 1.16 Equity Market Performance during the COVID-19 Pandemic 8Chart 1.17 Performance as per Sectors in Global Equity Markets 8Chart 1.18 Behaviour of Volatility Indices 9Chart 1.19 US Dollar Index and Emerging Market Currency Index 9Chart 1.20 Business Conditions 11Chart 1.21 Number of COVID-19 Patients and Key Incidents related to COVID-19 Outbreak in Sri Lanka 11Chart 1.22 Credit to Deposits Ratio of the Banking Sector 12Chart 1.23 Growth in Credit to Government and Public Corporations and Investments on
Government Securities 12Chart 1.24 Growth in Private Sector Credit 13Chart 1.25 Credit to GDP 13Chart 1.26 Willingness to Lend and Demand for Loans 14Chart 1.27 Quarterly Sectoral Credit Growth of Licensed Banks 14Chart 1.28 Quarterly Sectoral GDP Growth 14Chart 1.29 NPLs of Selected Loan Categories of the Banking Sector 15Chart 1.30 Consumption Loans 15Chart 1.31 NPL Ratio of the Household Sector (with IIS) 15Chart 1.32 Market Interest Rates 16Chart 1.33 Real Interest Rate 16Chart 1.34 Land Valuation Indicator 16Chart 1.35 Advertised Property Prices - Houses and Commercial Buildings 17Chart 1.36 Advertised Property Prices – Apartments 17Chart 1.37 Movements of the All Share Price Index and the Number of Transactions 17Chart 1.38 Trade Balance, Worker Remittances and Earnings from Tourism 17Chart 1.39 Foreign Investments in CSE and Government Securities Market 18Chart 1.40 Reserve Adequacy 18Chart 1.41 Major Fiscal Balances 18Chart 1.42 Total Outstanding Domestic and Foreign Debt 19Chart 1.43 Short Term Debt as a Percentage of Official Reserves 19Chart 1.44 ISB Maturity Profile as at end October 2020 19Chart 1.45 Assumed Risk Premiums on 10 Year International Sovereign Bonds 20
List of Charts
II
Central Bank of Sri Lanka - Financial System Stability Review 2020
2 Financial MarketsChart 2.1 Net Foreign Flows in Equity and Government Securities Market 31Chart 2.2 Financial Market Stability Index (2010 =100) 32Chart 23 Financial Market Stability Map - Comparison of Partial Variables (2010 =100) 32Chart 2.4 Growth of Overall Stock Market Index of Regional Peers as at end October 2020 33Chart 2.5 Movements of Price Indices and Market Capitalization 33Chart 2.6 Volatility of Price Indices 33Chart 2.7 Market Price Earnings Ratio of Regional Countries at end 2019 34Chart 2.8 Market Price Earnings Ratio and Market Price to Book Value 34Chart 2.9 Contribution of Domestic and Foreign Investors to the Total Turnover 34Chart 2.10 Net Foreign Flows to CSE (Monthly) 34Chart 2.11 Net Foreign Flows to CSE (Annual) 35Chart 2.12 Foreign Holdings of Equity 35Chart 2.13 Comparison of Global Stock Markets According to Size as at end 2019 35Chart 2.14 Market Capitalization as a Percentage of GDP (Annual) 36Chart 2.15 Market Capitalization as a Percentage of GDP as at end 2019 36Chart 2.16 Outstanding Treasury Bonds 36Chart 2.17 Demand for Treasury Bonds at Primary Market 37Chart 2.18 Foreign Holdings of Treasury Bond 37Chart 2.19 Secondary Treasury Bond Market Transactions 37Chart 2.20 Secondary Market Yield Curve 37Chart 2.21 Secondary Treasury Bond Market Yield 38Chart 2.22 Policy Rates and Treasury Bond Yield 38Chart 2.23 Listed Debentures Based on Maturity 39Chart 2.24 Sector-wise Listed Debentures 39Chart 2.25 Distribution of Annualized Interest Rates of Fixed Interest Five Year Debentures 39Chart 2.26 Secondary Market Transactions of the Corporate Debt Market 39Chart 2.27 Foreign Holdings - Corporate Debt Market 40Chart 2.28 Market Capitalization - Corporate Debt Market 40Chart 2.29 Factors Contributed towards Liquidity on a Cumulative Basis (Jan - end Oct 2020) 40Chart 2.30 Money Market Liquidity and Its Volatility 41Chart 2.31 Behavior of Money Market Liquidity and AWCMR 41Chart 2.32 Spread Between AWCMR and AWRR 42Chart 2.33 Demand for Treasury Bills at the Primary Market 42Chart 2.34 Secondary Market Average Quotes on Treasury Bills 43Chart 2.35 Outstanding Treasury Bills 43Chart 2.36 Foreign Holdings of Treasury Bills 43Chart 2.37 USD: LKR Exchange Rate Movements 44Chart 2.38 Technical Analysis of Exchange Rate Movements (Bollinger Bands) 44Chart 2.39 Exchange Rate Movements 44Chart 2.40 Volumes of Cash, Spot, Tom and Forward Transactions 45Chart 2.41 Intervention in the Domestic Foreign Exchange Market 45Chart 2.42 Weekly Forward Premium (per cent per annum) 46 3 FinancialInstitutionsChart 3.1 Banking Sector Loans & Advances 54Chart 3.2 Loan Growth by Bank Groups 54Chart 3.3 Sector Concentration 55Chart 3.4 Sector-wise NPLs 55Chart 3.5 NPL Ratio of the Banking Sector 56Chart 3.6 NPL Ratio of Bank Groups 56Chart 3.7 Rupee and FC Loans Growth 56Chart 3.8 Rupee and FC NPLs Growth 56Chart 3.9 Shift in Inter-Quartile Distribution of NPLs Ratios 57
III
Chart 3.10 Composition of NPLs 57Chart 3.11 Rescheduled Loans 57Chart 3.12 Provision Coverage 58Chart 3.13 Relative Share of Statutory Liquid Assets 58Chart 3.14 Growth in Deposits 59Chart 3.15 Credit to Deposit Ratio 59Chart 3.16 Relative Share of Deposits, Borrowings and Capital Funds 59Chart 3.17 Growth in Borrowings 59Chart 3.18 Liquidity Coverage Ratio – LKR 60Chart 3.19 Liquidity Coverage Ratio – All Currency 60Chart 3.20 Maturity Gap in the Assets and Liabilities of the Banking Sector 60Chart 3.21 Net Stable Funding Ratio 60Chart 3.22 Interest Sensitive Assets and Liabilities 61Chart 3.23 Decomposition of Change in Profits during the Nine Months that Ended in September 2020 61Chart 3.24 Net Interest Income Growth and Net Interest Margin 61Chart 3.25 Nine Months Growth Rates of Loans and Investments 62Chart 3.26 Cost and Efficiency Ratios 62Chart 3.27 Loan Loss Provision Charge 62Chart 3.28 Return on Assets and Return on Equity 62Chart 3.29 Capital Adequacy Ratio 63Chart 3.30 CAR of D-SIBs and Non-D-SIBs 63Chart 3.31 NPLs to Capital Funds 63Chart 3.32 Growth in RWA 64Chart 3.33 Leverage Ratio 64Chart 3.34 Loans and Advances of LFCs and SLCs Sector 64Chart 3.35 NPLs of LFCs and SLCs Sector 64Chart 3.36 Provision Coverage Ratio of LFCs and SLCs Sector 65Chart 3.37 Product-wise Loans and Advances by End September 65Chart 3.38 Product-wise NPLs by End September 66Chart 3.39 Liquidity of LFCs and SLCs Sector 66Chart 3.40 Deposits and Borrowings of the LFCs Sector 67Chart 3.41 Credit to Deposit & Debenture Ratio of LFCs 67Chart 3.42 Interest Sensitive Net Assets of the LFCs Sector 68Chart 3.43 Net Interest Income and Net Interest Margin 68Chart 3.44 Profitability of the LFCs and SLCs Sector 68Chart 3.45 Cost to Income and Efficiency Ratios of LFCs 68Chart 3.46 Total Capital Ratio of Individual LFCs* as at End September 2020 69Chart 3.47 Capital Adequacy of LFCs and SLCs Sector 69Chart 3.48 Net NPLs to Capital Funds 69Chart 3.49 Credit Rating of LFCs 70Chart 3.50 Gross Written Premium of the Insurance Sector 70Chart 3.51 ROA of Insurance Sector 71Chart 3.52 ROE of Insurance Sector 71Chart 3.53 Capital Adequacy of Insurance Sector 71Chart 3.54 Liquidity Ratios of Insurance Sector 71Chart 3.55 Distribution of Total Assets of Insurance Companies 72
4 Household Sector and Corporate SectorChart 4.1 Private Credit to GDP 73Chart 4.2 Credit to Government & Public Corporations to GDP 73Chart 4.3 Sources of Household Sector Credit at end 2020 Q2 74Chart 4.4 Level of Debt 74
IV
Central Bank of Sri Lanka - Financial System Stability Review 2020
Chart 4.5 Structural Change in Credit Quality of Household Debt 74Chart 4.6 NPL Ratio (with IIS) – Household Sector 75Chart 4.7 Composition of NPL of Household Sector as at June 2020 - By Institutions 75Chart 4.8 Composition of NPLs as at June 2020 – By Number of Days in Arrears 75Chart 4.9 Household Sector NPL Ratio by Province 75Chart 4.10 Sources of Institutional Sector Debt 76Chart 4.11 Structural Change in Credit Quality 76Chart 4.12 NPL Ratios (with IIS) – Institutional Sector 76Chart 4.13 Composition of Institutional NPLs as at June 2020 77Chart 4.14 Business Sentiment Index 77Chart 4.15 Growth of Corporate Revenue 78Chart 4.16 BSI – Sales Sub-Index 78Chart 4.17 Growth of Corporate Profit 78Chart 4.18 Profit Margins 78Chart 4.19 Effective Finance Cost as a Share of Sales 79Chart 4.20 Return on Assets of Corporates 79Chart 4.21 Return on Equity of Corporates 79Chart 4.22 Debt to Equity and Solvency Ratios of Corporates 79Chart 4.23 Interest Coverage Ratio 80
5 Financial System InfrastructureChart 5.1 Retail Payments in Value Terms 82Chart 5.2 Value and Volume of Cheque Returns as a Percentage of Total 82Chart 5.3 Return Code-wise Cheque Returns 82Chart 5.4 Total Volume and Value of Transactions Carried Out through Credit Cards 83Chart 5.5 ATM Cash Withdrawals and Payments Effected through Debit Cards and Credit Cards in Volume Terms 83Chart 5.6 ATM Cash Withdrawals and Payments Effected through Debit Cards and Credit Cards in Value Terms 83Chart 5.7 Average Value and Volume of RTGS Transactions Per Day 84Chart 5.8 Payment of Compensation for the Depositors of Failed LFCs as at 30 September 2020 86Chart 5.9 Changes in Banking Density of Sri Lanka 89Chart 5.10 Banking Density (LCBs and LSBs only) by Province 89
V
ADs Authorised Dealers
AML/CFT Anti-Money Laundering/Countering Financing of Terrorism
ASPI All Share Price Index
AWCMR Average Weighted Call Money Rate
AWRR Average Weighted Repo Rate
BCP Business Continuity Plan
BFCAs Business Foreign Currency Accounts
BIS Bank for International Settlements
BSI Business Sentiment Index
CAR Capital Adequacy Ratio
CAS Common ATM Switch
CDD Credit to Deposit and Debenture
CEFTS Common Electronic Fund Transfer Switch
CERT Computer Emergency Response Team
CSE Colombo Stock Exchange
D-SILFCs Domestic-Systemically Important Licensed Finance Companies
EBIT Earnings Before Interest and Tax
ECB European Central Bank
EMDEs Emerging Market and Developing Economies
EMEs Emerging Market Economies
EMV Europay Master Visa
FATF Financial Action Task Force
FCY Foreign Currency
FEA Foreign Exchange Act
FIs Financial Institutions
FIU Financial Intelligence Unit
FMSI Financial Market Stability Indicator
GDP Gross Domestic Product
GOSL Government of Sri Lanka
GWP Gross Written Premium
IFC International Finance Corporation
IIAs Inward Investment Accounts
IIS Interest in Suspense
ILF Intra-Day Liquidity Facility
ILO International Labor Organization
IMF International Monetary Fund
IPOs Initial Public Offerings
LBs Licensed Banks
LCBs Licensed Commercial Banks
LCPL Lanka Clear Pvt. Ltd
LCR Liquidity Coverage Ratio
LEA Law Enforcement Agencies’
LFCs Licensed Finance Companies
LFPR Labor Force Participation Rate
LPOPP LankaPay Online Payment Platform
LSB Licensed Specialized Bank
ISBs International Sovereign Bonds
LSF Liquidity Support Facility
LTV Loan to Value
MI Member Institutions
MLA Monetary Law Act
ML Money Laundering
MSMEs Micro, Small and Medium Enterprises
NBFIs Non-Bank Financial Institutions
NFIS National Financial Inclusion Strategy
NII Net Interest Income
NIM Net Interest Margin
NPC National Payment Councils
Abbreviations
VI
Central Bank of Sri Lanka - Financial System Stability Review 2020
NPLs Non-performing Loans
NSFR Net Stable Funding Ratio
OMO Open Market Operations
OPEC Organization of the Petroleum Exporting Countries
PBV Price to Book Value
PCIDSS Payment Card Industry Data Security Standard
PDCs Primary Dealer Companies
PER Price Earnings Ratio
PFCAs Personal Foreign Currency Accounts
PIs Participating Institutions
PMI Purchasing Managers’ Index
QR Quick Response
REITs Real Estate Investment Trusts
ROA Return on Assets
ROE Return on Equity
RTGS Real Time Gross Settlement
RWA Risk Weighted Assets
SDAs Special Deposit Accounts
SDFR Standing Deposit Facility Rate
SLCs Specialised Leasing Companies
SLDB Sri Lanka Development Bond
SLDILSS Sri Lanka Deposit Insurance and Liquidity Supports Scheme
SLFR Standing Lending Facility Rate
SLIPS Sri Lanka Inter Bank Payment System
SOEs State Owned Enterprises
SPDs Standalone Primary Dealers
SRR Statutory Reserve Ratio
USA United States of America
USD US Dollars
WEO World Economic Outlook
VII

VIII
Central Bank of Sri Lanka - Financial System Stability Review 2020
Governor’s Foreword
The Financial System Stability Review (FSSR) is an assessment of the financial system stability of Sri Lanka, carried out by the Central Bank, encompassing developments in the financial system and a comprehensive analysis of factors that may affect the stability and resilience of the financial system. The present issue of the FSSR highlights contemporary issues pertaining to risks in the financial system and the policy measures taken by the government and the Central Bank to contain such risks during the nine months ending September 2020.
Identifying and gauging risks and vulnerabilities in the financial system and taking remedial action to mitigate them in order to maintain the financial system stability were challenging during the period under review because of the uncertainties and adverse impacts of the COVID-19 pandemic on the financial sector and the economy. The global economy encountered one of its deepest recessions due to COVID- 19 pandemic. These negative developments in the global economy have transmitted to the domestic economy, bringing in unprecedented socio-economic problems. Despite spillovers of these unfavorable conditions, the financial system stability of Sri Lanka was maintained during this period, through timely and proactive policy measures. Accommodative monetary policy measures brought out a reduction in policy rates and the statutory reserve ratio. The consequent availability of liquidity in abundance and reduced market interest rates have the potential to stimulate economic activities. The introduction of concessionary credit schemes by the Central Bank encouraged banks to grant credit to COVID-19 affected businesses and individuals. Further, regulatory forbearances on capital and liquidity are further measures that were taken to reduce the stress on the financial system. Macroprudential measures such as holding capital conservation buffers by regulated financial institutions which were released in response to the crisis, helped those institutions to steer through the turbulent period. Further, micro-prudential regulation and supervision carried out by the Central Bank and other financial sector regulators ensured that adequate risk management techniques were employed by regulated financial institutions. Nevertheless, financial institutions continued to face concerns regarding depleting credit quality due
to income losses lowering the repayment capacity of borrowers. In addition, some Licensed Finance Companies (LFCs) which were under-capitalized even prior to the crisis, faced challenges in continuing their business operations. As such, a Master Plan is being implemented by the Central Bank to improve capital levels and establish a strong and resilient LFCs sector in the medium term. Meanwhile, the performance of financial markets weakened with high volatility during the COVID-affectedQ2 2020, followed by a recovery phase due to improved investor sentiments, political stability and favourable policy stimuli. In the meantime, financial infrastructure proved adequate for the smooth functioning of the payment and settlement systems, with considerable improvements in the legal infrastructure. Given the rising eagerness for digital payments due to effects of the COVID-19 pandemic, payment and settlement systems, supported by timely issuance of regulatory guidelines, demonstrated their resilience in the face of heightened cyber security threats.
Going forward, the Central Bank will continue to monitor and be vigilant on risks and vulnerabilities affecting individual participants of the financial system as well as the emergence of systemic risks, to safeguard the financial system stability, which is one of the Central Bank’s main objectives. In conclusion, I believe that this FSSR will provide comprehensive reference material to all stakeholders of the financial sector. Its detailed analysis of risks and vulnerabilities faced by the financial system and the summary it provides about risk mitigation measures implemented by relevant authorities are bound to be extremely useful for them as well as many others examining conditions of the economy.
Deshamanya Prof. W D LakshmanGovernor
Central Bank of Sri Lanka - Financial System Stability Review 2020

X
Central Bank of Sri Lanka - Financial System Stability Review 2020
Executive Summary
The outbreak of COVID-19 and its implications on economies extend far beyond the health-related concerns, testing the resilience of global financial sectors. The Sri Lankan financial sector is no exception as it was also confronted with an array of unprecedented challenges. Nevertheless, country managed to preserve the stability of the financial system during the nine months ending in September 2020 through multifaceted measures amidst strong macroeconomic headwinds. In built strengths and capacities of the financial system and prompt actions taken by the Government and the Central bank eased the pressure triggered by the pandemic to a greater extent. The efficacy of the pandemic containment measures especially during Q2 2020, continued accommodative monetary policy measures to exert downward adjustments to market interest rates, facilitating adequate liquidity and credit in domestic markets, introduction of concessional credit schemes and offering debt moratoria to businesses and individuals affected by the pandemic and regulatory forbearances to the financial sector, positively contributed towards the resilience of the financial system and restoring market confidence in Q3 2020. However, the resurgence of the COVID-19 pandemic in October 2020 could exert further stress on the financial sector, if not managed effectively.
Immediately after the Presidential elections, a fiscal stimulus package was unveiled in late 2019 targeting the corporate sector of Sri Lanka with a view to enhancing production and economic growth. However, due to the negative effects stemming from the COVID- 19 pandemic, the economy contracted by 1.6 per cent during the first quarter of 2020 and 16.3 per cent in second quarter 2020, negating the impact of the fiscal stimulus. Further, the global economic downturn transmitted to the domestic economy through declining tourism earnings and export earnings while recording foreign cash outflows from financial markets. Pandemic containment measures, including mobility restrictions, relentlessly affected the performance of the corporate sector and household incomes. As such, the economy could
not reap the benefits of the massive tax reliefs and positive policy stimuli provided towards the end of 2019. However, as a result of re-opening the country and positive policy stimuli a GDP growth of 1.5 per cent was recorded in third quarter of 2020.Financial intermediation which is measured by the credit to deposit ratio decreased during the period under review which was a result of increasing deposits. A modest increase in credit to the private sector was observed, while credit to the state sector expanded rapidly amidst increased reliance of the government on domestic financing amidst limited access to foreign sources and increased borrowing requirements of the government. Meanwhile, the sovereign rating of Sri Lanka was downgraded by three rating agencies, heightening the challenges to service the country’s external debt. Challenges to external debt sustainability are looming with the declining external demand for exports and mobility restrictions affecting tourism and other inflows, weighing heavily on foreign currency inflows amidst limited reserve assets to defend plausible risks. However, the fiscal policy strategy of the Budget for 2021 is expected to strengthen the medium term fiscal consolidation path through tax policy reforms, while further rationalization of recurrent expenditure and prioritizing public investment to stimulate the economy as enunciated in the national policy framework, “Vistas of Prosperity and Splendour”.
COVID-19 pandemic brought in unprecedented volatility into national financial market. Despite short lived unprecedented volatilities observed across all financial market segments as the pandemic befell, financial markets remained resilient during the ten months ending in October 2020. The prices of risky assets plummeted while investors sought refuge in safe haven assets, in global financial markets. The Sri Lankan financial markets were no exception and witnessed investors opting for more liquid and less risky assets. Despite proactive policy measures taken by the regulators that have been effective up to now, in stabilizing markets, the local financial markets remain volatile to COVID-19 pandemic related developments.
XI
The Colombo Stock Exchange came under severe stress at the onset of the pandemic, exhibiting excessive volatility which triggered indexed-based circuit breakers halting trade in market. Nevertheless, the bourse has been recovering since mid-May 2020 as domestic investors’ preference shifted towards equity investments in a low interest rate regime amidst foreign outflows, becoming one of the fastest recovered markets from the pandemic in the region. The government securities market expanded rapidly during the ten months ending October 2020 amidst foreign outflows, as the former benefited from excess rupee liquidity in the banking sector resulting from moderated private sector credit demand and enhanced investor preferences towards safer assets during the challenging business conditions. The government securities market remained active to finance the fiscal operations intensified by the pandemic. Yields on government securities were impacted by the monetary policy easing, strategic issuance arrangements of government securities, the announcement of maximum yield rates prior to auction and primary market purchase of government securities by the Central Bank. Consequently, historically low yield rates were observed across all maturities during the period, shifting the secondary market yield curve downwards. Primary market activities of the corporate bond market were adversely affected by the pandemic but rebounded towards Q3 2020, with measures being taken to contain the spread of the disease.
The money market was resilient reporting excess liquidity during ten months’ period ending October 2020. Unprecedented monetary policy easing, refinance facilities disbursed under special loan schemes for those affected by the pandemic, provision of long-term liquidity assistance to commercial banks and extending the Liquidity Support Facility for standalone primary dealers positively contributed towards easing the pressure in the money market. In response, money market interest rates significantly declined during the period.
The domestic foreign exchange market came under severe stress at the outset of the pandemic as substantial outflows were witnessed from financial markets, similar to other emerging market economies. The pressure had been gradually easing since May 2020, owing to the policy measures introduced, such as the imposition of temporary restrictions on non-essential imports
and selected outward remittances, modest foreign exchange interventions by the Central Bank and favorable developments in workers’ remittances. Consequently, the Sri Lankan rupee recorded only a slight depreciation of 1.4 per cent against the US dollar during the ten-month period ending in October 2020.
The banking sector was well poised in terms of capital and liquidity at the onset of the pandemic. As the pandemic unfolded, the banking sector exhibited a deterioration in credit quality during the nine months ending September 2020, despite the moratorium being in effect. The credit growth in 2020 was largely driven by credit to the government and State-Owned Enterprises (SOEs). The banking sector exhibited a higher resilience against liquidity risk reflecting the unprecedented easing of monetary policy, regulatory forbearances and low demand for loans. Rupee deposits recorded a notable growth during the nine months ending September 2020 and continued to be the major source of funding for the banking sector. The cumulative maturity gap as a percentage of the cumulative liabilities of the banking sector for maturity buckets up to six months marginally widened. The banking sector profits were impacted due to downward adjustment in NIM and increase in loan loss provisioning. Nevertheless, an increase in non-interest income and decrease in non- interest expenses and taxes positively contributed towards profits. All banks had complied with the minimum Capital Adequacy Requirement (CAR) while the banking sector CAR remained well above the regulatory minimum. Despite the marginal decline in the leverage ratio, it remained well above the requirement.
2020 turned out to be a challenging year for the Licensed Finance Companies (LFCs) and Specialised Leasing Companies (SLCs) sector. The sector, which was vulnerable even before 2019, became more vulnerable as a result of the COVID-19 pandemic. The central bank assisted LFC and SLC sector in managing and reducing these volatilities with their extraordinary policy measures. The loan book of the LFC and SLC sector contracted during the nine months ending September 2020 and depicted an increase in non- performing loans despite the debt moratorium offered. The introduction of import restrictions to curtail non-essential imports, especially motor vehicles, affected the LFC and SLC sector significantly. Profits of the LFCs and SLCs sector declined mainly due to high loan loss provisioning and drop in NIM. Despite
XII
Central Bank of Sri Lanka - Financial System Stability Review 2020
several companies failing to maintain adequate capital levels, the LFC and SLC sector collectively maintained capital and liquidity buffers well above the regulatory minimum levels. The Central Bank announced a Master Plan of consolidation aimed at strengthening the LFC and SLC sector, by facilitating the merger of distressed finance companies with stronger entities in the medium term, coupled with a prompt corrective action framework to ensure all LFCs and SLCs comply with all the prudential requirements. Meanwhile, the insurance sector exhibited mixed performances with satisfactory capital and liquidity levels during the period under consideration. The insurance sector weathered socio-economic challenges encountered in 2020, safeguarding policyholders with claim payments while affording relief on payment of insurance premiums.
The corporate and household sector leverage was heavily impacted by the pandemic- induced economic contraction which outweighed the slow growth in credit to the private sector. The moderation of credit is evident in the household sector. The institutional sector which encompasses the corporate sector, government and State- Owned Enterprises (SOEs) reported a credit growth largely due to the increase in credit to government and SOEs. Nevertheless, the delinquency levels of household and institutional sectors have been rising, resulting in increased non-performing loan ratios in these sectors. Monetary policy easing since early 2019 and tax stimulus unveiled in late 2019 had a favorable impact on corporate sector performance prior to the pandemic. However, as the effect of the pandemic heightened, the non-financial corporate sector reported a dismal performance in the first half of 2020. Subdued developments in the corporate sector may eventually be transmitted to the financial sector eroding its performance while hindering internal capital generation. However, it is apparent that the debt moratorium, concessionary interest rates and accommodative monetary policy measures would provide a considerable comfort to corporates. Effective pandemic management enabling the economy to return to its growth path is a critical factor to boost investor confidence and to revive the household and corporate sector performance in 2021, while mitigating risks to the financial sector.
The COVID-19 pandemic heightened the need for an efficient and reliable financial system infrastructure in the economy with a phenomenal increase
in digital transactions in the digital landscape. The domestic financial system infrastructure demonstrated its resilience as it functioned seamlessly during the nine months ending September 2020. The year 2020 was declared as “The Year of Digital Transactions” with the view of promoting the usage of secured and efficient digital payment mechanisms. Regulatory and supervisory frameworks were strengthened with appropriate reforms to streamline the financial sector and to maintain an efficient and stable financial system.
Financial inclusion and literacy have a considerable scope and a role in reshaping the future of the financial sector of Sri Lanka, fetching new growth prospects to households and Micro-small, Medium Enterprises (MSMEs). Further, enhanced financial inclusion and literacy positively contribute towards the financial sector by addressing issues such as over -indebtedness while inculcating healthy financial habits among households and MSMEs. Nevertheless, financial inclusion would bring new risks to the formal financial sector prompting policy setters to take pre-emptive measures to mitigate the plausible impact on financial system stability.
The pandemic has brought unprecedented challenges to the global economies and financial systems. The long-term resilience of the global financial system hinges upon the availability of vaccine for COVID-19 and the recovery of global economies. Sri Lanka needs to re-emerge from the prevalent economic contraction and return to a sustainable high growth path. Economic revival and containment of the spread of the virus are required for a lasting financial system stability. Stability of the financial system also contributes towards improving macroeconomic fundamentals through monetary transmission and financial intermediation which is a prerequisite for growth. Large-scale policy support provided by the Central Bank and the government is expected to facilitate fast recovery of economic activities in the near term, while growth-oriented policies of the government are expected to sustain the recovery over the medium term. Tailing off policy stimuli granted in response to the COVID-19 pandemic needs to be made prudently to minimize adverse implications while emphasizing the importance of policy consistency and coherence.
XIII

Chapter 1
MacrofinancialConditions
Macroeconomic headwinds stemming from the COVID-19 pandemic affected the global and domestic economy which spilled over to the financial sector of Sri Lanka, during the nine months ending September 2020. The COVID-19 pandemic has created a health crisis which has exerted a significant amount of stress on the global economy and the financial sector, which has a greater output loss than the global financial crisis. Further, the inherent uncertainty, which is unique to this crisis, continues to create further economic turmoil in both advanced economies, and Emerging Markets and Developing Economies (EMDEs). Drop in demand due to mobility restrictions and decline in production due to interruptions in the global supply chains resulted in falling commodity prices during this period. Further, investors shifting to less risky assets due to uncertainties created by the pandemic was observed in increasing investments in safe haven assets such as gold. Meanwhile, central banks and governments implemented unprecedented monetary and fiscal policies to revive the economies from the impact of the COVID-19 pandemic. These policies were aimed at stimulating the economies, boosting liquidity and regaining of business confidence in global financial markets, preventing the creation of macro financial feedback loops. However, as many frontier and developing economies, Sri Lanka, too experienced a dry down of liquidity in its international capital markets facing challenges to access funding as investors become increasingly risk averse.
Domestic macro-economic developments also exerted pressure on the financial system. Financial intermediation of Sri Lanka reflected through the credit to deposit ratio decreased during the period under review as a result of increasing deposits. Nevertheless, an increase of credit was also reported during this period due to enhanced liquidity, concessionary loan schemes, low interest rates and an increasing demand for credit by
the government. The credit demand from the government sector increased significantly for funding the fiscal deficit and to meet the additional expenses related to combating the COVID-19 pandemic. Depleting credit quality despite the debt moratorium, as a result of decreasing repayment capacity of corporates and individuals stemming from the economic downturn is a major risk faced by the financial sector.
In this background, unprecedented monetary and fiscal policy measures were taken by the Central Bank and the government, despite limited fiscal space available. Such policies resulted in considerably lowering market interest rates heading towards a negative real interest rate scenario for deposits. As such, a shift in investments towards ventures other than deposits was anticipated, creating an undue price increase in such ventures. Nevertheless, so far, such an increase in prices has not become evident in the real estate market. However, an improved enthusiasm in domestic investors was observed in the stock market. Yet, the stock market performance also was dismal, with continuous foreign outflows during the period and the disruptions to income flows of households and corporates.
Sri Lanka may encounter external sector vulnerabilities as decreasing export and tourism earnings with foreign cash outflows weigh heavily on foreign cash inflows amidst limited reserve assets to cushion plausible risks. Meanwhile, the requirement of financing the growing fiscal deficit, which was resultant from moderating government revenue and expanding expenses incurred on combating the COVID-19 pandemic has been challenging. Nevertheless, it is anticipated that the fiscal consolidation and tax reforms included in the Budget 2021 will improve the fiscal position of Sri Lanka.
1.1 Overview
1
World Uncertainty and World Pandemic Uncertainty Indices
Chart 1.1
Despite all challenges, the financial sector has so far been resilient owing to positive policy stimuli and the availability of buffers created through timely and advanced regulatory and macroprudential measures. However, going forward, revival of the global and domestic economy and sustaining macroeconomic performance are essential to maintaining financial system stability in Sri Lanka.
1.2InternationalEconomicEnvironment and Financial Condition
The global economy stepped in to the year 2020 with a mixed performance, anticipating improved growth, but was stunned by the COVID-19 pandemic from the beginning of the year. Towards the end of 2019, geopolitical and trade tensions amongst USA and its trade partners intensified, emerging markets such as India was under stress situations with concerns on the stability of its non-bank financial sector and natural catastrophes faced by USA, Europe, Australia, Eastern and Southern Africa. However, the accommodative monetary policy and fiscal easing carried out by countries like USA, China and South Korea gave a positive outlook for growth prospects for 2020. Considering a consolidated effect from all such factors in January 2020, the International Monetary Fund (IMF) projected that the global economy will grow by 3.3 per cent in 2020.
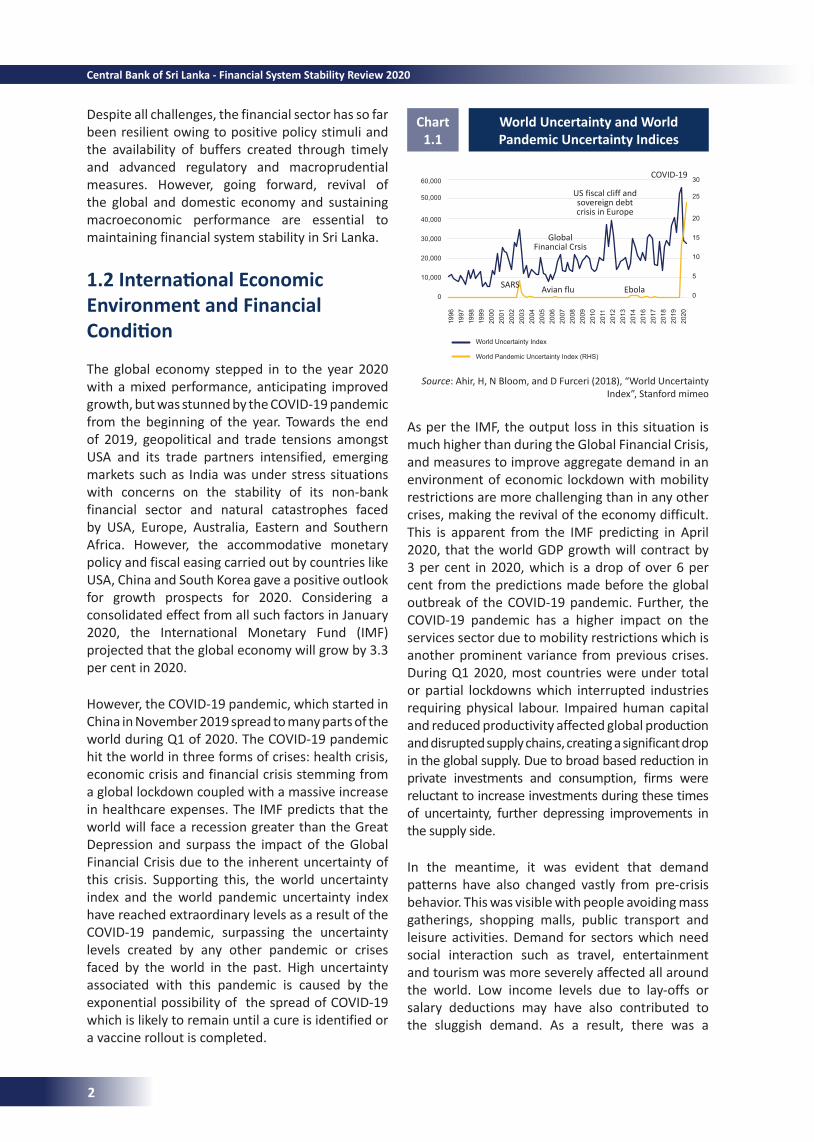
However, the COVID-19 pandemic, which started in China in November 2019 spread to many parts of the world during Q1 of 2020. The COVID-19 pandemic hit the world in three forms of crises: health crisis, economic crisis and financial crisis stemming from a global lockdown coupled with a massive increase in healthcare expenses. The IMF predicts that the world will face a recession greater than the Great Depression and surpass the impact of the Global Financial Crisis due to the inherent uncertainty of this crisis. Supporting this, the world uncertainty index and the world pandemic uncertainty index have reached extraordinary levels as a result of the COVID-19 pandemic, surpassing the uncertainty levels created by any other pandemic or crises faced by the world in the past. High uncertainty associated with this pandemic is caused by the exponential possibility of the spread of COVID-19 which is likely to remain until a cure is identified or a vaccine rollout is completed.
As per the IMF, the output loss in this situation is much higher than during the Global Financial Crisis, and measures to improve aggregate demand in an environment of economic lockdown with mobility restrictions are more challenging than in any other crises, making the revival of the economy difficult. This is apparent from the IMF predicting in April 2020, that the world GDP growth will contract by 3 per cent in 2020, which is a drop of over 6 per cent from the predictions made before the global outbreak of the COVID-19 pandemic. Further, the COVID-19 pandemic has a higher impact on the services sector due to mobility restrictions which is another prominent variance from previous crises. During Q1 2020, most countries were under total or partial lockdowns which interrupted industries requiring physical labour. Impaired human capital and reduced productivity affected global production and disrupted supply chains, creating a significant drop in the global supply. Due to broad based reduction in private investments and consumption, firms were reluctant to increase investments during these times of uncertainty, further depressing improvements in the supply side.
In the meantime, it was evident that demand patterns have also changed vastly from pre-crisis behavior. This was visible with people avoiding mass gatherings, shopping malls, public transport and leisure activities. Demand for sectors which need social interaction such as travel, entertainment and tourism was more severely affected all around the world. Low income levels due to lay-offs or salary deductions may have also contributed to the sluggish demand. As a result, there was a
Source: Ahir, H, N Bloom, and D Furceri (2018), “World Uncertainty Index”, Stanford mimeo
11.00
9.26 2.503.40 1.60
5.87
5.96
US fiscal cliff and sovereign debt crisis in Europe
COVID-19
Global Financial Crsis
EbolaAvian fluSARS
60,000
50,000
40,000
30,000
20,000
10,000
0
30
25
20
15
10
5
0
1996
1997
1998
1999
2000
2001
2002
2003
2004
2005
2006
2007
2008
2009
2010
2011
2012
2013
2014
2016
2017
2018
2019
2020
World Uncertainty Index
World Pandemic Uncertainty Index (RHS)
2
Central Bank of Sri Lanka - Financial System Stability Review 2020
Working Hour Losses as a Percentage Compared to 2019 Q4
Chart 1.2
noticeable reluctance in consumers to spend on luxury and non-essential products and services. The lack of confidence in future earnings have also led consumers to follow more cautious spending habits.
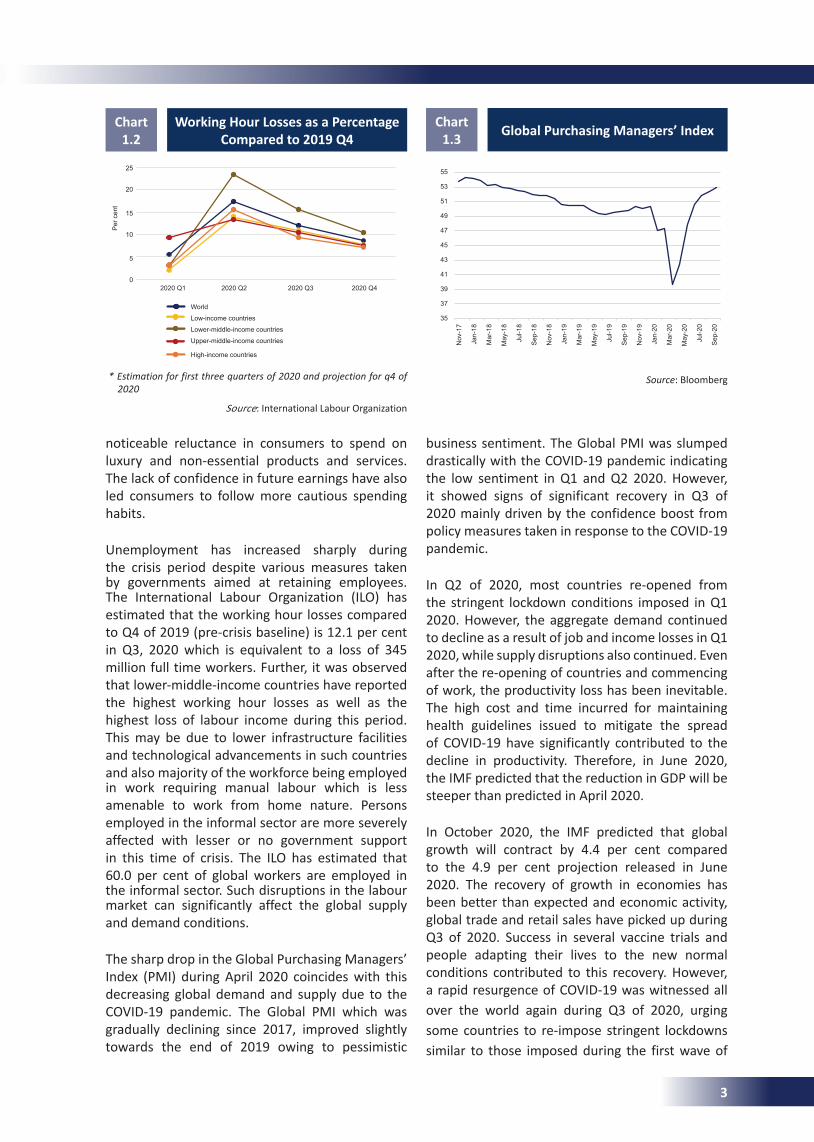
Unemployment has increased sharply during the crisis period despite various measures taken by governments aimed at retaining employees. The International Labour Organization (ILO) has estimated that the working hour losses compared to Q4 of 2019 (pre-crisis baseline) is 12.1 per cent in Q3, 2020 which is equivalent to a loss of 345 million full time workers. Further, it was observed that lower-middle-income countries have reported the highest working hour losses as well as the highest loss of labour income during this period. This may be due to lower infrastructure facilities and technological advancements in such countries and also majority of the workforce being employed in work requiring manual labour which is less amenable to work from home nature. Persons employed in the informal sector are more severely affected with lesser or no government support in this time of crisis. The ILO has estimated that 60.0 per cent of global workers are employed in the informal sector. Such disruptions in the labour market can significantly affect the global supply and demand conditions.
The sharp drop in the Global Purchasing Managers’ Index (PMI) during April 2020 coincides with this decreasing global demand and supply due to the COVID-19 pandemic. The Global PMI which was gradually declining since 2017, improved slightly towards the end of 2019 owing to pessimistic
Global Purchasing Managers’ IndexChart 1.3
business sentiment. The Global PMI was slumped drastically with the COVID-19 pandemic indicating the low sentiment in Q1 and Q2 2020. However, it showed signs of significant recovery in Q3 of 2020 mainly driven by the confidence boost from policy measures taken in response to the COVID-19 pandemic.
In Q2 of 2020, most countries re-opened from the stringent lockdown conditions imposed in Q1 2020. However, the aggregate demand continued to decline as a result of job and income losses in Q1 2020, while supply disruptions also continued. Even after the re-opening of countries and commencing of work, the productivity loss has been inevitable. The high cost and time incurred for maintaining health guidelines issued to mitigate the spread of COVID-19 have significantly contributed to the decline in productivity. Therefore, in June 2020, the IMF predicted that the reduction in GDP will be steeper than predicted in April 2020.
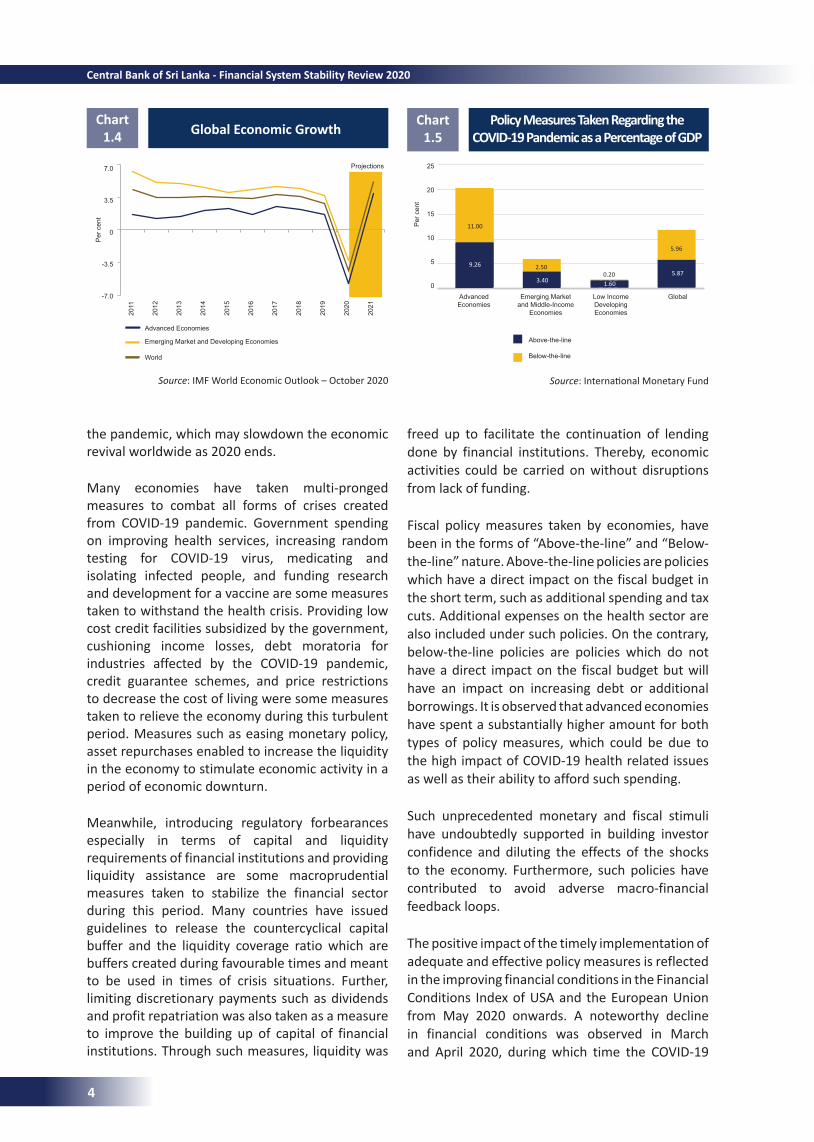
In October 2020, the IMF predicted that global growth will contract by 4.4 per cent compared to the 4.9 per cent projection released in June 2020. The recovery of growth in economies has been better than expected and economic activity, global trade and retail sales have picked up during Q3 of 2020. Success in several vaccine trials and people adapting their lives to the new normal conditions contributed to this recovery. However, a rapid resurgence of COVID-19 was witnessed all over the world again during Q3 of 2020, urging some countries to re-impose stringent lockdowns similar to those imposed during the first wave of
Source: Bloomberg
Source: International Labour Organization
* Estimation for first three quarters of 2020 and projection for q4 of 2020
11.00
9.26 2.503.40 1.60
5.87
5.96
11.00
9.26 2.503.40 1.60
5.87
5.96
World
Low-income countries
Lower-middle-income countries
Upper-middle-income countries
High-income countries
Per
cen
t
25
20
15
10
5
02020 Q1 2020 Q2 2020 Q3 2020 Q4
55
53
51
49
47
45
43
41
39
37
35
Nov
-17
Jan-
18
Mar
-18
May
-18
Jul-1
8
Sep
-18
Nov
-18
Jan-
19
Mar
-19
May
-19
Jul-1
9
Sep
-19
Nov
-19
Jan-
20
Mar
-20
May
-20
Jul-2
0
Sep
-20
3
Policy Measures Taken Regarding the COVID-19 Pandemic as a Percentage of GDP
Chart 1.5Global Economic Growth
Chart 1.4
Source: IMF World Economic Outlook – October 2020 Source: International Monetary Fund
the pandemic, which may slowdown the economic revival worldwide as 2020 ends.
Many economies have taken multi-pronged measures to combat all forms of crises created from COVID-19 pandemic. Government spending on improving health services, increasing random testing for COVID-19 virus, medicating and isolating infected people, and funding research and development for a vaccine are some measures taken to withstand the health crisis. Providing low cost credit facilities subsidized by the government, cushioning income losses, debt moratoria for industries affected by the COVID-19 pandemic, credit guarantee schemes, and price restrictions to decrease the cost of living were some measures taken to relieve the economy during this turbulent period. Measures such as easing monetary policy, asset repurchases enabled to increase the liquidity in the economy to stimulate economic activity in a period of economic downturn.
Meanwhile, introducing regulatory forbearances especially in terms of capital and liquidity requirements of financial institutions and providing liquidity assistance are some macroprudential measures taken to stabilize the financial sector during this period. Many countries have issued guidelines to release the countercyclical capital buffer and the liquidity coverage ratio which are buffers created during favourable times and meant to be used in times of crisis situations. Further, limiting discretionary payments such as dividends and profit repatriation was also taken as a measure to improve the building up of capital of financial institutions. Through such measures, liquidity was
freed up to facilitate the continuation of lending done by financial institutions. Thereby, economic activities could be carried on without disruptions from lack of funding.
Fiscal policy measures taken by economies, have been in the forms of “Above-the-line” and “Below-the-line” nature. Above-the-line policies are policies which have a direct impact on the fiscal budget in the short term, such as additional spending and tax cuts. Additional expenses on the health sector are also included under such policies. On the contrary, below-the-line policies are policies which do not have a direct impact on the fiscal budget but will have an impact on increasing debt or additional borrowings. It is observed that advanced economies have spent a substantially higher amount for both types of policy measures, which could be due to the high impact of COVID-19 health related issues as well as their ability to afford such spending.
Such unprecedented monetary and fiscal stimuli have undoubtedly supported in building investor confidence and diluting the effects of the shocks to the economy. Furthermore, such policies have contributed to avoid adverse macro-financial feedback loops.
The positive impact of the timely implementation of adequate and effective policy measures is reflected in the improving financial conditions in the Financial Conditions Index of USA and the European Union from May 2020 onwards. A noteworthy decline in financial conditions was observed in March and April 2020, during which time the COVID-19
11.00
9.26 2.503.40 1.60
5.87
5.96
11.00
9.26 2.503.40 1.60
5.87
5.96
Advanced Economies
Emerging Market and Developing Economies
World
Projections
Per
cen
t
7.0
3.5
0
-3.5
-7.0
2011
2012
2013
2014
2015
2016
2017
2018
2019
2020
2021
Per
cen
t
25
20
15
10
5
0Advanced Economies
Emerging Market and Middle-Income
Economies
Low Income Developing Economies
Global
Above-the-line
Below-the-line
11.00
2.500.20
5.96
9.26
3.40 1.60
5.87
4
Central Bank of Sri Lanka - Financial System Stability Review 2020
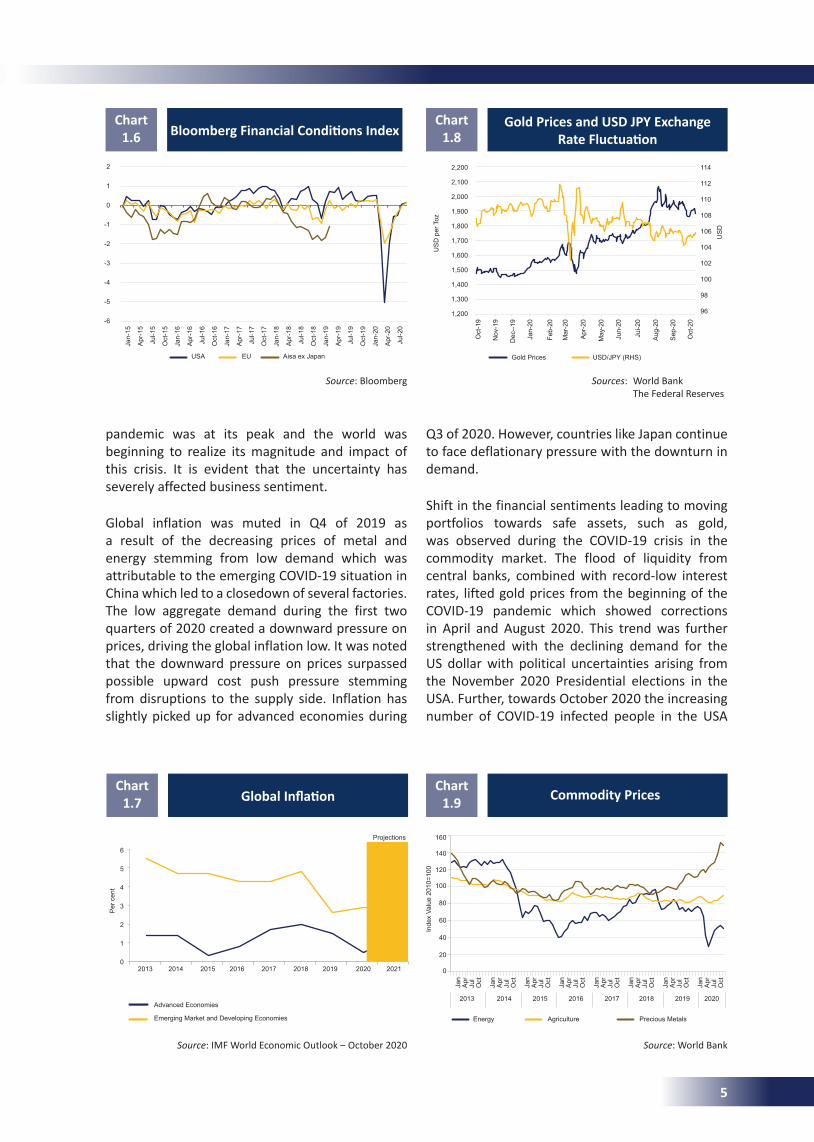
pandemic was at its peak and the world was beginning to realize its magnitude and impact of this crisis. It is evident that the uncertainty has severely affected business sentiment.
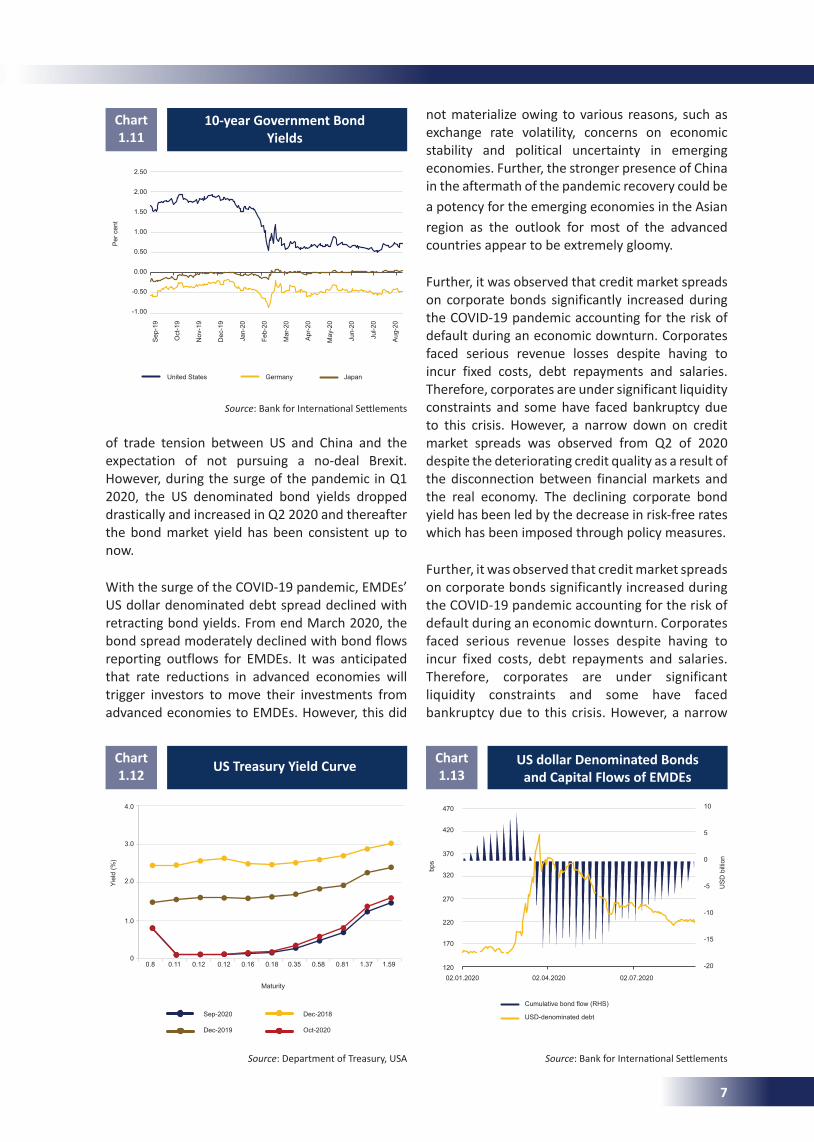
Global inflation was muted in Q4 of 2019 as a result of the decreasing prices of metal and energy stemming from low demand which was attributable to the emerging COVID-19 situation in China which led to a closedown of several factories. The low aggregate demand during the first two quarters of 2020 created a downward pressure on prices, driving the global inflation low. It was noted that the downward pressure on prices surpassed possible upward cost push pressure stemming from disruptions to the supply side. Inflation has slightly picked up for advanced economies during
BloombergFinancialConditionsIndexChart
1.6
Source: Bloomberg
Q3 of 2020. However, countries like Japan continue to face deflationary pressure with the downturn in demand.
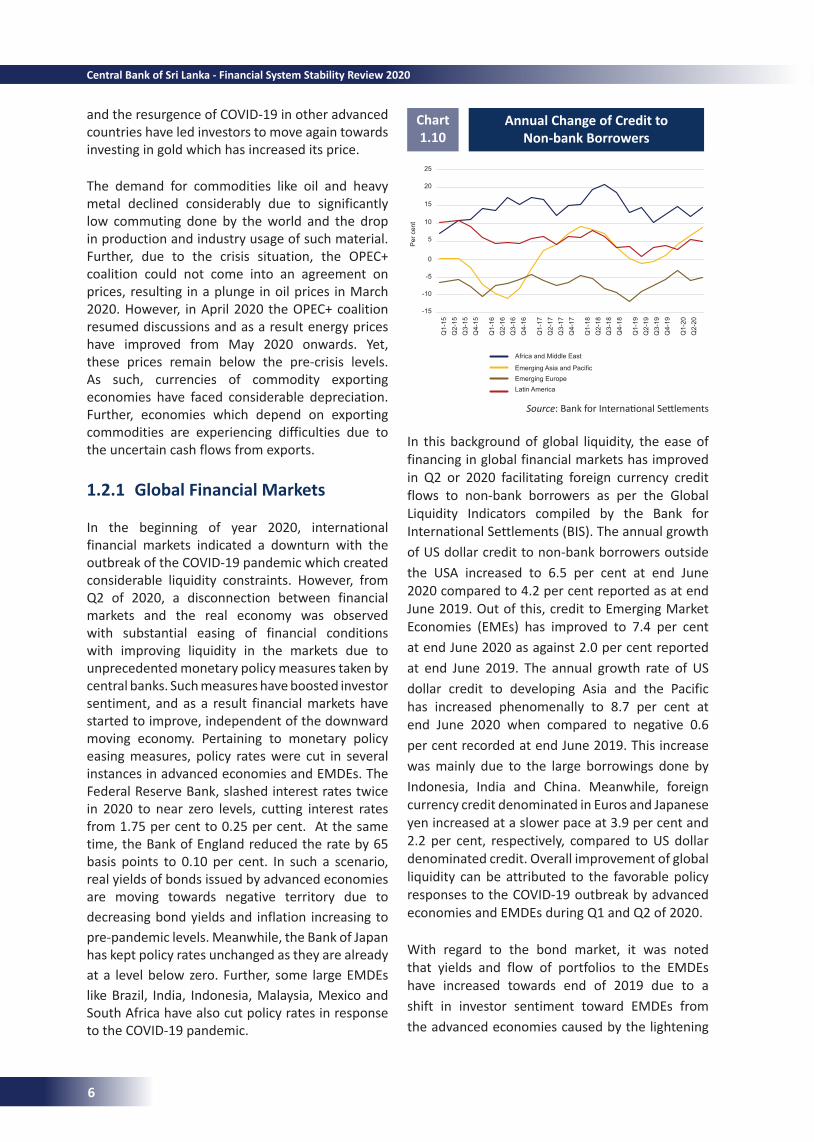
Shift in the financial sentiments leading to moving portfolios towards safe assets, such as gold, was observed during the COVID-19 crisis in the commodity market. The flood of liquidity from central banks, combined with record-low interest rates, lifted gold prices from the beginning of the COVID-19 pandemic which showed corrections in April and August 2020. This trend was further strengthened with the declining demand for the US dollar with political uncertainties arising from the November 2020 Presidential elections in the USA. Further, towards October 2020 the increasing number of COVID-19 infected people in the USA
Gold Prices and USD JPY Exchange RateFluctuation
Chart 1.8
Sources: World Bank The Federal Reserves
Commodity PricesChart
1.9
Source: World Bank
GlobalInflationChart
1.7
Source: IMF World Economic Outlook – October 2020
11.00
9.26 2.503.40 1.60
5.87
5.96
11.00
9.26 2.503.40 1.60
5.87
5.96
11.00
9.26 2.503.40 1.60
5.87
5.96
11.00
9.26 2.503.40 1.60
5.87
5.96
2
1
0
-1
-2
-3
-4
-5
-6
USA EU Aisa ex Japan
Jan-
15
Apr
-15
Jul-1
5
Oct
-15
Jan-
16
Apr
-16
Jul-1
6
Oct
-16
Jan-
17
Apr
-17
Jul-1
7
Oct
-17
Jan-
18
Apr
-18
Jul-1
8
Oct
-18
Jan-
19
Apr
-19
Jul-1
9
Oct
-19
Jan-
20
Apr
-20
Jul-2
0
Advanced Economies
Emerging Market and Developing Economies
Per
cen
t
6
5
4
3
2
1
02013 2014 2015 2016 2017 2018 2019 2020 2021
US
D p
er T
oz
US
D
2,200
2,100
2,000
1,900
1,800
1,700
1,600
1,500
1,400
1,300
1,200
114
112
110
108
106
104
102
100
98
96
Oct
-19
Nov
-19
Dec
--19
Jan-
20
Feb-
20
Mar
-20
Apr
-20
May
-20
Jun-
20
Jui-2
0
Aug
-20
Sep
-20
Oct
-20
Gold Prices USD/JPY (RHS)
Inde
x Va
lue
2010
=100
160
140
120
100
80
60
40
20
0
Energy Agriculture Precious Metals
Jan
Apr
Jul
Oct
Jan
Apr
Jul
Oct
Jan
Apr
Jul
Oct
Jan
Apr
Jul
Oct
Jan
Apr
Jul
Oct
Jan
Apr
Jul
Oct
Jan
Apr
Jul
Oct
Jan
Apr
Jul
Oct
2013 2014 2015 2016 2017 2018 2019 2020
Projections
5
Annual Change of Credit to Non-bank Borrowers
Chart 1.10
and the resurgence of COVID-19 in other advanced countries have led investors to move again towards investing in gold which has increased its price.
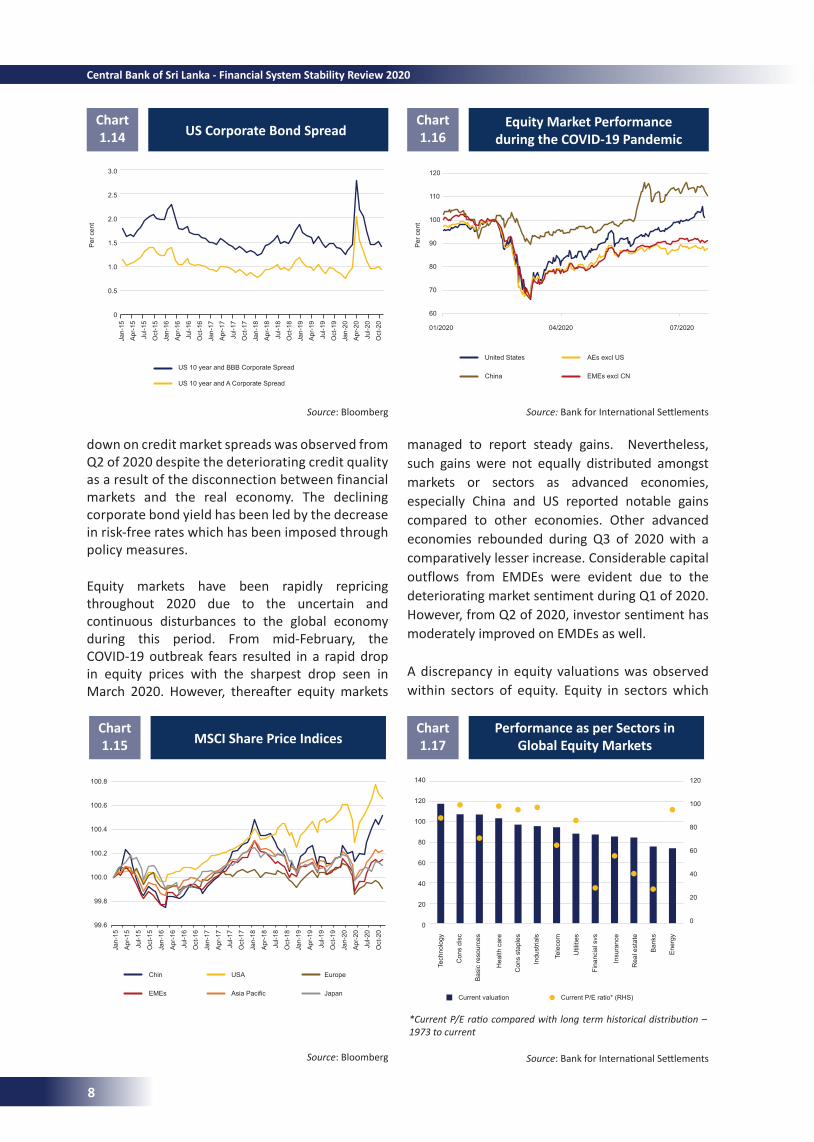
The demand for commodities like oil and heavy metal declined considerably due to significantly low commuting done by the world and the drop in production and industry usage of such material. Further, due to the crisis situation, the OPEC+ coalition could not come into an agreement on prices, resulting in a plunge in oil prices in March 2020. However, in April 2020 the OPEC+ coalition resumed discussions and as a result energy prices have improved from May 2020 onwards. Yet, these prices remain below the pre-crisis levels. As such, currencies of commodity exporting economies have faced considerable depreciation. Further, economies which depend on exporting commodities are experiencing difficulties due to the uncertain cash flows from exports.
1.2.1 Global Financial Markets
In the beginning of year 2020, international financial markets indicated a downturn with the outbreak of the COVID-19 pandemic which created considerable liquidity constraints. However, from Q2 of 2020, a disconnection between financial markets and the real economy was observed with substantial easing of financial conditions with improving liquidity in the markets due to unprecedented monetary policy measures taken by central banks. Such measures have boosted investor sentiment, and as a result financial markets have started to improve, independent of the downward moving economy. Pertaining to monetary policy easing measures, policy rates were cut in several instances in advanced economies and EMDEs. The Federal Reserve Bank, slashed interest rates twice in 2020 to near zero levels, cutting interest rates from 1.75 per cent to 0.25 per cent. At the same time, the Bank of England reduced the rate by 65 basis points to 0.10 per cent. In such a scenario, real yields of bonds issued by advanced economies are moving towards negative territory due to decreasing bond yields and inflation increasing to pre-pandemic levels. Meanwhile, the Bank of Japan has kept policy rates unchanged as they are already at a level below zero. Further, some large EMDEs like Brazil, India, Indonesia, Malaysia, Mexico and South Africa have also cut policy rates in response to the COVID-19 pandemic.
In this background of global liquidity, the ease of financing in global financial markets has improved in Q2 or 2020 facilitating foreign currency credit flows to non-bank borrowers as per the Global Liquidity Indicators compiled by the Bank for International Settlements (BIS). The annual growth of US dollar credit to non-bank borrowers outside the USA increased to 6.5 per cent at end June 2020 compared to 4.2 per cent reported as at end June 2019. Out of this, credit to Emerging Market Economies (EMEs) has improved to 7.4 per cent at end June 2020 as against 2.0 per cent reported at end June 2019. The annual growth rate of US dollar credit to developing Asia and the Pacific has increased phenomenally to 8.7 per cent at end June 2020 when compared to negative 0.6 per cent recorded at end June 2019. This increase was mainly due to the large borrowings done by Indonesia, India and China. Meanwhile, foreign currency credit denominated in Euros and Japanese yen increased at a slower pace at 3.9 per cent and 2.2 per cent, respectively, compared to US dollar denominated credit. Overall improvement of global liquidity can be attributed to the favorable policy responses to the COVID-19 outbreak by advanced economies and EMDEs during Q1 and Q2 of 2020.
With regard to the bond market, it was noted that yields and flow of portfolios to the EMDEs have increased towards end of 2019 due to a shift in investor sentiment toward EMDEs from the advanced economies caused by the lightening
Source: Bank for International SettlementsP
er c
ent
25
20
15
10
5
0
-5
-10
-15
Africa and Middle East
Emerging Asia and PacificEmerging EuropeLatin America
Q1-
15Q
2-15
Q3-
15Q
4-15
Q1-
16Q
2-16
Q3-
16Q
4-16
Q1-
17Q
2-17
Q3-
17Q
4-17
Q1-
18Q
2-18
Q3-
18Q
4-18
Q1-
19Q
2-19
Q3-
19Q
4-19
Q1-
20Q
2-20
6
Central Bank of Sri Lanka - Financial System Stability Review 2020
of trade tension between US and China and the expectation of not pursuing a no-deal Brexit. However, during the surge of the pandemic in Q1 2020, the US denominated bond yields dropped drastically and increased in Q2 2020 and thereafter the bond market yield has been consistent up to now.
With the surge of the COVID-19 pandemic, EMDEs’ US dollar denominated debt spread declined with retracting bond yields. From end March 2020, the bond spread moderately declined with bond flows reporting outflows for EMDEs. It was anticipated that rate reductions in advanced economies will trigger investors to move their investments from advanced economies to EMDEs. However, this did
US Treasury Yield CurveChart 1.12
Source: Department of Treasury, USA
not materialize owing to various reasons, such as exchange rate volatility, concerns on economic stability and political uncertainty in emerging economies. Further, the stronger presence of China in the aftermath of the pandemic recovery could be a potency for the emerging economies in the Asian region as the outlook for most of the advanced countries appear to be extremely gloomy.
Further, it was observed that credit market spreads on corporate bonds significantly increased during the COVID-19 pandemic accounting for the risk of default during an economic downturn. Corporates faced serious revenue losses despite having to incur fixed costs, debt repayments and salaries. Therefore, corporates are under significant liquidity constraints and some have faced bankruptcy due to this crisis. However, a narrow down on credit market spreads was observed from Q2 of 2020 despite the deteriorating credit quality as a result of the disconnection between financial markets and the real economy. The declining corporate bond yield has been led by the decrease in risk-free rates which has been imposed through policy measures.
Further, it was observed that credit market spreads on corporate bonds significantly increased during the COVID-19 pandemic accounting for the risk of default during an economic downturn. Corporates faced serious revenue losses despite having to incur fixed costs, debt repayments and salaries. Therefore, corporates are under significant liquidity constraints and some have faced bankruptcy due to this crisis. However, a narrow
US dollar Denominated Bonds and Capital Flows of EMDEs
Chart 1.13
Source: Bank for International Settlements
10-year Government Bond Yields
Chart 1.11
Source: Bank for International Settlements
United States Germany Japan
Per
cen
t
2.50
2.00
1.50
1.00
0.50
0.00
-0.50
-1.00
Sep
-19
Oct
-19
Nov
-19
Dec
-19
Jan-
20
Feb-
20
Mar
-20
Apr
-20
May
-20
Jun-
20
Jul-2
0
Aug
-20
Sep-2020 Dec-2018
Dec-2019 Oct-2020
Yiel
d (%
)
Maturity
4.0
3.0
2.0
1.0
00.8 0.11 0.12 0.12 0.16 0.18 0.35 0.58 0.81 1.37 1.59
10
5
0
-5
-10
-15
-20
bps
470
420
370
320
270
220
170
12002.01.2020 02.04.2020 02.07.2020
Cumulative bond flow (RHS)
USD-denominated debt
US
D b
illio
n
7
US Corporate Bond SpreadChart 1.14
Source: Bloomberg
Equity Market Performance during the COVID-19 Pandemic
Chart 1.16
Performance as per Sectors in Global Equity Markets
Chart 1.17
Source: Bank for International Settlements
*Current P/E ratio compared with long term historical distribution – 1973 to current
Source: Bank for International Settlements
down on credit market spreads was observed from Q2 of 2020 despite the deteriorating credit quality as a result of the disconnection between financial markets and the real economy. The declining corporate bond yield has been led by the decrease in risk-free rates which has been imposed through policy measures.
Equity markets have been rapidly repricing throughout 2020 due to the uncertain and continuous disturbances to the global economy during this period. From mid-February, the COVID-19 outbreak fears resulted in a rapid drop in equity prices with the sharpest drop seen in March 2020. However, thereafter equity markets
managed to report steady gains. Nevertheless, such gains were not equally distributed amongst markets or sectors as advanced economies, especially China and US reported notable gains compared to other economies. Other advanced economies rebounded during Q3 of 2020 with a comparatively lesser increase. Considerable capital outflows from EMDEs were evident due to the deteriorating market sentiment during Q1 of 2020. However, from Q2 of 2020, investor sentiment has moderately improved on EMDEs as well.
A discrepancy in equity valuations was observed within sectors of equity. Equity in sectors which
MSCI Share Price IndicesChart 1.15
Source: Bloomberg
Per
cen
t
3.0
2.5
2.0
1.5
1.0
0.5
0
US 10 year and BBB Corporate Spread
US 10 year and A Corporate Spread
Jan-
15
Apr
-15
Jul-1
5
Oct
-15
Jan-
16
Apr
-16
Jul-1
6
Oct
-16
Jan-
17
Apr
-17
Jul-1
7
Oct
-17
Jan-
18
Apr
-18
Jul-1
8
Oct
-18
Jan-
19
Apr
-19
Jul-1
9
Oct
-19
Jan-
20
Apr
-20
Jul-2
0
Oct
-20
Chin USA Europe
EMEs Asia Pacific Japan
100.8
100.6
100.4
100.2
100.0
99.8
99.6
Jan-
15
Apr
-15
Jul-1
5
Oct
-15
Jan-
16
Apr
-16
Jul-1
6
Oct
-16
Jan-
17
Apr
-17
Jul-1
7
Oct
-17
Jan-
18
Apr
-18
Jul-1
8
Oct
-18
Jan-
19
Apr
-19
Jul-1
9
Oct
-19
Jan-
20
Apr
-20
Jul-2
0
Oct
-20
01/2020 04/2020 07/2020
Per
cen
t
120
110
100
90
80
70
60
United States AEs excl US
China EMEs excl CN
Tech
nolo
gy
Con
s di
sc
Bas
ic re
sour
ces
Hea
lth c
are
Con
s st
aple
s
Indu
stria
ls
Tele
com
Util
ities
Fina
ncia
l svs
Insu
ranc
e
Rea
l est
ate
Ban
ks
Ene
rgy
140
120
100
80
60
40
20
0
120
100
80
60
40
20
0
Current valuation Current P/E ratio* (RHS)
8
Central Bank of Sri Lanka - Financial System Stability Review 2020
Source: Bloomberg Source: Bloomberg
are in a better position from structural changes created by the COVID-19 pandemic, such as stocks on technology and health, reported the highest valuation. The rising valuation of technology-related stocks has been a primary reason behind increasing prices in US and China equity markets where most of the technology-related stocks are listed. Meanwhile, financial services and energy stocks reported lower valuations. Due to the depleting credit quality, valuation of financial services was low and the lack of demand for energy has resulted in low valuation for energy related stocks.
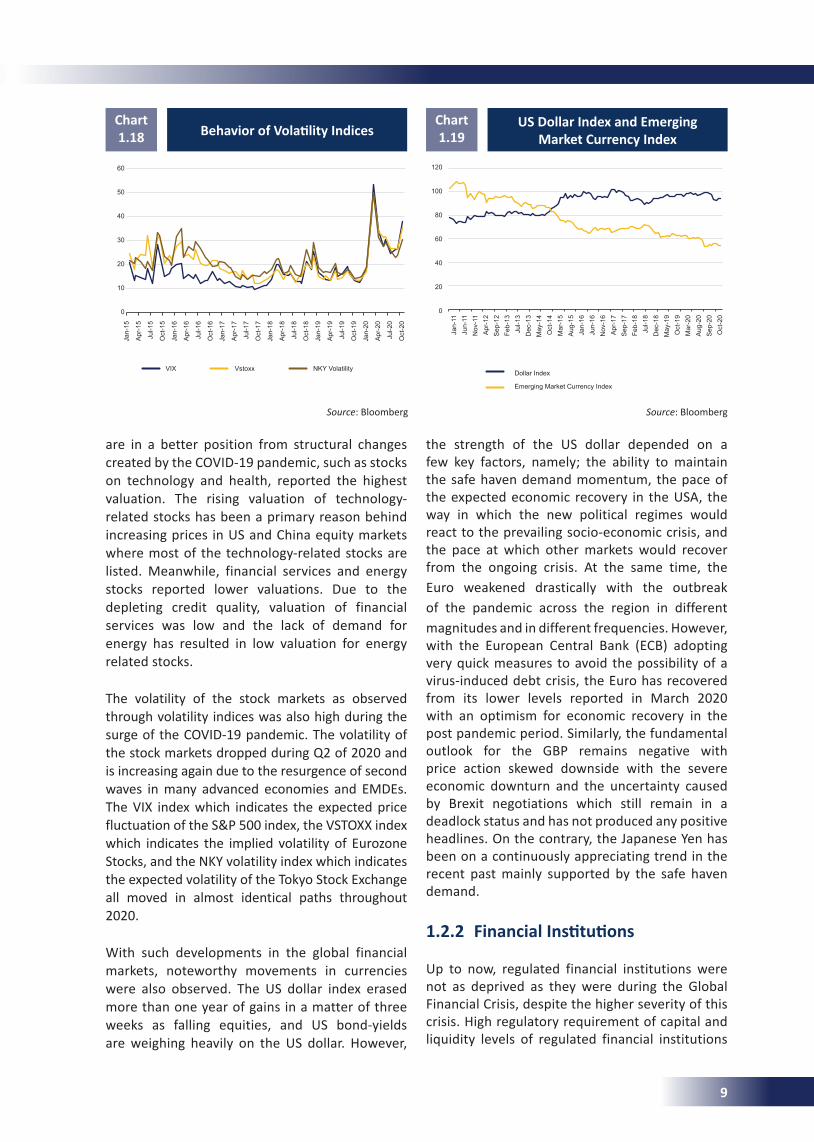
The volatility of the stock markets as observed through volatility indices was also high during the surge of the COVID-19 pandemic. The volatility of the stock markets dropped during Q2 of 2020 and is increasing again due to the resurgence of second waves in many advanced economies and EMDEs. The VIX index which indicates the expected price fluctuation of the S&P 500 index, the VSTOXX index which indicates the implied volatility of Eurozone Stocks, and the NKY volatility index which indicates the expected volatility of the Tokyo Stock Exchange all moved in almost identical paths throughout 2020.
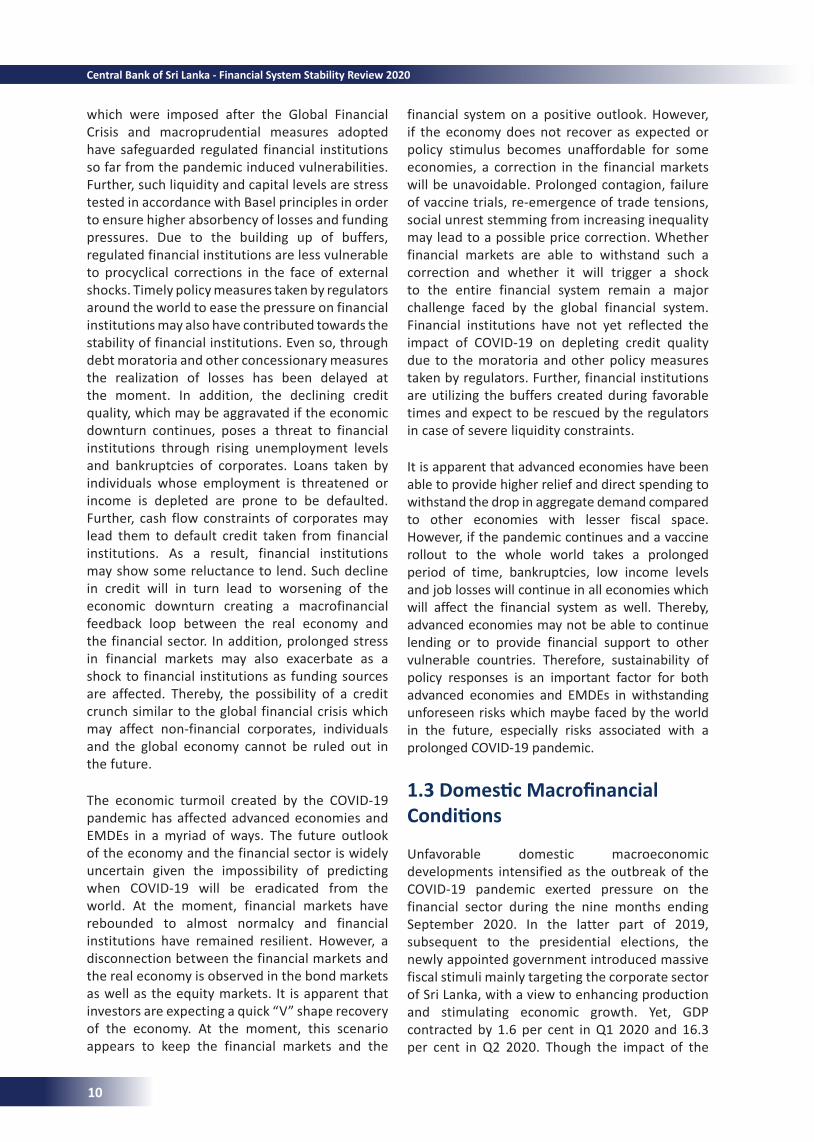
With such developments in the global financial markets, noteworthy movements in currencies were also observed. The US dollar index erased more than one year of gains in a matter of three weeks as falling equities, and US bond-yields are weighing heavily on the US dollar. However,
BehaviorofVolatilityIndicesChart 1.18
the strength of the US dollar depended on a few key factors, namely; the ability to maintain the safe haven demand momentum, the pace of the expected economic recovery in the USA, the way in which the new political regimes would react to the prevailing socio-economic crisis, and the pace at which other markets would recover from the ongoing crisis. At the same time, the Euro weakened drastically with the outbreak of the pandemic across the region in different magnitudes and in different frequencies. However, with the European Central Bank (ECB) adopting very quick measures to avoid the possibility of a virus-induced debt crisis, the Euro has recovered from its lower levels reported in March 2020 with an optimism for economic recovery in the post pandemic period. Similarly, the fundamental outlook for the GBP remains negative with price action skewed downside with the severe economic downturn and the uncertainty caused by Brexit negotiations which still remain in a deadlock status and has not produced any positive headlines. On the contrary, the Japanese Yen has been on a continuously appreciating trend in the recent past mainly supported by the safe haven demand.
1.2.2 FinancialInstitutions
Up to now, regulated financial institutions were not as deprived as they were during the Global Financial Crisis, despite the higher severity of this crisis. High regulatory requirement of capital and liquidity levels of regulated financial institutions
US Dollar Index and Emerging Market Currency Index
Chart 1.19
VIX Vstoxx NKY Volatility
60
50
40
30
20
10
0
Jan-
15
Apr
-15
Jul-1
5
Oct
-15
Jan-
16
Apr
-16
Jul-1
6
Oct
-16
Jan-
17
Apr
-17
Jul-1
7
Oct
-17
Jan-
18
Apr
-18
Jul-1
8
Oct
-18
Jan-
19
Apr
-19
Jul-1
9
Oct
-19
Jan-
20
Apr
-20
Jul-2
0
Oct
-20
Jan-
11Ju
n-11
Nov
-11
Apr
-12
Sep
-12
Feb-
13Ju
l-13
Dec
-13
May
-14
Oct
-14
Mar
-15
Aug
-15
Jan-
16Ju
n-16
Nov
-16
Apr
-17
Sep
-17
Feb-
18Ju
l-18
Dec
-18
May
-19
Oct
-19
Mar
-20
Aug
-20
Sep
-20
Oct
-20
120
100
80
60
40
20
0
Dollar Index Emerging Market Currency Index
9
which were imposed after the Global Financial Crisis and macroprudential measures adopted have safeguarded regulated financial institutions so far from the pandemic induced vulnerabilities. Further, such liquidity and capital levels are stress tested in accordance with Basel principles in order to ensure higher absorbency of losses and funding pressures. Due to the building up of buffers, regulated financial institutions are less vulnerable to procyclical corrections in the face of external shocks. Timely policy measures taken by regulators around the world to ease the pressure on financial institutions may also have contributed towards the stability of financial institutions. Even so, through debt moratoria and other concessionary measures the realization of losses has been delayed at the moment. In addition, the declining credit quality, which may be aggravated if the economic downturn continues, poses a threat to financial institutions through rising unemployment levels and bankruptcies of corporates. Loans taken by individuals whose employment is threatened or income is depleted are prone to be defaulted. Further, cash flow constraints of corporates may lead them to default credit taken from financial institutions. As a result, financial institutions may show some reluctance to lend. Such decline in credit will in turn lead to worsening of the economic downturn creating a macrofinancial feedback loop between the real economy and the financial sector. In addition, prolonged stress in financial markets may also exacerbate as a shock to financial institutions as funding sources are affected. Thereby, the possibility of a credit crunch similar to the global financial crisis which may affect non-financial corporates, individuals and the global economy cannot be ruled out in the future.
The economic turmoil created by the COVID-19 pandemic has affected advanced economies and EMDEs in a myriad of ways. The future outlook of the economy and the financial sector is widely uncertain given the impossibility of predicting when COVID-19 will be eradicated from the world. At the moment, financial markets have rebounded to almost normalcy and financial institutions have remained resilient. However, a disconnection between the financial markets and the real economy is observed in the bond markets as well as the equity markets. It is apparent that investors are expecting a quick “V” shape recovery of the economy. At the moment, this scenario appears to keep the financial markets and the
financial system on a positive outlook. However, if the economy does not recover as expected or policy stimulus becomes unaffordable for some economies, a correction in the financial markets will be unavoidable. Prolonged contagion, failure of vaccine trials, re-emergence of trade tensions, social unrest stemming from increasing inequality may lead to a possible price correction. Whether financial markets are able to withstand such a correction and whether it will trigger a shock to the entire financial system remain a major challenge faced by the global financial system. Financial institutions have not yet reflected the impact of COVID-19 on depleting credit quality due to the moratoria and other policy measures taken by regulators. Further, financial institutions are utilizing the buffers created during favorable times and expect to be rescued by the regulators in case of severe liquidity constraints.
It is apparent that advanced economies have been able to provide higher relief and direct spending to withstand the drop in aggregate demand compared to other economies with lesser fiscal space. However, if the pandemic continues and a vaccine rollout to the whole world takes a prolonged period of time, bankruptcies, low income levels and job losses will continue in all economies which will affect the financial system as well. Thereby, advanced economies may not be able to continue lending or to provide financial support to other vulnerable countries. Therefore, sustainability of policy responses is an important factor for both advanced economies and EMDEs in withstanding unforeseen risks which maybe faced by the world in the future, especially risks associated with a prolonged COVID-19 pandemic.
1.3DomesticMacrofinancialConditions
Unfavorable domestic macroeconomic developments intensified as the outbreak of the COVID-19 pandemic exerted pressure on the financial sector during the nine months ending September 2020. In the latter part of 2019, subsequent to the presidential elections, the newly appointed government introduced massive fiscal stimuli mainly targeting the corporate sector of Sri Lanka, with a view to enhancing production and stimulating economic growth. Yet, GDP contracted by 1.6 per cent in Q1 2020 and 16.3 per cent in Q2 2020. Though the impact of the
10
Central Bank of Sri Lanka - Financial System Stability Review 2020
fiscal stimuli was expected to be witnessed with some time lag, the COVID-19 pandemic affecting the global economy and the pandemic emerging in Sri Lanka since March 2020 negatively affected the economic performance of Sri Lanka. The global economic downturn transmitted to the Sri Lankan economy through lowering tourism earnings, export earnings and migrant worker remittances while recording cash outflows from financial markets. Measures taken to curtail the spread of COVID-19 virus, such as lockdown of the country for over two months, mobility restrictions and social distancing adversely affected the production
BusinessConditionsChart 1.20
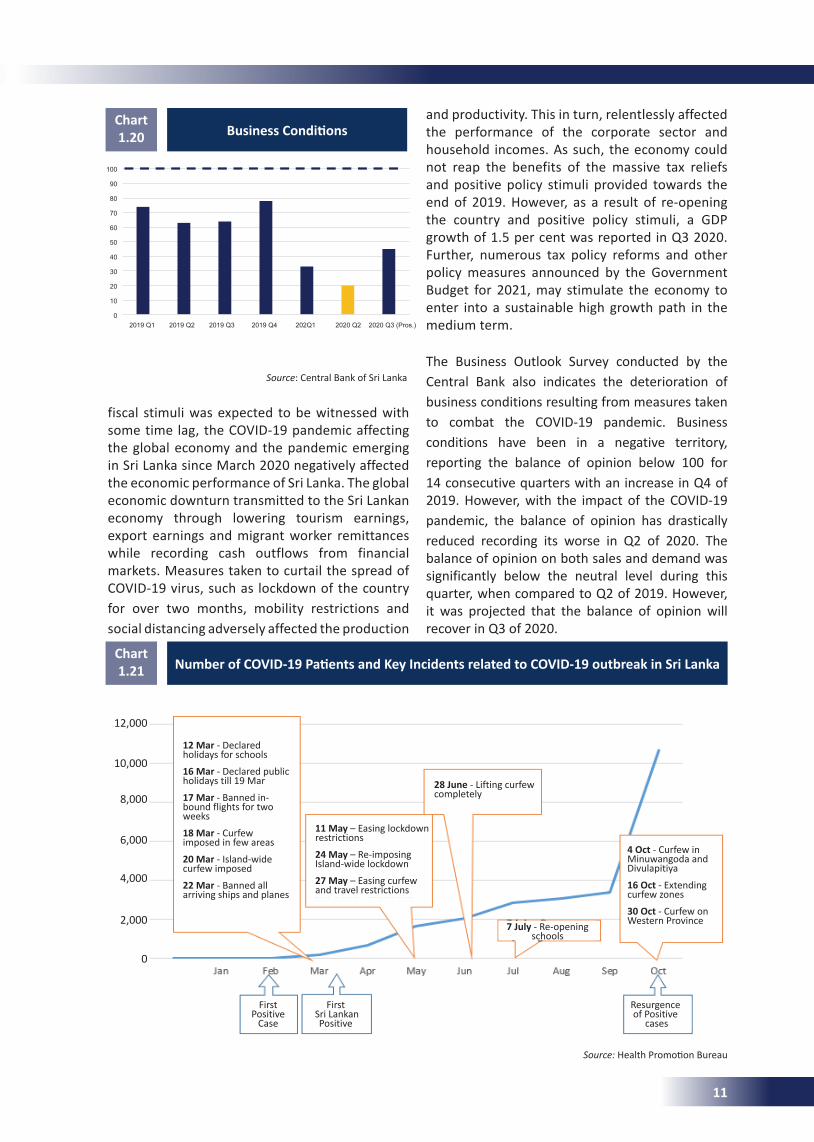
and productivity. This in turn, relentlessly affected the performance of the corporate sector and household incomes. As such, the economy could not reap the benefits of the massive tax reliefs and positive policy stimuli provided towards the end of 2019. However, as a result of re-opening the country and positive policy stimuli, a GDP growth of 1.5 per cent was reported in Q3 2020. Further, numerous tax policy reforms and other policy measures announced by the Government Budget for 2021, may stimulate the economy to enter into a sustainable high growth path in the medium term.
The Business Outlook Survey conducted by the Central Bank also indicates the deterioration of business conditions resulting from measures taken to combat the COVID-19 pandemic. Business conditions have been in a negative territory, reporting the balance of opinion below 100 for 14 consecutive quarters with an increase in Q4 of 2019. However, with the impact of the COVID-19 pandemic, the balance of opinion has drastically reduced recording its worse in Q2 of 2020. The balance of opinion on both sales and demand was significantly below the neutral level during this quarter, when compared to Q2 of 2019. However, it was projected that the balance of opinion will recover in Q3 of 2020.
Source: Central Bank of Sri Lanka
100
90
80
70
60
50
40
30
20
10
02019 Q1 2019 Q2 2019 Q3 2019 Q4 202Q1 2020 Q2 2020 Q3 (Pros.)
13 Financial System Stability Review -2020
the economy could not reap the benefits of the massive tax reliefs and positive policy stimuli provided towards the end of 2019. However, as a result of re-opening the country and positive policy stimuli, a GDP growth of 1.5 per cent was reported in Q3 2020. Further, numerous tax policy reforms and other policy measures announced by
the Government Budget for 2021, may stimulate the economy to enter into a sustainable high growth path in the medium term.The Business Outlook Survey conducted by the Central Bank also indicates the deterioration of business conditions resulting from measures taken to combat the COVID-19 pandemic. Business conditions have been in a negative territory, reporting the balance of opinion below 100 for 14 consecutive quarters with an increase in Q4 of 2019. However, with the impact of the COVID-19 pandemic, the balance of opinion has drastically reduced recording its worse in Q2 of 2020. The balance of opinion on both sales and demand was significantly below the neutral level during this quarter, when compared to Q2 of 2019. However, it was projected that the balance of opinion will recover in Q3 of 2020.
Such downturns in the global and domestic economy and business conditions spilled over to the financial sector of Sri Lanka, mainly through
Source: Central Bank of Sri Lanka
Chart 1.21: Number of COVID-19 Patients and Key
Incidents related to COVID-19 outbreak in Sri Lanka
Source: Health Promotion Bureau
Chart 1.22: Credit to Deposits Ratio of the Banking Sector
87.2 87.5
88.7
90.6
89.4
87.4 88.2
88.7 89.8
88.1
84.8
-0.01
0.01
0.02
0.03
0.04
0.05
0.06
0.07
84.0
85.0
86.0
87.0
88.0
89.0
90.0
91.0
Per c
ent
Per c
ent
QoQ Credit Growth (RHS)QoQ Deposit Growth (RHS)Banking Sector Credit to Deposit Ratio
Source: Central Bank of Sri Lanka
NumberofCOVID-19PatientsandKeyIncidentsrelatedtoCOVID-19outbreakinSriLankaChart 1.21
Source: Health Promotion Bureau
12 Mar - Declared holidays for schools
16 Mar - Declared public holidays till 19 Mar
17 Mar - Banned in-bound flights for two weeks
18 Mar - Curfew imposed in few areas
20 Mar - Island-wide curfew imposed
22 Mar - Banned all arriving ships and planes
11 May – Easing lockdown restrictions
24 May – Re-imposing Island-wide lockdown
27 May – Easing curfew and travel restrictions
28 June - Lifting curfew completely
4 Oct - Curfew in Minuwangoda and Divulapitiya
16 Oct - Extending curfew zones
30 Oct - Curfew on Western Province
First Positive
Case
First Sri Lankan
Positive
Resurgence of Positive
cases
7 July - Re-opening schools
12,000
10,000
8,000
6,000
4,000
2,000
0
11
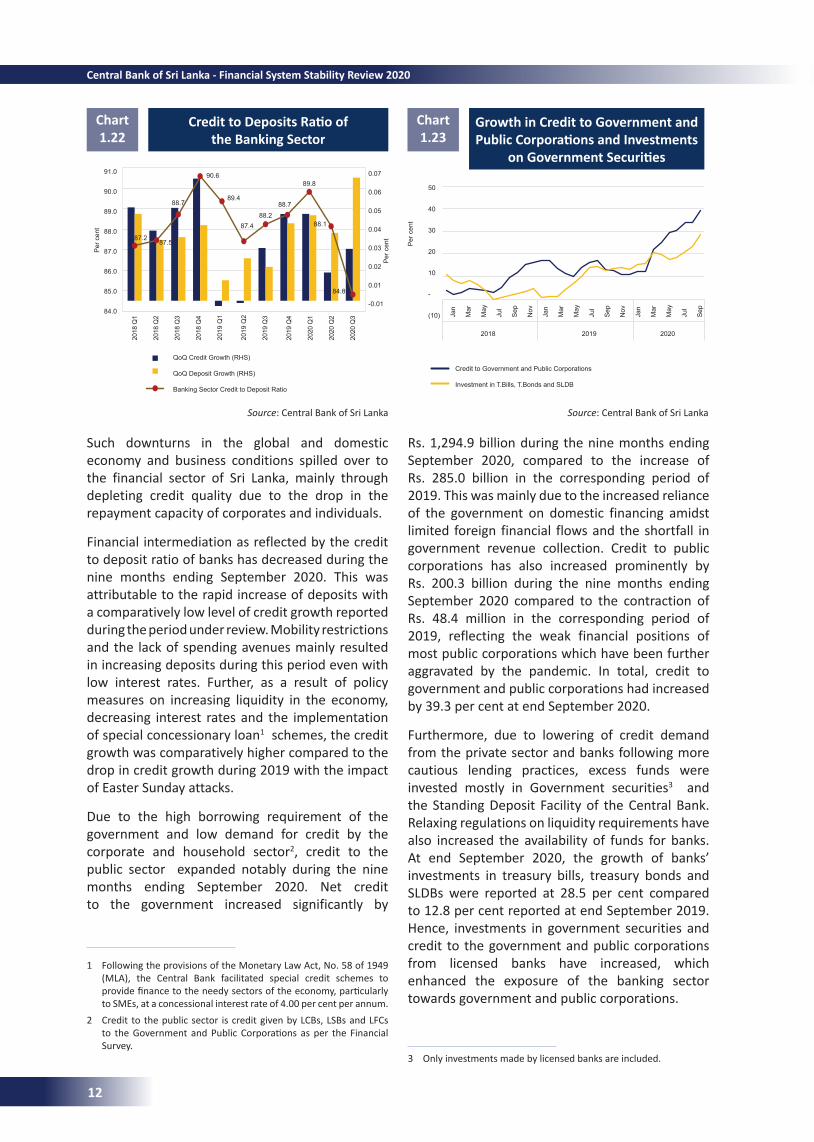
Such downturns in the global and domestic economy and business conditions spilled over to the financial sector of Sri Lanka, mainly through depleting credit quality due to the drop in the repayment capacity of corporates and individuals.
Financial intermediation as reflected by the credit to deposit ratio of banks has decreased during the nine months ending September 2020. This was attributable to the rapid increase of deposits with a comparatively low level of credit growth reported during the period under review. Mobility restrictions and the lack of spending avenues mainly resulted in increasing deposits during this period even with low interest rates. Further, as a result of policy measures on increasing liquidity in the economy, decreasing interest rates and the implementation of special concessionary loan1 schemes, the credit growth was comparatively higher compared to the drop in credit growth during 2019 with the impact of Easter Sunday attacks.
Due to the high borrowing requirement of the government and low demand for credit by the corporate and household sector2, credit to the public sector expanded notably during the nine months ending September 2020. Net credit to the government increased significantly by
1 Following the provisions of the Monetary Law Act, No. 58 of 1949 (MLA), the Central Bank facilitated special credit schemes to provide finance to the needy sectors of the economy, particularly to SMEs, at a concessional interest rate of 4.00 per cent per annum.
2 Credit to the public sector is credit given by LCBs, LSBs and LFCs to the Government and Public Corporations as per the Financial Survey.
CredittoDepositsRatioofthe Banking Sector
Chart 1.22
3 Only investments made by licensed banks are included.
Chart 1.23
Growth in Credit to Government and PublicCorporationsandInvestments
onGovernmentSecurities
Source: Central Bank of Sri Lanka Source: Central Bank of Sri Lanka
Rs. 1,294.9 billion during the nine months ending September 2020, compared to the increase of Rs. 285.0 billion in the corresponding period of 2019. This was mainly due to the increased reliance of the government on domestic financing amidst limited foreign financial flows and the shortfall in government revenue collection. Credit to public corporations has also increased prominently by Rs. 200.3 billion during the nine months ending September 2020 compared to the contraction of Rs. 48.4 million in the corresponding period of 2019, reflecting the weak financial positions of most public corporations which have been further aggravated by the pandemic. In total, credit to government and public corporations had increased by 39.3 per cent at end September 2020.
Furthermore, due to lowering of credit demand from the private sector and banks following more cautious lending practices, excess funds were invested mostly in Government securities3 and the Standing Deposit Facility of the Central Bank. Relaxing regulations on liquidity requirements have also increased the availability of funds for banks. At end September 2020, the growth of banks’ investments in treasury bills, treasury bonds and SLDBs were reported at 28.5 per cent compared to 12.8 per cent reported at end September 2019. Hence, investments in government securities and credit to the government and public corporations from licensed banks have increased, which enhanced the exposure of the banking sector towards government and public corporations.
0.07
0.06
0.05
0.04
0.03
0.02
0.01
-0.01
2018
Q1
2018
Q2
2018
Q3
2018
Q4
2019
Q1
2019
Q2
2019
Q3
2019
Q4
2020
Q1
2020
Q2
2020
Q3
Per
cen
t
Per
cen
t
91.0
90.0
89.0
88.0
87.0
86.0
85.0
84.0
87.287.5
88.7
90.6
89.4
87.488.2
88.7
89.8
88.1
84.8
QoQ Credit Growth (RHS)
QoQ Deposit Growth (RHS)
Banking Sector Credit to Deposit Ratio
50
40
30
20
10
-
(10) Jan
Mar
May
Jul
Sep
Nov
Jan
Mar
May
Jul
Sep
Nov
Jan
Mar
May
Jul
Sep
2018 2019 2020
Credit to Government and Public Corporations Investment in T.Bills, T.Bonds and SLDB
Per
cen
t
12
Central Bank of Sri Lanka - Financial System Stability Review 2020
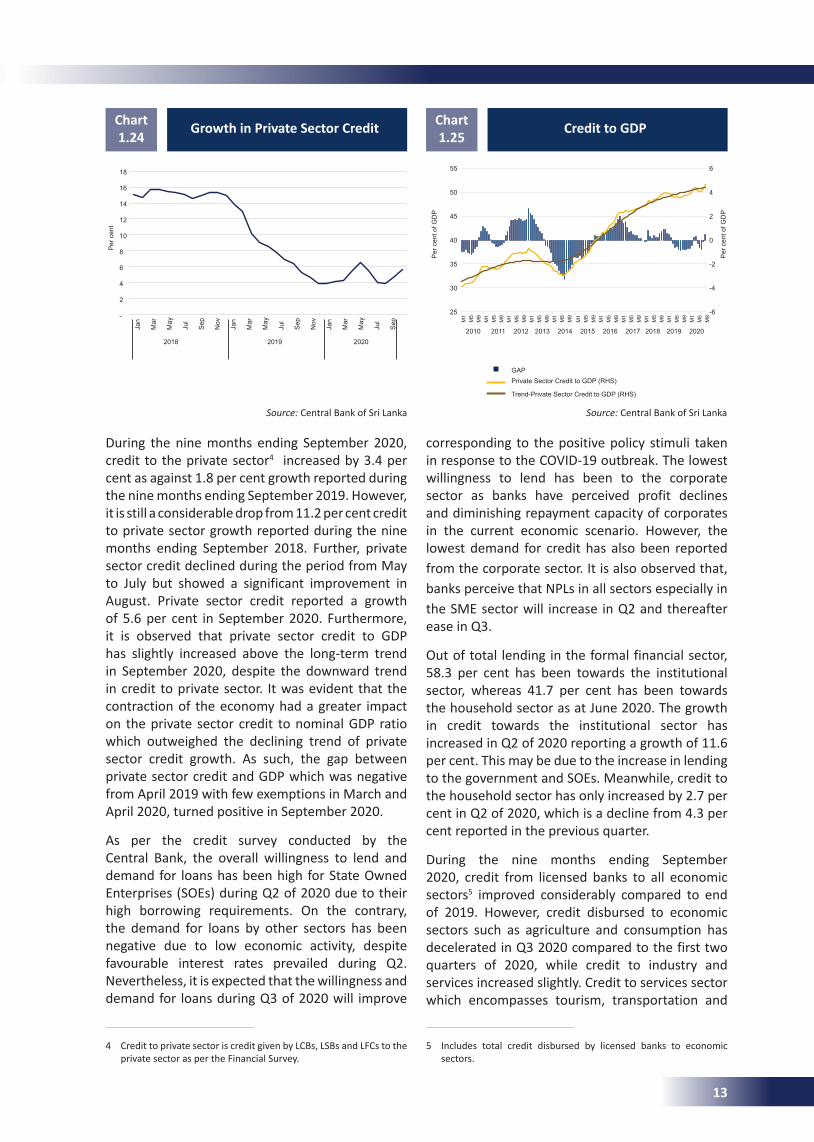
4 Credit to private sector is credit given by LCBs, LSBs and LFCs to the private sector as per the Financial Survey.
5 Includes total credit disbursed by licensed banks to economic sectors.
During the nine months ending September 2020, credit to the private sector4 increased by 3.4 per cent as against 1.8 per cent growth reported during the nine months ending September 2019. However, it is still a considerable drop from 11.2 per cent credit to private sector growth reported during the nine months ending September 2018. Further, private sector credit declined during the period from May to July but showed a significant improvement in August. Private sector credit reported a growth of 5.6 per cent in September 2020. Furthermore, it is observed that private sector credit to GDP has slightly increased above the long-term trend in September 2020, despite the downward trend in credit to private sector. It was evident that the contraction of the economy had a greater impact on the private sector credit to nominal GDP ratio which outweighed the declining trend of private sector credit growth. As such, the gap between private sector credit and GDP which was negative from April 2019 with few exemptions in March and April 2020, turned positive in September 2020.
As per the credit survey conducted by the Central Bank, the overall willingness to lend and demand for loans has been high for State Owned Enterprises (SOEs) during Q2 of 2020 due to their high borrowing requirements. On the contrary, the demand for loans by other sectors has been negative due to low economic activity, despite favourable interest rates prevailed during Q2. Nevertheless, it is expected that the willingness and demand for loans during Q3 of 2020 will improve
Growth in Private Sector Credit Chart 1.24
Source: Central Bank of Sri Lanka
Credit to GDP Chart 1.25
Source: Central Bank of Sri Lanka
corresponding to the positive policy stimuli taken in response to the COVID-19 outbreak. The lowest willingness to lend has been to the corporate sector as banks have perceived profit declines and diminishing repayment capacity of corporates in the current economic scenario. However, the lowest demand for credit has also been reported from the corporate sector. It is also observed that, banks perceive that NPLs in all sectors especially in the SME sector will increase in Q2 and thereafter ease in Q3.
Out of total lending in the formal financial sector, 58.3 per cent has been towards the institutional sector, whereas 41.7 per cent has been towards the household sector as at June 2020. The growth in credit towards the institutional sector has increased in Q2 of 2020 reporting a growth of 11.6 per cent. This may be due to the increase in lending to the government and SOEs. Meanwhile, credit to the household sector has only increased by 2.7 per cent in Q2 of 2020, which is a decline from 4.3 per cent reported in the previous quarter.
During the nine months ending September 2020, credit from licensed banks to all economic sectors5 improved considerably compared to end of 2019. However, credit disbursed to economic sectors such as agriculture and consumption has decelerated in Q3 2020 compared to the first two quarters of 2020, while credit to industry and services increased slightly. Credit to services sector which encompasses tourism, transportation and
Jan
Mar
May
Jul
Sep
Nov
Jan
Mar
May
Jul
Sep
Nov
Jan
Mar
May
Jul
Sep
2018 2019 2020
Per
cen
t
18
16
14
12
10
8
6
4
2
-
M1
M5
M9
M1
M5
M9
M1
M5
M9
M1
M5
M9
M1
M5
M9
M1
M5
M9
M1
M5
M9
M1
M5
M9
M1
M5
M9
M1
M5
M9
M1
M5
M9
GAPPrivate Sector Credit to GDP (RHS)
Trend-Private Sector Credit to GDP (RHS)
2010 2011 2012 2013 2014 2015 2016 2017 2018 2019 2020
Per
cen
t of G
DP
Per
cen
t of G
DP
55
50
45
40
35
30
25
6
4
2
0
-2
-4
-6
13
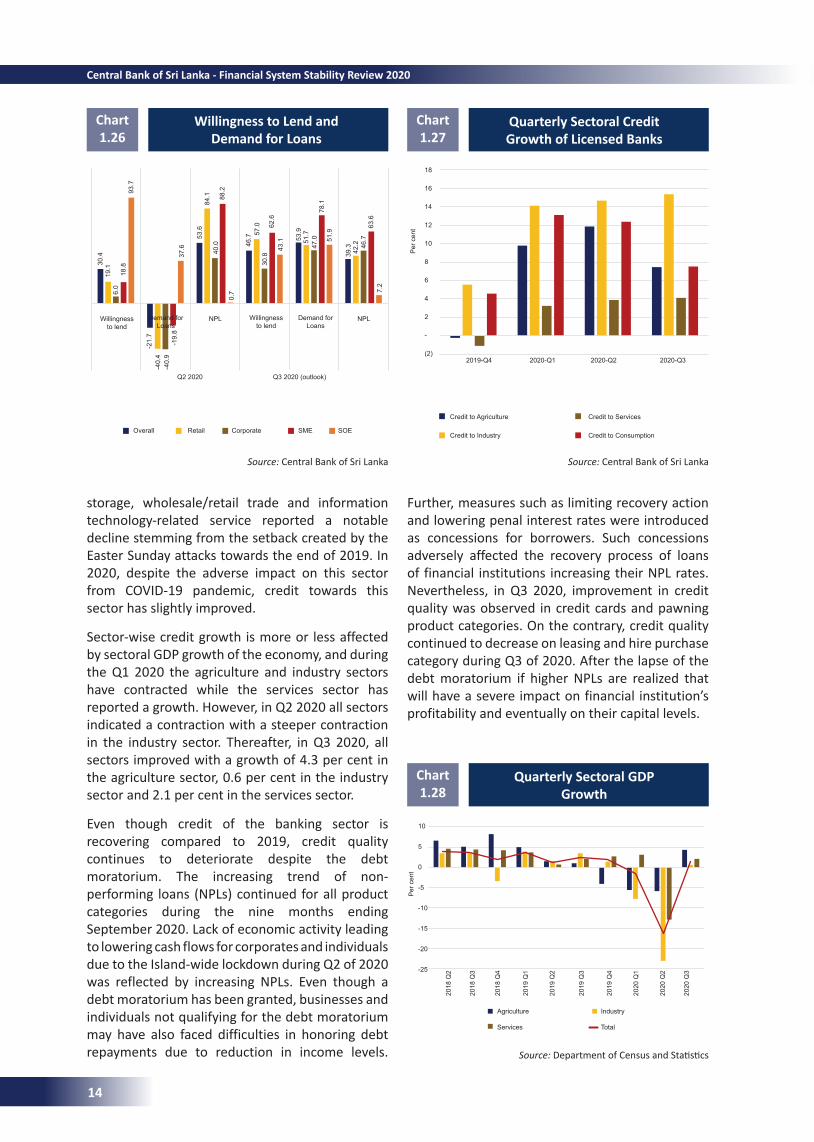
Agriculture Industry
Services Total
18
16
14
12
10
8
6
4
2
-
(2)
Credit to Agriculture Credit to Services
Credit to Industry Credit to Consumption
Willingness to Lend and Demand for Loans
Chart 1.26
Quarterly Sectoral Credit Growth of Licensed Banks
Chart 1.27
Quarterly Sectoral GDP Growth
Chart 1.28
Source: Central Bank of Sri Lanka
Source: Department of Census and Statistics
storage, wholesale/retail trade and information technology-related service reported a notable decline stemming from the setback created by the Easter Sunday attacks towards the end of 2019. In 2020, despite the adverse impact on this sector from COVID-19 pandemic, credit towards this sector has slightly improved.
Sector-wise credit growth is more or less affected by sectoral GDP growth of the economy, and during the Q1 2020 the agriculture and industry sectors have contracted while the services sector has reported a growth. However, in Q2 2020 all sectors indicated a contraction with a steeper contraction in the industry sector. Thereafter, in Q3 2020, all sectors improved with a growth of 4.3 per cent in the agriculture sector, 0.6 per cent in the industry sector and 2.1 per cent in the services sector.
Even though credit of the banking sector is recovering compared to 2019, credit quality continues to deteriorate despite the debt moratorium. The increasing trend of non-performing loans (NPLs) continued for all product categories during the nine months ending September 2020. Lack of economic activity leading to lowering cash flows for corporates and individuals due to the Island-wide lockdown during Q2 of 2020 was reflected by increasing NPLs. Even though a debt moratorium has been granted, businesses and individuals not qualifying for the debt moratorium may have also faced difficulties in honoring debt repayments due to reduction in income levels.
Further, measures such as limiting recovery action and lowering penal interest rates were introduced as concessions for borrowers. Such concessions adversely affected the recovery process of loans of financial institutions increasing their NPL rates. Nevertheless, in Q3 2020, improvement in credit quality was observed in credit cards and pawning product categories. On the contrary, credit quality continued to decrease on leasing and hire purchase category during Q3 of 2020. After the lapse of the debt moratorium if higher NPLs are realized that will have a severe impact on financial institution’s profitability and eventually on their capital levels.
Source: Central Bank of Sri Lanka
30
.4
19.1
6.0
18
.8
93.7
Overall Retail Corporate SME SOE
Q2 2020 Q3 2020 (outlook)
-21.
7-4
0.4
-40.
9-1
9.8
37.6
53.6
84.1
40.0
88.2
0.7
46.7 57
.030
.862
.643
.1 53.9
51.7
47.0
78.1
51.9
39.3 42.2 46
.763
.67.
2
Willingness to lend
Demand for Loans
Demand for Loans
NPL NPLWillingness to lend
Per
cen
t
2019-Q4 2020-Q1 2020-Q2 2020-Q3
10
5
0
-5
-10
-15
-20
-25
2018
Q2
2018
Q3
2018
Q4
2019
Q1
2019
Q2
2019
Q3
2019
Q4
2020
Q1
2020
Q2
2020
Q3
Per
cen
t
14
Central Bank of Sri Lanka - Financial System Stability Review 2020
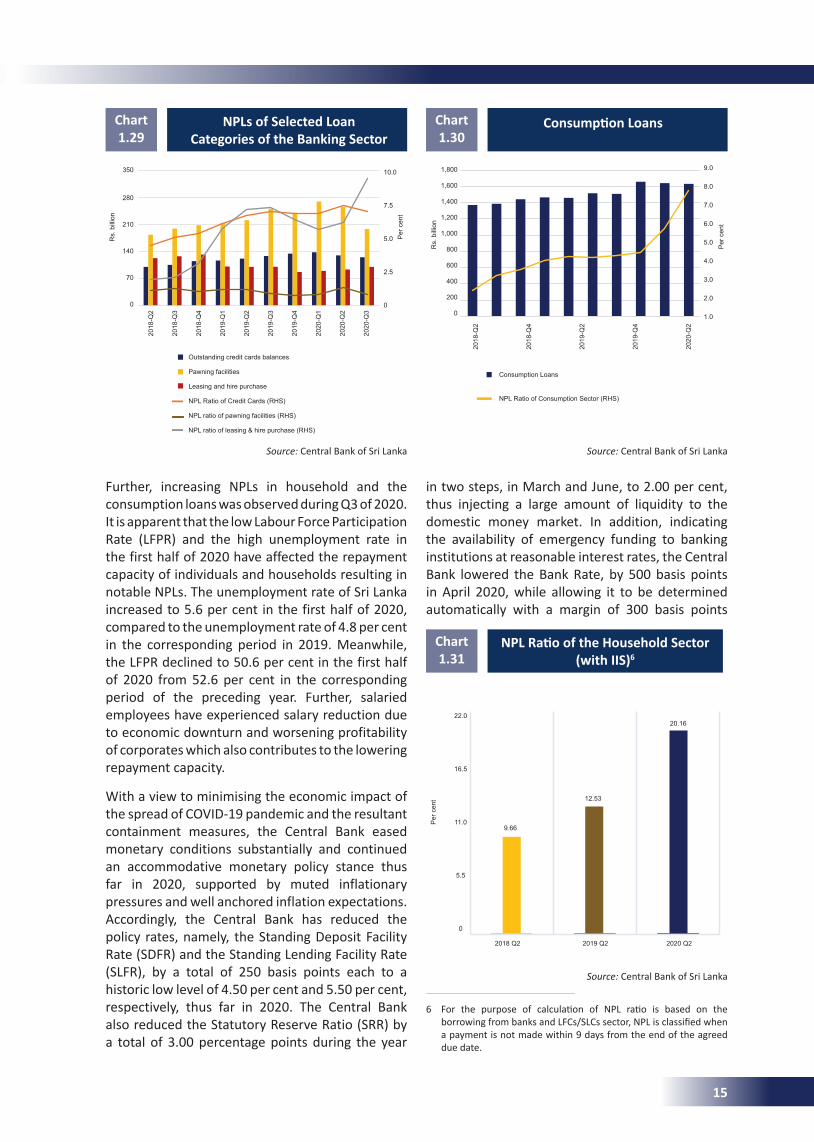
Further, increasing NPLs in household and the consumption loans was observed during Q3 of 2020. It is apparent that the low Labour Force Participation Rate (LFPR) and the high unemployment rate in the first half of 2020 have affected the repayment capacity of individuals and households resulting in notable NPLs. The unemployment rate of Sri Lanka increased to 5.6 per cent in the first half of 2020, compared to the unemployment rate of 4.8 per cent in the corresponding period in 2019. Meanwhile, the LFPR declined to 50.6 per cent in the first half of 2020 from 52.6 per cent in the corresponding period of the preceding year. Further, salaried employees have experienced salary reduction due to economic downturn and worsening profitability of corporates which also contributes to the lowering repayment capacity.
With a view to minimising the economic impact of the spread of COVID-19 pandemic and the resultant containment measures, the Central Bank eased monetary conditions substantially and continued an accommodative monetary policy stance thus far in 2020, supported by muted inflationary pressures and well anchored inflation expectations. Accordingly, the Central Bank has reduced the policy rates, namely, the Standing Deposit Facility Rate (SDFR) and the Standing Lending Facility Rate (SLFR), by a total of 250 basis points each to a historic low level of 4.50 per cent and 5.50 per cent, respectively, thus far in 2020. The Central Bank also reduced the Statutory Reserve Ratio (SRR) by a total of 3.00 percentage points during the year
NPLs of Selected Loan Categories of the Banking Sector
Chart 1.29
Source: Central Bank of Sri Lanka
ConsumptionLoansChart 1.30
Source: Central Bank of Sri Lanka
in two steps, in March and June, to 2.00 per cent, thus injecting a large amount of liquidity to the domestic money market. In addition, indicating the availability of emergency funding to banking institutions at reasonable interest rates, the Central Bank lowered the Bank Rate, by 500 basis points in April 2020, while allowing it to be determined automatically with a margin of 300 basis points
17 Financial System Stability Review -2020
pandemic, credit towards this sector has slightly improved.
Sector-wise credit growth is more or less affected by sectoral GDP growth of the economy, and during the Q1 2020 the agriculture and industry sectors have contracted while the services sector has reported a growth. However, in Q2 2020 all sectors indicated a contraction with a steeper contraction in the industry sector. Thereafter, in Q3 2020, all sectors improved with a growth of 4.3 per cent in the agriculture sector, 0.6 per cent in the industry sector and 2.1 per cent in the services sector.
Even though credit of the banking sector is recovering compared to 2019, credit quality continues to deteriorate despite the debt moratorium. The increasing trend of non-performing loans (NPLs) continued for all product categories during the nine months ending September 2020. Lack of economic activity leading to lowering cash flows for corporates and individuals due to the Island-wide lockdown during Q2 of 2020 was reflected by increasing NPLs. Even though a debt moratorium has been granted, businesses and individuals not qualifying for the debt moratorium may have also faced difficulties in honoring debt repayments due to reduction in income levels. Further, measures such as limiting recovery action and lowering penal interest rates were introduced as concessions for borrowers. Such concessions adversely affected the recovery process of loans of financial institutions increasing their NPL rates. Nevertheless, in Q3 2020, improvement in credit quality was observed in credit cards and pawning product categories. On the contrary, credit quality continued to decrease on leasing and hire purchase category during Q3 of 2020. After the lapse of the debt moratorium if higher NPLs are realized that will have a severe impact on financial
6 For the purpose of calculation of NPL ratio is based on the borrowing from banks and LFCs/SLCs sector, NPL is classified when a payment is not
institution’s profitability and eventually on their capital levels.
Further, increasing NPLs in household and the consumption loans was observed during Q3 of 2020. It is apparent that the low Labour Force Participation Rate (LFPR) and the high unemployment rate in the first half of 2020 have affected the repayment capacity of individuals and households resulting in notable NPLs. The unemployment rate of Sri Lanka increased to 5.6 per cent in the first half of 2020, compared to the unemployment rate of 4.8 per cent in the corresponding period in 2019. Meanwhile, the
made within 90 days from the end of the agreed due date.
Chart 1.31: NPL Ratio of the Household Sector (with IIS)6
Chart 1.30: Consumption Loans
'-
2.00
4.00
6.00
8.00
10.00
0.
425.
850.
1275.
1700.
2125.
2018-Q2 2019-Q1 2019-Q4 2020-Q3
Per c
ent
Rs b
illio
n
Consumption LoansNPL Ratio of Consumption Sector (RHS)
Source: Central Bank of Sri Lanka
9.66
12.53
20.16
0.
5.5
11.
16.5
22.
2018 Q2 2019 Q2 2020 Q2
per c
ent
Source: Central Bank of Sri Lanka
NPLRatiooftheHouseholdSector(with IIS)6
Chart 1.31
Source: Central Bank of Sri Lanka
350
280
210
140
70
0
2018
-Q2
2018
-Q3
2018
-Q4
2019
-Q1
2019
-Q2
2019
-Q3
2019
-Q4
2020
-Q1
2020
-Q2
2020
-Q3
10.0
7.5
5.0
2.5
0
Outstanding credit cards balances
Pawning facilities
Leasing and hire purchase NPL Ratio of Credit Cards (RHS)
NPL ratio of pawning facilities (RHS)
NPL ratio of leasing & hire purchase (RHS)
Rs.
bill
ion
Per
cen
t
1,800
1,600
1,400
1,200
1,000
800
600
400
200
0
2018
-Q2
2018
-Q4
2019
-Q2
2019
-Q4
2020
-Q2
9.0
8.0
7.0
6.0
5.0
4.0
3.0
2.0
1.0
Consumption Loans
NPL Ratio of Consumption Sector (RHS)
Rs.
bill
ion
Per
cen
t22.0
16.5
11.0
5.5
0
2018 Q2 2019 Q2 2020 Q2
Per
cen
t
9.66
12.53
20.16
6 For the purpose of calculation of NPL ratio is based on the borrowing from banks and LFCs/SLCs sector, NPL is classified when a payment is not made within 9 days from the end of the agreed due date.
15
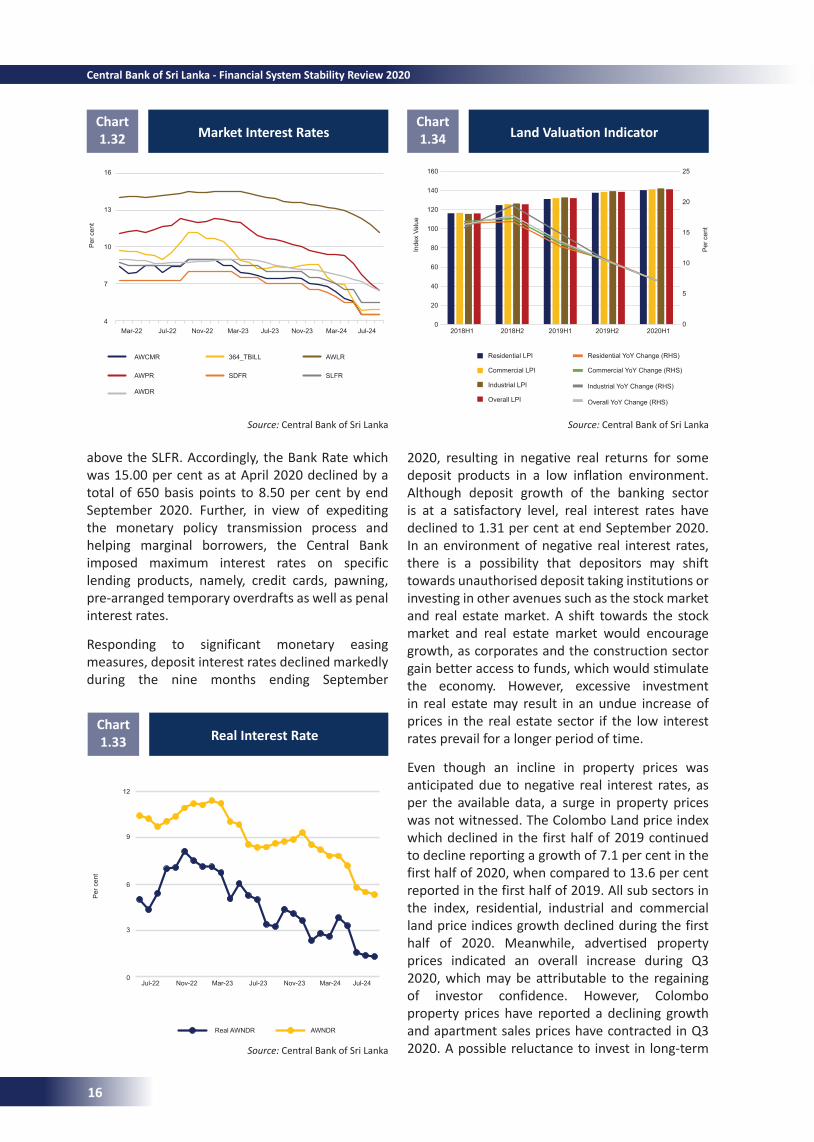
Residential LPI
Commercial LPI
Industrial LPI
Overall LPI
18 Financial System Stability Review -2020
LFPR declined to 50.6 per cent in the first half of 2020 from 52.6 per cent in the corresponding period of the preceding year. Further, salaried employees have experienced salary reduction due to economic downturn and worsening profitability of corporates which also contributes to the lowering repayment capacity.
With a view to minimising the economic impact of the spread of COVID-19 pandemic and the resultant containment measures, the Central Bank eased monetary conditions substantially and continued an accommodative monetary policy stance thus far in 2020, supported by muted
inflationary pressures and well anchored inflation expectations. Accordingly, the Central Bank has reduced the policy rates, namely, the Standing Deposit Facility Rate (SDFR) and the Standing Lending Facility Rate (SLFR), by a total of 250 basis points each to a historic low level of 4.50 per cent and 5.50 per cent, respectively, thus far in 2020. The Central Bank also reduced the Statutory Reserve Ratio (SRR) by a total of 3.00 percentage points during the year in two steps, in March and June, to
Chart 1.32: Market Interest Rates
4.0
7.0
10.0
13.0
16.0
Mar-22 Aug-22 Jan-23 Jun-23 Nov-23 Apr-24 Sept-24
Per c
ent
AWCMR 364_TBILL AWLRAWPR SDFR SLFR
Source: Central Bank of Sri Lanka
Chart 1.33: Real Interest Rate
0.0
3.0
6.0
9.0
12.0
Jul-22 Dec-22 May-23 Oct-23 Mar-24 Aug-24
Per c
ent
Real AWNDR AWNDR
Source: Central Bank of Sri Lanka
Chart 1.34: Land Valuation Indicator
0.
5.
10.
15.
20.
25.
0.0
37.5
75.0
112.5
150.0
2018H1 2018H2 2019H1 2019H2 2020H1
Per c
ent
Inde
x Va
lue
Residential LPICommercial LPIIndustrial LPIOverall LPIResidential YoY Change (RHS)Commercial YoY Change (RHS)Industrial YoY Change (RHS)Overall YoY Change (RHS)
Source: Central Bank of Sri Lanka
-20
-8
5
18
30
0.0
100.0
200.0
300.0
400.0
2018Q1
2018Q3
2019Q1
2019Q3
2020Q1
2020Q3
Per
cen
t
Rs.
mill
ion
Sri Lanka overall house sale pricesColombo Advertised House Sale PriceColombo Advertised Commercial Buildings Sale PriceSri Lanka overall house sale price growth QoQ (RHS)Colombo House Sale Price Growth QoQ (RHS)Colombo Commercial Buildings Sale Price Growth QoQ (RHS)
Chart 1.35: Advertised Property Prices – Houses and Commercial Buildings
Source: Lanka Property Web
Real Interest RateChart 1.33
LandValuationIndicatorChart 1.34
Source: Central Bank of Sri Lanka Source: Central Bank of Sri Lanka
Source: Central Bank of Sri Lanka
above the SLFR. Accordingly, the Bank Rate which was 15.00 per cent as at April 2020 declined by a total of 650 basis points to 8.50 per cent by end September 2020. Further, in view of expediting the monetary policy transmission process and helping marginal borrowers, the Central Bank imposed maximum interest rates on specific lending products, namely, credit cards, pawning, pre-arranged temporary overdrafts as well as penal interest rates.
Responding to significant monetary easing measures, deposit interest rates declined markedly during the nine months ending September
Market Interest Rates Chart 1.32
2020, resulting in negative real returns for some deposit products in a low inflation environment. Although deposit growth of the banking sector is at a satisfactory level, real interest rates have declined to 1.31 per cent at end September 2020. In an environment of negative real interest rates, there is a possibility that depositors may shift towards unauthorised deposit taking institutions or investing in other avenues such as the stock market and real estate market. A shift towards the stock market and real estate market would encourage growth, as corporates and the construction sector gain better access to funds, which would stimulate the economy. However, excessive investment in real estate may result in an undue increase of prices in the real estate sector if the low interest rates prevail for a longer period of time.
Even though an incline in property prices was anticipated due to negative real interest rates, as per the available data, a surge in property prices was not witnessed. The Colombo Land price index which declined in the first half of 2019 continued to decline reporting a growth of 7.1 per cent in the first half of 2020, when compared to 13.6 per cent reported in the first half of 2019. All sub sectors in the index, residential, industrial and commercial land price indices growth declined during the first half of 2020. Meanwhile, advertised property prices indicated an overall increase during Q3 2020, which may be attributable to the regaining of investor confidence. However, Colombo property prices have reported a declining growth and apartment sales prices have contracted in Q3 2020. A possible reluctance to invest in long-term
16
13
10
7
4Mar-22 Jul-22 Nov-22 Mar-23 Jul-23 Nov-23 Mar-24 Jul-24
AWCMR 364_TBILL AWLR
AWPR SDFR SLFR
AWDR
Per
cen
t
12
9
6
3
0Jul-22 Nov-22 Mar-23 Jul-23 Nov-23 Mar-24 Jul-24
Real AWNDR AWNDR
Per
cen
t
160
140
120
100
80
60
40
20
0
25
20
15
10
5
0
Residential YoY Change (RHS)
Commercial YoY Change (RHS)
Industrial YoY Change (RHS)
Overall YoY Change (RHS)
Inde
x Va
lue
Per
cen
t
2018H1 2018H2 2019H1 2019H2 2020H1
16
Central Bank of Sri Lanka - Financial System Stability Review 2020
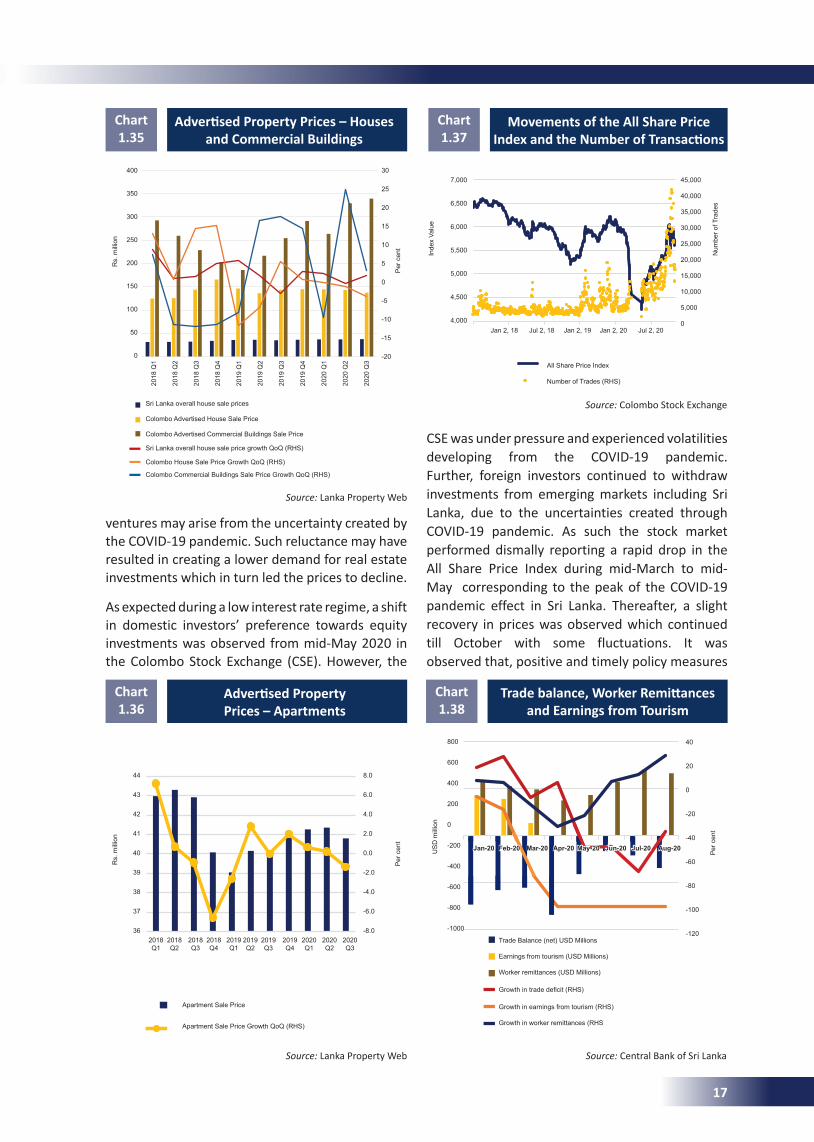
30
25
20
15
10
5
0
-5
-10
-15
-20
ventures may arise from the uncertainty created by the COVID-19 pandemic. Such reluctance may have resulted in creating a lower demand for real estate investments which in turn led the prices to decline.
As expected during a low interest rate regime, a shift in domestic investors’ preference towards equity investments was observed from mid-May 2020 in the Colombo Stock Exchange (CSE). However, the
AdvertisedPropertyPrices–Housesand Commercial Buildings
Chart 1.35
Source: Lanka Property Web
19 Financial System Stability Review -2020
2.00 per cent, thus injecting a large amount of liquidity to the domestic money market. In addition, indicating the availability of emergency funding to banking institutions at reasonable interest rates, the Central Bank lowered the Bank Rate, by 500 basis points in April 2020, while allowing it to be determined automatically with a margin of 300 basis points above the SLFR. acent as at April 2020 declined by a total of 650 basis points to 8.50 per cent by end September 2020. Further, in view of expediting the monetary policy transmission process and helping marginal borrowers, the Central Bank imposed maximum interest rates on specific lending products, namely, credit cards, pawning, pre-arranged temporary overdrafts as well as penal interest rates.
Responding to significant monetary easing measures, deposit interest rates declined markedly during the nine months ending in September 2020, resulting in negative real returns for some deposit products in a low inflation environment. Although deposit growth of the banking sector is at a satisfactory level, real interest rates have declined to 1.31 per cent at end September 2020. In an environment of negative real interest rates, there is a possibility that depositors may shift towards unauthorised deposit taking institutions or investing in other avenues such as the stock market and real estate market. A shift towards the stock market and real estate market would encourage growth, as corporates and the construction sector gain better access to funds, which would stimulate the economy. However, excessive investment in real estate may result in an undue increase of prices in the real estate sector if the low interest rates prevail for a longer period of time.
Even though an incline in property prices was anticipated due to negative real interest rates, as per the available data, a surge in property prices was not witnessed. The Colombo Land price index which declined in the first half of 2019 continued to decline reporting a growth of 7.1 per cent in the
first half of 2020, when compared to 13.6 per cent reported in the first half of 2019. All sub sectors in the index, residential, industrial and commercial land price indices growth declined during the first half of 2020. Meanwhile, advertised property prices indicated an overall increase during Q3 2020, which may be attributable to the regaining of investor confidence. However, Colombo property prices have reported a declining growth and apartment sales prices have contracted in Q3 2020. A possible reluctance to invest in long-term ventures may arise from the uncertainty created
Source: Lanka Property Web
Chart 1.36: Advertised Property
Prices – Apartments
-8.0-6.0-4.0-2.00.02.04.06.08.0
363738394041424344
2018
Q1
2018
Q2
2018
Q3
2018
Q4
2019
Q1
2019
Q2
2019
Q3
2019
Q4
2020
Q1
2020
Q2
2020
Q3
Per c
ent
Rs. m
illio
n
Apartment Sale Price
Apartment Sale Price Growth QoQ (RHS)
Chart 1.37: Movements of the All Share Price Index and the Number of Transactions
050001000015000200002500030000350004000045000
4000
4500
5000
5500
6000
6500
7000
Jan 2, 18 Jul 2, 18 Jan 2, 19 Jul 2, 19 Jan 2, 20 Jul 2, 20
Num
ber o
f Tra
des
Inde
x Val
ue
All Share Price IndexNumber of Trades (RHS)
Source: Colombo Stock Exchange
AdvertisedPropertyPrices–Apartments
Chart 1.36
Source: Lanka Property Web
19 Financial System Stability Review -2020
2.00 per cent, thus injecting a large amount of liquidity to the domestic money market. In addition, indicating the availability of emergency funding to banking institutions at reasonable interest rates, the Central Bank lowered the Bank Rate, by 500 basis points in April 2020, while allowing it to be determined automatically with a margin of 300 basis points above the SLFR. acent as at April 2020 declined by a total of 650 basis points to 8.50 per cent by end September 2020. Further, in view of expediting the monetary policy transmission process and helping marginal borrowers, the Central Bank imposed maximum interest rates on specific lending products, namely, credit cards, pawning, pre-arranged temporary overdrafts as well as penal interest rates.
Responding to significant monetary easing measures, deposit interest rates declined markedly during the nine months ending in September 2020, resulting in negative real returns for some deposit products in a low inflation environment. Although deposit growth of the banking sector is at a satisfactory level, real interest rates have declined to 1.31 per cent at end September 2020. In an environment of negative real interest rates, there is a possibility that depositors may shift towards unauthorised deposit taking institutions or investing in other avenues such as the stock market and real estate market. A shift towards the stock market and real estate market would encourage growth, as corporates and the construction sector gain better access to funds, which would stimulate the economy. However, excessive investment in real estate may result in an undue increase of prices in the real estate sector if the low interest rates prevail for a longer period of time.
Even though an incline in property prices was anticipated due to negative real interest rates, as per the available data, a surge in property prices was not witnessed. The Colombo Land price index which declined in the first half of 2019 continued to decline reporting a growth of 7.1 per cent in the
first half of 2020, when compared to 13.6 per cent reported in the first half of 2019. All sub sectors in the index, residential, industrial and commercial land price indices growth declined during the first half of 2020. Meanwhile, advertised property prices indicated an overall increase during Q3 2020, which may be attributable to the regaining of investor confidence. However, Colombo property prices have reported a declining growth and apartment sales prices have contracted in Q3 2020. A possible reluctance to invest in long-term ventures may arise from the uncertainty created
Source: Lanka Property Web
Chart 1.36: Advertised Property
Prices – Apartments
-8.0-6.0-4.0-2.00.02.04.06.08.0
363738394041424344
2018
Q1
2018
Q2
2018
Q3
2018
Q4
2019
Q1
2019
Q2
2019
Q3
2019
Q4
2020
Q1
2020
Q2
2020
Q3
Per c
ent
Rs. m
illio
n
Apartment Sale Price
Apartment Sale Price Growth QoQ (RHS)
Chart 1.37: Movements of the All Share Price Index and the Number of Transactions
050001000015000200002500030000350004000045000
4000
4500
5000
5500
6000
6500
7000
Jan 2, 18 Jul 2, 18 Jan 2, 19 Jul 2, 19 Jan 2, 20 Jul 2, 20
Num
ber o
f Tra
des
Inde
x Val
ue
All Share Price IndexNumber of Trades (RHS)
Source: Colombo Stock Exchange
Movements of the All Share Price IndexandtheNumberofTransactions
Chart 1.37
Source: Colombo Stock Exchange
CSE was under pressure and experienced volatilities developing from the COVID-19 pandemic. Further, foreign investors continued to withdraw investments from emerging markets including Sri Lanka, due to the uncertainties created through COVID-19 pandemic. As such the stock market performed dismally reporting a rapid drop in the All Share Price Index during mid-March to mid-May corresponding to the peak of the COVID-19 pandemic effect in Sri Lanka. Thereafter, a slight recovery in prices was observed which continued till October with some fluctuations. It was observed that, positive and timely policy measures
Source: Central Bank of Sri Lanka
20 Financial System Stability Review -2020
by the COVID-19 pandemic. Such reluctance may have resulted in creating a lower demand for real estate investments which in turn led the prices to decline.
As expected during a low interest rate regime, a shift in domestic investors’ preference towards equity investments was observed from mid-May 2020 in the Colombo Stock Exchange (CSE). However, the CSE was under pressure and experienced volatilities developing from the COVID-19 pandemic. Further, foreign investors continued to withdraw investments from emerging markets including Sri Lanka, due to the uncertainties created through COVID-19 pandemic. As such the stock market performed dismally reporting a rapid drop in the All Share Price Index during mid-March to mid-May7 corresponding to the peak of the COVID-19 pandemic effect in Sri Lanka. Thereafter, a slight recovery in prices was observed which continued till October with some fluctuations. It was observed that, positive and timely policy
7 The stock market was closed for 7 weeks during the period from March to May 2020 at a stretch.
measures to recover from the COVID-19 pandemic have been able to re-establish the confidence towards equity investments. However, with the resurgence of the COVID-19 outbreak, prices have indicated a downturn.
At the same time, the external sector of Sri Lanka was also affected severely by the COVID-19 pandemic at the beginning of year 2020 and gradually recovered thereafter. The trade deficit declined during the nine months ending September 2020 as merchandise imports started to decline due to disruptions in import related supply chains, economic lockdown, falling commodity prices and Government restrictions on the facilitation of motor vehicle imports and
suspending importation of non-essential consumer goods. Meanwhile, exports which initially dropped due to low global demand rebounded with time. On the contrary, the current account was severely hit by the tourism earnings
Chart 1.38: Trade balance, Worker Remittances and Earnings from Tourism
-120%
-100%
-80%
-60%
-40%
-20%
0%
20%
40%
-1000
-500
0
500
1000
Per c
ent
USD
mill
ion
Trade Balance (net)Earnings from tourismWorker remittancesGrowth in trade deficit (RHS)Growth in earnings from tourism (RHS)Growth in worker remittances (RHS)
Source: Central Bank of Sri Lanka
Chart 1.39: Foreign Investments in CSE and Government Securities Market
-1000
-800
-600
-400
-200
0
200
-300-250-200-150-100
-500
50100
Jan-
19M
ar-1
9
May
-19
Jul-1
9Se
p-19
Nov-
19Ja
n-20
Mar
-20
May
-20
Jul-2
0Se
p-20
USD
mill
ion
USD
mill
ion
Foreign investments in G-SecForeign investments in CSECumulative foreign G-Sec (RHS)Cumulative foreign investments in CSE (RHS)
Source: Central Bank of Sri Lanka
Tradebalance,WorkerRemittancesand Earnings from Tourism
Chart 1.38
Rs.
mill
ion
US
D m
illio
n
Per
cen
t
Inde
x Va
lue
Num
ber o
f Tra
des
Per
cen
t
Per
cen
t
2018Q1
2018Q2
2018Q3
2018Q4
2019Q1
2019Q2
2019Q3
2019Q4
2020Q1
2020Q2
2020Q3
44
43
42
41
40
39
38
37
36
8.0
6.0
4.0
2.0
0.0
-2.0
-4.0
-6.0
-8.0
Apartment Sale Price
Apartment Sale Price Growth QoQ (RHS)
7,000
6,500
6,000
5,500
5,000
4,500
4,000Jan 2, 18 Jul 2, 18 Jan 2, 19 Jan 2, 20 Jul 2, 20
45,000
40,000
35,000
30,000
25,000
20,000
15,000
10,000
5,000
0
All Share Price Index Number of Trades (RHS)
800
600
400
200
0
-200
-400
-600
-800
-1000
Jan-20 Feb-20 Mar-20 Apr-20 May-20 Jun-20 Jul-20 Aug-20
40
20
0
-20
-40
-60
-80
-100
-120
Rs.
mill
ion
400
350
300
250
200
150
100
50
0
2018
Q1
2018
Q2
2018
Q3
2018
Q4
2019
Q1
2019
Q2
2019
Q3
2019
Q4
2020
Q1
2020
Q2
2020
Q3
Sri Lanka overall house sale prices
Colombo Advertised House Sale Price
Colombo Advertised Commercial Buildings Sale Price
Sri Lanka overall house sale price growth QoQ (RHS)
Colombo House Sale Price Growth QoQ (RHS)
Colombo Commercial Buildings Sale Price Growth QoQ (RHS)
Trade Balance (net) USD Millions
Earnings from tourism (USD Millions)
Worker remittances (USD Millions)
Growth in trade deficit (RHS)
Growth in earnings from tourism (RHS)
Growth in worker remittances (RHS
17
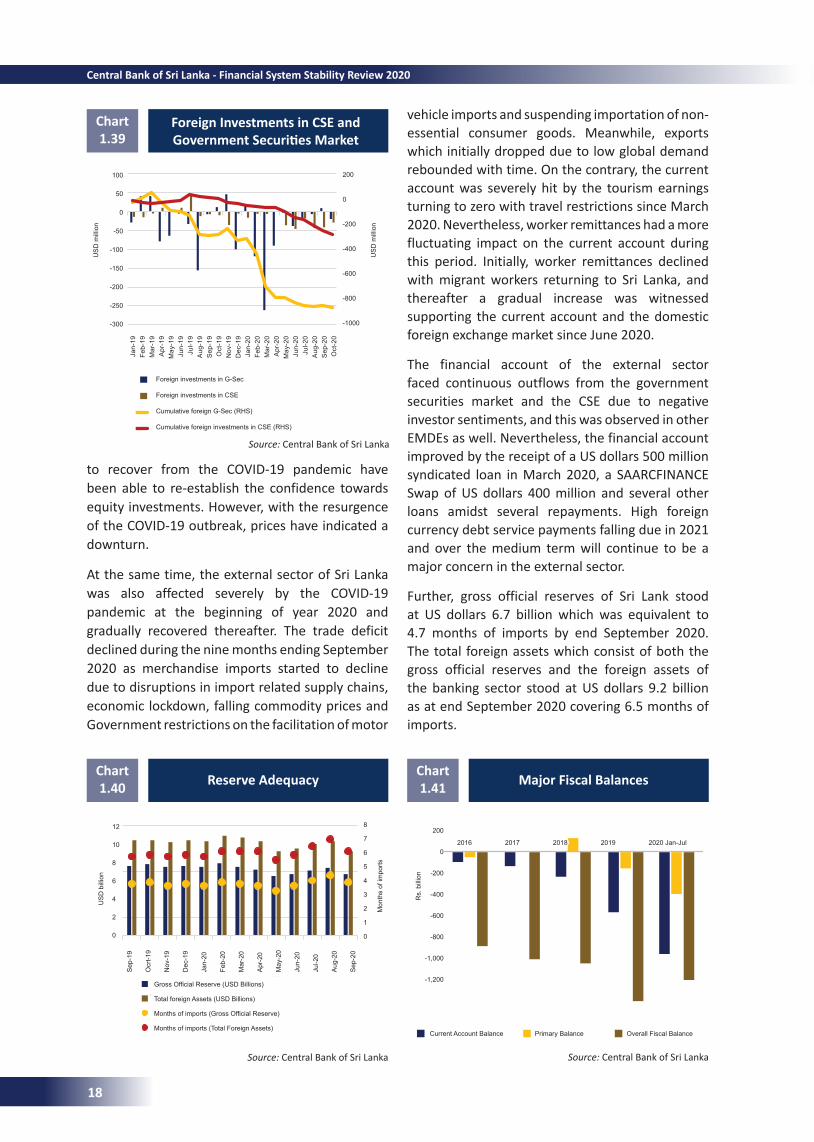
20 Financial System Stability Review -2020
by the COVID-19 pandemic. Such reluctance may have resulted in creating a lower demand for real estate investments which in turn led the prices to decline.
As expected during a low interest rate regime, a shift in domestic investors’ preference towards equity investments was observed from mid-May 2020 in the Colombo Stock Exchange (CSE). However, the CSE was under pressure and experienced volatilities developing from the COVID-19 pandemic. Further, foreign investors continued to withdraw investments from emerging markets including Sri Lanka, due to the uncertainties created through COVID-19 pandemic. As such the stock market performed dismally reporting a rapid drop in the All Share Price Index during mid-March to mid-May7 corresponding to the peak of the COVID-19 pandemic effect in Sri Lanka. Thereafter, a slight recovery in prices was observed which continued till October with some fluctuations. It was observed that, positive and timely policy
7 The stock market was closed for 7 weeks during the period from March to May 2020 at a stretch.
measures to recover from the COVID-19 pandemic have been able to re-establish the confidence towards equity investments. However, with the resurgence of the COVID-19 outbreak, prices have indicated a downturn.
At the same time, the external sector of Sri Lanka was also affected severely by the COVID-19 pandemic at the beginning of year 2020 and gradually recovered thereafter. The trade deficit declined during the nine months ending September 2020 as merchandise imports started to decline due to disruptions in import related supply chains, economic lockdown, falling commodity prices and Government restrictions on the facilitation of motor vehicle imports and
suspending importation of non-essential consumer goods. Meanwhile, exports which initially dropped due to low global demand rebounded with time. On the contrary, the current account was severely hit by the tourism earnings
Chart 1.38: Trade balance, Worker Remittances and Earnings from Tourism
-120%
-100%
-80%
-60%
-40%
-20%
0%
20%
40%
-1000
-500
0
500
1000
Per c
ent
USD
mill
ion
Trade Balance (net)Earnings from tourismWorker remittancesGrowth in trade deficit (RHS)Growth in earnings from tourism (RHS)Growth in worker remittances (RHS)
Source: Central Bank of Sri Lanka
Chart 1.39: Foreign Investments in CSE and Government Securities Market
-1000
-800
-600
-400
-200
0
200
-300-250-200-150-100
-500
50100
Jan-
19M
ar-1
9
May
-19
Jul-1
9Se
p-19
Nov-
19Ja
n-20
Mar
-20
May
-20
Jul-2
0Se
p-20
USD
mill
ion
USD
mill
ion
Foreign investments in G-SecForeign investments in CSECumulative foreign G-Sec (RHS)Cumulative foreign investments in CSE (RHS)
Source: Central Bank of Sri Lanka
Foreign Investments in CSE and GovernmentSecuritiesMarket
Chart 1.39
Source: Central Bank of Sri Lanka
21 Financial System Stability Review -2020
turning to zero with travel restrictions since March 2020. Nevertheless, worker remittances had a more fluctuating impact on the current account during this period. Initially, worker remittances declined with migrant workers returning to Sri Lanka, and thereafter a gradual increase was witnessed supporting the current account and the domestic foreign exchange market since June 2020.
The financial account of the external sector faced continuous outflows from the government securities market and the CSE due to negative investor sentiments, and this was observed in other EMDEs as well. Nevertheless, the financial account improved by the receipt of a US dollars 500 million syndicated loan in March 2020, a SAARCFINANCE Swap of US dollars 400 million and
several other loans amidst several repayments.
High foreign currency debt service payments falling due in 2021 and over the medium term will continue to be a major concern in the external sector.
Further, gross official reserves of Sri Lank stood at US dollars 6.7 billion which was equivalent to 4.7 months of imports by end September 2020. The total foreign assets which consist of both the gross official reserves and the foreign assets of the banking sector stood at US dollars 9.2 billion as at end September 2020 covering 6.5 months of imports.
As the government expenditure increased beyond the moderated government revenue, all fiscal balances weakened notably during the seven months ending July 2020. Subsequent to the presidential election, tax concessions granted to stimulate economic activities resulted in moderated government revenue. Thereafter, in 2020 a myriad of concessions on tax was granted due to the COVID-19 pandemic which aggravated the declining government revenue. Further, a notable
increase in recurrent expenditure was observed on subsidies and transfers during the seven months ending July 2020. Nonetheless, as new capital projects were not implemented during this
Chart 1.40: Reserve Adequacy
0
2
4
6
8
-3
2
7
12
Sep-
19Oc
t-19
Nov-
19De
c-19
Jan-
20Fe
b-20
Mar
-20
Apr-2
0M
ay-2
0Ju
n-20
Jul-2
0Au
g-20
Sep-
20
Mon
ths o
f Im
port
s
USD
billi
on
Gross Official Reserve (USD Billions)Total foreign Assets (USD Billions)Months of imports (Gross Official Reserve)Months of imports (Total Foreign Assets)
Source: Central Bank of Sri Lanka
Chart 1.41: Major Fiscal Balances
-1,200
-1,000
-800
-600
-400
-200
0
200
2016 2017 2018 2019 2020 Jan-Jul
Rs. b
illio
n
Current Account Balance Primary Balance
Source: Central Bank of Sri Lanka
Chart 1.42: Total Outstanding Domestic and Foreign Debt
0.02.04.06.08.0
10.012.014.016.0
Rs.
trilli
on
Total Domestic Debt Total Foreign Debt
Source: Central Bank of Sri Lanka
Reserve AdequacyChart 1.40
Source: Central Bank of Sri Lanka
to recover from the COVID-19 pandemic have been able to re-establish the confidence towards equity investments. However, with the resurgence of the COVID-19 outbreak, prices have indicated a downturn.
At the same time, the external sector of Sri Lanka was also affected severely by the COVID-19 pandemic at the beginning of year 2020 and gradually recovered thereafter. The trade deficit declined during the nine months ending September 2020 as merchandise imports started to decline due to disruptions in import related supply chains, economic lockdown, falling commodity prices and Government restrictions on the facilitation of motor
vehicle imports and suspending importation of non-essential consumer goods. Meanwhile, exports which initially dropped due to low global demand rebounded with time. On the contrary, the current account was severely hit by the tourism earnings turning to zero with travel restrictions since March 2020. Nevertheless, worker remittances had a more fluctuating impact on the current account during this period. Initially, worker remittances declined with migrant workers returning to Sri Lanka, and thereafter a gradual increase was witnessed supporting the current account and the domestic foreign exchange market since June 2020.
The financial account of the external sector faced continuous outflows from the government securities market and the CSE due to negative investor sentiments, and this was observed in other EMDEs as well. Nevertheless, the financial account improved by the receipt of a US dollars 500 million syndicated loan in March 2020, a SAARCFINANCE Swap of US dollars 400 million and several other loans amidst several repayments. High foreign currency debt service payments falling due in 2021 and over the medium term will continue to be a major concern in the external sector.
Further, gross official reserves of Sri Lank stood at US dollars 6.7 billion which was equivalent to 4.7 months of imports by end September 2020. The total foreign assets which consist of both the gross official reserves and the foreign assets of the banking sector stood at US dollars 9.2 billion as at end September 2020 covering 6.5 months of imports.
Major Fiscal BalancesChart 1.41
Source: Central Bank of Sri Lanka
100
50
0
-50
-100
-150
-200
-250
-300
Jan-
19Fe
b-19
Mar
-19
Apr
-19
May
-19
Jun-
19Ju
l-19
Aug
-19
Sep
-19
Oct
-19
Nov
-19
Dec
-19
Jan-
20Fe
b-20
Mar
-20
Apr
-20
May
-20
Jun-
20Ju
l-20
Aug
-20
Sep
-20
Oct
-20
200
0
-200
-400
-600
-800
-1000
Foreign investments in G-Sec
Foreign investments in CSE
Cumulative foreign G-Sec (RHS)
Cumulative foreign investments in CSE (RHS)
US
D m
illio
n
US
D m
illio
n
12
10
8
6
4
2
0
Sep
-19
Ocr
t-19
Nov
-19
Dec
-19
Jan-
20
Feb-
20
Mar
-20
Apr
-20
May
-20
Jun-
20
Jul-2
0
Aug
-20
Sep
-20
8
7
6
5
4
3
2
1
0
Gross Official Reserve (USD Billions)
Total foreign Assets (USD Billions)
Months of imports (Gross Official Reserve)
Months of imports (Total Foreign Assets)
US
D b
illio
n
Rs.
bill
ion
Mon
ths
of im
ports
200
0
-200
-400
-600
-800
-1,000
-1,200
Current Account Balance Primary Balance Overall Fiscal Balance
2016 2017 2018 2019 2020 Jan-Jul
18
Central Bank of Sri Lanka - Financial System Stability Review 2020
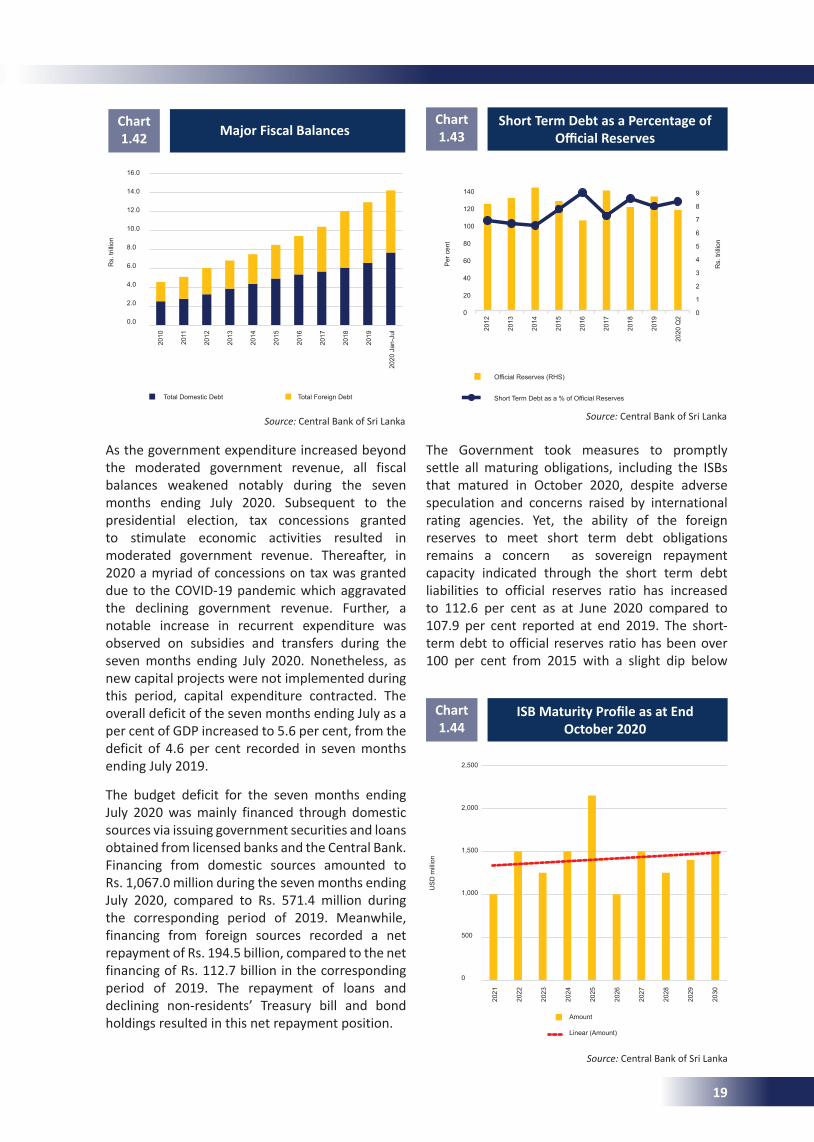
As the government expenditure increased beyond the moderated government revenue, all fiscal balances weakened notably during the seven months ending July 2020. Subsequent to the presidential election, tax concessions granted to stimulate economic activities resulted in moderated government revenue. Thereafter, in 2020 a myriad of concessions on tax was granted due to the COVID-19 pandemic which aggravated the declining government revenue. Further, a notable increase in recurrent expenditure was observed on subsidies and transfers during the seven months ending July 2020. Nonetheless, as new capital projects were not implemented during this period, capital expenditure contracted. The overall deficit of the seven months ending July as a per cent of GDP increased to 5.6 per cent, from the deficit of 4.6 per cent recorded in seven months ending July 2019.
The budget deficit for the seven months ending July 2020 was mainly financed through domestic sources via issuing government securities and loans obtained from licensed banks and the Central Bank. Financing from domestic sources amounted to Rs. 1,067.0 million during the seven months ending July 2020, compared to Rs. 571.4 million during the corresponding period of 2019. Meanwhile, financing from foreign sources recorded a net repayment of Rs. 194.5 billion, compared to the net financing of Rs. 112.7 billion in the corresponding period of 2019. The repayment of loans and declining non-residents’ Treasury bill and bond holdings resulted in this net repayment position.
21 Financial System Stability Review -2020
turning to zero with travel restrictions since March 2020. Nevertheless, worker remittances had a more fluctuating impact on the current account during this period. Initially, worker remittances declined with migrant workers returning to Sri Lanka, and thereafter a gradual increase was witnessed supporting the current account and the domestic foreign exchange market since June 2020.
The financial account of the external sector faced continuous outflows from the government securities market and the CSE due to negative investor sentiments, and this was observed in other EMDEs as well. Nevertheless, the financial account improved by the receipt of a US dollars 500 million syndicated loan in March 2020, a SAARCFINANCE Swap of US dollars 400 million and
several other loans amidst several repayments.
High foreign currency debt service payments falling due in 2021 and over the medium term will continue to be a major concern in the external sector.
Further, gross official reserves of Sri Lank stood at US dollars 6.7 billion which was equivalent to 4.7 months of imports by end September 2020. The total foreign assets which consist of both the gross official reserves and the foreign assets of the banking sector stood at US dollars 9.2 billion as at end September 2020 covering 6.5 months of imports.
As the government expenditure increased beyond the moderated government revenue, all fiscal balances weakened notably during the seven months ending July 2020. Subsequent to the presidential election, tax concessions granted to stimulate economic activities resulted in moderated government revenue. Thereafter, in 2020 a myriad of concessions on tax was granted due to the COVID-19 pandemic which aggravated the declining government revenue. Further, a notable
increase in recurrent expenditure was observed on subsidies and transfers during the seven months ending July 2020. Nonetheless, as new capital projects were not implemented during this
Chart 1.40: Reserve Adequacy
0
2
4
6
8
-3
2
7
12
Sep-
19Oc
t-19
Nov-
19De
c-19
Jan-
20Fe
b-20
Mar
-20
Apr-2
0M
ay-2
0Ju
n-20
Jul-2
0Au
g-20
Sep-
20
Mon
ths o
f Im
port
s
USD
billi
on
Gross Official Reserve (USD Billions)Total foreign Assets (USD Billions)Months of imports (Gross Official Reserve)Months of imports (Total Foreign Assets)
Source: Central Bank of Sri Lanka
Chart 1.41: Major Fiscal Balances
-1,200
-1,000
-800
-600
-400
-200
0
200
2016 2017 2018 2019 2020 Jan-Jul
Rs. b
illio
n
Current Account Balance Primary Balance
Source: Central Bank of Sri Lanka
Chart 1.42: Total Outstanding Domestic and Foreign Debt
0.02.04.06.08.0
10.012.014.016.0
Rs.
trilli
on
Total Domestic Debt Total Foreign Debt
Source: Central Bank of Sri Lanka
Major Fiscal BalancesChart 1.42
Source: Central Bank of Sri Lanka Source: Central Bank of Sri Lanka
22 Financial System Stability Review -2020
period, capital expenditure contracted. The overall deficit of the seven months ending July as
a per cent of GDP increased to 5.6 per cent, from the deficit of 4.6 per cent recorded in seven months ending July 2019.
The budget deficit for the seven months ending July 2020 was mainly financed through domestic sources via issuing government securities and loans obtained from licensed banks and the Central Bank. Financing from domestic sources amounted to Rs. 1,067.0 million during the seven months ending July 2020, compared to Rs. 571.4 million during the corresponding period of 2019. Meanwhile, financing from foreign sources recorded a net repayment of Rs. 194.5 billion, compared to the net financing of Rs. 112.7 billion in the corresponding period of 2019. The repayment of loans and declining non-residents’ Treasury bill and bond holdings resulted in this net repayment position.
The Government took measures to promptly settle all maturing obligations, including the ISBs that matured in October 2020, despite adverse speculation and concerns raised by international rating agencies. Yet, the ability of the foreign reserves to meet short term debt obligations remains a concern as sovereign repayment
8 For analysis purposes, the risk premium is calculated based on the difference between ten
capacity indicated through the short term debt liabilities to official reserves ratio has increased to 112.6 per cent as at June 2020 compared to 107.9 per cent reported at end 2019. The short-term debt to official reserves ratio has been over 100 per cent from 2015 with a slight dip below 100 per cent in year 2017. This ratio being above 100 per cent indicates that either the sovereign repayment capacity of Sri Lanka or reserves needs a considerable improvement.
The risk premium8 has been in a rising trend from beginning of 2020 as the yield of Sri Lankan ISBs increased with the declining US Treasury yield. Towards the end of Q1 2020, the yield of Sri Lankan ISBs sky rocketed with the negative market sentiments caused by the COVID-19 pandemic and peaked in mid-May 2020. However, thereafter with positive policy stimuli the yields came down till September 2020. At this point, Moody’s downgraded Sri Lanka’s rating two notches down from B2 to Caa1 on 28 September 2020, mainly citing wide budget deficit, external sector exposure and weakening institutions and governance. Further, in November 2020, Fitch Ratings downgraded Sri Lanka’s rating to CCC from
year US Treasury yields and the ten year Sri Lankan ISB yields.
Chart 1.44: ISB Maturity Profile as at End October 2020
-
500
1,000
1,500
2,000
2,500
2021202220232024202520262027202820292030
USD
mill
ion
AmountLinear (Amount )
Source: Central Bank of Sri Lanka
Chart 1.43: Short Term Debt as a Percentage of Official Reserves
0123456789
020406080
100120140
Rs. t
rillio
n
Per c
ent
Official Reserves (RHS)
Short Term Debt as a % of Offical Reserves
Source: Central Bank of Sri Lanka
Short Term Debt as a Percentage of OfficialReserves
Chart 1.43
The Government took measures to promptly settle all maturing obligations, including the ISBs that matured in October 2020, despite adverse speculation and concerns raised by international rating agencies. Yet, the ability of the foreign reserves to meet short term debt obligations remains a concern as sovereign repayment capacity indicated through the short term debt liabilities to official reserves ratio has increased to 112.6 per cent as at June 2020 compared to 107.9 per cent reported at end 2019. The short-term debt to official reserves ratio has been over 100 per cent from 2015 with a slight dip below
Source: Central Bank of Sri Lanka
22 Financial System Stability Review -2020
period, capital expenditure contracted. The overall deficit of the seven months ending July as
a per cent of GDP increased to 5.6 per cent, from the deficit of 4.6 per cent recorded in seven months ending July 2019.
The budget deficit for the seven months ending July 2020 was mainly financed through domestic sources via issuing government securities and loans obtained from licensed banks and the Central Bank. Financing from domestic sources amounted to Rs. 1,067.0 million during the seven months ending July 2020, compared to Rs. 571.4 million during the corresponding period of 2019. Meanwhile, financing from foreign sources recorded a net repayment of Rs. 194.5 billion, compared to the net financing of Rs. 112.7 billion in the corresponding period of 2019. The repayment of loans and declining non-residents’ Treasury bill and bond holdings resulted in this net repayment position.
The Government took measures to promptly settle all maturing obligations, including the ISBs that matured in October 2020, despite adverse speculation and concerns raised by international rating agencies. Yet, the ability of the foreign reserves to meet short term debt obligations remains a concern as sovereign repayment
8 For analysis purposes, the risk premium is calculated based on the difference between ten
capacity indicated through the short term debt liabilities to official reserves ratio has increased to 112.6 per cent as at June 2020 compared to 107.9 per cent reported at end 2019. The short-term debt to official reserves ratio has been over 100 per cent from 2015 with a slight dip below 100 per cent in year 2017. This ratio being above 100 per cent indicates that either the sovereign repayment capacity of Sri Lanka or reserves needs a considerable improvement.
The risk premium8 has been in a rising trend from beginning of 2020 as the yield of Sri Lankan ISBs increased with the declining US Treasury yield. Towards the end of Q1 2020, the yield of Sri Lankan ISBs sky rocketed with the negative market sentiments caused by the COVID-19 pandemic and peaked in mid-May 2020. However, thereafter with positive policy stimuli the yields came down till September 2020. At this point, Moody’s downgraded Sri Lanka’s rating two notches down from B2 to Caa1 on 28 September 2020, mainly citing wide budget deficit, external sector exposure and weakening institutions and governance. Further, in November 2020, Fitch Ratings downgraded Sri Lanka’s rating to CCC from
year US Treasury yields and the ten year Sri Lankan ISB yields.
Chart 1.44: ISB Maturity Profile as at End October 2020
-
500
1,000
1,500
2,000
2,500
2021202220232024202520262027202820292030
USD
mill
ion
AmountLinear (Amount )
Source: Central Bank of Sri Lanka
Chart 1.43: Short Term Debt as a Percentage of Official Reserves
0123456789
020406080
100120140
Rs. t
rillio
n
Per c
ent
Official Reserves (RHS)
Short Term Debt as a % of Offical Reserves
Source: Central Bank of Sri Lanka
ISBMaturityProfileasatEndOctober 2020
Chart 1.44
Rs.
trill
ion
US
D m
illio
n
Per
cen
t
Rs.
trill
ion
16.0
14.0
12.0
10.0
8.0
6.0
4.0
2.0
0.0
2010
2011
2012
2013
2014
2015
2016
2017
2018
2019
2020
Jan
-Jul
Total Domestic Debt Total Foreign Debt
Official Reserves (RHS)
Short Term Debt as a % of Official Reserves
140
120
100
80
60
40
20
0
2012
2013
2014
2015
2016
2017
2018
2019
2020
Q2
9
8
7
6
5
4
3
2
1
0
2,500
2,000
1,500
1,000
500
0
2021
2022
2023
2024
2025
2026
2027
2028
2029
2030
Amount
Linear (Amount)
19
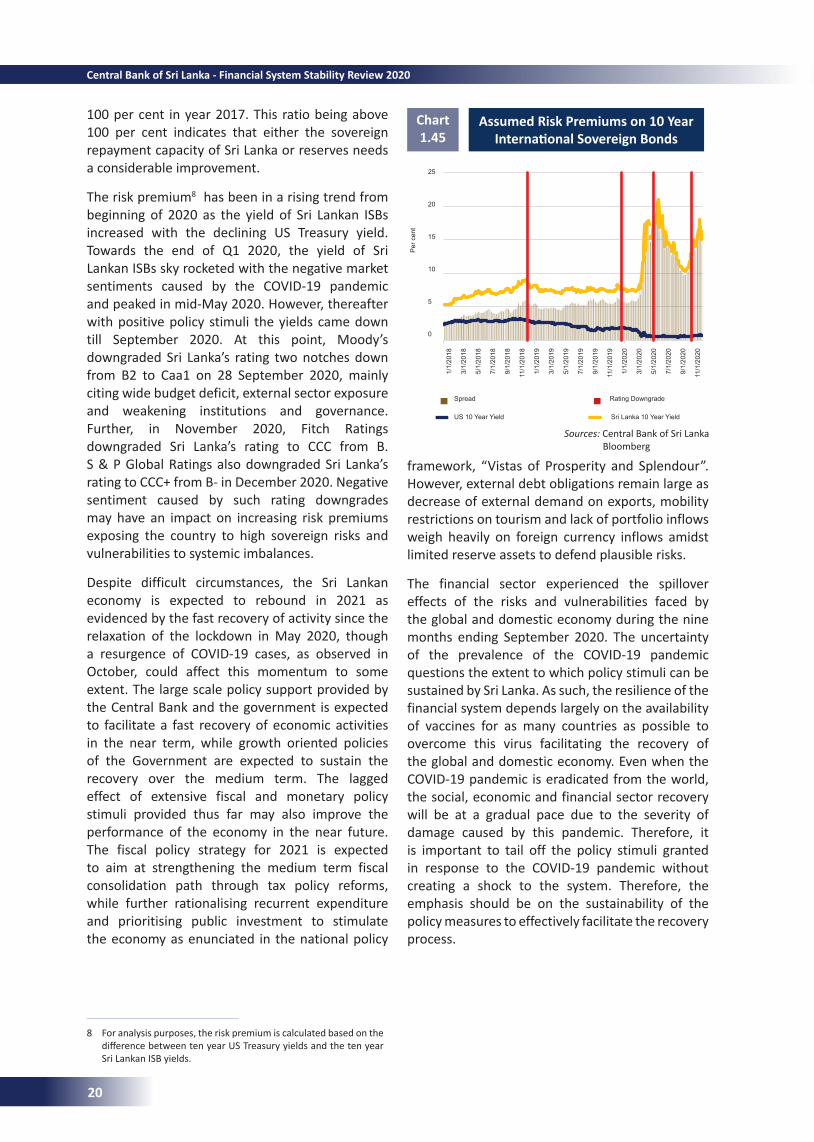
Assumed Risk Premiums on 10 Year InternationalSovereignBonds
Chart 1.45
23 Financial System Stability Review -2020
B. S & P Global Ratings also downgraded Sri Lanka’s rating to CCC+ from B- in December 2020. Negative sentiment caused by such rating downgrades may have an impact on increasing risk premiums exposing the country to high sovereign risks and vulnerabilities to systemic imbalances.
Despite difficult circumstances, the Sri Lankan economy is expected to rebound in 2021 as evidenced by the fast recovery of activity since the relaxation of the lockdown in May 2020, though a resurgence of COVID-19 cases, as observed in October, could affect this momentum to some extent. The large scale policy support provided by the Central Bank and the government is expected to facilitate a fast recovery of economic activities in the near term, while growth oriented policies of the Government are expected to sustain the recovery over the medium term. The lagged effect of extensive fiscal and monetary policy stimuli provided thus far may also improve the performance of the economy in the near future. The fiscal policy strategy for 2021 is expected to aim at strengthening the medium term fiscal consolidation path through tax policy reforms, while further rationalising recurrent expenditure and prioritising public investment to stimulate the economy as enunciated in the national policy framework, “Vistas of Prosperity
and Splendour”. However, external debt obligations remain large as decrease of external demand on exports, mobility restrictions on tourism and lack of portfolio inflows weigh heavily on foreign currency inflows amidst limited reserve assets to defend plausible risks.
The financial sector experienced the spillover effects of the risks and vulnerabilities faced by the global and domestic economy during the nine months ending September 2020. The uncertainty of the prevalence of the COVID-19 pandemic questions the extent to which policy stimuli can be sustained by Sri Lanka. As such, the resilience of the financial system depends largely on the availability of vaccines for as many countries as possible to overcome this virus facilitating the recovery of the global and domestic economy. Even when the COVID-19 pandemic is eradicated from the world, the social, economic and financial sector recovery will be at a gradual pace due to the severity of damage caused by this pandemic. Therefore, it is important to tail off the policy stimuli granted in response to the COVID-19 pandemic without creating a shock to the system. Therefore, the emphasis should be on the sustainability of the policy measures to effectively facilitate the recovery process.
Chart 1.45: Assumed Risk Premiums on 10 Year International Sovereign Bonds
0
5
10
15
20
25
1/1/2018 1/1/2019 1/1/2020
Per c
ent
Spread Rating DowngradeUS 10 Year Yield Sri Lanka 10 Year Yield
Source: Central Bank of Sri Lanka
8 For analysis purposes, the risk premium is calculated based on the difference between ten year US Treasury yields and the ten year Sri Lankan ISB yields.
Sources: Central Bank of Sri Lanka Bloomberg
100 per cent in year 2017. This ratio being above 100 per cent indicates that either the sovereign repayment capacity of Sri Lanka or reserves needs a considerable improvement.
The risk premium8 has been in a rising trend from beginning of 2020 as the yield of Sri Lankan ISBs increased with the declining US Treasury yield. Towards the end of Q1 2020, the yield of Sri Lankan ISBs sky rocketed with the negative market sentiments caused by the COVID-19 pandemic and peaked in mid-May 2020. However, thereafter with positive policy stimuli the yields came down till September 2020. At this point, Moody’s downgraded Sri Lanka’s rating two notches down from B2 to Caa1 on 28 September 2020, mainly citing wide budget deficit, external sector exposure and weakening institutions and governance. Further, in November 2020, Fitch Ratings downgraded Sri Lanka’s rating to CCC from B. S & P Global Ratings also downgraded Sri Lanka’s rating to CCC+ from B- in December 2020. Negative sentiment caused by such rating downgrades may have an impact on increasing risk premiums exposing the country to high sovereign risks and vulnerabilities to systemic imbalances.
Despite difficult circumstances, the Sri Lankan economy is expected to rebound in 2021 as evidenced by the fast recovery of activity since the relaxation of the lockdown in May 2020, though a resurgence of COVID-19 cases, as observed in October, could affect this momentum to some extent. The large scale policy support provided by the Central Bank and the government is expected to facilitate a fast recovery of economic activities in the near term, while growth oriented policies of the Government are expected to sustain the recovery over the medium term. The lagged effect of extensive fiscal and monetary policy stimuli provided thus far may also improve the performance of the economy in the near future. The fiscal policy strategy for 2021 is expected to aim at strengthening the medium term fiscal consolidation path through tax policy reforms, while further rationalising recurrent expenditure and prioritising public investment to stimulate the economy as enunciated in the national policy
framework, “Vistas of Prosperity and Splendour”. However, external debt obligations remain large as decrease of external demand on exports, mobility restrictions on tourism and lack of portfolio inflows weigh heavily on foreign currency inflows amidst limited reserve assets to defend plausible risks.
The financial sector experienced the spillover effects of the risks and vulnerabilities faced by the global and domestic economy during the nine months ending September 2020. The uncertainty of the prevalence of the COVID-19 pandemic questions the extent to which policy stimuli can be sustained by Sri Lanka. As such, the resilience of the financial system depends largely on the availability of vaccines for as many countries as possible to overcome this virus facilitating the recovery of the global and domestic economy. Even when the COVID-19 pandemic is eradicated from the world, the social, economic and financial sector recovery will be at a gradual pace due to the severity of damage caused by this pandemic. Therefore, it is important to tail off the policy stimuli granted in response to the COVID-19 pandemic without creating a shock to the system. Therefore, the emphasis should be on the sustainability of the policy measures to effectively facilitate the recovery process.
25
20
15
10
5
0
1/1/
2018
3/1/
2018
5/1/
2018
7/1/
2018
9/1/
2018
11/1
/201
8
1/1/
2019
3/1/
2019
5/1/
2019
7/1/
2019
9/1/
2019
11/1
/201
9
1/1/
2020
3/1/
2020
5/1/
2020
7/1/
2020
9/1/
2020
11/1
/202
0
US 10 Year Yield Sri Lanka 10 Year Yield
Per
cen
t
Spread Rating Downgrade
20
Central Bank of Sri Lanka - Financial System Stability Review 2020
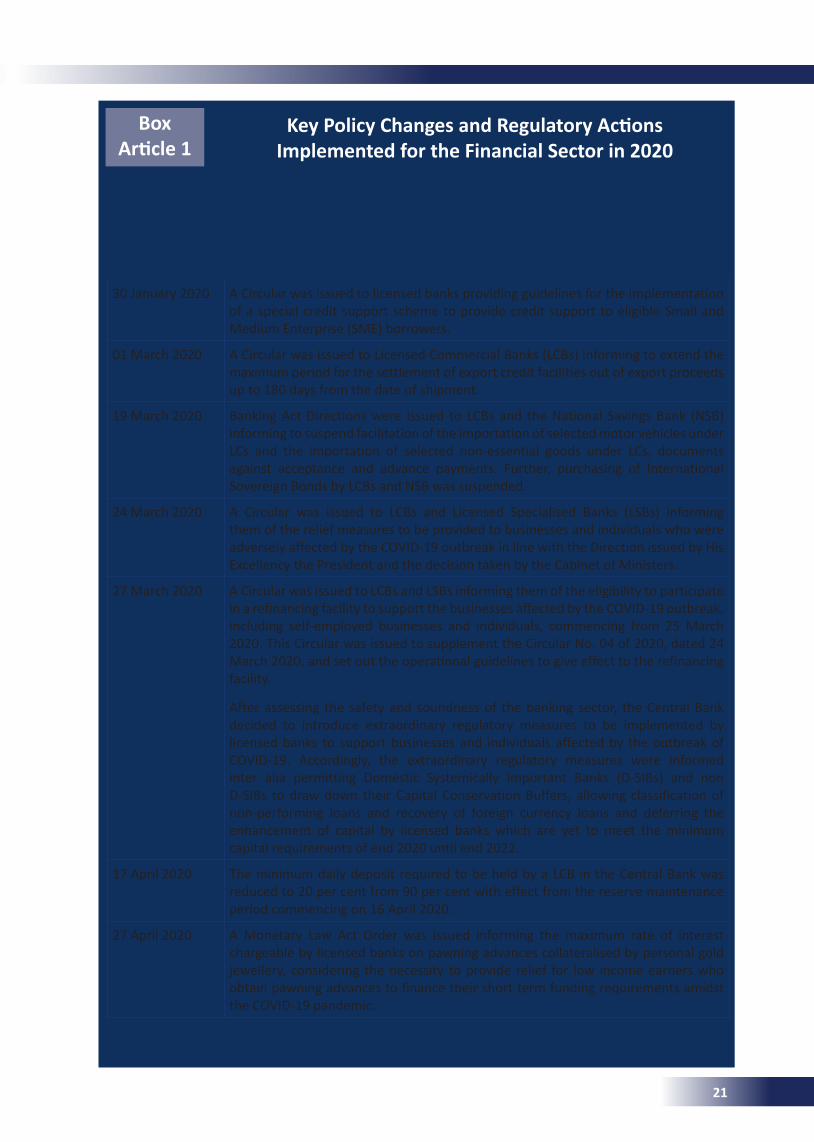
Box Article1
KeyPolicyChangesandRegulatoryActionsImplemented for the Financial Sector in 2020
FinancialInstitutionsLicensed Banks
30 January 2020 A Circular was issued to licensed banks providing guidelines for the implementation of a special credit support scheme to provide credit support to eligible Small and Medium Enterprise (SME) borrowers.
01 March 2020 A Circular was issued to Licensed Commercial Banks (LCBs) informing to extend the maximum period for the settlement of export credit facilities out of export proceeds up to 180 days from the date of shipment.
19 March 2020 Banking Act Directions were issued to LCBs and the National Savings Bank (NSB) informing to suspend facilitation of the importation of selected motor vehicles under LCs and the importation of selected non-essential goods under LCs, documents against acceptance and advance payments. Further, purchasing of International Sovereign Bonds by LCBs and NSB was suspended.
24 March 2020 A Circular was issued to LCBs and Licensed Specialised Banks (LSBs) informing them of the relief measures to be provided to businesses and individuals who were adversely affected by the COVID-19 outbreak in line with the Direction issued by His Excellency the President and the decision taken by the Cabinet of Ministers.
27 March 2020 A Circular was issued to LCBs and LSBs informing them of the eligibility to participate in a refinancing facility to support the businesses affected by the COVID-19 outbreak, including self-employed businesses and individuals, commencing from 25 March 2020. This Circular was issued to supplement the Circular No. 04 of 2020, dated 24 March 2020, and set out the operational guidelines to give effect to the refinancing facility.
After assessing the safety and soundness of the banking sector, the Central Bank decided to introduce extraordinary regulatory measures to be implemented by licensed banks to support businesses and individuals affected by the outbreak of COVID-19. Accordingly, the extraordinary regulatory measures were informed inter alia permitting Domestic Systemically Important Banks (D-SIBs) and non D-SIBs to draw down their Capital Conservation Buffers, allowing classification of non-performing loans and recovery of foreign currency loans and deferring the enhancement of capital by licensed banks which are yet to meet the minimum capital requirements of end 2020 until end 2022.
17 April 2020 The minimum daily deposit required to be held by a LCB in the Central Bank was reduced to 20 per cent from 90 per cent with effect from the reserve maintenance period commencing on 16 April 2020.
27 April 2020 A Monetary Law Act Order was issued informing the maximum rate of interest chargeable by licensed banks on pawning advances collateralised by personal gold jewellery, considering the necessity to provide relief for low income earners who obtain pawning advances to finance their short term funding requirements amidst the COVID-19 pandemic.
21
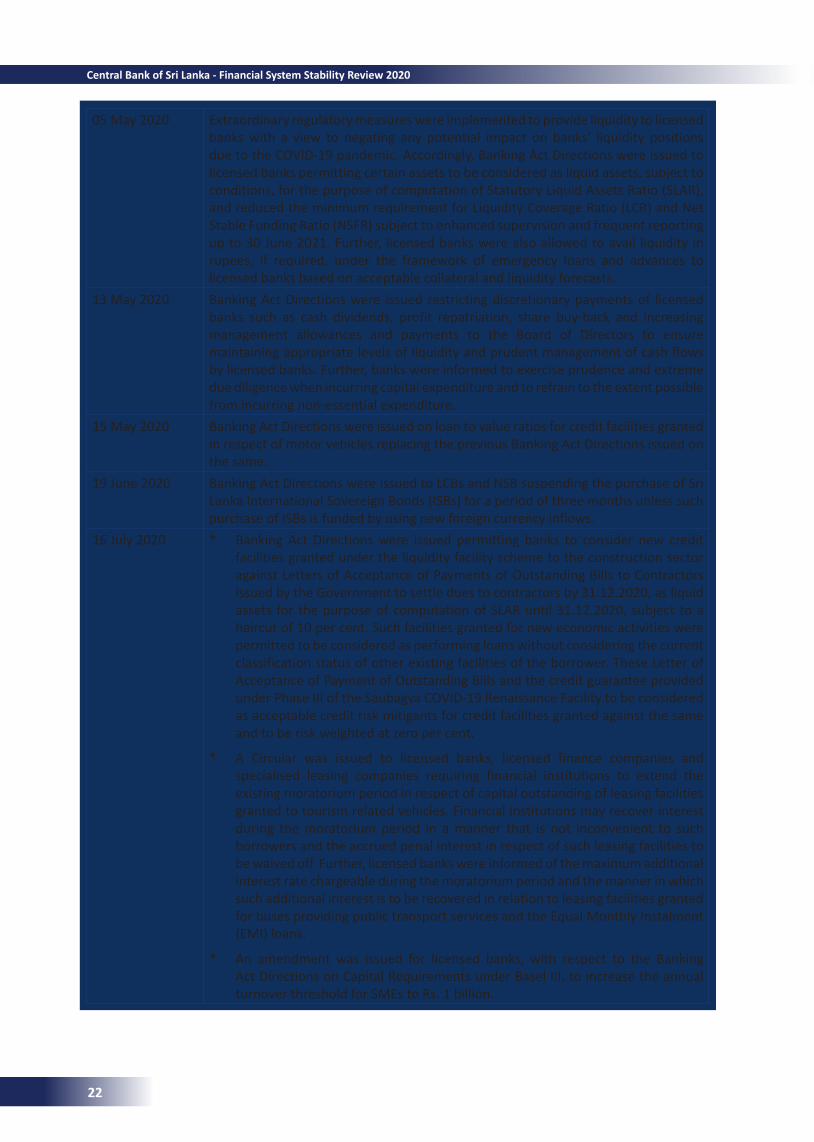
05 May 2020 Extraordinary regulatory measures were implemented to provide liquidity to licensed banks with a view to negating any potential impact on banks’ liquidity positions due to the COVID-19 pandemic. Accordingly, Banking Act Directions were issued to licensed banks permitting certain assets to be considered as liquid assets, subject to conditions, for the purpose of computation of Statutory Liquid Assets Ratio (SLAR), and reduced the minimum requirement for Liquidity Coverage Ratio (LCR) and Net Stable Funding Ratio (NSFR) subject to enhanced supervision and frequent reporting up to 30 June 2021. Further, licensed banks were also allowed to avail liquidity in rupees, if required, under the framework of emergency loans and advances to licensed banks based on acceptable collateral and liquidity forecasts.
13 May 2020 Banking Act Directions were issued restricting discretionary payments of licensed banks such as cash dividends, profit repatriation, share buy-back and increasing management allowances and payments to the Board of Directors to ensure maintaining appropriate levels of liquidity and prudent management of cash flows by licensed banks. Further, banks were informed to exercise prudence and extreme due diligence when incurring capital expenditure and to refrain to the extent possible from incurring non-essential expenditure.
15 May 2020 Banking Act Directions were issued on loan to value ratios for credit facilities granted in respect of motor vehicles replacing the previous Banking Act Directions issued on the same.
19 June 2020 Banking Act Directions were issued to LCBs and NSB suspending the purchase of Sri Lanka International Sovereign Bonds (ISBs) for a period of three months unless such purchase of ISBs is funded by using new foreign currency inflows.
16 July 2020 * Banking Act Directions were issued permitting banks to consider new credit facilities granted under the liquidity facility scheme to the construction sector against Letters of Acceptance of Payments of Outstanding Bills to Contractors issued by the Government to settle dues to contractors by 31.12.2020, as liquid assets for the purpose of computation of SLAR until 31.12.2020, subject to a haircut of 10 per cent. Such facilities granted for new economic activities were permitted to be considered as performing loans without considering the current classification status of other existing facilities of the borrower. These Letter of Acceptance of Payment of Outstanding Bills and the credit guarantee provided under Phase III of the Saubagya COVID-19 Renaissance Facility to be considered as acceptable credit risk mitigants for credit facilities granted against the same and to be risk weighted at zero per cent.
* A Circular was issued to licensed banks, licensed finance companies and specialised leasing companies requiring financial institutions to extend the existing moratorium period in respect of capital outstanding of leasing facilities granted to tourism related vehicles. Financial institutions may recover interest during the moratorium period in a manner that is not inconvenient to such borrowers and the accrued penal interest in respect of such leasing facilities to be waived off. Further, licensed banks were informed of the maximum additional interest rate chargeable during the moratorium period and the manner in which such additional interest is to be recovered in relation to leasing facilities granted for buses providing public transport services and the Equal Monthly Instalment (EMI) loans.
* An amendment was issued for licensed banks, with respect to the Banking Act Directions on Capital Requirements under Basel III, to increase the annual turnover threshold for SMEs to Rs. 1 billion.
22
Central Bank of Sri Lanka - Financial System Stability Review 2020
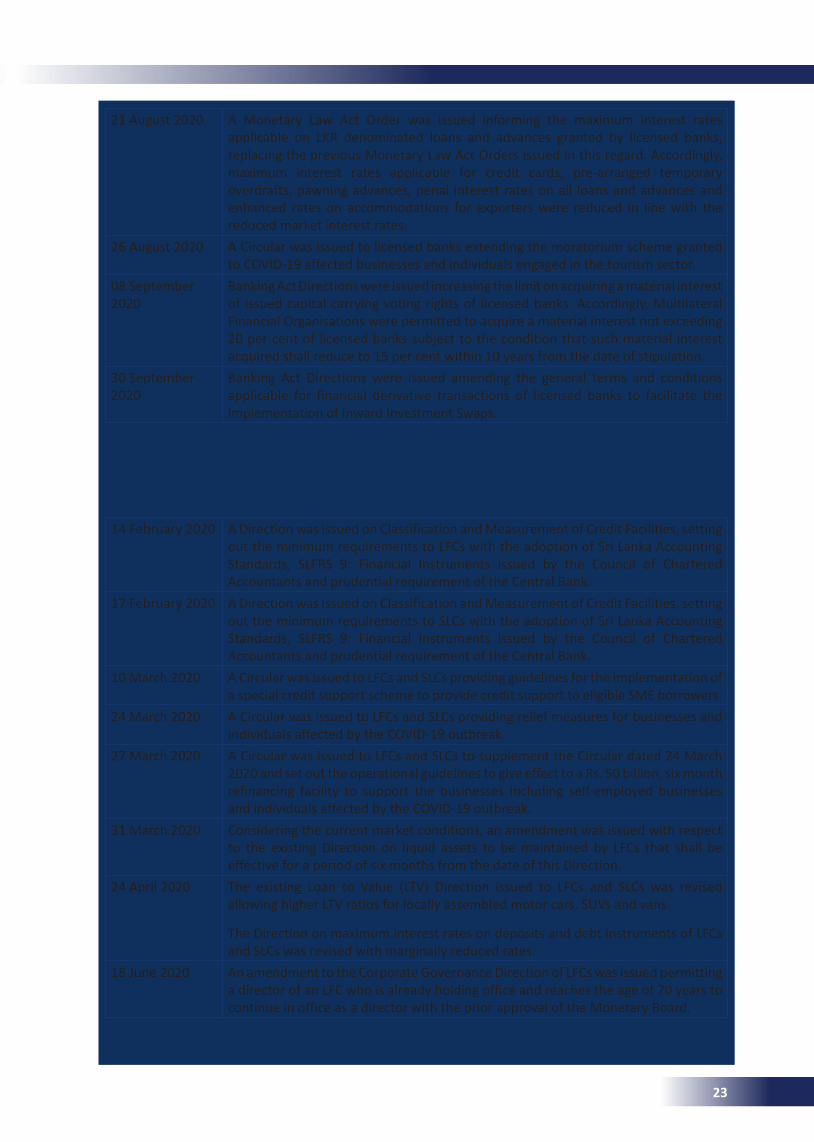
21 August 2020 A Monetary Law Act Order was issued informing the maximum interest rates applicable on LKR denominated loans and advances granted by licensed banks, replacing the previous Monetary Law Act Orders issued in this regard. Accordingly, maximum interest rates applicable for credit cards, pre-arranged temporary overdrafts, pawning advances, penal interest rates on all loans and advances and enhanced rates on accommodations for exporters were reduced in line with the reduced market interest rates.
26 August 2020 A Circular was issued to licensed banks extending the moratorium scheme granted to COVID-19 affected businesses and individuals engaged in the tourism sector.
08 September 2020
Banking Act Directions were issued increasing the limit on acquiring a material interest of issued capital carrying voting rights of licensed banks. Accordingly, Multilateral Financial Organisations were permitted to acquire a material interest not exceeding 20 per cent of licensed banks subject to the condition that such material interest acquired shall reduce to 15 per cent within 10 years from the date of stipulation.
30 September 2020
Banking Act Directions were issued amending the general terms and conditions applicable for financial derivative transactions of licensed banks to facilitate the implementation of Inward Investment Swaps.
14 February 2020 A Direction was issued on Classification and Measurement of Credit Facilities, setting out the minimum requirements to LFCs with the adoption of Sri Lanka Accounting Standards, SLFRS 9: Financial Instruments issued by the Council of Chartered Accountants and prudential requirement of the Central Bank.
17 February 2020 A Direction was issued on Classification and Measurement of Credit Facilities, setting out the minimum requirements to SLCs with the adoption of Sri Lanka Accounting Standards, SLFRS 9: Financial Instruments issued by the Council of Chartered Accountants and prudential requirement of the Central Bank.
10 March 2020 A Circular was issued to LFCs and SLCs providing guidelines for the implementation of a special credit support scheme to provide credit support to eligible SME borrowers.
24 March 2020 A Circular was issued to LFCs and SLCs providing relief measures for businesses and individuals affected by the COVID-19 outbreak.
27 March 2020 A Circular was issued to LFCs and SLCs to supplement the Circular dated 24 March 2020 and set out the operational guidelines to give effect to a Rs. 50 billion, six month refinancing facility to support the businesses including self-employed businesses and individuals affected by the COVID-19 outbreak.
31 March 2020 Considering the current market conditions, an amendment was issued with respect to the existing Direction on liquid assets to be maintained by LFCs that shall be effective for a period of six months from the date of this Direction.
24 April 2020 The existing Loan to Value (LTV) Direction issued to LFCs and SLCs was revised allowing higher LTV ratios for locally assembled motor cars, SUVs and vans.
The Direction on maximum interest rates on deposits and debt instruments of LFCs and SLCs was revised with marginally reduced rates.
18 June 2020 An amendment to the Corporate Governance Direction of LFCs was issued permitting a director of an LFC who is already holding office and reaches the age of 70 years to continue in office as a director with the prior approval of the Monetary Board.
Licensed Finance Companies (LFCs) and Specialised Leasing Companies (SLCs)
23
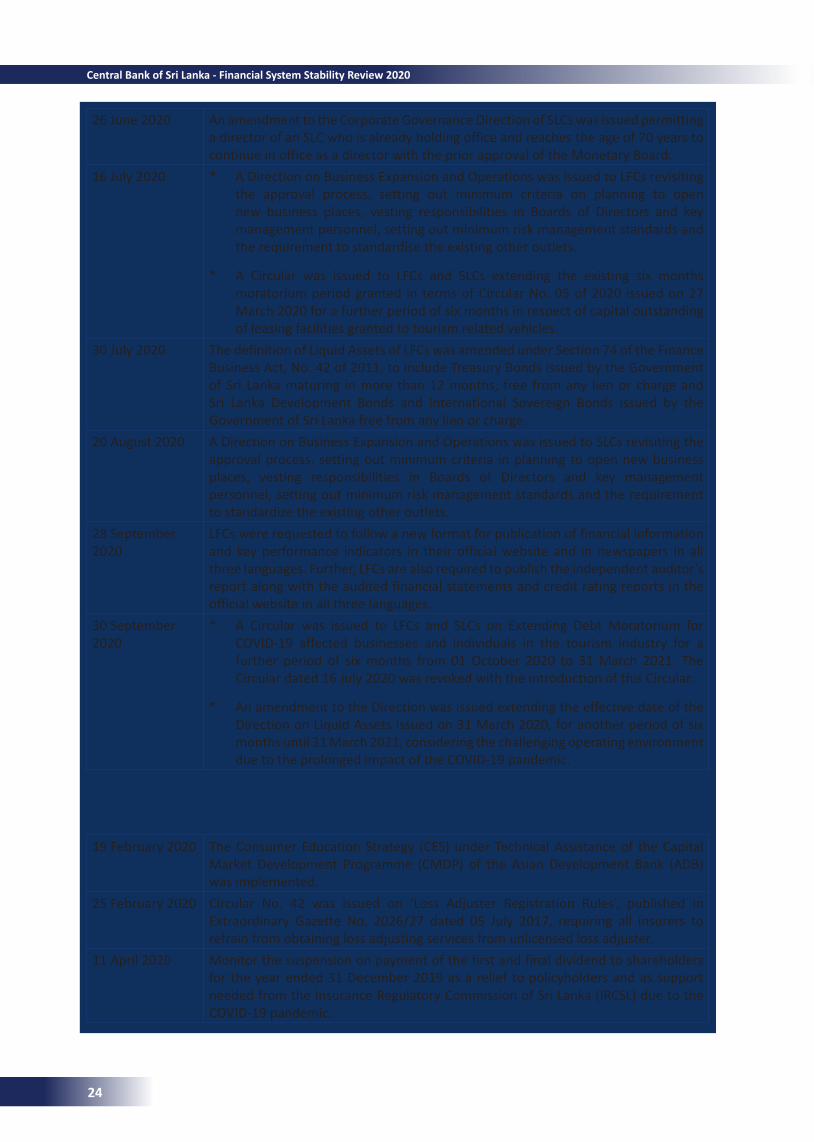
26 June 2020 An amendment to the Corporate Governance Direction of SLCs was issued permitting a director of an SLC who is already holding office and reaches the age of 70 years to continue in office as a director with the prior approval of the Monetary Board.
16 July 2020 * A Direction on Business Expansion and Operations was issued to LFCs revisiting the approval process, setting out minimum criteria on planning to open new business places, vesting responsibilities in Boards of Directors and key management personnel, setting out minimum risk management standards and the requirement to standardise the existing other outlets.
* A Circular was issued to LFCs and SLCs extending the existing six months moratorium period granted in terms of Circular No. 05 of 2020 issued on 27 March 2020 for a further period of six months in respect of capital outstanding of leasing facilities granted to tourism related vehicles.
30 July 2020 The definition of Liquid Assets of LFCs was amended under Section 74 of the Finance Business Act, No. 42 of 2011, to include Treasury Bonds issued by the Government of Sri Lanka maturing in more than 12 months, free from any lien or charge and Sri Lanka Development Bonds and International Sovereign Bonds issued by the Government of Sri Lanka free from any lien or charge.
20 August 2020 A Direction on Business Expansion and Operations was issued to SLCs revisiting the approval process, setting out minimum criteria in planning to open new business places, vesting responsibilities in Boards of Directors and key management personnel, setting out minimum risk management standards and the requirement to standardize the existing other outlets.
28 September 2020
LFCs were requested to follow a new format for publication of financial information and key performance indicators in their official website and in newspapers in all three languages. Further, LFCs are also required to publish the independent auditor’s report along with the audited financial statements and credit rating reports in the official website in all three languages.
30 September 2020
* A Circular was issued to LFCs and SLCs on Extending Debt Moratorium for COVID-19 affected businesses and individuals in the tourism industry for a further period of six months from 01 October 2020 to 31 March 2021. The Circular dated 16 July 2020 was revoked with the introduction of this Circular.
* An amendment to the Direction was issued extending the effective date of the Direction on Liquid Assets issued on 31 March 2020, for another period of six months until 31 March 2021, considering the challenging operating environment due to the prolonged impact of the COVID-19 pandemic.
19 February 2020 The Consumer Education Strategy (CES) under Technical Assistance of the Capital Market Development Programme (CMDP) of the Asian Development Bank (ADB) was implemented.
25 February 2020 Circular No. 42 was issued on ‘Loss Adjuster Registration Rules’, published in Extraordinary Gazette No. 2026/27 dated 05 July 2017, requiring all insurers to refrain from obtaining loss adjusting services from unlicensed loss adjuster.
11 April 2020 Monitor the suspension on payment of the first and final dividend to shareholders for the year ended 31 December 2019 as a relief to policyholders and as support needed from the Insurance Regulatory Commission of Sri Lanka (IRCSL) due to the COVID-19 pandemic.
Insurance
24
Central Bank of Sri Lanka - Financial System Stability Review 2020
Other relief measures related to the COVID-19 pandemic:
* For policies underwritten from 01 March 2020 to 30 June 2020, permit Long Term and General Insurance Companies to consider the premium receivables outstanding for 90 days for solvency purposes, subject to specific confirmation given by the principal officer of the company.
* Closely monitor ‘Monthly Certification/ Reporting of Risk Based Capital Adequacy Requirements (e.g. Capital Adequacy Ratio (CAR), Total Available Capital (TAC) and Risk Capital Requirement (RCR) and Determination 01 Compliance for Long Term and General Insurance Businesses’ from the month ended 31 March 2020 provided by the principal officer.
* Oversee whether Long Term and General insurance companies use the Risk Free Interest Rate (RFR) as per the Rules gazetted in 2015 to compute Solvency.
* Further, the IRCSL will consider negative impacts to the solvency and Determination- 01 due to the COVID-19 pandemic and on extended credit granted on payment of premium, on a case by case basis.
03 June 2020 Direction No. 19 on ‘Compliance with Minimum Net Capital Requirement’ was amended to address enforcement action that would be taken by the IRCSL when brokering companies take extensive periods of time to meet net capital requirement.
08 June 2020 Direction No. 17 on Corporate Governance Framework for insurance companies was amended considering the views obtained from the Insurance Association of Sri Lanka (IASL) and a few insurers.
02 July 2020 A Circular was issued mandating all insurers to issue policies in Sinhala, Tamil and English to ensure comprehension of policy terms and conditions by policyholders.
30 January 2020 Standing Deposit Facility Rate (SDFR) and Standing Lending Facility Rate (SLFR) were reduced by 50 basis points to 6.50 per cent and 7.50 per cent, respectively.
17 March 2020 * SDFR and SLFR were reduced by 25 basis points to 6.25 per cent and 7.25 per cent, respectively.
* Statutory Reserve Ratio (SRR) applicable on all rupee deposit liabilities of Licensed Commercial Banks (LCBs) was reduced by 1.00 percentage point to 4.00 per cent from 5.00 per cent with effect from the reserve maintenance period commencing on 16 March 2020.
03 April 2020 SDFR and SLFR were reduced by 25 basis points to 6.00 per cent and 7.00 per cent, respectively, with effect from the close of business on 03 April 2020.
16 April 2020 Bank Rate was reduced by 500 basis points to 10.00 per cent and allowed to automatically adjust in line with SLFR, with a margin of +300 basis points.
06 May 2020 SDFR and SLFR were reduced by 50 basis points to 5.50 per cent and 6.50 per cent, respectively, with effect from the close of business on 06 May 2020. Bank Rate was automatically reduced to 9.50 per cent from 10.00 per cent.
Financial MarketsMoney Market
25
01 January 2020 Actions were taken to record relevant information (including settlement value, price and interest rate) of the transactions in the Scripless Securities Settlement System (SSSS) to capture more attributes of transactions carried out in the government securities market (secondary market).
29 March 2020 Actions were taken to facilitate Treasury bill subscription by the Central Bank to cover any shortfall arising at weekly Treasury bill auctions.
06 May 2020 * Measures were taken to publish the maximum yield rate for acceptance for all maturities offered at Treasury bill and Treasury bond auctions until the financial markets return to normalcy.
* Activation of the Phase III of Treasury bond auction system was temporarily halted until normal procedures of the auction are reintroduced once the market returns to normalcy.
Government SecuritiesMarket
Capital Market
16 June 2020 SRR applicable on all rupee deposit liabilities of LCBs was reduced by 2.00 percentage points to 2.00 per cent while till cash contribution to SRR was reduced to 1.00 per cent from 2.0 per cent (only 1 per cent over and above the 2 per cent of the currency notes and coins shall be considered as a part of its reserves) with effect from the reserve maintenance period commencing on 16 June 2020.
09 July 2020 SDFR and SLFR were reduced by 100 basis points to 4.50 per cent and 5.50 per cent, respectively, with effect from the close of business on 09 July 2020. Bank Rate was automatically reduced to 8.50 per cent from 9.50 per cent.
31 March 2020 With a view to granting relief to investors affected by the market downturn caused by the COVID-19 pandemic, all registered Margin Providers/Licensed Stockbrokers were directed to pass on the benefit derived from the decisions announced by the Central Bank to their clients and were directed to refrain from charging and recovering interest on credit extended to their clients until 30 June 2020. Further, all registered Margin Providers/Licensed Stockbrokers were required to act in the best interest of and in a manner equitable to all clients in carrying out functions.
30 April 2020 - The timeframe for submission of reports by licensed/registered entities was extended due to the COVID-19 pandemic as follows:
* The due date for the submission of the Unaudited Financial Statements, the Compliance Officers’ Reports and the Unit Trust Returns for the months of March, April and May 2020 was extended by a period of three weeks from the stipulated time frame.
* The due date for submission of Audited Financial Statements was extended by a period of two months from the stipulated time frame for financial years ending 31 December 2019 and 31 March 2020, respectively.
* The submission of Annual and Interim Reports for Unit Trust Funds was extended by a period of two months from the stipulated time frame.
26
Central Bank of Sri Lanka - Financial System Stability Review 2020

* The licensed/registered entities were advised to diligently monitor their risk profile and resources during the pandemic period to ensure safety and soundness of the industry.
* Notwithstanding the above extensions of the timeframe, the entities were requested to promptly report to the Securities and Exchange Commission (SEC) regarding any exceptional matters which adversely affect or is likely to adversely affect the ability of such entities to meet their obligations in respect of their licensed or registered business or any matter, which may indicate that the financial standing or financial integrity of such entity or its Chief Executive Officer (CEO) or directors or the key management personnel is in question or may reasonably be affected.
- A deferment of the SEC’s annual licensing/registration fees for the year 2020 was granted on the core regulated activity of all licensed/registered entities by a period one year upon a request being made.
- The condition to fulfill the mandatory Continuous Professional Development (CPD) requirement to transfer all Investment Advisors from the previous Qualification Framework (QF) to the new QF was extended by six months (until 30 June 2021).
- All Investment Advisors, who are required to obtain a minimum of two CPD seminar credits for the renewal of license of their respective Stockbroker/Dealer company, where such date of renewal falls within March to September 2020, were granted an extension of six months from the date of the due date for renewal in order to meet the aforesaid CPD requirement.
28 May 2020 Amendments were introduced to the Colombo Stock Exchange (CSE) Rules to facilitate the conducting of all core activities digitally.
11 June 2020 * The Empower Board-Listing rule revision was implemented. The segment of rules that required immediate attention has been completed. As part of the continuous improvement process, the others are under review to ascertain whether urgent changes are required, particularly, to minimise regulatory burden to the listed entities impacted by the COVID-19 pandemic.
* A regulatory paper was submitted on multi-currency debt listing by local entities.
15 July 2020 Real Estate Investment Trusts (SL-REITs) were introduced.
20 January 2020 General Direction No. 1 of 2020 on fees chargeable on the transactions effected through the Common ATM Switch was issued replacing General Direction No. 1 of 2014 to include maximum fees that can be charged for ATM transactions carried out using payment cards issued under the National Card Scheme.
14 May 2020 Payment and Settlement Systems Circular No. 13 of 2020 was issued to mandate licensed commercial banks incorporated in Sri Lanka and operators of mobile phone based e-money systems joining LANKAQR as issuers and acquirers in order to promote LANKAQR for retail payments.
01 June 2020 Guideline No. 01/2020 on minimum compliance standard for payment related mobile applications was issued replacing the Guideline No. 01/2018 in order to update the Guidelines to cover new developments in payment related mobile applications.
Financial InfrastructurePaymentsandSettlements
27
05 February 2020 Guideline No. 1 of 2020 was issued on scenario based LankaFIN reporting for LFCs, insurance companies and stock broker companies.
10 June 2020 Guideline No. 2 of 2020 was issued on Anti-Money Laundering and Countering the Financing of Terrorism Compliance Obligations for Accountants and Trusts or Company Service Providers.
15 June 2020 Circular No. 03 of 2020 was issued to Financial Institutions advising to be vigilant to emerging Money Laundering/Terrorist Financing risks.
22 October 2020 Guideline No. 3 of 2020 was issued on Non-Face-to-Face Customer Identification and Verification Using Electronic Interface Provided by the Department for Registration of Persons
Anti-MoneyLaunderingandCounteringtheFinancingofTerrorism
19 March 2020 Direction No. 01 of 2020 was issued to Authorised Dealers (ADs) informing them to limit the release of foreign currency notes up to USD 5,000 or its equivalent in other foreign currency (from the previously permitted foreign currency travel allowance of USD 10,000) to persons resident in Sri Lanka travelling abroad for any purpose including for leisure, business, training, medical treatment etc.
20 March 2020 * Direction No. 02 of 2020 was issued to ADs requesting them to suspend the release of foreign exchange, for a period of three months with immediate effect, for the importation of certain non essential consumer goods under Documents Against Payments and Open Account Payment terms in line with the Banking Act Directions issued on curtailing certain imports and foreign currency investments.
* Sell-Buy Forex SWAP Auctions were introduced to fulfill the FX liquidity requirement in the domestic foreign exchange market to manage the excessive volatility in the exchange rate.
02 April 2020 Extraordinary Gazette Notification No. 2169/3 was issued to impose certain measures on outward remittances on Capital Transactions for a period of three months with a view to minimising the pressure on the exchange rate and possible negative impact of the economy.
* Suspending the general permission granted to make outward remittances for investments overseas through the Outward Investment Accounts by persons resident in Sri Lanka excluding the following:
a) investment to be financed out of a foreign currency loan obtained by the investor from a person resident outside Sri Lanka under the provisions of Foreign Exchange Act, or
b) investment to be made to fulfill the regulatory requirement in that country.
Foreign Exchange Market
08 June 2020 Payment and Settlement Systems Circular No. 16 of 2020 on maximum limits on transaction value and fees of Common Electronic Fund Transfer Switch (CEFTS) was issued to include procedure for determining maximum per transaction value limits for CEFTS transactions carried out through LankaPay Online Payment Platform.
17 September 2020
Payment and Settlement Systems Circular No. 18 of 2020 was issued to revise the transaction fees of LankaSettle System and to extend the cut-off time for accepting customer transactions.
28
Central Bank of Sri Lanka - Financial System Stability Review 2020
* Suspending the outward remittances through Business Foreign Currency Accounts (BFCAs) or Personal Foreign Currency Accounts (PFCAs) held by persons in, or resident in, Sri Lanka, other than for the remittances on current transactions.
* Suspending the repatriation of funds under the migration allowance through Capital Transactions Rupee Accounts (CTRAs) by the emigrants who have already claimed migration allowance.
* Limiting the eligible migration allowance for the emigrants who are claiming the migration allowance for the first time up to a maximum of USD 30,000.
* Limiting the authority of the Monetary Board of the Central Bank to grant special permission for investment on a case by case basis, which exceeds the limits specified in the general permission, only to those satisfying the criteria mentioned in (a) and (b) above.
03 April 2020 Directions No. 03 of 2020 were issued to ADs informing them to recover any foreign currency loans granted to holders of BFCAs in Sri Lanka Rupees, when recovery of such loans in foreign currency is remote, as a last resort by converting such loans to Sri Lanka Rupee denominated loans, where necessary.
08 April 2020 Extraordinary Gazette Notification No. 2170/4 was issued to introduce a Special Deposit Account (SDA) for any Sri Lankan individual resident in or outside Sri Lanka including Dual Citizens, Citizens of other States with Sri Lankan origin and any person resident outside Sri Lanka including funds, corporate bodies, associations and other well-wishers.
09 April 2020 Directions No. 04 of 2020 were issued to ADs specifying the criteria of opening and maintaining SDAs and permitted debits and credits.
16 April 2020 Directions No. 05 of 2020 were issued to ADs informing, loans granted to Sri Lankans employed abroad to be recovered in Sri Lanka Rupees, as a last resort, where necessary, when recovery of such loans in foreign currency is remote.
01 July 2020 * Extraordinary Gazette Notification No. 2182/33 was issued to increase the amount of foreign currency that can be retained by a person in, or resident in Sri Lanka in his possession up to USD 15,000 from the previously permitted amount of USD 10,000.
* Extraordinary Gazette Notification No. 2182/32 was issued to expand the sources of funding of SDAs, while permitting SDA holders to obtain loans from ADs against SDAs.
02 July 2020 Extraordinary Gazette Notification No. 2182/37 was issued, with the expiration of Extraordinary Gazette Notification No. 2169/3, to impose new measures on outward remittances on Capital Transactions for a period of six months.
* Suspending the general permission granted to make outward remittances for investments overseas through the Outward Investment Accounts by persons resident in Sri Lanka excluding the following:
a) investments to be financed out of foreign currency loans obtained by the investor from a person resident outside Sri Lanka under the provisions of the Foreign Exchange Act, No. 12 of 2017,
b) an additional investment to be made to fulfill the regulatory requirement in the investee’s country applicable on the investment already made in a company or a branch office in that country,
29
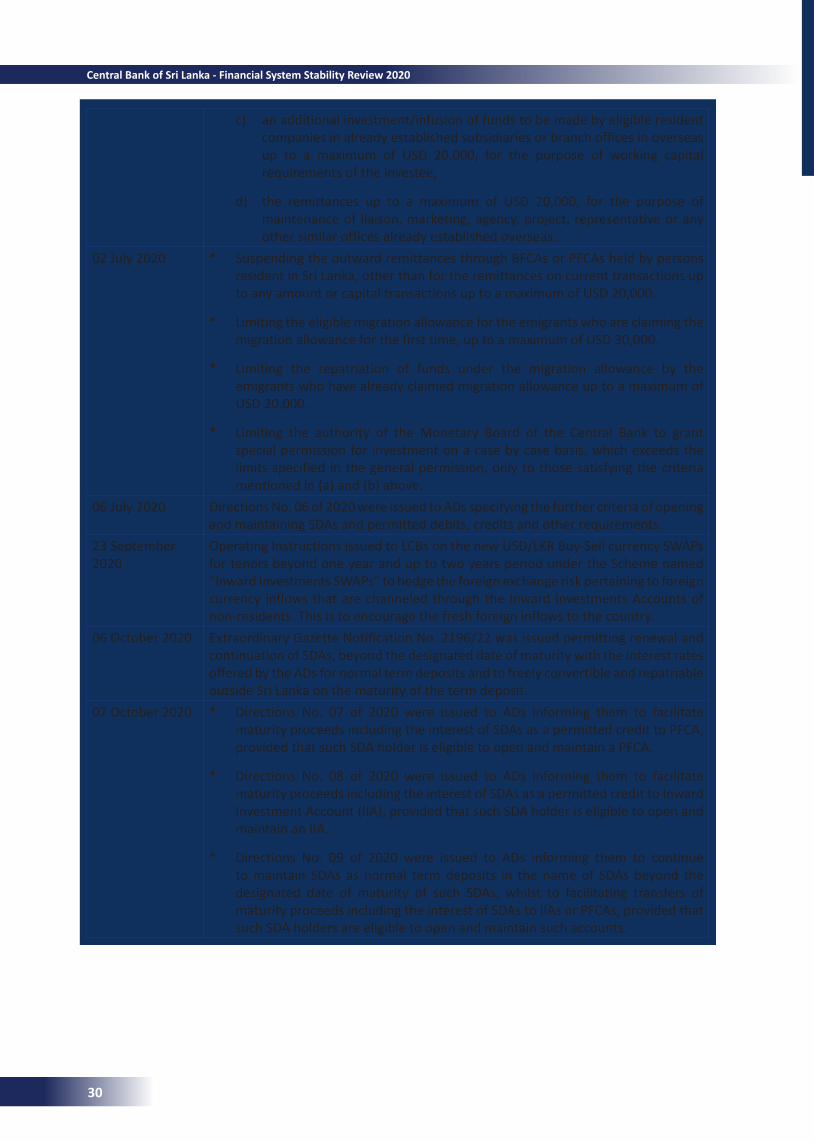
c) an additional investment/infusion of funds to be made by eligible resident companies in already established subsidiaries or branch offices in overseas up to a maximum of USD 20,000, for the purpose of working capital requirements of the investee,
d) the remittances up to a maximum of USD 20,000, for the purpose of maintenance of liaison, marketing, agency, project, representative or any other similar offices already established overseas.
02 July 2020 * Suspending the outward remittances through BFCAs or PFCAs held by persons resident in Sri Lanka, other than for the remittances on current transactions up to any amount or capital transactions up to a maximum of USD 20,000.
* Limiting the eligible migration allowance for the emigrants who are claiming the migration allowance for the first time, up to a maximum of USD 30,000.
* Limiting the repatriation of funds under the migration allowance by the emigrants who have already claimed migration allowance up to a maximum of USD 20,000.
* Limiting the authority of the Monetary Board of the Central Bank to grant special permission for investment on a case by case basis, which exceeds the limits specified in the general permission, only to those satisfying the criteria mentioned in (a) and (b) above.
06 July 2020 Directions No. 06 of 2020 were issued to ADs specifying the further criteria of opening and maintaining SDAs and permitted debits, credits and other requirements.
23 September 2020
Operating Instructions issued to LCBs on the new USD/LKR Buy-Sell currency SWAPs for tenors beyond one year and up to two years period under the Scheme named “Inward Investments SWAPs” to hedge the foreign exchange risk pertaining to foreign currency inflows that are channeled through the Inward Investments Accounts of non-residents. This is to encourage the fresh foreign inflows to the country.
06 October 2020 Extraordinary Gazette Notification No. 2196/22 was issued permitting renewal and continuation of SDAs, beyond the designated date of maturity with the interest rates offered by the ADs for normal term deposits and to freely convertible and repatriable outside Sri Lanka on the maturity of the term deposit.
07 October 2020 * Directions No. 07 of 2020 were issued to ADs informing them to facilitate maturity proceeds including the interest of SDAs as a permitted credit to PFCA, provided that such SDA holder is eligible to open and maintain a PFCA.
* Directions No. 08 of 2020 were issued to ADs informing them to facilitate maturity proceeds including the interest of SDAs as a permitted credit to Inward Investment Account (IIA), provided that such SDA holder is eligible to open and maintain an IIA.
* Directions No. 09 of 2020 were issued to ADs informing them to continue to maintain SDAs as normal term deposits in the name of SDAs beyond the designated date of maturity of such SDAs, whilst to facilitating transfers of maturity proceeds including the interest of SDAs to IIAs or PFCAs, provided that such SDA holders are eligible to open and maintain such accounts.
30
Central Bank of Sri Lanka - Financial System Stability Review 2020
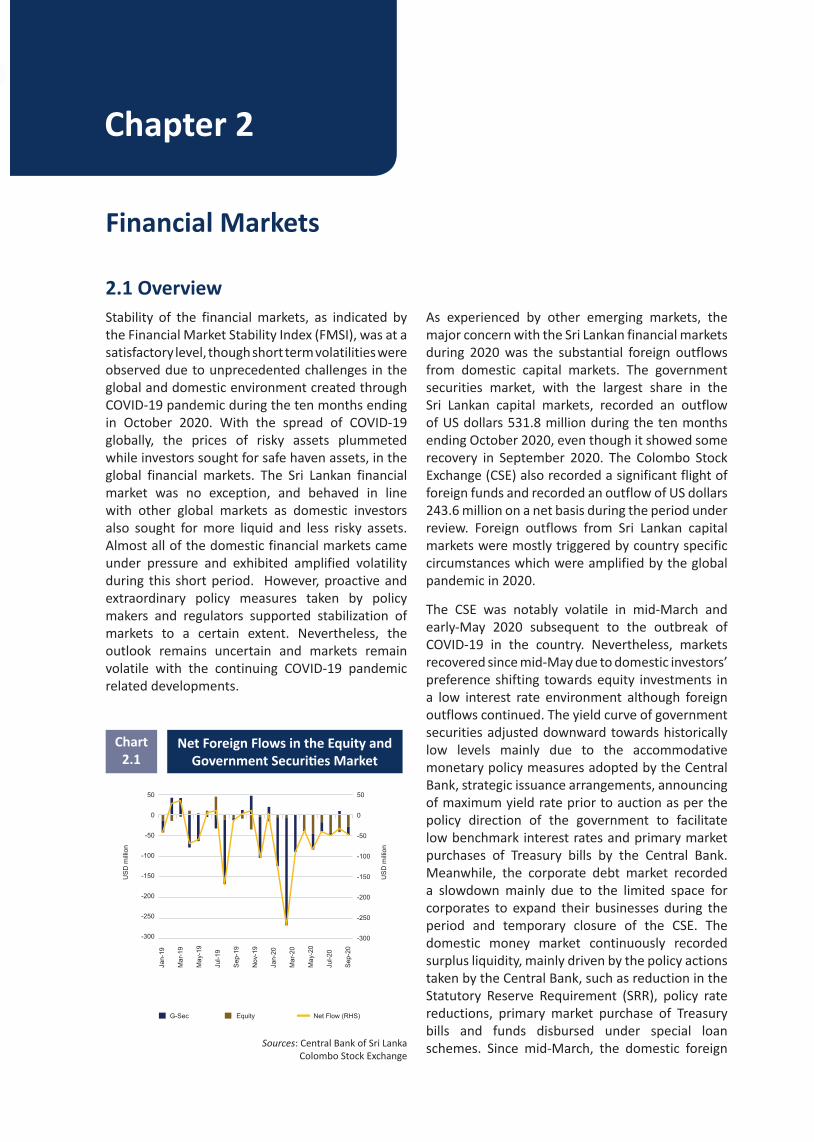
Financial Markets
Stability of the financial markets, as indicated by the Financial Market Stability Index (FMSI), was at a satisfactory level, though short term volatilities were observed due to unprecedented challenges in the global and domestic environment created through COVID-19 pandemic during the ten months ending in October 2020. With the spread of COVID-19 globally, the prices of risky assets plummeted while investors sought for safe haven assets, in the global financial markets. The Sri Lankan financial market was no exception, and behaved in line with other global markets as domestic investors also sought for more liquid and less risky assets. Almost all of the domestic financial markets came under pressure and exhibited amplified volatility during this short period. However, proactive and extraordinary policy measures taken by policy makers and regulators supported stabilization of markets to a certain extent. Nevertheless, the outlook remains uncertain and markets remain volatile with the continuing COVID-19 pandemic related developments.
2.1 Overview
Net Foreign Flows in the Equity and GovernmentSecuritiesMarket
Chart 2.1
Sources: Central Bank of Sri LankaColombo Stock Exchange
Chapter 2
-
As experienced by other emerging markets, the major concern with the Sri Lankan financial markets during 2020 was the substantial foreign outflows from domestic capital markets. The government securities market, with the largest share in the Sri Lankan capital markets, recorded an outflow of US dollars 531.8 million during the ten months ending October 2020, even though it showed some recovery in September 2020. The Colombo Stock Exchange (CSE) also recorded a significant flight of foreign funds and recorded an outflow of US dollars 243.6 million on a net basis during the period under review. Foreign outflows from Sri Lankan capital markets were mostly triggered by country specific circumstances which were amplified by the global pandemic in 2020.
The CSE was notably volatile in mid-March and early-May 2020 subsequent to the outbreak of COVID-19 in the country. Nevertheless, markets recovered since mid-May due to domestic investors’ preference shifting towards equity investments in a low interest rate environment although foreign outflows continued. The yield curve of government securities adjusted downward towards historically low levels mainly due to the accommodative monetary policy measures adopted by the Central Bank, strategic issuance arrangements, announcing of maximum yield rate prior to auction as per the policy direction of the government to facilitate low benchmark interest rates and primary market purchases of Treasury bills by the Central Bank. Meanwhile, the corporate debt market recorded a slowdown mainly due to the limited space for corporates to expand their businesses during the period and temporary closure of the CSE. The domestic money market continuously recorded surplus liquidity, mainly driven by the policy actions taken by the Central Bank, such as reduction in the Statutory Reserve Requirement (SRR), policy rate reductions, primary market purchase of Treasury bills and funds disbursed under special loan schemes. Since mid-March, the domestic foreign
Jan-
19
Mar
-19
May
-19
Jul-1
9
Sep
-19
Nov
-19
Jan-
20
Mar
-20
May
-20
Jul-2
0
Sep
-20
G-Sec Equity Net Flow (RHS)
50
0
-50
-100
-150
-200
-250
-300
US
D m
illio
n
US
D m
illio
n
50
0
-50
-100
-150
-200
-250
-300
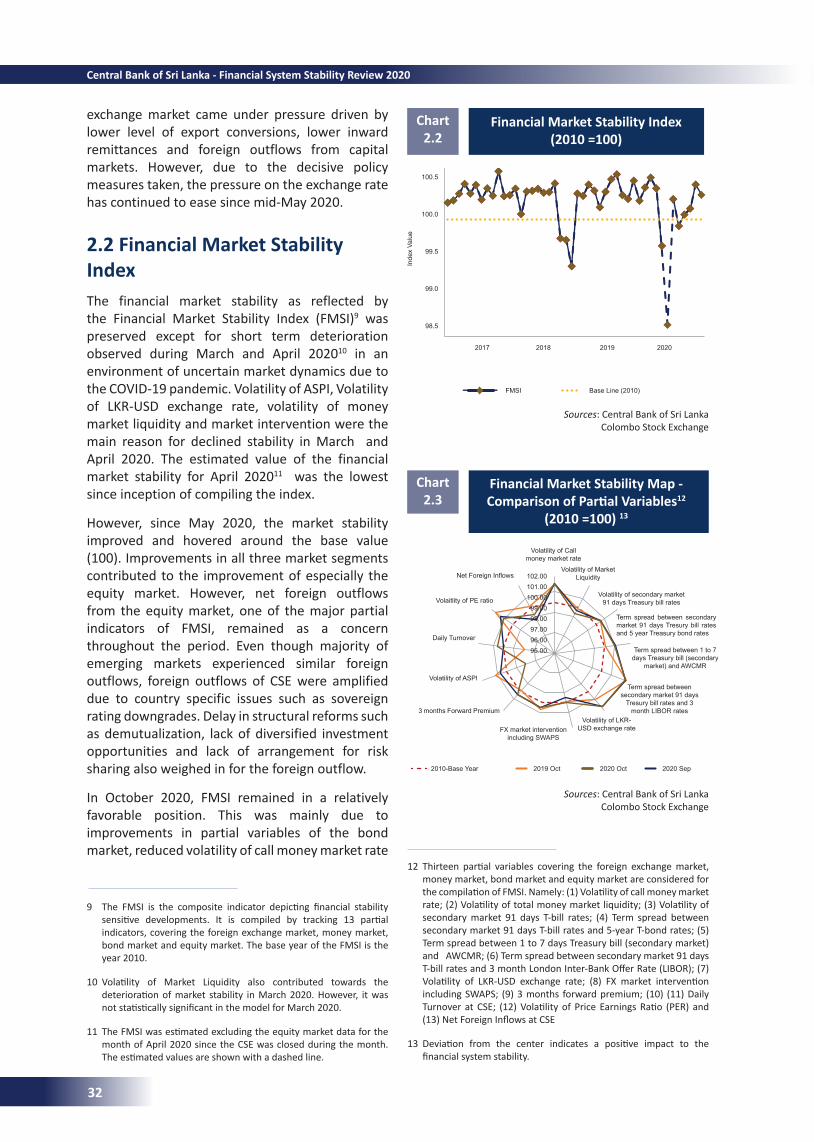
9 The FMSI is the composite indicator depicting financial stability sensitive developments. It is compiled by tracking 13 partial indicators, covering the foreign exchange market, money market, bond market and equity market. The base year of the FMSI is the year 2010.
10 Volatility of Market Liquidity also contributed towards the deterioration of market stability in March 2020. However, it was not statistically significant in the model for March 2020.
11 The FMSI was estimated excluding the equity market data for the month of April 2020 since the CSE was closed during the month. The estimated values are shown with a dashed line.
12 Thirteen partial variables covering the foreign exchange market, money market, bond market and equity market are considered for the compilation of FMSI. Namely: (1) Volatility of call money market rate; (2) Volatility of total money market liquidity; (3) Volatility of secondary market 91 days T-bill rates; (4) Term spread between secondary market 91 days T-bill rates and 5-year T-bond rates; (5) Term spread between 1 to 7 days Treasury bill (secondary market) and AWCMR; (6) Term spread between secondary market 91 days T-bill rates and 3 month London Inter-Bank Offer Rate (LIBOR); (7) Volatility of LKR-USD exchange rate; (8) FX market intervention including SWAPS; (9) 3 months forward premium; (10) (11) Daily Turnover at CSE; (12) Volatility of Price Earnings Ratio (PER) and (13) Net Foreign Inflows at CSE
13 Deviation from the center indicates a positive impact to the financial system stability.
Financial Market Stability Index (2010 =100)
Chart 2.2
Financial Market Stability Map - ComparisonofPartialVariables12
(2010 =100) 13
Chart 2.3
Sources: Central Bank of Sri LankaColombo Stock Exchange
Sources: Central Bank of Sri LankaColombo Stock Exchange
exchange market came under pressure driven by lower level of export conversions, lower inward remittances and foreign outflows from capital markets. However, due to the decisive policy measures taken, the pressure on the exchange rate has continued to ease since mid-May 2020.
2.2 Financial Market Stability Index The financial market stability as reflected by the Financial Market Stability Index (FMSI)9 was preserved except for short term deterioration observed during March and April 202010 in an environment of uncertain market dynamics due to the COVID-19 pandemic. Volatility of ASPI, Volatility of LKR-USD exchange rate, volatility of money market liquidity and market intervention were the main reason for declined stability in March and April 2020. The estimated value of the financial market stability for April 202011 was the lowest since inception of compiling the index.
However, since May 2020, the market stability improved and hovered around the base value (100). Improvements in all three market segments contributed to the improvement of especially the equity market. However, net foreign outflows from the equity market, one of the major partial indicators of FMSI, remained as a concern throughout the period. Even though majority of emerging markets experienced similar foreign outflows, foreign outflows of CSE were amplified due to country specific issues such as sovereign rating downgrades. Delay in structural reforms such as demutualization, lack of diversified investment opportunities and lack of arrangement for risk sharing also weighed in for the foreign outflow.
In October 2020, FMSI remained in a relatively favorable position. This was mainly due to improvements in partial variables of the bond market, reduced volatility of call money market rate
-
-
Inde
x Va
lue
FMSI Base Line (2010)
2017 2018 2019 2020
100.5
100.0
99.5
99.0
98.5
Net Foreign Inflows 102.00101.00100.0099.0098.0097.0096.0095.00
2010-Base Year 2019 Oct 2020 Oct 2020 Sep
Volatility of Call money market rate
Volatility of Market Liquidity
Volatility of secondary market 91 days Treasury bill rates
Term spread between secondary market 91 days Tresury bill rates and 5 year Treasury bond rates
Term spread between 1 to 7 days Treasury bill (secondary
market) and AWCMR
Term spread between secondary market 91 days
Tresury bill rates and 3 month LIBOR rates
Volatility of LKR-USD exchange rateFX market intervention
including SWAPS
3 months Forward Premium
Volatility of ASPI
Daily Turnover
Volaitlity of PE ratio
32
Central Bank of Sri Lanka - Financial System Stability Review 2020
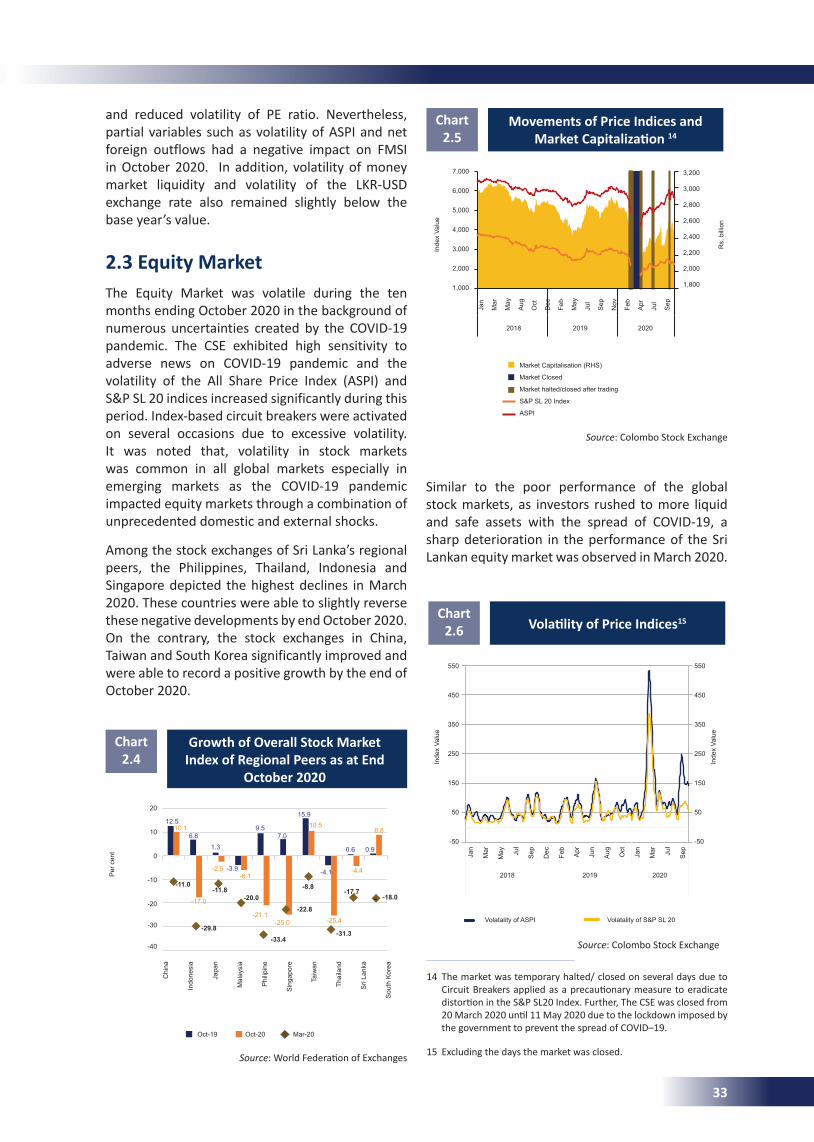
550
450
350
250
150
50
-50
-
-
and reduced volatility of PE ratio. Nevertheless, partial variables such as volatility of ASPI and net foreign outflows had a negative impact on FMSI in October 2020. In addition, volatility of money market liquidity and volatility of the LKR-USD exchange rate also remained slightly below the base year’s value.
2.3 Equity MarketThe Equity Market was volatile during the ten months ending October 2020 in the background of numerous uncertainties created by the COVID-19 pandemic. The CSE exhibited high sensitivity to adverse news on COVID-19 pandemic and the volatility of the All Share Price Index (ASPI) and S&P SL 20 indices increased significantly during this period. Index-based circuit breakers were activated on several occasions due to excessive volatility. It was noted that, volatility in stock markets was common in all global markets especially in emerging markets as the COVID-19 pandemic impacted equity markets through a combination of unprecedented domestic and external shocks.
Among the stock exchanges of Sri Lanka’s regional peers, the Philippines, Thailand, Indonesia and Singapore depicted the highest declines in March 2020. These countries were able to slightly reverse these negative developments by end October 2020. On the contrary, the stock exchanges in China, Taiwan and South Korea significantly improved and were able to record a positive growth by the end of October 2020.
Growth of Overall Stock Market Index of Regional Peers as at End
October 2020
Chart 2.4
Source: World Federation of Exchanges
Movements of Price Indices and MarketCapitalization14
Chart 2.5
-
Source: Colombo Stock Exchange
Similar to the poor performance of the global stock markets, as investors rushed to more liquid and safe assets with the spread of COVID-19, a sharp deterioration in the performance of the Sri Lankan equity market was observed in March 2020.
VolatilityofPriceIndices15Chart
2.6
Source: Colombo Stock Exchange
14 The market was temporary halted/ closed on several days due to Circuit Breakers applied as a precautionary measure to eradicate distortion in the S&P SL20 Index. Further, The CSE was closed from 20 March 2020 until 11 May 2020 due to the lockdown imposed by the government to prevent the spread of COVID–19.
15 Excluding the days the market was closed.
Chi
na
Indo
nesi
a
Japa
n
Mal
aysi
a
Phi
lipin
e
Sin
gapo
re
Taiw
an
Thai
land
Sri
Lank
a
Sou
th K
orea
Oct-19 Oct-20 Mar-20
Per
cen
t
12.510.1
6.8
-11.0-11.8
-2.5 -3.9-6.1
-20.0
-21.1-25.0
-22.8-25.4
-4.1 -4.4
-18.0-17.7
-31.3
-8.8
-33.4
-17.0
-29.8
1.3
9.57.0
15.910.5
0.6 0.9
8.8
20
10
0
-10
-20
-30
-40
Jan
Mar
May
Aug
Oct
Dec
Feb
May
Jul
Sep
Nov
Feb
Apr
Jul
Sep
Market Capitalisation (RHS)
Market Closed
Market halted/closed after trading
S&P SL 20 Index
ASPI
2018 2019 2020
Inde
x Va
lue
Rs.
bill
ion
7,000
6,000
5,000
4,000
3,000
2,000
1,000
3,200
3,000
2,800
2,600
2,400
2,200
2,000
1,800
Jan
Mar
May Ju
l
Sep
Dec
Feb
Apr
Jun
Aug Oct
Jan
Mar Ju
l
Sep
Volatality of ASPI Volatality of S&P SL 20
Inde
x Va
lue
Inde
x Va
lue
550
450
350
250
150
50
-50
2018 2019 2020
33
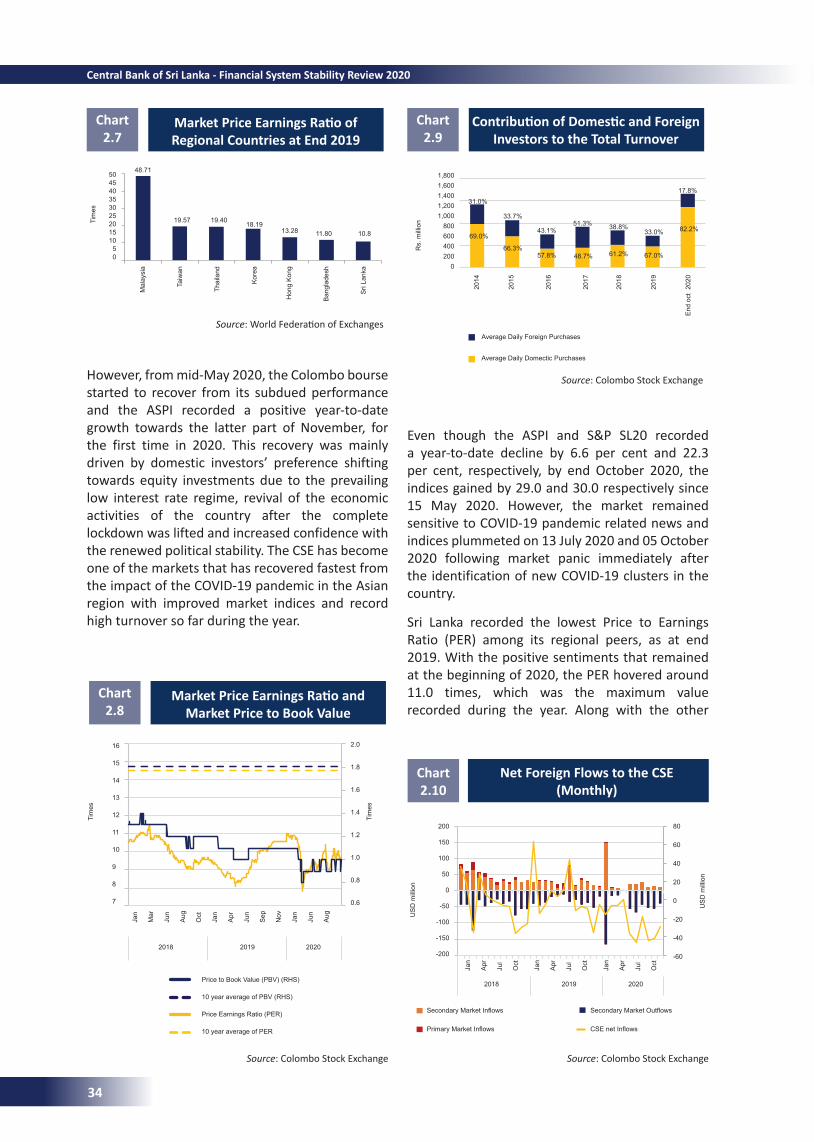
MarketPriceEarningsRatioofRegional Countries at End 2019
Chart 2.7
MarketPriceEarningsRatioandMarket Price to Book Value
Chart 2.8
ContributionofDomesticandForeignInvestors to the Total Turnover
Chart 2.9
Net Foreign Flows to the CSE (Monthly)
Source: World Federation of Exchanges
Source: Colombo Stock Exchange
Source: Colombo Stock Exchange
Source: Colombo Stock Exchange
However, from mid-May 2020, the Colombo bourse started to recover from its subdued performance and the ASPI recorded a positive year-to-date growth towards the latter part of November, for the first time in 2020. This recovery was mainly driven by domestic investors’ preference shifting towards equity investments due to the prevailing low interest rate regime, revival of the economic activities of the country after the complete lockdown was lifted and increased confidence with the renewed political stability. The CSE has become one of the markets that has recovered fastest from the impact of the COVID-19 pandemic in the Asian region with improved market indices and record high turnover so far during the year.
Even though the ASPI and S&P SL20 recorded a year-to-date decline by 6.6 per cent and 22.3 per cent, respectively, by end October 2020, the indices gained by 29.0 and 30.0 respectively since 15 May 2020. However, the market remained sensitive to COVID-19 pandemic related news and indices plummeted on 13 July 2020 and 05 October 2020 following market panic immediately after the identification of new COVID-19 clusters in the country.
Sri Lanka recorded the lowest Price to Earnings Ratio (PER) among its regional peers, as at end 2019. With the positive sentiments that remained at the beginning of 2020, the PER hovered around 11.0 times, which was the maximum value recorded during the year. Along with the other
Chart 2.10
50454035302520151050
Mal
aysi
a
Taiw
an
Thai
land
Kor
ea
Hon
g K
ong
Ban
glad
esh
Sri
Lank
a
Tim
es
48.71
19.57 19.40 18.1913.28 11.80 10.8
16
15
14
13
12
11
10
9
8
7
2.0
1.8
1.6
1.4
1.2
1.0
0.8
0.6
Jan
Mar
Jun
Aug
Oct
Jan
Apr
Jun
Sep
Nov
Jan
Jun
Aug
Price to Book Value (PBV) (RHS)
10 year average of PBV (RHS)
Price Earnings Ratio (PER)
10 year average of PER
Tim
es
Tim
es
2018
2018 2019 2020
2019 2020
1,8001,6001,4001,2001,000
800600400200
0
2014
2015
2016
2017
2018
2019
End
oct
202
0
Average Daily Foreign Purchases
Average Daily Domectic Purchases
Rs.
mill
ion
31.0%
33.7%
43.1%51.3% 38.8%
33.0%
17.8%
69.0%
66.3%57.8% 48.7% 61.2% 67.0%
82.2%
200
150
100
50
0
-50
-100
-150
-200
80
60
40
20
0
-20
-40
-60
Jan
Apr
Jul
Oct
Jan
Apr
Jul
Oct
Jan
Apr
Jul
Oct
Secondary Market Inflows Secondary Market Outflows
Primary Market Inflows CSE net Inflows
US
D m
illio
n
US
D m
illio
n
34
Central Bank of Sri Lanka - Financial System Stability Review 2020
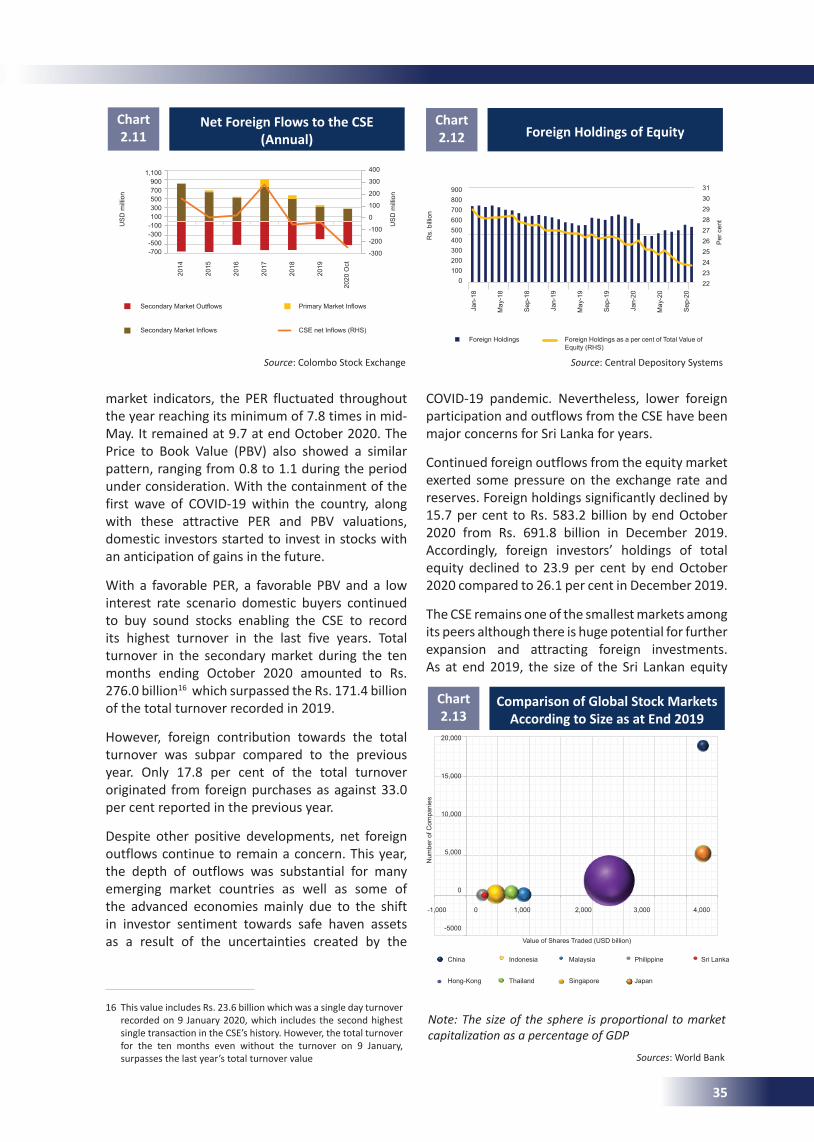
16 This value includes Rs. 23.6 billion which was a single day turnover recorded on 9 January 2020, which includes the second highest single transaction in the CSE’s history. However, the total turnover for the ten months even without the turnover on 9 January, surpasses the last year’s total turnover value
market indicators, the PER fluctuated throughout the year reaching its minimum of 7.8 times in mid-May. It remained at 9.7 at end October 2020. The Price to Book Value (PBV) also showed a similar pattern, ranging from 0.8 to 1.1 during the period under consideration. With the containment of the first wave of COVID-19 within the country, along with these attractive PER and PBV valuations, domestic investors started to invest in stocks with an anticipation of gains in the future.
With a favorable PER, a favorable PBV and a low interest rate scenario domestic buyers continued to buy sound stocks enabling the CSE to record its highest turnover in the last five years. Total turnover in the secondary market during the ten months ending October 2020 amounted to Rs. 276.0 billion16 which surpassed the Rs. 171.4 billion of the total turnover recorded in 2019.
However, foreign contribution towards the total turnover was subpar compared to the previous year. Only 17.8 per cent of the total turnover originated from foreign purchases as against 33.0 per cent reported in the previous year.
Despite other positive developments, net foreign outflows continue to remain a concern. This year, the depth of outflows was substantial for many emerging market countries as well as some of the advanced economies mainly due to the shift in investor sentiment towards safe haven assets as a result of the uncertainties created by the
Net Foreign Flows to the CSE (Annual)
Chart 2.11
Source: Colombo Stock Exchange
Foreign Holdings of EquityChart 2.12
Source: Central Depository Systems
COVID-19 pandemic. Nevertheless, lower foreign participation and outflows from the CSE have been major concerns for Sri Lanka for years.
Continued foreign outflows from the equity market exerted some pressure on the exchange rate and reserves. Foreign holdings significantly declined by 15.7 per cent to Rs. 583.2 billion by end October 2020 from Rs. 691.8 billion in December 2019. Accordingly, foreign investors’ holdings of total equity declined to 23.9 per cent by end October 2020 compared to 26.1 per cent in December 2019.
The CSE remains one of the smallest markets among its peers although there is huge potential for further expansion and attracting foreign investments. As at end 2019, the size of the Sri Lankan equity
Comparison of Global Stock Markets According to Size as at End 2019
Chart 2.13
Sources: World Bank
Note: The size of the sphere is proportional to market capitalization as a percentage of GDP
400
300
200
100
0
-100
-200
-300
2014
2015
2016
2017
2018
2019
2020
Oct
Secondary Market Outflows Primary Market Inflows
Secondary Market Inflows CSE net Inflows (RHS)
1,100900700500300100
-100-300-500-700
US
D m
illio
n
US
D m
illio
n 900800700600500400300200100
0
31302928272625242322
Jan-
18
May
-18
Sep
-18
Jan-
19
May
-19
Sep
-19
Jan-
20
May
-20
Sep
-20
Foreign Holdings Foreign Holdings as a per cent of Total Value of Equity (RHS)
Rs.
bill
ion
Per
cen
t
20,000
15,000
10,000
5,000
0
-5000
-1,000 0 1,000 2,000 3,000 4,000
Num
ber o
f Com
pani
es
Value of Shares Traded (USD billion)
China Indonesia Malaysia Philippine Sri Lanka
Hong-Kong Thailand Singapore Japan
35
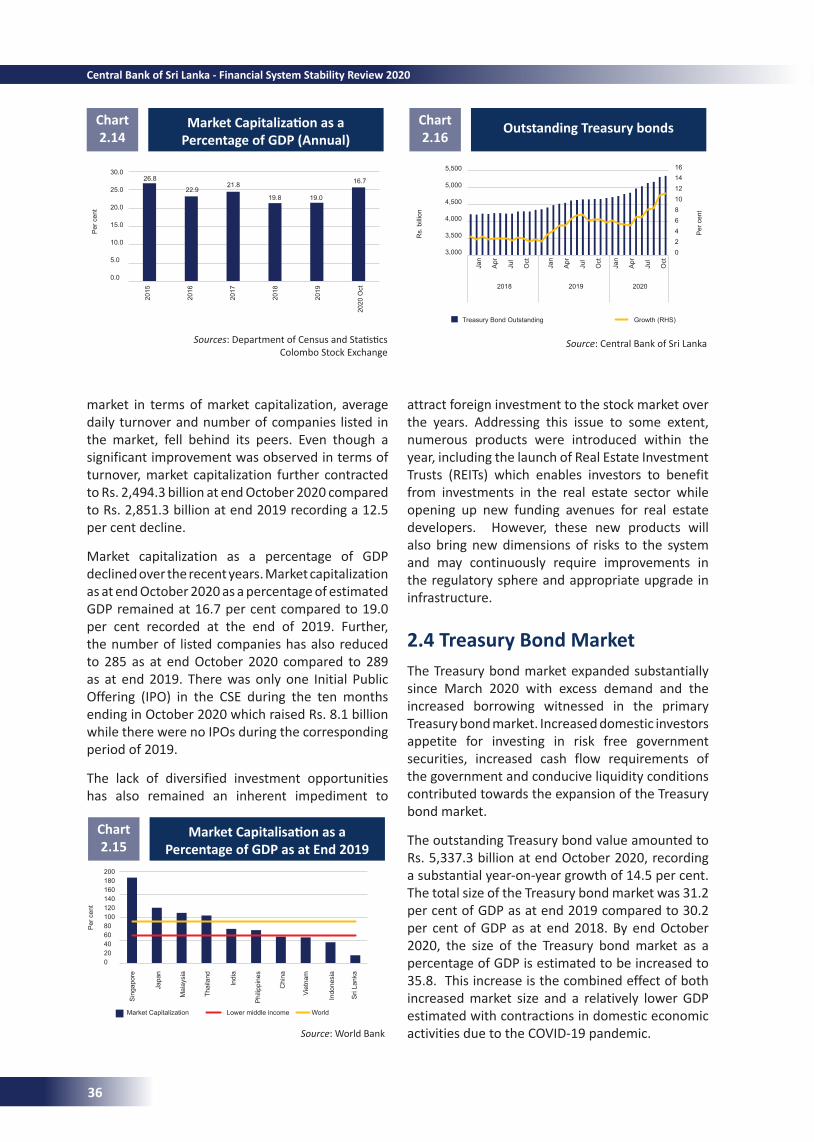
MarketCapitalizationasaPercentage of GDP (Annual)
Chart 2.14
Sources: Department of Census and StatisticsColombo Stock Exchange
MarketCapitalisationasaPercentage of GDP as at End 2019
Chart 2.15
Source: World Bank
Outstanding Treasury bondsChart 2.16
Source: Central Bank of Sri Lanka
market in terms of market capitalization, average daily turnover and number of companies listed in the market, fell behind its peers. Even though a significant improvement was observed in terms of turnover, market capitalization further contracted to Rs. 2,494.3 billion at end October 2020 compared to Rs. 2,851.3 billion at end 2019 recording a 12.5 per cent decline.
Market capitalization as a percentage of GDP declined over the recent years. Market capitalization as at end October 2020 as a percentage of estimated GDP remained at 16.7 per cent compared to 19.0 per cent recorded at the end of 2019. Further, the number of listed companies has also reduced to 285 as at end October 2020 compared to 289 as at end 2019. There was only one Initial Public Offering (IPO) in the CSE during the ten months ending in October 2020 which raised Rs. 8.1 billion while there were no IPOs during the corresponding period of 2019.
The lack of diversified investment opportunities has also remained an inherent impediment to
attract foreign investment to the stock market over the years. Addressing this issue to some extent, numerous products were introduced within the year, including the launch of Real Estate Investment Trusts (REITs) which enables investors to benefit from investments in the real estate sector while opening up new funding avenues for real estate developers. However, these new products will also bring new dimensions of risks to the system and may continuously require improvements in the regulatory sphere and appropriate upgrade in infrastructure.
2.4 Treasury Bond MarketThe Treasury bond market expanded substantially since March 2020 with excess demand and the increased borrowing witnessed in the primary Treasury bond market. Increased domestic investors appetite for investing in risk free government securities, increased cash flow requirements of the government and conducive liquidity conditions contributed towards the expansion of the Treasury bond market.
The outstanding Treasury bond value amounted to Rs. 5,337.3 billion at end October 2020, recording a substantial year-on-year growth of 14.5 per cent. The total size of the Treasury bond market was 31.2 per cent of GDP as at end 2019 compared to 30.2 per cent of GDP as at end 2018. By end October 2020, the size of the Treasury bond market as a percentage of GDP is estimated to be increased to 35.8. This increase is the combined effect of both increased market size and a relatively lower GDP estimated with contractions in domestic economic activities due to the COVID-19 pandemic.
30.0
25.0
20.0
15.0
10.0
5.0
0.0
2015
2016
2017
2018
2019
2020
Oct
Per
cen
t
26.8
22.921.8
19.8 19.0
16.7
200180160140120100806040200
Sin
gapo
re
Japa
n
Mal
aysi
a
Thai
land
Indi
a
Phi
lippi
nes
Chi
na
Viet
nam
Indo
nesi
a
Sri
Lank
a
Market Capitalization Lower middle income World
Per
cen
t
5,500
5,000
4,500
4,000
3,500
3,000
Jan
Apr
Jul
Oct
Jan
Apr
Jul
Oct
Jan
Apr
Jul
Oct
1614121086420
Treasury Bond Outstanding Growth (RHS)
Rs.
bill
ion
2018 2019 2020
Per
cen
t
36
Central Bank of Sri Lanka - Financial System Stability Review 2020
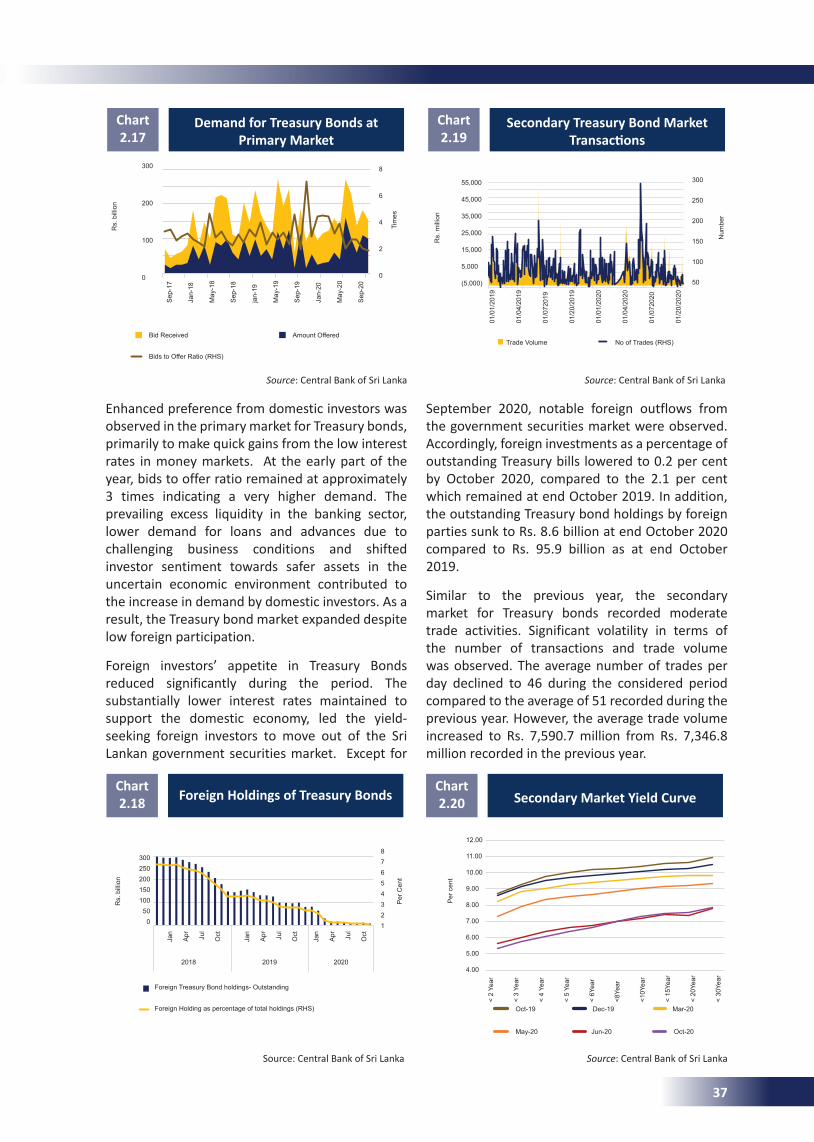
Demand for Treasury Bonds at Primary Market
Chart 2.17
Source: Central Bank of Sri Lanka
Enhanced preference from domestic investors was observed in the primary market for Treasury bonds, primarily to make quick gains from the low interest rates in money markets. At the early part of the year, bids to offer ratio remained at approximately 3 times indicating a very higher demand. The prevailing excess liquidity in the banking sector, lower demand for loans and advances due to challenging business conditions and shifted investor sentiment towards safer assets in the uncertain economic environment contributed to the increase in demand by domestic investors. As a result, the Treasury bond market expanded despite low foreign participation.
Foreign investors’ appetite in Treasury Bonds reduced significantly during the period. The substantially lower interest rates maintained to support the domestic economy, led the yield-seeking foreign investors to move out of the Sri Lankan government securities market. Except for
September 2020, notable foreign outflows from the government securities market were observed. Accordingly, foreign investments as a percentage of outstanding Treasury bills lowered to 0.2 per cent by October 2020, compared to the 2.1 per cent which remained at end October 2019. In addition, the outstanding Treasury bond holdings by foreign parties sunk to Rs. 8.6 billion at end October 2020 compared to Rs. 95.9 billion as at end October 2019.
Similar to the previous year, the secondary market for Treasury bonds recorded moderate trade activities. Significant volatility in terms of the number of transactions and trade volume was observed. The average number of trades per day declined to 46 during the considered period compared to the average of 51 recorded during the previous year. However, the average trade volume increased to Rs. 7,590.7 million from Rs. 7,346.8 million recorded in the previous year.
Foreign Holdings of Treasury BondsChart 2.18
Source: Central Bank of Sri Lanka
Secondary Treasury Bond Market Transactions
Chart 2.19
Source: Central Bank of Sri Lanka
Secondary Market Yield CurveChart 2.20
Source: Central Bank of Sri Lanka
300
200
100
0
Sep
-17
Jan-
18
May
-18
Sep
-18
jan-
19
May
-19
Sep
-19
Jan-
20
May
-20
Sep
-20
8
6
4
2
0
Bid Received Amount Offered
Bids to Offer Ratio (RHS)
Rs.
bill
ion
Tim
es
300250200150100500
Jan
Apr Ju
l
Oct
Jan
Apr Ju
l
Oct
Jan
Apr Ju
l
Oct
87654321
Foreign Treasury Bond holdings- Outstanding
Foreign Holding as percentage of total holdings (RHS)
Per
Cen
t
Rs.
bill
ion
2018 2019 2020
55,000
45,000
35,000
25,000
15,000
5,000
(5,000)
01/0
1/20
19
01/0
4/20
19
01/0
7201
9
01/2
0/20
19
01/0
1/20
20
01/0
4/20
20
01/0
7202
0
01/2
0/20
20
300
250
200
150
100
50
Trade Volume No of Trades (RHS)
Rs.
mill
ion
Num
ber
12.00
11.00
10.00
9.00
8.00
7.00
6.00
5.00
4.00
< 2
Year
< 3
Year
< 4
Year
< 5
Year
< 6Y
ear
<8Ye
ar
<10Y
ear
< 15
Year
< 20
Year
< 30
Year
Oct-19 Dec-19 Mar-20
May-20 Jun-20 Oct-20
Per
cen
t
37
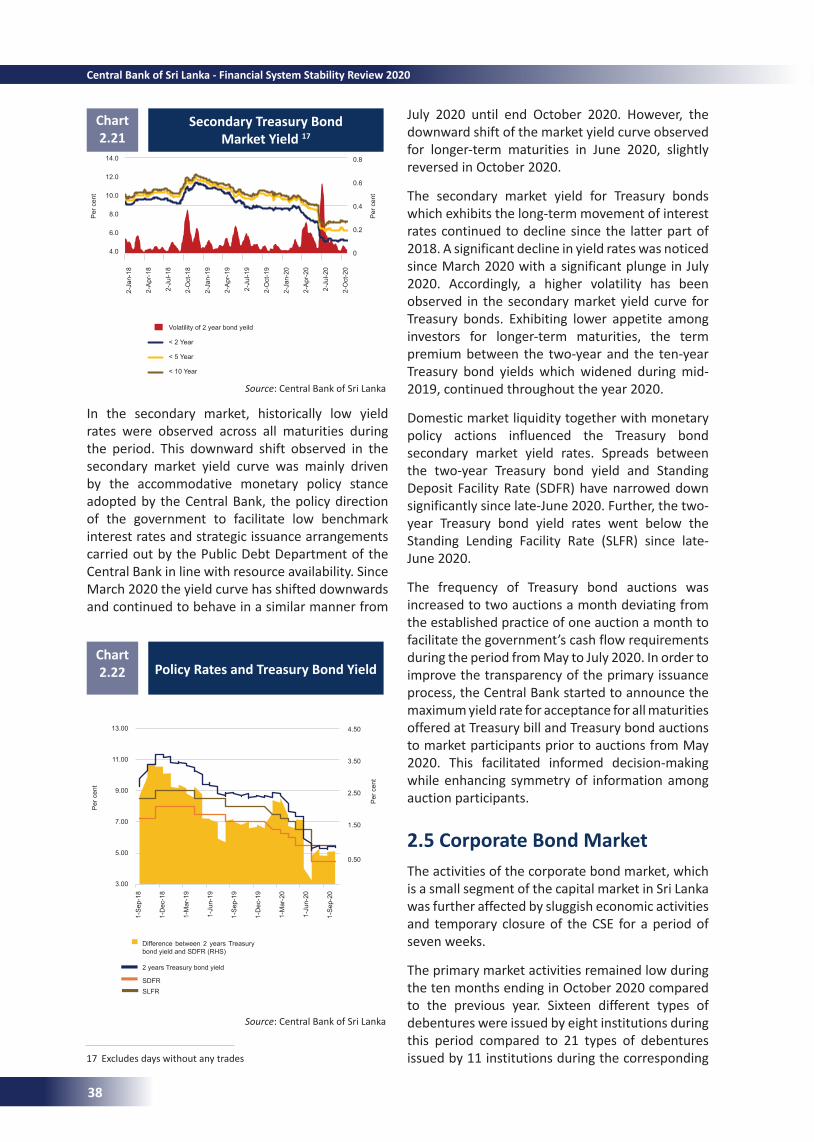
Secondary Treasury Bond Market Yield 17
Chart 2.21
17 Excludes days without any trades
Source: Central Bank of Sri Lanka
Policy Rates and Treasury Bond YieldChart 2.22
Source: Central Bank of Sri Lanka
In the secondary market, historically low yield rates were observed across all maturities during the period. This downward shift observed in the secondary market yield curve was mainly driven by the accommodative monetary policy stance adopted by the Central Bank, the policy direction of the government to facilitate low benchmark interest rates and strategic issuance arrangements carried out by the Public Debt Department of the Central Bank in line with resource availability. Since March 2020 the yield curve has shifted downwards and continued to behave in a similar manner from
July 2020 until end October 2020. However, the downward shift of the market yield curve observed for longer-term maturities in June 2020, slightly reversed in October 2020.
The secondary market yield for Treasury bonds which exhibits the long-term movement of interest rates continued to decline since the latter part of 2018. A significant decline in yield rates was noticed since March 2020 with a significant plunge in July 2020. Accordingly, a higher volatility has been observed in the secondary market yield curve for Treasury bonds. Exhibiting lower appetite among investors for longer-term maturities, the term premium between the two-year and the ten-year Treasury bond yields which widened during mid-2019, continued throughout the year 2020.
Domestic market liquidity together with monetary policy actions influenced the Treasury bond secondary market yield rates. Spreads between the two-year Treasury bond yield and Standing Deposit Facility Rate (SDFR) have narrowed down significantly since late-June 2020. Further, the two-year Treasury bond yield rates went below the Standing Lending Facility Rate (SLFR) since late-June 2020.
The frequency of Treasury bond auctions was increased to two auctions a month deviating from the established practice of one auction a month to facilitate the government’s cash flow requirements during the period from May to July 2020. In order to improve the transparency of the primary issuance process, the Central Bank started to announce the maximum yield rate for acceptance for all maturities offered at Treasury bill and Treasury bond auctions to market participants prior to auctions from May 2020. This facilitated informed decision-making while enhancing symmetry of information among auction participants.
2.5 Corporate Bond MarketThe activities of the corporate bond market, which is a small segment of the capital market in Sri Lanka was further affected by sluggish economic activities and temporary closure of the CSE for a period of seven weeks.
The primary market activities remained low during the ten months ending in October 2020 compared to the previous year. Sixteen different types of debentures were issued by eight institutions during this period compared to 21 types of debentures issued by 11 institutions during the corresponding
14.0
12.0
10.0
8.0
6.0
4.0
2-Ja
n-18
2-A
pr-1
8
2-Ju
l-18
2-O
ct-1
8
2-Ja
n-19
2-A
pr-1
9
2-Ju
l-19
2-O
ct-1
9
2-Ja
n-20
2-A
pr-2
0
2-Ju
l-20
2-O
ct-2
0
0.8
0.6
0.4
0.2
0
Per
cen
t
Per
cen
t
Volatility of 2 year bond yeild
< 2 Year
< 5 Year
< 10 Year
13.00
11.00
9.00
7.00
5.00
3.00
1-S
ep-1
8
1-D
ec-1
8
1-M
ar-1
9
1-Ju
n-19
1-S
ep-1
9
1-D
ec-1
9
1-M
ar-2
0
1-Ju
n-20
1-S
ep-2
0
4.50
3.50
2.50
1.50
0.50
Difference between 2 years Treasury bond yield and SDFR (RHS)
2 years Treasury bond yield
SDFRSLFR
Per
cen
t
Per
cen
t
38
Central Bank of Sri Lanka - Financial System Stability Review 2020
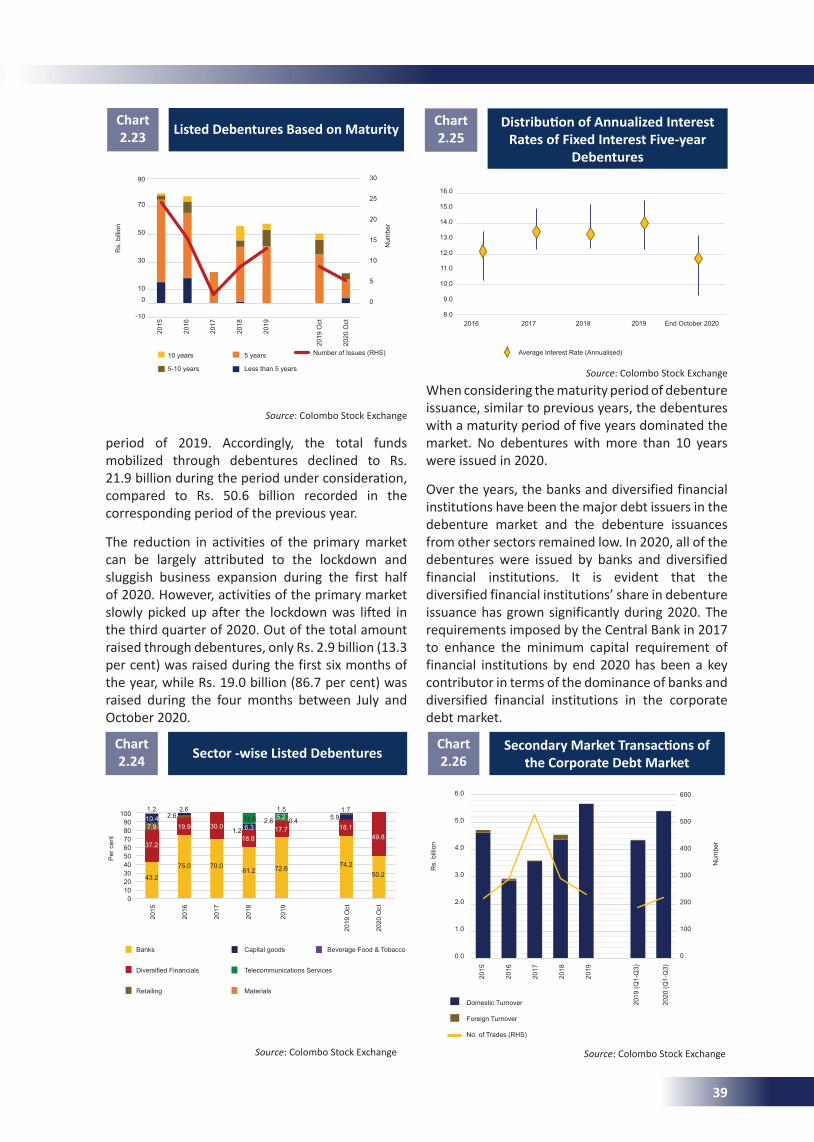
Listed Debentures Based on MaturityChart 2.23
Source: Colombo Stock Exchange
period of 2019. Accordingly, the total funds mobilized through debentures declined to Rs. 21.9 billion during the period under consideration, compared to Rs. 50.6 billion recorded in the corresponding period of the previous year.
The reduction in activities of the primary market can be largely attributed to the lockdown and sluggish business expansion during the first half of 2020. However, activities of the primary market slowly picked up after the lockdown was lifted in the third quarter of 2020. Out of the total amount raised through debentures, only Rs. 2.9 billion (13.3 per cent) was raised during the first six months of the year, while Rs. 19.0 billion (86.7 per cent) was raised during the four months between July and October 2020.
Sector -wise Listed DebenturesChart 2.24
Source: Colombo Stock Exchange
When considering the maturity period of debenture issuance, similar to previous years, the debentures with a maturity period of five years dominated the market. No debentures with more than 10 years were issued in 2020.
Over the years, the banks and diversified financial institutions have been the major debt issuers in the debenture market and the debenture issuances from other sectors remained low. In 2020, all of the debentures were issued by banks and diversified financial institutions. It is evident that the diversified financial institutions’ share in debenture issuance has grown significantly during 2020. The requirements imposed by the Central Bank in 2017 to enhance the minimum capital requirement of financial institutions by end 2020 has been a key contributor in terms of the dominance of banks and diversified financial institutions in the corporate debt market.
DistributionofAnnualizedInterestRates of Fixed Interest Five-year
Debentures
Chart 2.25
Source: Colombo Stock Exchange
SecondaryMarketTransactionsofthe Corporate Debt Market
Chart 2.26
Source: Colombo Stock Exchange
90
70
50
30
10
0
-10
2015
2016
2017
2018
2019
2019
Oct
2020
Oct
30
25
20
15
10
5
0
10 years
5-10 years
5 years
Less than 5 years
Number of Issues (RHS)
Rs.
bill
ion
Num
ber
1009080706050403020100
2015
2016
2017
2018
2019
2019
Oct
2020
Oct
Per
cen
t
1.2 2.62.6
43.2
75.0 70.061.2 72.6 74.2
50.2
49.8
12.51.5 1.7
5.92.6 0.45.2
1.2 6.3
18.817.7 18.1
10.47.9 19.9 30.0
37.2
16.0
15.0
14.0
13.0
12.0
11.0
10.0
9.0
8.02016 2017 2018 2019 End October 2020
Average Interest Rate (Annualised)
6.0
5.0
4.0
3.0
2.0
1.0
0.0
2015
2016
2017
2018
2019
2019
(Q1-
Q3)
2020
(Q1-
Q3)
600
500
400
300
200
100
0
Domestic Turnover
Foreign Turnover
No. of Trades (RHS)
Rs.
bill
ion
Num
ber
Capital goods Beverage Food & TobaccoBanks
Telecommunications ServicesDiversified Financials
MaterialsRetailing
39
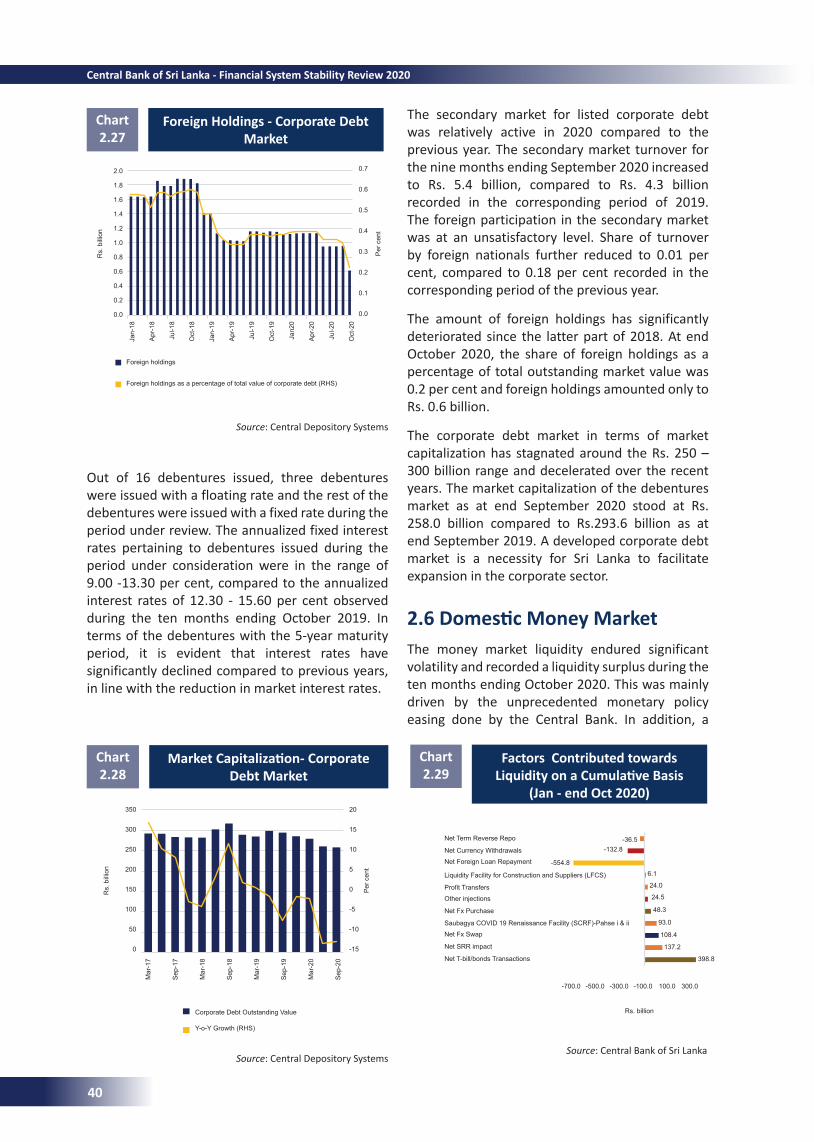
Foreign Holdings - Corporate Debt Market
Chart 2.27
Source: Central Depository Systems
MarketCapitalization-CorporateDebt Market
Chart 2.28
Source: Central Depository Systems
Chart 2.29
Factors Contributed towards LiquidityonaCumulativeBasis
(Jan - end Oct 2020)
Source: Central Bank of Sri Lanka
Out of 16 debentures issued, three debentures were issued with a floating rate and the rest of the debentures were issued with a fixed rate during the period under review. The annualized fixed interest rates pertaining to debentures issued during the period under consideration were in the range of 9.00 -13.30 per cent, compared to the annualized interest rates of 12.30 - 15.60 per cent observed during the ten months ending October 2019. In terms of the debentures with the 5-year maturity period, it is evident that interest rates have significantly declined compared to previous years, in line with the reduction in market interest rates.
The secondary market for listed corporate debt was relatively active in 2020 compared to the previous year. The secondary market turnover for the nine months ending September 2020 increased to Rs. 5.4 billion, compared to Rs. 4.3 billion recorded in the corresponding period of 2019. The foreign participation in the secondary market was at an unsatisfactory level. Share of turnover by foreign nationals further reduced to 0.01 per cent, compared to 0.18 per cent recorded in the corresponding period of the previous year.
The amount of foreign holdings has significantly deteriorated since the latter part of 2018. At end October 2020, the share of foreign holdings as a percentage of total outstanding market value was 0.2 per cent and foreign holdings amounted only to Rs. 0.6 billion.
The corporate debt market in terms of market capitalization has stagnated around the Rs. 250 – 300 billion range and decelerated over the recent years. The market capitalization of the debentures market as at end September 2020 stood at Rs. 258.0 billion compared to Rs.293.6 billion as at end September 2019. A developed corporate debt market is a necessity for Sri Lanka to facilitate expansion in the corporate sector.
2.6DomesticMoneyMarketThe money market liquidity endured significant volatility and recorded a liquidity surplus during the ten months ending October 2020. This was mainly driven by the unprecedented monetary policy easing done by the Central Bank. In addition, a
2.0
1.8
1.6
1.4
1.2
1.0
0.8
0.6
0.4
0.2
0.0
Jan-
18
Apr
-18
Jul-1
8
Oct
-18
Jan-
19
Apr
-19
Jul-1
9
Oct
-19
Jan2
0
Apr
-20
Jul-2
0
Oct
-20
0.7
0.6
0.5
0.4
0.3
0.2
0.1
0.0
Foreign holdings
Foreign holdings as a percentage of total value of corporate debt (RHS)
Rs.
bill
ion
Per
cen
t
350
300
250
200
150
100
50
0
Mar
-17
Sep
-17
Mar
-18
Sep
-18
Mar
-19
Sep
-19
Mar
-20
Sep
-20
20
15
10
5
0
-5
-10
-15
Corporate Debt Outstanding Value
Y-o-Y Growth (RHS)
Rs.
bill
ion
Per
cen
t
Net Term Reverse Repo
Net Currency Withdrawals
Net Foreign Loan Repayment
Liquidity Facility for Construction and Suppliers (LFCS)
Profit Transfers
Other injections
Net Fx Purchase
Saubagya COVID 19 Renaissance Facility (SCRF)-Pahse i & ii
Net Fx Swap
Net SRR impact
Net T-bill/bonds Transactions
-132.8
-700.0 -500.0 -300.0 -100.0 100.0 300.0
Rs. billion
-36.5
6.1
24.0
24.5
48.3
93.0
108.4
137.2
398.8
-554.8
40
Central Bank of Sri Lanka - Financial System Stability Review 2020
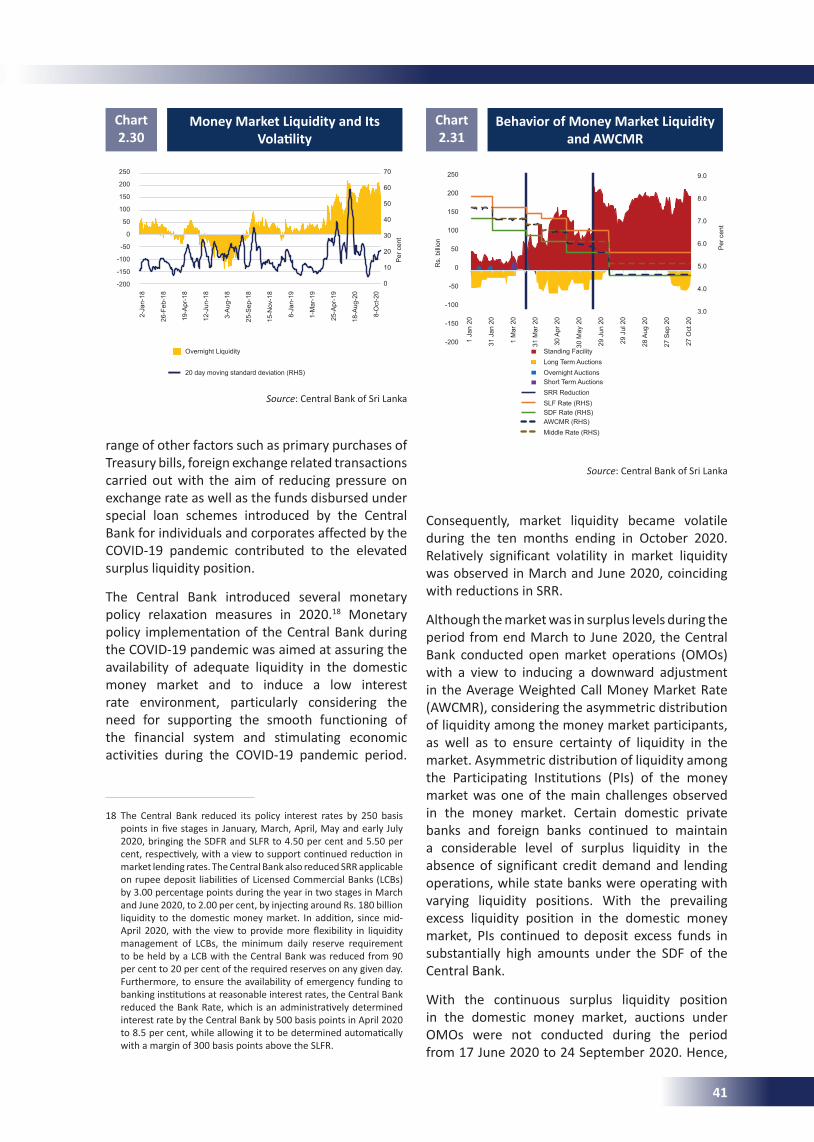
Money Market Liquidity and Its Volatility
Chart 2.30
Source: Central Bank of Sri Lanka
18 The Central Bank reduced its policy interest rates by 250 basis points in five stages in January, March, April, May and early July 2020, bringing the SDFR and SLFR to 4.50 per cent and 5.50 per cent, respectively, with a view to support continued reduction in market lending rates. The Central Bank also reduced SRR applicable on rupee deposit liabilities of Licensed Commercial Banks (LCBs) by 3.00 percentage points during the year in two stages in March and June 2020, to 2.00 per cent, by injecting around Rs. 180 billion liquidity to the domestic money market. In addition, since mid-April 2020, with the view to provide more flexibility in liquidity management of LCBs, the minimum daily reserve requirement to be held by a LCB with the Central Bank was reduced from 90 per cent to 20 per cent of the required reserves on any given day. Furthermore, to ensure the availability of emergency funding to banking institutions at reasonable interest rates, the Central Bank reduced the Bank Rate, which is an administratively determined interest rate by the Central Bank by 500 basis points in April 2020 to 8.5 per cent, while allowing it to be determined automatically with a margin of 300 basis points above the SLFR.
range of other factors such as primary purchases of Treasury bills, foreign exchange related transactions carried out with the aim of reducing pressure on exchange rate as well as the funds disbursed under special loan schemes introduced by the Central Bank for individuals and corporates affected by the COVID-19 pandemic contributed to the elevated surplus liquidity position.
The Central Bank introduced several monetary policy relaxation measures in 2020.18 Monetary policy implementation of the Central Bank during the COVID-19 pandemic was aimed at assuring the availability of adequate liquidity in the domestic money market and to induce a low interest rate environment, particularly considering the need for supporting the smooth functioning of the financial system and stimulating economic activities during the COVID-19 pandemic period.
Consequently, market liquidity became volatile during the ten months ending in October 2020. Relatively significant volatility in market liquidity was observed in March and June 2020, coinciding with reductions in SRR.
Although the market was in surplus levels during the period from end March to June 2020, the Central Bank conducted open market operations (OMOs) with a view to inducing a downward adjustment in the Average Weighted Call Money Market Rate (AWCMR), considering the asymmetric distribution of liquidity among the money market participants, as well as to ensure certainty of liquidity in the market. Asymmetric distribution of liquidity among the Participating Institutions (PIs) of the money market was one of the main challenges observed in the money market. Certain domestic private banks and foreign banks continued to maintain a considerable level of surplus liquidity in the absence of significant credit demand and lending operations, while state banks were operating with varying liquidity positions. With the prevailing excess liquidity position in the domestic money market, PIs continued to deposit excess funds in substantially high amounts under the SDF of the Central Bank.
With the continuous surplus liquidity position in the domestic money market, auctions under OMOs were not conducted during the period from 17 June 2020 to 24 September 2020. Hence,
Behavior of Money Market Liquidity and AWCMR
Chart 2.31
Source: Central Bank of Sri Lanka
250
200
150
100
50
0
-50
-100
-150
-200
2-Ja
n-18
26-F
eb-1
8
19-A
pr-1
8
12-J
un-1
8
3-A
ug-1
8
25-S
ep-1
8
15-N
ov-1
8
8-Ja
n-19
1-M
ar-1
9
25-A
pr-1
9
18-A
ug-2
0
8-O
ct-2
0
70
60
50
40
30
20
10
0
Overnight Liquidity
20 day moving standard deviation (RHS)
Per
cen
t
250
200
150
100
50
0
-50
-100
-150
-200 1 Ja
n 20
31 J
an 2
0
1 M
ar 2
0
31 M
ar 2
0
30 A
pr 2
0
30 M
ay 2
0
29 J
un 2
0
29 J
ul 2
0
28 A
ug 2
0
27 S
ep 2
0
27 O
ct 2
0
9.0
8.0
7.0
6.0
5.0
4.0
3.0
Per
cen
t
Standing Facility Long Term Auctions Overnight Auctions Short Term AuctionsSRR ReductionSLF Rate (RHS)SDF Rate (RHS)AWCMR (RHS)Middle Rate (RHS)
Rs.
bill
ion
41
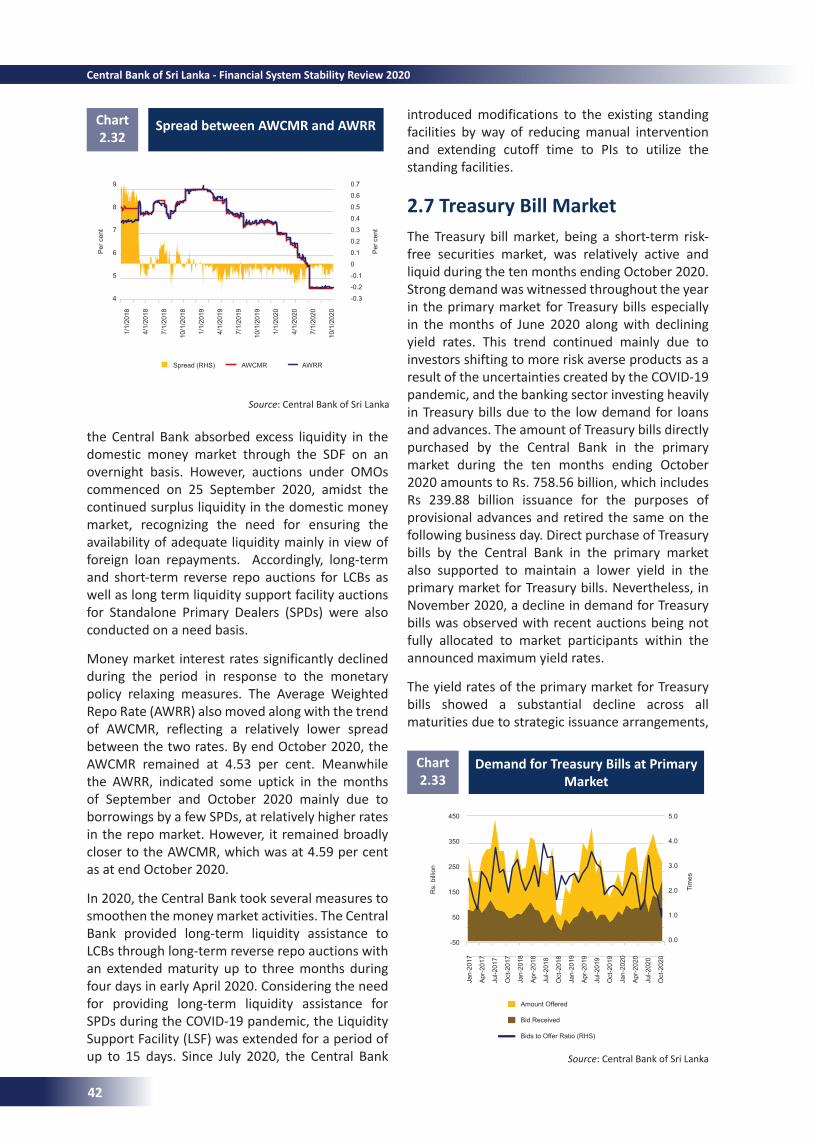
Spread between AWCMR and AWRRChart 2.32
Source: Central Bank of Sri Lanka
Demand for Treasury Bills at Primary Market
Chart 2.33
Source: Central Bank of Sri Lanka
the Central Bank absorbed excess liquidity in the domestic money market through the SDF on an overnight basis. However, auctions under OMOs commenced on 25 September 2020, amidst the continued surplus liquidity in the domestic money market, recognizing the need for ensuring the availability of adequate liquidity mainly in view of foreign loan repayments. Accordingly, long-term and short-term reverse repo auctions for LCBs as well as long term liquidity support facility auctions for Standalone Primary Dealers (SPDs) were also conducted on a need basis.
Money market interest rates significantly declined during the period in response to the monetary policy relaxing measures. The Average Weighted Repo Rate (AWRR) also moved along with the trend of AWCMR, reflecting a relatively lower spread between the two rates. By end October 2020, the AWCMR remained at 4.53 per cent. Meanwhile the AWRR, indicated some uptick in the months of September and October 2020 mainly due to borrowings by a few SPDs, at relatively higher rates in the repo market. However, it remained broadly closer to the AWCMR, which was at 4.59 per cent as at end October 2020.
In 2020, the Central Bank took several measures to smoothen the money market activities. The Central Bank provided long-term liquidity assistance to LCBs through long-term reverse repo auctions with an extended maturity up to three months during four days in early April 2020. Considering the need for providing long-term liquidity assistance for SPDs during the COVID-19 pandemic, the Liquidity Support Facility (LSF) was extended for a period of up to 15 days. Since July 2020, the Central Bank
introduced modifications to the existing standing facilities by way of reducing manual intervention and extending cutoff time to PIs to utilize the standing facilities.
2.7 Treasury Bill Market The Treasury bill market, being a short-term risk-free securities market, was relatively active and liquid during the ten months ending October 2020. Strong demand was witnessed throughout the year in the primary market for Treasury bills especially in the months of June 2020 along with declining yield rates. This trend continued mainly due to investors shifting to more risk averse products as a result of the uncertainties created by the COVID-19 pandemic, and the banking sector investing heavily in Treasury bills due to the low demand for loans and advances. The amount of Treasury bills directly purchased by the Central Bank in the primary market during the ten months ending October 2020 amounts to Rs. 758.56 billion, which includes Rs 239.88 billion issuance for the purposes of provisional advances and retired the same on the following business day. Direct purchase of Treasury bills by the Central Bank in the primary market also supported to maintain a lower yield in the primary market for Treasury bills. Nevertheless, in November 2020, a decline in demand for Treasury bills was observed with recent auctions being not fully allocated to market participants within the announced maximum yield rates.
The yield rates of the primary market for Treasury bills showed a substantial decline across all maturities due to strategic issuance arrangements,
9
8
7
6
5
4
1/1/
2018
4/1/
2018
7/1/
2018
10/1
/201
8
1/1/
2019
4/1/
2019
7/1/
2019
10/1
/201
9
1/1/
2020
4/1/
2020
7/1/
2020
10/1
/202
0
0.7
0.6
0.5
0.4
0.3
0.2
0.1
0
-0.1
-0.2
-0.3
Per
cen
t
Per
cen
t
450
350
250
150
50
-50
Jan-
2017
Apr
-201
7
Jul-2
017
Oct
-201
7
Jan-
2018
Apr
-201
8
Jul-2
018
Oct
-201
8
Jan-
2019
Apr
-201
9
Jul-2
019
Oct
-201
9
Jan-
2020
Apr
-202
0
Jul-2
020
Oct
-202
0
5.0
4.0
3.0
2.0
1.0
0.0
Amount Offered
Bid Received
Bids to Offer Ratio (RHS)
Rs.
bill
ion
Tim
es
Spread (RHS) AWCMR AWRR
42
Central Bank of Sri Lanka - Financial System Stability Review 2020
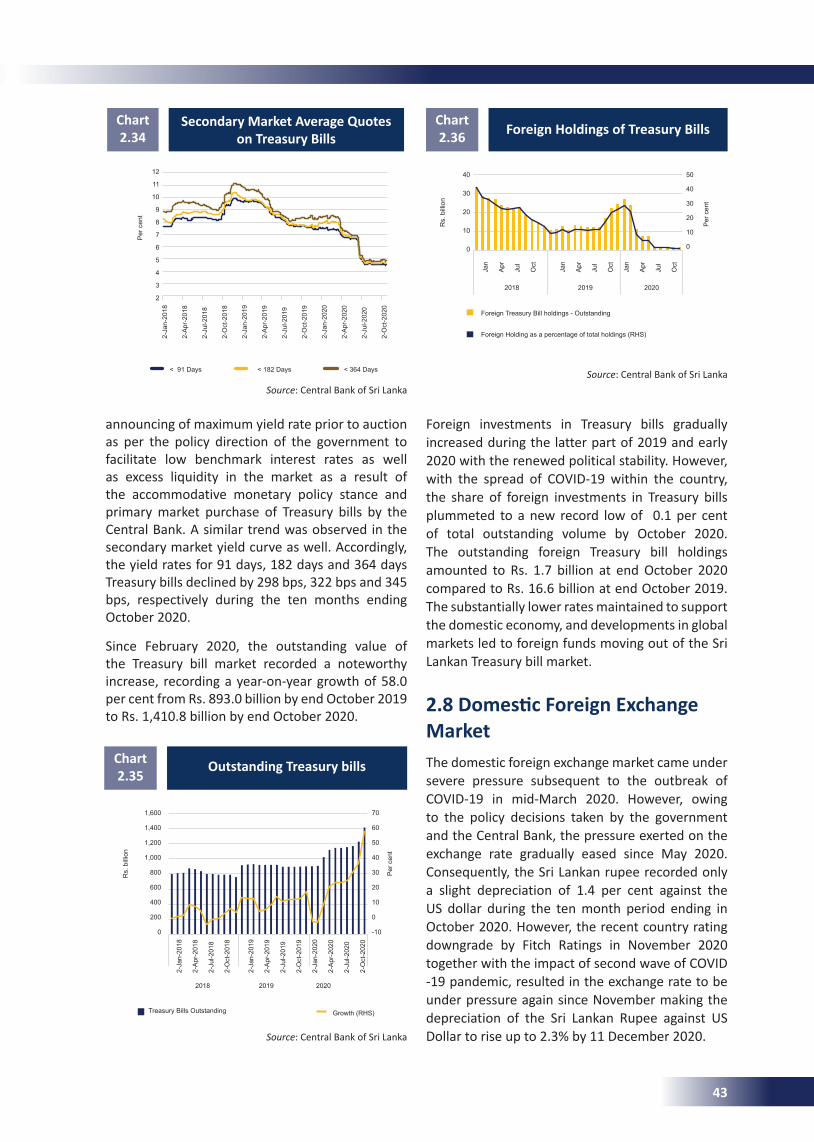
Secondary Market Average Quotes on Treasury Bills
Chart 2.34
Outstanding Treasury billsChart 2.35
Source: Central Bank of Sri Lanka
Source: Central Bank of Sri Lanka
announcing of maximum yield rate prior to auction as per the policy direction of the government to facilitate low benchmark interest rates as well as excess liquidity in the market as a result of the accommodative monetary policy stance and primary market purchase of Treasury bills by the Central Bank. A similar trend was observed in the secondary market yield curve as well. Accordingly, the yield rates for 91 days, 182 days and 364 days Treasury bills declined by 298 bps, 322 bps and 345 bps, respectively during the ten months ending October 2020.
Since February 2020, the outstanding value of the Treasury bill market recorded a noteworthy increase, recording a year-on-year growth of 58.0 per cent from Rs. 893.0 billion by end October 2019 to Rs. 1,410.8 billion by end October 2020.
Foreign investments in Treasury bills gradually increased during the latter part of 2019 and early 2020 with the renewed political stability. However, with the spread of COVID-19 within the country, the share of foreign investments in Treasury bills plummeted to a new record low of 0.1 per cent of total outstanding volume by October 2020. The outstanding foreign Treasury bill holdings amounted to Rs. 1.7 billion at end October 2020 compared to Rs. 16.6 billion at end October 2019. The substantially lower rates maintained to support the domestic economy, and developments in global markets led to foreign funds moving out of the Sri Lankan Treasury bill market.
2.8DomesticForeignExchangeMarketThe domestic foreign exchange market came under severe pressure subsequent to the outbreak of COVID-19 in mid-March 2020. However, owing to the policy decisions taken by the government and the Central Bank, the pressure exerted on the exchange rate gradually eased since May 2020. Consequently, the Sri Lankan rupee recorded only a slight depreciation of 1.4 per cent against the US dollar during the ten month period ending in October 2020. However, the recent country rating downgrade by Fitch Ratings in November 2020 together with the impact of second wave of COVID -19 pandemic, resulted in the exchange rate to be under pressure again since November making the depreciation of the Sri Lankan Rupee against US Dollar to rise up to 2.3% by 11 December 2020.
Foreign Holdings of Treasury BillsChart 2.36
Source: Central Bank of Sri Lanka
12
11
10
9
8
7
6
5
4
3
2
2-Ja
n-20
18
2-A
pr-2
018
2-Ju
l-201
8
2-O
ct-2
018
2-Ja
n-20
19
2-A
pr-2
019
2-Ju
l-201
9
2-O
ct-2
019
2-Ja
n-20
20
2-A
pr-2
020
2-Ju
l-202
0
2-O
ct-2
020
< 91 Days < 182 Days < 364 Days
Per
cen
t
1,600
1,400
1,200
1,000
800
600
400
200
0
2-Ja
n-20
18
2-A
pr-2
018
2-Ju
l-201
8
2-O
ct-2
018
2-Ja
n-20
19
2-A
pr-2
019
2-Ju
l-201
9
2-O
ct-2
019
2-Ja
n-20
20
2-A
pr-2
020
2-Ju
l-202
0
2-O
ct-2
020
Treasury Bills Outstanding
70
60
50
40
30
20
10
0
-10
Rs.
bill
ion
Per
cen
t
Growth (RHS)
2018 2019 2020
40
30
20
10
0
Jan
Apr
Jul
Oct
Jan
Apr
Jul
Oct
Jan
Apr
Jul
Oct
Foreign Treasury Bill holdings - Outstanding
Foreign Holding as a percentage of total holdings (RHS)
50
40
30
20
10
0
Rs.
bill
ion
2018 2019 2020
Per
cen
t
43
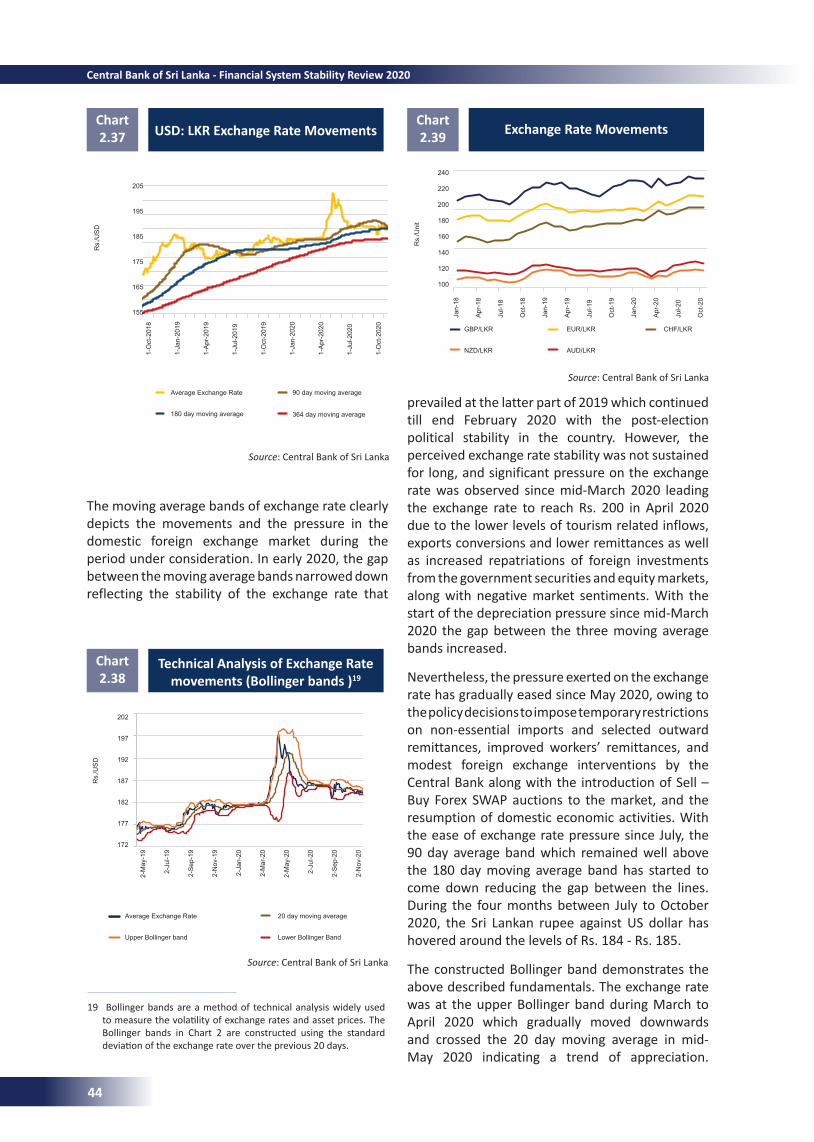
USD:LKRExchangeRateMovementsChart 2.37
Source: Central Bank of Sri Lanka
Technical Analysis of Exchange Rate movements (Bollinger bands )19
Chart 2.38
Source: Central Bank of Sri Lanka
19 Bollinger bands are a method of technical analysis widely used to measure the volatility of exchange rates and asset prices. The Bollinger bands in Chart 2 are constructed using the standard deviation of the exchange rate over the previous 20 days.
Exchange Rate MovementsChart 2.39
Source: Central Bank of Sri Lanka
The moving average bands of exchange rate clearly depicts the movements and the pressure in the domestic foreign exchange market during the period under consideration. In early 2020, the gap between the moving average bands narrowed down reflecting the stability of the exchange rate that
prevailed at the latter part of 2019 which continued till end February 2020 with the post-election political stability in the country. However, the perceived exchange rate stability was not sustained for long, and significant pressure on the exchange rate was observed since mid-March 2020 leading the exchange rate to reach Rs. 200 in April 2020 due to the lower levels of tourism related inflows, exports conversions and lower remittances as well as increased repatriations of foreign investments from the government securities and equity markets, along with negative market sentiments. With the start of the depreciation pressure since mid-March 2020 the gap between the three moving average bands increased.
Nevertheless, the pressure exerted on the exchange rate has gradually eased since May 2020, owing to the policy decisions to impose temporary restrictions on non-essential imports and selected outward remittances, improved workers’ remittances, and modest foreign exchange interventions by the Central Bank along with the introduction of Sell – Buy Forex SWAP auctions to the market, and the resumption of domestic economic activities. With the ease of exchange rate pressure since July, the 90 day average band which remained well above the 180 day moving average band has started to come down reducing the gap between the lines. During the four months between July to October 2020, the Sri Lankan rupee against US dollar has hovered around the levels of Rs. 184 - Rs. 185.
The constructed Bollinger band demonstrates the above described fundamentals. The exchange rate was at the upper Bollinger band during March to April 2020 which gradually moved downwards and crossed the 20 day moving average in mid-May 2020 indicating a trend of appreciation.
205
195
185
175
165
155
1-O
ct-2
018
1-Ja
n-20
19
1-A
pr-2
019
1-Ju
l-201
9
1-O
ct-2
019
1-Ja
n-20
20
1-A
pr-2
020
1-Ju
l-202
0
1-O
ct-2
020
Average Exchange Rate
180 day moving average
Rs.
/US
D
202
197
192
187
182
177
172
2-M
ay-1
9
2-Ju
l-19
2-S
ep-1
9
2-N
ov-1
9
2-Ja
n-20
2-M
ar-2
0
2-M
ay-2
0
2-Ju
l-20
2-S
ep-2
0
2-N
ov-2
0
Average Exchange Rate 20 day moving average
Upper Bollinger band Lower Bollinger Band
Rs.
/US
D
240
220
200
180
160
140
120
100
Jan-
18
Apr
-18
Jul-1
8
Oct
-18
Jan-
19
Apr
-19
Jul-1
9
Oct
-19
Jan-
20
Apr
-20
Jul-2
0
Oct
-20
GBP/LKR EUR/LKR CHF/LKR
NZD/LKR AUD/LKR
Rs.
/Uni
t
90 day moving average
364 day moving average
44
Central Bank of Sri Lanka - Financial System Stability Review 2020
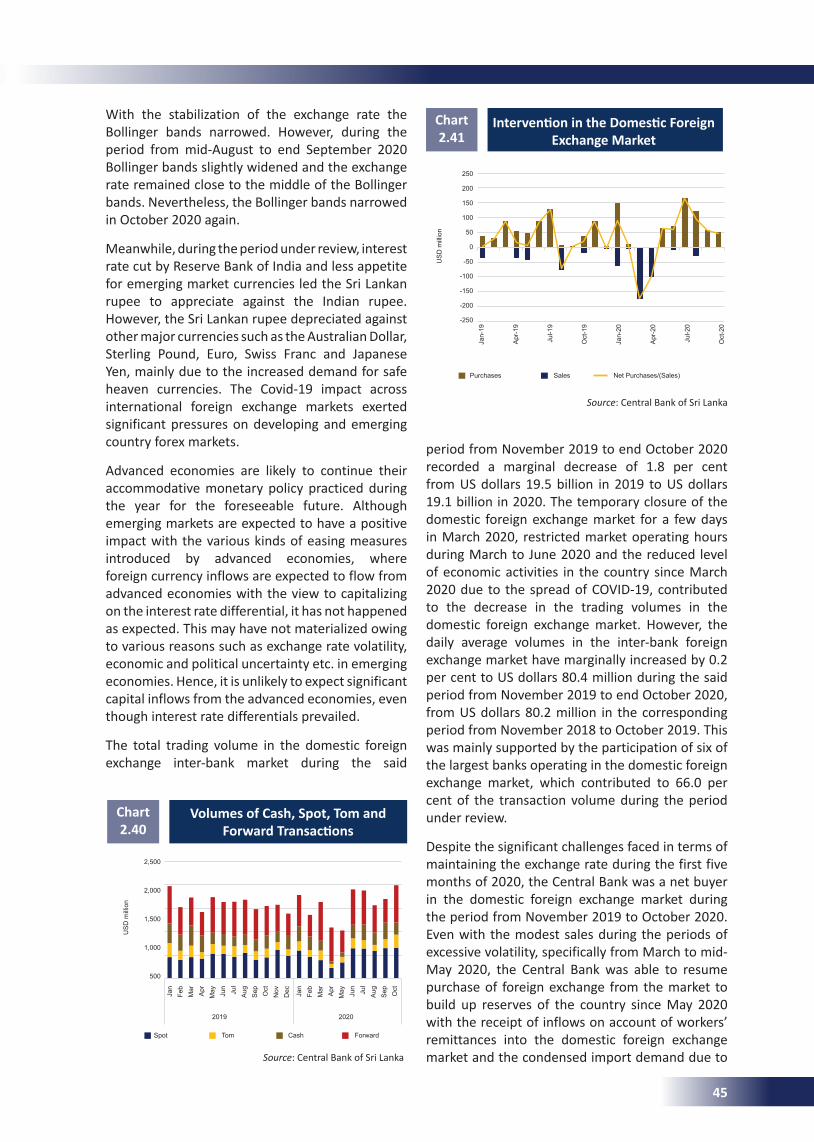
Source: Central Bank of Sri Lanka
Volumes of Cash, Spot, Tom and ForwardTransactions
Chart 2.40
With the stabilization of the exchange rate the Bollinger bands narrowed. However, during the period from mid-August to end September 2020 Bollinger bands slightly widened and the exchange rate remained close to the middle of the Bollinger bands. Nevertheless, the Bollinger bands narrowed in October 2020 again.
Meanwhile, during the period under review, interest rate cut by Reserve Bank of India and less appetite for emerging market currencies led the Sri Lankan rupee to appreciate against the Indian rupee. However, the Sri Lankan rupee depreciated against other major currencies such as the Australian Dollar, Sterling Pound, Euro, Swiss Franc and Japanese Yen, mainly due to the increased demand for safe heaven currencies. The Covid-19 impact across international foreign exchange markets exerted significant pressures on developing and emerging country forex markets.
Advanced economies are likely to continue their accommodative monetary policy practiced during the year for the foreseeable future. Although emerging markets are expected to have a positive impact with the various kinds of easing measures introduced by advanced economies, where foreign currency inflows are expected to flow from advanced economies with the view to capitalizing on the interest rate differential, it has not happened as expected. This may have not materialized owing to various reasons such as exchange rate volatility, economic and political uncertainty etc. in emerging economies. Hence, it is unlikely to expect significant capital inflows from the advanced economies, even though interest rate differentials prevailed.
The total trading volume in the domestic foreign exchange inter-bank market during the said
period from November 2019 to end October 2020 recorded a marginal decrease of 1.8 per cent from US dollars 19.5 billion in 2019 to US dollars 19.1 billion in 2020. The temporary closure of the domestic foreign exchange market for a few days in March 2020, restricted market operating hours during March to June 2020 and the reduced level of economic activities in the country since March 2020 due to the spread of COVID-19, contributed to the decrease in the trading volumes in the domestic foreign exchange market. However, the daily average volumes in the inter-bank foreign exchange market have marginally increased by 0.2 per cent to US dollars 80.4 million during the said period from November 2019 to end October 2020, from US dollars 80.2 million in the corresponding period from November 2018 to October 2019. This was mainly supported by the participation of six of the largest banks operating in the domestic foreign exchange market, which contributed to 66.0 per cent of the transaction volume during the period under review.
Despite the significant challenges faced in terms of maintaining the exchange rate during the first five months of 2020, the Central Bank was a net buyer in the domestic foreign exchange market during the period from November 2019 to October 2020. Even with the modest sales during the periods of excessive volatility, specifically from March to mid-May 2020, the Central Bank was able to resume purchase of foreign exchange from the market to build up reserves of the country since May 2020 with the receipt of inflows on account of workers’ remittances into the domestic foreign exchange market and the condensed import demand due to
InterventionintheDomesticForeignExchange Market
Chart 2.41
Source: Central Bank of Sri Lanka
2,500
2,000
1,500
1,000
500
Jan
Feb
Mar
Apr
May Jun
Jul
Aug
Sep Oct
Nov
Dec Jan
Feb
Mar
Apr
May Jun
Jul
Aug
Sep Oct
Spot Tom Cash Forward
US
D m
illio
n
2019 2020
250
200
150
100
50
0
-50
-100
-150
-200
-250
Jan-
19
Apr
-19
Jul-1
9
Oct
-19
Jan-
20
Apr
-20
Jul-2
0
Oct
-20
Purchases Sales Net Purchases/(Sales)
US
D m
illio
n
45
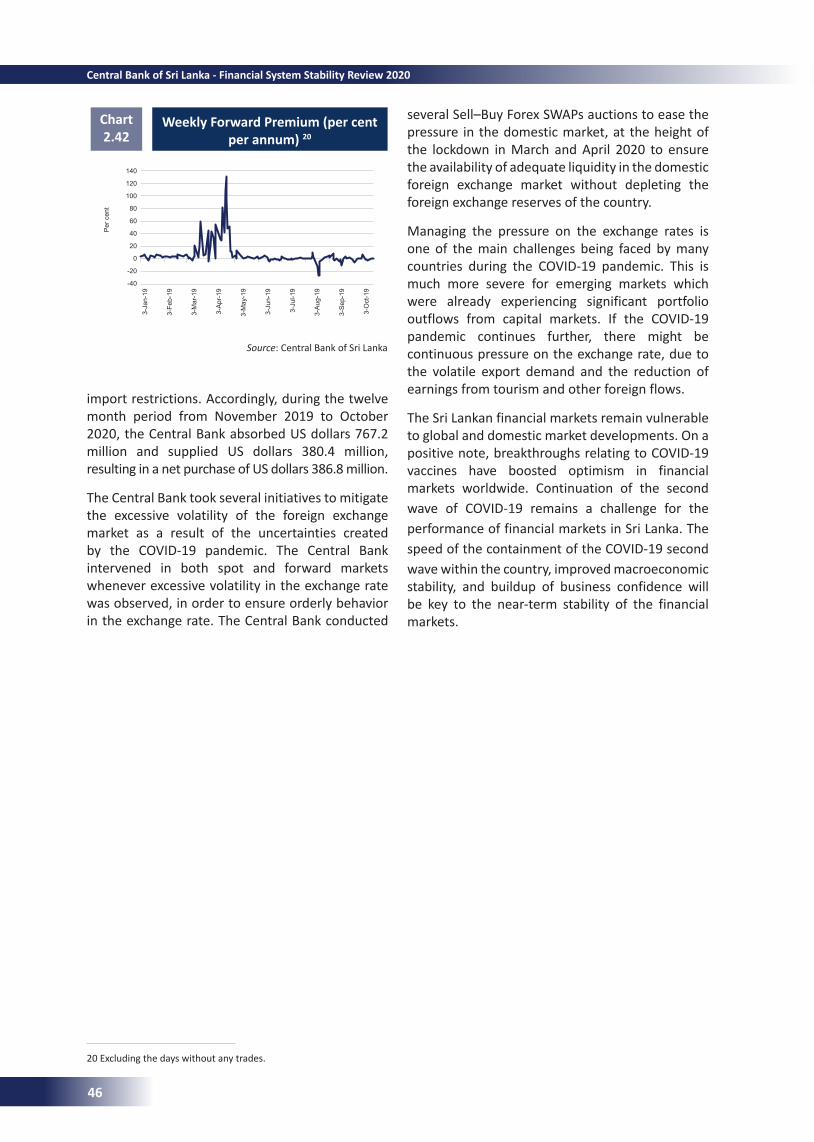
Weekly Forward Premium (per cent per annum) 20
Chart 2.42
Source: Central Bank of Sri Lanka
20 Excluding the days without any trades.
import restrictions. Accordingly, during the twelve month period from November 2019 to October 2020, the Central Bank absorbed US dollars 767.2 million and supplied US dollars 380.4 million, resulting in a net purchase of US dollars 386.8 million.
The Central Bank took several initiatives to mitigate the excessive volatility of the foreign exchange market as a result of the uncertainties created by the COVID-19 pandemic. The Central Bank intervened in both spot and forward markets whenever excessive volatility in the exchange rate was observed, in order to ensure orderly behavior in the exchange rate. The Central Bank conducted
several Sell–Buy Forex SWAPs auctions to ease the pressure in the domestic market, at the height of the lockdown in March and April 2020 to ensure the availability of adequate liquidity in the domestic foreign exchange market without depleting the foreign exchange reserves of the country.
Managing the pressure on the exchange rates is one of the main challenges being faced by many countries during the COVID-19 pandemic. This is much more severe for emerging markets which were already experiencing significant portfolio outflows from capital markets. If the COVID-19 pandemic continues further, there might be continuous pressure on the exchange rate, due to the volatile export demand and the reduction of earnings from tourism and other foreign flows.
The Sri Lankan financial markets remain vulnerable to global and domestic market developments. On a positive note, breakthroughs relating to COVID-19 vaccines have boosted optimism in financial markets worldwide. Continuation of the second wave of COVID-19 remains a challenge for the performance of financial markets in Sri Lanka. The speed of the containment of the COVID-19 second wave within the country, improved macroeconomic stability, and buildup of business confidence will be key to the near-term stability of the financial markets.
140
120
100
80
60
40
20
0
-20
-40
3-Ja
n-19
3-Fe
b-19
3-M
ar-1
9
3-A
pr-1
9
3-M
ay-1
9
3-Ju
n-19
3-Ju
l-19
3-A
ug-1
9
3-S
ep-1
9
3-O
ct-1
9
Per
cen
t
46
Central Bank of Sri Lanka - Financial System Stability Review 2020
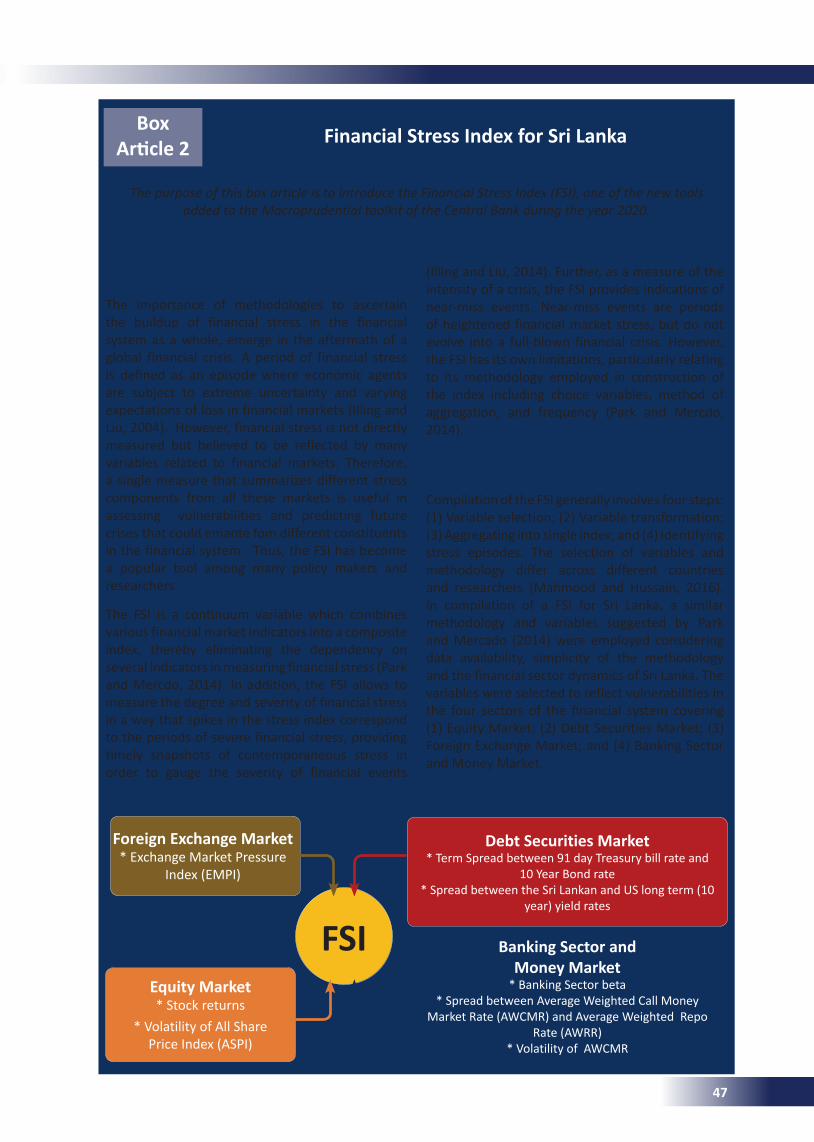
FSI
The importance of methodologies to ascertain the buildup of financial stress in the financial system as a whole, emerge in the aftermath of a global financial crisis. A period of financial stress is defined as an episode where economic agents are subject to extreme uncertainty and varying expectations of loss in financial markets (Illing and Liu, 2004). However, financial stress is not directly measured but believed to be reflected by many variables related to financial markets. Therefore, a single measure that summarizes different stress components from all these markets is useful in assessing vulnerabilities and predicting future crises that could emante fom different constituents in the financial system. Thus, the FSI has become a popular tool among many policy makers and researchers.
The FSI is a continuum variable which combines various financial market indicators into a composite index, thereby eliminating the dependency on several indicators in measuring financial stress (Park and Mercdo, 2014). In addition, the FSI allows to measure the degree and severity of financial stress in a way that spikes in the stress index correspond to the periods of severe financial stress, providing timely snapshots of contemporaneous stress in order to gauge the severity of financial events
Box Article2 Financial Stress Index for Sri Lanka
The purpose of this box article is to introduce the Financial Stress Index (FSI), one of the new tools added to the Macroprudential toolkit of the Central Bank during the year 2020.
Introduction (Illing and Liu, 2014). Further, as a measure of the intensity of a crisis, the FSI provides indications of near-miss events. Near-miss events are periods of heightened financial market stress, but do not evolve into a full-blown financial crisis. However, the FSI has its own limitations, particularly relating to its methodology employed in construction of the index including choice variables, method of aggregation, and frequency (Park and Mercdo, 2014).
MethodologyofConstructingtheFSICompilation of the FSI generally involves four steps: (1) Variable selection; (2) Variable transformation; (3) Aggregating into single index; and (4) Identifying stress episodes. The selection of variables and methodology differ across different countries and researchers (Mahmood and Hussain, 2016). In compilation of a FSI for Sri Lanka, a similar methodology and variables suggested by Park and Mercado (2014) were employed considering data availability, simplicity of the methodology and the financial sector dynamics of Sri Lanka. The variables were selected to reflect vulnerabilities in the four sectors of the financial system covering (1) Equity Market; (2) Debt Securities Market; (3) Foreign Exchange Market; and (4) Banking Sector and Money Market.
Equity Market* Stock returns
* Volatility of All Share Price Index (ASPI)
Foreign Exchange Market* Exchange Market Pressure
Index (EMPI)
Debt Securities Market* Term Spread between 91 day Treasury bill rate and
10 Year Bond rate * Spread between the Sri Lankan and US long term (10
year) yield rates
Banking Sector and Money Market
* Banking Sector beta* Spread between Average Weighted Call Money
Market Rate (AWCMR) and Average Weighted Repo Rate (AWRR)
* Volatility of AWCMR
47
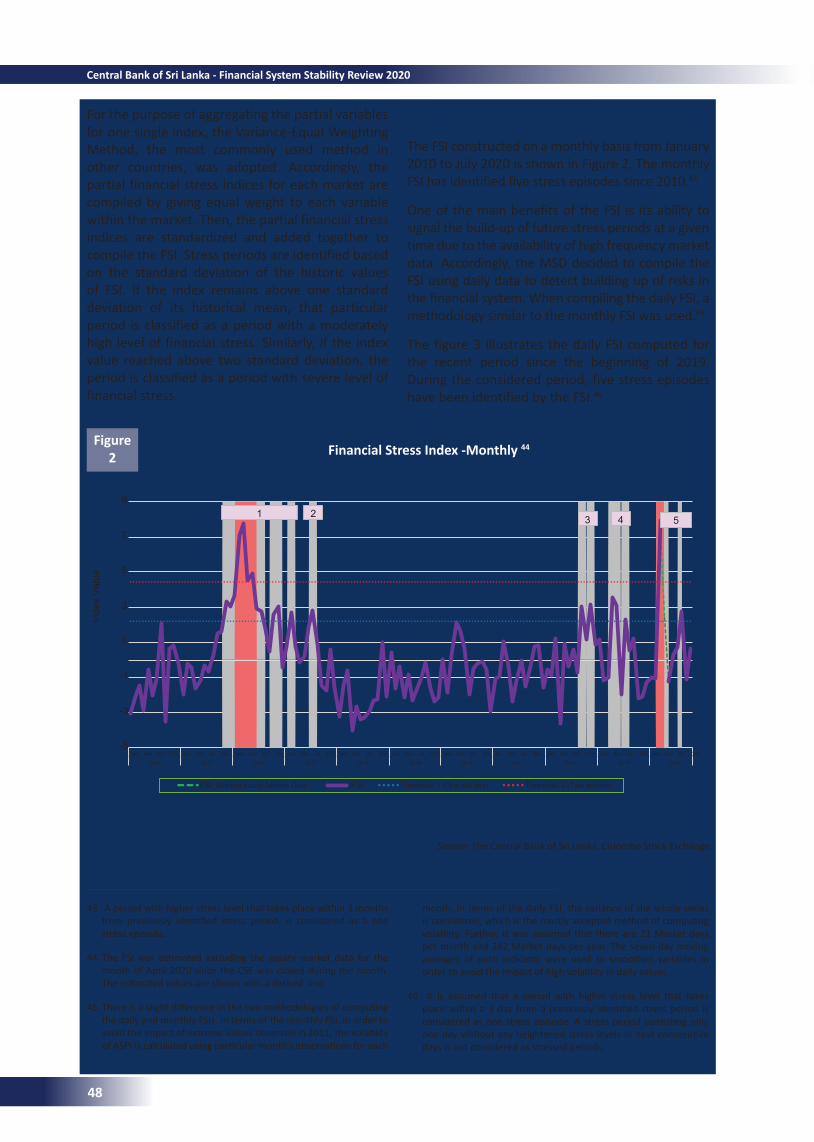
For the purpose of aggregating the partial variables for one single index, the Variance-Equal Weighting Method, the most commonly used method in other countries, was adopted. Accordingly, the partial financial stress indices for each market are compiled by giving equal weight to each variable within the market. Then, the partial financial stress indices are standardized and added together to compile the FSI. Stress periods are identified based on the standard deviation of the historic values of FSI. If the index remains above one standard deviation of its historical mean, that particular period is classified as a period with a moderately high level of financial stress. Similarly, if the index value reached above two standard deviation, the period is classified as a period with severe level of financial stress.
43 A period with higher stress level that takes place within 3 months from previously identified stress period, is considered as a one stress episode.
44 The FSI was estimated excluding the equity market data for the month of April 2020 since the CSE was closed during the month. The estimated values are shown with a dashed line.
45 There is a slight difference in the two methodologies of computing the daily and monthly FSIs. In terms of the monthly FSI, in order to avoid the impact of extreme values observed in 2011, the volatility of ASPI is calculated using particular month’s observations for each
Financial Stress Index -Monthly 44Figure 2
Source: The Central Bank of Sri Lanka, Colombo Stock Exchange
-5
-3
-1
1
3
5
7
9
Jan Apr Jul Oct Jan Apr Jul Oct
2010 2011 2012
Inde
x V
alue
FSI_Without Ecuity Market Data FSI Threshold 1 (One std dev) Threshold 2 (Two std dev)
4315
Jan Apr Jul Oct
2013
Jan Apr Jul Oct
2014
Jan Apr Jul Oct
2015
Jan Apr Jul Oct
2016
Jan Apr Jul Oct
2017
Jan Apr Jul Oct
2018
Jan Apr Jul Oct
2019
Jan Apr Jul Oct
2020
Jan Apr Jul Oct
2
Behaviour of Monthly FSIThe FSI constructed on a monthly basis from January 2010 to July 2020 is shown in Figure 2. The monthly FSI has identified five stress episodes since 2010.43
One of the main benefits of the FSI is its ability to signal the build-up of future stress periods at a given time due to the availability of high frequency market data. Accordingly, the MSD decided to compile the FSI using daily data to detect building up of risks in the financial system. When compiling the daily FSI, a methodology similar to the monthly FSI was used.45
The figure 3 illustrates the daily FSI computed for the recent period since the beginning of 2019. During the considered period, five stress episodes have been identified by the FSI.46
month. In terms of the daily FSI, the variance of the whole series is considered, which is the mostly accepted method of computing volatility. Further, it was assumed that there are 21 Market days per month and 242 Market days per year. The seven-day moving averages of each indicator were used to smoothen variables in order to avoid the impact of high volatility in daily values.
46 It is assumed that a period with higher stress level that takes place within a 3 day from a previously identified stress period is considered as one stress episode. A stress period consisting only one day without any heightened stress levels in next consecutive days is not considered as stressed periods.
48
Central Bank of Sri Lanka - Financial System Stability Review 2020
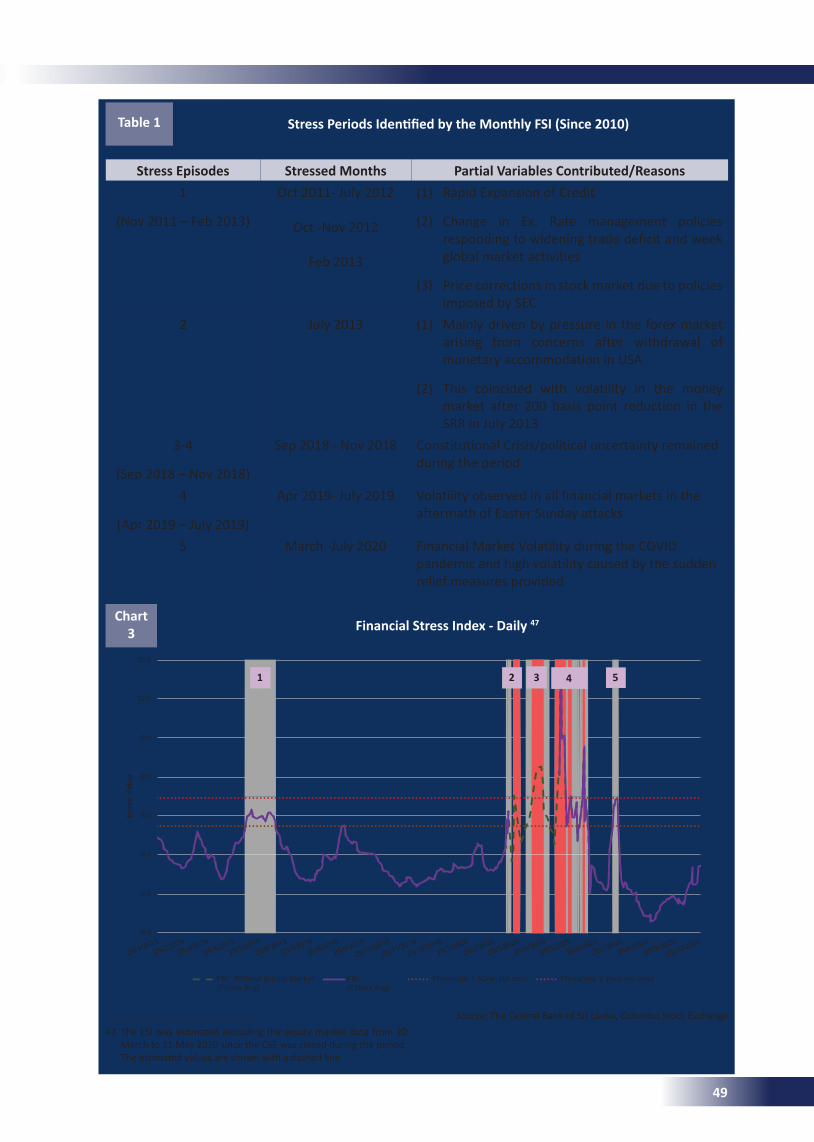
Financial Stress Index - Daily 47Chart 3
Source: The Central Bank of Sri Lanka, Colombo Stock Exchange
-6.0
-3.0
0.0
3.0
6.0
9.0
12.0
15.0
25/1/201925/2/2019
25/3/201925/4/2019
25/5/201925/6/2019
25/7/201925/8/2019
25/9/2019
25/10/2019
25/11/2019
25/12/201925/1/2020
25/2/202025/3/2020
25/4/202025/5/2020
25/6/202025/7/2020
25/8/202025/9/2020
25/10/2020
Inde
x V
alue
FSI_Without Equity Market(7 Days Avg)
FSI(7 Days Avg)
Threshold 1 (One std dev) Threshold 2 (two std dev)
21 3 54
Stress Episodes Stressed Months Partial Variables Contributed/Reasons1
(Nov 2011 – Feb 2013)
Oct 2011- July 2012 (1) Rapid Expansion of Credit
(2) Change in Ex. Rate management policies responding to widening trade deficit and week global market activities
(3) Price corrections in stock market due to policies imposed by SEC
Oct -Nov 2012
Feb 2013
2 July 2013 (1) Mainly driven by pressure in the forex market arising from concerns after withdrawal of monetary accommodation in USA
(2) This coincided with volatility in the money market after 200 basis point reduction in the SRR in July 2013
3-4
(Sep 2018 – Nov 2018)
Sep 2018 - Nov 2018 Constitutional Crisis/political uncertainty remained during the period
4
(Apr 2019 – July 2019)
Apr 2019- July 2019 Volatility observed in all financial markets in the aftermath of Easter Sunday attacks
5 March -July 2020 Financial Market Volatility during the COVID pandemic and high volatility caused by the sudden relief measures provided
StressPeriodsIdentifiedbytheMonthlyFSI(Since2010)Table 1
47 The FSI was estimated excluding the equity market data from 20 March to 11 May 2020 since the CSE was closed during the period. The estimated values are shown with a dashed line.
49
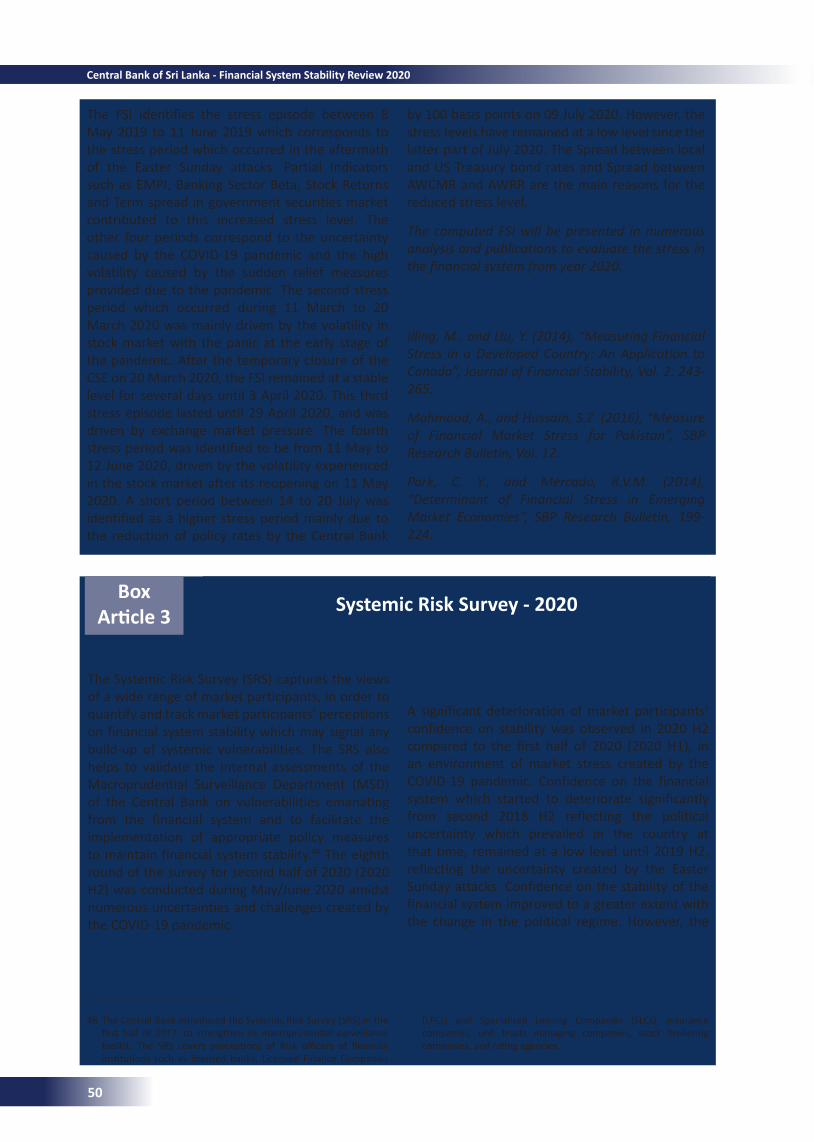
The FSI identifies the stress episode between 8 May 2019 to 11 June 2019 which corresponds to the stress period which occurred in the aftermath of the Easter Sunday attacks. Partial Indicators such as EMPI, Banking Sector Beta, Stock Returns and Term spread in government securities market contributed to this increased stress level. The other four periods correspond to the uncertainty caused by the COVID-19 pandemic and the high volatility caused by the sudden relief measures provided due to the pandemic. The second stress period which occurred during 11 March to 20 March 2020 was mainly driven by the volatility in stock market with the panic at the early stage of the pandemic. After the temporary closure of the CSE on 20 March 2020, the FSI remained at a stable level for several days until 3 April 2020. This third stress episode lasted until 29 April 2020, and was driven by exchange market pressure. The fourth stress period was identified to be from 11 May to 12 June 2020, driven by the volatility experienced in the stock market after its reopening on 11 May 2020. A short period between 14 to 20 July was identified as a higher stress period mainly due to the reduction of policy rates by the Central Bank
by 100 basis points on 09 July 2020. However, the stress levels have remained at a low level since the latter part of July 2020. The Spread between local and US Treasury bond rates and Spread between AWCMR and AWRR are the main reasons for the reduced stress level.
The computed FSI will be presented in numerous analysis and publications to evaluate the stress in the financial system from year 2020.
Reference Illing, M., and Liu, Y. (2014), “Measuring Financial Stress in a Developed Country: An Application to Canada”, Journal of Financial Stability, Vol. 2: 243-265.
Mahmood, A., and Hussain, S.Z. (2016), “Measure of Financial Market Stress for Pakistan”, SBP Research Bulletin, Vol. 12.
Park, C. Y., and Mercado, R.V.M. (2014), “Determinant of Financial Stress in Emerging Market Economies”, SBP Research Bulletin, 199-224.
Box Article3 Systemic Risk Survey - 2020
The Systemic Risk Survey (SRS) captures the views of a wide range of market participants, in order to quantify and track market participants’ perceptions on financial system stability which may signal any build-up of systemic vulnerabilities. The SRS also helps to validate the internal assessments of the Macroprudential Surveillance Department (MSD) of the Central Bank on vulnerabilities emanating from the financial system and to facilitate the implementation of appropriate policy measures to maintain financial system stability.48 The eighth round of the survey for second half of 2020 (2020 H2) was conducted during May/June 2020 amidst numerous uncertainties and challenges created by the COVID-19 pandemic.
48 The Central Bank introduced the Systemic Risk Survey (SRS) in the first half of 2017, to strengthen its macroprudential surveillance toolkit. The SRS covers perceptions of Risk officers of financial institutions such as licensed banks, Licensed Finance Companies
(LFCs) and Specialized Leasing Companies (SLCs), insurance companies, unit trusts managing companies, stock brokering companies, and rating agencies.
ConfidenceontheFinancialSystemA significant deterioration of market participants’ confidence on stability was observed in 2020 H2 compared to the first half of 2020 (2020 H1), in an environment of market stress created by the COVID-19 pandemic. Confidence on the financial system which started to deteriorate significantly from second 2018 H2 reflecting the political uncertainty which prevailed in the country at that time, remained at a low level until 2019 H2, reflecting the uncertainty created by the Easter Sunday attacks. Confidence on the stability of the financial system improved to a greater extent with the change in the political regime. However, the
50
Central Bank of Sri Lanka - Financial System Stability Review 2020
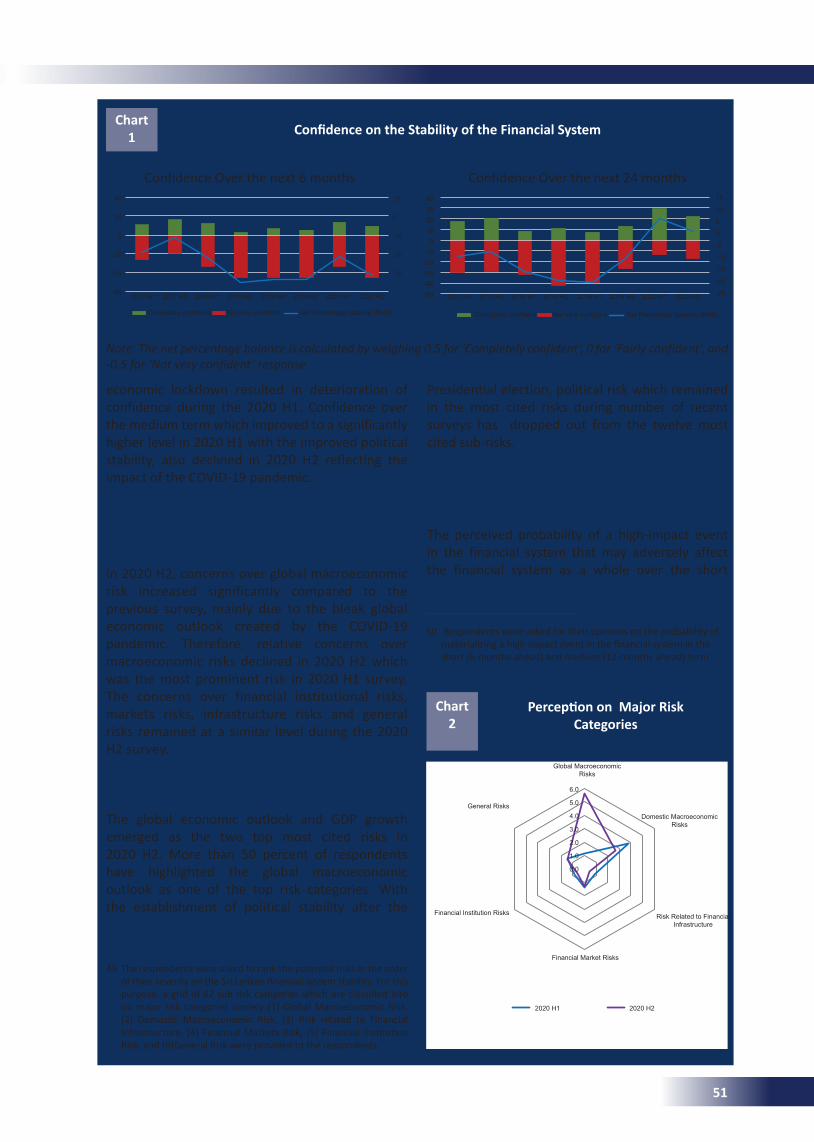
ConfidenceontheStabilityoftheFinancialSystemChart
1
economic lockdown resulted in deterioration of confidence during the 2020 H1. Confidence over the medium term which improved to a significantly higher level in 2020 H1 with the improved political stability, also declined in 2020 H2 reflecting the impact of the COVID-19 pandemic.
Sources of Risks to the Financial System49
In 2020 H2, concerns over global macroeconomic risk increased significantly compared to the previous survey, mainly due to the bleak global economic outlook created by the COVID-19 pandemic. Therefore, relative concerns over macroeconomic risks declined in 2020 H2 which was the most prominent risk in 2020 H1 survey. The concerns over financial institutional risks, markets risks, infrastructure risks and general risks remained at a similar level during the 2020 H2 survey.
Top Most Cited Sub-RisksThe global economic outlook and GDP growth emerged as the two top most cited risks in 2020 H2. More than 50 percent of respondents have highlighted the global macroeconomic outlook as one of the top risk categories. With the establishment of political stability after the
49 The respondents were asked to rank the potential risks in the order of their severity on the Sri Lankan financial system stability. For this purpose, a grid of 62 sub risk categories which are classified into six major risk categories namely (1) Global Macroeconomic Risk, (2) Domestic Macroeconomic Risk, (3) Risk related to Financial Infrastructure, (4) Financial Markets Risk, (5) Financial Institution Risk, and (6)General Risk were provided to the respondents.
Note: The net percentage balance is calculated by weighing 0.5 for ‘Completely confident’, 0 for ‘Fairly confident’, and -0.5 for ‘Not very confident’ response
Presidential election, political risk which remained in the most cited risks during number of recent surveys has dropped out from the twelve most cited sub-risks.
Perceived Probability of a High Impact Event 50
The perceived probability of a high-impact event in the financial system that may adversely affect the financial system as a whole over the short
PerceptiononMajorRiskCategories
Chart 2
General RisksFinancial Institution RisksGlobal Macroeconomic RisksDomestic Macroeconomic RisksRisk Related to Financial InfrastructureFinancial Market Risks
6.05.04.03.02.01.00.02020 H12020 H2
2020 H1 2020 H2
General Risks
Global Macroeconomic Risks
Domestic Macroeconomic Risks
Risk Related to Financial Infrastructure
Financial Market Risks
Financial Institution Risks
6.0
5.0
4.0
3.0
2.0
1.0
0.0
40
20
0
-20
-40
-60
Completely confident Completely confident
2017 H1 2017 H12019 H1 2019 H12017 H2 2017 H22019 H2 2019 H22018 H1 2018 H12020 H1 2020 H12018 H2 2018 H22020 H2 2020 H2
Not very confident Not very confidentNet Percentage balance (RHS) Net Percentage balance (RHS)
10
0
-10
-20
-30
15
10
5
0
-5
-10
-15
-20
-25
403020100
-10-20-30-40-50
Confidence Over the next 6 months Confidence Over the next 24 months
50 Respondents were asked for their opinions on the probability of materializing a high impact event in the financial system in the short (6-months ahead) and medium (12-months ahead) term.
51
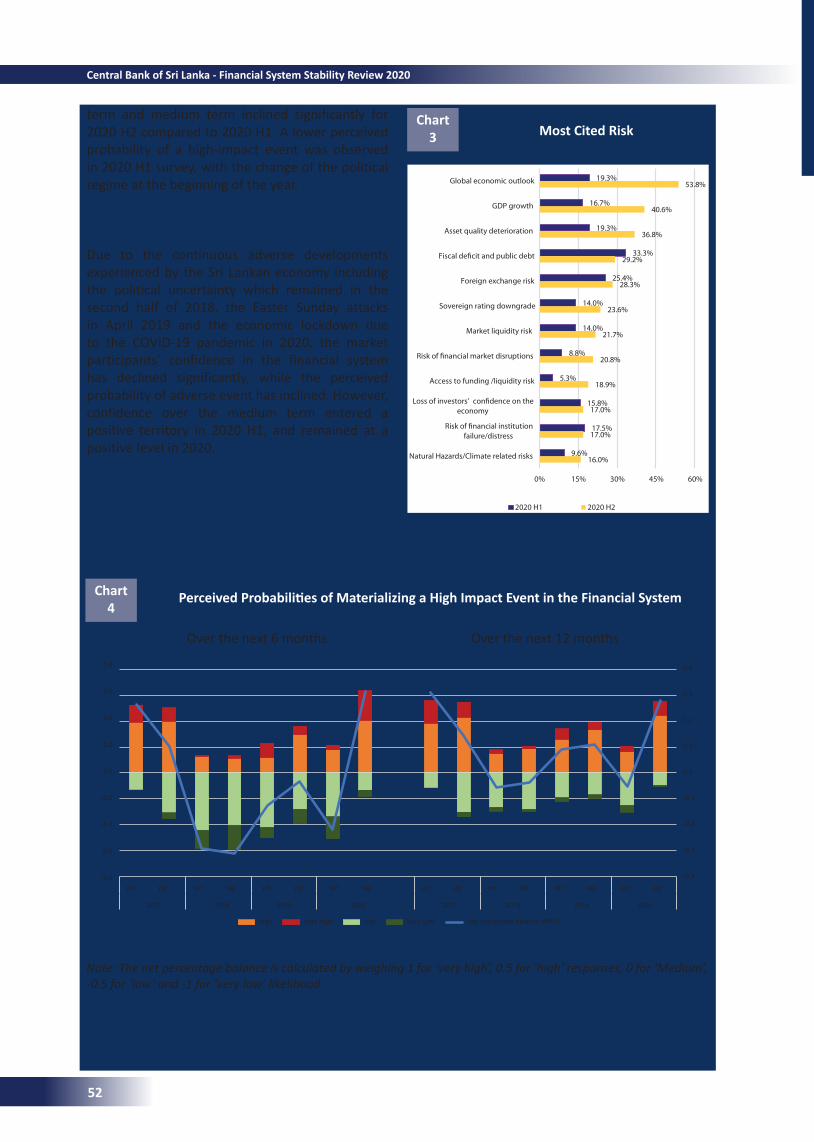
H1 H2H1 H2
term and medium term inclined significantly for 2020 H2 compared to 2020 H1. A lower perceived probability of a high-impact event was observed in 2020 H1 survey, with the change of the political regime at the beginning of the year.
ConclusionDue to the continuous adverse developments experienced by the Sri Lankan economy including the political uncertainty which remained in the second half of 2018, the Easter Sunday attacks in April 2019 and the economic lockdown due to the COVID-19 pandemic in 2020, the market participants’ confidence in the financial system has declined significantly, while the perceived probability of adverse event has inclined. However, confidence over the medium term entered a positive territory in 2020 H1, and remained at a positive level in 2020.
Most Cited RiskChart
3
122 Financial System Stability Review -2020
risks remained at a similar level during the
2020 H2 survey.
Top Most Cited Sub-Risks The global economic outlook and GDP
growth emerged as the two top most cited
risks in 2020 H2. More than 50 percent of
respondents have highlighted the global
macroeconomic outlook as one of the top risk
categories. With the establishment of
political stability after the Presidential
election, political risk which remained in the
most cited risks during number of recent
50 Respondents were asked for their opinions on the probability of materializing a high impact event in
surveys has dropped out from the twelve
most cited sub-risks.
Perceived Probability of a High Impact Event50 The perceived probability of a high-impact
event in the financial system that may
adversely affect the financial system as a
whole over the short term and medium term
inclined significantly for 2020 H2 compared
to 2020 H1. A lower perceived probability of
a high-impact event was observed in 2020 H1
survey, with the change of the political
regime at the beginning of the year.
Conclusion Due to the continuous adverse developments
experienced by the Sri Lankan economy
including the political uncertainty which
remained in the second half of 2018, the
Easter Sunday attacks in April 2019 and the
economic lockdown due to the COVID-19
pandemic in 2020, the market participants’
confidence in the financial system has
declined significantly, while the perceived
probability of adverse event has inclined.
However, confidence over the medium term
entered a positive territory in 2020 H1, and
remained at a positive level in 2020.
the �nancial system in the short (6-months ahead) and medium (12-months ahead) term.
Chart B3.3: Most Cited Risk
19.3%
16.7%
19.3%
33.3%
25.4%
14.0%
14.0%
8.8%
5.3%
15.8%
17.5%
9.6%
53.8%
40.6%
36.8%
29.2%
28.3%
23.6%
21.7%
20.8%
18.9%
17.0%
17.0%
16.0%
0% 15% 30% 45% 60%
Global economic outlook
GDP growth
Asset quality deterioration
Fiscal de�cit and public debt
Foreign exchange risk
Sovereign rating downgrade
Market liquidity risk
Risk of �nancial market disruptions
Access to funding /liquidity risk
Loss of investors’ con�dence on the economy
Risk of �nancial institutionfailure/distress
Natural Hazards/Climate related risks
2020 H1 2020 H2
PerceivedProbabilitiesofMaterializingaHighImpactEventintheFinancialSystemChart 4
Note: The net percentage balance is calculated by weighing 1 for ‘very high’, 0.5 for ‘high’ responses, 0 for ‘Medium’, -0.5 for ‘low’ and -1 for ‘very low’ likelihood.
0.8
0.6
0.4
0.2
0.0
-0.2
-0.4
-0.6
-0.8
0.4
0.3
0.2
0.1
0.0
-0.1
-0.2
-0.3
-0.4
Over the next 6 months Over the next 12 months
H1 H2
High LowVery High Very Low Net percentage balance (RHS)
20172017 2018 20182019 2019 20202020
H1 H2 H1 H2 H1 H2 H1 H2 H1 H2
52
Central Bank of Sri Lanka - Financial System Stability Review 2020
Chapter 3
FinancialInstitutions
Financial Institutions (FIs) of the country remained resilient amidst unprecedented shocks to economic activities caused by the COVID-19 pandemic globally and domestically during the nine months ending September 2020. Headwinds of sluggish economic performance and the Easter Sunday attacks had already affected the performance of FIs in 2019, as reflected by the deterioration in asset quality and profitability. In such an environment, the spread of COVID-19 in 2020 and associated public health concerns to contain the outbreak caused substantial disruptions to domestic economic and business activities. Travel restrictions across provincial borders and economic lockdowns led to a significant decline in revenues of corporates and household sector of the country. In an environment of limited fiscal space available to stimulate the economy hit by the COVID-19 pandemic, a debt moratorium was implemented through the financial sector to support borrowers who had lost their income.21 The performance of some FIs has been also impacted by the introduction of import restrictions to curtail non-essential imports and the sovereign rating downgrade. Lower demand for loans and advances forced banks to divert their funds to liquid assets such as Treasury bills and Treasury bonds with lower returns. As a result, year-on-year growth in investments of the banking sector increased considerably. Timely and appropriate regulatory forbearances introduced by the Central Bank assured the overall stability of the financial system without causing any major macroprudential concerns during the nine months ending September 2020. Unprecedented easing of monetary policy was adopted in response to Covid-19 pandemic to ensure availability of adequate liquidity in inter-bank markets and also to support FIs to maintain resilience.
3.1 OverviewThe banking sector, the dominant sector of the financial system was well positioned in capital and liquidity to weather unexpected shocks at the beginning of 2020 though banking sector experienced increased NPLs and decreasing profitability. In response to meet the regulatory minimum capital requirement, the banking sector built their capital level during the last couple of years. Implementation of international best practices for creating buffers at the favourable time along with regulatory forbearances at turbulent time enabled the banking sector to maintain an adequate level of liquidity and capital during this period of turmoil. Despite the debt moratorium provided to COVID-19 affected businesses and individuals, increasing NPL has become a concern in credit risk management of the banking sector and the real impact of the pandemic on asset quality is expected to be realized upon cessation of the moratorium. Therefore, the debt moratorium and other concessions granted on repayment of loans due to the COVID-19 pandemic, understate the deteriorating credit quality of the banking sector, which if not adequately managed, may threaten the solvency and liquidity of the sector.
The nine months ending September 2020 were a challenging period for the Licensed Finance Companies (LFCs) and Specialised Leasing Companies (SLCs) sector in terms of higher credit risk, declining profitability and inadequate capital levels for a number of companies. The LFCs and SLCs sector was more vulnerable than the banking sector already before the COVID-19 outbreak. The COVID-19 pandemic compounded the existing trends within the LFCs and SLCs sector and pointed to the elevated vulnerabilities in comparison to the banking sector. However, the sector as a whole, maintained capital and liquidity buffers well above the regulatory minimum levels. The Central Bank announced a Master Plan of consolidation aimed at strengthening the LFC and SLC sector, by facilitating the merger of distressed finance companies with
21 Under this debt moratorium borrowers are allowed to request banks to defer their capital and interest payments, until the economy picks up and their income streams improve. At the same time, the debt moratorium reduces the expected credit losses of FIs and extends them over time while reducing their revenues.
53
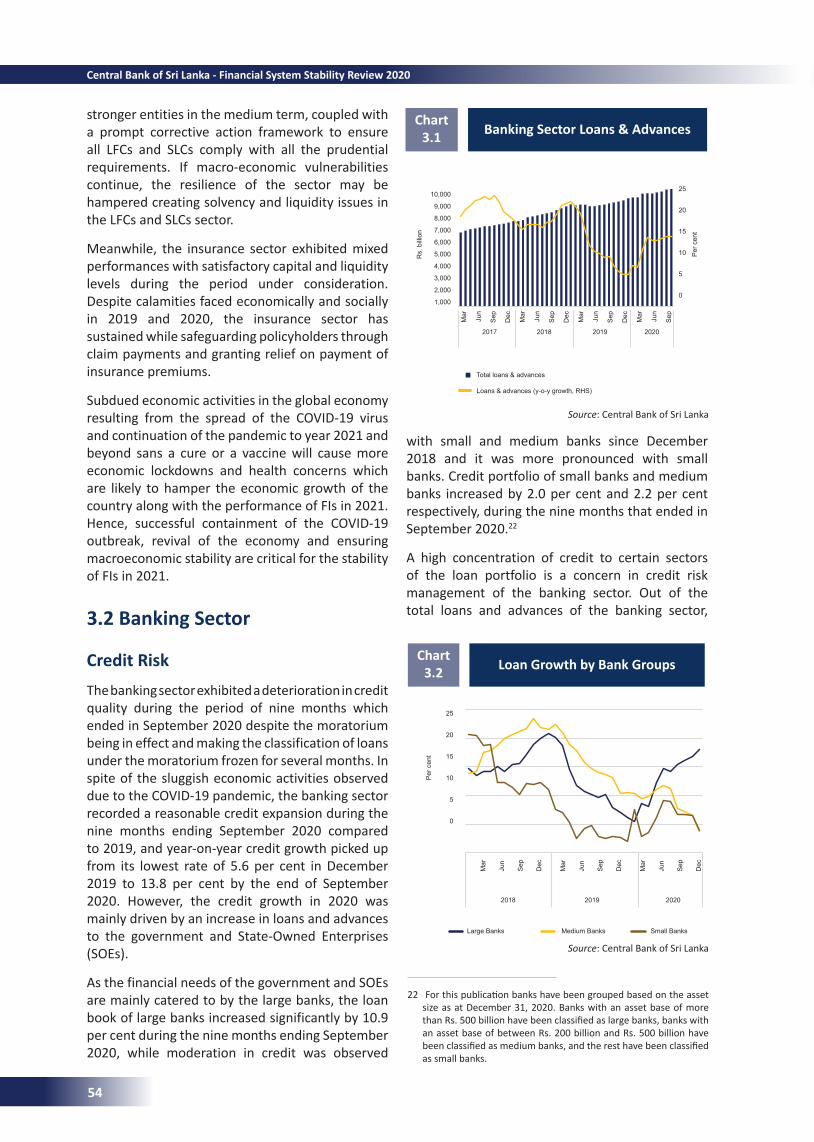
stronger entities in the medium term, coupled with a prompt corrective action framework to ensure all LFCs and SLCs comply with all the prudential requirements. If macro-economic vulnerabilities continue, the resilience of the sector may be hampered creating solvency and liquidity issues in the LFCs and SLCs sector.
Meanwhile, the insurance sector exhibited mixed performances with satisfactory capital and liquidity levels during the period under consideration. Despite calamities faced economically and socially in 2019 and 2020, the insurance sector has sustained while safeguarding policyholders through claim payments and granting relief on payment of insurance premiums.
Subdued economic activities in the global economy resulting from the spread of the COVID-19 virus and continuation of the pandemic to year 2021 and beyond sans a cure or a vaccine will cause more economic lockdowns and health concerns which are likely to hamper the economic growth of the country along with the performance of FIs in 2021. Hence, successful containment of the COVID-19 outbreak, revival of the economy and ensuring macroeconomic stability are critical for the stability of FIs in 2021.
3.2 Banking Sector
Credit RiskThe banking sector exhibited a deterioration in credit quality during the period of nine months which ended in September 2020 despite the moratorium being in effect and making the classification of loans under the moratorium frozen for several months. In spite of the sluggish economic activities observed due to the COVID-19 pandemic, the banking sector recorded a reasonable credit expansion during the nine months ending September 2020 compared to 2019, and year-on-year credit growth picked up from its lowest rate of 5.6 per cent in December 2019 to 13.8 per cent by the end of September 2020. However, the credit growth in 2020 was mainly driven by an increase in loans and advances to the government and State-Owned Enterprises (SOEs).
As the financial needs of the government and SOEs are mainly catered to by the large banks, the loan book of large banks increased significantly by 10.9 per cent during the nine months ending September 2020, while moderation in credit was observed
Banking Sector Loans & Advances Chart
3.1
Source: Central Bank of Sri Lanka
22 For this publication banks have been grouped based on the asset size as at December 31, 2020. Banks with an asset base of more than Rs. 500 billion have been classified as large banks, banks with an asset base of between Rs. 200 billion and Rs. 500 billion have been classified as medium banks, and the rest have been classified as small banks.
Loan Growth by Bank Groups Chart
3.2
Source: Central Bank of Sri Lanka
with small and medium banks since December 2018 and it was more pronounced with small banks. Credit portfolio of small banks and medium banks increased by 2.0 per cent and 2.2 per cent respectively, during the nine months that ended in September 2020.22
A high concentration of credit to certain sectors of the loan portfolio is a concern in credit risk management of the banking sector. Out of the total loans and advances of the banking sector,
10,000
9,000
8,000
7,000
6,000
5,000
4,000
3,000
2,000
1,000
Mar
Jun
Sep
Dec
Mar
Jun
Sep
Dec
Mar
Jun
Sep
Dec
Mar
Jun
Sep
Total loans & advances
Loans & advances (y-o-y growth, RHS)
25
20
15
10
5
0
2017 2018 2019 2020
Rs.
bill
ion
Mar
Jun
Sep
Dec
Mar
Jun
Sep
Dec
Mar
Jun
Sep
Dec
Large Banks Medium Banks Small Banks
2018 2019 2020
25
20
15
10
5
0
Per
cen
t
Per
cen
t
54
Central Bank of Sri Lanka - Financial System Stability Review 2020
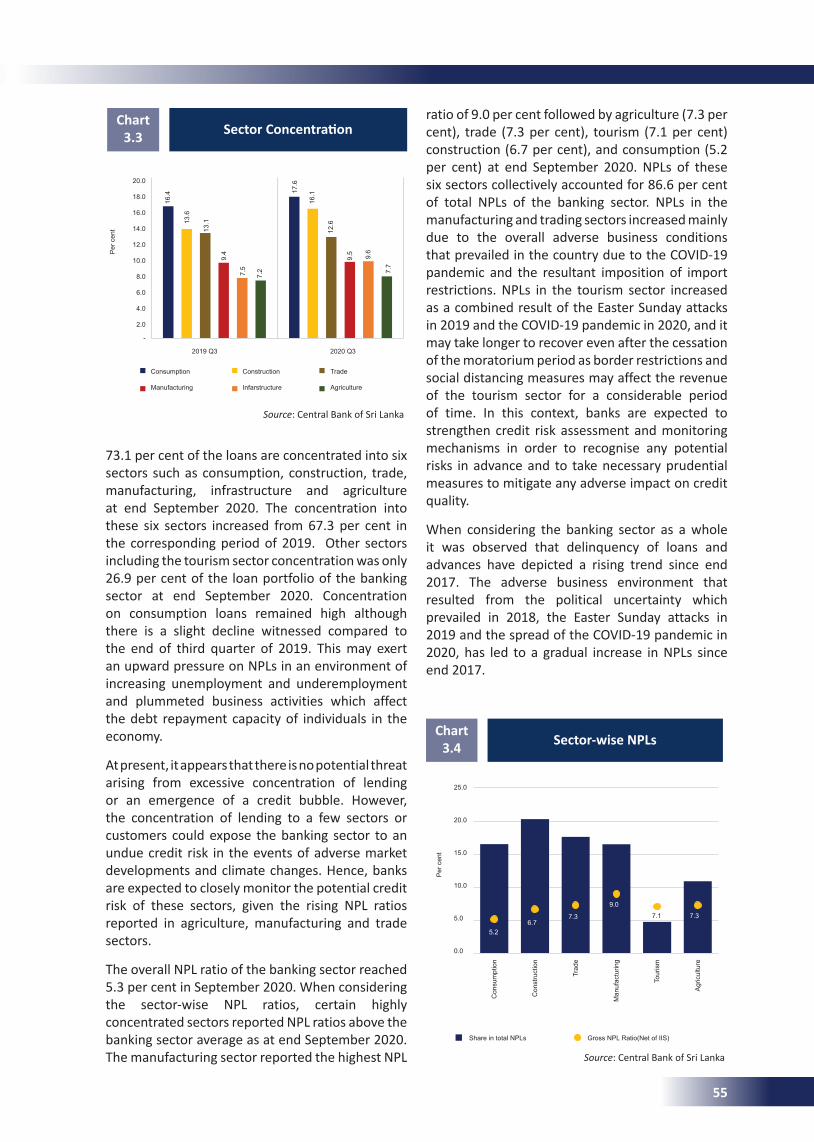
Consumption Construction Trade
Manufacturing Infarstructure Agriculture
SectorConcentrationChart
3.3
Source: Central Bank of Sri Lanka
73.1 per cent of the loans are concentrated into six sectors such as consumption, construction, trade, manufacturing, infrastructure and agriculture at end September 2020. The concentration into these six sectors increased from 67.3 per cent in the corresponding period of 2019. Other sectors including the tourism sector concentration was only 26.9 per cent of the loan portfolio of the banking sector at end September 2020. Concentration on consumption loans remained high although there is a slight decline witnessed compared to the end of third quarter of 2019. This may exert an upward pressure on NPLs in an environment of increasing unemployment and underemployment and plummeted business activities which affect the debt repayment capacity of individuals in the economy.
At present, it appears that there is no potential threat arising from excessive concentration of lending or an emergence of a credit bubble. However, the concentration of lending to a few sectors or customers could expose the banking sector to an undue credit risk in the events of adverse market developments and climate changes. Hence, banks are expected to closely monitor the potential credit risk of these sectors, given the rising NPL ratios reported in agriculture, manufacturing and trade sectors.
The overall NPL ratio of the banking sector reached 5.3 per cent in September 2020. When considering the sector-wise NPL ratios, certain highly concentrated sectors reported NPL ratios above the banking sector average as at end September 2020. The manufacturing sector reported the highest NPL
ratio of 9.0 per cent followed by agriculture (7.3 per cent), trade (7.3 per cent), tourism (7.1 per cent) construction (6.7 per cent), and consumption (5.2 per cent) at end September 2020. NPLs of these six sectors collectively accounted for 86.6 per cent of total NPLs of the banking sector. NPLs in the manufacturing and trading sectors increased mainly due to the overall adverse business conditions that prevailed in the country due to the COVID-19 pandemic and the resultant imposition of import restrictions. NPLs in the tourism sector increased as a combined result of the Easter Sunday attacks in 2019 and the COVID-19 pandemic in 2020, and it may take longer to recover even after the cessation of the moratorium period as border restrictions and social distancing measures may affect the revenue of the tourism sector for a considerable period of time. In this context, banks are expected to strengthen credit risk assessment and monitoring mechanisms in order to recognise any potential risks in advance and to take necessary prudential measures to mitigate any adverse impact on credit quality.
When considering the banking sector as a whole it was observed that delinquency of loans and advances have depicted a rising trend since end 2017. The adverse business environment that resulted from the political uncertainty which prevailed in 2018, the Easter Sunday attacks in 2019 and the spread of the COVID-19 pandemic in 2020, has led to a gradual increase in NPLs since end 2017.
Sector-wise NPLsChart
3.4
Source: Central Bank of Sri Lanka
20.0
18.0
16.0
14.0
12.0
10.0
8.0
6.0
4.0
2.0
-
2019 Q3 2020 Q3
Per
cen
t
16.4
13.6
13.1
9.4
7.5
7.2
17.6
16.1
12.6
9.5
7.7
9.6
25.0
20.0
15.0
10.0
5.0
0.0
Con
sum
ptio
n
Con
stru
ctio
n
Trad
e
Man
ufac
turin
g
Tour
ism
Agr
icul
ture
Share in total NPLs Gross NPL Ratio(Net of IIS)
Per
cen
t
5.26.7
7.3
9.0
7.1 7.3
55
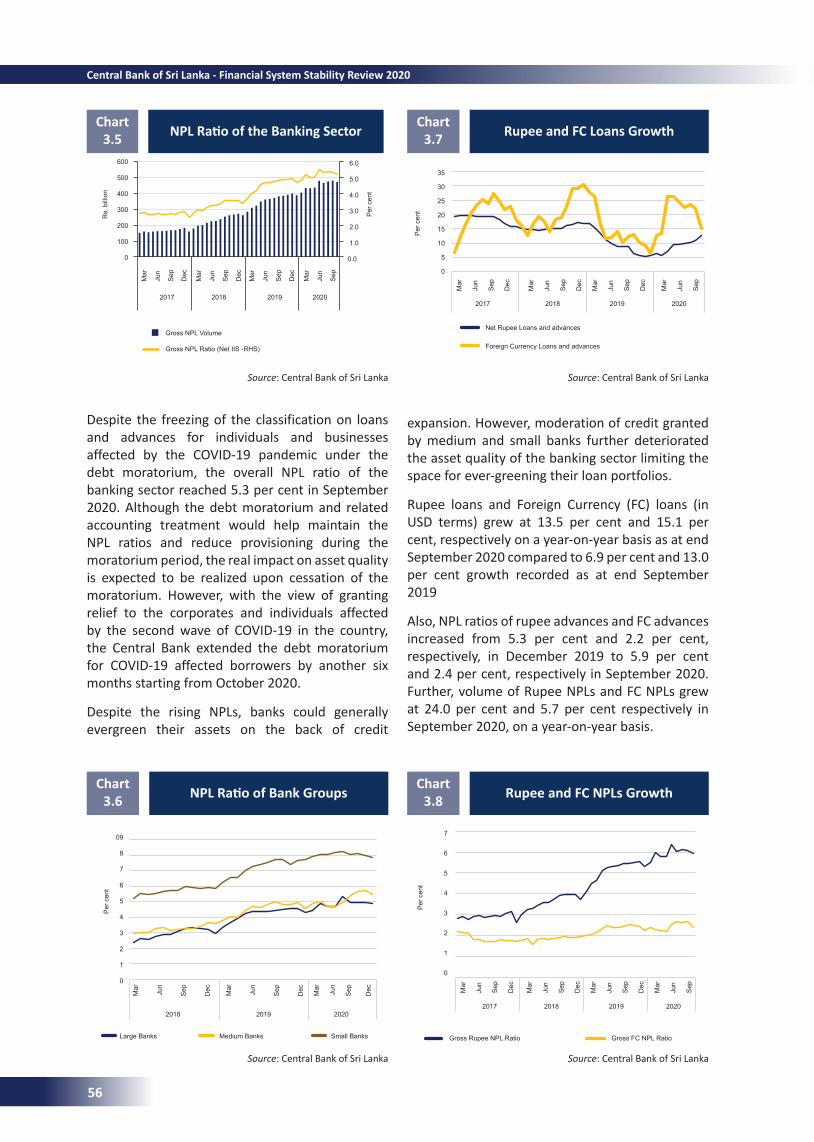
NPLRatiooftheBankingSectorChart
3.5
Source: Central Bank of Sri Lanka
NPLRatioofBankGroupsChart
3.6
Source: Central Bank of Sri Lanka
Rupee and FC Loans GrowthChart
3.7
Source: Central Bank of Sri Lanka
Rupee and FC NPLs GrowthChart
3.8
Source: Central Bank of Sri Lanka
Despite the freezing of the classification on loans and advances for individuals and businesses affected by the COVID-19 pandemic under the debt moratorium, the overall NPL ratio of the banking sector reached 5.3 per cent in September 2020. Although the debt moratorium and related accounting treatment would help maintain the NPL ratios and reduce provisioning during the moratorium period, the real impact on asset quality is expected to be realized upon cessation of the moratorium. However, with the view of granting relief to the corporates and individuals affected by the second wave of COVID-19 in the country, the Central Bank extended the debt moratorium for COVID-19 affected borrowers by another six months starting from October 2020.
Despite the rising NPLs, banks could generally evergreen their assets on the back of credit
expansion. However, moderation of credit granted by medium and small banks further deteriorated the asset quality of the banking sector limiting the space for ever-greening their loan portfolios.
Rupee loans and Foreign Currency (FC) loans (in USD terms) grew at 13.5 per cent and 15.1 per cent, respectively on a year-on-year basis as at end September 2020 compared to 6.9 per cent and 13.0 per cent growth recorded as at end September 2019
Also, NPL ratios of rupee advances and FC advances increased from 5.3 per cent and 2.2 per cent, respectively, in December 2019 to 5.9 per cent and 2.4 per cent, respectively in September 2020.Further, volume of Rupee NPLs and FC NPLs grew at 24.0 per cent and 5.7 per cent respectively in September 2020, on a year-on-year basis.
Rs.
bill
ion
6.0
5.0
4.0
3.0
2.0
1.0
0.0
Mar
Jun
Sep
Dec
Mar
Jun
Sep
Dec
Mar
Jun
Sep
Dec
Mar
Jun
Sep
2017 2018 2019 2020
Gross NPL Volume
Gross NPL Ratio (Net IIS -RHS)
600
500
400
300
200
100
0
Per
cen
t
09
8
7
6
5
4
3
2
1
0
Mar
Jun
Sep
Dec
Mar
Jun
Sep
Dec
Mar
Jun
Sep
Dec
20182017 2018 2019 2020
2019 2020
Large Banks Medium Banks Small Banks
Per
cen
t
35
30
25
20
15
10
5
0
Mar
Jun
Sep
Dec
Mar
Jun
Sep
Dec
Mar
Jun
Sep
Dec
Mar
Jun
Sep
2017 2018 2019 2020
Net Rupee Loans and advances
Foreign Currency Loans and advances
Per
cen
t
7
6
5
4
3
2
1
0
Mar
Jun
Sep
Dec
Mar
Jun
Sep
Dec
Mar
Jun
Sep
Dec
Mar
Jun
Sep
Gross Rupee NPL Ratio Gross FC NPL Ratio
Per
cen
t
56
Central Bank of Sri Lanka - Financial System Stability Review 2020
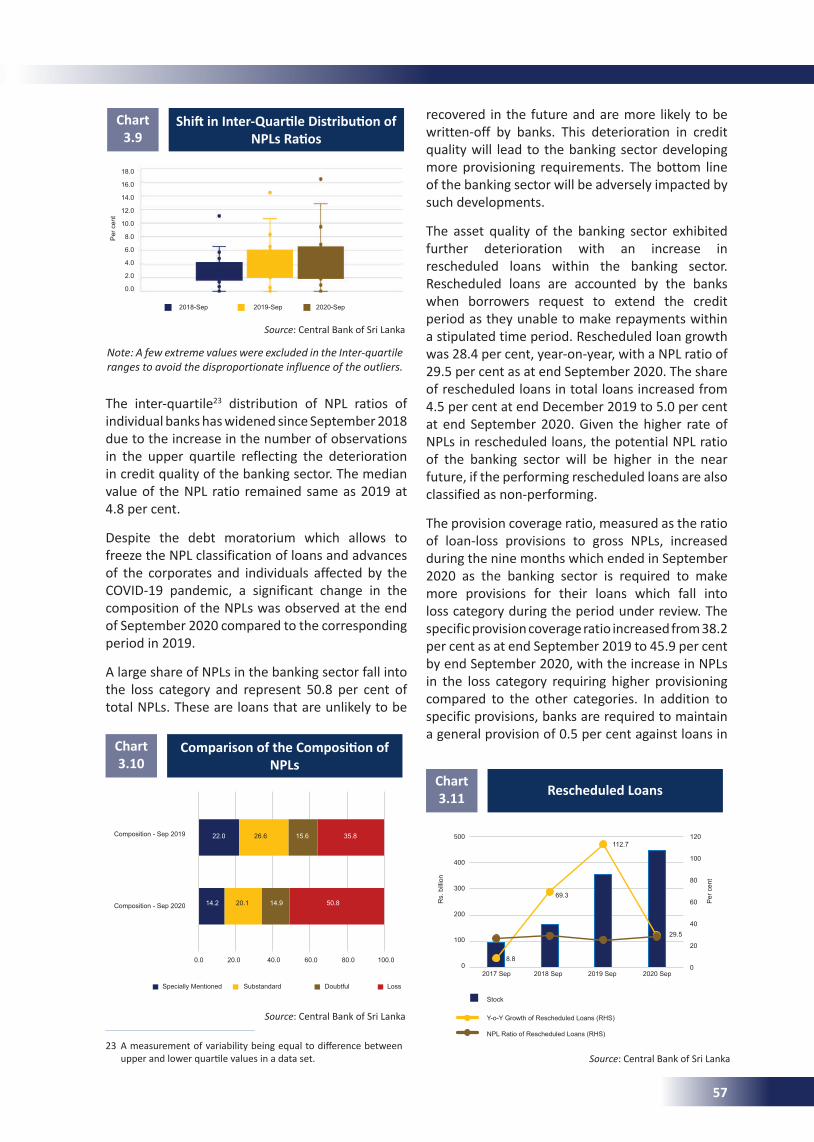
The inter-quartile23 distribution of NPL ratios of individual banks has widened since September 2018 due to the increase in the number of observations in the upper quartile reflecting the deterioration in credit quality of the banking sector. The median value of the NPL ratio remained same as 2019 at 4.8 per cent.
Despite the debt moratorium which allows to freeze the NPL classification of loans and advances of the corporates and individuals affected by the COVID-19 pandemic, a significant change in the composition of the NPLs was observed at the end of September 2020 compared to the corresponding period in 2019.
A large share of NPLs in the banking sector fall into the loss category and represent 50.8 per cent of total NPLs. These are loans that are unlikely to be
23 A measurement of variability being equal to difference between upper and lower quartile values in a data set.
recovered in the future and are more likely to be written-off by banks. This deterioration in credit quality will lead to the banking sector developing more provisioning requirements. The bottom line of the banking sector will be adversely impacted by such developments.
The asset quality of the banking sector exhibited further deterioration with an increase in rescheduled loans within the banking sector. Rescheduled loans are accounted by the banks when borrowers request to extend the credit period as they unable to make repayments within a stipulated time period. Rescheduled loan growth was 28.4 per cent, year-on-year, with a NPL ratio of 29.5 per cent as at end September 2020. The share of rescheduled loans in total loans increased from 4.5 per cent at end December 2019 to 5.0 per cent at end September 2020. Given the higher rate of NPLs in rescheduled loans, the potential NPL ratio of the banking sector will be higher in the near future, if the performing rescheduled loans are also classified as non-performing.
The provision coverage ratio, measured as the ratio of loan-loss provisions to gross NPLs, increased during the nine months which ended in September 2020 as the banking sector is required to make more provisions for their loans which fall into loss category during the period under review. The specific provision coverage ratio increased from 38.2 per cent as at end September 2019 to 45.9 per cent by end September 2020, with the increase in NPLs in the loss category requiring higher provisioning compared to the other categories. In addition to specific provisions, banks are required to maintain a general provision of 0.5 per cent against loans in
ShiftinInter-QuartileDistributionofNPLsRatios
Chart 3.9
Per
cen
t
Note: A few extreme values were excluded in the Inter-quartile ranges to avoid the disproportionate influence of the outliers.
Source: Central Bank of Sri Lanka
ComparisonoftheCompositionofNPLs
Chart 3.10
Source: Central Bank of Sri Lanka
Rescheduled LoansChart 3.11
Source: Central Bank of Sri Lanka
18.0
16.0
14.0
12.0
10.0
8.0
6.0
4.0
2.0
0.0
2018-Sep 2019-Sep 2020-Sep
Specially Mentioned Substandard Doubtful Loss
Composition - Sep 2019
Composition - Sep 2020
0.0 20.0 40.0 60.0 80.0 100.0
22.0
14.2 14.9
26.6
20.1
15.6 35.8
50.8
500
400
300
200
100
0
Stock
Y-o-Y Growth of Rescheduled Loans (RHS)
NPL Ratio of Rescheduled Loans (RHS)
120
100
80
60
40
20
0
Rs.
bill
ion
Per
cen
t
8.8
2017 Sep 2018 Sep 2019 Sep 2020 Sep
69.3
112.7
29.5
57
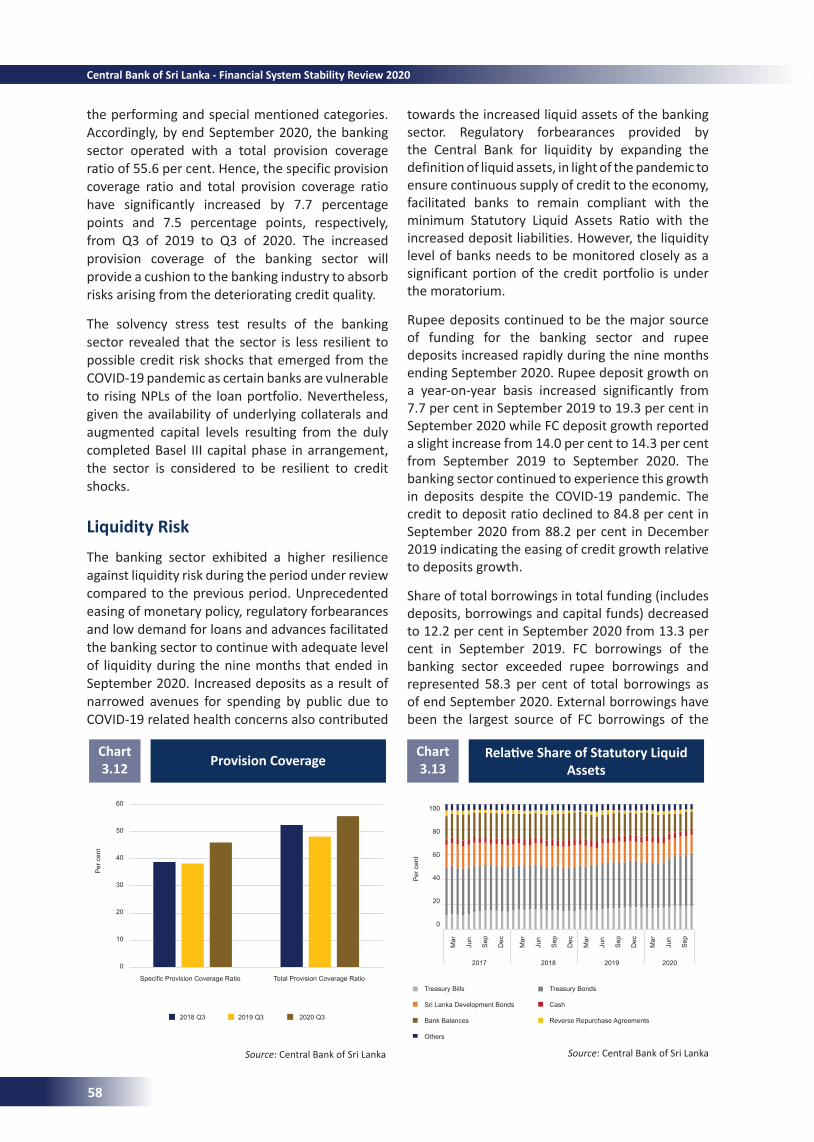
Provision CoverageChart 3.12
Source: Central Bank of Sri Lanka
the performing and special mentioned categories. Accordingly, by end September 2020, the banking sector operated with a total provision coverage ratio of 55.6 per cent. Hence, the specific provision coverage ratio and total provision coverage ratio have significantly increased by 7.7 percentage points and 7.5 percentage points, respectively, from Q3 of 2019 to Q3 of 2020. The increased provision coverage of the banking sector will provide a cushion to the banking industry to absorb risks arising from the deteriorating credit quality.
The solvency stress test results of the banking sector revealed that the sector is less resilient to possible credit risk shocks that emerged from the COVID-19 pandemic as certain banks are vulnerable to rising NPLs of the loan portfolio. Nevertheless, given the availability of underlying collaterals and augmented capital levels resulting from the duly completed Basel III capital phase in arrangement, the sector is considered to be resilient to credit shocks.
Liquidity RiskThe banking sector exhibited a higher resilience against liquidity risk during the period under review compared to the previous period. Unprecedented easing of monetary policy, regulatory forbearances and low demand for loans and advances facilitated the banking sector to continue with adequate level of liquidity during the nine months that ended in September 2020. Increased deposits as a result of narrowed avenues for spending by public due to COVID-19 related health concerns also contributed
towards the increased liquid assets of the banking sector. Regulatory forbearances provided by the Central Bank for liquidity by expanding the definition of liquid assets, in light of the pandemic to ensure continuous supply of credit to the economy, facilitated banks to remain compliant with the minimum Statutory Liquid Assets Ratio with the increased deposit liabilities. However, the liquidity level of banks needs to be monitored closely as a significant portion of the credit portfolio is under the moratorium.
Rupee deposits continued to be the major source of funding for the banking sector and rupee deposits increased rapidly during the nine months ending September 2020. Rupee deposit growth on a year-on-year basis increased significantly from 7.7 per cent in September 2019 to 19.3 per cent in September 2020 while FC deposit growth reported a slight increase from 14.0 per cent to 14.3 per cent from September 2019 to September 2020. The banking sector continued to experience this growth in deposits despite the COVID-19 pandemic. The credit to deposit ratio declined to 84.8 per cent in September 2020 from 88.2 per cent in December 2019 indicating the easing of credit growth relative to deposits growth.
Share of total borrowings in total funding (includes deposits, borrowings and capital funds) decreased to 12.2 per cent in September 2020 from 13.3 per cent in September 2019. FC borrowings of the banking sector exceeded rupee borrowings and represented 58.3 per cent of total borrowings as of end September 2020. External borrowings have been the largest source of FC borrowings of the
RelativeShareofStatutoryLiquidAssets
Chart 3.13
Source: Central Bank of Sri Lanka
60
50
40
30
20
10
0
2018 Q3 2019 Q3 2020 Q3
Per
cen
t
Specific Provision Coverage Ratio Total Provision Coverage Ratio
100
80
60
40
20
0
Mar
Jun
Sep
Dec
Mar
Jun
Sep
Dec
Mar
Jun
Sep
Dec
Mar
Jun
Sep
2017 2018 2019 2020
Treasury Bills Treasury Bonds
Sri Lanka Development Bonds Cash
Bank Balances Reverse Repurchase Agreements
Others
Per
cen
t
58
Central Bank of Sri Lanka - Financial System Stability Review 2020
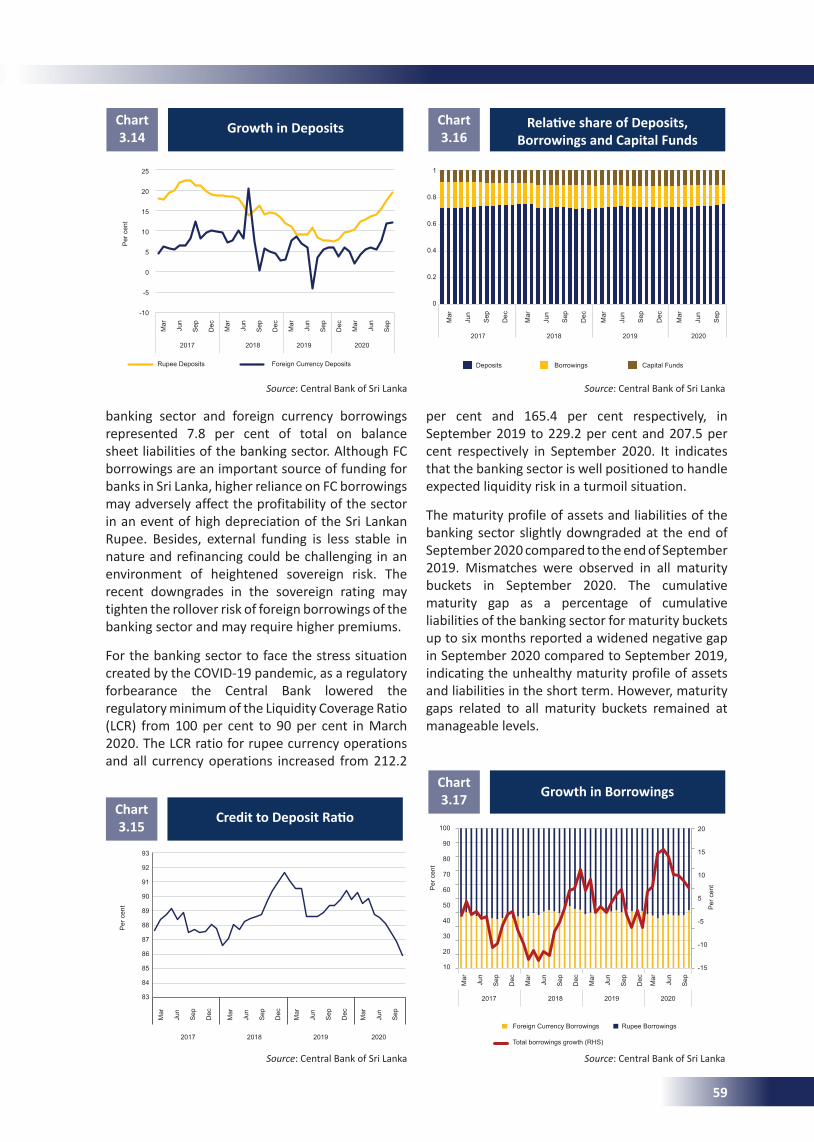
per cent and 165.4 per cent respectively, in September 2019 to 229.2 per cent and 207.5 per cent respectively in September 2020. It indicates that the banking sector is well positioned to handle expected liquidity risk in a turmoil situation.
The maturity profile of assets and liabilities of the banking sector slightly downgraded at the end of September 2020 compared to the end of September 2019. Mismatches were observed in all maturity buckets in September 2020. The cumulative maturity gap as a percentage of cumulative liabilities of the banking sector for maturity buckets up to six months reported a widened negative gap in September 2020 compared to September 2019, indicating the unhealthy maturity profile of assets and liabilities in the short term. However, maturity gaps related to all maturity buckets remained at manageable levels.
banking sector and foreign currency borrowings represented 7.8 per cent of total on balance sheet liabilities of the banking sector. Although FC borrowings are an important source of funding for banks in Sri Lanka, higher reliance on FC borrowings may adversely affect the profitability of the sector in an event of high depreciation of the Sri Lankan Rupee. Besides, external funding is less stable in nature and refinancing could be challenging in an environment of heightened sovereign risk. The recent downgrades in the sovereign rating may tighten the rollover risk of foreign borrowings of the banking sector and may require higher premiums.
For the banking sector to face the stress situation created by the COVID-19 pandemic, as a regulatory forbearance the Central Bank lowered the regulatory minimum of the Liquidity Coverage Ratio (LCR) from 100 per cent to 90 per cent in March 2020. The LCR ratio for rupee currency operations and all currency operations increased from 212.2
Growth in Deposits Chart 3.14
Source: Central Bank of Sri Lanka Source: Central Bank of Sri Lanka
Source: Central Bank of Sri Lanka
CredittoDepositRatioChart 3.15
Source: Central Bank of Sri Lanka
RelativeshareofDeposits,Borrowings and Capital Funds
Chart 3.16
Growth in BorrowingsChart 3.17
25
20
15
10
5
0
-5
-10
Mar
Jun
Sep
Dec
Mar
Jun
Sep
Dec
Mar
Jun
Sep
Dec
Mar
Jun
Sep
Rupee Deposits Foreign Currency Deposits
Per
cen
t
20172017
20182018
20192019
20202020
93
92
91
90
89
88
87
86
85
84
83
Mar
Jun
Sep
Dec
Mar
Jun
Sep
Dec
Mar
Jun
Sep
Dec
Mar
Jun
Sep
Per
cen
t
2017
2017
2018
2018
2019
2019
2020
2020
1
0.8
0.6
0.4
0.2
0
Mar
Jun
Sep
Dec
Mar
Jun
Sep
Dec
Mar
Jun
Sep
Dec
Mar
Jun
Sep
Deposits Borrowings Capital Funds
100
90
80
70
60
50
40
30
20
10
Mar
Jun
Sep
Dec
Mar
Jun
Sep
Dec
Mar
Jun
Sep
Dec
Mar
Jun
Sep
20
15
10
5
-5
-10
-15
Foreign Currency Borrowings Rupee Borrowings
Total borrowings growth (RHS)
Per
cen
t
Per
cen
t
59
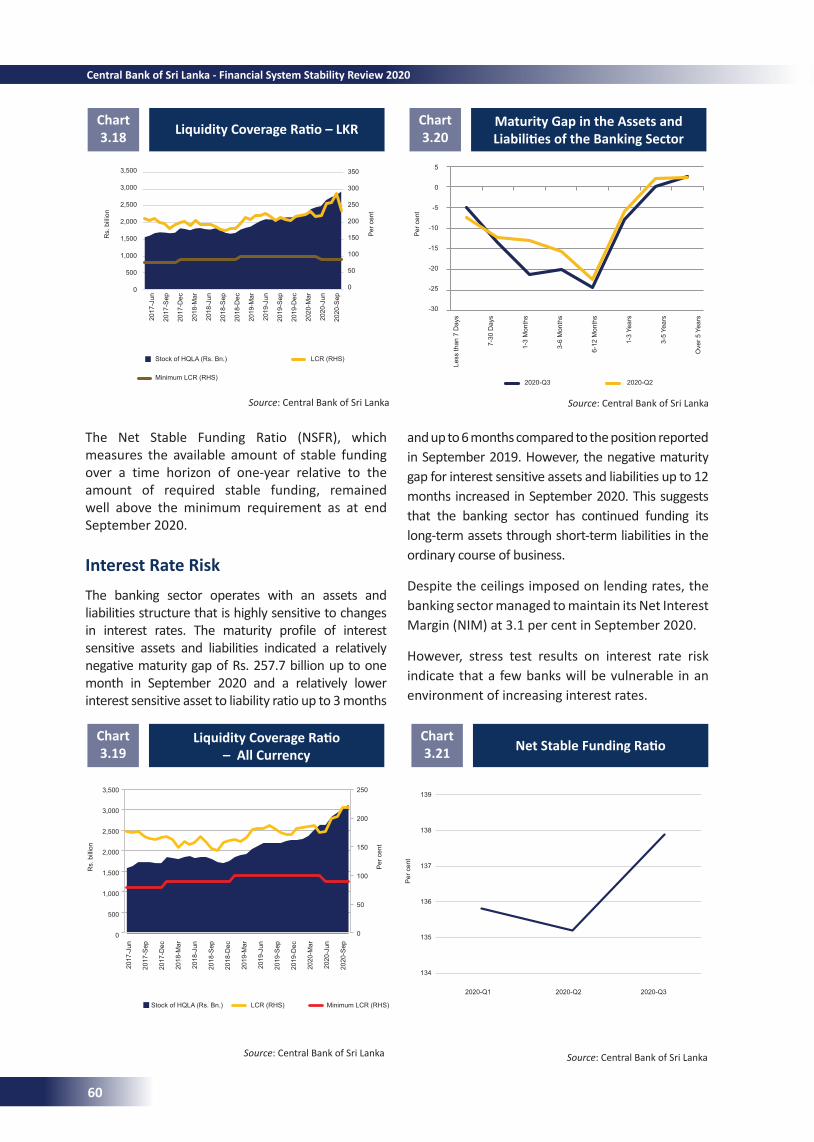
LiquidityCoverageRatio–LKRChart 3.18
Source: Central Bank of Sri Lanka Source: Central Bank of Sri Lanka
The Net Stable Funding Ratio (NSFR), which measures the available amount of stable funding over a time horizon of one-year relative to the amount of required stable funding, remained well above the minimum requirement as at end September 2020.
Interest Rate Risk The banking sector operates with an assets and liabilities structure that is highly sensitive to changes in interest rates. The maturity profile of interest sensitive assets and liabilities indicated a relatively negative maturity gap of Rs. 257.7 billion up to one month in September 2020 and a relatively lower interest sensitive asset to liability ratio up to 3 months
Source: Central Bank of Sri Lanka
LiquidityCoverageRatio–AllCurrency
Chart 3.19
and up to 6 months compared to the position reported in September 2019. However, the negative maturity gap for interest sensitive assets and liabilities up to 12 months increased in September 2020. This suggests that the banking sector has continued funding its long-term assets through short-term liabilities in the ordinary course of business.
Despite the ceilings imposed on lending rates, the banking sector managed to maintain its Net Interest Margin (NIM) at 3.1 per cent in September 2020.
However, stress test results on interest rate risk indicate that a few banks will be vulnerable in an environment of increasing interest rates.
Maturity Gap in the Assets and LiabilitiesoftheBankingSector
Chart 3.20
NetStableFundingRatioChart 3.21
Source: Central Bank of Sri Lanka
3,500
3,000
2,500
2,000
1,500
1,000
500
0
350
300
250
200
150
100
50
0
Stock of HQLA (Rs. Bn.) LCR (RHS)
Minimum LCR (RHS)
Rs.
bill
ion
Per
cen
t
Per
cen
t
2017
-Jun
2017
-Sep
2017
-Dec
2018
-Mar
2018
-Jun
2018
-Sep
2018
-Dec
2019
-Mar
2019
-Jun
2019
-Sep
2019
-Dec
2020
-Mar
2020
-Jun
2020
-Sep
3,500
3,000
2,500
2,000
1,500
1,000
500
0
250
200
150
100
50
0
Stock of HQLA (Rs. Bn.) LCR (RHS) Minimum LCR (RHS)
Rs.
bill
ion
Per
cen
t
Per
cen
t
2017
-Jun
2017
-Sep
2017
-Dec
2018
-Mar
2018
-Jun
2018
-Sep
2018
-Dec
2019
-Mar
2019
-Jun
2019
-Sep
2019
-Dec
2020
-Mar
2020
-Jun
2020
-Sep
139
138
137
136
135
134
2020-Q1 2020-Q2 2020-Q3
5
0
-5
-10
-15
-20
-25
-30
Less
than
7 D
ays
7-30
Day
s
1-3
Mon
ths
3-6
Mon
ths
6-12
Mon
ths
1-3
Year
s
3-5
Year
s
Ove
r 5 Y
ears
2020-Q3 2020-Q2
60
Central Bank of Sri Lanka - Financial System Stability Review 2020
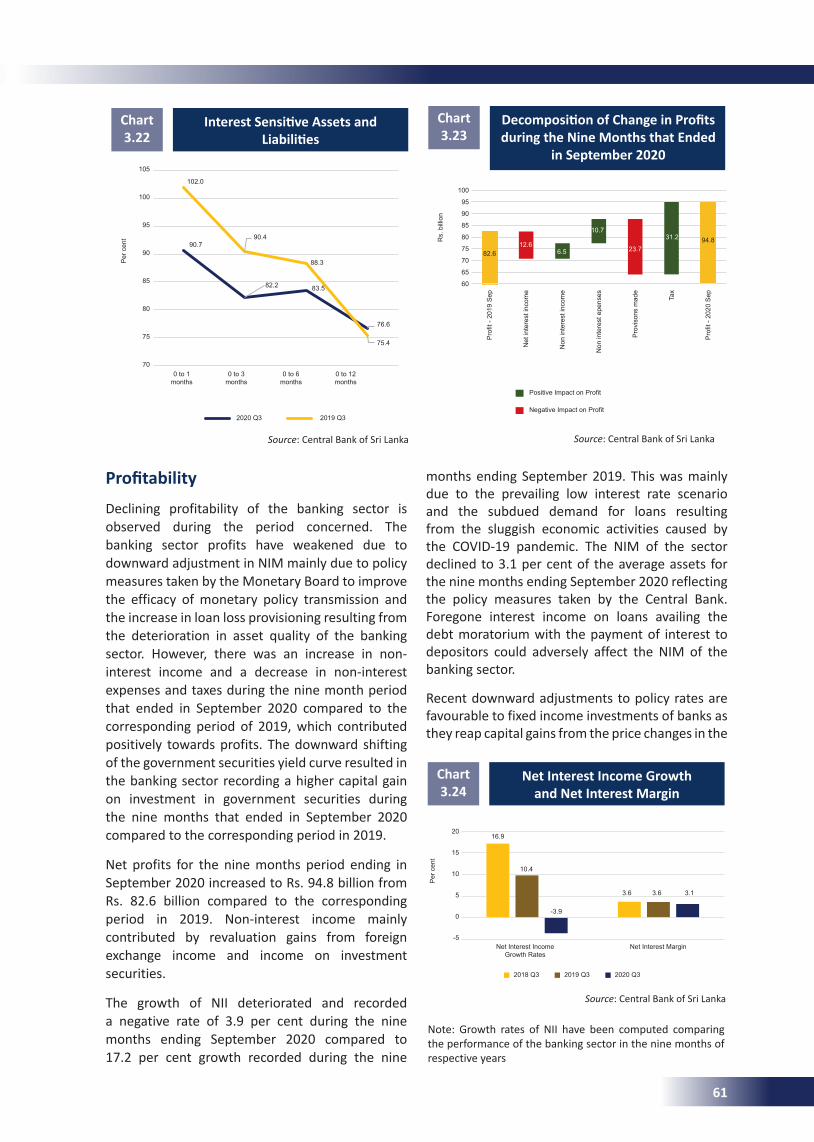
Profitability
Declining profitability of the banking sector is observed during the period concerned. The banking sector profits have weakened due to downward adjustment in NIM mainly due to policy measures taken by the Monetary Board to improve the efficacy of monetary policy transmission and the increase in loan loss provisioning resulting from the deterioration in asset quality of the banking sector. However, there was an increase in non-interest income and a decrease in non-interest expenses and taxes during the nine month period that ended in September 2020 compared to the corresponding period of 2019, which contributed positively towards profits. The downward shifting of the government securities yield curve resulted in the banking sector recording a higher capital gain on investment in government securities during the nine months that ended in September 2020 compared to the corresponding period in 2019.
Net profits for the nine months period ending in September 2020 increased to Rs. 94.8 billion from Rs. 82.6 billion compared to the corresponding period in 2019. Non-interest income mainly contributed by revaluation gains from foreign exchange income and income on investment securities.
The growth of NII deteriorated and recorded a negative rate of 3.9 per cent during the nine months ending September 2020 compared to 17.2 per cent growth recorded during the nine
InterestSensitiveAssetsandLiabilities
Chart 3.22
Source: Central Bank of Sri Lanka
months ending September 2019. This was mainly due to the prevailing low interest rate scenario and the subdued demand for loans resulting from the sluggish economic activities caused by the COVID-19 pandemic. The NIM of the sector declined to 3.1 per cent of the average assets for the nine months ending September 2020 reflecting the policy measures taken by the Central Bank. Foregone interest income on loans availing the debt moratorium with the payment of interest to depositors could adversely affect the NIM of the banking sector.
Recent downward adjustments to policy rates are favourable to fixed income investments of banks as they reap capital gains from the price changes in the
DecompositionofChangeinProfitsduring the Nine Months that Ended
in September 2020
Chart 3.23
Source: Central Bank of Sri Lanka
Net Interest Income Growth and Net Interest Margin
Chart 3.24
Note: Growth rates of NII have been computed comparing the performance of the banking sector in the nine months of respective years
Source: Central Bank of Sri Lanka
2020 Q3 2019 Q3
105
100
95
90
85
80
75
70
Per
cen
t
0 to 1 months
0 to 6months
0 to 3months
0 to 12months
90.7
102.0
90.4
82.2
88.3
83.5
76.6
75.4
82.612.6
6.5
10.7
23.7
31.2 94.8
Pro
fit -
2019
Sep
Net
inte
rest
inco
me
Non
inte
rest
inco
me
Non
inte
rest
epe
nses
Pro
viso
ns m
ade
Tax
Pro
fit -
2020
Sep
Positive Impact on Profit
Negative Impact on Profit
100
95
90
85
80
75
70
65
60
Rs.
bill
ion
16.9
10.4
-3.9
3.6 3.6 3.1
Net Interest Income Growth Rates
2018 Q3 2019 Q3 2020 Q3
20
15
10
5
0
-5
Per
cen
t
Net Interest Margin
61
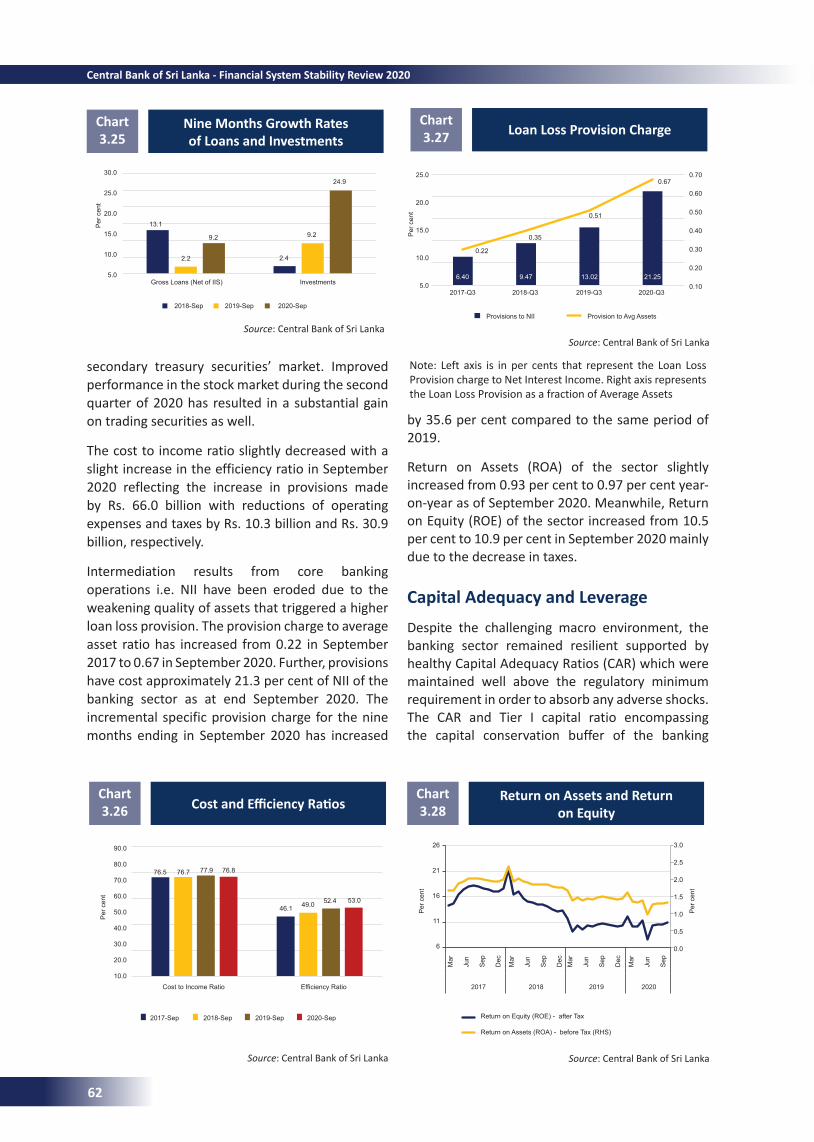
secondary treasury securities’ market. Improved performance in the stock market during the second quarter of 2020 has resulted in a substantial gain on trading securities as well.
The cost to income ratio slightly decreased with a slight increase in the efficiency ratio in September 2020 reflecting the increase in provisions made by Rs. 66.0 billion with reductions of operating expenses and taxes by Rs. 10.3 billion and Rs. 30.9 billion, respectively.
Intermediation results from core banking operations i.e. NII have been eroded due to the weakening quality of assets that triggered a higher loan loss provision. The provision charge to average asset ratio has increased from 0.22 in September 2017 to 0.67 in September 2020. Further, provisions have cost approximately 21.3 per cent of NII of the banking sector as at end September 2020. The incremental specific provision charge for the nine months ending in September 2020 has increased
Nine Months Growth Rates of Loans and Investments
Chart 3.25
Loan Loss Provision ChargeChart 3.27
Note: Left axis is in per cents that represent the Loan Loss Provision charge to Net Interest Income. Right axis represents the Loan Loss Provision as a fraction of Average Assets
Source: Central Bank of Sri LankaSource: Central Bank of Sri Lanka
CostandEfficiencyRatiosChart 3.26
Source: Central Bank of Sri Lanka
by 35.6 per cent compared to the same period of 2019.
Return on Assets (ROA) of the sector slightly increased from 0.93 per cent to 0.97 per cent year-on-year as of September 2020. Meanwhile, Return on Equity (ROE) of the sector increased from 10.5 per cent to 10.9 per cent in September 2020 mainly due to the decrease in taxes.
Capital Adequacy and Leverage Despite the challenging macro environment, the banking sector remained resilient supported by healthy Capital Adequacy Ratios (CAR) which were maintained well above the regulatory minimum requirement in order to absorb any adverse shocks. The CAR and Tier I capital ratio encompassing the capital conservation buffer of the banking
Return on Assets and Return on Equity
Chart 3.28
Source: Central Bank of Sri Lanka
30.0
25.0
20.0
15.0
10.0
5.0
2018-Sep 2019-Sep 2020-Sep
Per
cen
t
Gross Loans (Net of IIS) Investments
13.1
0.22
0.35
0.51
0.67
2.2
9.2
2.4
9.2
24.9
Cost to Income Ratio Efficiency Ratio
90.0
80.0
70.0
60.0
50.0
40.0
30.0
20.0
10.0
2017-Sep 2018-Sep 2019-Sep 2020-Sep
Per
cen
t
Per
cen
t
Per
cen
t
76.5 76.7 77.9 76.8
46.1 49.0 52.4 53.0
0.70
0.60
0.50
0.40
0.30
0.20
0.10
Provisions to NII Provision to Avg Assets
25.0
20.0
15.0
10.0
5.02017-Q3 2018-Q3 2019-Q3 2020-Q3
Per
cen
t
6.40 9.47 13.02 21.25
3.0
2.5
2.0
1.5
1.0
0.5
0.0
Return on Equity (ROE) - after Tax
Return on Assets (ROA) - before Tax (RHS)
26
21
16
11
6
Mar
Jun
Sep
Dec
Mar
Jun
Sep
Dec
Mar
Jun
Sep
Dec
Mar
Jun
Sep
2017 2018 2019 2020
62
Central Bank of Sri Lanka - Financial System Stability Review 2020
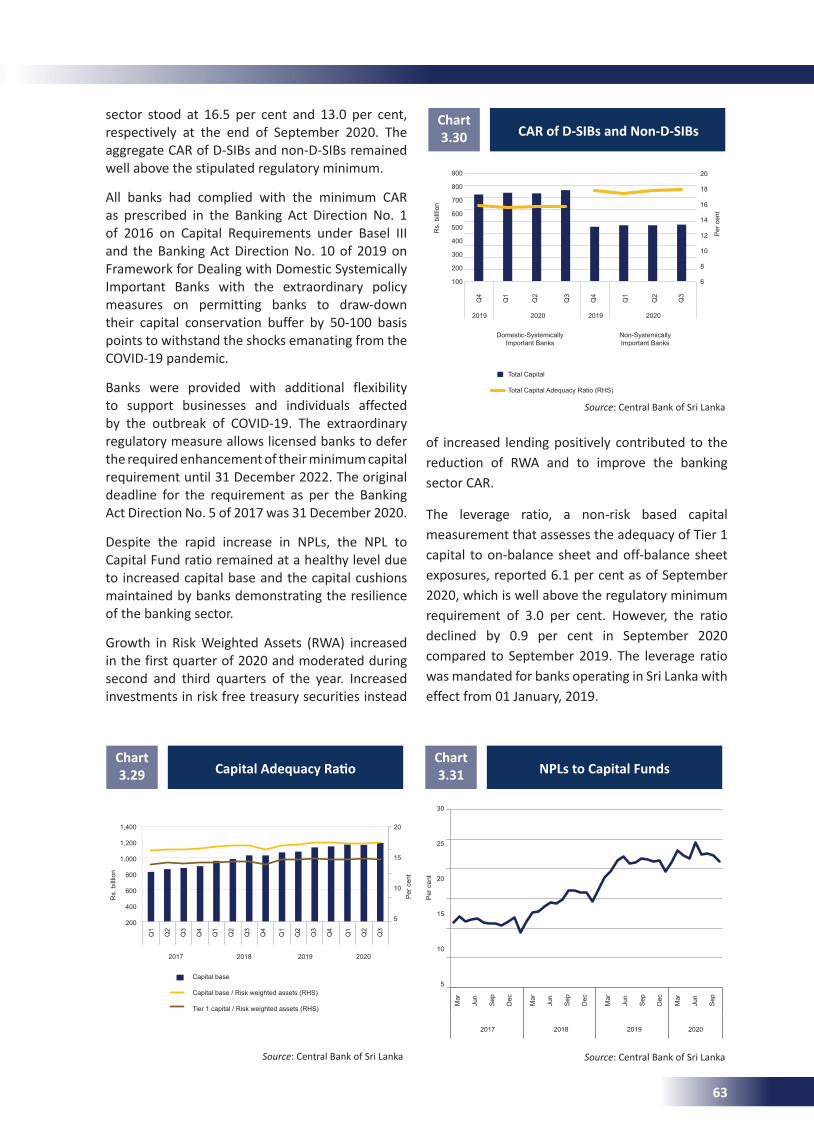
sector stood at 16.5 per cent and 13.0 per cent, respectively at the end of September 2020. The aggregate CAR of D-SIBs and non-D-SIBs remained well above the stipulated regulatory minimum.
All banks had complied with the minimum CAR as prescribed in the Banking Act Direction No. 1 of 2016 on Capital Requirements under Basel III and the Banking Act Direction No. 10 of 2019 on Framework for Dealing with Domestic Systemically Important Banks with the extraordinary policy measures on permitting banks to draw-down their capital conservation buffer by 50-100 basis points to withstand the shocks emanating from the COVID-19 pandemic.
Banks were provided with additional flexibility to support businesses and individuals affected by the outbreak of COVID-19. The extraordinary regulatory measure allows licensed banks to defer the required enhancement of their minimum capital requirement until 31 December 2022. The original deadline for the requirement as per the Banking Act Direction No. 5 of 2017 was 31 December 2020.
Despite the rapid increase in NPLs, the NPL to Capital Fund ratio remained at a healthy level due to increased capital base and the capital cushions maintained by banks demonstrating the resilience of the banking sector.
Growth in Risk Weighted Assets (RWA) increased in the first quarter of 2020 and moderated during second and third quarters of the year. Increased investments in risk free treasury securities instead
CapitalAdequacyRatioChart 3.29
Source: Central Bank of Sri Lanka
of increased lending positively contributed to the reduction of RWA and to improve the banking sector CAR.
The leverage ratio, a non-risk based capital measurement that assesses the adequacy of Tier 1 capital to on-balance sheet and off-balance sheet exposures, reported 6.1 per cent as of September 2020, which is well above the regulatory minimum requirement of 3.0 per cent. However, the ratio declined by 0.9 per cent in September 2020 compared to September 2019. The leverage ratio was mandated for banks operating in Sri Lanka with effect from 01 January, 2019.
CAR of D-SIBs and Non-D-SIBsChart 3.30
Source: Central Bank of Sri Lanka
Source: Central Bank of Sri Lanka
NPLs to Capital FundsChart 3.31
20
15
10
5
Q1 Q2
Q3
Q4
Q1 Q2
Q3
Q4
Q1 Q2
Q3
Q4
Q1 Q2
Q3
Capital base
Capital base / Risk weighted assets (RHS)
Tier 1 capital / Risk weighted assets (RHS)
1,400
1,200
1,000
800
600
400
200
Rs.
bill
lion
Per
cen
t
2017 2018 2019 2020
2017 2018 2019 2020
Rs.
bill
lion
Per
cen
t
20
18
16
14
12
10
8
6
Q4
Q1
Q2
Q3
Q4
Q1
Q2
Q3
Total Capital
Total Capital Adequacy Ratio (RHS)
900
800
700
600
500
400
300
200
100
2019 2020 2019 2020
Domestic-Systemically Important Banks
Non-Systemically Important Banks
Per
cen
t
30
25
20
15
10
5
Mar
Jun
Sep
Dec
Mar
Jun
Sep
Dec
Mar
Jun
Sep
Dec
Mar
Jun
Sep
63
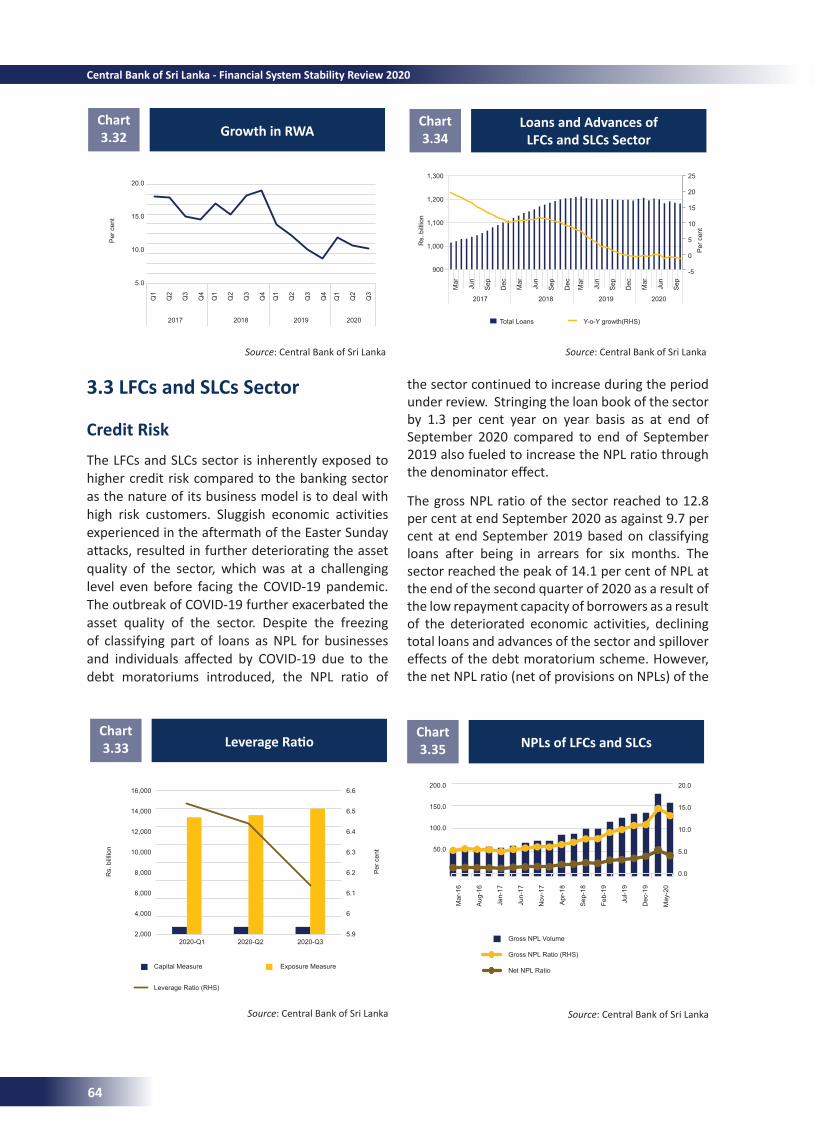
Growth in RWAChart 3.32
Source: Central Bank of Sri Lanka
LeverageRatioChart 3.33
Source: Central Bank of Sri Lanka
3.3 LFCs and SLCs Sector
Credit RiskThe LFCs and SLCs sector is inherently exposed to higher credit risk compared to the banking sector as the nature of its business model is to deal with high risk customers. Sluggish economic activities experienced in the aftermath of the Easter Sunday attacks, resulted in further deteriorating the asset quality of the sector, which was at a challenging level even before facing the COVID-19 pandemic. The outbreak of COVID-19 further exacerbated the asset quality of the sector. Despite the freezing of classifying part of loans as NPL for businesses and individuals affected by COVID-19 due to the debt moratoriums introduced, the NPL ratio of
the sector continued to increase during the period under review. Stringing the loan book of the sector by 1.3 per cent year on year basis as at end of September 2020 compared to end of September 2019 also fueled to increase the NPL ratio through the denominator effect.
The gross NPL ratio of the sector reached to 12.8 per cent at end September 2020 as against 9.7 per cent at end September 2019 based on classifying loans after being in arrears for six months. The sector reached the peak of 14.1 per cent of NPL at the end of the second quarter of 2020 as a result of the low repayment capacity of borrowers as a result of the deteriorated economic activities, declining total loans and advances of the sector and spillover effects of the debt moratorium scheme. However, the net NPL ratio (net of provisions on NPLs) of the
Loans and Advances of LFCs and SLCs Sector
Chart 3.34
Source: Central Bank of Sri Lanka
NPLs of LFCs and SLCsChart 3.35
Source: Central Bank of Sri Lanka
Per
cen
t
20.0
15.0
10.0
5.0
Q1
Q2
Q3
Q4
Q1
Q2
Q3
Q4
Q1
Q2
Q3
Q4
Q1
Q2
Q3
2017
2017
2018
2018
2019
2019
2020
2020
Rs.
bill
lion
Per
cen
t
6.6
6.5
6.4
6.3
6.2
6.1
6
5.92020-Q1 2020-Q2 2020-Q3
Capital Measure Exposure Measure
Leverage Ratio (RHS)
16,000
14,000
12,000
10,000
8,000
6,000
4,000
2,000
Rs.
bill
lion
Per
cen
t
25
20
15
10
5
0
-5
Mar
Jun
Sep
Dec
Mar
Jun
Sep
Dec
Mar
Jun
Sep
Dec
Mar
Jun
Sep
Total Loans Y-o-Y growth(RHS)
1,300
1,200
1,100
1,000
900
20.0
15.0
10.0
5.0
0.0
Mar
-16
Aug
-16
Jan-
17
Jun-
17
Nov
-17
Apr
-18
Sep
-18
Feb-
19
Jul-1
9
Dec
-19
May
-20
Gross NPL Volume
Gross NPL Ratio (RHS)
Net NPL Ratio
200.0
150.0
100.0
50.0
64
Central Bank of Sri Lanka - Financial System Stability Review 2020
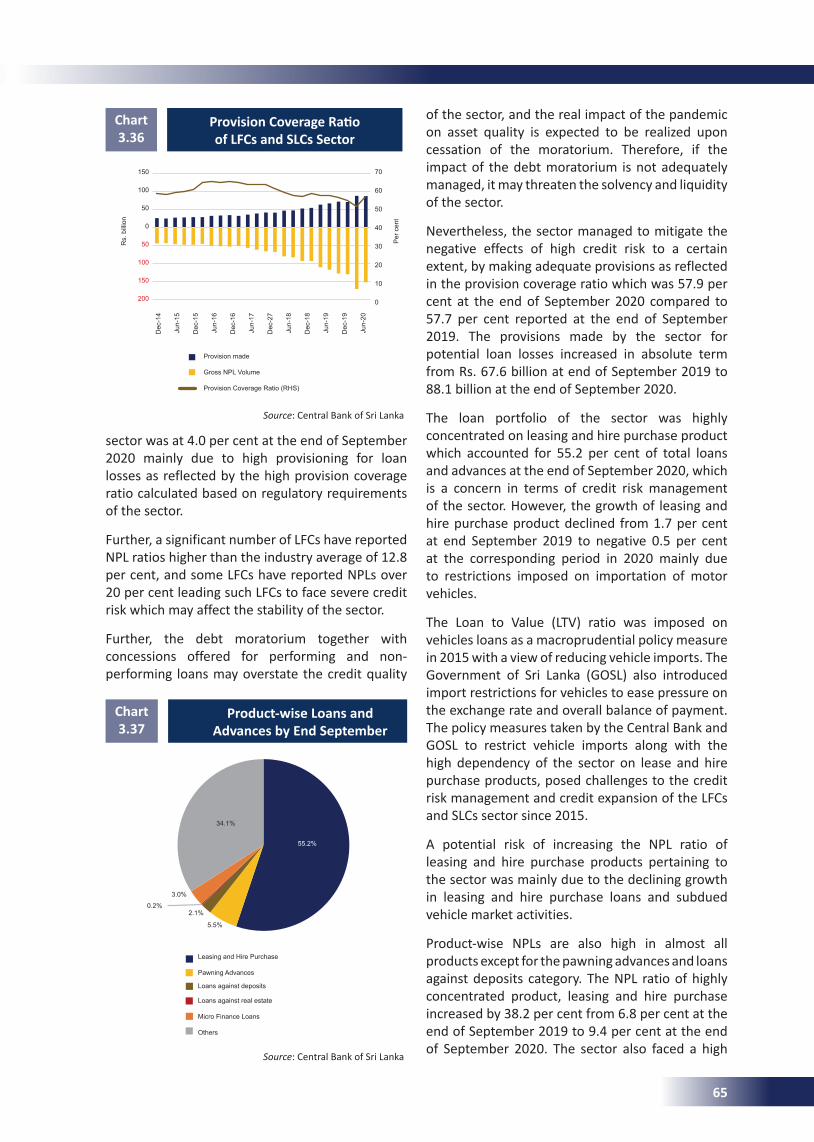
sector was at 4.0 per cent at the end of September 2020 mainly due to high provisioning for loan losses as reflected by the high provision coverage ratio calculated based on regulatory requirements of the sector.
Further, a significant number of LFCs have reported NPL ratios higher than the industry average of 12.8 per cent, and some LFCs have reported NPLs over 20 per cent leading such LFCs to face severe credit risk which may affect the stability of the sector.
Further, the debt moratorium together with concessions offered for performing and non-performing loans may overstate the credit quality
Source: Central Bank of Sri Lanka
of the sector, and the real impact of the pandemic on asset quality is expected to be realized upon cessation of the moratorium. Therefore, if the impact of the debt moratorium is not adequately managed, it may threaten the solvency and liquidity of the sector.
Nevertheless, the sector managed to mitigate the negative effects of high credit risk to a certain extent, by making adequate provisions as reflected in the provision coverage ratio which was 57.9 per cent at the end of September 2020 compared to 57.7 per cent reported at the end of September 2019. The provisions made by the sector for potential loan losses increased in absolute term from Rs. 67.6 billion at end of September 2019 to 88.1 billion at the end of September 2020.
The loan portfolio of the sector was highly concentrated on leasing and hire purchase product which accounted for 55.2 per cent of total loans and advances at the end of September 2020, which is a concern in terms of credit risk management of the sector. However, the growth of leasing and hire purchase product declined from 1.7 per cent at end September 2019 to negative 0.5 per cent at the corresponding period in 2020 mainly due to restrictions imposed on importation of motor vehicles.
The Loan to Value (LTV) ratio was imposed on vehicles loans as a macroprudential policy measure in 2015 with a view of reducing vehicle imports. The Government of Sri Lanka (GOSL) also introduced import restrictions for vehicles to ease pressure on the exchange rate and overall balance of payment. The policy measures taken by the Central Bank and GOSL to restrict vehicle imports along with the high dependency of the sector on lease and hire purchase products, posed challenges to the credit risk management and credit expansion of the LFCs and SLCs sector since 2015.
A potential risk of increasing the NPL ratio of leasing and hire purchase products pertaining to the sector was mainly due to the declining growth in leasing and hire purchase loans and subdued vehicle market activities.
Product-wise NPLs are also high in almost all products except for the pawning advances and loans against deposits category. The NPL ratio of highly concentrated product, leasing and hire purchase increased by 38.2 per cent from 6.8 per cent at the end of September 2019 to 9.4 per cent at the end of September 2020. The sector also faced a high
ProvisionCoverageRatioof LFCs and SLCs Sector
Chart 3.36
Source: Central Bank of Sri Lanka
Product-wise Loans and Advances by End September
Chart 3.37
Rs.
bill
ion
Per
cen
t
70
60
50
40
30
20
10
0
Dec
-14
Jun-
15
Dec
-15
Jun-
16
Dec
-16
Jun-
17
Dec
-27
Jun-
18
Dec
-18
Jun-
19
Dec
-19
Jun-
20Provision made
Gross NPL Volume
Provision Coverage Ratio (RHS)
150
100
50
0
50
100
150
200
Leasing and Hire Purchase
Pawning Advances
Loans against deposits
Loans against real estate
Micro Finance Loans
Others
55.2%
34.1%
3.0%
0.2%2.1%
5.5%
65
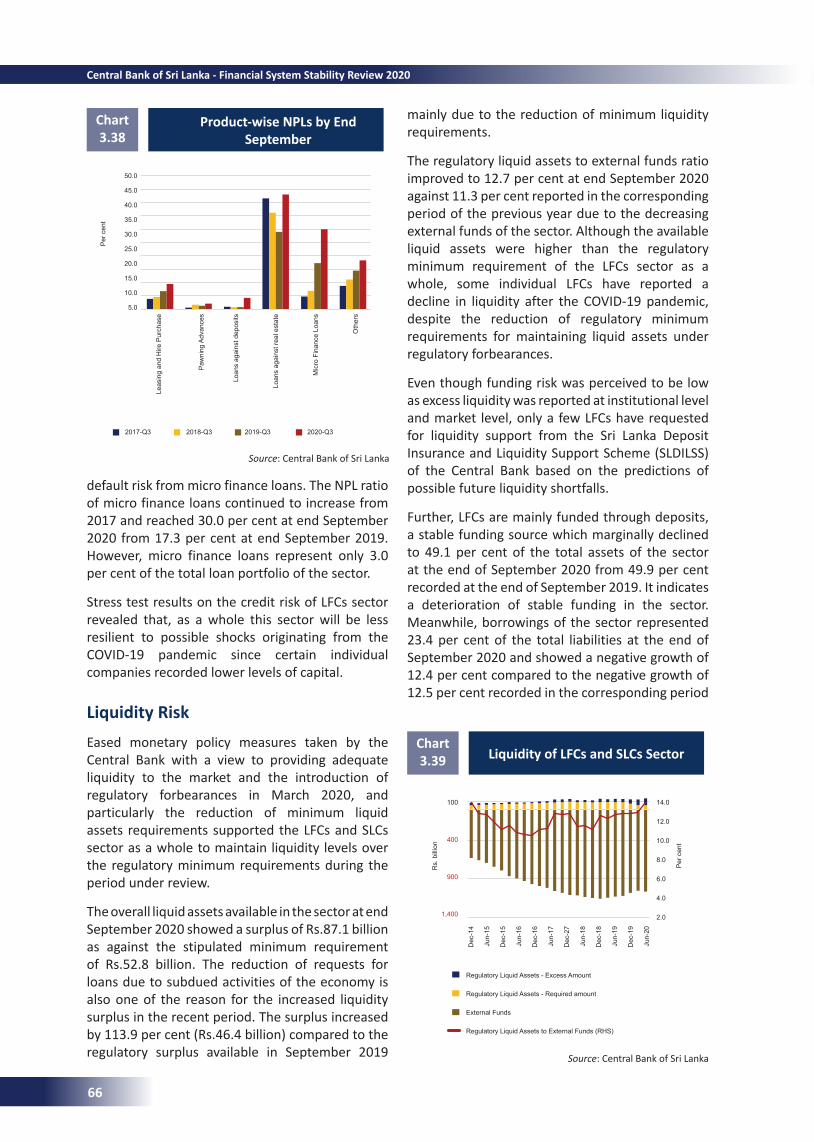
default risk from micro finance loans. The NPL ratio of micro finance loans continued to increase from 2017 and reached 30.0 per cent at end September 2020 from 17.3 per cent at end September 2019. However, micro finance loans represent only 3.0 per cent of the total loan portfolio of the sector.
Stress test results on the credit risk of LFCs sector revealed that, as a whole this sector will be less resilient to possible shocks originating from the COVID-19 pandemic since certain individual companies recorded lower levels of capital.
Liquidity RiskEased monetary policy measures taken by the Central Bank with a view to providing adequate liquidity to the market and the introduction of regulatory forbearances in March 2020, and particularly the reduction of minimum liquid assets requirements supported the LFCs and SLCs sector as a whole to maintain liquidity levels over the regulatory minimum requirements during the period under review.
The overall liquid assets available in the sector at end September 2020 showed a surplus of Rs.87.1 billion as against the stipulated minimum requirement of Rs.52.8 billion. The reduction of requests for loans due to subdued activities of the economy is also one of the reason for the increased liquidity surplus in the recent period. The surplus increased by 113.9 per cent (Rs.46.4 billion) compared to the regulatory surplus available in September 2019
mainly due to the reduction of minimum liquidity requirements.
The regulatory liquid assets to external funds ratio improved to 12.7 per cent at end September 2020 against 11.3 per cent reported in the corresponding period of the previous year due to the decreasing external funds of the sector. Although the available liquid assets were higher than the regulatory minimum requirement of the LFCs sector as a whole, some individual LFCs have reported a decline in liquidity after the COVID-19 pandemic, despite the reduction of regulatory minimum requirements for maintaining liquid assets under regulatory forbearances.
Even though funding risk was perceived to be low as excess liquidity was reported at institutional level and market level, only a few LFCs have requested for liquidity support from the Sri Lanka Deposit Insurance and Liquidity Support Scheme (SLDILSS) of the Central Bank based on the predictions of possible future liquidity shortfalls.
Further, LFCs are mainly funded through deposits, a stable funding source which marginally declined to 49.1 per cent of the total assets of the sector at the end of September 2020 from 49.9 per cent recorded at the end of September 2019. It indicates a deterioration of stable funding in the sector. Meanwhile, borrowings of the sector represented 23.4 per cent of the total liabilities at the end of September 2020 and showed a negative growth of 12.4 per cent compared to the negative growth of 12.5 per cent recorded in the corresponding period
Product-wise NPLs by End September
Chart 3.38
Source: Central Bank of Sri Lanka
Source: Central Bank of Sri Lanka
Liquidity of LFCs and SLCs SectorChart 3.39
Per
cen
t
Leas
ing
and
Hire
Pur
chas
e
Paw
ning
Adv
ance
s
Loan
s ag
ains
t dep
osits
Loan
s ag
ains
t rea
l est
ate
Mic
ro F
inan
ce L
oans
Oth
ers
50.0
45.0
40.0
35.0
30.0
25.0
20.0
15.0
10.0
5.0
2017-Q3 2018-Q3 2019-Q3 2020-Q3
Regulatory Liquid Assets - Excess Amount
Regulatory Liquid Assets - Required amount
External Funds
Regulatory Liquid Assets to External Funds (RHS)
14.0
12.0
10.0
8.0
6.0
4.0
2.0
100
400
900
1,400
Dec
-14
Jun-
15
Dec
-15
Jun-
16
Dec
-16
Jun-
17
Dec
-27
Jun-
18
Dec
-18
Jun-
19
Dec
-19
Jun-
20
Rs.
bill
ion
Per
cen
t
66
Central Bank of Sri Lanka - Financial System Stability Review 2020
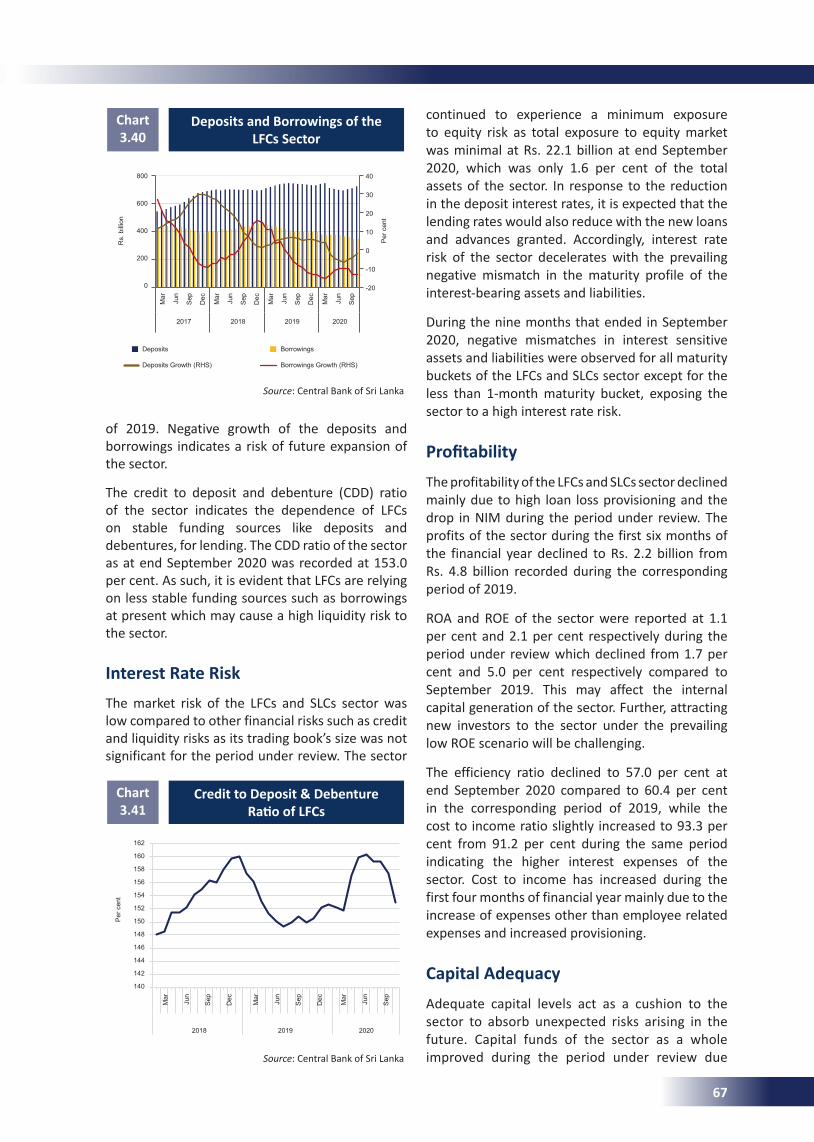
of 2019. Negative growth of the deposits and borrowings indicates a risk of future expansion of the sector.
The credit to deposit and debenture (CDD) ratio of the sector indicates the dependence of LFCs on stable funding sources like deposits and debentures, for lending. The CDD ratio of the sector as at end September 2020 was recorded at 153.0 per cent. As such, it is evident that LFCs are relying on less stable funding sources such as borrowings at present which may cause a high liquidity risk to the sector.
Interest Rate Risk The market risk of the LFCs and SLCs sector was low compared to other financial risks such as credit and liquidity risks as its trading book’s size was not significant for the period under review. The sector
continued to experience a minimum exposure to equity risk as total exposure to equity market was minimal at Rs. 22.1 billion at end September 2020, which was only 1.6 per cent of the total assets of the sector. In response to the reduction in the deposit interest rates, it is expected that the lending rates would also reduce with the new loans and advances granted. Accordingly, interest rate risk of the sector decelerates with the prevailing negative mismatch in the maturity profile of the interest-bearing assets and liabilities.
During the nine months that ended in September 2020, negative mismatches in interest sensitive assets and liabilities were observed for all maturity buckets of the LFCs and SLCs sector except for the less than 1-month maturity bucket, exposing the sector to a high interest rate risk.
ProfitabilityThe profitability of the LFCs and SLCs sector declined mainly due to high loan loss provisioning and the drop in NIM during the period under review. The profits of the sector during the first six months of the financial year declined to Rs. 2.2 billion from Rs. 4.8 billion recorded during the corresponding period of 2019.
ROA and ROE of the sector were reported at 1.1 per cent and 2.1 per cent respectively during the period under review which declined from 1.7 per cent and 5.0 per cent respectively compared to September 2019. This may affect the internal capital generation of the sector. Further, attracting new investors to the sector under the prevailing low ROE scenario will be challenging.
The efficiency ratio declined to 57.0 per cent at end September 2020 compared to 60.4 per cent in the corresponding period of 2019, while the cost to income ratio slightly increased to 93.3 per cent from 91.2 per cent during the same period indicating the higher interest expenses of the sector. Cost to income has increased during the first four months of financial year mainly due to the increase of expenses other than employee related expenses and increased provisioning.
Capital Adequacy Adequate capital levels act as a cushion to the sector to absorb unexpected risks arising in the future. Capital funds of the sector as a whole improved during the period under review due
Source: Central Bank of Sri Lanka
Source: Central Bank of Sri Lanka
Deposits and Borrowings of the LFCs Sector
Chart 3.40
Credit to Deposit & Debenture RatioofLFCs
Chart 3.41
Rs.
bill
ion
2017 2018 2019 2020
Per
cen
t
Deposits Borrowings
Deposits Growth (RHS) Borrowings Growth (RHS)
800
600
400
200
0
Mar
Jun
Sep
Dec
Mar
Jun
Sep
Dec
Mar
Jun
Sep
Dec
Mar
Jun
Sep
40
30
20
10
0
-10
-20
Per
cen
t
162
160
158
156
154
152
150
148
146
144
142
140
Mar
Jun
Sep
Dec
Mar
Jun
Sep
Dec
Mar
Jun
Sep
2018 2019 2020
67
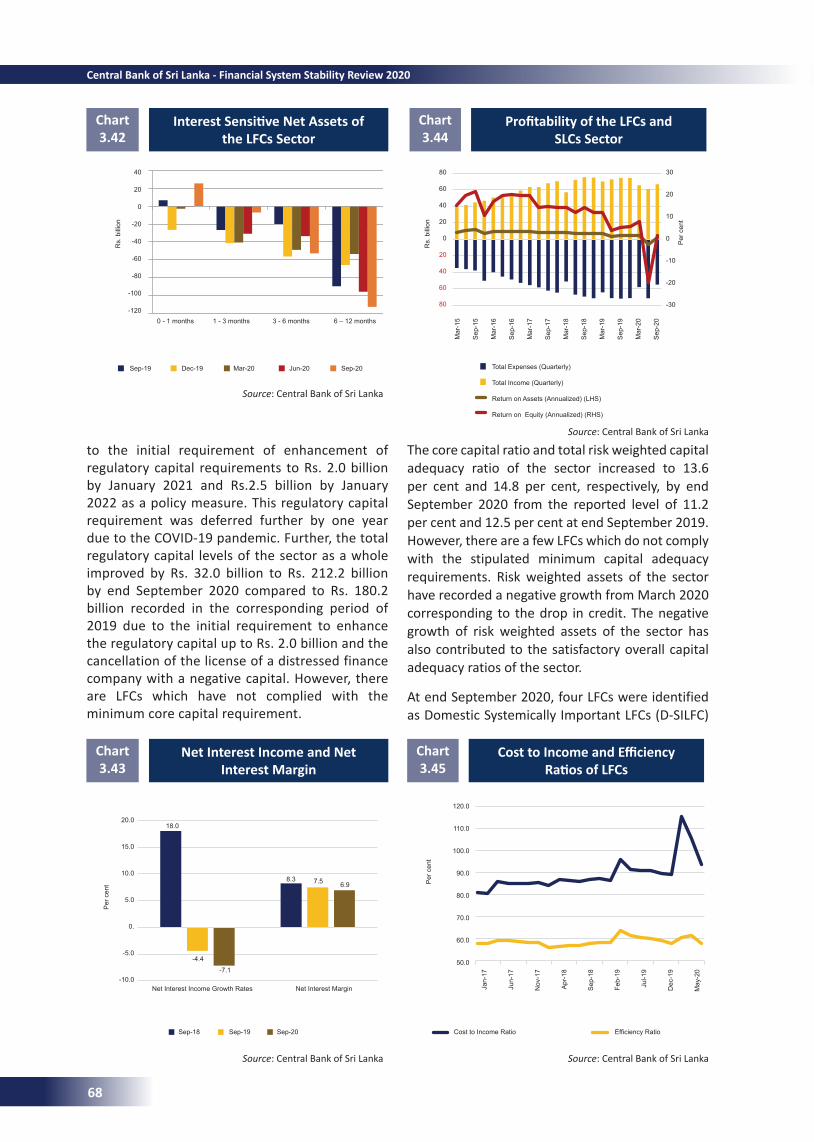
Net Interest Income and Net Interest Margin
Chart 3.43
ProfitabilityoftheLFCsandSLCs Sector
Chart 3.44
CosttoIncomeandEfficiencyRatiosofLFCs
Chart 3.45
Source: Central Bank of Sri Lanka
Source: Central Bank of Sri Lanka
Source: Central Bank of Sri Lanka
Source: Central Bank of Sri Lanka
to the initial requirement of enhancement of regulatory capital requirements to Rs. 2.0 billion by January 2021 and Rs.2.5 billion by January 2022 as a policy measure. This regulatory capital requirement was deferred further by one year due to the COVID-19 pandemic. Further, the total regulatory capital levels of the sector as a whole improved by Rs. 32.0 billion to Rs. 212.2 billion by end September 2020 compared to Rs. 180.2 billion recorded in the corresponding period of 2019 due to the initial requirement to enhance the regulatory capital up to Rs. 2.0 billion and the cancellation of the license of a distressed finance company with a negative capital. However, there are LFCs which have not complied with the minimum core capital requirement.
The core capital ratio and total risk weighted capital adequacy ratio of the sector increased to 13.6 per cent and 14.8 per cent, respectively, by end September 2020 from the reported level of 11.2 per cent and 12.5 per cent at end September 2019. However, there are a few LFCs which do not comply with the stipulated minimum capital adequacy requirements. Risk weighted assets of the sector have recorded a negative growth from March 2020 corresponding to the drop in credit. The negative growth of risk weighted assets of the sector has also contributed to the satisfactory overall capital adequacy ratios of the sector.
At end September 2020, four LFCs were identified as Domestic Systemically Important LFCs (D-SILFC)
InterestSensitiveNetAssetsofthe LFCs Sector
Chart 3.42
Rs.
bill
ion
Rs.
bill
ion
40
20
0
-20
-40
-60
-80
-100
-1200 - 1 months 1 - 3 months 3 - 6 months 6 – 12 months
Sep-19 Dec-19 Mar-20 Jun-20 Sep-20
Per
cen
t
20.0
15.0
10.0
5.0
0.
-5.0
-10.0Net Interest Income Growth Rates Net Interest Margin
Sep-18 Sep-19 Sep-20
18.0
-4.4
-7.1
8.3 7.5 6.9
Per
cen
t
80
60
40
20
0
20
40
60
80
30
20
10
0
-10
-20
-30
Mar
-15
Sep
-15
Mar
-16
Sep
-16
Mar
-17
Sep
-17
Mar
-18
Sep
-18
Mar
-19
Sep
-19
Mar
-20
Sep
-20
Total Expenses (Quarterly)
Total Income (Quarterly)
Return on Assets (Annualized) (LHS)
Return on Equity (Annualized) (RHS)
Per
cen
t
120.0
110.0
100.0
90.0
80.0
70.0
60.0
50.0
Jan-
17
Jun-
17
Nov
-17
Apr
-18
Sep
-18
Feb-
19
Jul-1
9
Dec
-19
May
-20
Cost to Income Ratio Efficiency Ratio
68
Central Bank of Sri Lanka - Financial System Stability Review 2020
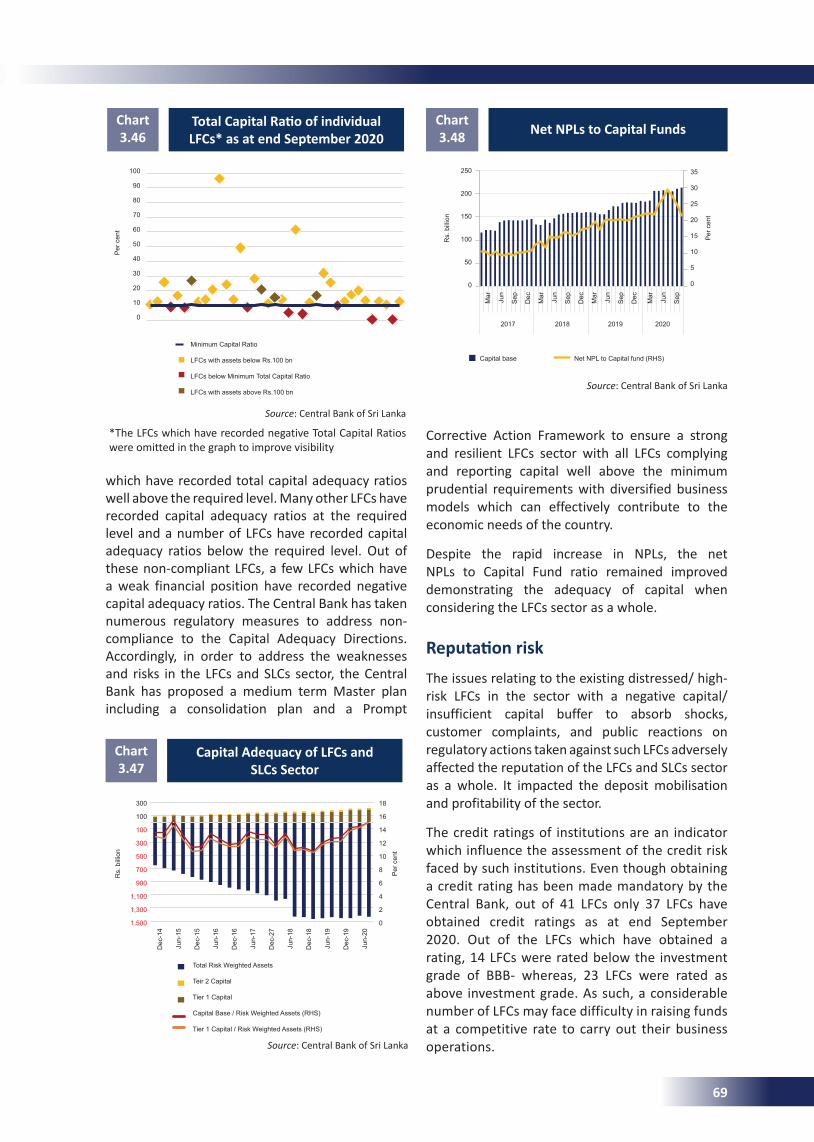
Source: Central Bank of Sri Lanka
TotalCapitalRatioofindividualLFCs* as at end September 2020
Chart 3.46
*The LFCs which have recorded negative Total Capital Ratios were omitted in the graph to improve visibility
Source: Central Bank of Sri Lanka
which have recorded total capital adequacy ratios well above the required level. Many other LFCs have recorded capital adequacy ratios at the required level and a number of LFCs have recorded capital adequacy ratios below the required level. Out of these non-compliant LFCs, a few LFCs which have a weak financial position have recorded negative capital adequacy ratios. The Central Bank has taken numerous regulatory measures to address non-compliance to the Capital Adequacy Directions. Accordingly, in order to address the weaknesses and risks in the LFCs and SLCs sector, the Central Bank has proposed a medium term Master plan including a consolidation plan and a Prompt
Source: Central Bank of Sri Lanka
Capital Adequacy of LFCs and SLCs Sector
Chart 3.47
Corrective Action Framework to ensure a strong and resilient LFCs sector with all LFCs complying and reporting capital well above the minimum prudential requirements with diversified business models which can effectively contribute to the economic needs of the country.
Despite the rapid increase in NPLs, the net NPLs to Capital Fund ratio remained improved demonstrating the adequacy of capital when considering the LFCs sector as a whole.
ReputationriskThe issues relating to the existing distressed/ high-risk LFCs in the sector with a negative capital/insufficient capital buffer to absorb shocks, customer complaints, and public reactions on regulatory actions taken against such LFCs adversely affected the reputation of the LFCs and SLCs sector as a whole. It impacted the deposit mobilisation and profitability of the sector.
The credit ratings of institutions are an indicator which influence the assessment of the credit risk faced by such institutions. Even though obtaining a credit rating has been made mandatory by the Central Bank, out of 41 LFCs only 37 LFCs have obtained credit ratings as at end September 2020. Out of the LFCs which have obtained a rating, 14 LFCs were rated below the investment grade of BBB- whereas, 23 LFCs were rated as above investment grade. As such, a considerable number of LFCs may face difficulty in raising funds at a competitive rate to carry out their business operations.
Net NPLs to Capital FundsChart 3.48
Per
cen
t
100
90
80
70
60
50
40
30
20
10
0
Minimum Capital Ratio
LFCs with assets below Rs.100 bn
LFCs below Minimum Total Capital Ratio
LFCs with assets above Rs.100 bn
Rs.
bill
ion
Per
cen
t
300
100
100
300
500
700
900
1,100
1,300
1,500
18
16
14
12
10
8
6
4
2
0
Dec
-14
Jun-
15
Dec
-15
Jun-
16
Dec
-16
Jun-
17
Dec
-27
Jun-
18
Dec
-18
Jun-
19
Dec
-19
Jun-
20
Total Risk Weighted Assets
Teir 2 Capital
Tier 1 Capital
Capital Base / Risk Weighted Assets (RHS)
Tier 1 Capital / Risk Weighted Assets (RHS)
Rs.
bill
ion
2017 2018 2019 2020
Per
cen
t
250
200
150
100
50
0
35
30
25
20
15
10
5
0
Mar
Jun
Sep
Dec
Mar
Jun
Sep
Dec
Mar
Jun
Sep
Dec
Mar
Jun
Sep
Capital base Net NPL to Capital fund (RHS)
69
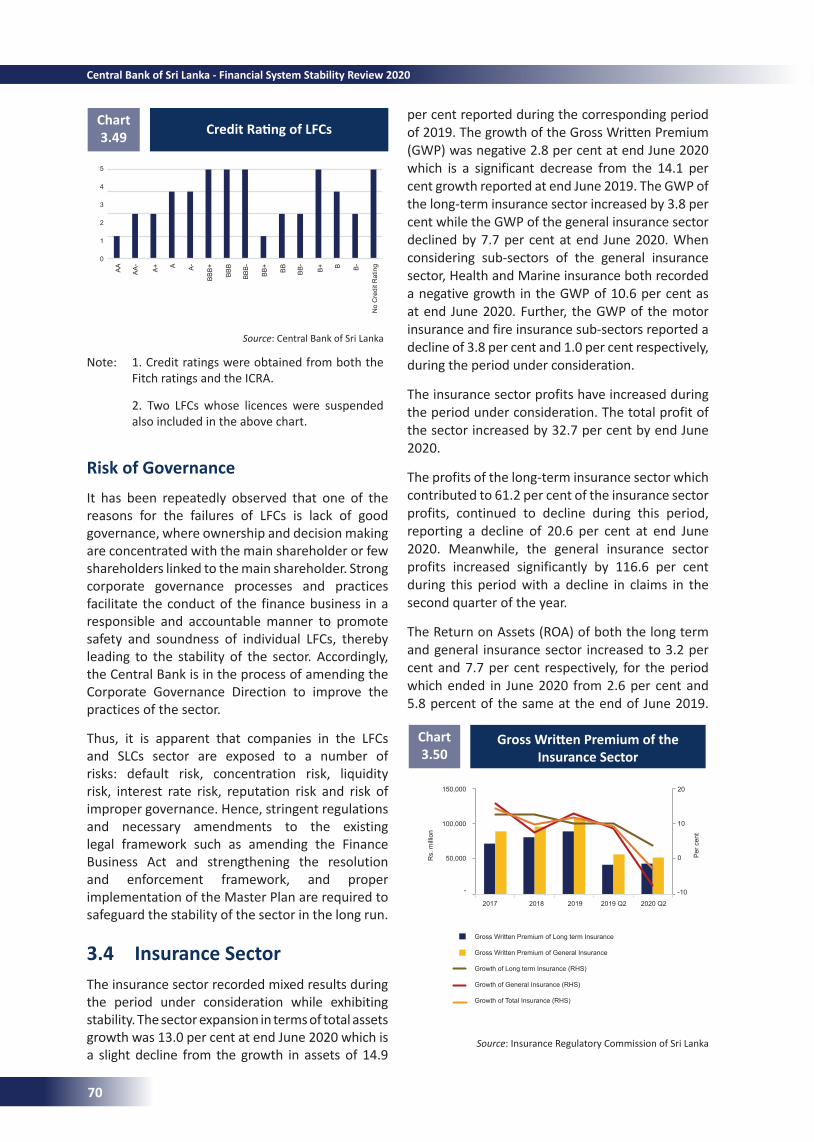
Risk of Governance It has been repeatedly observed that one of the reasons for the failures of LFCs is lack of good governance, where ownership and decision making are concentrated with the main shareholder or few shareholders linked to the main shareholder. Strong corporate governance processes and practices facilitate the conduct of the finance business in a responsible and accountable manner to promote safety and soundness of individual LFCs, thereby leading to the stability of the sector. Accordingly, the Central Bank is in the process of amending the Corporate Governance Direction to improve the practices of the sector.
Thus, it is apparent that companies in the LFCs and SLCs sector are exposed to a number of risks: default risk, concentration risk, liquidity risk, interest rate risk, reputation risk and risk of improper governance. Hence, stringent regulations and necessary amendments to the existing legal framework such as amending the Finance Business Act and strengthening the resolution and enforcement framework, and proper implementation of the Master Plan are required to safeguard the stability of the sector in the long run.
3.4 Insurance SectorThe insurance sector recorded mixed results during the period under consideration while exhibiting stability. The sector expansion in terms of total assets growth was 13.0 per cent at end June 2020 which is a slight decline from the growth in assets of 14.9
GrossWrittenPremiumoftheInsurance Sector
Chart 3.50
Source: Insurance Regulatory Commission of Sri Lanka
per cent reported during the corresponding period of 2019. The growth of the Gross Written Premium (GWP) was negative 2.8 per cent at end June 2020 which is a significant decrease from the 14.1 per cent growth reported at end June 2019. The GWP of the long-term insurance sector increased by 3.8 per cent while the GWP of the general insurance sector declined by 7.7 per cent at end June 2020. When considering sub-sectors of the general insurance sector, Health and Marine insurance both recorded a negative growth in the GWP of 10.6 per cent as at end June 2020. Further, the GWP of the motor insurance and fire insurance sub-sectors reported a decline of 3.8 per cent and 1.0 per cent respectively, during the period under consideration.
The insurance sector profits have increased during the period under consideration. The total profit of the sector increased by 32.7 per cent by end June 2020.
The profits of the long-term insurance sector which contributed to 61.2 per cent of the insurance sector profits, continued to decline during this period, reporting a decline of 20.6 per cent at end June 2020. Meanwhile, the general insurance sector profits increased significantly by 116.6 per cent during this period with a decline in claims in the second quarter of the year.
The Return on Assets (ROA) of both the long term and general insurance sector increased to 3.2 per cent and 7.7 per cent respectively, for the period which ended in June 2020 from 2.6 per cent and 5.8 percent of the same at the end of June 2019.
Rs.
mill
ion
Per
cen
t
150,000
100,000
50,000
-
2017 2018 2019 2019 Q2 2020 Q2
20
10
0
-10
Gross Written Premium of Long term Insurance
Gross Written Premium of General Insurance
Growth of Long term Insurance (RHS)
Growth of General Insurance (RHS)
Growth of Total Insurance (RHS)
CreditRatingofLFCsChart 3.49
Note: 1. Credit ratings were obtained from both the Fitch ratings and the ICRA.
2. Two LFCs whose licences were suspended also included in the above chart.
Source: Central Bank of Sri Lanka
5
4
3
2
1
0
AA
AA
-
A+ A A-
BB
B+
BB
B
BB
B-
BB
+
BB
BB
-
B+ B B-
No
Cre
dit R
atin
g
70
Central Bank of Sri Lanka - Financial System Stability Review 2020
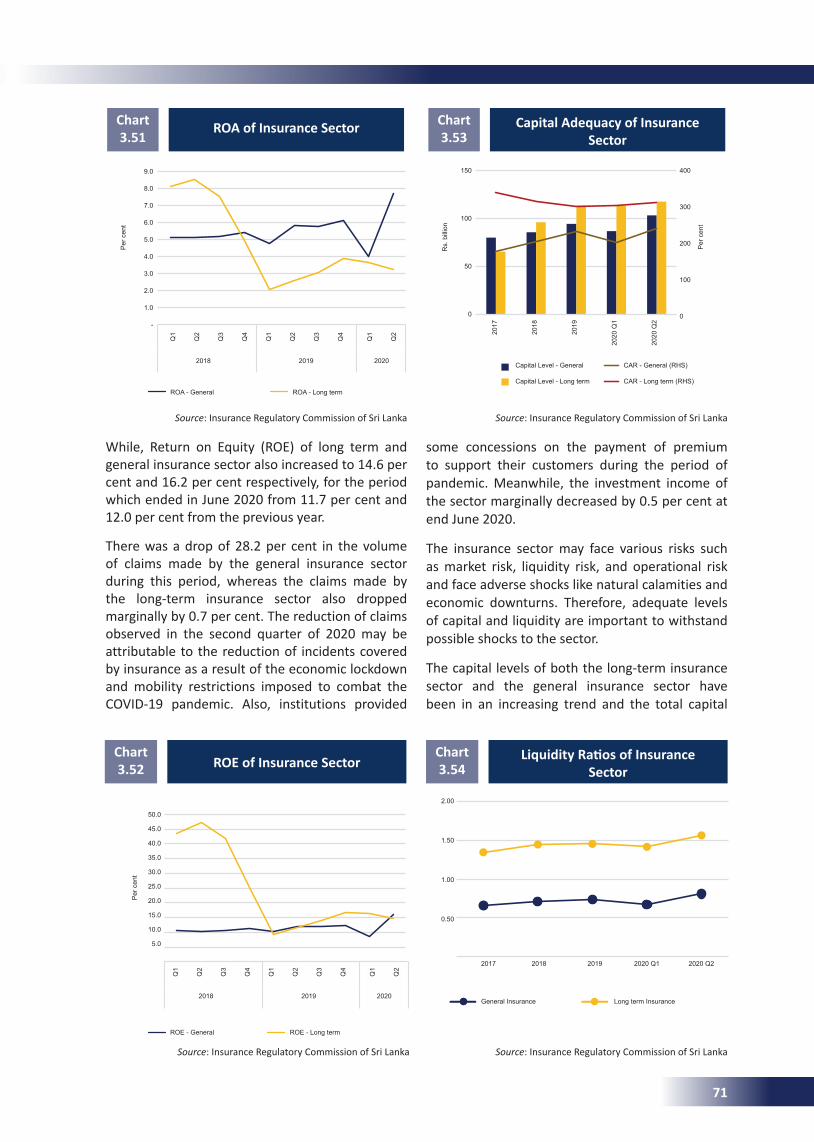
ROA of Insurance Sector Chart 3.51
Source: Insurance Regulatory Commission of Sri Lanka Source: Insurance Regulatory Commission of Sri Lanka
ROE of Insurance SectorChart 3.52
Source: Insurance Regulatory Commission of Sri Lanka
While, Return on Equity (ROE) of long term and general insurance sector also increased to 14.6 per cent and 16.2 per cent respectively, for the period which ended in June 2020 from 11.7 per cent and 12.0 per cent from the previous year.
There was a drop of 28.2 per cent in the volume of claims made by the general insurance sector during this period, whereas the claims made by the long-term insurance sector also dropped marginally by 0.7 per cent. The reduction of claims observed in the second quarter of 2020 may be attributable to the reduction of incidents covered by insurance as a result of the economic lockdown and mobility restrictions imposed to combat the COVID-19 pandemic. Also, institutions provided
some concessions on the payment of premium to support their customers during the period of pandemic. Meanwhile, the investment income of the sector marginally decreased by 0.5 per cent at end June 2020.
The insurance sector may face various risks such as market risk, liquidity risk, and operational risk and face adverse shocks like natural calamities and economic downturns. Therefore, adequate levels of capital and liquidity are important to withstand possible shocks to the sector.
The capital levels of both the long-term insurance sector and the general insurance sector have been in an increasing trend and the total capital
Capital Adequacy of Insurance Sector
Chart 3.53
Source: Insurance Regulatory Commission of Sri Lanka
LiquidityRatiosofInsuranceSector
Chart 3.54
Per
cen
t
9.0
8.0
7.0
6.0
5.0
4.0
3.0
2.0
1.0
-
Q1
Q2
Q3
Q4
Q1
Q2
Q3
Q4
Q1
Q2
ROA - General ROA - Long term
2018 2019 2020
Per
cen
t
50.0
45.0
40.0
35.0
30.0
25.0
20.0
15.0
10.0
5.0
ROE - General ROE - Long term
Q1
Q2
Q3
Q4
Q1
Q2
Q3
Q4
Q1
Q2
2018 2019 2020
Rs.
bill
ion
Per
cen
t
150
100
50
0
2017
2018
2019
2020
Q1
2020
Q2
400
300
200
100
0
Capital Level - General
Capital Level - Long term
CAR - General (RHS)
CAR - Long term (RHS)
2.00
1.50
1.00
0.50
2017 2018 2019 2020 Q1 2020 Q2
General Insurance Long term Insurance
71
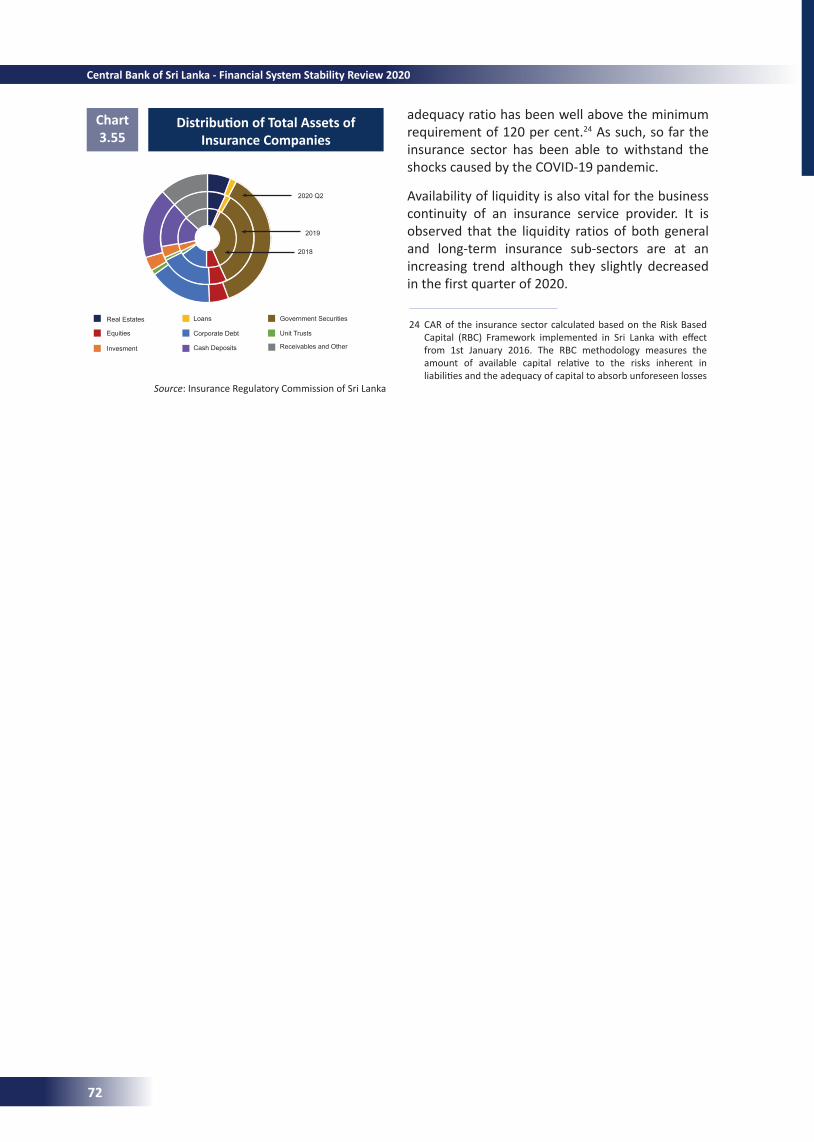
DistributionofTotalAssetsofInsurance Companies
Chart 3.55
24 CAR of the insurance sector calculated based on the Risk Based Capital (RBC) Framework implemented in Sri Lanka with effect from 1st January 2016. The RBC methodology measures the amount of available capital relative to the risks inherent in liabilities and the adequacy of capital to absorb unforeseen losses
Source: Insurance Regulatory Commission of Sri Lanka
adequacy ratio has been well above the minimum requirement of 120 per cent.24 As such, so far the insurance sector has been able to withstand the shocks caused by the COVID-19 pandemic.
Availability of liquidity is also vital for the business continuity of an insurance service provider. It is observed that the liquidity ratios of both general and long-term insurance sub-sectors are at an increasing trend although they slightly decreased in the first quarter of 2020.
2020 Q2
2019
2018
Real Estates Loans Government Securities
Equities Unit Trusts
Invesment Cash Deposits
Corporate Debt
Receivables and Other
72
Central Bank of Sri Lanka - Financial System Stability Review 2020
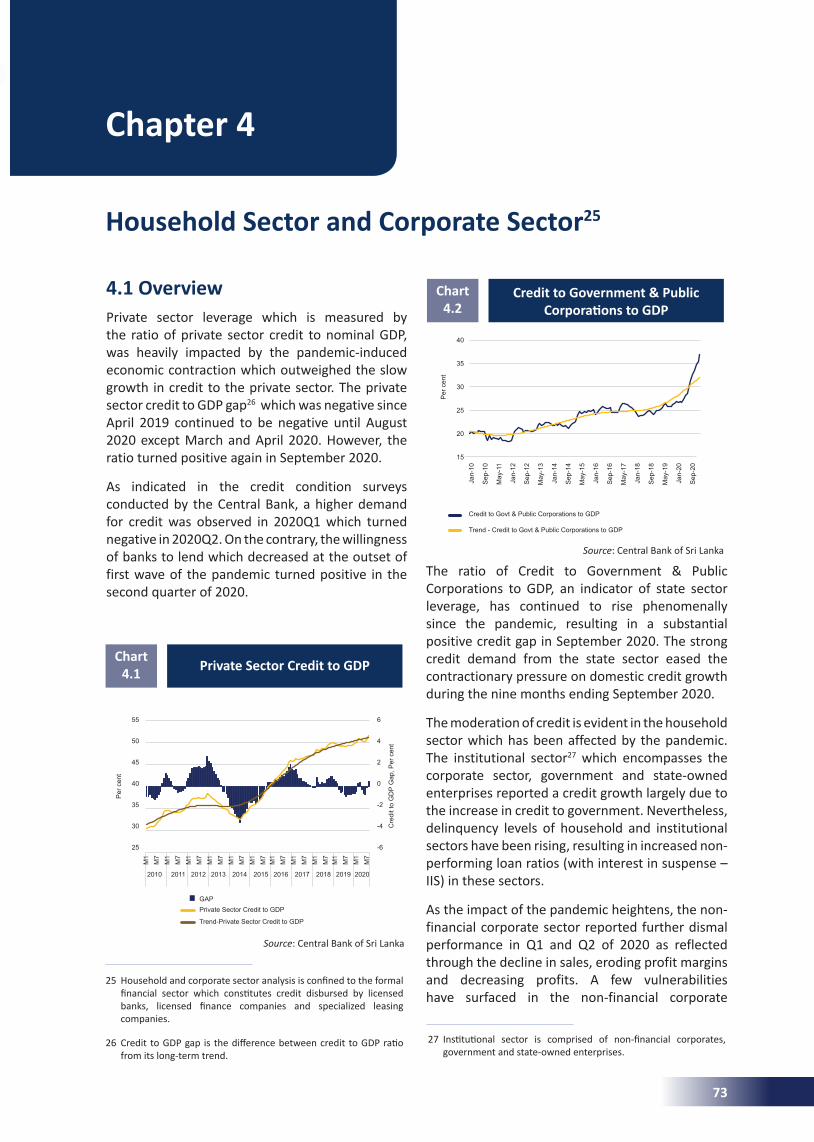
Private Sector Credit to GDPChart
4.1
Credit to Government & Public CorporationstoGDP
Chart 4.2
Chapter 4
Household Sector and Corporate Sector25
Private sector leverage which is measured by the ratio of private sector credit to nominal GDP, was heavily impacted by the pandemic-induced economic contraction which outweighed the slow growth in credit to the private sector. The private sector credit to GDP gap26 which was negative since April 2019 continued to be negative until August 2020 except March and April 2020. However, the ratio turned positive again in September 2020.
As indicated in the credit condition surveys conducted by the Central Bank, a higher demand for credit was observed in 2020Q1 which turned negative in 2020Q2. On the contrary, the willingness of banks to lend which decreased at the outset of first wave of the pandemic turned positive in the second quarter of 2020.
4.1 Overview
25 Household and corporate sector analysis is confined to the formal financial sector which constitutes credit disbursed by licensed banks, licensed finance companies and specialized leasing companies.
26 Credit to GDP gap is the difference between credit to GDP ratio from its long-term trend.
27 Institutional sector is comprised of non-financial corporates, government and state-owned enterprises.
The ratio of Credit to Government & Public Corporations to GDP, an indicator of state sector leverage, has continued to rise phenomenally since the pandemic, resulting in a substantial positive credit gap in September 2020. The strong credit demand from the state sector eased the contractionary pressure on domestic credit growth during the nine months ending September 2020.
The moderation of credit is evident in the household sector which has been affected by the pandemic. The institutional sector27 which encompasses the corporate sector, government and state-owned enterprises reported a credit growth largely due to the increase in credit to government. Nevertheless, delinquency levels of household and institutional sectors have been rising, resulting in increased non-performing loan ratios (with interest in suspense – IIS) in these sectors.
As the impact of the pandemic heightens, the non-financial corporate sector reported further dismal performance in Q1 and Q2 of 2020 as reflected through the decline in sales, eroding profit margins and decreasing profits. A few vulnerabilities have surfaced in the non-financial corporate
Source: Central Bank of Sri Lanka
Source: Central Bank of Sri Lanka
2010 2011 2012 2013 2014 2015 2016 2017 2018 2019 2020
55
50
45
40
35
30
25
6
4
2
0
-2
-4
-6
M1
M7
M1
M7
M1
M7
M1
M7
M1
M7
M1
M7
M1
M7
M1
M7
M1
M7
M1
M7
M1
M7
GAPPrivate Sector Credit to GDP
Trend-Private Sector Credit to GDP
Cre
dit t
o G
DP
Gap
, Per
cen
t
40
35
30
25
20
15
Jan-
10
Sep
-10
May
-11
Jan-
12
Sep
-12
May
-13
Jan-
14
Sep
-14
May
-15
Jan-
16
Sep
-16
May
-17
Jan-
18
Sep
-18
May
-19
Jan-
20
Sep
-20
Credit to Govt & Public Corporations to GDP
Trend - Credit to Govt & Public Corporations to GDP
Per
cen
t
Per
cen
t
73
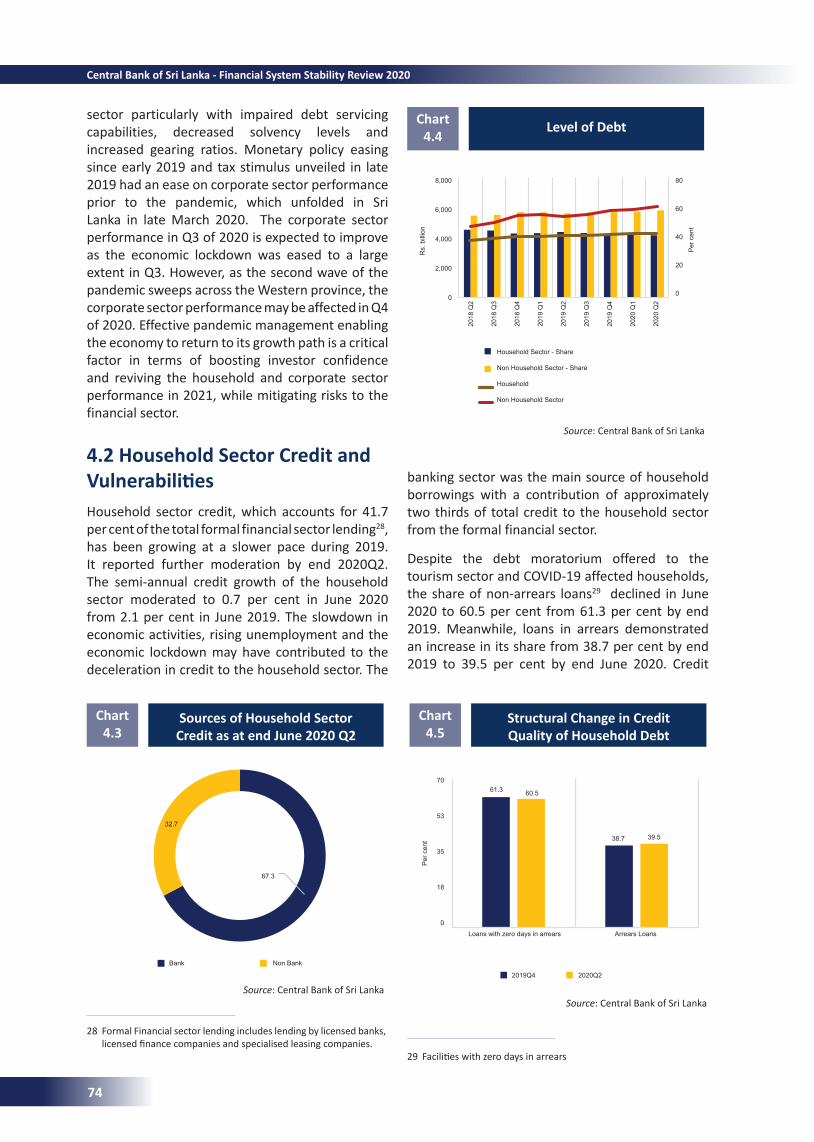
sector particularly with impaired debt servicing capabilities, decreased solvency levels and increased gearing ratios. Monetary policy easing since early 2019 and tax stimulus unveiled in late 2019 had an ease on corporate sector performance prior to the pandemic, which unfolded in Sri Lanka in late March 2020. The corporate sector performance in Q3 of 2020 is expected to improve as the economic lockdown was eased to a large extent in Q3. However, as the second wave of the pandemic sweeps across the Western province, the corporate sector performance may be affected in Q4 of 2020. Effective pandemic management enabling the economy to return to its growth path is a critical factor in terms of boosting investor confidence and reviving the household and corporate sector performance in 2021, while mitigating risks to the financial sector.
4.2 Household Sector Credit and VulnerabilitiesHousehold sector credit, which accounts for 41.7 per cent of the total formal financial sector lending28, has been growing at a slower pace during 2019. It reported further moderation by end 2020Q2. The semi-annual credit growth of the household sector moderated to 0.7 per cent in June 2020 from 2.1 per cent in June 2019. The slowdown in economic activities, rising unemployment and the economic lockdown may have contributed to the deceleration in credit to the household sector. The
Level of DebtChart 4.4
29 Facilities with zero days in arrears
Sources of Household Sector Credit as at end June 2020 Q2
Chart 4.3
28 Formal Financial sector lending includes lending by licensed banks, licensed finance companies and specialised leasing companies.
Source: Central Bank of Sri Lanka
Source: Central Bank of Sri Lanka
Structural Change in Credit Quality of Household Debt
Chart 4.5
Source: Central Bank of Sri Lanka
banking sector was the main source of household borrowings with a contribution of approximately two thirds of total credit to the household sector from the formal financial sector.
Despite the debt moratorium offered to the tourism sector and COVID-19 affected households, the share of non-arrears loans29 declined in June 2020 to 60.5 per cent from 61.3 per cent by end 2019. Meanwhile, loans in arrears demonstrated an increase in its share from 38.7 per cent by end 2019 to 39.5 per cent by end June 2020. Credit
67.3
32.7
Bank Non Bank
Rs.
bill
ion
8,000
6,000
4,000
2,000
0
80
60
40
20
0
2018
Q2
2018
Q3
2018
Q4
2019
Q1
2019
Q2
2019
Q3
2019
Q4
2020
Q1
2020
Q2
Household Sector - Share
Non Household Sector - Share
Household
Non Household Sector
Per
cen
t
70
53
35
18
0Loans with zero days in arrears Arrears Loans
2019Q4 2020Q2
61.3 60.5
38.7 39.5
Per
cen
t
74
Central Bank of Sri Lanka - Financial System Stability Review 2020
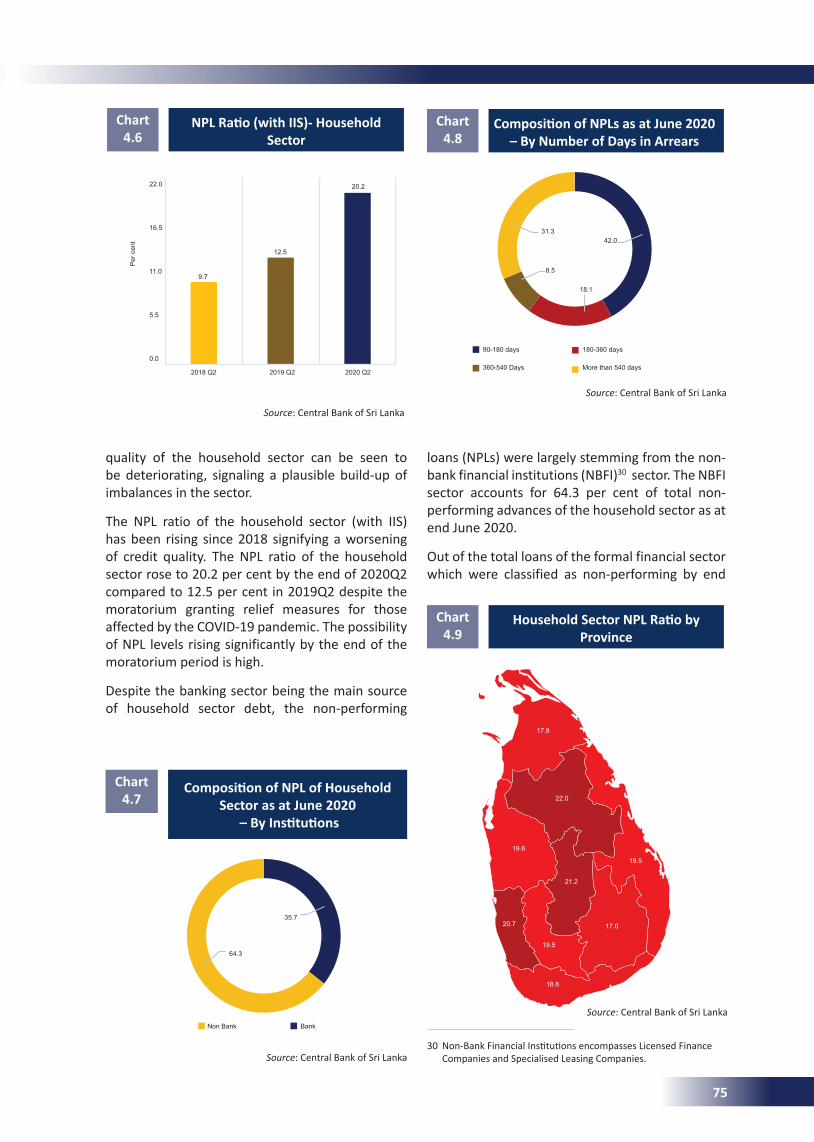
CompositionofNPLofHouseholdSector as at June 2020
–ByInstitutions
Chart 4.7
NPLRatio(withIIS)-HouseholdSector
Chart 4.6
CompositionofNPLsasatJune2020–ByNumberofDaysinArrears
Chart 4.8
loans (NPLs) were largely stemming from the non-bank financial institutions (NBFI)30 sector. The NBFI sector accounts for 64.3 per cent of total non-performing advances of the household sector as at end June 2020.
Out of the total loans of the formal financial sector which were classified as non-performing by end
30 Non-Bank Financial Institutions encompasses Licensed Finance Companies and Specialised Leasing Companies. Source: Central Bank of Sri Lanka
Source: Central Bank of Sri Lanka
Source: Central Bank of Sri Lanka
quality of the household sector can be seen to be deteriorating, signaling a plausible build-up of imbalances in the sector.
The NPL ratio of the household sector (with IIS) has been rising since 2018 signifying a worsening of credit quality. The NPL ratio of the household sector rose to 20.2 per cent by the end of 2020Q2 compared to 12.5 per cent in 2019Q2 despite the moratorium granting relief measures for those affected by the COVID-19 pandemic. The possibility of NPL levels rising significantly by the end of the moratorium period is high.
Despite the banking sector being the main source of household sector debt, the non-performing
HouseholdSectorNPLRatiobyProvince
Chart 4.9
Per
cen
t
22.0
16.5
11.0
5.5
0.0
2018 Q2 2019 Q2 2020 Q2
9.7
12.5
20.2
35.7
64.3
Non Bank Bank
31.342.0
18.1
8.5
90-180 days 180-360 days
360-540 Days More than 540 days
17.8
19.6
20.7 17.0
21.2
19.5
19.5
18.8
22.0
Source: Central Bank of Sri Lanka
75
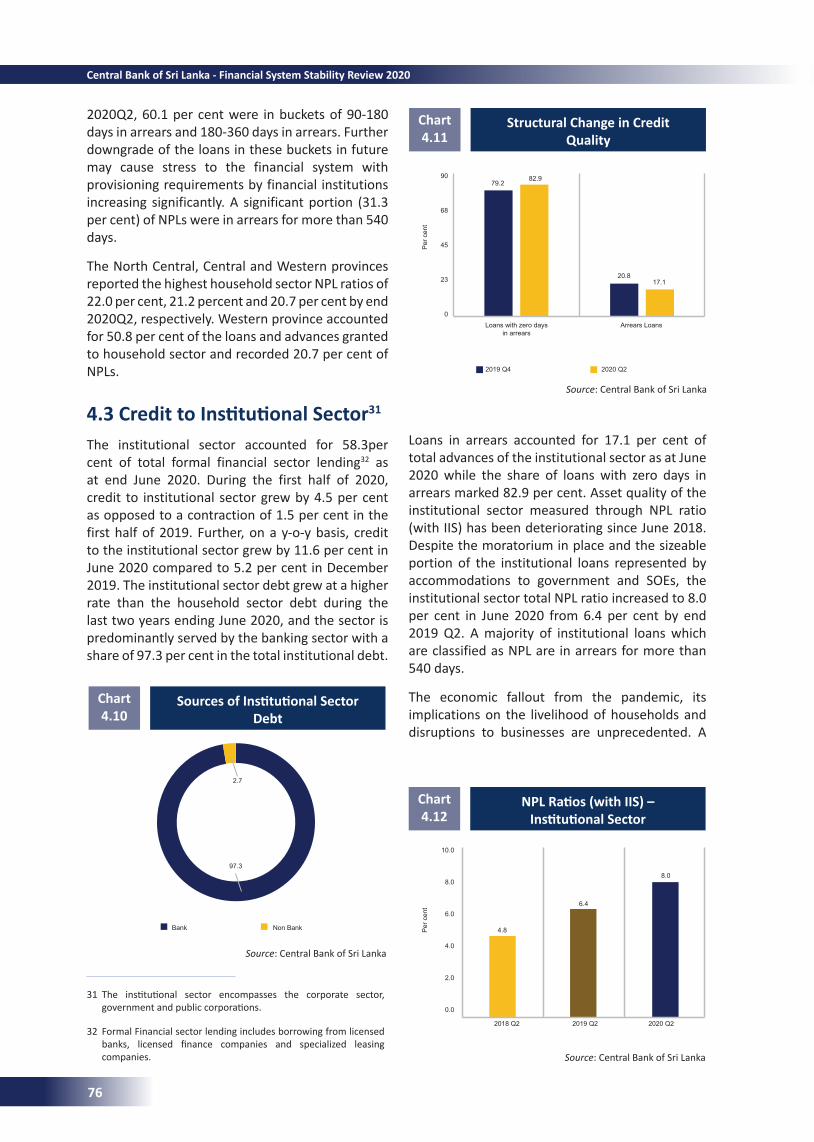
SourcesofInstitutionalSectorDebt
Chart 4.10
Structural Change in Credit Quality
Chart 4.11
31 The institutional sector encompasses the corporate sector, government and public corporations.
32 Formal Financial sector lending includes borrowing from licensed banks, licensed finance companies and specialized leasing companies.
Loans in arrears accounted for 17.1 per cent of total advances of the institutional sector as at June 2020 while the share of loans with zero days in arrears marked 82.9 per cent. Asset quality of the institutional sector measured through NPL ratio (with IIS) has been deteriorating since June 2018. Despite the moratorium in place and the sizeable portion of the institutional loans represented by accommodations to government and SOEs, the institutional sector total NPL ratio increased to 8.0 per cent in June 2020 from 6.4 per cent by end 2019 Q2. A majority of institutional loans which are classified as NPL are in arrears for more than 540 days.
The economic fallout from the pandemic, its implications on the livelihood of households and disruptions to businesses are unprecedented. A
Source: Central Bank of Sri Lanka
Source: Central Bank of Sri Lanka
NPLRatios(withIIS)–InstitutionalSector
Chart 4.12
Source: Central Bank of Sri Lanka
2020Q2, 60.1 per cent were in buckets of 90-180 days in arrears and 180-360 days in arrears. Further downgrade of the loans in these buckets in future may cause stress to the financial system with provisioning requirements by financial institutions increasing significantly. A significant portion (31.3 per cent) of NPLs were in arrears for more than 540 days.
The North Central, Central and Western provinces reported the highest household sector NPL ratios of 22.0 per cent, 21.2 percent and 20.7 per cent by end 2020Q2, respectively. Western province accounted for 50.8 per cent of the loans and advances granted to household sector and recorded 20.7 per cent of NPLs.
4.3CredittoInstitutionalSector31 The institutional sector accounted for 58.3per cent of total formal financial sector lending32 as at end June 2020. During the first half of 2020, credit to institutional sector grew by 4.5 per cent as opposed to a contraction of 1.5 per cent in the first half of 2019. Further, on a y-o-y basis, credit to the institutional sector grew by 11.6 per cent in June 2020 compared to 5.2 per cent in December 2019. The institutional sector debt grew at a higher rate than the household sector debt during the last two years ending June 2020, and the sector is predominantly served by the banking sector with a share of 97.3 per cent in the total institutional debt.
2.7
97.3
Bank Non Bank
Per
cen
t
90
68
45
23
0
79.2
2019 Q4
Loans with zero days in arrears
Arrears Loans
2020 Q2
82.9
20.817.1
Per
cen
t
10.0
8.0
6.0
4.0
2.0
0.0
4.8
6.4
8.0
2018 Q2 2019 Q2 2020 Q2
76
Central Bank of Sri Lanka - Financial System Stability Review 2020
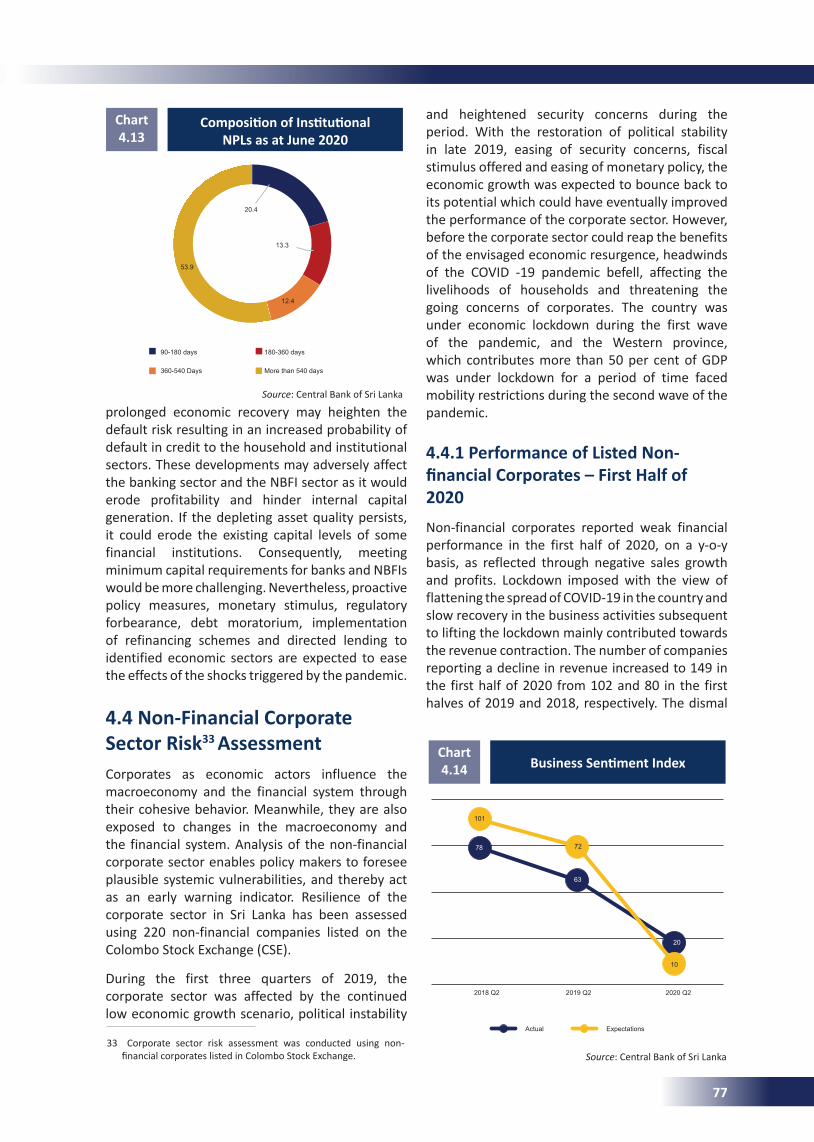
Actual Expectations
CompositionofInstitutionalNPLs as at June 2020
Chart 4.13
33 Corporate sector risk assessment was conducted using non-financial corporates listed in Colombo Stock Exchange.
Source: Central Bank of Sri Lanka
prolonged economic recovery may heighten the default risk resulting in an increased probability of default in credit to the household and institutional sectors. These developments may adversely affect the banking sector and the NBFI sector as it would erode profitability and hinder internal capital generation. If the depleting asset quality persists, it could erode the existing capital levels of some financial institutions. Consequently, meeting minimum capital requirements for banks and NBFIs would be more challenging. Nevertheless, proactive policy measures, monetary stimulus, regulatory forbearance, debt moratorium, implementation of refinancing schemes and directed lending to identified economic sectors are expected to ease the effects of the shocks triggered by the pandemic.
4.4 Non-Financial Corporate Sector Risk33 AssessmentCorporates as economic actors influence the macroeconomy and the financial system through their cohesive behavior. Meanwhile, they are also exposed to changes in the macroeconomy and the financial system. Analysis of the non-financial corporate sector enables policy makers to foresee plausible systemic vulnerabilities, and thereby act as an early warning indicator. Resilience of the corporate sector in Sri Lanka has been assessed using 220 non-financial companies listed on the Colombo Stock Exchange (CSE).
During the first three quarters of 2019, the corporate sector was affected by the continued low economic growth scenario, political instability
and heightened security concerns during the period. With the restoration of political stability in late 2019, easing of security concerns, fiscal stimulus offered and easing of monetary policy, the economic growth was expected to bounce back to its potential which could have eventually improved the performance of the corporate sector. However, before the corporate sector could reap the benefits of the envisaged economic resurgence, headwinds of the COVID -19 pandemic befell, affecting the livelihoods of households and threatening the going concerns of corporates. The country was under economic lockdown during the first wave of the pandemic, and the Western province, which contributes more than 50 per cent of GDP was under lockdown for a period of time faced mobility restrictions during the second wave of the pandemic.
4.4.1 Performance of Listed Non-financialCorporates–FirstHalfof2020Non-financial corporates reported weak financial performance in the first half of 2020, on a y-o-y basis, as reflected through negative sales growth and profits. Lockdown imposed with the view of flattening the spread of COVID-19 in the country and slow recovery in the business activities subsequent to lifting the lockdown mainly contributed towards the revenue contraction. The number of companies reporting a decline in revenue increased to 149 in the first half of 2020 from 102 and 80 in the first halves of 2019 and 2018, respectively. The dismal
BusinessSentimentIndexChart 4.14
Source: Central Bank of Sri Lanka
20.4
13.3
12.4
53.9
90-180 days 180-360 days
360-540 Days More than 540 days
101
72
10
78
63
20
2018 Q2 2019 Q2 2020 Q2
77
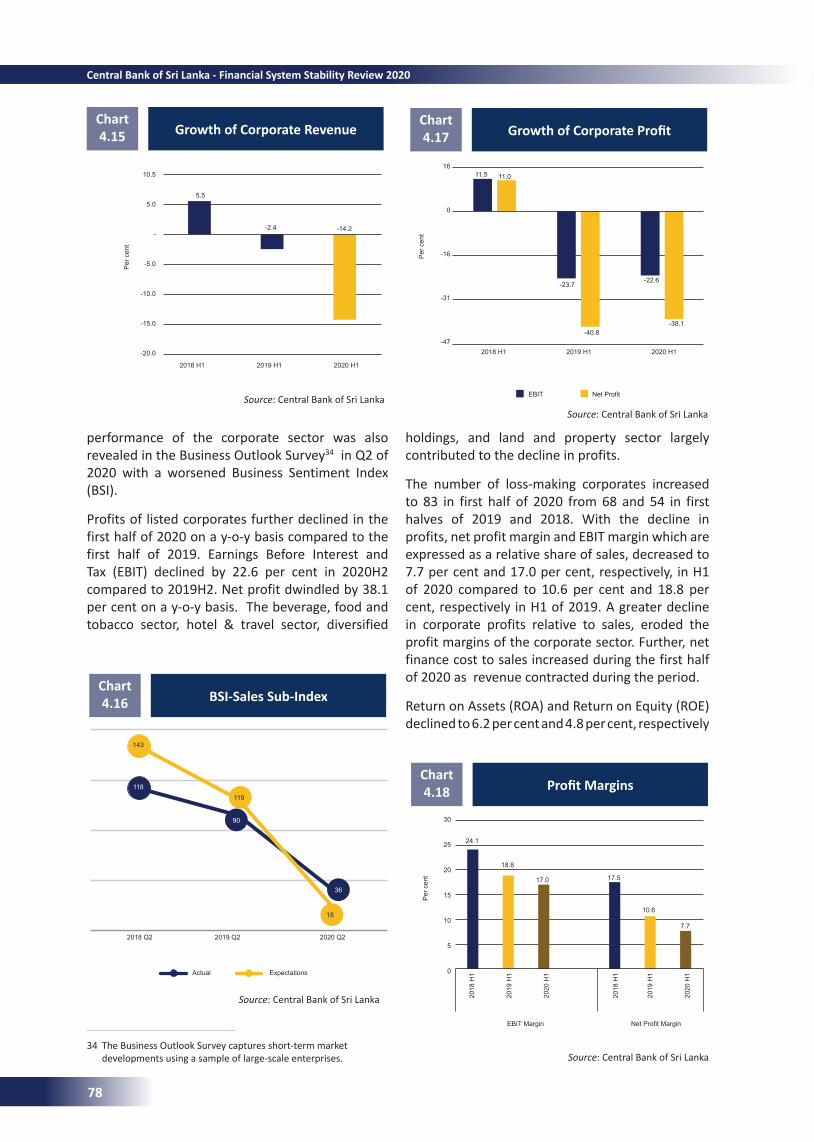
BSI-Sales Sub-IndexChart 4.16
GrowthofCorporateProfitChart 4.17Growth of Corporate Revenue
Chart 4.15
34 The Business Outlook Survey captures short-term market developments using a sample of large-scale enterprises.
ProfitMarginsChart 4.18
Source: Central Bank of Sri Lanka
Source: Central Bank of Sri Lanka
Source: Central Bank of Sri Lanka
Source: Central Bank of Sri Lanka
performance of the corporate sector was also revealed in the Business Outlook Survey34 in Q2 of 2020 with a worsened Business Sentiment Index (BSI).
Profits of listed corporates further declined in the first half of 2020 on a y-o-y basis compared to the first half of 2019. Earnings Before Interest and Tax (EBIT) declined by 22.6 per cent in 2020H2 compared to 2019H2. Net profit dwindled by 38.1 per cent on a y-o-y basis. The beverage, food and tobacco sector, hotel & travel sector, diversified
holdings, and land and property sector largely contributed to the decline in profits.
The number of loss-making corporates increased to 83 in first half of 2020 from 68 and 54 in first halves of 2019 and 2018. With the decline in profits, net profit margin and EBIT margin which are expressed as a relative share of sales, decreased to 7.7 per cent and 17.0 per cent, respectively, in H1 of 2020 compared to 10.6 per cent and 18.8 per cent, respectively in H1 of 2019. A greater decline in corporate profits relative to sales, eroded the profit margins of the corporate sector. Further, net finance cost to sales increased during the first half of 2020 as revenue contracted during the period.
Return on Assets (ROA) and Return on Equity (ROE) declined to 6.2 per cent and 4.8 per cent, respectively
Per
cen
t
5.5
11.5 11.0
-23.7
-40.8
-22.6
-38.1
-2.4 -14.2
10.5
5.0
-
-5.0
-10.0
-15.0
-20.0
2018 H1 2019 H1 2020 H1
143
119
24.1
18.8
17.0 17.5
10.6
7.7
18
118
90
36
2018 Q2 2019 Q2 2020 Q2
Actual Expectations
EBIT Margin Net Profit Margin
Per
cen
t
16
0
-16
-31
-472018 H1 2019 H1 2020 H1
EBIT Net Profit
Per
cen
t
30
25
20
15
10
5
0
2018
H1
2019
H1
2020
H1
2018
H1
2019
H1
2020
H1
78
Central Bank of Sri Lanka - Financial System Stability Review 2020
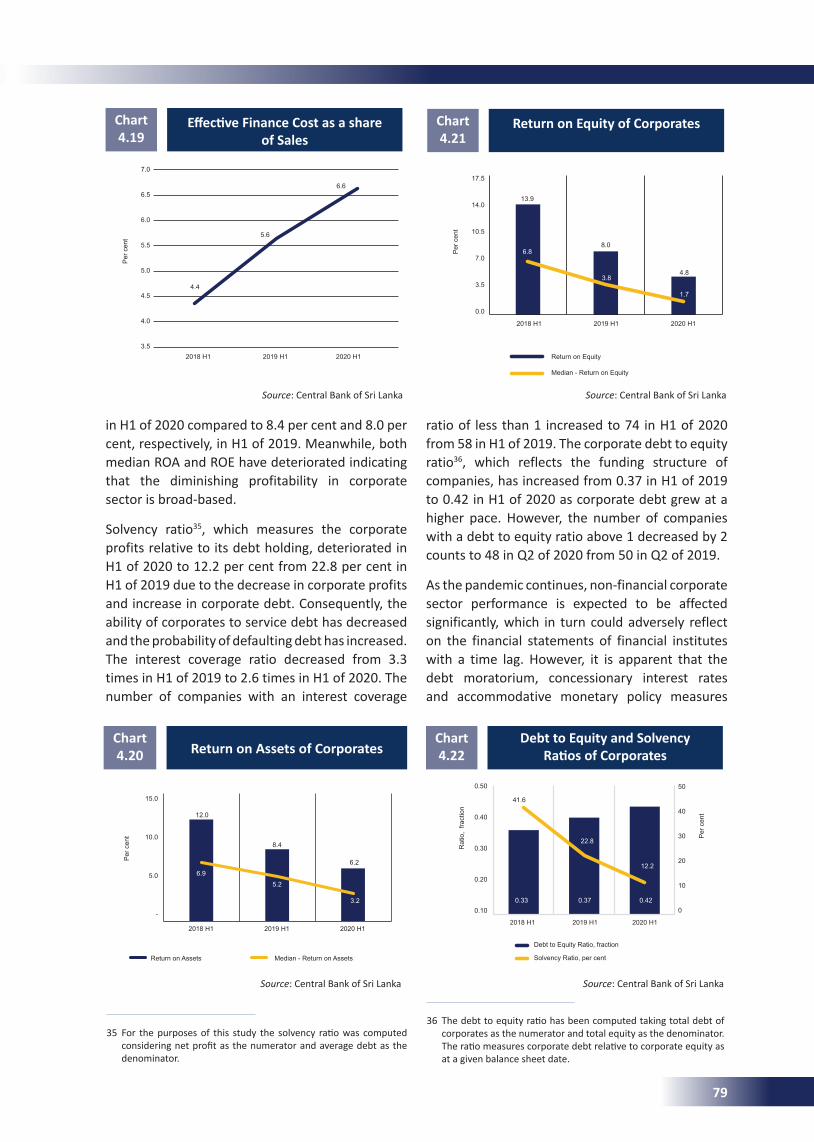
Return on Assets of CorporatesChart 4.20
EffectiveFinanceCostasashareof Sales
Chart 4.19
Return on Equity of CorporatesChart 4.21
36 The debt to equity ratio has been computed taking total debt of corporates as the numerator and total equity as the denominator. The ratio measures corporate debt relative to corporate equity as at a given balance sheet date.
Source: Central Bank of Sri Lanka Source: Central Bank of Sri Lanka
Source: Central Bank of Sri Lanka
in H1 of 2020 compared to 8.4 per cent and 8.0 per cent, respectively, in H1 of 2019. Meanwhile, both median ROA and ROE have deteriorated indicating that the diminishing profitability in corporate sector is broad-based.
Solvency ratio35, which measures the corporate profits relative to its debt holding, deteriorated in H1 of 2020 to 12.2 per cent from 22.8 per cent in H1 of 2019 due to the decrease in corporate profits and increase in corporate debt. Consequently, the ability of corporates to service debt has decreased and the probability of defaulting debt has increased. The interest coverage ratio decreased from 3.3 times in H1 of 2019 to 2.6 times in H1 of 2020. The number of companies with an interest coverage
ratio of less than 1 increased to 74 in H1 of 2020 from 58 in H1 of 2019. The corporate debt to equity ratio36, which reflects the funding structure of companies, has increased from 0.37 in H1 of 2019 to 0.42 in H1 of 2020 as corporate debt grew at a higher pace. However, the number of companies with a debt to equity ratio above 1 decreased by 2 counts to 48 in Q2 of 2020 from 50 in Q2 of 2019.
As the pandemic continues, non-financial corporate sector performance is expected to be affected significantly, which in turn could adversely reflect on the financial statements of financial institutes with a time lag. However, it is apparent that the debt moratorium, concessionary interest rates and accommodative monetary policy measures
35 For the purposes of this study the solvency ratio was computed considering net profit as the numerator and average debt as the denominator.
Debt to Equity and Solvency RatiosofCorporates
Chart 4.22
Source: Central Bank of Sri Lanka
Per
cen
t
Per
cen
t
7.0
6.5
6.0
5.5
5.0
4.5
4.0
3.52018 H1 2019 H1 2020 H1
2018 H1 2019 H1 2020 H1
4.4
5.6
6.6
13.9
8.0
4.8
6.8
3.8
1.7
Per
cen
t
15.0
10.0
5.0
-
2018 H1 2019 H1 2020 H1
Return on Assets Median - Return on Assets
12.0
41.6
0.33 0.37 0.42
22.8
12.2
8.4
6.26.9
5.2
3.2
17.5
14.0
10.5
7.0
3.5
0.0
Return on Equity
Median - Return on Equity
50
40
30
20
10
0
Rat
io,
fract
ion
Per
cen
t
0.50
0.40
0.30
0.20
0.10
2018 H1 2019 H1 2020 H1
Debt to Equity Ratio, fraction
Solvency Ratio, per cent
79
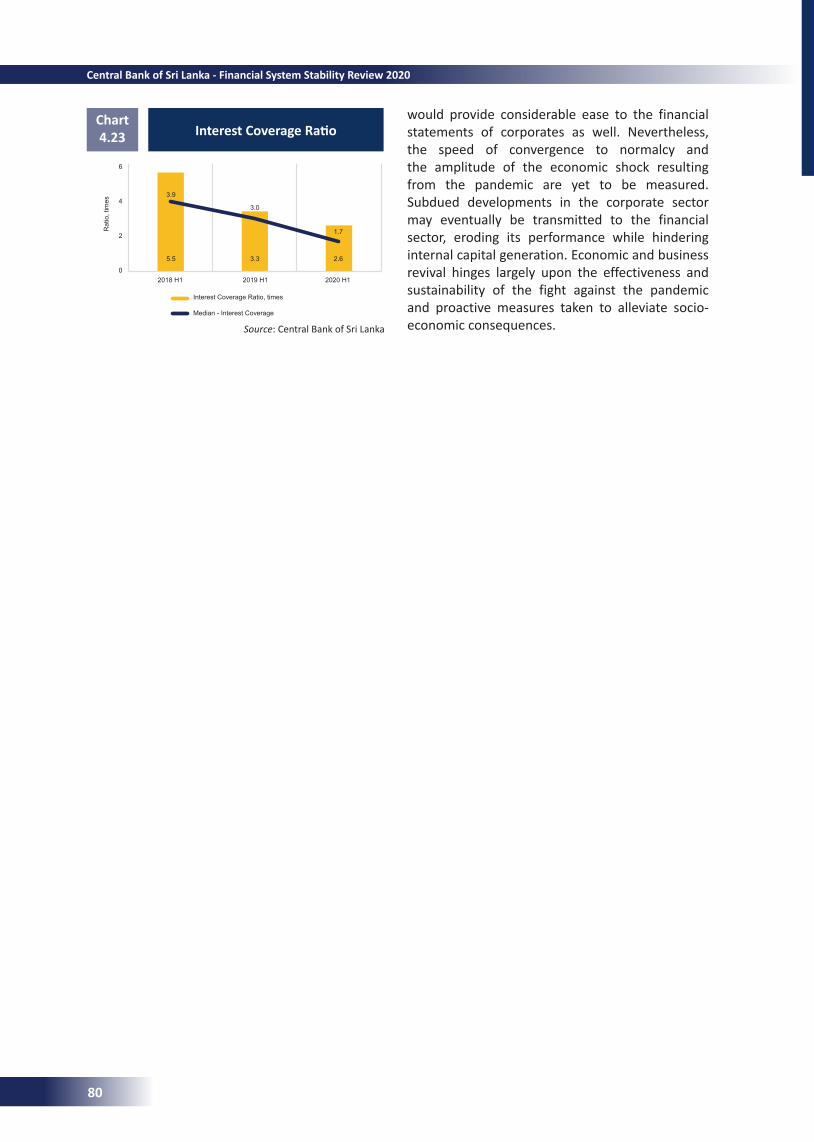
InterestCoverageRatioChart 4.23
Source: Central Bank of Sri Lanka
would provide considerable ease to the financial statements of corporates as well. Nevertheless, the speed of convergence to normalcy and the amplitude of the economic shock resulting from the pandemic are yet to be measured. Subdued developments in the corporate sector may eventually be transmitted to the financial sector, eroding its performance while hindering internal capital generation. Economic and business revival hinges largely upon the effectiveness and sustainability of the fight against the pandemic and proactive measures taken to alleviate socio-economic consequences.
Rat
io, t
imes
6
4
2
02018 H1 2019 H1 2020 H1
Interest Coverage Ratio, times
Median - Interest Coverage
5.5
3.9
3.3
3.0
2.6
1.7
80
Central Bank of Sri Lanka - Financial System Stability Review 2020
Chapter 5
Financial System Infrastructure
The financial infrastructure of the country, one of the critical components of financial stability, functioned without any major disruptions amidst the challenges that emerged from the spread of COVID-19, thus enabling the preservation of financial system stability. Significant increase in digital transactions in the country during the periods of lockdown imposed due to the spread of COVID-19 also demonstrated the growing importance of efficient and reliable financial system infrastructure. The Central Bank focused mainly on the national payment and settlement system and adopted several measures to strengthen the financial system infrastructure of the country during the nine months ending September 2020.
The systemically important payment and settlement systems (SIPS) operated without any disruptions and with a high degree of system availability despite the COVID-19 pandemic, as the Central Bank activated its Business Continuity Plan (BCP). Necessary guidelines for the development of effective BCPs and the establishment of disaster recovery sites were issued to Participating Institutions (PIs) of the national payment and settlement systems by the Central Bank, considering the risks associated with possible disruption to operations of these systems and their back up sites. With the view to promoting the usage of secure and efficient digital payment mechanisms by the general public, working towards establishing a digital economy, strengthening the regulatory and supervisory framework and minimizing risks associated with such payment mechanisms, the year 2020 was declared as “The Year of Digital Transactions”. In the backdrop of technological advances in the critical payment and settlement system infrastructure, the increased system and cyber security threats emerging in the recent past were a major area of concern for financial system stability. Therefore, a number of measures were taken to improve the system security and cyber security to make these critical systems more
5.1 Overviewresilient. In this regard, the National Payments Council of Sri Lanka focused on strengthening the mechanisms of monitoring and preventing fraud in line with international security standards, enhancing awareness of cyber threats and cyber security best practices, while coordinating between PIs and the Computer Emergency Response Team (CERT) which was established by the National Center for Cyber Security.
With the view of maintaining financial system stability by improving public confidence in the country’s financial system, appropriate regulatory measures and actions were taken by the Central Bank within the existing legal and institutional framework, addressing the emerging risks, including the risks arising from the COVID-19 pandemic. Regulatory measures and actions mainly targeted the financial system infrastructure related to the payment and settlement systems, foreign exchange controls and anti-money laundering & countering the financing of terrorism. In addition, the Central Bank continued to strengthen its legal and institutional framework by introducing reforms to assist the maintenance of financial system stability of the country. Steps are being taken to introduce reforms focused on a wide spectrum of financial services covering Licensed Banks (LBs), Licensed Finance Companies (LFCs) and Specialised Leasing Companies (SLCs), exchange control, payment and settlement systems and stock & securities. Initiating action to introducing a new Banking Act to improve the regulation and supervision of the banking sector, strengthening the regulatory framework applicable to Sri Lanka Deposit Insurance and Liquidity Support Scheme (SLDILSS) and commencing the establishment of a resolution framework for LBs and LFCs are among the key steps taken by the Central Bank during the reference period. Further, drafting the Credit Regulatory Authority Act to replace the existing Microfinance Act No. 6 of 2016 to further strengthen the regulation and supervision
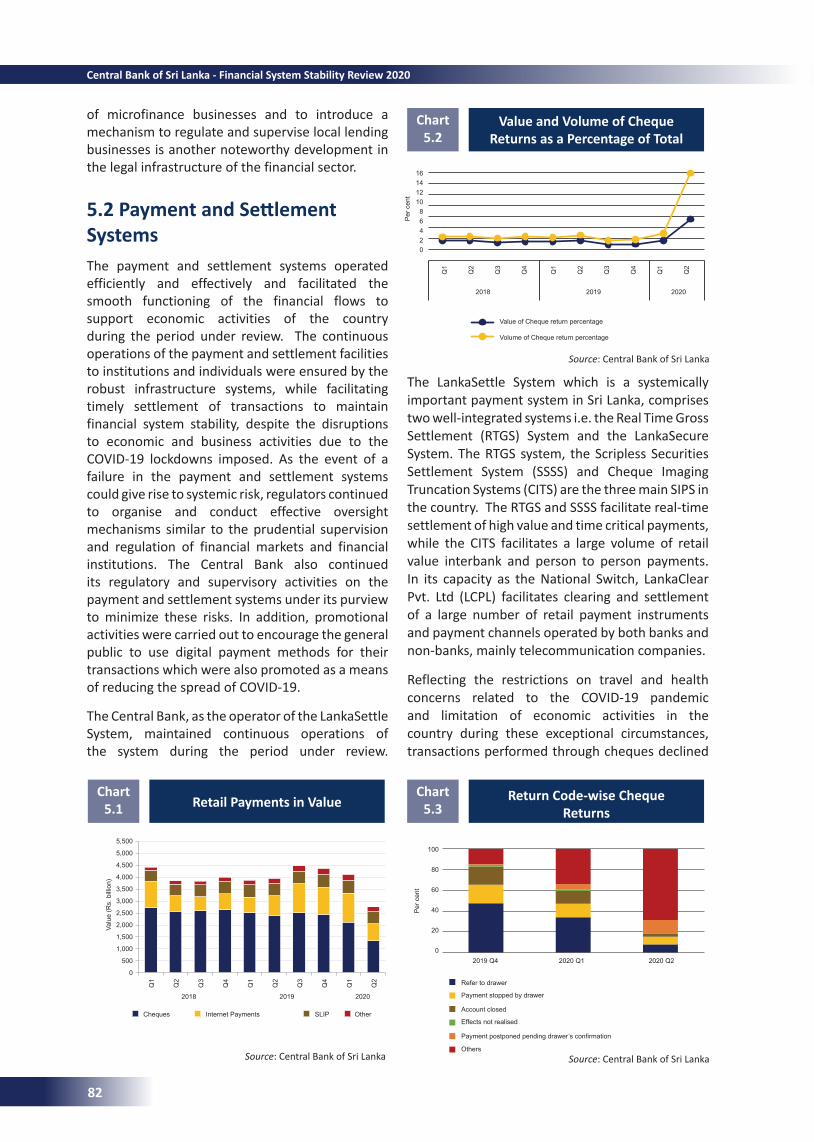
of microfinance businesses and to introduce a mechanism to regulate and supervise local lending businesses is another noteworthy development in the legal infrastructure of the financial sector.
5.2PaymentandSettlementSystemsThe payment and settlement systems operated efficiently and effectively and facilitated the smooth functioning of the financial flows to support economic activities of the country during the period under review. The continuous operations of the payment and settlement facilities to institutions and individuals were ensured by the robust infrastructure systems, while facilitating timely settlement of transactions to maintain financial system stability, despite the disruptions to economic and business activities due to the COVID-19 lockdowns imposed. As the event of a failure in the payment and settlement systems could give rise to systemic risk, regulators continued to organise and conduct effective oversight mechanisms similar to the prudential supervision and regulation of financial markets and financial institutions. The Central Bank also continued its regulatory and supervisory activities on the payment and settlement systems under its purview to minimize these risks. In addition, promotional activities were carried out to encourage the general public to use digital payment methods for their transactions which were also promoted as a means of reducing the spread of COVID-19.
The Central Bank, as the operator of the LankaSettle System, maintained continuous operations of the system during the period under review.
The LankaSettle System which is a systemically important payment system in Sri Lanka, comprises two well-integrated systems i.e. the Real Time Gross Settlement (RTGS) System and the LankaSecure System. The RTGS system, the Scripless Securities Settlement System (SSSS) and Cheque Imaging Truncation Systems (CITS) are the three main SIPS in the country. The RTGS and SSSS facilitate real-time settlement of high value and time critical payments, while the CITS facilitates a large volume of retail value interbank and person to person payments. In its capacity as the National Switch, LankaClear Pvt. Ltd (LCPL) facilitates clearing and settlement of a large number of retail payment instruments and payment channels operated by both banks and non-banks, mainly telecommunication companies.
Reflecting the restrictions on travel and health concerns related to the COVID-19 pandemic and limitation of economic activities in the country during these exceptional circumstances, transactions performed through cheques declined
Value and Volume of Cheque Returns as a Percentage of Total
Chart 5.2
Retail Payments in Value Chart
5.1
Source: Central Bank of Sri Lanka
Source: Central Bank of Sri Lanka
Return Code-wise Cheque Returns
Chart 5.3
Source: Central Bank of Sri Lanka
Valu
e (R
s. b
illio
n)
5,500
5,000
4,500
4,000
3,500
3,000
2,500
2,000
1,500
1,000
500
0
Q1
Q2
Q3
Q4
Q1
Q2
Q3
Q4
Q1
Q2
Cheques Internet Payments SLIP Other
2018
2019 Q4 2020 Q1 2020 Q2
2019 2020
1614121086420
Q1
Q2
Q3
Q4
Q1
Q2
Q3
Q4
Q1
Q2
Value of Cheque return percentage Volume of Cheque return percentage
202020192018
Per
cen
t
100
80
60
40
20
0
Refer to drawer
Account closed
Payment stopped by drawer
Effects not realised
Payment postponed pending drawer’s confirmation
Others
Per
cen
t
82
Central Bank of Sri Lanka - Financial System Stability Review 2020
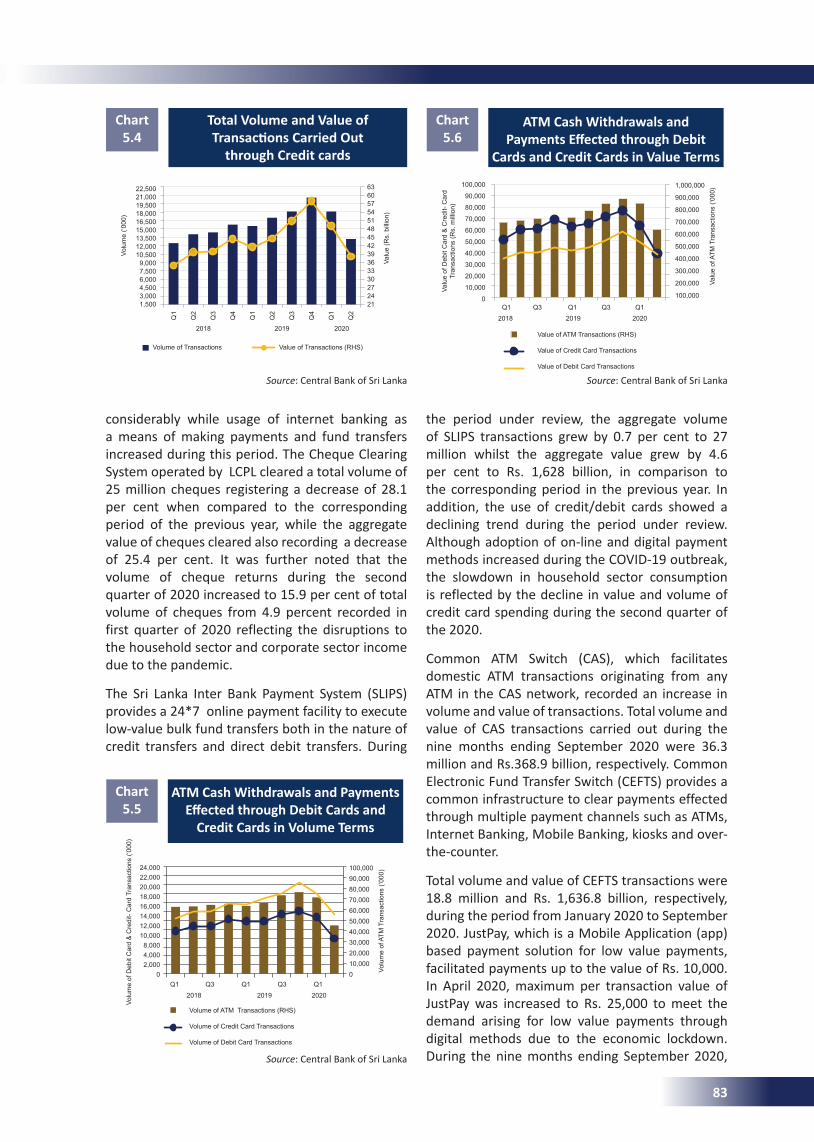
Total Volume and Value of TransactionsCarriedOut
through Credit cards
Chart 5.4
ATM Cash Withdrawals and Payments EffectedthroughDebitCardsand
Credit Cards in Volume Terms
Chart 5.5
ATM Cash Withdrawals and PaymentsEffectedthroughDebit
Cards and Credit Cards in Value Terms
Chart 5.6
Source: Central Bank of Sri Lanka Source: Central Bank of Sri Lanka
Source: Central Bank of Sri Lanka
considerably while usage of internet banking as a means of making payments and fund transfers increased during this period. The Cheque Clearing System operated by LCPL cleared a total volume of 25 million cheques registering a decrease of 28.1 per cent when compared to the corresponding period of the previous year, while the aggregate value of cheques cleared also recording a decrease of 25.4 per cent. It was further noted that the volume of cheque returns during the second quarter of 2020 increased to 15.9 per cent of total volume of cheques from 4.9 percent recorded in first quarter of 2020 reflecting the disruptions to the household sector and corporate sector income due to the pandemic.
The Sri Lanka Inter Bank Payment System (SLIPS) provides a 24*7 online payment facility to execute low-value bulk fund transfers both in the nature of credit transfers and direct debit transfers. During
the period under review, the aggregate volume of SLIPS transactions grew by 0.7 per cent to 27 million whilst the aggregate value grew by 4.6 per cent to Rs. 1,628 billion, in comparison to the corresponding period in the previous year. In addition, the use of credit/debit cards showed a declining trend during the period under review. Although adoption of on-line and digital payment methods increased during the COVID-19 outbreak, the slowdown in household sector consumption is reflected by the decline in value and volume of credit card spending during the second quarter of the 2020.
Common ATM Switch (CAS), which facilitates domestic ATM transactions originating from any ATM in the CAS network, recorded an increase in volume and value of transactions. Total volume and value of CAS transactions carried out during the nine months ending September 2020 were 36.3 million and Rs.368.9 billion, respectively. Common Electronic Fund Transfer Switch (CEFTS) provides a common infrastructure to clear payments effected through multiple payment channels such as ATMs, Internet Banking, Mobile Banking, kiosks and over-the-counter.
Total volume and value of CEFTS transactions were 18.8 million and Rs. 1,636.8 billion, respectively, during the period from January 2020 to September 2020. JustPay, which is a Mobile Application (app) based payment solution for low value payments, facilitated payments up to the value of Rs. 10,000. In April 2020, maximum per transaction value of JustPay was increased to Rs. 25,000 to meet the demand arising for low value payments through digital methods due to the economic lockdown. During the nine months ending September 2020,
Volu
me
(‘000
)
Valu
e of
Deb
it C
ard
& C
redi
t- C
ard
Tran
sact
ions
(Rs.
mill
ion)
Valu
e of
ATM
Tra
nsac
tions
(‘00
0)
Valu
e (R
s. b
illio
n)
22,50021,00019,50018,00016,50015,00013,50012,00010,5009,0007,5006,0004,5003,0001,500
636057545148454239363330272421
Q1
Q2
Q3
Q4
Q1
Q2
Q3
Q4
Q1
Q2
Volume of Transactions Value of Transactions (RHS)
2018 2019 2020
Volu
me
of D
ebit
Car
d &
Cre
dit-
Car
d Tr
ansa
ctio
ns (‘
000)
Volu
me
of A
TM T
rans
actio
ns (‘
000)
24,00022,00020,00018,00016,00014,00012,00010,0008,0004,0002,000
0
100,00090,00080,00070,00060,00050,00040,00030,00020,00010,0000
2018 2019 2020
Volume of ATM Transactions (RHS)
Volume of Credit Card Transactions
Volume of Debit Card Transactions
Q1 Q3 Q1 Q3 Q1
100,000
90,000
80,000
70,000
60,000
50,000
40,000
30,000
20,000
10,000
0
1,000,000
900,000
800,000
700,000
600,000
500,000
400,000
300,000
200,000
100,000
Value of ATM Transactions (RHS)
Value of Credit Card Transactions
Value of Debit Card Transactions
2018 2019 2020Q1 Q3 Q1 Q3 Q1
83
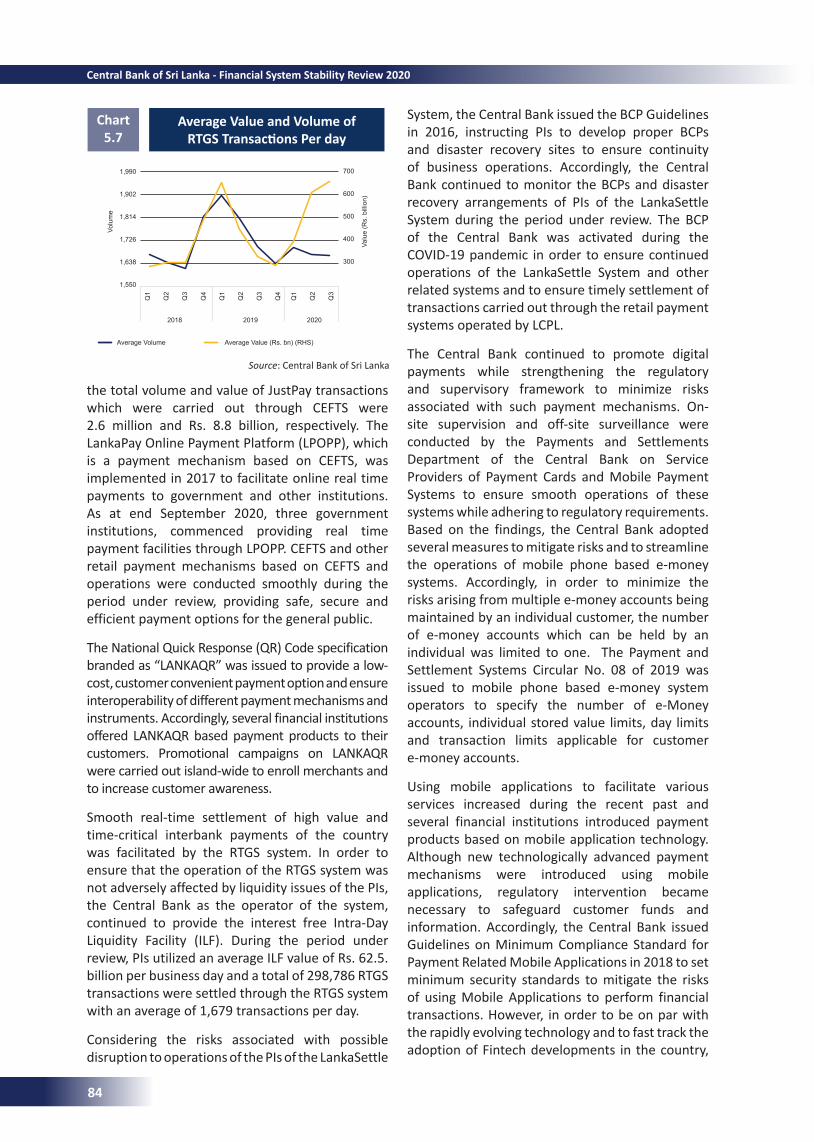
Average Volume Average Value (Rs. bn) (RHS)
Average Value and Volume of RTGSTransactionsPerday
Chart 5.7
Source: Central Bank of Sri Lanka
the total volume and value of JustPay transactions which were carried out through CEFTS were 2.6 million and Rs. 8.8 billion, respectively. The LankaPay Online Payment Platform (LPOPP), which is a payment mechanism based on CEFTS, was implemented in 2017 to facilitate online real time payments to government and other institutions. As at end September 2020, three government institutions, commenced providing real time payment facilities through LPOPP. CEFTS and other retail payment mechanisms based on CEFTS and operations were conducted smoothly during the period under review, providing safe, secure and efficient payment options for the general public.
The National Quick Response (QR) Code specification branded as “LANKAQR” was issued to provide a low-cost, customer convenient payment option and ensure interoperability of different payment mechanisms and instruments. Accordingly, several financial institutions offered LANKAQR based payment products to their customers. Promotional campaigns on LANKAQR were carried out island-wide to enroll merchants and to increase customer awareness.
Smooth real-time settlement of high value and time-critical interbank payments of the country was facilitated by the RTGS system. In order to ensure that the operation of the RTGS system was not adversely affected by liquidity issues of the PIs, the Central Bank as the operator of the system, continued to provide the interest free Intra-Day Liquidity Facility (ILF). During the period under review, PIs utilized an average ILF value of Rs. 62.5. billion per business day and a total of 298,786 RTGS transactions were settled through the RTGS system with an average of 1,679 transactions per day.
Considering the risks associated with possible disruption to operations of the PIs of the LankaSettle
System, the Central Bank issued the BCP Guidelines in 2016, instructing PIs to develop proper BCPs and disaster recovery sites to ensure continuity of business operations. Accordingly, the Central Bank continued to monitor the BCPs and disaster recovery arrangements of PIs of the LankaSettle System during the period under review. The BCP of the Central Bank was activated during the COVID-19 pandemic in order to ensure continued operations of the LankaSettle System and other related systems and to ensure timely settlement of transactions carried out through the retail payment systems operated by LCPL.
The Central Bank continued to promote digital payments while strengthening the regulatory and supervisory framework to minimize risks associated with such payment mechanisms. On-site supervision and off-site surveillance were conducted by the Payments and Settlements Department of the Central Bank on Service Providers of Payment Cards and Mobile Payment Systems to ensure smooth operations of these systems while adhering to regulatory requirements. Based on the findings, the Central Bank adopted several measures to mitigate risks and to streamline the operations of mobile phone based e-money systems. Accordingly, in order to minimize the risks arising from multiple e-money accounts being maintained by an individual customer, the number of e-money accounts which can be held by an individual was limited to one. The Payment and Settlement Systems Circular No. 08 of 2019 was issued to mobile phone based e-money system operators to specify the number of e-Money accounts, individual stored value limits, day limits and transaction limits applicable for customer e-money accounts.
Using mobile applications to facilitate various services increased during the recent past and several financial institutions introduced payment products based on mobile application technology. Although new technologically advanced payment mechanisms were introduced using mobile applications, regulatory intervention became necessary to safeguard customer funds and information. Accordingly, the Central Bank issued Guidelines on Minimum Compliance Standard for Payment Related Mobile Applications in 2018 to set minimum security standards to mitigate the risks of using Mobile Applications to perform financial transactions. However, in order to be on par with the rapidly evolving technology and to fast track the adoption of Fintech developments in the country,
Volu
me
Valu
e (R
s. b
illio
n)
1,990
1,902
1,814
1,726
1,638
1,550
700
600
500
400
300
Q1
Q2
Q3
Q4
Q1
Q2
Q3
Q4
Q1
Q2
Q3
2018 2019 2020
84
Central Bank of Sri Lanka - Financial System Stability Review 2020
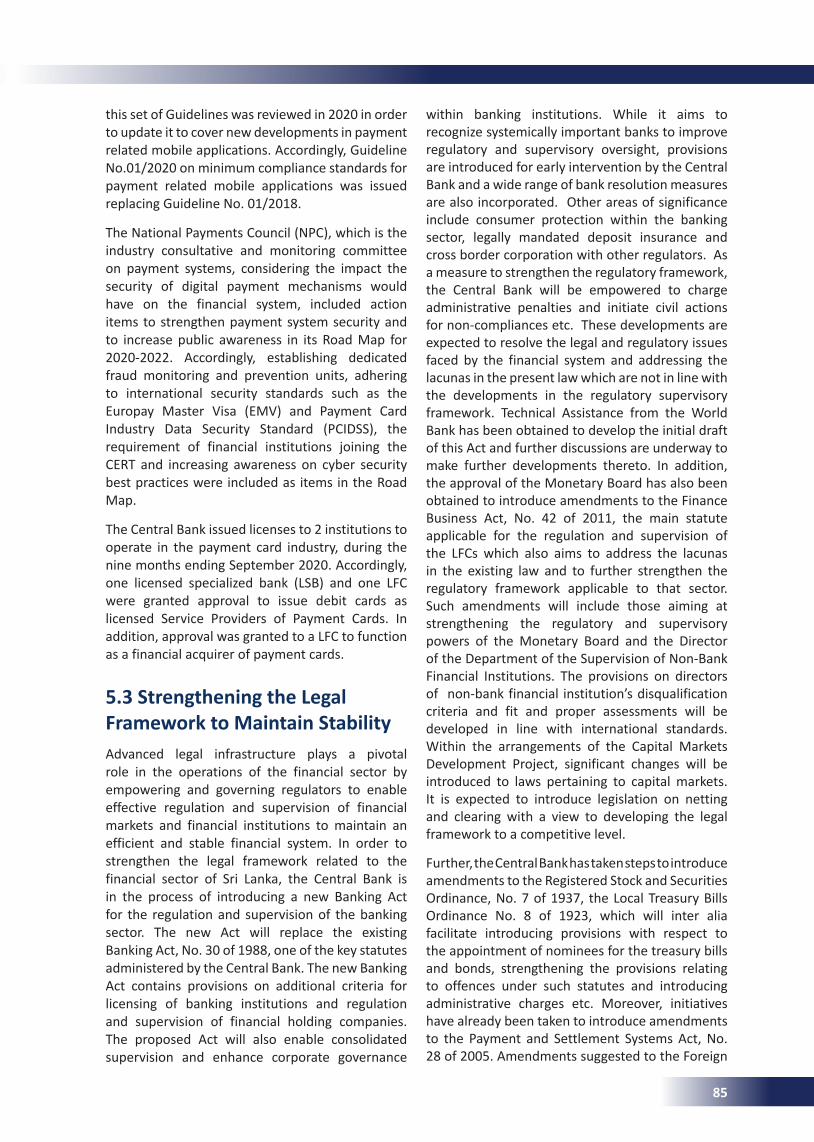
this set of Guidelines was reviewed in 2020 in order to update it to cover new developments in payment related mobile applications. Accordingly, Guideline No.01/2020 on minimum compliance standards for payment related mobile applications was issued replacing Guideline No. 01/2018.
The National Payments Council (NPC), which is the industry consultative and monitoring committee on payment systems, considering the impact the security of digital payment mechanisms would have on the financial system, included action items to strengthen payment system security and to increase public awareness in its Road Map for 2020-2022. Accordingly, establishing dedicated fraud monitoring and prevention units, adhering to international security standards such as the Europay Master Visa (EMV) and Payment Card Industry Data Security Standard (PCIDSS), the requirement of financial institutions joining the CERT and increasing awareness on cyber security best practices were included as items in the Road Map.
The Central Bank issued licenses to 2 institutions to operate in the payment card industry, during the nine months ending September 2020. Accordingly, one licensed specialized bank (LSB) and one LFC were granted approval to issue debit cards as licensed Service Providers of Payment Cards. In addition, approval was granted to a LFC to function as a financial acquirer of payment cards.
5.3 Strengthening the Legal Framework to Maintain StabilityAdvanced legal infrastructure plays a pivotal role in the operations of the financial sector by empowering and governing regulators to enable effective regulation and supervision of financial markets and financial institutions to maintain an efficient and stable financial system. In order to strengthen the legal framework related to the financial sector of Sri Lanka, the Central Bank is in the process of introducing a new Banking Act for the regulation and supervision of the banking sector. The new Act will replace the existing Banking Act, No. 30 of 1988, one of the key statutes administered by the Central Bank. The new Banking Act contains provisions on additional criteria for licensing of banking institutions and regulation and supervision of financial holding companies. The proposed Act will also enable consolidated supervision and enhance corporate governance
within banking institutions. While it aims to recognize systemically important banks to improve regulatory and supervisory oversight, provisions are introduced for early intervention by the Central Bank and a wide range of bank resolution measures are also incorporated. Other areas of significance include consumer protection within the banking sector, legally mandated deposit insurance and cross border corporation with other regulators. As a measure to strengthen the regulatory framework, the Central Bank will be empowered to charge administrative penalties and initiate civil actions for non-compliances etc. These developments are expected to resolve the legal and regulatory issues faced by the financial system and addressing the lacunas in the present law which are not in line with the developments in the regulatory supervisory framework. Technical Assistance from the World Bank has been obtained to develop the initial draft of this Act and further discussions are underway to make further developments thereto. In addition, the approval of the Monetary Board has also been obtained to introduce amendments to the Finance Business Act, No. 42 of 2011, the main statute applicable for the regulation and supervision of the LFCs which also aims to address the lacunas in the existing law and to further strengthen the regulatory framework applicable to that sector. Such amendments will include those aiming at strengthening the regulatory and supervisory powers of the Monetary Board and the Director of the Department of the Supervision of Non-Bank Financial Institutions. The provisions on directors of non-bank financial institution’s disqualification criteria and fit and proper assessments will be developed in line with international standards. Within the arrangements of the Capital Markets Development Project, significant changes will be introduced to laws pertaining to capital markets. It is expected to introduce legislation on netting and clearing with a view to developing the legal framework to a competitive level.
Further, the Central Bank has taken steps to introduce amendments to the Registered Stock and Securities Ordinance, No. 7 of 1937, the Local Treasury Bills Ordinance No. 8 of 1923, which will inter alia facilitate introducing provisions with respect to the appointment of nominees for the treasury bills and bonds, strengthening the provisions relating to offences under such statutes and introducing administrative charges etc. Moreover, initiatives have already been taken to introduce amendments to the Payment and Settlement Systems Act, No. 28 of 2005. Amendments suggested to the Foreign
85
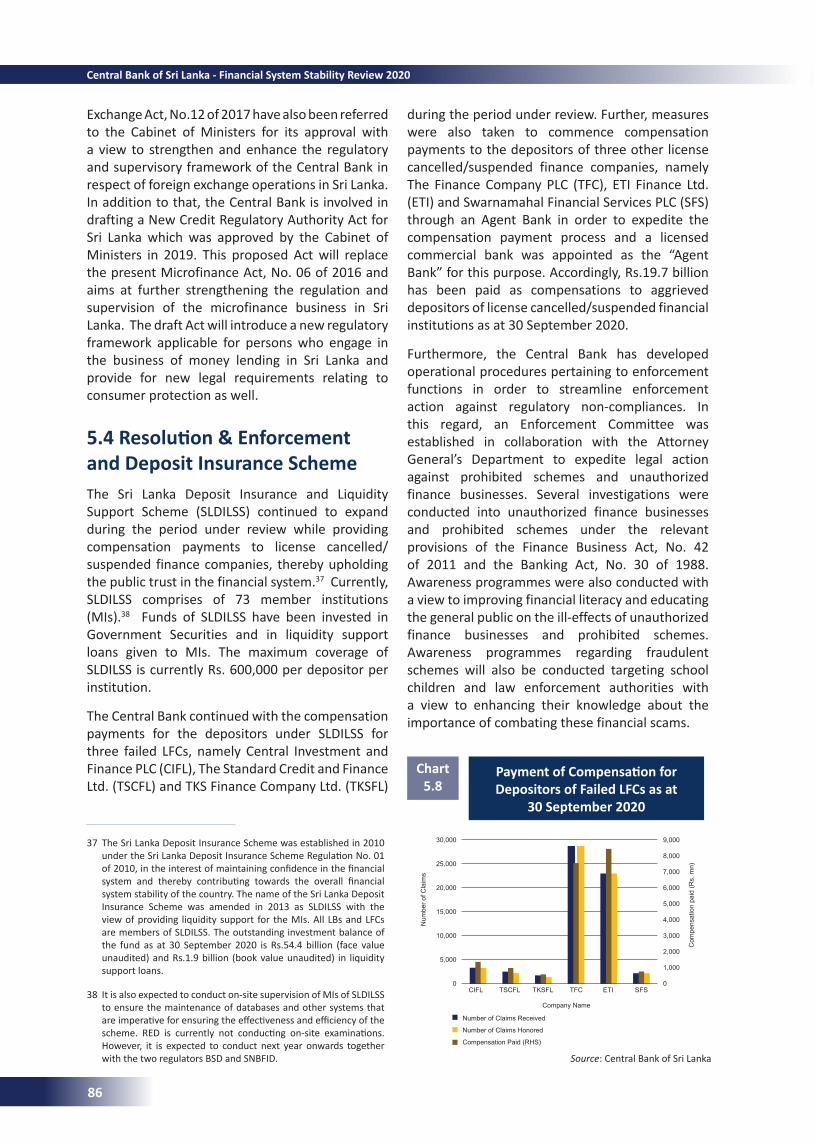
Number of Claims Received
Number of Claims Honored
Compensation Paid (RHS)
PaymentofCompensationforDepositors of Failed LFCs as at
30 September 2020
Chart 5.8
37 The Sri Lanka Deposit Insurance Scheme was established in 2010 under the Sri Lanka Deposit Insurance Scheme Regulation No. 01 of 2010, in the interest of maintaining confidence in the financial system and thereby contributing towards the overall financial system stability of the country. The name of the Sri Lanka Deposit Insurance Scheme was amended in 2013 as SLDILSS with the view of providing liquidity support for the MIs. All LBs and LFCs are members of SLDILSS. The outstanding investment balance of the fund as at 30 September 2020 is Rs.54.4 billion (face value unaudited) and Rs.1.9 billion (book value unaudited) in liquidity support loans.
38 It is also expected to conduct on-site supervision of MIs of SLDILSS to ensure the maintenance of databases and other systems that are imperative for ensuring the effectiveness and efficiency of the scheme. RED is currently not conducting on-site examinations. However, it is expected to conduct next year onwards together with the two regulators BSD and SNBFID.
Exchange Act, No.12 of 2017 have also been referred to the Cabinet of Ministers for its approval with a view to strengthen and enhance the regulatory and supervisory framework of the Central Bank in respect of foreign exchange operations in Sri Lanka. In addition to that, the Central Bank is involved in drafting a New Credit Regulatory Authority Act for Sri Lanka which was approved by the Cabinet of Ministers in 2019. This proposed Act will replace the present Microfinance Act, No. 06 of 2016 and aims at further strengthening the regulation and supervision of the microfinance business in Sri Lanka. The draft Act will introduce a new regulatory framework applicable for persons who engage in the business of money lending in Sri Lanka and provide for new legal requirements relating to consumer protection as well.
5.4Resolution&Enforcementand Deposit Insurance SchemeThe Sri Lanka Deposit Insurance and Liquidity Support Scheme (SLDILSS) continued to expand during the period under review while providing compensation payments to license cancelled/suspended finance companies, thereby upholding the public trust in the financial system.37 Currently, SLDILSS comprises of 73 member institutions (MIs).38 Funds of SLDILSS have been invested in Government Securities and in liquidity support loans given to MIs. The maximum coverage of SLDILSS is currently Rs. 600,000 per depositor per institution.
The Central Bank continued with the compensation payments for the depositors under SLDILSS for three failed LFCs, namely Central Investment and Finance PLC (CIFL), The Standard Credit and Finance Ltd. (TSCFL) and TKS Finance Company Ltd. (TKSFL)
during the period under review. Further, measures were also taken to commence compensation payments to the depositors of three other license cancelled/suspended finance companies, namely The Finance Company PLC (TFC), ETI Finance Ltd. (ETI) and Swarnamahal Financial Services PLC (SFS) through an Agent Bank in order to expedite the compensation payment process and a licensed commercial bank was appointed as the “Agent Bank” for this purpose. Accordingly, Rs.19.7 billion has been paid as compensations to aggrieved depositors of license cancelled/suspended financial institutions as at 30 September 2020.
Furthermore, the Central Bank has developed operational procedures pertaining to enforcement functions in order to streamline enforcement action against regulatory non-compliances. In this regard, an Enforcement Committee was established in collaboration with the Attorney General’s Department to expedite legal action against prohibited schemes and unauthorized finance businesses. Several investigations were conducted into unauthorized finance businesses and prohibited schemes under the relevant provisions of the Finance Business Act, No. 42 of 2011 and the Banking Act, No. 30 of 1988. Awareness programmes were also conducted with a view to improving financial literacy and educating the general public on the ill-effects of unauthorized finance businesses and prohibited schemes. Awareness programmes regarding fraudulent schemes will also be conducted targeting school children and law enforcement authorities with a view to enhancing their knowledge about the importance of combating these financial scams.
Source: Central Bank of Sri Lanka
Num
ber o
f Cla
ims
Com
pens
atio
n pa
id (R
s. m
n)
30,000
25,000
20,000
15,000
10,000
5,000
0
9,000
8,000
7,000
6,000
5,000
4,000
3,000
2,000
1,000
0CIFL TSCFL TKSFL TFC ETI SFS
Company Name
86
Central Bank of Sri Lanka - Financial System Stability Review 2020
39 The FATF is an independent inter-governmental body that develops and promotes policies to protect the global financial system against money laundering, terrorist financing and the financing of proliferation of weapons of mass destruction
40 The de-listing of Sri Lanka by the European Commission from its List of High Risk Third Countries that have strategic deficiencies in their AML/CFT regimes published on 7 May 2020 is one such achievement. Sri Lanka was listed as a High Risk Third Country by the EU in February 2018, subsequent to Sri Lanka being identified by the FATF as a jurisdiction with strategic AML/CFT deficiencies in its Compliance Document a.k.a “the Grey List” in October 2017. Upon the listing, a time bound Action Plan to address the strategic deficiencies identified was assigned to Sri Lanka. Since the listing by the FATF, the FIU together with other stakeholders, took a series of effective and tangible steps to implement the FATF Action Plan well within the given time frame, and accordingly, the FATF de-listed Sri Lanka from the Grey List at its plenary held during 13-18 October 2019 in Paris. Subsequent to the de-listing by the FATF, the EU de-listed Sri Lanka from its list of High Risk Third Countries.
A comprehensive Resolution Framework for the LBs and LFCs under the existing legal framework is being developed with the technical assistance of the US Treasury. In the proposed resolution framework, the Resolution & Enforcement Department will function as the Resolution Authority of the Central Bank in accordance with the policy framework that will be promulgated under the proposed Banking Act. Accordingly, it is envisaged to strengthen the regulatory framework applicable to SLDILSS in terms of the proposed Banking Act and international best practices.
5.5Anti-MoneyLaunderingandCountering the Financing of TerrorismMoney laundering and financing of terrorism pose a significant threat to financial system stability and economic development by diverting resources away from economically and socially productive uses. The COVID-19 pandemic has especially generated a range of financial flows through fiscal stimulus, international aid and other social assistance programmes providing new opportunities for criminals and terrorists to launder illicit proceeds. The Financial Action Task Force (FATF)39 has highlighted that threats of money laundering have increased due to the COVID-19 pandemic with the increased popularity of remote work through online systems, restrictions on in-person banking, urgent purchases of medical equipment to meet the overwhelming demand and increase in global online sales. Having recognized the emerging threats, the Financial Intelligence Unit (FIU) of the Central Bank continued to perform its core functions amid many challenges, during the year 2020. However, the de-listing of Sri Lanka by the FATF and European Commission from their lists of High Risk countries that have strategic deficiencies in their AML/CFT in 2019 and 2020 respectively will have a positive economic and financial impact on Sri Lanka, since the stability of the financial system depends heavily on perceived reputation of its integrity.40
FIU issued several circulars and guidelines focusing on identification of Politically Exposed Persons, AML/CFT compliance obligations for Accountants
and Trusts or Company Service Providers, scenario based LankaFIN reporting for LFCs, Insurance Companies and Stock Brokers, etc. and to all the Financial Institutions advising them to increase vigilance/due diligence and to take appropriate measures to protect the financial system from possible money laundering/ terrorist financing risks arising during the global COVID-19 pandemic.
Conducting awareness among investigating officers on money laundering (ML) investigations, continuous coordination with investigators, prosecutors and financial institutions, briefing financial institutions on their responsibilities in ensuring institutional compliance and supporting Law Enforcement Agencies’ (LEA) efforts in combating ML related to illicit drug trade, etc. were also carried out during this period.
The FIU is in the process of introducing amendments to three main legislative enactments (the Convention on the Suppression of Terrorist Financing Act, No. 25 of 2005, the Prevention of Money Laundering Act, No. 5 of 2006 and the Financial Transactions Reporting Act, No. 6 of 2006) that support the AML/CFT framework of Sri Lanka. The approval of the Cabinet of Ministers has been sought for the amendments, which are mainly aimed at rectifying the deficiencies identified at the Mutual Evaluation carried out in 2014/15 by the Asia Pacific Group on Money Laundering, with a view to enhancing the country’s compliance with the changes to the FATF recommendations and deficiencies identified in the implementation of these legislations over the period.
5.6 Surveillance on Foreign ExchangeTransactionsSeveral measures were introduced by way of Regulations, Orders and Directions issued under the provisions of the Foreign Exchange Act, No.
87
41 Proposals have also been forwarded to the Hon. Minister of Finance seeking permission to extend the period for which new SDAs can be opened. All these measures are expected to lessen the emerging risk of remitting out of maturity proceeds of such SDAs.
42 Banking density is defined as the number of bank branchers per 100,000 population.
12 of 2017 (FEA), in order to ease the pressure on the exchange rate and to improve the foreign reserve position of the country during the period concerned.
Accordingly, in order to attract foreign exchange inflows to the country from both residents and non-residents, Special Deposit Accounts (SDAs) with an additional interest payment by the Government were introduced during early April 2020. Further, the Order issued under Section 22 of the FEA which suspended outward remittances in respect of certain capital transactions is valid only for a six months period (i.e. to be lapsed by 01 January 2021). However, suspensions under this Order, if not extended, may cause unfavorable effects on the exchange rate stability with possible subsequent outward capital transactions. However, if the economic conditions warrant continuation of these restrictions, then there will be concern to revisit the existing general permission granted under the FEA for residents to make outward investments and claims on migration allowance by emigrants.
Moreover, considering the difficulties faced by foreign currency borrowers with the reduced level of cash flows/earnings in foreign exchange due to the impact of the COVID-19 pandemic, Authorized Dealers (ADs) were permitted to recover existing foreign currency loans granted to foreign exchange earners and to Sri Lankans working abroad (other than emigrants), in Sri Lanka Rupees, as a last resort.
In line with several other measures introduced by the Central Bank to ease the pressure on the exchange rate and to prevent financial market panic due to the COVID-19 pandemic, Directions were issued to ADs under FEA limiting release of foreign exchange in respect of certain current transactions. As a further measure to preserve the foreign currency reserve position of the country, an Order was issued under Section 22 of the FEA, restricting outward remittances of certain capital transactions for a three months period. However, considering the possible negative impact to the Sri Lankan economy due to the COVID-19 pandemic, this Order was subsequently extended for a period of six months. In order to attract inward remittances/inflows to the country and thereby to support national effort to manage the challenges faced due to the COVID-19 outbreak, regulations were issued introducing SDAs to be opened with fresh inward remittances until 02 October 2020 41. Later, sources of funding in foreign exchange for SDAs
were expanded with a view to encouraging more inward remittances/deposits to SDAs. Moreover, regulations were issued, permitting ADs to renew and continue SDAs beyond the designated date of maturity under the terms for normal deposits and to transfer maturity proceeds into Inward Investment Accounts (IIAs) or Personal Foreign Currency Accounts (PFCAs).
Instructions are being issued on a case by case basis to ADs, in respect of foreign currency loans granted to holders of Business Foreign Currency Accounts (BFCAs) and to Sri Lankans working abroad who maintain PFCAs (other than emigrants), to allow borrowers to repay such loans in Sri Lanka Rupees only for a short period (i.e. for 03 to 06 months of loans installments), thereby avoiding the lump sum conversions of large scale/long term foreign currency loans into Sri Lanka Rupee loans.
During October 2020, regulations were issued permitting the renewal and continuation of SDAs, beyond the designated date of maturity with interest rates offered by ADs for normal term deposits and to be freely convertible and repatriable outside Sri Lanka on the maturity of such term deposits. Further, maturity proceeds including the interest of SDAs were permitted to be credited to PFCAs and IIAs, provided SDA holders are eligible to open and maintain such accounts, also encouraging retention of such deposits within the country.
5.7 Financial InclusionFinancial inclusion is identified as a key determinant of household sector income, thereby influencing the financial stability and economic growth particularly in developing countries. Having identified the importance of financial inclusion, the Central Bank has taken efforts to improve the level of financial inclusion of the country during the past few decades. The banking density42 of the country, one of the key primary indicators of financial inclusion gradually increased with the outreach of bank branches, particularly during the post-conflict era. With an intention of further improving financial inclusion of the country, the Central Bank developed
88
Central Bank of Sri Lanka - Financial System Stability Review 2020
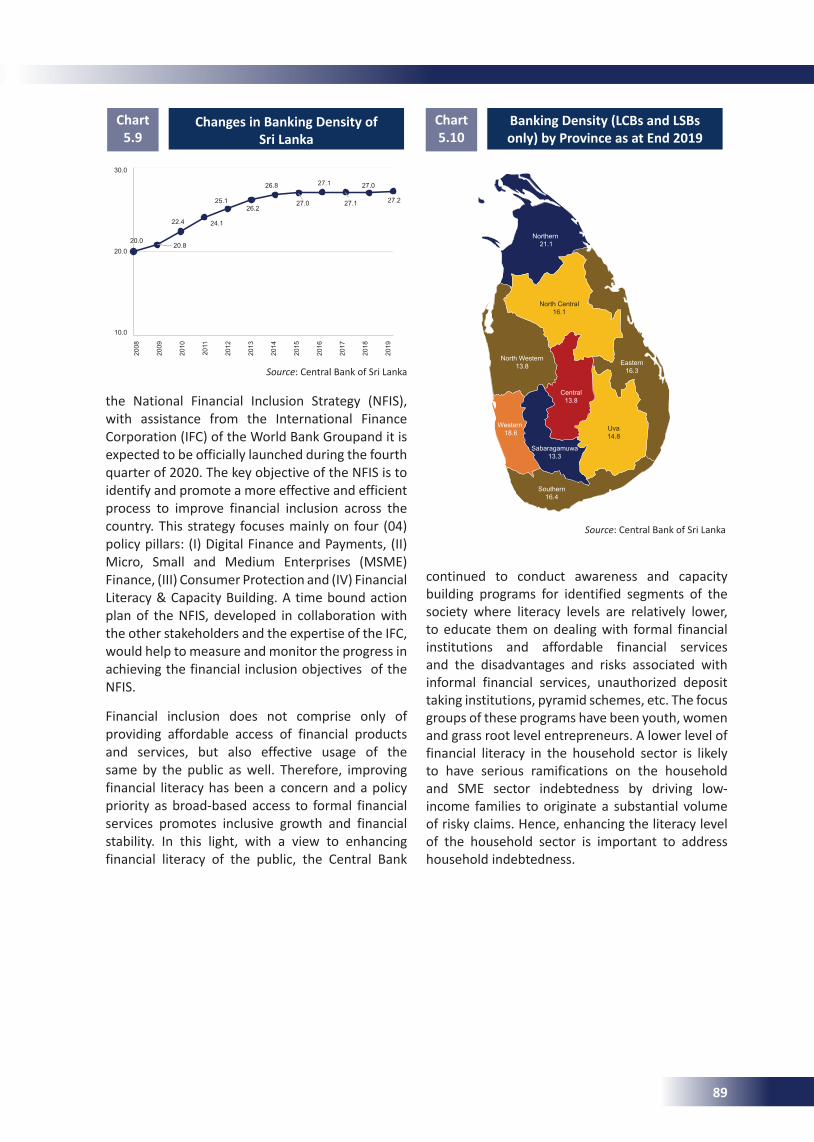
Banking Density (LCBs and LSBs only) by Province as at End 2019
Chart 5.10
Source: Central Bank of Sri Lanka
Northern 21.1
North Western 13.8
Central 13.8
Sabaragamuwa 13.3
Southern 16.4
North Central 16.1
Eastern 16.3
Uva 14.8
Western 18.6
the National Financial Inclusion Strategy (NFIS), with assistance from the International Finance Corporation (IFC) of the World Bank Groupand it is expected to be officially launched during the fourth quarter of 2020. The key objective of the NFIS is to identify and promote a more effective and efficient process to improve financial inclusion across the country. This strategy focuses mainly on four (04) policy pillars: (I) Digital Finance and Payments, (II) Micro, Small and Medium Enterprises (MSME) Finance, (III) Consumer Protection and (IV) Financial Literacy & Capacity Building. A time bound action plan of the NFIS, developed in collaboration with the other stakeholders and the expertise of the IFC, would help to measure and monitor the progress in achieving the financial inclusion objectives of the NFIS.
Financial inclusion does not comprise only of providing affordable access of financial products and services, but also effective usage of the same by the public as well. Therefore, improving financial literacy has been a concern and a policy priority as broad-based access to formal financial services promotes inclusive growth and financial stability. In this light, with a view to enhancing financial literacy of the public, the Central Bank
Changes in Banking Density of Sri Lanka
Chart 5.9
Source: Central Bank of Sri Lanka
continued to conduct awareness and capacity building programs for identified segments of the society where literacy levels are relatively lower, to educate them on dealing with formal financial institutions and affordable financial services and the disadvantages and risks associated with informal financial services, unauthorized deposit taking institutions, pyramid schemes, etc. The focus groups of these programs have been youth, women and grass root level entrepreneurs. A lower level of financial literacy in the household sector is likely to have serious ramifications on the household and SME sector indebtedness by driving low-income families to originate a substantial volume of risky claims. Hence, enhancing the literacy level of the household sector is important to address household indebtedness.
30.0
20.0
10.0
2008
2009
2010
2011
2012
2013
2014
2015
2016
2017
2018
2019
20.020.8
22.4 24.1
25.1
26.8
26.2 27.0
27.1
27.1
27.0
27.2
89
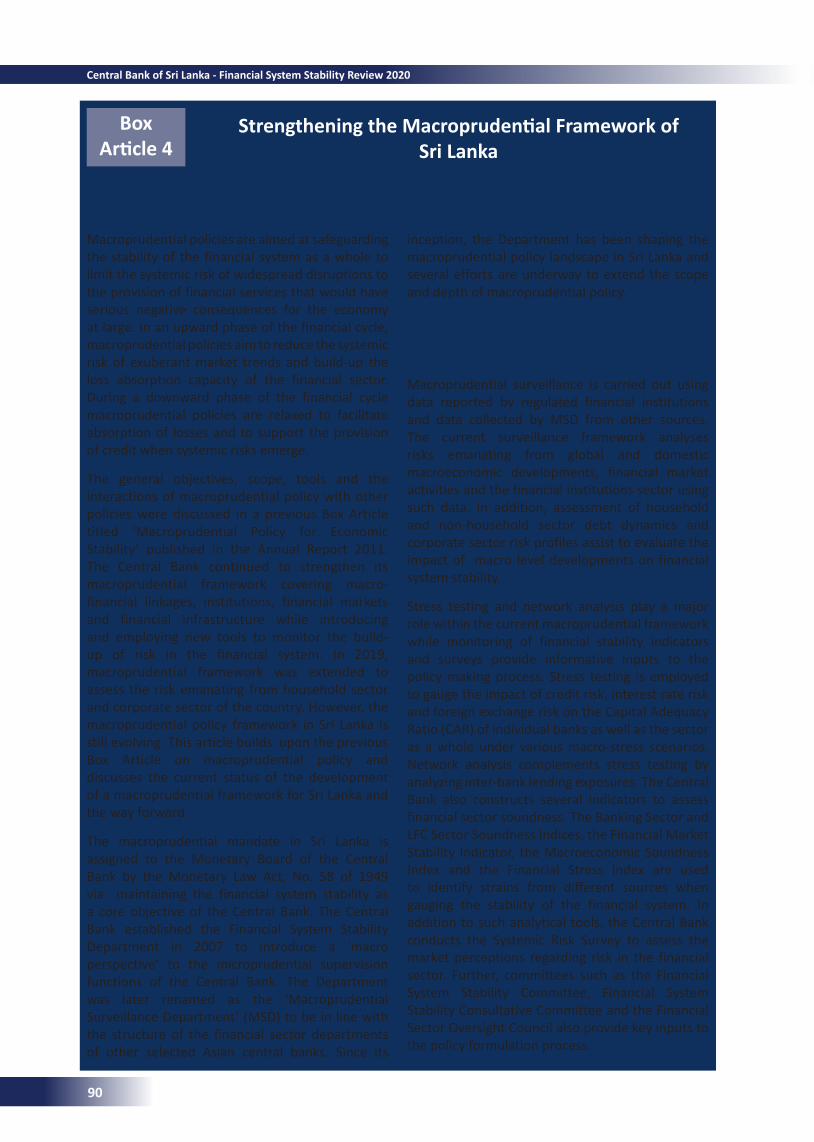
Box Article4
StrengtheningtheMacroprudentialFrameworkofSri Lanka
Macroprudential policies are aimed at safeguarding the stability of the financial system as a whole to limit the systemic risk of widespread disruptions to the provision of financial services that would have serious negative consequences for the economy at large. In an upward phase of the financial cycle, macroprudential policies aim to reduce the systemic risk of exuberant market trends and build-up the loss absorption capacity of the financial sector. During a downward phase of the financial cycle macroprudential policies are relaxed to facilitate absorption of losses and to support the provision of credit when systemic risks emerge.
The general objectives, scope, tools and the interactions of macroprudential policy with other policies were discussed in a previous Box Article titled ‘Macroprudential Policy for Economic Stability’ published in the Annual Report 2011. The Central Bank continued to strengthen its macroprudential framework covering macro-financial linkages, institutions, financial markets and financial infrastructure while introducing and employing new tools to monitor the build-up of risk in the financial system. In 2019, macroprudential framework was extended to assess the risk emanating from household sector and corporate sector of the country. However, the macroprudential policy framework in Sri Lanka is still evolving. This article builds upon the previous Box Article on macroprudential policy and discusses the current status of the development of a macroprudential framework for Sri Lanka and the way forward.
The macroprudential mandate in Sri Lanka is assigned to the Monetary Board of the Central Bank by the Monetary Law Act, No. 58 of 1949 via maintaining the financial system stability as a core objective of the Central Bank. The Central Bank established the Financial System Stability Department in 2007 to introduce a ‘macro perspective’ to the microprudential supervision functions of the Central Bank. The Department was later renamed as the ‘Macroprudential Surveillance Department’ (MSD) to be in line with the structure of the financial sector departments of other selected Asian central banks. Since its
inception, the Department has been shaping the macroprudential policy landscape in Sri Lanka and several efforts are underway to extend the scope and depth of macroprudential policy.
TheCurrentStatusofMacroprudentialSurveillance in Sri LankaMacroprudential surveillance is carried out using data reported by regulated financial institutions and data collected by MSD from other sources. The current surveillance framework analyses risks emanating from global and domestic macroeconomic developments, financial market activities and the financial institutions sector using such data. In addition, assessment of household and non-household sector debt dynamics and corporate sector risk profiles assist to evaluate the impact of macro level developments on financial system stability.
Stress testing and network analysis play a major role within the current macroprudential framework while monitoring of financial stability indicators and surveys provide informative inputs to the policy making process. Stress testing is employed to gauge the impact of credit risk, interest rate risk and foreign exchange risk on the Capital Adequacy Ratio (CAR) of individual banks as well as the sector as a whole under various macro-stress scenarios. Network analysis complements stress testing by analyzing inter-bank lending exposures. The Central Bank also constructs several indicators to assess financial sector soundness. The Banking Sector and LFC Sector Soundness Indices, the Financial Market Stability Indicator, the Macroeconomic Soundness Index and the Financial Stress Index are used to identify strains from different sources when gauging the stability of the financial system. In addition to such analytical tools, the Central Bank conducts the Systemic Risk Survey to assess the market perceptions regarding risk in the financial sector. Further, committees such as the Financial System Stability Committee, Financial System Stability Consultative Committee and the Financial Sector Oversight Council also provide key inputs to the policy formulation process.
90
Central Bank of Sri Lanka - Financial System Stability Review 2020
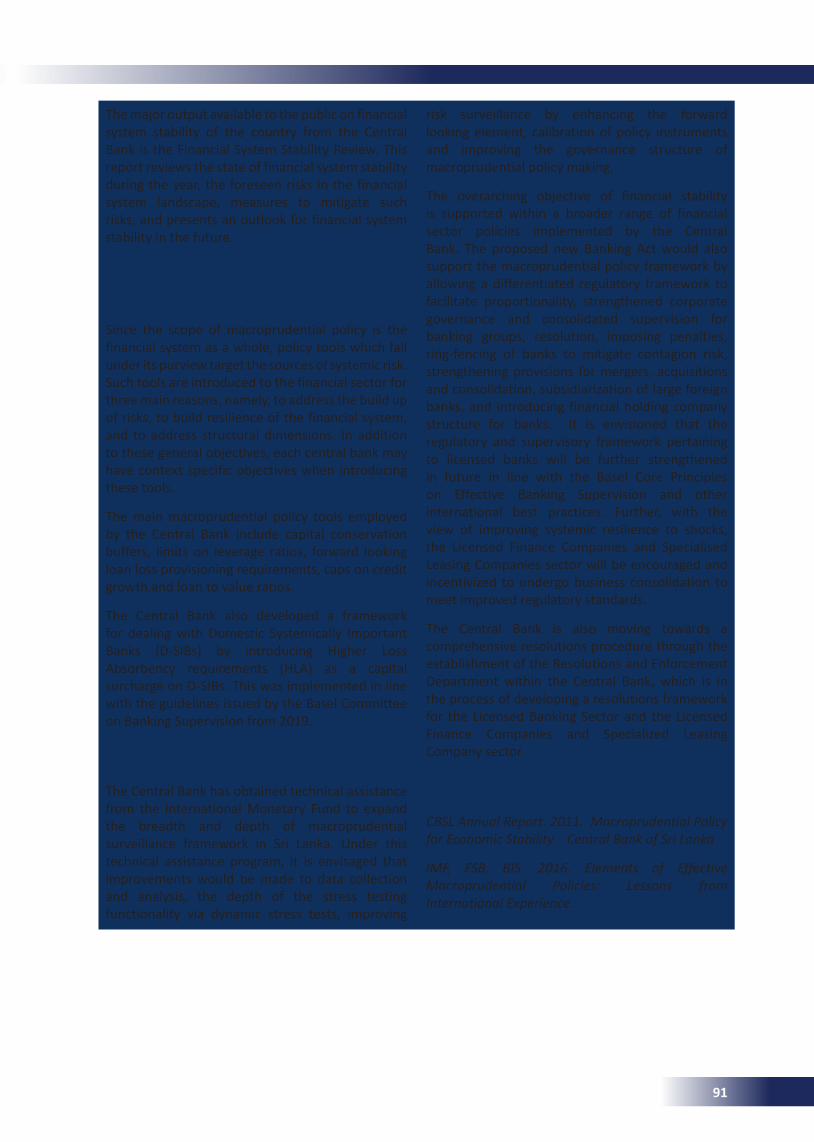
The major output available to the public on financial system stability of the country from the Central Bank is the Financial System Stability Review. This report reviews the state of financial system stability during the year, the foreseen risks in the financial system landscape, measures to mitigate such risks, and presents an outlook for financial system stability in the future.
SignificantMacroprudentialPolicyMeasures Taken by the Central BankSince the scope of macroprudential policy is the financial system as a whole, policy tools which fall under its purview target the sources of systemic risk. Such tools are introduced to the financial sector for three main reasons, namely, to address the build up of risks, to build resilience of the financial system, and to address structural dimensions. In addition to these general objectives, each central bank may have context specific objectives when introducing these tools.
The main macroprudential policy tools employed by the Central Bank include capital conservation buffers, limits on leverage ratios, forward looking loan loss provisioning requirements, caps on credit growth and loan to value ratios.
The Central Bank also developed a framework for dealing with Domestic Systemically Important Banks (D-SIBs) by introducing Higher Loss Absorbency requirements (HLA) as a capital surcharge on D-SIBs. This was implemented in line with the guidelines issued by the Basel Committee on Banking Supervision from 2019.
Way ForwardThe Central Bank has obtained technical assistance from the International Monetary Fund to expand the breadth and depth of macroprudential surveillance framework in Sri Lanka. Under this technical assistance program, it is envisaged that improvements would be made to data collection and analysis, the depth of the stress testing functionality via dynamic stress tests, improving
risk surveillance by enhancing the forward looking element, calibration of policy instruments and improving the governance structure of macroprudential policy making.
The overarching objective of financial stability is supported within a broader range of financial sector policies implemented by the Central Bank. The proposed new Banking Act would also support the macroprudential policy framework by allowing a differentiated regulatory framework to facilitate proportionality, strengthened corporate governance and consolidated supervision for banking groups, resolution, imposing penalties, ring-fencing of banks to mitigate contagion risk, strengthening provisions for mergers, acquisitions and consolidation, subsidiarization of large foreign banks, and introducing financial holding company structure for banks. It is envisioned that the regulatory and supervisory framework pertaining to licensed banks will be further strengthened in future in line with the Basel Core Principles on Effective Banking Supervision and other international best practices. Further, with the view of improving systemic resilience to shocks, the Licensed Finance Companies and Specialised Leasing Companies sector will be encouraged and incentivized to undergo business consolidation to meet improved regulatory standards.
The Central Bank is also moving towards a comprehensive resolutions procedure through the establishment of the Resolutions and Enforcement Department within the Central Bank, which is in the process of developing a resolutions framework for the Licensed Banking Sector and the Licensed Finance Companies and Specialized Leasing Company sector.
ReferencesCBSL Annual Report. 2011. Macroprudential Policy for Economic Stability. Central Bank of Sri Lanka
IMF, FSB, BIS. 2016. Elements of Effective Macroprudential Policies: Lessons from International Experience.
91
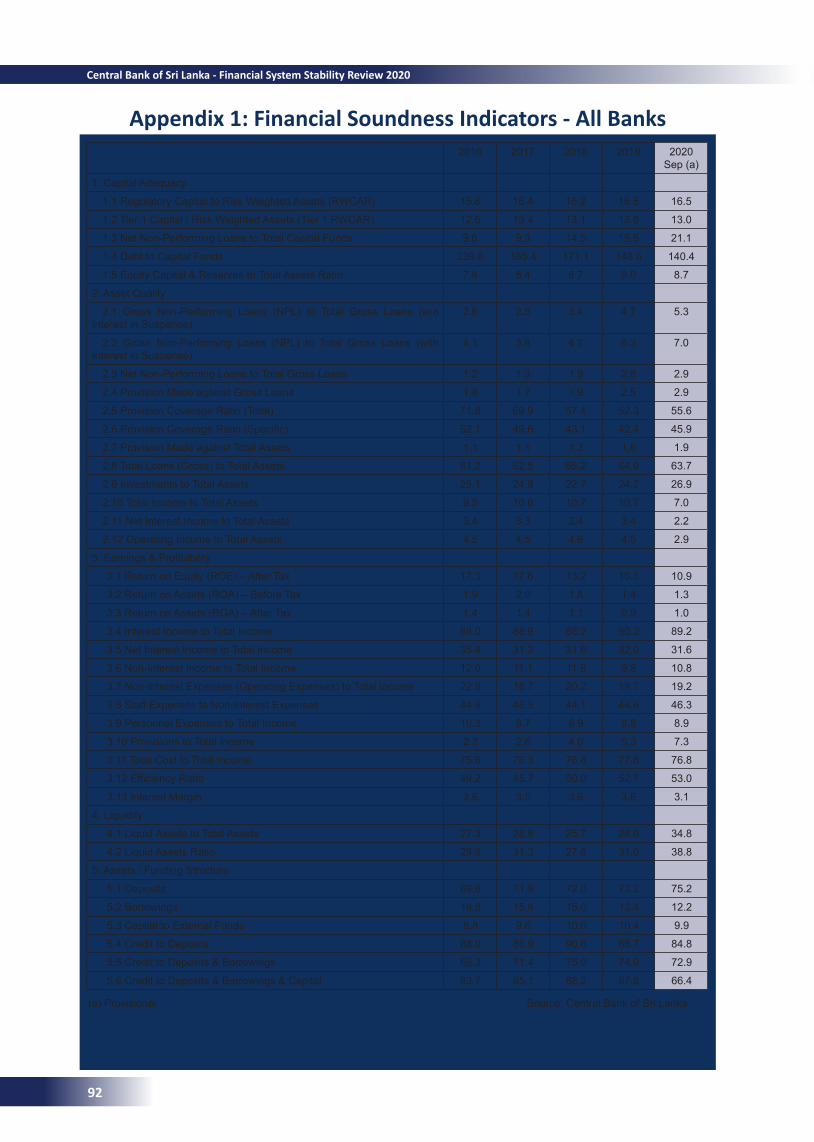
Appendix 1: Financial Soundness Indicators - All Banks2016 2017 2018 2019 2020
Sep (a)
1. Capital Adequacy
1.1 Regulatory Capital to Risk Weighted Assets (RWCAR) 15.6 16.4 16.2 16.5 16.5
1.2 Tier 1 Capital / Risk Weighted Assets (Tier 1 RWCAR) 12.6 13.4 13.1 13.0 13.0
1.3 Net Non-Performing Loans to Total Capital Funds 9.6 9.3 14.5 19.5 21.1
1.4 Debt to Capital Funds 239.8 185.4 171.1 148.6 140.4
1.5 Equity Capital & Reserves to Total Assets Ratio 7.8 8.4 8.7 9.0 8.7
2. Asset Quality
2.1 Gross Non-Performing Loans (NPL) to Total Gross Loans (w/o Interest in Suspense)
2.6 2.5 3.4 4.7 5.3
2.2 Gross Non-Performing Loans (NPL) to Total Gross Loans (with Interest in Suspense)
4.1 3.8 4.7 6.3 7.0
2.3 Net Non-Performing Loans to Total Gross Loans 1.2 1.3 1.9 2.8 2.9
2.4 Provision Made against Gross Loans 1.8 1.7 1.9 2.5 2.9
2.5 Provision Coverage Ratio (Total) 71.8 69.9 57.4 52.3 55.6
2.6 Provision Coverage Ratio (Specific) 52.1 49.6 43.1 42.4 45.9
2.7 Provision Made against Total Assets 1.1 1.1 1.3 1.6 1.9
2.8 Total Loans (Gross) to Total Assets 61.2 62.5 65.2 64.9 63.7
2.9 Investments to Total Assets 25.1 24.8 22.7 24.2 26.9
2.10 Total Income to Total Assets 9.5 10.6 10.7 10.7 7.0
2.11 Net Interest Income to Total Assets 3.4 3.3 3.4 3.4 2.2
2.12 Operating Income to Total Assets 4.5 4.5 4.6 4.5 2.9
3. Earnings & Profitability
3.1 Return on Equity (ROE) – After Tax 17.3 17.6 13.2 10.3 10.9
3.2 Return on Assets (ROA) – Before Tax 1.9 2.0 1.8 1.4 1.3
3.3 Return on Assets (ROA) – After Tax 1.4 1.4 1.1 0.9 1.0
3.4 Interest Income to Total Income 88.0 88.9 88.2 90.2 89.2
3.5 Net Interest Income to Total Income 35.4 31.2 31.6 32.0 31.6
3.6 Non-Interest Income to Total Income 12.0 11.1 11.8 9.8 10.8
3.7 Non-Interest Expenses (Operating Expenses) to Total Income 22.9 18.7 20.2 19.7 19.2
3.8 Staff Expenses to Non-Interest Expenses 44.9 46.5 44.1 44.6 46.3
3.9 Personnel Expenses to Total Income 10.3 8.7 8.9 8.8 8.9
3.10 Provisions to Total Income 2.3 2.6 4.0 5.3 7.3
3.11 Total Cost to Total Income 75.6 76.3 76.8 77.8 76.8
3.12 Efficiency Ratio 49.2 45.7 50.0 52.7 53.0
3.13 Interest Margin 3.6 3.5 3.6 3.6 3.1
4. Liquidity
4.1 Liquid Assets to Total Assets 27.3 28.8 25.7 28.9 34.8
4.2 Liquid Assets Ratio 29.9 31.3 27.6 31.0 38.8
5. Assets / Funding Structure
5.1 Deposits 69.6 71.9 72.0 73.2 75.2
5.2 Borrowings 18.8 15.6 15.0 13.4 12.2
5.3 Capital to External Funds 8.8 9.6 10.0 10.4 9.9
5.4 Credit to Deposits 88.0 86.9 90.6 88.7 84.8
5.5 Credit to Deposits & Borrowings 69.3 71.4 75.0 74.9 72.9
5.6 Credit to Deposits & Borrowings & Capital 63.7 65.1 68.2 67.8 66.4
(a) Provisional Source: Central Bank of Sri Lanka
92
Central Bank of Sri Lanka - Financial System Stability Review 2020
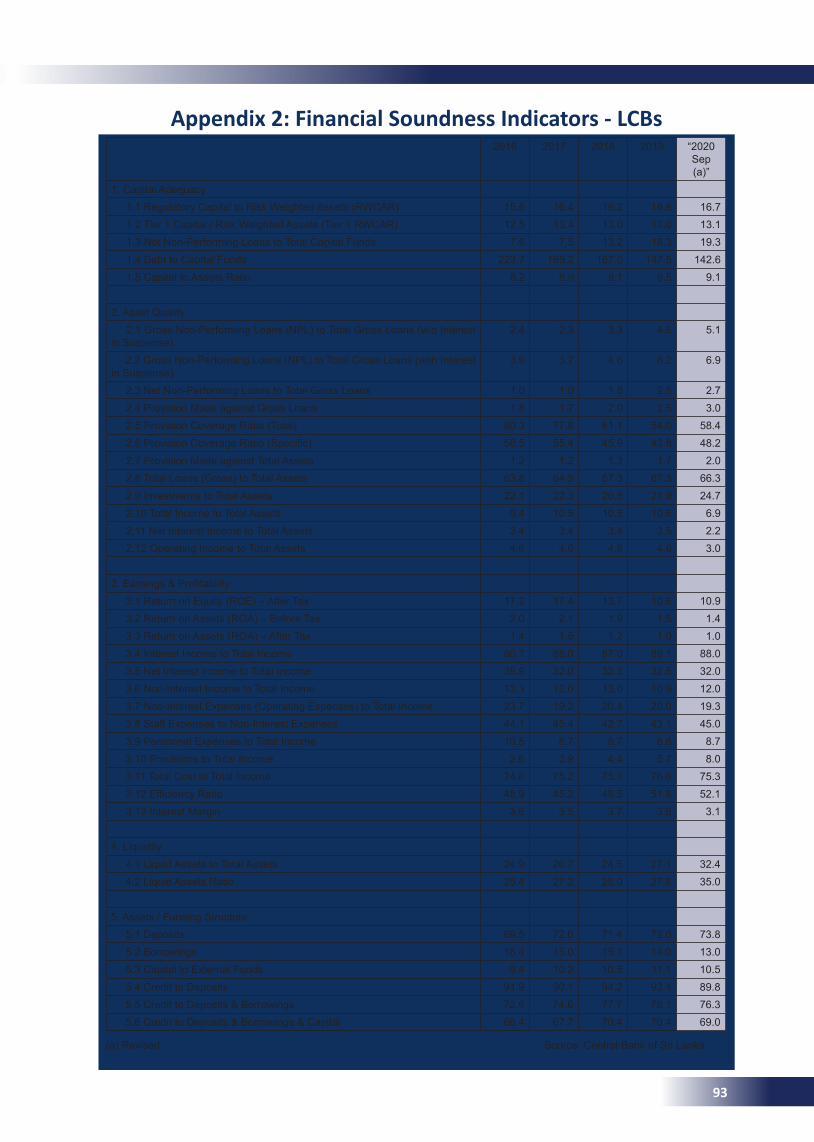
Appendix 2: Financial Soundness Indicators - LCBs2016 2017 2018 2019 “2020
Sep (a)”
1. Capital Adequacy 1.1 Regulatory Capital to Risk Weighted Assets (RWCAR) 15.6 16.4 16.2 16.6 16.7 1.2 Tier 1 Capital / Risk Weighted Assets (Tier 1 RWCAR) 12.5 13.4 13.0 13.0 13.1 1.3 Net Non-Performing Loans to Total Capital Funds 7.6 7.5 13.2 18.3 19.3 1.4 Debt to Capital Funds 223.7 169.2 167.0 147.5 142.6 1.5 Capital to Assets Ratio 8.2 8.9 9.1 9.5 9.1
2. Asset Quality 2.1 Gross Non-Performing Loans (NPL) to Total Gross Loans (w/o Interest in Suspense)
2.4 2.3 3.3 4.6 5.1
2.2 Gross Non-Performing Loans (NPL) to Total Gross Loans (with Interest in Suspense)
3.9 3.7 4.6 6.2 6.9
2.3 Net Non-Performing Loans to Total Gross Loans 1.0 1.0 1.8 2.6 2.7 2.4 Provision Made against Gross Loans 1.8 1.7 2.0 2.5 3.0 2.5 Provision Coverage Ratio (Total) 80.3 77.8 61.1 54.0 58.4 2.6 Provision Coverage Ratio (Specific) 58.5 55.4 45.9 43.8 48.2 2.7 Provision Made against Total Assets 1.2 1.2 1.3 1.7 2.0 2.8 Total Loans (Gross) to Total Assets 63.8 64.9 67.3 67.3 66.3 2.9 Investments to Total Assets 22.1 22.3 20.5 21.9 24.7 2.10 Total Income to Total Assets 9.4 10.5 10.5 10.6 6.9 2.11 Net Interest Income to Total Assets 3.4 3.4 3.4 3.5 2.2 2.12 Operating Income to Total Assets 4.6 4.6 4.8 4.6 3.0
3. Earnings & Profitability 3.1 Return on Equity (ROE) – After Tax 17.2 17.4 13.7 10.6 10.9 3.2 Return on Assets (ROA) – Before Tax 2.0 2.1 1.9 1.5 1.4 3.3 Return on Assets (ROA) – After Tax 1.4 1.5 1.2 1.0 1.0 3.4 Interest Income to Total Income 86.7 88.0 87.0 89.1 88.0 3.5 Net Interest Income to Total Income 35.9 32.0 32.3 32.5 32.0 3.6 Non-Interest Income to Total Income 13.3 12.0 13.0 10.9 12.0 3.7 Non-Interest Expenses (Operating Expenses) to Total Income 23.7 19.2 20.4 20.0 19.3 3.8 Staff Expenses to Non-Interest Expenses 44.1 45.4 42.7 43.1 45.0 3.9 Personnel Expenses to Total Income 10.5 8.7 8.7 8.6 8.7 3.10 Provisions to Total Income 2.6 2.9 4.4 5.7 8.0 3.11 Total Cost to Total Income 74.6 75.2 75.1 76.6 75.3 3.12 Efficiency Ratio 48.9 45.2 48.5 51.8 52.1 3.13 Interest Margin 3.6 3.5 3.7 3.6 3.1
4. Liquidity 4.1 Liquid Assets to Total Assets 24.9 26.7 24.5 27.1 32.4 4.2 Liquid Assets Ratio 25.4 27.2 25.0 27.8 35.0
5. Assets / Funding Structure 5.1 Deposits 69.5 72.0 71.4 72.0 73.8 5.2 Borrowings 18.4 15.0 15.1 14.0 13.0 5.3 Capital to External Funds 9.4 10.2 10.5 11.1 10.5 5.4 Credit to Deposits 91.9 90.1 94.2 93.4 89.8 5.5 Credit to Deposits & Borrowings 72.6 74.6 77.7 78.1 76.3 5.6 Credit to Deposits & Borrowings & Capital 66.4 67.7 70.4 70.4 69.0
(a) Revised Source: Central Bank of Sri Lanka
93
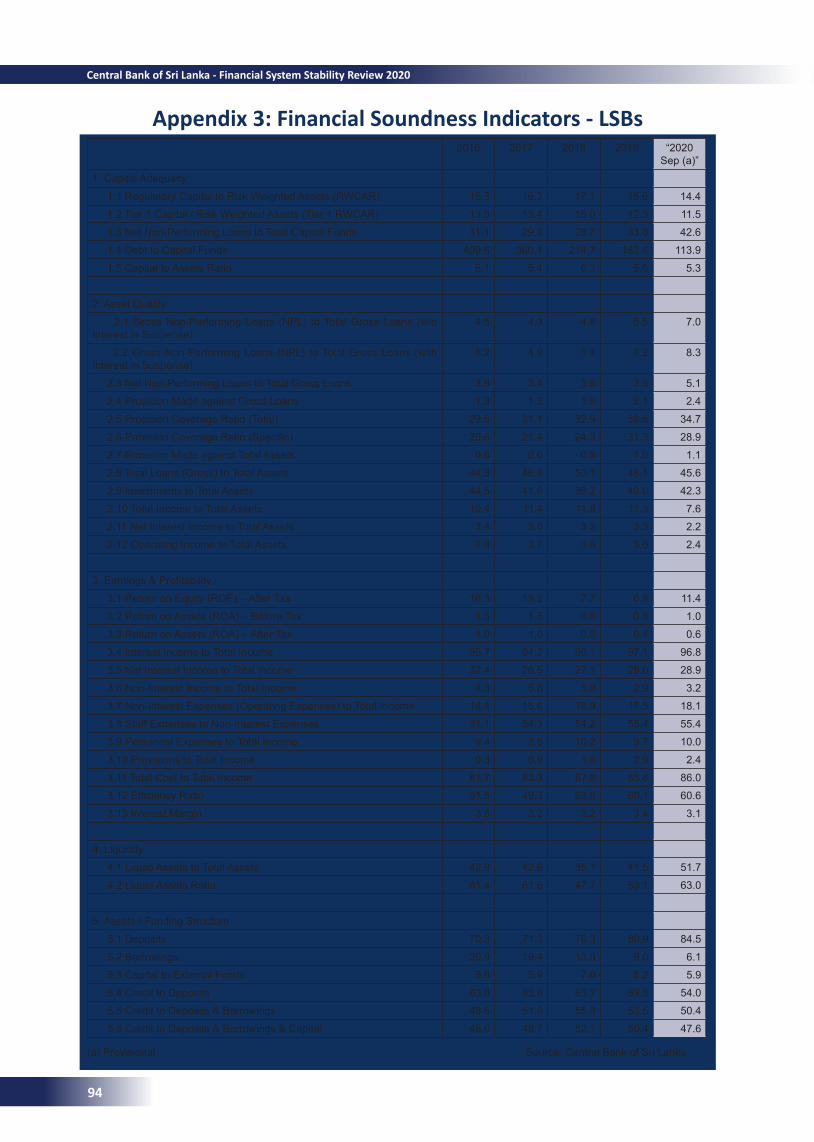
Appendix 3: Financial Soundness Indicators - LSBs2016 2017 2018 2019 “2020
Sep (a)”
1. Capital Adequacy
1.1 Regulatory Capital to Risk Weighted Assets (RWCAR) 15.3 16.3 17.1 15.6 14.4
1.2 Tier 1 Capital / Risk Weighted Assets (Tier 1 RWCAR) 13.5 13.4 15.0 12.3 11.5
1.3 Net Non-Performing Loans to Total Capital Funds 31.1 29.3 28.7 33.0 42.6
1.4 Debt to Capital Funds 409.6 360.1 214.7 162.6 113.9
1.5 Capital to Assets Ratio 5.1 5.4 6.3 5.6 5.3
2. Asset Quality
2.1 Gross Non-Performing Loans (NPL) to Total Gross Loans (w/o Interest in Suspense)
4.5 4.3 4.8 5.5 7.0
2.2 Gross Non-Performing Loans (NPL) to Total Gross Loans (with Interest in Suspense)
5.2 4.9 5.4 7.2 8.3
2.3 Net Non-Performing Loans to Total Gross Loans 3.6 3.4 3.6 3.9 5.1
2.4 Provision Made against Gross Loans 1.3 1.3 1.5 2.1 2.4
2.5 Provision Coverage Ratio (Total) 29.6 31.1 32.9 38.6 34.7
2.6 Provision Coverage Ratio (Specific) 20.6 21.4 24.3 31.3 28.9
2.7 Provision Made against Total Assets 0.6 0.6 0.8 1.0 1.1
2.8 Total Loans (Gross) to Total Assets 44.3 46.8 50.1 48.1 45.6
2.9 Investments to Total Assets 44.5 41.6 38.2 40.0 42.3
2.10 Total Income to Total Assets 10.4 11.4 11.8 11.3 7.6
2.11 Net Interest Income to Total Assets 3.4 3.0 3.2 3.3 2.2
2.12 Operating Income to Total Assets 3.8 3.7 3.6 3.6 2.4
3. Earnings & Profitability
3.1 Return on Equity (ROE) – After Tax 18.3 19.2 7.7 6.8 11.4
3.2 Return on Assets (ROA) – Before Tax 1.5 1.5 0.8 0.8 1.0
3.3 Return on Assets (ROA) – After Tax 1.0 1.0 0.5 0.4 0.6
3.4 Interest Income to Total Income 95.7 94.2 96.1 97.1 96.8
3.5 Net Interest Income to Total Income 32.4 26.5 27.1 29.0 28.9
3.6 Non-Interest Income to Total Income 4.3 5.8 3.9 2.9 3.2
3.7 Non-Interest Expenses (Operating Expenses) to Total Income 18.4 15.6 18.9 17.5 18.1
3.8 Staff Expenses to Non-Interest Expenses 51.1 54.3 54.2 55.4 55.4
3.9 Personnel Expenses to Total Income 9.4 8.5 10.2 9.7 10.0
3.10 Provisions to Total Income 0.3 0.9 1.6 2.9 2.4
3.11 Total Cost to Total Income 81.7 83.3 87.8 85.6 86.0
3.12 Efficiency Ratio 51.5 49.3 63.8 60.1 60.6
3.13 Interest Margin 3.5 3.2 3.2 3.4 3.1
4. Liquidity
4.1 Liquid Assets to Total Assets 42.9 42.6 35.1 41.5 51.7
4.2 Liquid Assets Ratio 61.4 61.6 47.7 53.1 63.0
5. Assets / Funding Structure
5.1 Deposits 70.3 71.3 76.3 80.9 84.5
5.2 Borrowings 20.9 19.4 13.5 9.0 6.1
5.3 Capital to External Funds 5.6 5.9 7.0 6.2 5.9
5.4 Credit to Deposits 63.0 65.6 65.7 59.5 54.0
5.5 Credit to Deposits & Borrowings 48.6 51.6 55.8 53.5 50.4
5.6 Credit to Deposits & Borrowings & Capital 46.0 48.7 52.1 50.4 47.6
(a) Provisional Source: Central Bank of Sri Lanka
94
Central Bank of Sri Lanka - Financial System Stability Review 2020
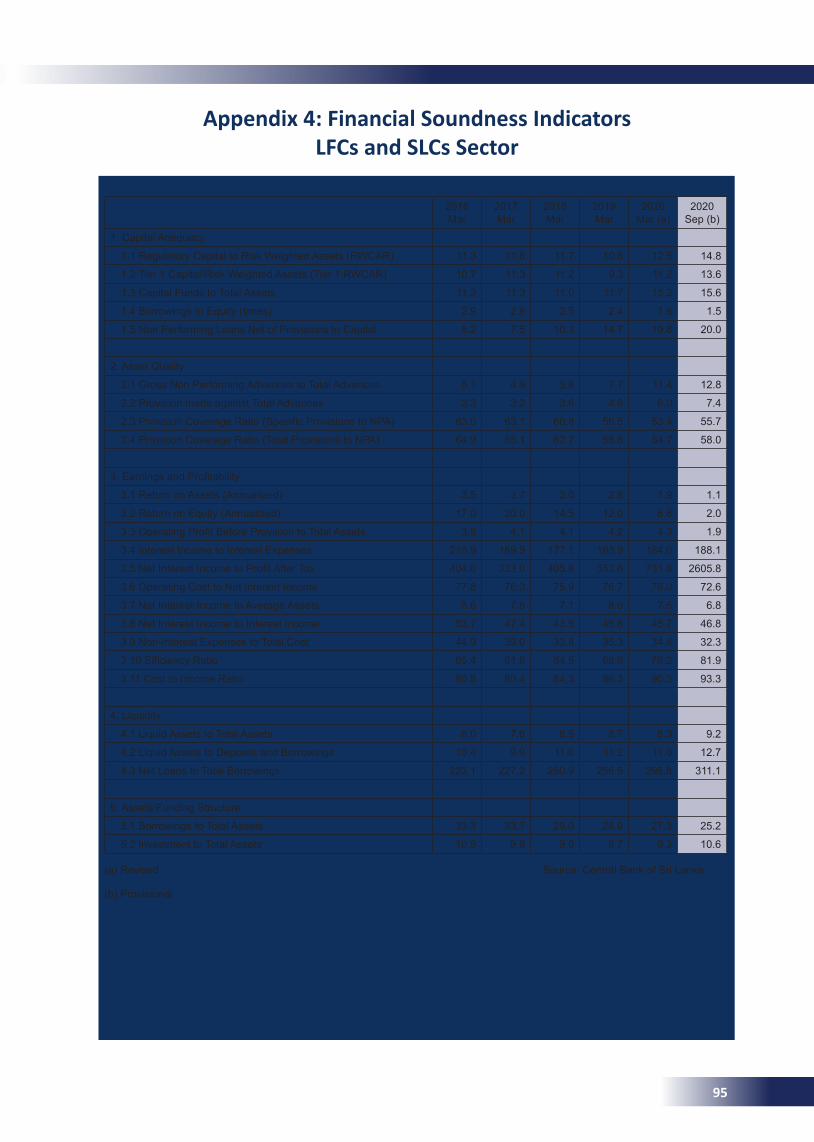
Appendix 4: Financial Soundness IndicatorsLFCs and SLCs Sector
2016 Mar
2017 Mar
2018 Mar
2019 Mar
2020 Mar (a)
2020 Sep (b)
1. Capital Adequacy
1.1 Regulatory Capital to Risk Weighted Assets (RWCAR) 11.3 11.8 11.7 10.6 12.5 14.8
1.2 Tier 1 Capital/Risk Weighted Assets (Tier 1 RWCAR) 10.7 11.3 11.2 9.3 11.2 13.6
1.3 Capital Funds to Total Assets 11.2 11.3 11.0 11.7 15.2 15.6
1.4 Borrowings to Equity (times) 2.9 2.8 2.5 2.4 1.6 1.5
1.5 Non Performing Loans Net of Provisions to Capital 8.2 7.5 10.3 14.7 19.8 20.0
2. Asset Quality
2.1 Gross Non Performing Advances to Total Advances 5.1 4.9 5.8 7.7 11.4 12.8
2.2 Provision made against Total Advances 3.3 3.2 3.6 4.6 6.0 7.4
2.3 Provision Coverage Ratio (Specific Provisions to NPA) 63.0 63.1 60.8 56.5 53.4 55.7
2.4 Provision Coverage Ratio (Total Provisions to NPA) 64.9 65.1 62.7 58.8 54.7 58.0
3. Earnings and Profitability
3.1 Return on Assets (Annualized) 3.5 3.7 3.0 2.8 1.9 1.1
3.2 Return on Equity (Annualized) 17.0 20.0 14.5 12.0 6.6 2.0
3.3 Operating Profit Before Provision to Total Assets 3.8 4.1 4.1 4.2 4.3 1.9
3.4 Interest Income to Interest Expenses 215.9 189.9 177.1 183.9 184.0 188.1
3.5 Net Interest Income to Profit After Tax 404.6 333.0 405.8 553.6 731.8 2605.8
3.6 Operating Cost to Net Interest Income 77.8 76.3 75.9 76.7 78.0 72.6
3.7 Net Interest Income to Average Assets 8.6 7.8 7.1 8.0 7.6 6.8
3.8 Net Interest Income to Interest Income 53.7 47.4 43.5 45.6 45.7 46.8
3.9 Non-Interest Expenses to Total Cost 44.9 39.0 33.8 35.3 34.4 32.3
3.10 Efficiency Ratio 65.4 61.6 64.5 68.9 76.2 81.9
3.11 Cost to Income Ratio 80.8 80.4 84.3 86.3 90.3 93.3
4. Liquidity
4.1 Liquid Assets to Total Assets 8.0 7.6 8.5 8.7 8.3 9.2
4.2 Liquid Assets to Deposits and Borrowings 10.4 9.9 11.0 11.2 11.0 12.7
4.3 Net Loans to Total Borrowings 223.1 227.2 260.9 256.5 295.8 311.1
5. Assets/Funding Structure
5.1 Borrowings to Total Assets 33.3 33.7 29.0 28.9 27.3 25.2
5.2 Investment to Total Assets 10.9 9.9 9.0 8.7 9.3 10.6
(a) Revised
(b) Provisional
Source: Central Bank of Sri Lanka
95
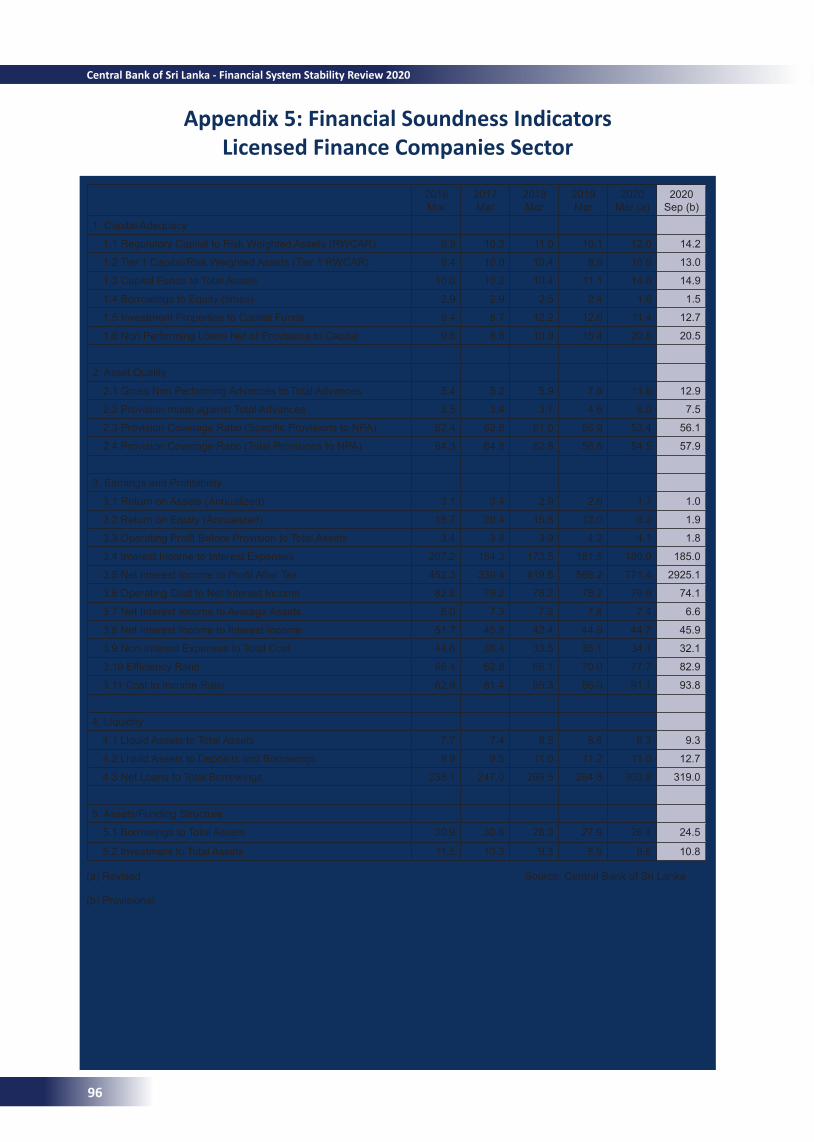
Appendix 5: Financial Soundness IndicatorsLicensed Finance Companies Sector
2016 Mar
2017 Mar
2018 Mar
2019 Mar
2020 Mar (a)
2020 Sep (b)
1. Capital Adequacy
1.1 Regulatory Capital to Risk Weighted Assets (RWCAR) 9.9 10.3 11.0 10.1 12.0 14.2
1.2 Tier 1 Capital/Risk Weighted Assets (Tier 1 RWCAR) 9.4 10.0 10.4 8.8 10.6 13.0
1.3 Capital Funds to Total Assets 10.0 10.2 10.4 11.1 14.6 14.9
1.4 Borrowings to Equity (times) 2.9 2.9 2.5 2.4 1.6 1.5
1.5 Investment Properties to Capital Funds 9.4 8.7 12.2 12.6 11.4 12.7
1.6 Non Performing Loans Net of Provisions to Capital 9.6 8.8 10.9 15.4 20.8 20.5
2. Asset Quality
2.1 Gross Non Performing Advances to Total Advances 5.4 5.2 5.9 7.8 11.6 12.9
2.2 Provision made against Total Advances 3.5 3.4 3.7 4.6 6.0 7.5
2.3 Provision Coverage Ratio (Specific Provisions to NPA) 62.4 62.8 61.0 56.9 53.4 56.1
2.4 Provision Coverage Ratio (Total Provisions to NPA) 64.3 64.8 62.8 58.8 54.5 57.9
3. Earnings and Profitability
3.1 Return on Assets (Annualized) 3.1 3.4 2.9 2.6 1.7 1.0
3.2 Return on Equity (Annualized) 15.7 20.4 15.6 12.0 6.2 1.9
3.3 Operating Profit Before Provision to Total Assets 3.4 3.8 3.9 4.2 4.1 1.8
3.4 Interest Income to Interest Expenses 207.2 184.3 173.5 181.5 180.9 185.0
3.5 Net Interest Income to Profit After Tax 452.3 339.4 419.6 568.2 771.4 2925.1
3.6 Operating Cost to Net Interest Income 82.8 79.2 78.2 78.2 79.9 74.1
3.7 Net Interest Income to Average Assets 8.0 7.3 7.2 7.8 7.4 6.6
3.8 Net Interest Income to Interest Income 51.7 45.8 42.4 44.9 44.7 45.9
3.9 Non-Interest Expenses to Total Cost 44.6 38.4 33.5 35.1 34.1 32.1
3.10 Efficiency Ratio 68.4 62.8 66.1 70.0 77.7 82.9
3.11 Cost to Income Ratio 82.9 81.4 85.3 86.9 91.1 93.8
4. Liquidity
4.1 Liquid Assets to Total Assets 7.7 7.4 8.5 8.8 8.3 9.3
4.2 Liquid Assets to Deposits and Borrowings 9.9 9.5 11.0 11.2 11.0 12.7
4.3 Net Loans to Total Borrowings 238.1 247.0 269.5 264.8 303.9 319.0
5. Assets/Funding Structure
5.1 Borrowings to Total Assets 30.9 30.8 28.0 27.9 26.4 24.5
5.2 Investment to Total Assets 11.5 10.3 9.3 8.9 9.6 10.8
(a) Revised
(b) Provisional
Source: Central Bank of Sri Lanka
96
Central Bank of Sri Lanka - Financial System Stability Review 2020
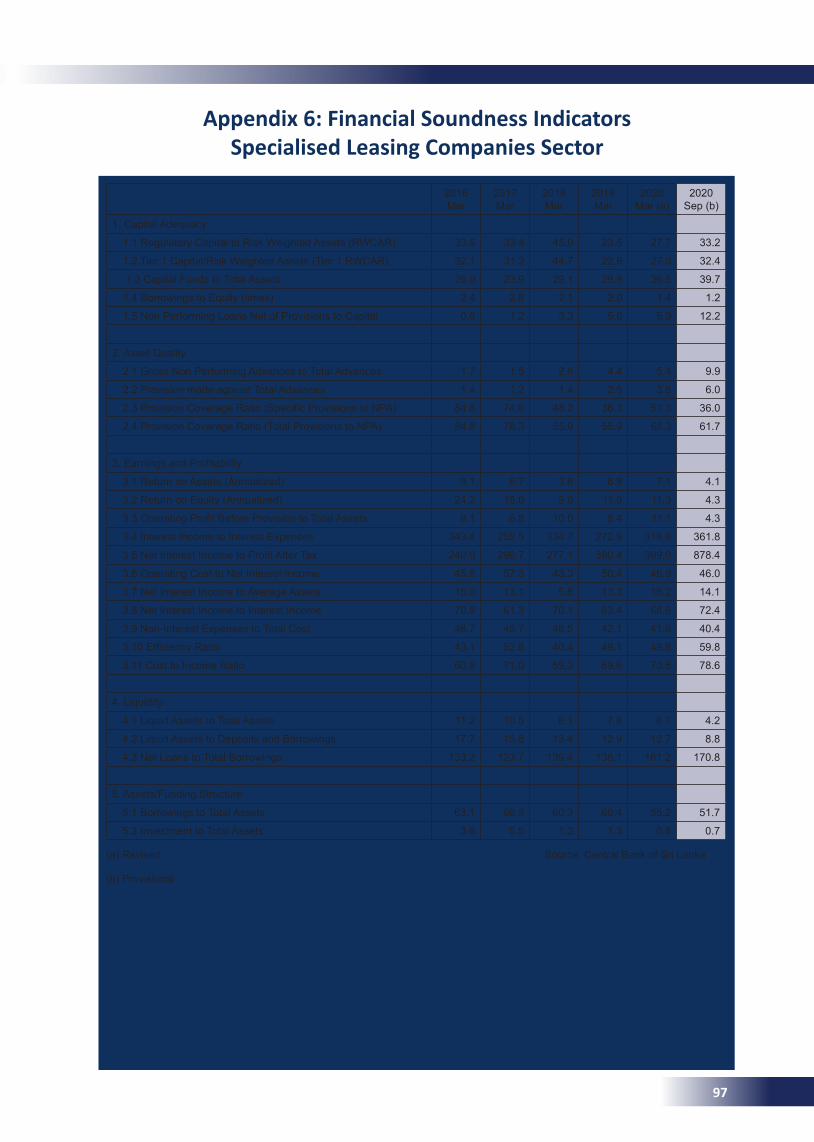
Appendix 6: Financial Soundness IndicatorsSpecialised Leasing Companies Sector
2016 Mar
2017 Mar
2018 Mar
2019 Mar
2020 Mar (a)
2020 Sep (b)
1. Capital Adequacy
1.1 Regulatory Capital to Risk Weighted Assets (RWCAR) 33.5 33.4 45.0 23.5 27.7 33.2
1.2 Tier 1 Capital/Risk Weighted Assets (Tier 1 RWCAR) 32.1 31.2 44.7 22.9 27.0 32.4
1.3 Capital Funds to Total Assets 26.0 23.9 29.1 29.8 36.5 39.7
1.4 Borrowings to Equity (times) 2.4 2.8 2.1 2.0 1.4 1.2
1.5 Non Performing Loans Net of Provisions to Capital 0.8 1.2 3.3 5.6 5.9 12.2
2. Asset Quality
2.1 Gross Non Performing Advances to Total Advances 1.7 1.5 2.6 4.4 5.4 9.9
2.2 Provision made against Total Advances 1.4 1.2 1.4 2.5 3.5 6.0
2.3 Provision Coverage Ratio (Specific Provisions to NPA) 84.8 74.6 48.2 36.3 51.3 36.0
2.4 Provision Coverage Ratio (Total Provisions to NPA) 84.8 78.3 55.9 55.9 68.3 61.7
3. Earnings and Profitability
3.1 Return on Assets (Annualized) 9.1 6.7 3.6 6.9 7.1 4.1
3.2 Return on Equity (Annualized) 24.2 18.0 9.0 11.9 11.3 4.3
3.3 Operating Profit Before Provision to Total Assets 9.1 6.8 10.0 8.4 11.1 4.3
3.4 Interest Income to Interest Expenses 343.4 258.5 334.7 272.9 318.8 361.8
3.5 Net Interest Income to Profit After Tax 240.0 296.7 277.1 380.4 399.0 878.4
3.6 Operating Cost to Net Interest Income 45.8 57.3 43.3 50.4 46.9 46.0
3.7 Net Interest Income to Average Assets 15.0 13.1 5.6 13.3 16.2 14.1
3.8 Net Interest Income to Interest Income 70.9 61.3 70.1 63.4 68.6 72.4
3.9 Non-Interest Expenses to Total Cost 48.7 45.7 46.5 42.1 41.6 40.4
3.10 Efficiency Ratio 43.1 52.8 40.4 49.1 49.8 59.8
3.11 Cost to Income Ratio 60.9 71.0 59.3 69.6 70.5 78.6
4. Liquidity
4.1 Liquid Assets to Total Assets 11.2 10.5 8.1 7.8 6.7 4.2
4.2 Liquid Assets to Deposits and Borrowings 17.7 15.8 13.4 12.9 12.7 8.8
4.3 Net Loans to Total Borrowings 133.2 123.7 139.4 138.1 161.2 170.8
5. Assets/Funding Structure
5.1 Borrowings to Total Assets 63.1 66.5 60.3 60.4 55.2 51.7
5.2 Investment to Total Assets 3.8 5.5 1.2 1.3 0.8 0.7
(a) Revised
(b) Provisional
Source: Central Bank of Sri Lanka
97

Financial System Stability Review
2020
ISBN-978-955-575-411-8 Central Bank of Sri Lanka