Financial sustainability of modern composting: the ... · Financial sustainability of modern...
14
ORIGINAL RESEARCH Financial sustainability of modern composting: the economically optimal scale for municipal waste composting plant in developing Asia Andante Hadi Pandyaswargo • Dickella Gamaralalage Jagath Premakumara Received: 9 July 2013 / Accepted: 16 June 2014 / Published online: 23 July 2014 Ó The Author(s) 2014. This article is published with open access at Springerlink.com Abstract There is a widespread interest in converting organic waste into compost fertilizer to extend the life of landfills, create economic and environmental benefits, and ultimately reduce the pressure on local governments in managing the ever-increasing complexity of municipal solid waste. However, composting is still seldom consid- ered as a strategic element. There is also very little evi- dence available of its economic feasibility. This study, therefore, aims to analyze key factors that influence the economic feasibility of municipal composting plant and identify a range of plant capacity or scale where a com- posting project could have higher opportunity to be finan- cially sustainable. A cost–benefit analysis (CBA) was carried out using the data gathered from five composting plants in Asia, including Surabaya, Bali and Bekasi in Indonesia, Beijing in China, and Matale in Sri Lanka. The results identified that the medium-scale and lower large- scale composting plants have an optimal opportunity for being financially feasible as compared with the smaller and larger capacity plants. The study also identified that the economic viability of the composting plants depends on the number of factors, such as selection of suitable processing methods, technologies, scale, quality of product and mar- keting strategies. The advantages of the medium and lower large-scale composting plants are (1) waste input and product quality are easier to control than larger scale compost plants, and (2) there are extra income opportuni- ties such as tipping fees and carbon credits that are limited in the case of small-scale composting plants. The scale of composting plant is one of the key factors to be considered at the initial stage of planning composting plants. Keywords Modern composting Municipal solid waste management Resource recovery Economic feasibility Asian developing countries Introduction Municipal solid waste management in Asian Cities Developing countries in Asia have some similarities in their municipal solid waste management (MSWM), waste composition and its characteristics. Estimates show that many cities in developing countries allocate 20–50 % of their annual budget for MSWM, even though 30–60 % of all urban municipal waste (MSW) remains uncollected and \ 50 % of the population is served (UNEP 2009). The composition of MSW in developing Asia is dominated by organic waste and collection is often done without proper waste separation at source. The most common existing treatment method is landfill, as it remains the cheapest and easiest way of disposing of the MSW. However, most landfills in developing countries are poorly designed and maintained, effectively turning into open, unsanitary dumpsites (ADB 2011). The improper MSW collection and treatment contribute severe public and environmental health issues, including the global warming since organic waste is the main source of methane gas emissions through open dumping and landfill disposal (Sang-Arun et al. 2009). Thus, converting A. H. Pandyaswargo (&) Graduate School of Environment and Energy Engineering, Waseda University, Tokyo, Japan e-mail: [email protected] D. G. J. Premakumara Institute for Global Environmental Strategies, Kitakyushu Urban Centre, Kitakyushu, Japan e-mail: [email protected] 123 Int J Recycl Org Waste Agricult (2014) 3:66 DOI 10.1007/s40093-014-0066-y
Transcript of Financial sustainability of modern composting: the ... · Financial sustainability of modern...
ORIGINAL RESEARCH
Financial sustainability of modern composting: the economicallyoptimal scale for municipal waste composting plant in developingAsia
Andante Hadi Pandyaswargo •
Dickella Gamaralalage Jagath Premakumara
Received: 9 July 2013 / Accepted: 16 June 2014 / Published online: 23 July 2014
� The Author(s) 2014. This article is published with open access at Springerlink.com
Abstract There is a widespread interest in converting
organic waste into compost fertilizer to extend the life of
landfills, create economic and environmental benefits, and
ultimately reduce the pressure on local governments in
managing the ever-increasing complexity of municipal
solid waste. However, composting is still seldom consid-
ered as a strategic element. There is also very little evi-
dence available of its economic feasibility. This study,
therefore, aims to analyze key factors that influence the
economic feasibility of municipal composting plant and
identify a range of plant capacity or scale where a com-
posting project could have higher opportunity to be finan-
cially sustainable. A cost–benefit analysis (CBA) was
carried out using the data gathered from five composting
plants in Asia, including Surabaya, Bali and Bekasi in
Indonesia, Beijing in China, and Matale in Sri Lanka. The
results identified that the medium-scale and lower large-
scale composting plants have an optimal opportunity for
being financially feasible as compared with the smaller and
larger capacity plants. The study also identified that the
economic viability of the composting plants depends on the
number of factors, such as selection of suitable processing
methods, technologies, scale, quality of product and mar-
keting strategies. The advantages of the medium and lower
large-scale composting plants are (1) waste input and
product quality are easier to control than larger scale
compost plants, and (2) there are extra income opportuni-
ties such as tipping fees and carbon credits that are limited
in the case of small-scale composting plants. The scale of
composting plant is one of the key factors to be considered
at the initial stage of planning composting plants.
Keywords Modern composting � Municipal solid waste
management � Resource recovery � Economic feasibility �Asian developing countries
Introduction
Municipal solid waste management in Asian Cities
Developing countries in Asia have some similarities in
their municipal solid waste management (MSWM), waste
composition and its characteristics. Estimates show that
many cities in developing countries allocate 20–50 % of
their annual budget for MSWM, even though 30–60 % of
all urban municipal waste (MSW) remains uncollected and
\50 % of the population is served (UNEP 2009). The
composition of MSW in developing Asia is dominated by
organic waste and collection is often done without proper
waste separation at source. The most common existing
treatment method is landfill, as it remains the cheapest and
easiest way of disposing of the MSW. However, most
landfills in developing countries are poorly designed and
maintained, effectively turning into open, unsanitary
dumpsites (ADB 2011).
The improper MSW collection and treatment contribute
severe public and environmental health issues, including
the global warming since organic waste is the main source
of methane gas emissions through open dumping and
landfill disposal (Sang-Arun et al. 2009). Thus, converting
A. H. Pandyaswargo (&)
Graduate School of Environment and Energy Engineering,
Waseda University, Tokyo, Japan
e-mail: [email protected]
D. G. J. Premakumara
Institute for Global Environmental Strategies, Kitakyushu Urban
Centre, Kitakyushu, Japan
e-mail: [email protected]
123
Int J Recycl Org Waste Agricult (2014) 3:66
DOI 10.1007/s40093-014-0066-y

this high level of organic waste into resource recovery
systems presents a sizeable untapped potential for extend-
ing the life of landfills, creating economic and environ-
mental benefits, and ultimately reducing the pressure on
municipalities in developing countries to manage the ever-
increasing complexity of MSWM (Premakumara et al.
2011).
The potential of composting in municipal solid waste
management
Figure 1 shows the percentage of MSW composition in six
Asian countries. It shows that over 50 % of MSW gener-
ated in these countries is organic waste. Further, MSW in
developing countries is characterized by a significantly
higher density and moisture, mainly organic waste with
low caloric values (an average 700–1,000 kilocalories)
(ADB 2011). Technically, high-moisture waste caused by
the high percentage of organic waste makes it more suit-
able for biological treatment rather than thermal treatment
(Rand et. al. 2000). Moreover, due to this particular waste
characteristic, integrated waste management involving
composting is more energy efficient and has lower envi-
ronmental impact (Pandyaswargo et. al. 2012).
Developing countries in Asia generally practice two
biological treatment methods for organic waste manage-
ment, such as aerobic composting and anaerobic digestion
(AD). The AD method allows both material and energy
recovery. The output of material recovery is compost fer-
tilizer and the outputs of energy recovery are electricity and
heat. Though AD plants are getting more popular due to these
two benefits, they are highly sensitive towards input quality.
Thus, AD technology has been commonly used in Asia to
treat animal manure, kitchen and agricultural waste because
of the uniformity and purity of organic content.
However, some attempts to apply this technology to
treat MSW have not been so successful in many Asian
cities where segregation of waste at source is poor
(Mazumdar 2012). Moreover, the rate of implementation is
hindered by the high up-front investment, maintenance
costs and technical skill requirements. These failures can
be seen in Delhi, Bangalore, Lucknow and other cities in
India (Ambulkar and Shekdar 2004). Similarly, municipal
waste AD plants in China also faced problems and opera-
tional difficulties (Zheng 2012).
Aerobic composting, on the other hand, is more for-
giving towards input quality (Hoornweg and Bhada-Tata
2012) and requires less investment and operational costs
(Aye and Widjaya 2006). Composting can be applied in
various scales, from small, more community-based
approaches to medium and large scales, centralized
facilities that can handle several hundred tonnes of MSW
per day (see Table 1). A number of composting tech-
niques are available in developing countries in Asia, such
as household bins, windrows or piles that are aerated with
poles and turned with front-loaders or simple spades, and
in-vessel or enclosed systems (drums and agitated bed
technologies or any technical system enclosed in a
building require complex equipment) (Eawag Sandec
2008).
Key factors for the sustainability of composting
schemes
Although developing countries in Asia have gained more
experience in implementing composting than AD projects,
MSW composting is not a problem-free solution either
(Hargreaves et al. 2008). Most commonly, composting
systems have failed due to economic and technical
reasons.
Economic failure
One of the popular economic failures is a lack of market
for the compost that is produced by the compost plants.
Market acceptance of compost fertilizer relies on a wide
range of criteria, including the price, quality and consis-
tency of the product. It should also be free from con-
taminants such as heavy metals, glass, inert materials, and
also plant and animal pathogens. It was evident that a
larger scale composting plants often receive a large vol-
ume of mixed waste, which may contain contaminants
(Williams 2005).
In addition to the income from compost sells, the
compost plants can earn additional income from the tipping
fees and the Certified Emission Reduction (CER) if the
plant is registered and approved as Clean Development
Mechanism (CDM) project. In practice, more than 98 % of
Fig. 1 Municipal waste compositions in Sri Lanka, Bangladesh,
India, Thailand, Indonesia and PR China
66 Page 2 of 14 Int J Recycl Org Waste Agricult (2014) 3:66
123

the registered CDM composting projects fall in the cate-
gory of medium- to large-scale composting plant (Fenhann
2012). The smaller composting plants are not qualified to
receive carbon credits due to insufficient greenhouse
abatement potential set by the United Nations Framework
Convention on Climate Change (UNFCCC) regulation
(Yenneti and Premakumara 2011). Thus, the small-scale
composting plants are often dependent on municipal pro-
vision to launch and sustain its operation. (Zurbruegg et al.
2004).
Technical failure
Composting plants have experienced two kinds of tech-
nical failures: first, the failure of the mechanical systems
those manipulate waste streams before biological process
starts; second, the failure of the decomposition process
itself mainly attributable to failure to create an environ-
ment for the biological process to thrive. The technolog-
ical failure of composting is primarily a failure of the
mechanical pre-processing systems. The large-scale
composting facilities with the complex mechanical pre-
processing to remove non-compostable materials have
largely failed at their tasks. There is hardly any
mechanical system which could ever adequately identify
and separate all of the materials in the mixed waste to
ensure the production of good-quality compost. In addi-
tion, there is a failure in the composting process itself due
to the failure in understanding the nature of biological
processes. Compost bacteria, insects, and microorganisms
require certain environmental conditions to thrive. If these
conditions are absent or interrupted, it badly affects the
composting process and its quality.
Objectives
The objective of this study is to analyze factors that could
affect the economic feasibility of municipal waste com-
posting plant and to find a range of plant capacity or scale
where a composting project could have higher opportunity
to be financially sustainable based on a comparative ana-
lysis in the study.
Estimation results of this study represent only the dis-
cussed case study plants. However, the sensitivity analysis
part, which highlighted the significant factors that affect
the economic feasibility of a composting plant with dif-
ferent capacities, could be used as an approximate eco-
nomic guideline for investment in a composting plant, in
the developing countries of the Asian region.
The paper is divided into four sections. After this brief
introduction, ‘‘Materials and methods’’ elaborates on the
data and research methodology. Then, ‘‘Results and dis-
cussions’’ presents the results of CBA and ‘‘Sensitivity
analysis’’ provides sensitivity analysis to show how the
plants would perform under different conditions. Finally,
the conclusion, recommendations and suggestions for fur-
ther studies are offered in ‘‘Conclusions and recommen-
dations’’ and ‘‘Further studies’’.
Materials and methods
Scope and boundaries
The study selected five case studies from three different
countries to represent three ranges of composting plant
capacities (small, medium, large). The selected small-scale
Table 1 Comparison of composting at different scales
Small Medium Large
Small-scale (maximum 5 tonnes/day)
composting schemes which are commonly
integrated into the community MSW
collection system
Medium-scale composting plants handle
around 5–100 tonnes/day of organic waste
collected from city markets and/or
residential areas
Large-scale composting plants accept over 100
tonnes/day of organic waste collected from
city markets and mixed residential areas and
mostly located outside of the city
Apply a simple, low-cost technology with high
labour-intensive methods. Common
composting methods are manual windrow,
box composting and vermicomposting are
commonly used
Semi-mechanized plants with mechanical
windrow and aerated static piles are
commonly applied
Highly mechanized and low labour-intensive
methods, such as mechanical windrow and
in-vessel methods
Low capital and operational costs, easy to start
and operate with minimum know-how,
reduce transportation costs and good-quality
compost
Medium capital and operational costs, more
control of operation
High capital and operational costs, more
control of operation
Reliance on cooperation of citizens, less
control of implementation
Need trained staff, more expensive,
additional knowledge on project
management and marketing
Need highly trained staff, highly expensive,
additional knowledge on project management
and marketing and poor-quality compost
products
Source: compiled by the authors
Int J Recycl Org Waste Agricult (2014) 3:66 Page 3 of 14 66
123
municipal waste composting plants are located in Surabaya
city in Indonesia (0.6 TPD)—note that the analyzed com-
posting activity in this plant is only the open windrow one
and not the takakura basket method (Pusdakota 2014)
(Christianto 2005)—and Matale City in Sri Lanka (1 TPD).
The medium-scale municipal waste composting plant is
situated in Bali, Indonesia (51 TPD). Also, large-scale
municipal waste composting plants selected in this study
are in Beijing, China (638 TPD) and Bekasi, Indonesia
(200 TPD). The CBA included all direct economic costs
such as land acquisition cost, machineries, fuel, manpower,
etc. based on the specific plants discussed in accordance
with the current local market prices.
Applied composting techniques and outputs
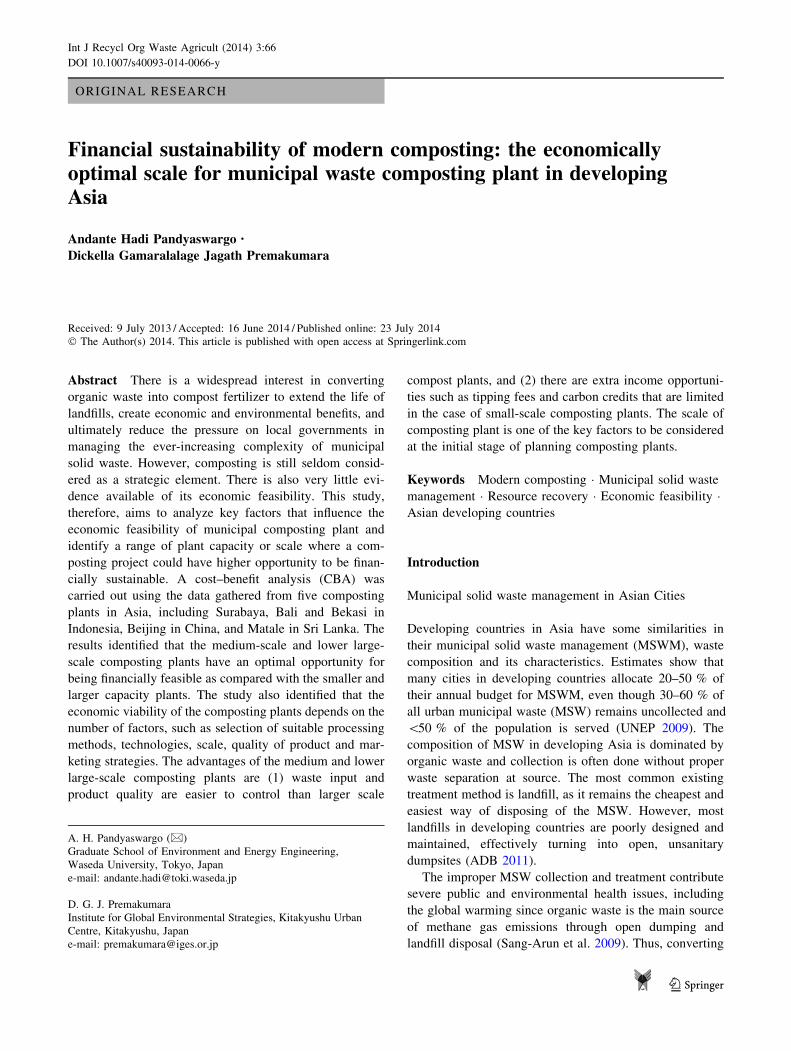
Composting plants in this study use the different com-
posting methods. Figures 2, 3, 4, 5 and 6 show the
composting process in each plant. The input for the
small-scale plants in Surabaya and Matale is source-
separated household kitchen waste. The Surabaya com-
post pile is the open windrow and the Matale plant is
applied ventilated brick boxes (box composting method).
Compost piles are manually turned and the compost
product is used for agriculture. Brinton suggests that
compost made by pure organic waste is suitable for
vegetable planting (Brinton 2000). The heavy metal test
using Atomic Absorption Spectrometer (AAS) conducted
by the Sri Lankan Industrial Technology Institute showed
that there is no Cadmium (Cd) detected, Chromium (Cr)
30 mg/kg, Copper (Cu) 42 mg/kg, Mercury (Hg) not
detected, Nickel (Ni) 11 mg/kg, and Zinc (Zn) 113 mg/kg
in the Matale compost product (Jayaratne 2013). This
result is meeting the Sri Lankan standard for heavy
metal limit in fertilizers (UN ESCAP 2010; Jayaratne
2009).
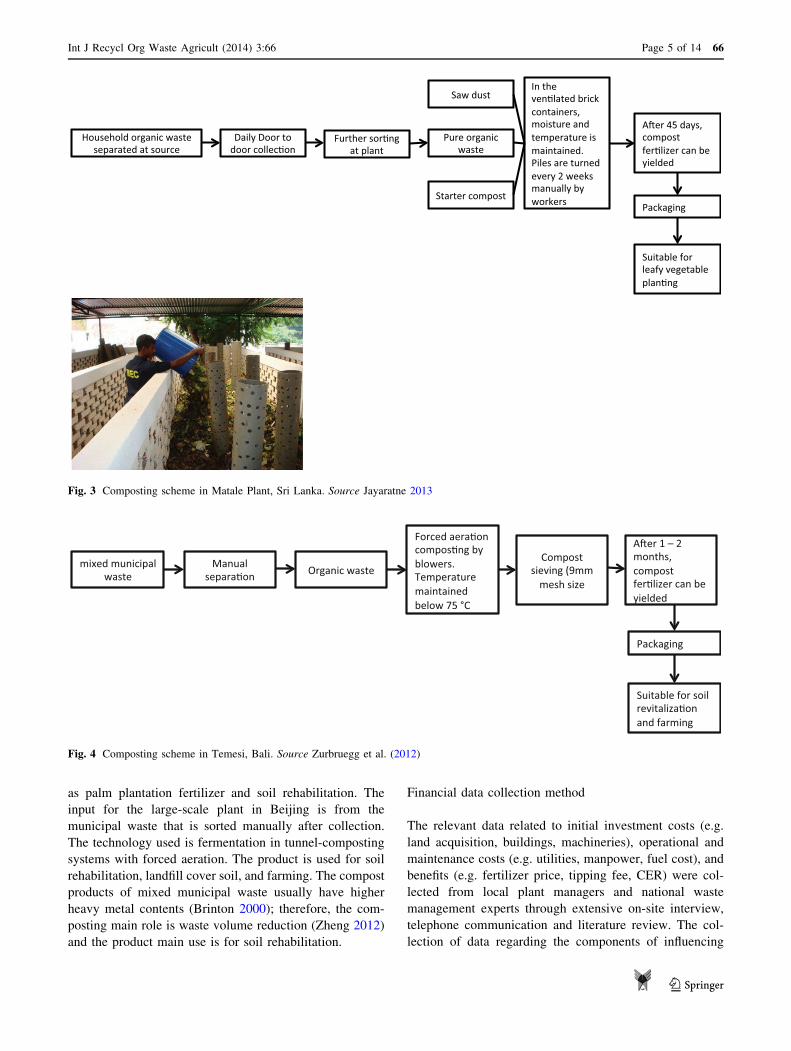
The input for the medium-scale plant in Bali is post-
collection, manually separated organic waste from the
mixed municipal waste. The technology used is forced
aeration composting using a blower. The product of this
plant is suitable for soil revitalization and farming. The
research conducted by Zurbruegg et al. (2012) has shown
that the product has a concentration metal as far below the
Indonesian standards and it is meeting all the specifications
for compost from organic waste.
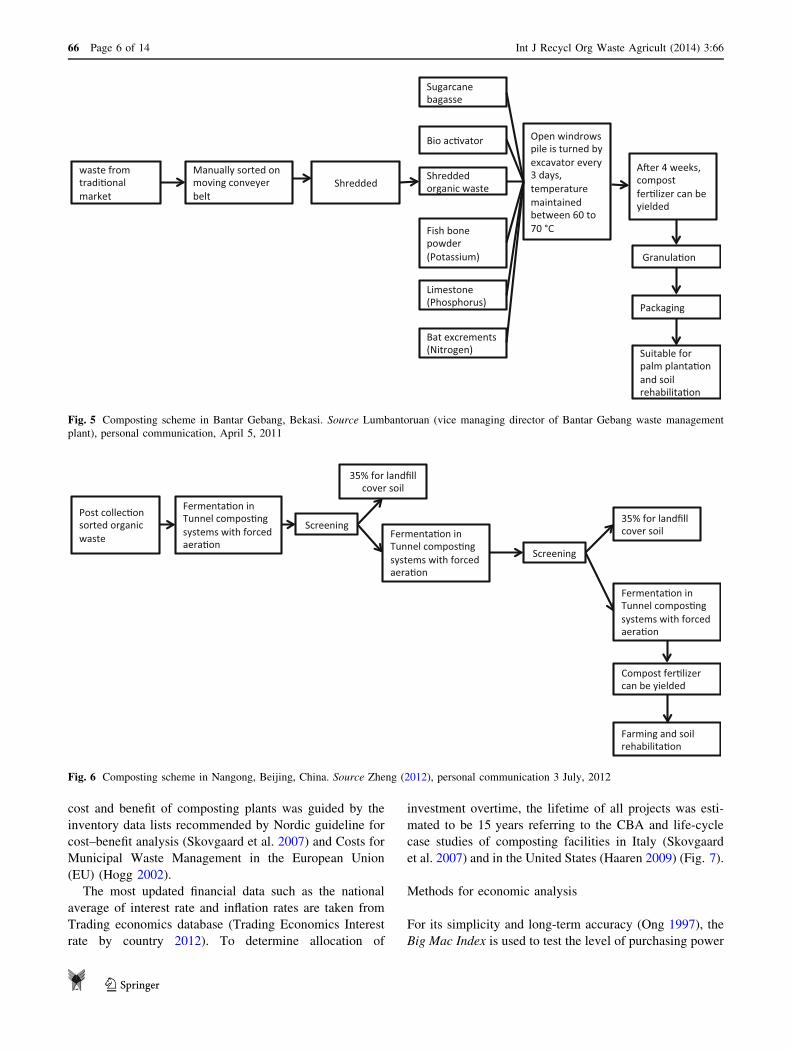
The input for the large-scale plant in Bekasi is from the
traditional market, the technique applied is open windrow,
excavator is used for turning the pile, and the output is used
Fig. 2 Composting scheme practiced in Surabaya. Source Christianto 2005
66 Page 4 of 14 Int J Recycl Org Waste Agricult (2014) 3:66
123
as palm plantation fertilizer and soil rehabilitation. The
input for the large-scale plant in Beijing is from the
municipal waste that is sorted manually after collection.
The technology used is fermentation in tunnel-composting
systems with forced aeration. The product is used for soil
rehabilitation, landfill cover soil, and farming. The compost
products of mixed municipal waste usually have higher
heavy metal contents (Brinton 2000); therefore, the com-
posting main role is waste volume reduction (Zheng 2012)
and the product main use is for soil rehabilitation.
Financial data collection method
The relevant data related to initial investment costs (e.g.
land acquisition, buildings, machineries), operational and
maintenance costs (e.g. utilities, manpower, fuel cost), and
benefits (e.g. fertilizer price, tipping fee, CER) were col-
lected from local plant managers and national waste
management experts through extensive on-site interview,
telephone communication and literature review. The col-
lection of data regarding the components of influencing
Fig. 3 Composting scheme in Matale Plant, Sri Lanka. Source Jayaratne 2013
Fig. 4 Composting scheme in Temesi, Bali. Source Zurbruegg et al. (2012)
Int J Recycl Org Waste Agricult (2014) 3:66 Page 5 of 14 66
123
cost and benefit of composting plants was guided by the
inventory data lists recommended by Nordic guideline for
cost–benefit analysis (Skovgaard et al. 2007) and Costs for
Municipal Waste Management in the European Union
(EU) (Hogg 2002).
The most updated financial data such as the national
average of interest rate and inflation rates are taken from
Trading economics database (Trading Economics Interest
rate by country 2012). To determine allocation of
investment overtime, the lifetime of all projects was esti-
mated to be 15 years referring to the CBA and life-cycle
case studies of composting facilities in Italy (Skovgaard
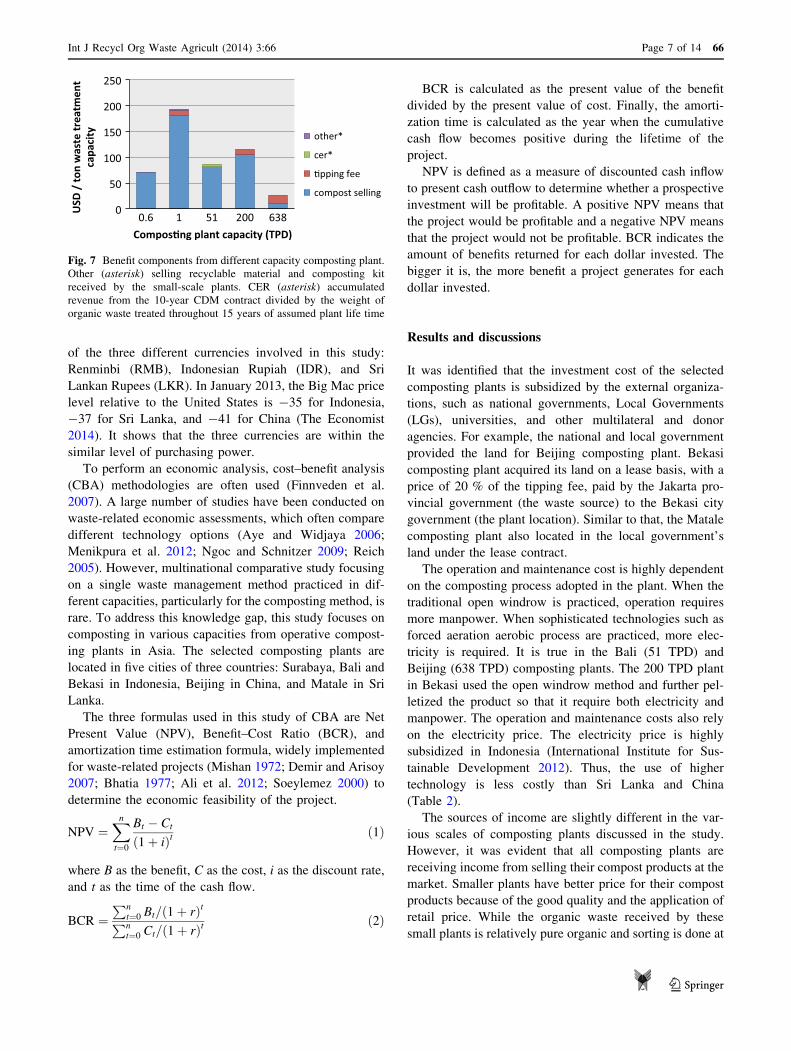
et al. 2007) and in the United States (Haaren 2009) (Fig. 7).
Methods for economic analysis
For its simplicity and long-term accuracy (Ong 1997), the
Big Mac Index is used to test the level of purchasing power
Fig. 5 Composting scheme in Bantar Gebang, Bekasi. Source Lumbantoruan (vice managing director of Bantar Gebang waste management
plant), personal communication, April 5, 2011
Fig. 6 Composting scheme in Nangong, Beijing, China. Source Zheng (2012), personal communication 3 July, 2012
66 Page 6 of 14 Int J Recycl Org Waste Agricult (2014) 3:66
123
of the three different currencies involved in this study:
Renminbi (RMB), Indonesian Rupiah (IDR), and Sri
Lankan Rupees (LKR). In January 2013, the Big Mac price
level relative to the United States is -35 for Indonesia,
-37 for Sri Lanka, and -41 for China (The Economist
2014). It shows that the three currencies are within the
similar level of purchasing power.
To perform an economic analysis, cost–benefit analysis
(CBA) methodologies are often used (Finnveden et al.
2007). A large number of studies have been conducted on
waste-related economic assessments, which often compare
different technology options (Aye and Widjaya 2006;
Menikpura et al. 2012; Ngoc and Schnitzer 2009; Reich
2005). However, multinational comparative study focusing
on a single waste management method practiced in dif-
ferent capacities, particularly for the composting method, is
rare. To address this knowledge gap, this study focuses on
composting in various capacities from operative compost-
ing plants in Asia. The selected composting plants are
located in five cities of three countries: Surabaya, Bali and
Bekasi in Indonesia, Beijing in China, and Matale in Sri
Lanka.
The three formulas used in this study of CBA are Net
Present Value (NPV), Benefit–Cost Ratio (BCR), and
amortization time estimation formula, widely implemented
for waste-related projects (Mishan 1972; Demir and Arisoy
2007; Bhatia 1977; Ali et al. 2012; Soeylemez 2000) to
determine the economic feasibility of the project.
NPV ¼Xn
t¼0
Bt � Ct
ð1 þ iÞt ð1Þ
where B as the benefit, C as the cost, i as the discount rate,
and t as the time of the cash flow.
BCR ¼Pn
t¼0 Bt=ð1 þ rÞt
Pnt¼0 Ct=ð1 þ rÞt ð2Þ
BCR is calculated as the present value of the benefit
divided by the present value of cost. Finally, the amorti-
zation time is calculated as the year when the cumulative
cash flow becomes positive during the lifetime of the
project.
NPV is defined as a measure of discounted cash inflow
to present cash outflow to determine whether a prospective
investment will be profitable. A positive NPV means that
the project would be profitable and a negative NPV means
that the project would not be profitable. BCR indicates the
amount of benefits returned for each dollar invested. The
bigger it is, the more benefit a project generates for each
dollar invested.
Results and discussions
It was identified that the investment cost of the selected
composting plants is subsidized by the external organiza-
tions, such as national governments, Local Governments
(LGs), universities, and other multilateral and donor
agencies. For example, the national and local government
provided the land for Beijing composting plant. Bekasi
composting plant acquired its land on a lease basis, with a
price of 20 % of the tipping fee, paid by the Jakarta pro-
vincial government (the waste source) to the Bekasi city
government (the plant location). Similar to that, the Matale
composting plant also located in the local government’s
land under the lease contract.
The operation and maintenance cost is highly dependent
on the composting process adopted in the plant. When the
traditional open windrow is practiced, operation requires
more manpower. When sophisticated technologies such as
forced aeration aerobic process are practiced, more elec-
tricity is required. It is true in the Bali (51 TPD) and
Beijing (638 TPD) composting plants. The 200 TPD plant
in Bekasi used the open windrow method and further pel-
letized the product so that it require both electricity and
manpower. The operation and maintenance costs also rely
on the electricity price. The electricity price is highly
subsidized in Indonesia (International Institute for Sus-
tainable Development 2012). Thus, the use of higher
technology is less costly than Sri Lanka and China
(Table 2).
The sources of income are slightly different in the var-
ious scales of composting plants discussed in the study.
However, it was evident that all composting plants are
receiving income from selling their compost products at the
market. Smaller plants have better price for their compost
products because of the good quality and the application of
retail price. While the organic waste received by these
small plants is relatively pure organic and sorting is done at
Fig. 7 Benefit components from different capacity composting plant.
Other (asterisk) selling recyclable material and composting kit
received by the small-scale plants. CER (asterisk) accumulated
revenue from the 10-year CDM contract divided by the weight of
organic waste treated throughout 15 years of assumed plant life time
Int J Recycl Org Waste Agricult (2014) 3:66 Page 7 of 14 66
123
the source. However, when the plant capacity is bigger and
the input is mixed municipal waste, the control of quality
became difficult and result for low market price. To
overcome this problem, the Bekasi (200 TPD) plant made
some attempts to increase the value of composting products
by pelletizing its final outputs. According to the plant
manager, by applying this strategy, the demand for its
compost product has been increased, widely from large-
scale plantations across the country.
It was further identified that tipping fee from the gov-
ernment is mainly only received by the large-scale com-
posting plants (the small-scale Matale plant receive it as a
‘‘collection fee’’ because it is more of a community scale).
Furthermore, only the medium composting plant was able
to receive CER benefit. The tipping fee plays a significant
role in the financial sustainability of the Beijing Nangong
(638 TPD) plant and the Bekasi plant (200 TPD) as it
covers the necessary operational cost.
Cost–benefit analysis
Small-scale composting plants
The amount of organic waste received in Rungkut Lor
community-based composting plant, in Surabaya, is 0.6
TPD and it produces 0.1 tonne of compost fertilizer daily.
The capital costs include various organizations subsidized
land acquisition, construction, equipment and other plan-
ning and managerial initial cost of project establishment.
The 190 m2 land of this plant was donated by the univer-
sity and the equipment and building construction costs
were donated by Kitakyushu city government. Monthly
operational costs are 125 USD for the labors and 60 USD
for management. The average Indonesian inflation rate of
12.26 % was incorporated to estimate the annual increase
of operation and maintenance costs. Income sources are
from selling the compost products at a price of 70 USD/
tonne. A realistic price increase of 10 % of organic com-
post fertilizer was assumed. The average Indonesian
interest rate of 8.12 % is incorporated for the NPV
calculation.
NPV result for Rungkut Lor composting plant is 5,941
USD or about 9,902 per ton, BCR is 1.08 and amortization
period can be achieved in the sixth year. It reveals that this
project is feasible and although the achieved margin is very
low, it is still financially profitable.
The Sri Lankan composting plant selected for this study
is located in Matale city with organic waste input capacity
of 1 TPD. This plant produces 0.3 TPD compost and sold at
180 USD per ton at the market. According to the plant
manager, it was able to keep the high price for their
compost products, because the quality of compost is good
and it received a compost quality certification from the
Ministry of Agriculture. Furthermore, the plant has devel-
oped and continues to practice efficient marketing strate-
gies. In addition, the plant receives some other incomes
from selling the recyclables and the collection fee paid by
the served residences and local markets. The investment
costs including a 600 m2 area of land whose leasing price
would have been 3,000 USD for an entire lifetime was
granted by municipal government to the local Non-Gov-
ernmental Organization (NGO) called Sevanatha who is
running the compost project. The building construction
cost of 23,000 USD and the equipment cost of 4,700 USD
were granted by United Nations Economic and Social
Commission for Asia and the Pacific (UNESCAP). The
construction cost is much higher than the simple windrow
plant in the same scale (Surabaya) due to the spending of
additional costs for making brick boxes for compost
treatment. The operational costs include the salary for a
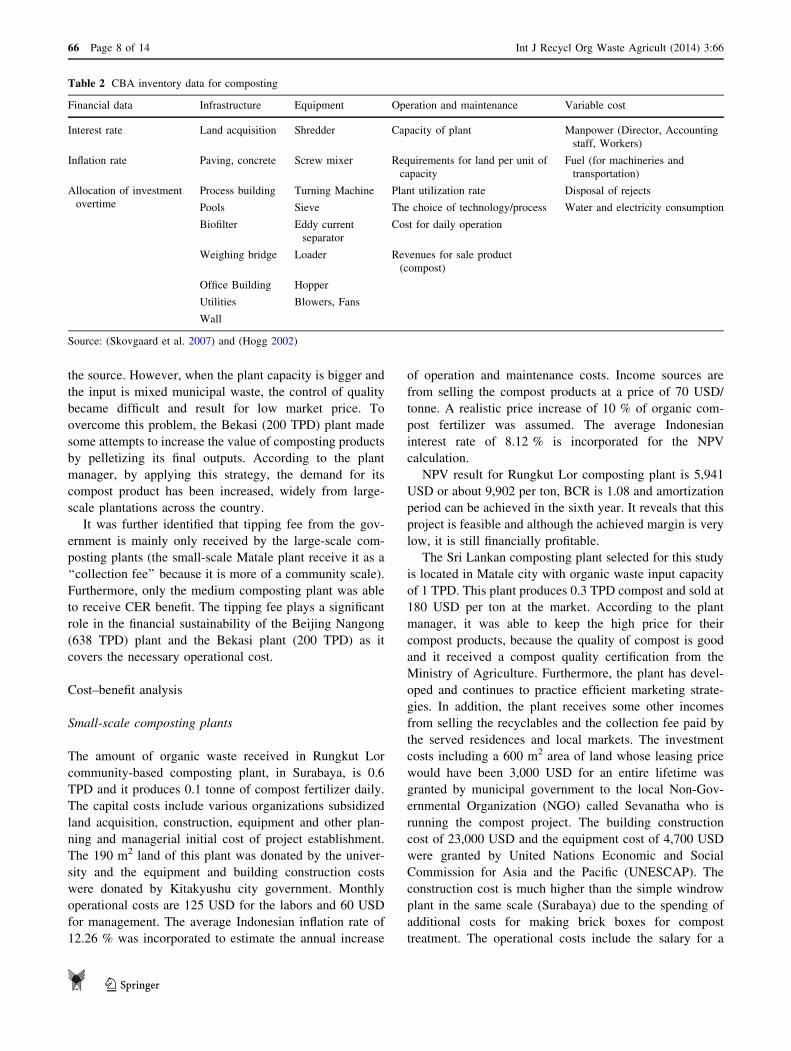
Table 2 CBA inventory data for composting
Financial data Infrastructure Equipment Operation and maintenance Variable cost
Interest rate Land acquisition Shredder Capacity of plant Manpower (Director, Accounting
staff, Workers)
Inflation rate Paving, concrete Screw mixer Requirements for land per unit of
capacity
Fuel (for machineries and
transportation)
Allocation of investment
overtime
Process building Turning Machine Plant utilization rate Disposal of rejects
Pools Sieve The choice of technology/process Water and electricity consumption
Biofilter Eddy current
separator
Cost for daily operation
Weighing bridge Loader Revenues for sale product
(compost)
Office Building Hopper
Utilities Blowers, Fans
Wall
Source: (Skovgaard et al. 2007) and (Hogg 2002)
66 Page 8 of 14 Int J Recycl Org Waste Agricult (2014) 3:66
123
technician (125 USD) and a worker (60 USD). The average
Sri Lankan inflation rate of 10.4 % was incorporated for
the annual cost increase and interest rate of 8.47 % was
employed as the discount rate for the NPV calculation.
Estimated price increase of fertilizer is 10 %. This
assumption is made based on the price increase of various
kinds of fertilizers commonly used in plantations in Sri
Lanka (Gunathilake 2012). NPV result for Matale com-
posting plant is 33,194 USD, BCR is 1.12 and amortization
period can be achieved within a 7-year period. Similar to
the Surabaya case study, this project is also financially
feasible with low-profit margin.
Medium-scale composting plant
The medium-scale composting plant selected for this study
is located in Temesi village, Gianyar regency in Bali. This
plant is registered as CDM project and receiving 60 TPD
manually pre-sorted wastes. Among total waste, about
85 % (51 TPD) is organic waste and uses for composting.
The rest of residuals are disposed of in the nearby final
disposal site. The plant uses the forced aeration technique
and its composting production ratio is 30 % of the inputs.
The final product is sold at 1,000 IDR per kg, or about 106
USD per ton at the retail market when sold in the 20-kg
packages. However, the selling price of the bulk is about 53
USD/ton (Zurbruegg et al. 2012). The project also receives
income from CER of 23 USD per ton CO2-eq up to end of
2012 that decreases yearly by one USD and will stop at 17
USD in year 2018. The project investment costs were
donated by Swiss Development Cooperation (SDC), United
States Agency for International Development (USAID),
Rotary Club Hamburg, Rotary Club Atlanta, Japan Inter-
national Cooperation Agency (JICA), and Bali hoteliers
(Boer et al. 2008; Nakamura et al. 2012). Similar to the
Surabaya case study, the discount rate of 8.12 %, the
inflation rate of 12.26 %, and fertilizer price increase of
10 % were incorporated in the financial calculation. The
results are as follows: a predicted 7,158,681 USD of total
NPV or about 140,336 USD per ton waste treatment
capacity, 3.05 CBR and 3-year amortization period.
Large-scale composting plants
Bantar Gebang composting site in Bekasi, Indonesia, is
treating the waste from the Kramat Jati central market in
Jakarta. The waste contains vegetable, fruits, and straw
fruit baskets. The composting technology used at the plant
is the windrow composting method. Responding to market
demand, output product is pelletized and packed in 60-kg
packages used for agriculture, such as, cassava plantation,
palm oil plantation, and rice farms. The received amount of
market waste is 200 TPD. The final product is 30 TPD of
pelletized compost fertilizer. About 60–70 % of the pro-
ducts is sold at 1,000 Indonesian Rupiah or about 106
USD/tonne. The residue is disposed of in a nearby landfill
or sold by scavengers for plastic recycling. The Jakarta
government pays 11 USD/tonne of waste tipping fee. 20 %
of this fee is paid as land rent fee to the Bekasi city gov-
ernment and the remaining 80 % is used for paying the
plant operators (Pikiran Rakyat 2011). The tipping fee
increases about 5 % annually (Kompas 2010). Costs rela-
ted to transportation, such as, the 4-tonnes capacity trucks
and the truck drivers’ wages, are paid by the cleansing
department. 160 people, who mostly used to work as
scavengers in the nearby landfill, are paid 127 USD per
person. Similar to the other Indonesian composting plants
in this study, the discount rate of 8.12 %, the inflation rate
of 12.26 % and fertilizer price increase of 10 % were
assumed in the financial calculation. Results show that the
NPV of this project is 40,573,301 USD or about 202,867
USD per ton waste treatment capacity. The CBR is 1.77
and amortization period may be reached on the 6th year of
the production lifetime. It reviews that the project is esti-
mated to be profitable.
Beijing Nangong composting plant receives 638 TPD of
municipal waste, in which 172.6 TPD is used as landfill
cover soil and 465.4 TPD is processed into compost fer-
tilizer using tunnel-composting systems with forced aera-
tion technology. The sellable product is 65.7 TPD.
Depending on the quality, price ranges from 7.8 to 12.6
USD/tonne. The remainder is given to farmers with no
charge. The government of Beijing granted a land area of
66,000 m2. The investment cost for machinery, equipment
and building was 26.6 million USD or about 72,282 per ton
waste treatment capacity. The government of Beijing
subsidizes the operation and maintenance cost, which
equals to 15.86 USD per ton waste treated as the tipping
fee. For the annual operation and maintenance cost calcu-
lation, the applied China inflation rate is 4.3 % and the
discount rate applied for NPV calculation is 6.5 %. The
municipal waste compost fertilizer price increase is
assumed to be 10 %.
The total NPV result of Nangong composting plant is -
294 million USD or about -545,538 per ton waste treat-
ment capacity, CBR is 0.77 and amortization time cannot
be achieved in the 15 years assumed lifetime. The results
imply that the project is not financially profitable. Addi-
tional cost arising in a large-scale composting plant is the
transportation cost. However, Nangong composting plant
does not bear this cost because it is borne by the govern-
ment-appointed Transportation Company.
Table 3 summarizes the investment cost, annual opera-
tion and maintenance cost, and NPV for per ton capacity,
BCR and the amortization period of the above-described
plants.
Int J Recycl Org Waste Agricult (2014) 3:66 Page 9 of 14 66
123

Estimated amortization time was calculated by the
estimated cumulated cash flow. The year when cash flow
cumulative becomes positive is the year when pay back is
achieved. Table 4 summarizes the cumulative cash flow of
each plant per ton waste treatment capacity.
NPV, CBR and amortization time
In the four smaller plant capacities, NPV seemed to increase,
but it becomes extremely unprofitable in the gigantic 638
TPD plant. Furthermore, the CBR and amortization time
results from the different capacities of composting plant in
this study showed an interesting trend; they get better as it
approaches the medium scale and worsen off as the capacity
moves away from the medium scale (see Table 3). This
finding indicates that the medium-scale composting plant
may have the best financial performance.
Sensitivity analysis
Because all of the composting plants presented in this study
received some support either from the government, uni-
versity, NGO or other institution and organization, four
pessimistic scenarios were constructed in this study to see
how the plants would perform under the absence of these
financial supports. The first scenario is the absence of the
tipping fee, the second scenario is the absence of the initial
cost including land and machineries, the third scenario is
the absence of CER benefit, and the fourth scenario is the
absence of all external supports (tipping fee, the initial cost,
and CER) in all plants. The list of assumptions is shown in
Table 4 and the accumulated cash flow of business of usual
under ideal situation is shown in Table 5.
In the first pessimistic scenario, where tipping fee was
absent (but the other income such as CER and land and
initial costs in the business as usual), the 1 TPD, 200 TPD,
and 638 TPD plants suffered the most. Collection fee in a
small-scale Matale plant of 3,960 USD/year is quite sig-
nificant in proportion to the expenditures; the large-scale
Bekasi plant receives a large amount of 3,679,820 USD
tipping fee per year; and in large-scale Nangong plant the
tipping fee is almost equivalent to the whole operation and
maintenance cost. Without tipping fee, a 3-year delay of
payback time in the Bekasi plant would be expected. The
Matale and Nangong plant would be financially unsus-
tainable (Table 6).
In the second pessimistic scenario, where initial fee was
set to absent (another income in the business as usual), the
payback time in the 0.6 TPD Surabaya plant would not be
achievable within the 15 years assumed life time, a sig-
nificant 9-year delay of payback time in the 1 TPD Matale
plant was to be expected, and several years of payback time
delay would be expected for both the medium- and large-
scale composting plants in Indonesia. Initial fee mainly
includes of land and machineries. In addition to the first
2,200 operational cost, the initial machinery and land cost
Table 3 Tables of investment, cost, benefit, NPV, BCR, and amortization in USD
Plant name Rungkut Lora Mataleb Temesic Bantar Gebangd Nangonge
Plant capacity (TPD) 0.6 1 51 200 638
USD/Ton waste treatment capacity
Investment cost 3,700 21,300 3,729 10,859 72,282
1st year operation and maintenance cost 3,700 21,300 3,729 10,705 10,330
NPV 9,902 33,194 140,366 202,867 -545,538
BCR 1.08 1.12 3.05 1.77 0.77
Amortization period 6 years 7 years 3 years 6 years Never
Investment cost granted by local university and Kitakyushu city government. Conversion rate 1 USD = 9,433 IDRa Source: KITA, Kitakyushu International Techno-cooperative Associationb Land is leased from the municipal government by Sevantha NGO. Conversion rate 1 USD = 115 LKRc Sources: (Zurbruegg et al. 2012), (Kueper 2012). Investment costs were donated by SDC, USAID, Rotary Club Hamburg, Rotary Club Atlanta,
JICA, and Bali hoteliers. Conversion rate 1 USD = 9,433 IDRd Source: Managing director of Bantar Gebang integrated disposal site, Lumban Toruan. Land, which is owned by Bekasi city government, is
leased to Jakarta provincial government. Lease fee is 20 % of the tipping fee. 80 % of the tipping fee goes to plant operators (PT Godang Tua
Jaya and PT Navigat Organic Energy Indonesia)e Source: Zheng 2012. Land was granted by the government of Beijing
Table 4 Details of pessimistic scenarios
Pessimistic scenario Absence of
1 Tipping fee
2 Initial cost (land and machineries)
3 CER
4 Tipping fee, initial cost, and CER
66 Page 10 of 14 Int J Recycl Org Waste Agricult (2014) 3:66
123
in the Surabaya plant is 19,400 USD. This cost is too
expensive for the plant to sustain itself financially. Under
the assumption that the land for the 200 TPD Bekasi plant
had to be purchased, it would have required an extra
3,180,324 USD to the first cash outflow because based on a
local survey, land price in Bantar Gebang Bekasi is about
53 USD/m2. Bantar Gebang composting area occupies
20,000 m2 out of the 110-ha waste management area. The
land of Temesi plant is 4,700 m2 and a local survey
revealed that the land price in Temesi, Gianyar is 84 USD/m2.
Based on this, an additional 398,600 USD was added to the
pessimistic scenario of the medium plant (Table 7).
In the third scenario, where CER was eliminated (but
another income is in the business as usual), the medium-
scale Temesi plant would have several years of payback
time delay. Note that the assumed lifetime is for 15 years
while the CER income is only scheduled until the 11th
year. If machinery and spare-parts need to be repurchased
before the assumed 15 years lifetime; the delay would have
been more significant (Table 8).
In the fourth pessimistic scenario, tipping fee, the initial
investment, and CER were eliminated. In this scenario, all
plants financially suffer quite significantly. Three out of the
plants would never achieve payback time within the
assumed 15-year lifetime. The medium-scale Temesi plant
payback would be delayed to the 10th year, and the large-
scale Bekasi plant payback would be delayed to the 11th
year (Table 9).
Conclusions and recommendations
This study made attempts to investigate the optimum range
of municipal waste composting in developing Asian
countries. Site visits, interview with plant managers, and
data provided by the relevant organizations ensured the
authenticity of data used in this study.
The results revealed that the medium-scale (51 TPD)
and lower large-scale (200 TPD) composting plants have a
better opportunity to be financially sustainable. The waste
input and product quality of these plants are more
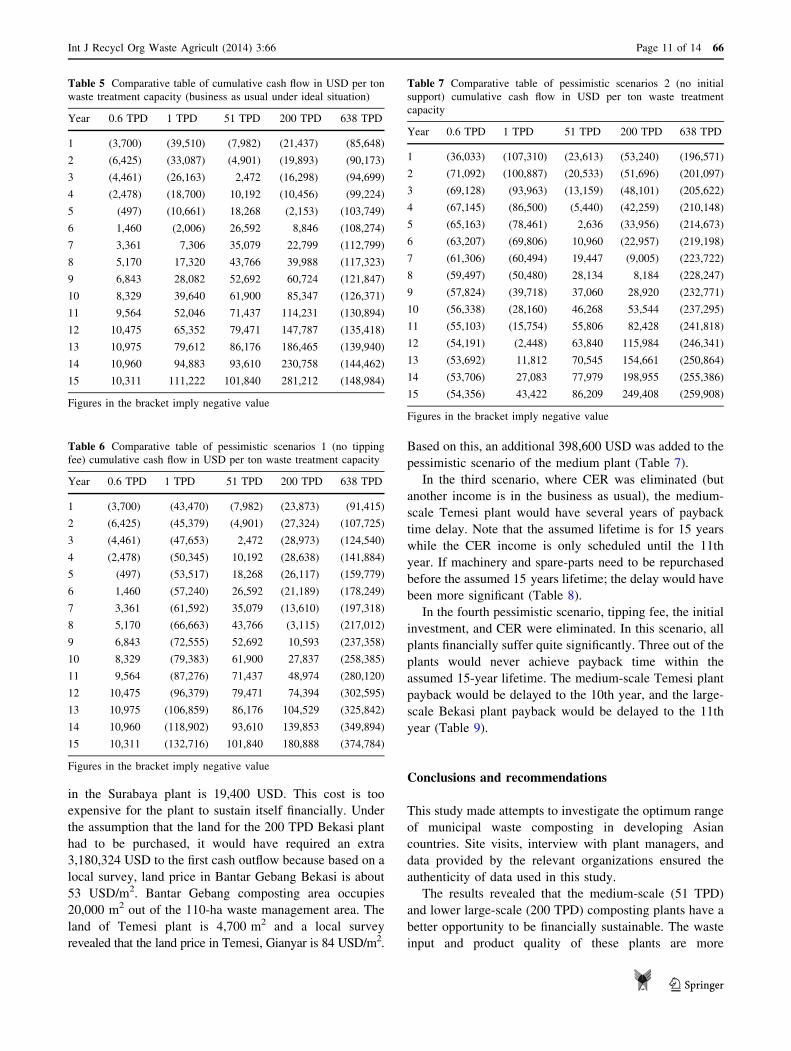
Table 5 Comparative table of cumulative cash flow in USD per ton
waste treatment capacity (business as usual under ideal situation)
Year 0.6 TPD 1 TPD 51 TPD 200 TPD 638 TPD
1 (3,700) (39,510) (7,982) (21,437) (85,648)
2 (6,425) (33,087) (4,901) (19,893) (90,173)
3 (4,461) (26,163) 2,472 (16,298) (94,699)
4 (2,478) (18,700) 10,192 (10,456) (99,224)
5 (497) (10,661) 18,268 (2,153) (103,749)
6 1,460 (2,006) 26,592 8,846 (108,274)
7 3,361 7,306 35,079 22,799 (112,799)
8 5,170 17,320 43,766 39,988 (117,323)
9 6,843 28,082 52,692 60,724 (121,847)
10 8,329 39,640 61,900 85,347 (126,371)
11 9,564 52,046 71,437 114,231 (130,894)
12 10,475 65,352 79,471 147,787 (135,418)
13 10,975 79,612 86,176 186,465 (139,940)
14 10,960 94,883 93,610 230,758 (144,462)
15 10,311 111,222 101,840 281,212 (148,984)
Figures in the bracket imply negative value
Table 6 Comparative table of pessimistic scenarios 1 (no tipping
fee) cumulative cash flow in USD per ton waste treatment capacity
Year 0.6 TPD 1 TPD 51 TPD 200 TPD 638 TPD
1 (3,700) (43,470) (7,982) (23,873) (91,415)
2 (6,425) (45,379) (4,901) (27,324) (107,725)
3 (4,461) (47,653) 2,472 (28,973) (124,540)
4 (2,478) (50,345) 10,192 (28,638) (141,884)
5 (497) (53,517) 18,268 (26,117) (159,779)
6 1,460 (57,240) 26,592 (21,189) (178,249)
7 3,361 (61,592) 35,079 (13,610) (197,318)
8 5,170 (66,663) 43,766 (3,115) (217,012)
9 6,843 (72,555) 52,692 10,593 (237,358)
10 8,329 (79,383) 61,900 27,837 (258,385)
11 9,564 (87,276) 71,437 48,974 (280,120)
12 10,475 (96,379) 79,471 74,394 (302,595)
13 10,975 (106,859) 86,176 104,529 (325,842)
14 10,960 (118,902) 93,610 139,853 (349,894)
15 10,311 (132,716) 101,840 180,888 (374,784)
Figures in the bracket imply negative value
Table 7 Comparative table of pessimistic scenarios 2 (no initial
support) cumulative cash flow in USD per ton waste treatment
capacity
Year 0.6 TPD 1 TPD 51 TPD 200 TPD 638 TPD
1 (36,033) (107,310) (23,613) (53,240) (196,571)
2 (71,092) (100,887) (20,533) (51,696) (201,097)
3 (69,128) (93,963) (13,159) (48,101) (205,622)
4 (67,145) (86,500) (5,440) (42,259) (210,148)
5 (65,163) (78,461) 2,636 (33,956) (214,673)
6 (63,207) (69,806) 10,960 (22,957) (219,198)
7 (61,306) (60,494) 19,447 (9,005) (223,722)
8 (59,497) (50,480) 28,134 8,184 (228,247)
9 (57,824) (39,718) 37,060 28,920 (232,771)
10 (56,338) (28,160) 46,268 53,544 (237,295)
11 (55,103) (15,754) 55,806 82,428 (241,818)
12 (54,191) (2,448) 63,840 115,984 (246,341)
13 (53,692) 11,812 70,545 154,661 (250,864)
14 (53,706) 27,083 77,979 198,955 (255,386)
15 (54,356) 43,422 86,209 249,408 (259,908)
Figures in the bracket imply negative value
Int J Recycl Org Waste Agricult (2014) 3:66 Page 11 of 14 66
123

controllable than larger scale composting plants. They can
also earn extra income from tipping fees and CER that is
hardly possible to get in the small-scale plants. The com-
post quality can be enhanced by manually separating
organic waste in Bali plant or by pelletizing the waste in
Bekasi plant that results in increasing the market accep-
tance of their products. Another successful strategy adop-
ted was the agreement between Bantar Gebang plant and
the Department of Agriculture, where a significant amount
of the products is utilized in plantations. The role of gov-
ernment and institutions, such as, providing investment
cost of the small-scale composting plant and providing
tipping fee for large-scale composting plants, is significant
in determining the economic feasibility of the plants.
Awareness of these successful strategies may contribute to
the improvement of composting plant economic
performance.
Further studies
Although this study has identified the general economic
performance estimation on different scales of composting
plants, more detailed study dedicated to comparing the
nutrient and heavy metals contained in the product of dif-
ferent-scale composting plant would be useful for the
product-oriented practitioners. Further discussion on tech-
niques, schemes, and design of efficient policy to encour-
age organic waste source separation would benefit many
growing cities struggling with the increasing volume and
waste composition diversity.
Moreover, benefits of composting such as waste volume
reduction, benefits related to soil rehabilitation from man-
made chemical contamination, and social impact such as
improvement of environmental awareness due to commu-
nity engagement and number of employment created from
composting would be important to be analyzed. Holistic
and comprehensive understanding of the benefits in various
aspects may attract better supports from stakeholders and
policy makers.
Acknowledgments The authors thank the composting plant man-
agers, institutions, and national municipal waste management con-
sultants who have generously contributed data and information for
this research.
Conflict of interest The authors declare that there is no competing
interest.
Open Access This article is distributed under the terms of the
Creative Commons Attribution License which permits any use, dis-
tribution, and reproduction in any medium, provided the original
author(s) and the source are credited.
References
Ali G, Vilas N, Abbas S, Sabir M (2012) Green waste to biogas:
renewable energy possibilities for Thailand’s green markets.
Renew Sustain Energy Rev 16:5423–5429
Ambulkar A, Shekdar A (2004) Prospects of biomethanation
technology in the Indian context: a pragmatic approach. Resour
Conserv Recycl 40:111–128
Asian Development Bank (ADB) (2011) Towards sustainable
municipal organic waste management in South Asia: a guide
for policy makers and practitioners. ADB, Manila
Table 8 Comparative table of pessimistic scenarios 3 (no CER)
cumulative cash flow in USD per ton waste treatment capacity
Year 0.6 TPD 1 TPD 51 TPD 200 TPD 638 TPD
1 (3,700) (39,510) (9,335) (21,437) (85,648)
2 (6,425) (33,087) (10,313) (19,893) (90,173)
3 (4,461) (26,163) (8,351) (16,298) (94,699)
4 (2,478) (18,700) (6,044) (10,456) (99,224)
5 (497) (10,661) (3,379) (2,153) (103,749)
6 1,460 (2,006) (350) 8,846 (108,274)
7 3,361 7,306 3,079 22,799 (112,799)
8 5,170 17,320 6,942 39,988 (117,323)
9 6,843 28,082 11,280 60,724 (121,847)
10 8,329 39,640 16,135 85,347 (126,371)
11 9,564 52,046 21,555 114,231 (130,894)
12 10,475 65,352 27,589 147,787 (135,418)
13 10,975 79,612 34,294 186,465 (139,940)
14 10,960 94,883 41,728 230,758 (144,462)
15 10,311 111,222 49,958 281,212 (148,984)
Figures in the bracket imply negative value
Table 9 Comparative table of pessimistic scenario 4 (no tipping fee,
no initial support, no CER) cumulative cash flow in USD per ton
waste treatment capacity
Year 0.6 TPD 1 TPD 51 TPD 200 TPD 638 TPD
1 (36,033) (111,270) (24,966) (55,676) (202,339)
2 (71,092) (113,179) (25,945) (59,127) (218,648)
3 (69,128) (115,453) (23,983) (60,776) (235,464)
4 (67,145) (118,145) (21,675) (60,441) (252,808)
5 (65,163) (121,317) (19,011) (57,920) (270,703)
6 (63,207) (125,040) (15,981) (52,992) (289,172)
7 (61,306) (129,392) (12,553) (45,414) (308,242)
8 (59,497) (134,463) (8,689) (34,918) (327,936)
9 (57,824) (140,355) (4,352) (21,210) (348,282)
10 (56,338) (147,183) 504 (3,966) (369,308)
11 (55,103) (155,076) 5,923 17,170 (391,044)
12 (54,191) (164,179) 11,958 42,591 (413,519)
13 (53,692) (174,659) 18,662 72,726 (436,766)
14 (53,706) (186,702) 26,097 108,050 (460,817)
15 (54,356) (200,516) 34,326 149,085 (485,708)
Figures in the bracket imply negative value
66 Page 12 of 14 Int J Recycl Org Waste Agricult (2014) 3:66
123
Aye L, Widjaya E (2006) Environmental and economic analyses of
waste disposal options for traditional markets in Indonesia.
Waste Manag 26:1180–1191
Bhatia R (1977) Economic Appraisal of Bio-Gas Units in India:
framework for social benefit cost analysis. Econ Polit Wkly
12:33–34
Boer R, Dewi R, Ismawati Y, Anggraini S (2008) Country: Indonesia.
Financing local low carbon development. http://dp2m.umm.ac.
id/files/file/financinglocallowcarbondevelopment_indonesia.pdf.
Accessed 7 Jan 2012
Brinton WF (2000) Compost quality standards and Guidelines.
Woods and research laboratory: http://compost.css.cornell.edu/
Brinton.pdf. Accessed 23 Apr 2014
Christianto (2005) Teknik pengomposan metode open windrow.
Pusdakota Ubaya: http://nusataniterpadu.files.wordpress.com/
2009/08/isi-buku.pdf. Accessed 02 Apr 2014
Demir A, Arisoy M (2007) Biological and chemical removal of
Cr(VI) from waste water: cost and benefit analysis. J Hazard
Mater 147:275–280
Eawag Sandec (2008) Sandec Training Tool 1.0—module 4. Water
and sanitation in developing countries. http://www.sswm.info/
sites/default/files/reference_attachments/EAWAG%20SAN
DEC%202008%20Module%204%20Sanitation%20Systems%
20and%20Technologies%20-%20Presentation.pdf. Accessed 11
Jan 2012
Fenhann J (2012) CDM Pipeline Overview. UNEP Risoe Centre:
http://www.cdmpipeline.org/. Accessed 7 Sep 2012
Finnveden G, Bjoerklund A, Moberg A, Ekvall T (2007) Environ-
mental and economic assessment methods for waste manage-
ment decision-support: possibilities and limitations. Waste
Manag Res 25(3):263–269
Gunathilake HAJ (2012) Fertilizer usage for coconut and intercrops in
Sri Lanka. Advance agricultural practice: http://www.advancea
griculturalpractice.in/w/images/3/37/Fertilizer_usage_for_Coco
nut_and_Intercrops_in_Sri_Lanka.pdf. Accessed 7 Nov 2012
Haaren R (2009) Large scale aerobic composting of source-separated
organic wastes: a comparative study of environmental impacts,
costs, and contextual effects. Foundation of Engineering and
Applied Science, Earth and Environmental Engineering. Colum-
bia University, New York
Hargreaves JC, Adl MS, Warman PR (2008) A review of the use of
composted municipal solid waste in agriculture. Agric Ecosyst
Environ 123:1–14
Hogg D (2002) Costs for municipal waste management in the EU.
Eunomia Research and Consulting. European Commission,
Brussels
Hoornweg D, Bhada-Tata P (2012) What a waste: a global review of
solid waste management. World Bank, Washington DC
International Institute for Sustainable Development (2012) A Citi-
zens’ guide to energy subsidies in Indonesia. http://www.iisd.
org/gsi/sites/default/files/indonesia_czguide_eng.pdf. Accessed
13 July 2012
Jayaratne KA (2009) Eco-efficient and sustainable urban infrastruc-
ture in Asia and Latin America. Expert Group Meeting. http://
www.cepal.org/dmaah/noticias/paginas/3/35703/session-8-
matale.pdf. Accessed 23 Apr 2014
Jayaratne KA (2013) Partnerships for sustainable municipal solid
waste management system: Integrated Resource Recovery
Center Program in Sri Lanka. Presentation made at National
Workshop on Compost MSW. Sri Lanka, IRRC, 2013
Kueper D (2012) Temesi business plan, for the Gianyar Waste
Recovery Project. http://www.temesirecycling.org/download/
new/Temesi%20Business%20Plan.pdf. Accessed 7 Oct 2012
Kompas (2010) Megapolitan. News. http://nasional.kompas.com/
read/2010/07/01/19062770/wah.tipping.fee.bantar.gebang.5665.
juta. Accessed 7 Dec 2011
Mazumdar N (2012) India country situation report on municipal solid
waste management and composting submitted Institute of Global
Environmental Strategies (IGES). IGES, Kitakyushu
Menikpura S, Gheewala S, Bonnet S (2012) Framework for life cycle
sustainability assessment of municipal solid waste management
systems with an application to a case study in Thailand. Waste
Manag Res 0:1–12
Mishan EJ (1972) Cost–benefit analysis. George Allen & Unwin,
London
Nakamura H et al. (2012) Carbon finance for low-carbon community
development. Institute for Global Environmental Strategies:
EnviroScope: http://enviroscope.iges.or.jp/modules/envirolib/
upload/2645/attach/iges%20carbon%20finance%20report%
20final%20p.pdf. Accessed 7 Nov 2012
Ngoc UN, Schnitzer H (2009) Sustainable solutions for solid waste
management in Southeast Asian countries. Waste Manag
29(6):1982–1995
Ong LL (1997) Burgernomics: the economics of the Big Mac
standard. J Int Money Financ 16:865–878
Pandyaswargo AH, Onoda H, Nagata K (2012) Energy recovery
potential and life cycle impact assessment of municipal solid
waste management technologies in Asian countries using ELP
model. Int J Energy Environ Eng 3:28
Pikiran Rakyat (2011) Pikiran Rakyat Online: http://www.pikiran-
rakyat.com/node/139760. Accessed 7 Dec 2012
Premakumara DGJ, Abe M, Maeda T (2011) Reducing municipal
waste through promoting integrated sustainable waste manage-
ment (ISWM) practices in Surabaya City, Indonesia, ecology and
waste management, vol 144. WIT Press, UK, pp 457–470
Pusdakota (2014) Pusdakota: http://gtps.ampl.or.id/index2.php?op
tion=com_content&do_pdf=1&id=68. Accessed 02 Apr 2014
Rand T, Hankohl J, Marxen U (2000) Municipal solid waste
incineration: a decision maker’s guide. World Bank, Washington
DC
Reich CM (2005) Economic assessment of municipal waste manage-
ment systems—case studies using a combination of life cycle
assessment (LCA) and life cycle costing (LCC). J Clean Prod
13:253–263
Sang-Arun J, Bengtsson M, Mori H (2009) Practical guide for
improved organic waste management. Institute of Global
Environmental Strategies (IGES), Hayama
Skovgaard M, Karin I, Tomas E (2007) Nordic guideline for cost–
benefit analysis in waste management. Nordic cooperation.
Nordic Council of Ministers, Denmark
Soeylemez M (2000) On the optimum heat exchanger sizing for heat
recovery. Energy Convers Manag 41:1419–1427
The Economist (2014) The Big mac Index, full data-set. The
Economist: http://media.economist.com/sites/default/files/
media/2014InfoG/databank/BMfile2000-Jan2014.xls. Accessed
23 Apr 2014
Trading Economics Interest rate by country (2012) Trading econom-
ics: http://www.tradingeconomics.com/interest-rates-list-by-
country. Accessed 07 Apr 2012
UNEP (2009) Developing integrated solid waste management plan:
training manual. Assessment of current waste management
system and gaps therein. International Environmental Technol-
ogy Centre, Division of Technology, Industry and Economics,
vol 2, UNEP, Osaka
UN ESCAP (United Nations Economic and Social Commission for
Asia and the Pacific), Waste Concern and Sevanatha Urban
Resource Center (2010) Resource recovery options baseline
survey. waste2resource.org: http://waste2resource.org/wp-con
tent/uploads/2014/03/Matale-Baseline.pdf. Accessed 23 Apr
2014
Williams PT (2005) Waste treatment and disposal. Wiley, West
Sussex
Int J Recycl Org Waste Agricult (2014) 3:66 Page 13 of 14 66
123

Yenneti K, Premakumara DGJ (2011) Carbon finance and decentra-
lised composting projects. Institute for Global Environmental
Strategies (IGES), Kitakyushu
Zheng G (2012) China National Overview/Country Situation Report
On municipal solid waste management and composting submit-
ted Institute of Global Environmental Strategies (IGES). IGES,
Kitakyushu
Zurbruegg C, Drescher S, Patel A, Sharatchandra HC (2004)
Decentralised composting of urban waste—an overview of
community and private initiatives in Indian cities. Waste
management 24:655–662
Zurbruegg C, Gfrerer M, Ashadi H, Werener B, David K (2012)
Determinants of sustainability in solid waste management—the
Gianyar waste recovery project in Indonesia. Waste Manag
32:2126–2133
66 Page 14 of 14 Int J Recycl Org Waste Agricult (2014) 3:66
123