Financial Summary Results of FY2015 & Outlook for FY2016€¦ · -Healthcare: Demand for ophthalmic...
38
Copyright © 2016 Mitsui Chemicals, Inc. Mitsui Chemicals, Inc. Financial Summary <Remarks> FY2015 indicates the period from April 1, 2015 to March 31, 2016. May 13, 2016 Results of FY2015 & Outlook for FY2016
Transcript of Financial Summary Results of FY2015 & Outlook for FY2016€¦ · -Healthcare: Demand for ophthalmic...

Copyright © 2016 Mitsui Chemicals, Inc.
Mitsui Chemicals, Inc.
Financial Summary
<Remarks>FY2015 indicates the period from April 1, 2015 to March 31, 2016.
May 13, 2016
Results of FY2015 & Outlook for FY2016

Copyright © 2016 Mitsui Chemicals, Inc.
Contents
Please note that this document has been translated from the original Japanese into English for the convenience of our stakeholders. The information was originally provided in Japanese. If there is any discrepancy, the Japanese language version is the official document and is available on our Japanese language website.
1. Results of FY2015 (April 1, 2015 – March 31, 2016)
1) Review of FY2015 (Business Overview and 4th Quarter Topics) ・・・ 1、2
2) Consolidated Financial Highlights ・・・ 3、4 3) Sales and Operating Income/Loss by Business Segment (compared with corresponding period of FY2014) ・・・ 5
4) Non-Operating Income and Expenses, and Extraordinary Gains and Losses ・・・ 6
5) Consolidated Balance Sheet ・・・ 7
6) Consolidated Statement of Cash Flow ・・・ 8
2. Outlook for FY2016 (April 1, 2016 – March 31, 2017)
1) Topics of FY2016 ・・・ 9
2) Consolidated Financial Highlights of Outlook ・・・10 3) Sales and Operating Income/Loss by Business Segment (compared with FY2015 results) ・・・11
4) Transition of Operating Income (FY2014 → FY2015 → FY2016 outlook) ・・・12
5) Trends of Business Segment ・・・13、14
6) Non-Operating Income and Expenses, and Extraordinary Gains and Losses ・・・15
7) Consolidated Statement of Cash Flow ・・・16
8) Consolidated Accounting Fundamentals ・・・17
3. Appendix ・・・18〜31

Copyright © 2016 Mitsui Chemicals, Inc.
1. Results of FY2015(April 1, 2015 – March 31, 2016)

Copyright © 2016 Mitsui Chemicals, Inc.1
<Business Overview>
1) Review of FY2015 (Business Overview and 4th Quarter Topics)
- Mobility: Strong demand for elastomers and PP compounds continued overseas.Healthy demand for functional polymers continued, especially in electronic and information applications.
- Healthcare: Demand for ophthalmic lens materials and nonwoven fabrics was good due to expanding overseas market.
- Food & Packaging: Healthy demand for high-value–added performance films and sheets continued and sales for new products were good.Healthy domestic and overseas sales in agrochemicals.
- Healthy demand for domestic petrochemicals.Operating rates for domestic petrochemicals remained at a high level.
- Business restructuring and cost cutting progressed as scheduled in bulk & commodity products.
- Overseas conditions for polyurethane materials continued to be severe.- Weak market conditions for phenol due to competitor plant start-ups, etc. Sourcing
issue of raw materials occurred in Singapore at end of FY2015.
1.Results of FY2015

Copyright © 2016 Mitsui Chemicals, Inc.2
<Topics in 4th Quarter>
1) Review of FY2015 (Business Overview and 4th Quarter Topics)
- Mitsui Chemicals Agro, Inc. acquires additional shares of Sotus International Co., Ltd. in Thailand (January 2016)
- Commercial operations of new bio-polyol facilities in India(8,000 tons/annum, January 2016)
- Commercial operations at world's first large scale XDI plant at Omuta Works in Japan (5,000 tons/annum, March 2016)
- Mitsui Chemicals Agro, Inc. launches new fungicide for paddy rice which contains new active ingredient Tolprocarb (March 2016)
- Termination of TDI plant at Kashima Works in Japan(117,000 tons/annum, March 2016)
1.Results of FY2015
Copyright © 2016 Mitsui Chemicals, Inc.3
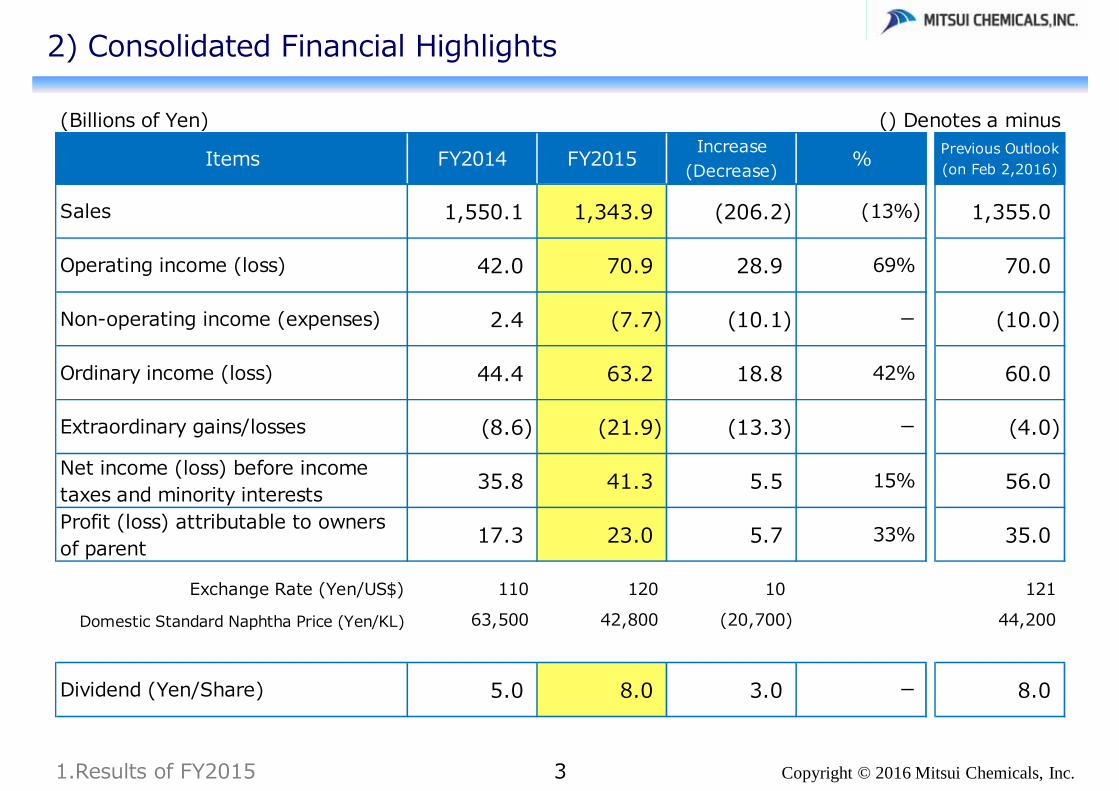
2) Consolidated Financial Highlights
(Billions of Yen) () Denotes a minus
FY2014 FY2015 Increase(Decrease) % Previous Outlook
(on Feb 2,2016)
1,550.1 1,343.9 (206.2) (13%) 1,355.0
42.0 70.9 28.9 69% 70.0
2.4 (7.7) (10.1) ー (10.0)
44.4 63.2 18.8 42% 60.0
(8.6) (21.9) (13.3) ー (4.0)
35.8 41.3 5.5 15% 56.0
17.3 23.0 5.7 33% 35.0
Exchange Rate (Yen/US$) 110 120 10 121
Domestic Standard Naphtha Price (Yen/KL) 63,500 42,800 (20,700) 44,200
5.0 8.0 3.0 ー 8.0
Items
Sales
Operating income (loss)
Non-operating income (expenses)
Ordinary income (loss)
Extraordinary gains/losses
Net income (loss) before incometaxes and minority interestsProfit (loss) attributable to ownersof parent
Dividend (Yen/Share)
1.Results of FY2015

Copyright © 2016 Mitsui Chemicals, Inc.4
2) Consolidated Financial Highlights
(Billions of Yen) () Denotes a minusEnd ofFY2014
End ofFY2015
Increase(Decrease) %
548.7 473.0 (75.7) (14%)
496.7 393.4 (103.3) (21%)
406.2 381.9 (24.3) (6%)
1.22 1.03 (0.19) ー
28.8 30.3 1.5 ー
(Number of companies)
FY2014 FY2015 Increase(Decrease)
Consolidated subsidiaries 100 95 (5)
137 131 (6)
Items
Interest-bearing liabilities
Interest-bearing liabilities (net)
Total
Non-consolidated subsidiaries and affiliates towhich the equity method is applied
Equity
Net D/E Ratio (Times)
Equity Ratio (%)
37 36 (1)
Items
Consolidated companies
1.Results of FY2015

Copyright © 2016 Mitsui Chemicals, Inc.5
3) Sales and Operating Income/Loss by Business Segment(compared with corresponding period of FY2014)
(Billions of Yen) () Denotes a minus
FY2014 FY2015 Incr.(Decr.) FY2014 FY2015 Incr.
(Decr.) Volume Price * Costs
Healthcare 138.2 151.3 13.1 9.1 10.7 1.6 2.1 1.3 (1.8)
Functional PolymericMaterials 174.5 167.5 (7.0) 18.7 26.2 7.5 0.6 7.6 (0.7)
Polyurethane 154.8 112.2 (42.6) (3.5) (8.5) (5.0) (0.6) (5.0) 0.6
Basic Chemicals 330.8 251.2 (79.6) (7.9) (3.7) 4.2 (0.6) 3.0 1.8
Petrochemicals 584.4 491.3 (93.1) 21.6 39.3 17.7 3.0 13.2 1.5
Food & Packaging 129.2 131.9 2.7 9.1 13.9 4.8 2.1 2.5 0.2
Others 38.2 38.5 0.3 (5.1) (7.0) (1.9) - - (1.9)
Total 1,550.1 1,343.9 (206.2) 42.0 70.9 28.9 6.6 22.6 (0.3)
* Price : Terms of trade, including both sales price and purchase price.
BreakdownSegment
Sales Operating Income/Loss
1.Results of FY2015

Copyright © 2016 Mitsui Chemicals, Inc.6
4) Non-Operating Income and Expenses, and Extraordinary Gains and Losses
(Billions of Yen) () Denotes a minus
FY2014 FY2015 Incr.(Decr.)
Equity in earnings of non-consolidated subsidiaries and affiliates (0.1) (2.2) (2.1)Interest expenses, interest and dividend income (2.3) (2.6) (0.3)Gain (loss) on foreign exchange 5.2 (1.9) (7.1)Others (0.4) (1.0) (0.6)Non-Operating Income and Expenses Total 2.4 (7.7) (10.1)
(Billions of Yen) () Denotes a minus
FY2014 FY2015 Incr.(Decr.)
Gains on sales of fixed assets 2.3 5.1 2.8Gains on transfer of business ー 3.7 3.7Extraordinary gains (a) 2.3 8.8 6.5Loss on sales and disposal of fixed assets (4.5) (5.6) (1.1)Impairment loss (5.3) (24.1) (18.8)Loss on restructuring of subsidiaries and affiliates ー (1.0) (1.0)Others (1.1) ー 1.1Extraordinary losses (b) (10.9) (30.7) (19.8)
Extraordinary gains and losses Total (a)+(b) (8.6) (21.9) (13.3)
Items
Items
Non-Operating Income and Expenses
Extraordinary Gains and Losses
1.Results of FY2015

Copyright © 2016 Mitsui Chemicals, Inc.7
5) Consolidated Balance Sheet
(Billions of Yen) () Denotes a minus
Current Assets 731.7 628.2 (103.5) Liabilities 940.5 815.7 (124.8)
Cash and deposits 52.0 79.6 27.6 Notes andaccounts payables 164.2 118.3 (45.9)
Notes andaccounts receivables 299.1 245.3 (53.8) Interest-bearing
liabilities 548.7 473.0 (75.7)
Inventories 291.3 240.7 (50.6) Other liabilities 227.6 224.4 (3.2)
Other current assets 89.3 62.6 (26.7)
Fixed Assets 680.1 630.7 (49.4) Net assets 471.3 443.2 (28.1)
Tangible and intangiblefixed assets 506.4 453.6 (52.8) Shareholders' equity 367.1 382.4 15.3
[Intangible fixed assets] [ 72.8 ] [ 40.2 ] [ (32.6) ] Other accumulatedcomprehensive income 39.1 (0.5) (39.6)
Investments andother non-current assets 173.7 177.1 3.4 Non-controlling interests 65.1 61.3 (3.8)
Total 1,411.8 1,258.9 (152.9) Total 1,411.8 1,258.9 (152.9)
Incr.(Decr.)Items End of
Mar. 2015End of
Mar. 2016Incr.
(Decr.) Items End ofMar. 2015
End ofMar. 2016
1.Results of FY2015

Copyright © 2016 Mitsui Chemicals, Inc.8
6) Consolidated Statement of Cash Flow
(Billions of Yen) () Denotes a minus
FY2014 FY2015 Incr.(Decr.)
Ⅰ.Cash flows from operating activities (a) 58.3 145.9 87.6
Ⅱ.Cash flows from investing activities (b) (35.0) (36.4) (1.4)
Free cash flows (a)+(b) 23.3 109.5 86.2
Ⅲ.Cash flows from financing activities (46.6) (79.0) (32.4)
Ⅳ.Others 2.7 (2.9) (5.6)
Net incr.(decr.) in cash and cash equivalents (20.6) 27.6 48.2
Items
1.Results of FY2015

Copyright © 2016 Mitsui Chemicals, Inc.
2. Outlook for FY2016(April 1, 2016 – March 31, 2017)
This summary contains forward-looking statements about the future plans, strategies, belief and performance of the Mitsui Chemicals Group as a whole and its individual consolidated companies. These forward-looking statements are not historical facts. They are expectations, estimates, forecasts and projections based on information currently available to the Mitsui Chemicals Group and are subject to a number of risks, uncertainties and assumptions, which, without limitation, include economic trends, fluctuations in foreign currency exchange rates, fluctuations in the price of raw materials, competition in markets where the Company is active, personal consumption, market demand, the tax system and other legislation. As such, actual results may differ materially from those projected and the Mitsui Chemicals Group cannot guarantee that these forward-looking statements are accurate or will be achieved.
The segment amounts of FY2014 and FY2015 are approximate estimates to compare with FY2016.

Copyright © 2016 Mitsui Chemicals, Inc.92. Outlook for FY2016
1) Topics of FY2016
<Topics>
- Mitsui Chemicals commences operations at Korean subsidiary (April 2016) - Construction starts for new facility of high performance nonwoven fabrics at
Nagoya Works in Japan (15,000 tons/annum, April 2016, commercial operations in FY2017)
- New system house base starts operations in Mexico (April 2016)- Termination of MDI plant at Omuta Works in Japan
(60,000 tons/annum, May 2016) - Commercial operations for 2 new specialty isocyanates in Japan
(2,000 tons/annum, August 2016)- Commercial operations of new EvolueTM plant in Singapore
(300,000 tons/annum, FY2016)

Copyright © 2016 Mitsui Chemicals, Inc.
2) Consolidated Financial Highlights of Outlook
(Billions of Yen) () Denotes a minus
1st Half Full Year 1st Half Full Year Full Year %
708.6 1,343.9 600.0 1,250.0 (93.9) (7%)
41.4 70.9 27.0 70.0 (0.9) (1%)
(0.2) (7.7) (4.0) (8.0) (0.3) ー
41.2 63.2 23.0 62.0 (1.2) (2%)
(0.1) (21.9) (3.0) (6.0) 15.9 ー
41.1 41.3 20.0 56.0 14.7 36%
28.5 23.0 10.0 36.0 13.0 57%
Exchange Rate (Yen/US$) 122 120 110 110 (10)Domestic Standard Naphtha Price (Yen/KL) 48,000 42,800 33,000 33,000 (9,800)
Interim Year-end Interim Year-end Interim Year-end4.0 4.0 4.0 5.0 0.0 +1.0
Full year 8.0 Full year 9.0 Full year +1.0
Net income (loss) before income taxesand minority interests
Incr.(Decr.)(b)-(a)Items
FY2015 (a) FY2016 Outlook (b)
Sales
Operating income (loss)
Profit (loss) attributable to owners ofparent
Non-operating income (expenses)
Ordinary income (loss)
Extraordinary gains/losses
Dividend (Yen/Share)
102. Outlook for FY2016

Copyright © 2016 Mitsui Chemicals, Inc.
3) Sales and Operating Income/Loss by Business Segment(compared with FY2015 results)
11
(Billions of Yen) () Denotes a minus
1st Half Full Year (a) 1st Half Full Year (b) 1st Half Full Year (c) 1st Half Full Year (d)
Mobility 164.5 318.2 155.0 320.0 1.8 24.0 44.9 19.0 39.0 (5.9)
Healthcare 87.4 161.1 78.0 160.0 (1.1) 5.1 11.6 6.0 15.0 3.4
Food &Packaging 96.6 195.2 93.0 200.0 4.8 10.9 20.3 9.0 20.0 (0.3)
BasicMaterials 341.3 630.8 255.0 530.0 (100.8) 4.3 1.0 (3.0) 4.0 3.0
Others 18.8 38.6 19.0 40.0 1.4 (2.9) (6.9) (4.0) (8.0) (1.1)
Total 708.6 1,343.9 600.0 1,250.0 (93.9) 41.4 70.9 27.0 70.0 (0.9)
FY2016 Outlook Incr.(Decr.)(d) - (c)
SegmentSales
FY2015 FY2016 OutlookOperating Income/Loss
Incr.(Decr.)(b) - (a)
FY2015
2. Outlook for FY2016

Copyright © 2016 Mitsui Chemicals, Inc.
4) Transition of Operating Income(FY2014 → FY2015 → FY2016 outlook)
12
0
100
200
300
400
500
600
700
800
900
FY2014FY2016
(Outlook)
42.0
Volume+6.6
Terms of trade+22.6
Costs(0.3)
(Billions of Yen)
70.9 70.0Volume+7.0
Terms of trade(15.0) Costs
+7.1
FY2015
【Mobility】Oversea PP Compound[+],Functional Polymers[+]
【Healthcare】Vision Care Materials[+],Nonwovens[+]
【Food & Packaging】Functional Films[+],
etc.
Mobility[+],Basic Materials[+],Forex[+], etc.
Businessrestructuring effects such as plant shutdowns[+], development costs[-], inventory reduction[-],etc.
【Mobility】Oversea PP Compound[+],Elastmers[+]
【Healthcare】Vision Care Materials[+],Dental Materials[+]
【Food & Packaging】Coating & Engineering Materials[+],Agrochemicals[+],
etc.
Businessrestructuring effects such as plant shutdowns[+], development costs[-], etc.
Forex[-],Basic Materials[-]、Mobility[-], etc.
44.9
20.3
11.6
39.0
15.0
20.0
4.01.0
30.8
9.2
13.5
(6.5)
Mobility
Healthcare
Basic Materials
Others
Food &Packaging
90
80
70
60
50
40
30
20
10
0
2. Outlook for FY2016
74

Copyright © 2016 Mitsui Chemicals, Inc.
Mobility
Healthcare
Food &Packaging
Sales expansion[+], development costs[-],etc. Sales expansion[+], etc.
Sales expansion[+], terms of trade[-],etc. Sales expansion[+], etc.
Trends of Operating Income2nd half of FY2015 → 1st half of FY2016 (Outlook) 1st half of FY2016 (Outlook) → 2nd half of FY2016 (Outlook)
Robust trends Sales expansion[+], etc.
5) Trends of Business Segment(Mobility, Healthcare, and Food & Packaging segments)
132. Outlook for FY2016
20.9 19.0 20.0
6.5 6.0 9.0
9.4 9.0 11.0
0.0
10.0
20.0
30.0
40.0
50.0
2nd half of FY2015 1st half of FY2016(Outlook)
2nd half of FY2016(Outlook)
(Billions of yen)
Mobility
Healthcare
Food &Packaging
36.8 34.040.0
◆ Forecast volume growth from growing demand in line with global economic recovery. Forecasted effects and terms of trade risks from naphtha price fluctuations and exchange ratesare included.
◆ Continue development cost, new project cost, etc. investments to bolster growth.
<Business Environment>74.0

Copyright © 2016 Mitsui Chemicals, Inc.
Breakdown of Basic Materials
Petrochemicalfeedstocks and
Polyolefins60%
Phenols, PTA&PETand Industrial
Chemicals35%
PolyurethaneMaterials 5%
Note: All figures are approximation for reference purpose only.
Regular maintenance of naphthacracker[-], terms of trade[-], etc.
Regular maintenance of naphthacracker[+], etc.
Sales Ratio(%)
Trends of Operating Income2nd half of FY2015 → 1st half of FY2016 (Outlook) 1st half of FY2016 (Outlook) → 2nd half of FY2016 (Outlook)
Resolution of raw materials sourcingissue in Singapore[+], etc.
Shutdown of Kashima TDI and OmutaMDI[+], etc.
Shutdown of Kashima TDI and OmutaMDI[+], etc.
5) Trends of Business Segment(Basic Materials segment)
142. Outlook for FY2016
◆ Forecast continuation of current demand andmarket conditions.
◆ Forecast stable demand for domestic petrochemicals and continued high operating rates.
<Business Environment>
(3.3) (3.0)
7.0
(5.0)
0.0
5.0
10.0
2nd half of FY2015 1st half of FY2016(Outlook)
2nd half of FY2016(Outlook)
(Billionsof yen)4.0

Copyright © 2016 Mitsui Chemicals, Inc.15
(Billions of Yen) () Denotes a minus
1st Half Full Year(a) 1st Half Full Year
(b)
Equity in earnings of non-consolidated subsidiaries and affiliates 3.7 (2.2) (1.0) (2.0) 0.2
Interest expenses, interest and dividend income (2.5) (2.6) (1.5) (3.0) (0.4)
Gain (loss) on foreign exchange (0.4) (1.9) - - 1.9
Others (1.0) (1.0) (1.5) (3.0) (2.0)
Non-Operating Income and Expenses Total (0.2) (7.7) (4.0) (8.0) (0.3)
(Billions of Yen) () Denotes a minus
1st Half Full Year(a) 1st Half Full Year
(b)
Gains on sales of fixed assets 1.2 5.1 ー ー (5.1)Gains on transfer of business 3.7 3.7 ー ー (3.7)
Extraordinary gains (a) 4.9 8.8 ー ー (8.8)
Loss on sales and disposal of fixed assets (2.1) (5.6) (3.0) (6.0) (0.4)Impairment loss (2.7) (24.1) - - 24.1Loss on restructuring of subsidiaries and affiliates (0.2) (1.0) - - 1.0
Extraordinary losses (b) (5.0) (30.7) (3.0) (6.0) 24.7
Extraordinary gains and losses Total (a)+(b) (0.1) (21.9) (3.0) (6.0) 15.9
FY2016 OutlookIncr.(Decr.)
(b) - (a)
ItemsFY2015 FY2016 Outlook
Incr.(Decr.)(b) - (a)
ItemsFY2015
Non-Operating Income and Expenses
Extraordinary Gains and Losses
6) Non-Operating Income and Expenses, and Extraordinary Gains and Losses
2. Outlook for FY2016

Copyright © 2016 Mitsui Chemicals, Inc.16
7) Consolidated Statement of Cash Flow
(Billions of Yen) () Denotes a minus
1st Half Full Year(a) 1st Half Full Year
(b)
Ⅰ.Cash flows from operating activities (a) 86.7 145.9 38.0 98.0 (47.9)
Ⅱ.Cash flows from investing activities (b) (12.7) (36.4) (31.0) (68.0) (31.6)
Free cash flows (a)+(b) 74.0 109.5 7.0 30.0 (79.5)
Ⅲ.Cash flows from financing activities (58.5) (79.0) (18.0) (37.0) 42.0
Ⅳ.Others (0.7) (2.9) ー ー 2.9
Net incr.(decr.) in cash and cash equivalents 14.8 27.6 (11.0) (7.0) (34.6)
FY2015 FY2016 OutlookIncr.(Decr.)
(b) - (a)Items
2. Outlook for FY2016

Copyright © 2016 Mitsui Chemicals, Inc.17
8) Consolidated Accounting Fundamentals
2. Outlook for FY2016
() Denotes a minus
1st Half Full Year 1st Half Full Year
Exchange Rate Yen/US$ 122 120 110 110
Domestic Standard Naphtha Price Yen/KL 48,000 42,800 33,000 33,000
Capital Expenditure \ Billions 21.1 43.4 25.0 56.0
Capital Expenditure (excluding acquisition) \ Billions 21.1 43.4 25.0 56.0
Research and Development Expenses \ Billions 15.7 31.5 17.0 34.0
Depreciation and Amortization \ Billions 25.3 48.6 22.0 46.0
Financing Income and Expenses \ Billions (2.5) (2.6) (1.5) (3.0)
Interest-bearing Liabilities \ Billions 491.6 473.0 463.0 450.0
Net D/E ratio times 1.00 1.03 1.02 0.92
Number of Employees persons 13,626 13,447 13,800 13,700
ItemsFY2015 FY2016 Outlook

Copyright © 2016 Mitsui Chemicals, Inc.

Copyright © 2016 Mitsui Chemicals, Inc.
3. Appendix
This summary contains forward-looking statements about the future plans, strategies, belief and performance of the Mitsui Chemicals Group as a whole and its individual consolidated companies. These forward-looking statements are not historical facts. They are expectations, estimates, forecasts and projections based on information currently available to the Mitsui Chemicals Group and are subject to a number of risks, uncertainties and assumptions, which, without limitation, include economic trends, fluctuations in foreign currency exchange rates, fluctuations in the price of raw materials, competition in markets where the Company is active, personal consumption, market demand, the tax system and other legislation. As such, actual results may differ materially from those projected and the Mitsui Chemicals Group cannot guarantee that these forward-looking statements are accurate or will be achieved.
1) Trends in Main Product Prices2) Increase/Decrease in Business Segment (Sales and Operating Income, year on year)3) Sales and Operating Income/Loss by Business Segment (by Quarter)4) Change in Business Segments5) Main Subsidiaries and Affiliates6) Financial Summary7) Sales by Region8) Topics of FY2015

Copyright © 2016 Mitsui Chemicals, Inc.
1) Trends in Main Product Prices
3. Appendix 18
(Naphtha prices are Domestic Standard Naphtha Price )(PE, PP, PH, BPA(Japan) : Change in Prices and Raw Materials Prices in Japan / BPA(China), PTA, TDI : Chinese Market Price)(ACP) : Asian contract price
Year 2013 2014 2015 2016Month Apr.-Jun. Jul.-Sep. Oct.-Dec. Jan.-Mar. Apr.-Jun. Jul.-Sep. Oct.-Dec. Jan.-Mar. Apr.-Jun. Jul.-Sep. Oct.-Dec. Jan.-Mar.
Naphtha(Yen/KL) 65,500 63,900 67,800 72,000 69,900 70,900 66,000 47,000 48,800 47,200 40,900 34,300
PE(Yen/KG)
about+5
about+10
about+10
about(30)
about(10)
about(10)
PP(Yen/KG)
about+5
about+10
about+10
about(30)
about(10)
about(10)
PH(Formula Price)
(Yen/KG)
BZ(ACP)(US$/T) $1,310 $1,250 $1,290 $1,330 $1,270 $1,380 $1,060 $650 $790 $720 $610 $560
+21From Mar.
(30)From Oct.
negotiation based on BZ price and BPA market priceBPA (China)
(US$/T) $1,740 $1,660 $1,630 $1,660 $1,670 $1,910 $1,620 $1,430 $1,390 $1,060 $910 $940
PTA(US$/T) $1,050 $1,080 $1,020 $940 $910 $980 $760 $620 $720 $630 $600 $570
PX(ACP)(US$/T) $1,410 $1,450 $1,440 $1,300 $1,260 $1,350 $1,040 $780 $930 $820 $790 $720
TDI(US$/T) $2,530 $2,375 $2,340 $2,330 $2,320 $2,340 $2,280 $1,940 $1,740 $1,570 $1,510 $1,510
BPA(Japan)(Yen/KG)

Copyright © 2016 Mitsui Chemicals, Inc.
138.2 151.3
14.2 (1.1)
FY2014 Volume Prices FY2015
9.110.7
2.11.3 (1.8)
FY2014 Volume Terms oftrade
Costs FY2015
19
2-1) Increase/Decrease in Healthcare(Sales and Operating Income, year on year)
+13.1
(Unit:Billions of yen)
+1.6
(Unit:Billions of yen)
3. Appendix
151.3 billion yen (+13.1 billion yen year on year)
Volume +14.2 billion yen - Increase in overseas demand for ophthalmic lens materials,
nonwovens, etc.- Increase from fiscal period adjustment of dental material
businessPrices (1.1) billion yen
10.7 billion yen (+1.6 billion yen year on year)
Volume +2.1 billion yen- Sales growth from expanded export of ophthalmic lens
materials, nonwovens, etc.Terms of trade +1.3 billion yenCosts (1.8) billion yen- Increase in fixed costs from depreciation of goodwill related
to fiscal period adjustment of dental material business etc.
() Denotes a minusIncrease/Decrease of Net Sales (FY2015 vs. FY2014)
Increase/Decrease of Operating Income (FY2015 vs. FY2014)

Copyright © 2016 Mitsui Chemicals, Inc.
174.5 167.5
(3.4) (3.6)
FY2014 Volume Prices FY2015
18.726.2
0.6
7.6(0.7)
FY2014 Volume Terms oftrade
Costs FY2015
2-2) Increase/Decrease in Functional Polymeric Materials(Sales and Operating Income, year on year)
(7.0)
(Unit:Billions of yen)
+7.5
(Unit:Billions of yen)
3.Appendix
167.5 billion yen ( (7.0) billion yen year on year)
Volume (3.4) billion yen- Decrease in production volume due to regular maintenance
shutdown despite Mitsui Chemicals Group’s prompt response to healthy global automotive use demand
- Increase from brisk sales in functional polymers from expanded demand for electronic and information-related applications
Prices (3.6) billion yen
26.2 billion yen (+7.5 billion yen year on year)
Volume +0.6 billion yen- Group continues to promptly respond to healthy global
demand for automotive applications- Increase from brisk sales in functional polymers from
expanded demand for electronic and information-related applications
Terms of trade +7.6 billion yen- Increase from weak yen, etc.Costs (0.7) billion yen
20
() Denotes a minusIncrease/Decrease of Net Sales (FY2015 vs. FY2014)
Increase/Decrease of Operating Income (FY2015 vs. FY2014)

Copyright © 2016 Mitsui Chemicals, Inc.
154.8
112.2
(29.3)(13.3)
FY2014 Volume Prices FY2015
(3.5)
(8.5)
(5.0)
(0.6)
0.6
FY2014 VolumeTerms of
trade Costs FY2015
2-3) Increase/Decrease in Polyurethane(Sales and Operating Income, year on year)
3.Appendix
(42.6)
(Unit:Billions of yen)
(5.0)
(Unit:Billions of yen)
112.2 billion yen ( (42.6) billion yen year on year)
Volume (29.3) billion yen- Decrease from company split-up of polyurethane materials,
etc.
Prices (13.3) billion yen
(8.5) billion yen ( (5.0) billion yen year on year)
Volume (0.6) billion yen
Terms of trade (5.0) billion yen- Drop in overseas market prices of polyurethane materials
offset weak yen and resulted in a decrease
Costs +0.6 billion yen
() Denotes a minus
21
Increase/Decrease of Net Sales (FY2015 vs. FY2014)
Increase/Decrease of Operating Income (FY2015 vs. FY2014)

Copyright © 2016 Mitsui Chemicals, Inc.
330.8251.2
(15.6)(64.0)
FY2014 Volume Prices FY2015
(7.9)
(3.7)
(0.6)3.0
1.8
FY2014 VolumeTerms of
trade Costs FY2015
2-4) Increase/Decrease in Basic Chemicals(Sales and Operating Income, year on year)
3.Appendix
(79.6)
(Unit:Billions of yen)
+4.2
(Unit:Billions of yen)
22
251.2 billion yen ( (79.6) billion yen year on year)
Volume (15.6) billion yenPrices (64.0) billion yen- Decrease in market prices due to downturn in oil prices, etc.
(3.7) billion yen (+4.2 billion yen year on year)
Volume (0.6) billion yenTerms of trade +3.0 billion yen- Market prices, etc.
Costs +1.8 billion yen- Rationalizations, etc.
() Denotes a minusIncrease/Decrease of Net Sales (FY2015 vs. FY2014)
Increase/Decrease of Operating Income (FY2015 vs. FY2014)

Copyright © 2016 Mitsui Chemicals, Inc.
584.4491.3
19.8(112.9)
FY2014 Volume Prices FY2015
21.6
39.3 3.0
13.2
1.5
FY2014 Volume Terms oftrade
Costs FY2015
2-5) Increase/Decrease in Petrochemicals(Sales and Operating Income, year on year)
3.Appendix
(93.1)
(Unit:Billions of yen)
+17.7
(Unit:Billions of yen)
491.3 billion yen ( (93.1) billion yen year on year)
Volume +19.8 billion yen- Increase from strong overseas demand for automotive PP
compounds, etc.
Prices (112.9) billion yen- Effect of downturn in oil prices, etc.
39.3 billion yen (+17.7 billion yen year on year)
Volume +3.0 billion yen- Increase from strong demand for overseas PP compounds,
etc.Terms of trade +13.2 billion yen- Improvement of production rates, etc.Costs +1.5 billion yen
23
() Denotes a minusIncrease/Decrease of Net Sales (FY2015 vs. FY2014)
Increase/Decrease of Operating Income (FY2015 vs. FY2014)

Copyright © 2016 Mitsui Chemicals, Inc.
129.2 131.9
5.4 (2.7)
FY2014 Volume Prices FY2015
9.1
13.9
2.1
2.50.2
FY2014 Volume Terms oftrade
Costs FY2015
2-6) Increase/Decrease in Food & Packaging(Sales and Operating Income, year on year)
3.Appendix
+2.7
(Unit:Billions of yen)
+4.8
(Unit:Billions of yen)
24
131.9 billion yen (+2.7 billion yen year on year)
Volume +5.4 billion yen- Increase in demand for high-value-added performance films
and sheets and expanded sales of new products- Increase in agrochemicals sales
Prices (2.7) billion yen
13.9 billion yen (+4.8 billion yen year on year)
Volume +2.1 billion yen- Increase in sales of performance films and sheets, and
agrochemicalsTerms of trade +2.5 billion yen- Increase from weak yen, etc.Costs +0.2 billion yen
() Denotes a minusIncrease/Decrease of Net Sales (FY2015 vs. FY2014)
Increase/Decrease of Operating Income (FY2015 vs. FY2014)

Copyright © 2016 Mitsui Chemicals, Inc.
3) Sales and Operating Income/Loss by Business Segment (by Quarter)
3.Appendix 25
Sales (Billions of Yen) () Denotes a minus
FY2015Apr-Jun Jul-Sep Oct-Dec Jan-Mar Apr-Jun Jul-Sep Oct-Dec Jan-Mar
Healthcare 34.2 34.2 34.0 35.8 46.5 35.6 35.6 33.6Functional Polymeric Materials 42.6 43.1 42.7 46.1 46.4 40.1 40.5 40.5Polyurethane 35.7 39.3 41.3 38.5 38.5 24.7 25.2 23.8Basic Chemicals 85.6 88.8 80.2 76.2 74.8 66.6 59.0 50.8Petrochemicals 151.7 142.3 148.9 141.5 131.0 121.7 121.7 116.9Food & Packaging 30.7 30.7 32.1 35.7 32.8 31.1 32.0 36.0Others 8.7 8.4 10.0 11.1 9.1 9.7 9.2 10.5Total 389.2 386.8 389.2 384.9 379.1 329.5 323.2 312.1
Operating Income/Loss (Billions of Yen) () Denotes a minus
FY2015Apr-Jun Jul-Sep Oct-Dec Jan-Mar Apr-Jun Jul-Sep Oct-Dec Jan-Mar
Healthcare 2.5 2.0 1.5 3.1 1.9 2.7 3.1 3.0Functional Polymeric Materials 3.9 3.2 4.6 7.0 7.6 6.3 6.6 5.7Polyurethane (2.2) (1.3) 0.7 (0.7) (1.7) (1.6) (2.5) (2.7)Basic Chemicals (3.1) (1.8) (1.2) (1.8) 1.0 0.0 (1.9) (2.8)Petrochemicals 7.5 5.0 7.0 2.1 10.8 9.6 8.9 10.0Food & Packaging 3.1 2.2 2.3 1.5 4.7 3.1 3.0 3.1Others (1.3) (1.1) (0.8) (1.9) (1.6) (1.4) (2.2) (1.8)Total 10.4 8.2 14.1 9.3 22.7 18.7 15.0 14.5
FY2014
SegmentFY2014
Segment

Copyright © 2016 Mitsui Chemicals, Inc.
(Billions of Yen) () Denotes a minus
FormerSegment Sales Operating
IncomeNew
Segment Businesses Sales OperatingIncome
20.3
BasicMaterials
Phenols, PTA&PET, IndustrialChemicals, PetrochemicalFeedstocks, Polyolefins,
Licensing and PolyurethaneMaterials
630.8 1.0
Polyurethane 112.2 (8.5)
BasicChemicals 251.2 (3.7)
HealthcareVision Care Materials,
Personal Care Materials,Nonwovens andDental Materials
161.1
Food &Packaging
Coating & EngineeringMaterials, Functional Films
& Sheets andAgrochemicals
195.2
Petrochemicals 491.3 39.3
Food &Packaging 131.9 13.9
Others
FY2015 FY2015
Healthcare 151.3 10.7Mobility
Elastomers, PerformanceCompound, PerformancePolymers and Oversea PP
Compound
318.2 44.9FunctionalPolymericMaterials
167.5 26.2
11.6
- 38.6
70.9Total 1,343.9 70.9 Total - 1,343.9
(6.9)Others 38.5 (7.0)
4) Change in Business Segments
3.Appendix 26

Copyright © 2016 Mitsui Chemicals, Inc.
5) Main Subsidiaries and Affiliates
3.Appendix 27
Operating Income/Loss : FY2016 outlook "→" represents "no change", or change less than 0.5 billion yen compared with FY2015.
Sales Operating Income/Loss
FY2015 FY2015
Subsidiaries % Billions of Yen
Prime Polymer 65.0 260 gain Terms of trade[-]Advanced Composites 61.8 110 gain Terms of trade[-]Mitsui Phenols Singapore 95.0 40 lossMitsui Elastomers Singapore 100.0 50 gain Terms of trade[-]Mitsui Chemicals Tohcello, Inc. 100.0 80 gainMitsui Chemicals Agro, Inc. 100.0 50 gain
AffiliatesDupont-Mitsui Polychemicals 50.0 40 gainDupont-Mitsui Fluorochemicals 50.0 30 gainShanghai Shinopec Mitsui Chemicals 50.0 30 lossSiam Mitsui PTA 50.0 70 loss
Items Ourshare FY2016 Outlook

Copyright © 2016 Mitsui Chemicals, Inc.3.Appendix 28
6-1) Financial Summary
(9.5)
40.5
21.6
4.3
24.9
70.9
(28.0)
24.9
(1.0)(8.1)
70.0
42.0
17.3
(25.1)
36.023.0
(40.0)
(20.0)
0.0
20.0
40.0
60.0
80.0
'09 '10 '11 '12 '13 '14 '15 '16
Operating IncomeProfit attributable to owners of parent
(Billion Yen)
1,238.11,295.6
1,256.3
1,338.0
1,432.2 1,411.8
1,258.9
1,000
1,200
1,400
1,600
'09 '10 '11 '12 '13 '14 '15
(Billion Yen)
1,207.7
1,391.7 1,454.0
1,406.2
1,566.0 1,550.1
1,343.9
1,250.0
1,000
1,250
1,500
1,750
'09 '10 '11 '12 '13 '14 '15 '16
(Billion Yen) Net Sales
Operating Income & Profit attributable to owners of parent
(Outlook)
Total Assets
Cash Flows
98.0
145.9
58.343.5
18.5
43.3
73.270.2
(68.0)
(36.4)(35.0)
(89.8)
(58.1)(42.5)(43.2)(42.9)
30.027.3
30.0
0.8 (39.6)(46.3)
23.3
109.5
(100.0)
(50.0)
0.0
50.0
100.0
150.0
'09 '10 '11 '12 '13 '14 '15 '16
Investing CFOperating CFFCF
(Billion Yen)
(Outlook) (Outlook)
0 0

Copyright © 2016 Mitsui Chemicals, Inc.3.Appendix 29
6-2) Financial Summary
Depreciation & AmortizationCapital Expenditure
49.1 45.1 44.8 56.6
113.2
47.5 43.4 56.0
0.020.040.060.080.0
100.0120.0
'09 '10 '11 '12 '13 '14 '15 '16
(Billion Yen) 74.969.2
62.7
43.8 48.1 48.2 48.6 46.0
0.0
20.0
40.0
60.0
80.0
'09 '10 '11 '12 '13 '14 '15 '16
(Billion Yen)
* include Heraeus dental business acquisition 56.0 billion yen
*
R&D ResourcesNet D/E Ratio
38.1 36.2 33.2 32.0 33.6 32.5 31.5 34.0
0.0
10.0
20.0
30.0
40.0
50.0
'09 '10 '11 '12 '13 '14 '15 '16
(Billion Yen)
1.121.22
1.44
1.22
1.030.92
1.041.11
0.0
200.0
400.0
600.0
800.0
1,000.0
'09 '10 '11 '12 '13 '14 '15 '160.6
0.8
1.0
1.2
1.4
1.6Net Interest-bearing LiabilitiesEquityNet D/E Ratio
(Billion Yen) (Times)
(Outlook) (Outlook)
(Outlook) (Outlook)

Copyright © 2016 Mitsui Chemicals, Inc.3.Appendix 30
7) Sales by Region
Japan55%
China10%
Asia*15%
Americas13%
Europe6%
Japan56%
China11%
Asia*17%
Americas11%
Europe5%
FY2014Consolidated Sales
¥1,550.1 billion
Overseas Sales44%
FY2015Consolidated Sales
¥1,343.9 billion
Overseas Sales45%
* Asia excluding Japan and China

Copyright © 2016 Mitsui Chemicals, Inc.
8) Topics of FY2015
<Topics>- Construction of high-performance polyurethane plant began at Omuta Works (April 2015)
Production facility for new aliphatic isocyanates FORTIMOTM and STABiOTM, 2,000t/annum, planned for commercial operation in August 2016 (tentative)
- Mitsui Chemicals & SKC Polyurethanes Inc. Commences Operations (July 2015)
- Construction starts at breathable film facility in Thailand (November 2015)(4,200tons/annum, planned for commercial operations in January 2017 (tentative))
- Whole You™ launches Whole You Nexteeth™, its first denture product, and a new oral device for obstructive sleep apnea and snoring (November 2015)
- Mitsui Chemicals participates in subsidiary of Taiwan’s Sentronic International Corp.(December 2015)(Bolstering business development of metal resin integrally molded POLYMETAC™)
- Mitsui Chemicals Agro, Inc. acquires additional shares of Sotus International Co., Ltd. in Thailand (January 2016)
- Commercial operations of new bio-polyol facilities in India (8,000 tons/annum, January 2016)- Commercial operations at world's first large scale XDI plant at Omuta Works in Japan
(5,000 tons/annum, March 2016)- Mitsui Chemicals Agro, Inc. launches new fungicide for paddy rice which contains new active
ingredient Tolprocarb (March 2016)- Termination of TDI plant at Kashima Works in Japan (117,000 tons/annum, March 2016)
3.Appendix 31

Copyright © 2016 Mitsui Chemicals, Inc.
Creating New Customer Value and Solving Social Challenges through Business Activities


![Presentation on Results for 2nd Quarter of Fiscal 2016...[ 2Q FY2016 Results] Consolidated Income Statements – Changes from 2Q FY2015 7 Unit: billion yen FY2016 FY2015 (Apr.-Sep.2016)](https://static.fdocuments.us/doc/165x107/5fcdfc2550ca5500ae4530a9/presentation-on-results-for-2nd-quarter-of-fiscal-2016-2q-fy2016-results.jpg)