Financial summary - Results for 1st Quarter of FY2020 ......Japanese language version is the...
28
Copyright © 2020 Mitsui Chemicals, Inc. Mitsui Chemicals, Inc. Financial Summary Aug 13, 2020 <Remarks> FY2020 indicates the period from April 1, 2020 to March 31, 2021. Results for 1 st Quarter of FY2020 & Outlook for FY2020
Transcript of Financial summary - Results for 1st Quarter of FY2020 ......Japanese language version is the...

Copyright © 2020 Mitsui Chemicals, Inc.
Mitsui Chemicals, Inc.
Financial Summary
Aug 13, 2020
<Remarks>FY2020 indicates the period from April 1, 2020 to March 31, 2021.
Results for 1st Quarter of FY2020 & Outlook for FY2020

Copyright © 2020 Mitsui Chemicals, Inc.
Contents
Please note that this document has been translated from the original Japanese into English for the convenience of our stakeholders. The information was originally provided in Japanese. If there is any discrepancy, the Japanese language version is the official document and is available on our Japanese language website.
1. Results for 1st Quarter of FY2020 (April 1, 2020 – June 30, 2020)
1) Review on 1st Quarter of FY2020 (Business Overview and Topics) ・・・ 1, 2
2) Consolidated Financial Highlights ・・・ 3, 4
3) Sales revenue and Operating Income before special items by Business Segment (compared with corresponding period of FY2019 results) ・・・ 5
4) Non-recurring items ・・・ 6
5) Consolidated Statement of Financial Position ・・・ 7
6) Consolidated Statement of Cash Flow ・・・ 8
2. Outlook for FY2020 (April 1, 2020 – March 31, 2021)
1) Topics for and after 2nd Quarter of FY2020 ・・・ 9
2) Consolidated Financial Highlights of Outlook ・・・ 10 3) Sales revenue and Operating income before special items by Business Segment (compared with FY2019 results)
・・・ 11
4) Operating income before special items by Business Segment (compared with previous outlook of FY2020)
・・・ 12
5) Consolidated Statement of Cash Flow ・・・ 13
3. Appendix ・・・14~22
Copyright © 2020 Mitsui Chemicals, Inc.
1. Results for 1st Quarter of FY2020(April 1, 2020 – June 30, 2020)

Copyright © 2020 Mitsui Chemicals, Inc.1
<Business Overview>
1) Review on 1st Quarter of FY2020 (Business Overview and Topics)
1.Results for 1st Quarter of FY2020
- Mobility: Amid the global slowdown in automobile production caused by the COVID-19 pandemic, sales for elastomers, performance compounds, overseas polypropylene compounds and solution businesses declined. Stable demand continued in performance polymers despite weaker overall demand in the information and communication technology market.
- Health Care: Sales for vision care materials and dental materials declined due to the COVID-19 pandemic. In nonwoven fabrics, nonwovens for diapers, masks and medical gowns saw healthy sales.
- Food & Packaging: In coating & engineering materials, sales declined due to the COVID-19 pandemic. In functional films & sheets, packaging films and industrial films saw firm sales. Sales for agrochemicals were stable.
- Basic Materials: Operating rates of naphtha crackers reduced due to decreased demand for downstream products owing to the COVID-19 pandemic. Sales for polypropylene were impacted by weaker demand mainly in automotive applications. In acetones, the overseas market environments were at a higher level year-on-year due to increased demand for downstream products for disinfection applications.

Copyright © 2020 Mitsui Chemicals, Inc.2
<Topics>
1) Review on 1st Quarter of FY2020 (Business Overview and Topics)
- Supply of Nonwovens for Medical Gowns (Announced in April 2020)
- Capacity expansion of cyclic olefin copolymers APEL™(Start of construction: April 2020 Completion: March 2022 +1 line)
- Enhancement of Business and Capital Tie-up with Shofu Inc. (Announced in May 2020)
- ARRK Corporation becoming a wholly-owned subsidiary of Mitsui Chemicals, Inc. (Announced in May 2020)
- Construction of production facility for α-Methylstyrene in Singapore(Completion in May 2020, 20,000 tons/annum)
- Commercial operations for PP Compounds Company in Netherlands (June 2020, 30,000 tons /annum)
- Capacity expansion of TEKNOROTE™ for mask nose clamps(Start of construction: June 2020 Completion: October 2020 +1 line)
1.Results for 1st Quarter of FY2020
Copyright © 2020 Mitsui Chemicals, Inc.3
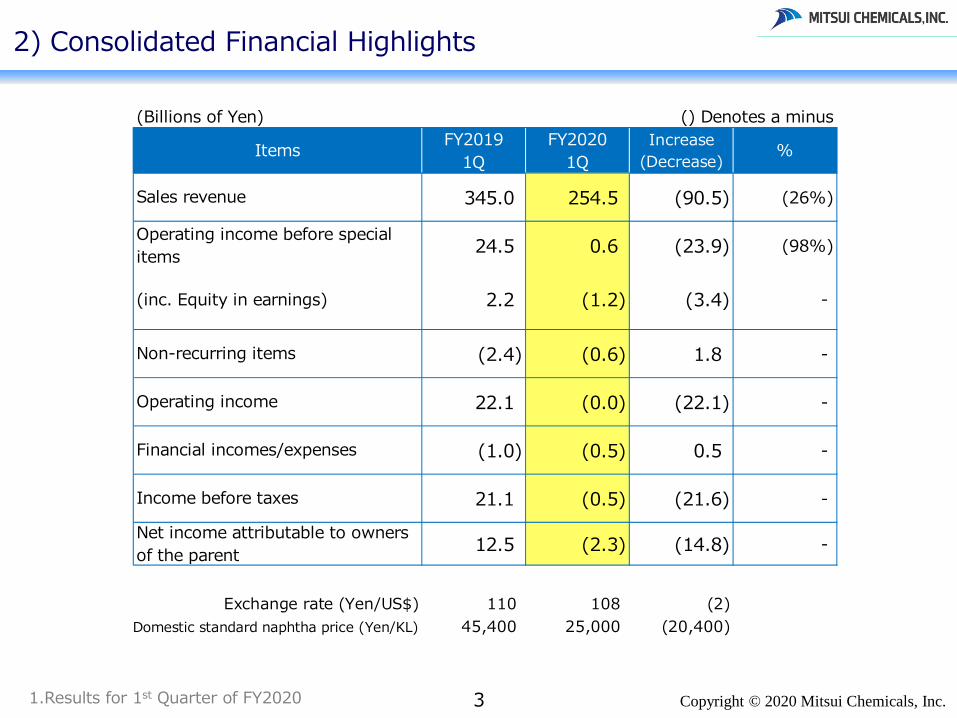
2) Consolidated Financial Highlights
1.Results for 1st Quarter of FY2020
(Billions of Yen) () Denotes a minusFY2019
1QFY2020
1QIncrease
(Decrease) %
345.0 254.5 (90.5) (26%)
24.5 0.6 (23.9) (98%)
2.2 (1.2) (3.4) -
(2.4) (0.6) 1.8 -
22.1 (0.0) (22.1) -
(1.0) (0.5) 0.5 -
21.1 (0.5) (21.6) -
12.5 (2.3) (14.8) -
Exchange rate (Yen/US$) 110 108 (2)Domestic standard naphtha price (Yen/KL) 45,400 25,000 (20,400)
Income before taxes
Net income attributable to ownersof the parent
Financial incomes/expenses
Non-recurring items
Operating income
(inc. Equity in earnings)
Items
Sales revenue
Operating income before specialitems

Copyright © 2020 Mitsui Chemicals, Inc.4
2) Consolidated Financial Highlights
1.Results for 1st Quarter of FY2020
(Billions of Yen) () Denotes a minusEnd of
Mar. 2020End of
Jun.2020Increase
(Decrease) %
599.4 652.4 53.0 9%
427.7 414.3 (13.4) (3%)
529.2 523.6 (5.6) (1%)
0.81 0.79 (0.02) ー
34.6 34.6 0.0 ー
*Equity attributable to owners of the parent
(Number of companies)End of
Mar. 2020End of
Jun.2020Increase
(Decrease)
Consolidated subsidiaries 125 122 (3)Joint operations 4 4 ー
Non-consolidated subsidiaries and affiliates 27 27 0156 153 (3)Total
Items
Consolidated companies
Shareholder's Equity*
Net D/E Ratio (Times)
Shareholder's equity* Ratio (%)
Items
Interest-bearing liabilities
Interest-bearing liabilities (net)

Copyright © 2020 Mitsui Chemicals, Inc.5
3) Sales revenue and Operating Income before special items by Business Segment (compared with corresponding period of FY2019 results)
*Mobility, Health Care and Food & Packaging
1.Results for 1st Quarter of FY2020
(Billions of Yen) () Denotes a minus
FY20191Q
FY20201Q
Incr.(Decr.)
FY20191Q
FY20201Q
Incr.(Decr.) Volume Terms of
trade Costs
Mobility 94.4 58.3 (36.1) 11.7 2.3 (9.4) (8.2) (0.3) (0.9)
Health Care 35.2 28.9 (6.3) 3.7 1.4 (2.3) (4.1) 0.0 1.8
Food & Packaging 47.3 45.4 (1.9) 3.1 4.4 1.3 0.6 0.2 0.5
Basic Materials 163.7 118.6 (45.1) 7.6 (6.3) (13.9) (3.9) (7.1) (2.9)
Others 4.4 3.3 (1.1) (1.6) (1.2) 0.4 - - 0.4
Total 345.0 254.5 (90.5) 24.5 0.6 (23.9) (15.6) (7.2) (1.1)
3 Targeted Domains* 176.9 132.6 (44.3) 18.5 8.1 (10.4)
Sales revenue Operating income before specialitems Breakdown
Segment

Copyright © 2020 Mitsui Chemicals, Inc.6
4) Non-recurring items
1.Results for 1st Quarter of FY2020
(Billions of Yen) () Denotes a minusFY2019
1QFY2020
1QIncr.
(Decr.)
Loss on sales and disposal of non-current assets 0.0 (0.4) (0.4)
Impairment loss (0.7) - 0.7
Loss on business of subsidiaries and affiliates (0.6) (0.0) 0.6
Others (1.1) (0.2) 0.9
Non-recurring items total (2.4) (0.6) 1.8
Items

Copyright © 2020 Mitsui Chemicals, Inc.7
5) Consolidated Statement of Financial Position
1.Results for 1st Quarter of FY2020
(Billions of Yen) () Denotes a minus
Current assets 781.8 763.3 (18.5) Liabilities 920.8 912.1 (8.7)
Cash and cashequivalents 164.6 230.8 66.2 Operating payables 121.0 84.9 (36.1)
Operating receivables 273.9 224.1 (49.8) Interest-bearing liabilities 599.4 652.4 53.0
Inventories 284.3 260.1 (24.2) Other liabilities 200.4 174.8 (25.6)
Other current assets 59.0 48.3 (10.7)
Non-current assets 748.7 750.0 1.3 Equity 609.7 601.2 (8.5)
Property, plant andequipment & right-of-use assets
499.7 496.2 (3.5) Equity attributable toowners of the parent 529.2 523.6 (5.6)
Goodwill andIntangible assets 26.2 25.6 (0.6) Non-controlling interests 80.5 77.6 (2.9)
Other non-current assets 222.8 228.2 5.4
Total 1,530.5 1,513.3 (17.2) Total 1,530.5 1,513.3 (17.2)
Items End ofMar. 2020
End ofJun.2020
Incr.(Decr.)Items End of
Mar. 2020End of
Jun.2020Incr.
(Decr.)

Copyright © 2020 Mitsui Chemicals, Inc.
6) Consolidated Statement of Cash Flow
81.Results for 1st Quarter of FY2020
(Billions of Yen) () Denotes a minusFY2019
1QFY2020
1QIncr.
(Decr.)
Ⅰ.Cash flows from operating activities (a) 17.8 50.3 32.5
Ⅱ.Cash flows from investing activities (b) (20.7) (24.9) (4.2)
Free cash flows (a)+(b) (2.9) 25.4 28.3
Ⅲ.Cash flows from financing activities (4.6) 41.2 45.8
Ⅳ.Others (0.8) (0.4) 0.4
Net incr.(decr.) in cash and cash equivalents (8.3) 66.2 74.5
Items
Copyright © 2020 Mitsui Chemicals, Inc.
2. Outlook for FY2020(April 1, 2020 – March 31, 2021)
This summary contains forward-looking statements about the future plans, strategies, belief and performance of the Mitsui Chemicals Group as a whole and its individual consolidated companies. These forward-looking statements are not historical facts. They are expectations, estimates, forecasts and projections based on information currently available to the Mitsui Chemicals Group and are subject to a number of risks, uncertainties and assumptions, which, without limitation, include economic trends, fluctuations in foreign currency exchange rates, fluctuations in the price of raw materials, competition in markets where the Company is active, personal consumption, market demand, the tax system and other legislation. As such, actual results may differ materially from those projected and the Mitsui Chemicals Group cannot guarantee that these forward-looking statements are accurate or will be achieved.
Copyright © 2020 Mitsui Chemicals, Inc.9
<Topics>
1) Topics for and after 2nd Quarter of FY2020
2. Outlook for FY2020
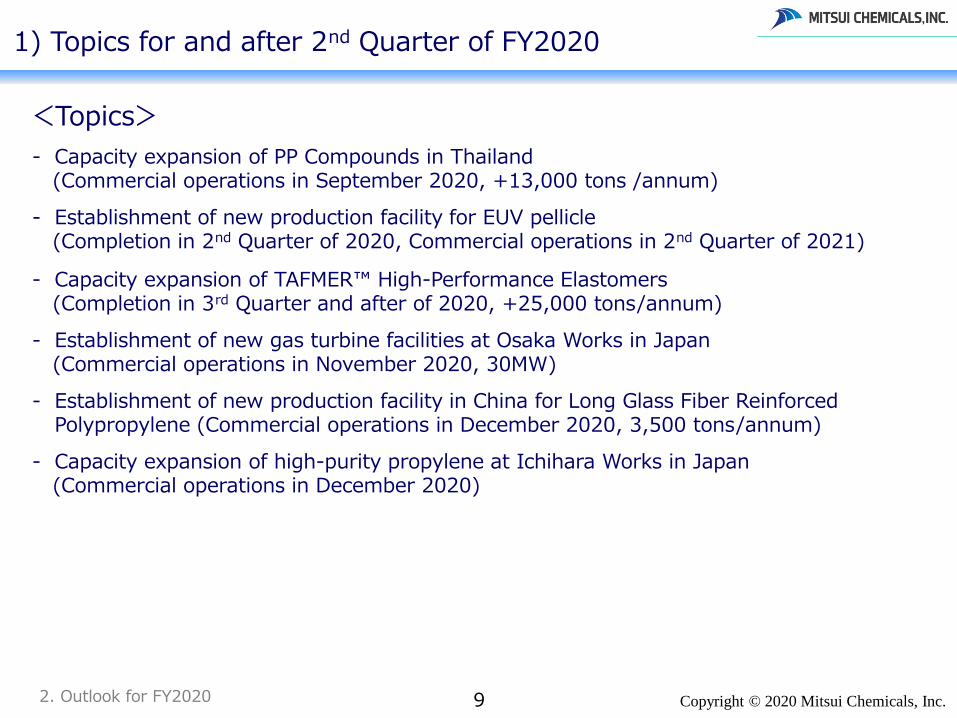
- Capacity expansion of PP Compounds in Thailand (Commercial operations in September 2020, +13,000 tons /annum)
- Establishment of new production facility for EUV pellicle(Completion in 2nd Quarter of 2020, Commercial operations in 2nd Quarter of 2021)
- Capacity expansion of TAFMER™ High-Performance Elastomers(Completion in 3rd Quarter and after of 2020, +25,000 tons/annum)
- Establishment of new gas turbine facilities at Osaka Works in Japan(Commercial operations in November 2020, 30MW)
- Establishment of new production facility in China for Long Glass Fiber Reinforced Polypropylene (Commercial operations in December 2020, 3,500 tons/annum)
- Capacity expansion of high-purity propylene at Ichihara Works in Japan(Commercial operations in December 2020)

Copyright © 2020 Mitsui Chemicals, Inc.
2) Consolidated Financial Highlights of Outlook
102. Outlook for FY2020
(Billions of Yen) () Denotes a minusFY2020 Previous
Outlook(on May 14,
2020)
1st Half Full Year 1st Half Full Year Full Year % Full Year
678.7 1,349.5 540.0 1,170.0 (179.5) (13%) 1,145.0
39.7 72.3 5.0 40.0 (32.3) (45%) 35.0
(2.8) (7.7) 1.0 2.0 9.7 - 2.0
36.9 64.6 6.0 42.0 (22.6) (35%) 37.0
(1.3) (3.8) (1.0) (3.0) 0.8 - (3.0)
35.6 60.8 5.0 39.0 (21.8) (36%) 34.0
20.4 34.0 1.0 27.0 (7.0) (21%) 20.0
Exchange rate (Yen/US$) 109 109 108 108 (1) 108Domestic standard naphtha price (Yen/KL) 42,800 42,900 27,500 28,750 (14,150) 23,300
Interim Year-end Interim Year-end Interim Year-end Year-end50 50 50 50 0 0
Full year 100 Full year 100 Full year 0Undecided
FY2020 Outlook(IFRS) (b)
Incr.(Decr.)(b)-(a)
Sales revenue
Operating income before special items
Items
FY2019 *1(IFRS) (a)
Non-recurring items
Operating income
Financial income/expenses
Income before taxes
Net income attributable to owners of theparent
Dividend (Yen/Share)
*1 Figures for the FY2019 results under IFRS provided were prepared for the purpose of comparison with FY2020 outlook figures, and have not been subject to certified audit.

Copyright © 2020 Mitsui Chemicals, Inc.
3) Sales revenue and Operating income before special items by Business Segment (compared with FY2019 results)
112. Outlook for FY2020
(Billions of Yen) () Denotes a minus
1st Half Full Year (a) 1st Half Full Year (b) 1st Half Full Year (c) 1st Half Full Year (d)
Mobility 187.3 367.9 130.0 300.0 (67.9) 22.3 43.2 6.0 27.5 (15.7)
Health Care 69.8 143.2 63.0 140.0 (3.2) 5.7 13.0 4.0 13.0 0.0
Food &Packaging 96.6 201.3 90.0 195.0 (6.3) 7.6 16.7 7.5 16.0 (0.7)
Basic Materials 316.0 619.5 250.0 520.0 (99.5) 6.7 9.1 (9.0) (9.5) (18.6)
Others 9.0 17.6 7.0 15.0 (2.6) (2.6) (9.7) (3.5) (7.0) 2.7
Total 678.7 1,349.5 540.0 1,170.0 (179.5) 39.7 72.3 5.0 40.0 (32.3)
3 TargetedDomains *2
353.7 712.4 283.0 635.0 (77.4) 35.6 72.9 17.5 56.5 (16.4)
FY2020 Outlook Incr.(Decr.)(d) - (c)
Sales revenue (IFRS) Operating income before special items (IFRS)FY2019 *1 FY2020 Outlook Incr.(Decr.)
(b) - (a)FY2019 *1Segment
*2 Mobility, Health Care and Food & Packaging
*1 Figures for the FY2019 results under IFRS provided were prepared for the purpose of comparison with FY2020 outlook figures, and have not been subject to certified audit.
Copyright © 2020 Mitsui Chemicals, Inc.12
4) Operating income before special items by Business Segment (compared with previous outlook of FY2020)
2. Outlook for FY2020
(Billions of Yen) () Denotes a minus
PreviousOutlook
(on May. 14,2020)
CurrentOutlook
Incr.(Decr.)
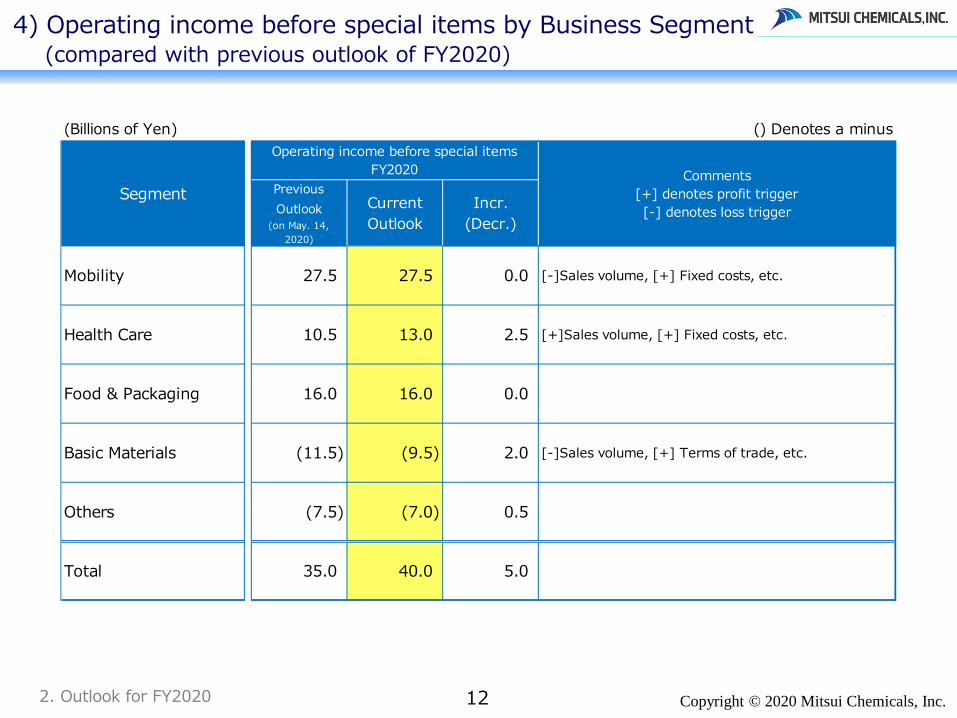
Mobility 27.5 27.5 0.0 [-]Sales volume, [+] Fixed costs, etc.
Health Care 10.5 13.0 2.5 [+]Sales volume, [+] Fixed costs, etc.
Food & Packaging 16.0 16.0 0.0
Basic Materials (11.5) (9.5) 2.0 [-]Sales volume, [+] Terms of trade, etc.
Others (7.5) (7.0) 0.5
Total 35.0 40.0 5.0
Operating income before special itemsFY2020 Comments
[+] denotes profit trigger[-] denotes loss trigger
Segment

Copyright © 2020 Mitsui Chemicals, Inc.13
5) Consolidated Statement of Cash Flow
2. Outlook for FY2020
(Billions of Yen) () Denotes a minusFY2020 PreviousOutlook (IFRS)
(on May 14, 2020)
1st Half Full Year 1st Half Full Year Full Year
Ⅰ.Cash flows from operating activities (a) 74.5 115.0 65.0 135.0 130.0
Ⅱ.Cash flows from investing activities (b) (41.7) (85.2) (60.0) (120.0) (120.0)
Free cash flows (a)+(b) 32.8 29.8 5.0 15.0 10.0
Ⅲ.Cash flows from financing activities (19.1) 9.0 61.0 30.0 (15.0)
Ⅳ.Others (1.3) (1.3) - - ー
Net incr.(decr.) in cash and cash equivalents 12.4 37.5 66.0 45.0 (5.0)
FY2020 Outlook(IFRS)Items
FY2019(J-GAAP)
Copyright © 2020 Mitsui Chemicals, Inc.
3. Appendix
This summary contains forward-looking statements about the future plans, strategies, belief and performance of the Mitsui Chemicals Group as a whole and its individual consolidated companies. These forward-looking statements are not historical facts. They are expectations, estimates, forecasts and projections based on information currently available to the Mitsui Chemicals Group and are subject to a number of risks, uncertainties and assumptions, which, without limitation, include economic trends, fluctuations in foreign currency exchange rates, fluctuations in the price of raw materials, competition in markets where the Company is active, personal consumption, market demand, the tax system and other legislation. As such, actual results may differ materially from those projected and the Mitsui Chemicals Group cannot guarantee that these forward-looking statements are accurate or will be achieved.
1) Trends in Product Prices2) Increase/Decrease in Business Segment (Sales revenue and Operating income before
special items, year on year)3) Sales revenue and Operating Income before special items by Business Segment
(by Quarter)4) Financial Summary5) Sales revenue by Region
Copyright © 2020 Mitsui Chemicals, Inc.
1) Trends in Product Prices
3. Appendix 14
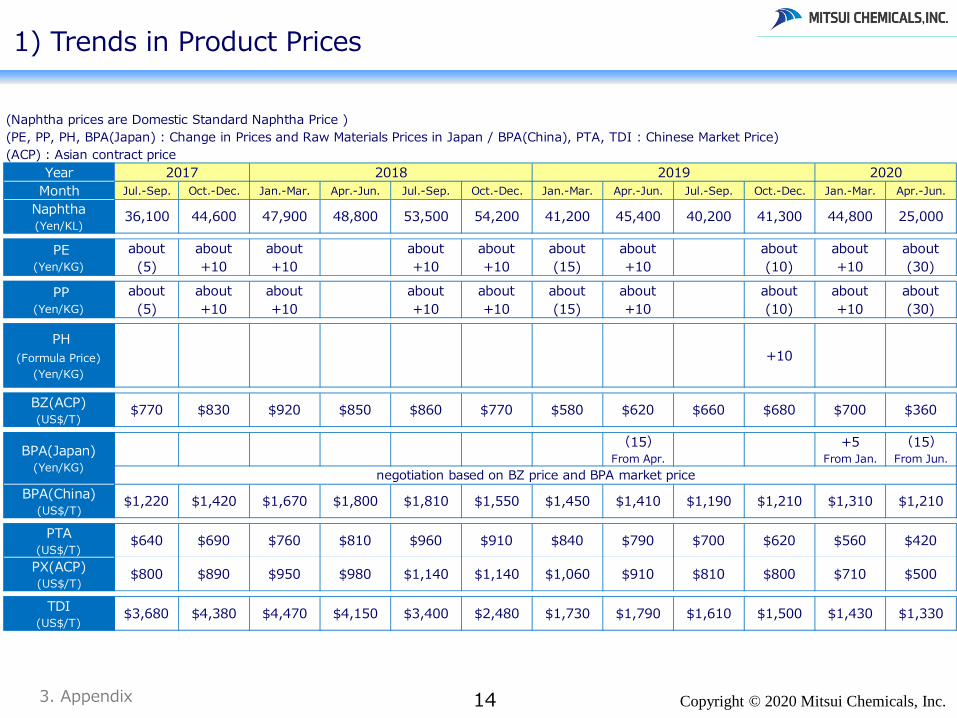
(Naphtha prices are Domestic Standard Naphtha Price )(PE, PP, PH, BPA(Japan) : Change in Prices and Raw Materials Prices in Japan / BPA(China), PTA, TDI : Chinese Market Price)(ACP) : Asian contract price
Year 2017 2018 2019 2020Month Jul.-Sep. Oct.-Dec. Jan.-Mar. Apr.-Jun. Jul.-Sep. Oct.-Dec. Jan.-Mar. Apr.-Jun. Jul.-Sep. Oct.-Dec. Jan.-Mar. Apr.-Jun.
Naphtha(Yen/KL)
36,100 44,600 47,900 48,800 53,500 54,200 41,200 45,400 40,200 41,300 44,800 25,000
PE(Yen/KG)
about(5)
about+10
about+10
about+10
about+10
about(15)
about+10
about(10)
about+10
about(30)
PP(Yen/KG)
about(5)
about+10
about+10
about+10
about+10
about(15)
about+10
about(10)
about+10
about(30)
PH(Formula Price)
(Yen/KG)+10
BZ(ACP)(US$/T)
$770 $830 $920 $850 $860 $770 $580 $620 $660 $680 $700 $360
(15)From Apr.
+5From Jan.
(15)From Jun.
negotiation based on BZ price and BPA market priceBPA(China)
(US$/T)$1,220 $1,420 $1,670 $1,800 $1,810 $1,550 $1,450 $1,410 $1,190 $1,210 $1,310 $1,210
PTA(US$/T)
$640 $690 $760 $810 $960 $910 $840 $790 $700 $620 $560 $420
PX(ACP)(US$/T)
$800 $890 $950 $980 $1,140 $1,140 $1,060 $910 $810 $800 $710 $500
TDI(US$/T)
$3,680 $4,380 $4,470 $4,150 $3,400 $2,480 $1,730 $1,790 $1,610 $1,500 $1,430 $1,330
BPA(Japan)(Yen/KG)
Copyright © 2020 Mitsui Chemicals, Inc.15
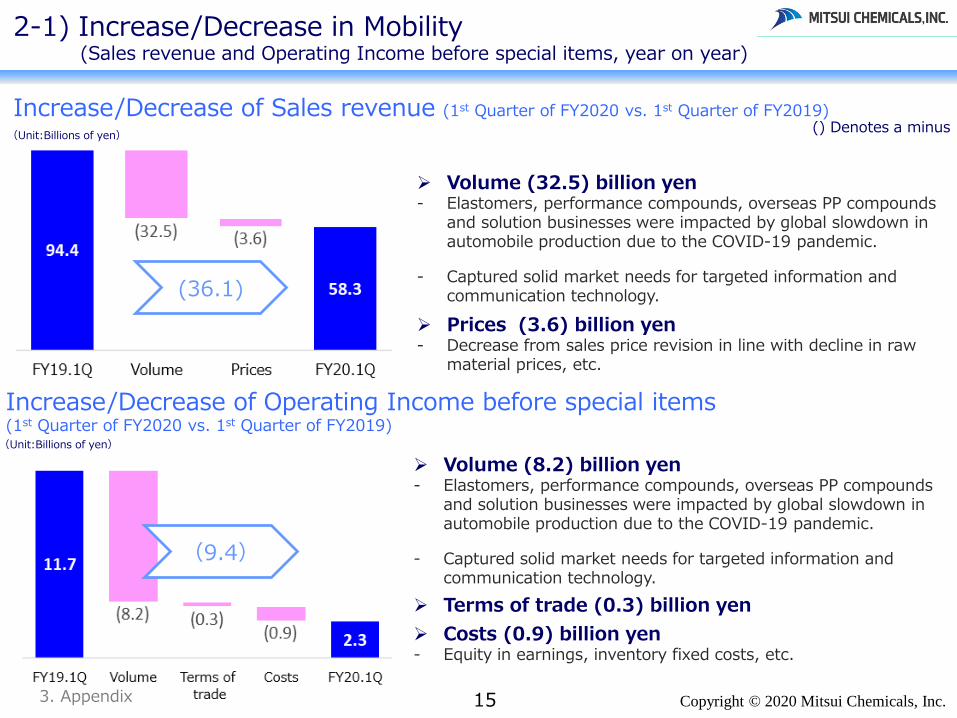
2-1) Increase/Decrease in Mobility(Sales revenue and Operating Income before special items, year on year)
(36.1)
(9.4)
3. Appendix
Volume (32.5) billion yen - Elastomers, performance compounds, overseas PP compounds
and solution businesses were impacted by global slowdown in automobile production due to the COVID-19 pandemic.
- Captured solid market needs for targeted information and communication technology.
Prices (3.6) billion yen- Decrease from sales price revision in line with decline in raw
material prices, etc.
Volume (8.2) billion yen- Elastomers, performance compounds, overseas PP compounds
and solution businesses were impacted by global slowdown in automobile production due to the COVID-19 pandemic.
- Captured solid market needs for targeted information and communication technology.
Terms of trade (0.3) billion yen Costs (0.9) billion yen- Equity in earnings, inventory fixed costs, etc.
() Denotes a minusIncrease/Decrease of Sales revenue (1st Quarter of FY2020 vs. 1st Quarter of FY2019)
Increase/Decrease of Operating Income before special items (1st Quarter of FY2020 vs. 1st Quarter of FY2019)
(Unit:Billions of yen)
(Unit:Billions of yen)

Copyright © 2020 Mitsui Chemicals, Inc.16
2-2) Increase/Decrease in Health Care(Sales revenue and Operating Income before special items, year on year)
(6.3)
(Unit:Billions of yen)
△2.3
(Unit:Billions of yen)
3. Appendix
Volume (5.4) billion yen- Vision care materials and dental materials declined due to
the COVID-19 pandemic.- Healthy sales of nonwovens for diapers, masks and
medical gowns.
Prices (0.9) billion yen- Decrease from sales price revision in line with decline in
raw material prices, etc.
Volume (4.1) billion yen- Vision care materials and dental materials declined due to
the COVID-19 pandemic.- Healthy sales of nonwovens for diapers, masks and
medical gowns.
Terms of trade +0.0 billion yen
Costs +1.8 billion yen- Cost reduction, etc.
() Denotes a minusIncrease/Decrease of Sales revenue (1st Quarter of FY2020 vs. 1st Quarter of FY2019)
Increase/Decrease of Operating Income before special items (1st Quarter of FY2020 vs. 1st Quarter of FY2019)
Copyright © 2020 Mitsui Chemicals, Inc.17
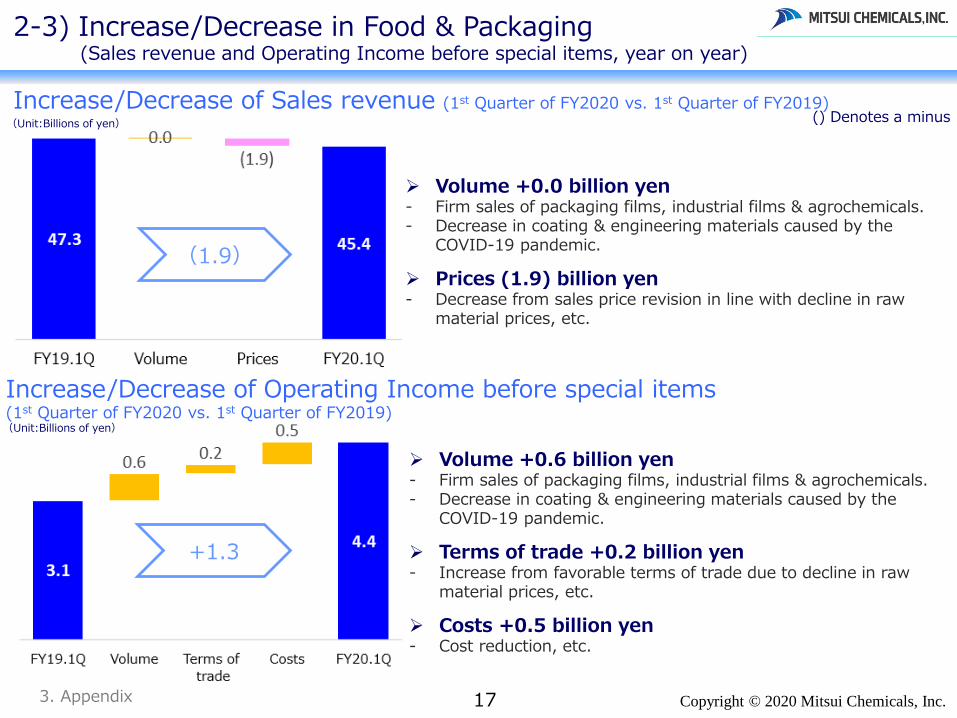
2-3) Increase/Decrease in Food & Packaging(Sales revenue and Operating Income before special items, year on year)
(1.9)
+1.3
3. Appendix
Volume +0.0 billion yen - Firm sales of packaging films, industrial films & agrochemicals.- Decrease in coating & engineering materials caused by the
COVID-19 pandemic.
Prices (1.9) billion yen- Decrease from sales price revision in line with decline in raw
material prices, etc.
Volume +0.6 billion yen - Firm sales of packaging films, industrial films & agrochemicals.- Decrease in coating & engineering materials caused by the
COVID-19 pandemic.
Terms of trade +0.2 billion yen- Increase from favorable terms of trade due to decline in raw
material prices, etc.
Costs +0.5 billion yen- Cost reduction, etc.
(Unit:Billions of yen)
(Unit:Billions of yen)
() Denotes a minusIncrease/Decrease of Sales revenue (1st Quarter of FY2020 vs. 1st Quarter of FY2019)
Increase/Decrease of Operating Income before special items (1st Quarter of FY2020 vs. 1st Quarter of FY2019)

Copyright © 2020 Mitsui Chemicals, Inc.18
2-4) Increase/Decrease in Basic Materials(Sales revenue and Operating Income before special items, year on year)
(45.1)
(13.9)
3. Appendix
Volume (18.8) billion yen - Decrease in olefins and polypropylenes.
Prices (26.3) billion yen- Decrease from sales price revision in line with decline in raw
material prices.- Weaker overseas market, etc.
Volume (3.9) billion yen- Decrease in olefins and polypropylenes.
Terms of trade (7.1) billion yen- Inventory valuation difference, etc.
Costs (2.9) billion yen- Equity in earnings, inventory fixed costs, etc.
(Unit:Billions of yen)
(Unit:Billions of yen)
() Denotes a minusIncrease/Decrease of Sales revenue (1st Quarter of FY2020 vs. 1st Quarter of FY2019)
Increase/Decrease of Operating Income before special items (1st Quarter of FY2020 vs. 1st Quarter of FY2019)

Copyright © 2020 Mitsui Chemicals, Inc.193. Appendix
3) Sales revenue and Operating Income before special items by Business Segment (by Quarter)
(Billions of Yen)Net sales(J-GAAP)
Sales revenue(IFRS)
FY2019 FY2019 FY2020Apr-Jun Jul-Sep Oct-Dec Jan-Mar Apr-Jun Apr-Jun
Mobility 94.1 93.4 90.2 89.9 94.4 58.3Health Care 35.2 34.5 37.0 36.3 35.2 28.9Food & Packaging 45.6 47.4 46.4 54.4 47.3 45.4Basic Materials 163.5 152.3 146.4 154.7 163.7 118.6Others 4.4 4.5 4.2 4.6 4.4 3.3Total 342.8 332.1 324.2 339.9 345.0 254.5
(Billions of Yen) () Denotes a minus
Operating income(J-GAAP)
Operating incomebefore special items
(IFRS)FY2019 FY2019 FY2020
Apr-Jun Jul-Sep Oct-Dec Jan-Mar Apr-Jun Apr-JunMobility 10.1 9.7 9.6 9.8 11.7 2.3Health Care 3.8 2.2 3.8 4.0 3.7 1.4Food & Packaging 3.3 4.6 3.9 6.3 3.1 4.4Basic Materials 6.1 (1.2) 3.7 0.1 7.6 (6.3)Others (2.6) (1.5) (2.5) (1.6) (1.6) (1.2)Total 20.7 13.8 18.5 18.6 24.5 0.6
Segment
Segment

Copyright © 2020 Mitsui Chemicals, Inc.
43.5 58.3
145.9 100.4 82.7 109.5
115.0 135.0
(89.8)
(35.0) (36.4) (47.4)(75.1)(64.3) (85.2)
(120.0)
(46.3)
23.3
109.5
53.0
7.6 45.2
29.8 15.0
(150.0)
(100.0)
(50.0)
0.0
50.0
100.0
150.0
'13 '14 '15 '16 '17 '18 '19 '20
Operating CF Investing CF FCF
24.9 42.0
70.9
102.1 103.5 93.4
71.6
40.0
(25.1)
17.3 23.0
64.8 71.6 76.1
37.9 27.0
(40.0)
(20.0)
0.0
20.0
40.0
60.0
80.0
100.0
120.0
'13 '14 '15 '16 '17 '18 '19 '20
Operating income/Operating income before special items
Profit attributable to owners of parent/Net income attributable to owners of the parent
3.Appendix 20
4-1) Financial Summary
1,432.2 1,411.8
1,258.91,325.5
1,431.31,501.1 1,480.1
1,000
1,200
1,400
1,600
'13 '14 '15 '16 '17 '18 '19
(Billion Yen)
1,566.0 1,550.1 1,343.9
1,212.3 1,328.5
1,482.9 1,339.0
1,170.0
0
500
1,000
1,500
2,000
'13 '14 '15 '16 '17 '18 '19 '20
Net Sales/Sales revenue
Operating income/Operating income before special items &
Profit attributable to owners of parent/ Net income attributable to owners of the parent
(Outlook)
Total Assets
Cash Flows
(Outlook) (Outlook)
0 0
() Denotes a minus
(Billion Yen)(Billion Yen)
*1
*1.Consolidated balance sheet as of FY2017 is restated to reflect changes in presentation from including an impact of “Partial Amendments to Accounting Standard for Tax Effect Accounting”.
~FY19:J-GAAP / FY20~:IFRS
(Billion Yen)

Copyright © 2020 Mitsui Chemicals, Inc.3.Appendix 21
4-2) Financial Summary
Depreciation & AmortizationCapital Expenditure113.2
47.5 43.4 45.4
81.2 61.9
76.3
122.0
0.020.040.060.080.0
100.0120.0140.0
'13 '14 '15 '16 '17 '18 '19 '20
48.1 48.2 48.6 44.1 45.7 49.5 52.1
79.0
0.0
20.0
40.0
60.0
80.0
100.0
'13 '14 '15 '16 '17 '18 '19 '20
*1
R&D Expenses Net D/E Ratio
33.6 32.5 31.5 30.8 33.4 35.8 36.4 36.0
0.0
10.0
20.0
30.0
40.0
50.0
'13 '14 '15 '16 '17 '18 '19 '20
(Billion Yen)
(Outlook) (Outlook)
(Outlook) (Outlook)
1.44
1.22
1.03
0.79 0.75 0.68 0.76 0.80
0.40
0.80
1.20
1.60
0
500
1,000
'13 '14 '15 '16 '17 '18 '19 '20
Net Interest-bearing Liabilities
Equity / Equity attributable to owners of the parent
Net D/E Ratio
(Billion Yen)
*2
~FY19:J-GAAP / FY20~:IFRS(Billion Yen) (Billion Yen)*3
*4
*1. Includes Heraeus dental business acquisition 56.0 billion yen*2. Includes acquisition of shares of ARRK corporation 23.9 billion yen*3. Includes increase due to recognition of regular maintenance and repair
costs etc. under IFRS
*4. Includes increase due to recognition of regular maintenance and repair costs etc. under IFRS

Copyright © 2020 Mitsui Chemicals, Inc.3.Appendix 22
5) Sales revenue by Region
* Asia excluding Japan and China
Japan50%
China18%
Asia*12%
Americas10%
Europe9%
Japan55%
China13%
Asia*13%
Americas12%
Europe7%
FY2019Net Sales
¥1,339.0 billion
Overseas Sales45%
FY2020 1QSales revenue¥254.5 billion
Overseas Sales50%
J-GAAP IFRS

Copyright © 2020 Mitsui Chemicals, Inc.
Creating New Customer Value and Solving Social Challenges through Business Activities