Financial Summary of Medi-Cal Managed Care Health Plans · PDF file31.12.2016 ·...
41
www.HealthHelp.ca.gov HealthHelp.ca.gov Financial Summary of Medi-Cal Managed Care Health Plans Quarter Ending December 31, 2016 Prepared on April 14, 2017
Transcript of Financial Summary of Medi-Cal Managed Care Health Plans · PDF file31.12.2016 ·...

www.HealthHelp.ca.gov
HealthHelp.ca.gov
Financial Summary of Medi-Cal Managed Care Health Plans
Quarter Ending December 31, 2016
Prepared on April 14, 2017

www.HealthHelp.ca.gov
Prepared by: Office of Financial Review
Pritika Dutt, Deputy Director
Stephen Babich, Supervising Examiner
Karanveer Singh, Financial Examiner
Janelle Graham, AGPA

Financial Summary of Medi-Cal Managed Care Plans Page i QE 12/31/16
Table of Contents
Page Number
I. Overview 1
II. Summary of Findings 2
III. Local Initiative Health Plans (LIs)
A. Highlights 3
B. Enrollment Trends 5
C. Financial Trends 8 IV. County Organized Health Systems (COHS)
A. Highlights 15
B. Enrollment Trends 17
C. Financial Trends 20
V. Non-Governmental Medi-Cal Plans
A. Highlights 26

Financial Summary of Medi-Cal Managed Care Plans Page ii QE 12/31/16
B. Enrollment Trends 28
C. Financial Trends 31 VI. Conclusion 36
Tables
Table 1 Enrollment in Local Initiatives December 2015 – December 2016 5
Table 2 Per Member Per Month Medical Expense and Premium Revenue - LI 9
Table 3 LI Net Income by Quarter 12
Table 4 Enrollment in County Organized Health Systems December 2015 - December 2016 17
Table 5 Per Member Per Month Medical Expense and Premium Revenue - COHS 21
Table 6 COHS Net Income by Quarter 23
Table 7 Enrollment in Non-Governmental Medi-Cal Plans December 2015 - December 2016 28
Table 8 Per Member Per Month Medical Expense and Premium Revenue – 32 Non-Governmental Medi-Cal Plans Table 9 Non-Governmental Medi-Cal Plans Net Income by Quarter 34

Financial Summary of Medi-Cal Managed Care Plans Page iii QE 12/31/16
Charts
Chart 1 Medi-Cal Enrollment - All LI Plans 2013-2016 6
Chart 2 Medi-Cal Enrollment by LI Plan 2013-2016 7
Chart 3 Total Medical Expenses - All LI Plans 2013-2016 8
Chart 4 PMPM Medical Expense vs PMPM Premium Revenue - LI 11
Chart 5 Percentage TNE - LI December 2015 - December 2016 13
Chart 6 Medi-Cal Enrollment in COHS Plans 2013-2016 18
Chart 7 Medi-Cal Enrollment by COHS Plan 2013-2016 19
Chart 8 Total Medical Expenses - COHS 2013-2016 20
Chart 9 PMPM Medical Expense vs PMPM Premium Revenue - COHS 22
Chart 10 Percentage TNE by COHS December 2015 - December 2016 24
Chart 11 Medi-Cal Enrollment in Non-Governmental Medi-Cal Plans 2013-2016 29
Chart 12 Medi-Cal Enrollment by Non-Governmental Medi-Cal Plan 2013-2016 30
Chart 13 Total Medical Expenses – Non-Governmental Medi-Cal Plans 2013-2016 31
Chart 14 PMPM Medical Expense vs PMPM Premium Revenue – Non-Governmental Medi-Cal Plans 33
Chart 15 Percentage TNE - Non-Governmental Medi-Cal Plans December 2015 - December 2016 35

Financial Summary of Medi-Cal Managed Care Plans Page 1 QE 12/31/16
I. Overview
Medi-Cal, California’s Medicaid program, has experienced significantly increased enrollment in the last three years due to the transition of children from the Healthy Families Program (HFP) to Medi-Cal and the expansion of Medi-Cal eligibility to low-income individuals under the Patient Protection and Affordable Care Act (ACA).
There are two main Medi-Cal systems administered by the Department of Health Care Services (DHCS) for the delivery of medical services to Medi-Cal beneficiaries: fee-for-service Medi-Cal and Medi-Cal managed care (MCMC). Over two-thirds of Medi-Cal beneficiaries are enrolled in a MCMC plan. Approximately 10.7 million Medi-Cal beneficiaries in all 58 California counties receive their health care through six main models of managed care: Two-Plan Model, County Organized Health Systems (COHS), Geographic Managed Care (GMC), Imperial Model, San Benito Model, and Regional Model. Locally-sponsored plans known as Local Initiatives (LIs) participate as MCMC plans under the Two-Plan Model, while County Organized Health Systems plans serve Medi-Cal enrollees under the COHS Model.1 Both LI and COHS plans are local agencies established by county boards of supervisors to contract with the Medi-Cal program. Approximately 7 million Medi-Cal beneficiaries are enrolled in LI and COHS plans under the Two-Plan and COHS Models. In the two GMC counties, Sacramento and San Diego, DHCS contracts with several commercial plans to serve approximately 1.17 million Medi-Cal beneficiaries. There are about 387,000 Medi-Cal beneficiaries served under the Imperial, San Benito, and Regional models combined.
This report includes enrollment and financial information reported by LI and COHS plans as of the quarter ending December 31, 2016. This report also includes financial results for the Non-Governmental Medi-Cal (NGM) plans. The NGM plans are categorized as any non LI or COHS plan that reports greater than 50% Medi-Cal enrollment. For quarter ending December 31, 2016, NGM plans reported 3.4 million Medi-Cal enrollees. Because LI, COHS, and NGM plans serve primarily Medi-Cal enrollees, Medi-Cal enrollment increases and the rates provided by DHCS are driving factors for the financial performance of these plans.2
1 Counties with the two-plan model offer both a LI and a commercial Medi-Cal managed care plan. In counties using the COHS model, the COHS is the only Medi-Cal managed care plan available. 2 Additionally, medical expenses for these plans increased due to legislation that expanded outpatient mental health benefits available to beneficiaries with mild to moderate impairment of mental, emotional or behavioral functioning resulting from any mental health condition defined by the DSM-IV, and clarified that the Early and Periodic Screening, Diagnostic and Treatment benefit includes the provision of Behavioral Health Treatment to all Medi-Cal children and adolescent beneficiaries 0 to 21 years of age that are diagnosed with Autism Spectrum Disorder.

Financial Summary of Medi-Cal Managed Care Plans Page 2 QE 12/31/16
II. Summary of Findings
Key findings from this report include:
• The financial information for LI and COHS plans was compared to Non-Governmental Medi-Cal (NGM) plans. For the purposes of this report, NGM plans include for-profit and not-for-profit plans with greater than 50% Medi-Cal enrollment. Enrollment information for Blue Cross of California and Kaiser Foundation Health Plan was also included due to the large number of Medi-Cal enrollees they reported. However, they do not meet the definition of a NGM Plan as their Medi-Cal enrollment was less than 50% of their total enrollment.
• LI and COHS enrollment stabilized in 2016, compared to significant growth experienced in 2014 and 2015. NGM plans experienced similar trends.
• All LI, COHS and NGM plans reported increases in their Medi-Cal enrollment from December 2013 to December 2016.
• Increased enrollment contributed to increased medical expenses for LI, COHS and NGM plans.
• Per Member Per Month (PMPM) premium revenue exceeded PMPM medical expense for almost every LI, COHS and NGM plan for December 2016.
• The LI plans reported higher net income than COHS, and COHS reported higher Tangible Net Equity (TNE) reserves than LIs. However, both the LI and COHS plans continue to report healthy TNE reserves. In comparison, NGM plans reported higher net income with lower TNE reserves. This is in part due to a majority of the NGM plans paying dividends to parent companies/shareholders thereby reducing the reserve levels. In comparison, LI and COHS plans may need to hold on to higher reserves to alleviate any potential capital expenditure needs or future economic downturn.

Financial Summary of Medi-Cal Managed Care Plans Page 3 QE 12/31/16
III. Local Initiative Health Plans (LI) A. Highlights
• At present, 14 counties participate in the Two-Plan Model of Medi-Cal managed care. In 13 of these counties,
the DHCS contracts with both a commercial plan and a LI plan; in Tulare County, the DHCS contracts with two commercial plans: Anthem Blue Cross and Health Net. The LIs must be licensed under the Knox-Keene Health Care Service Plan Act of 1975, as amended (Knox-Keene Act), for their Medi-Cal lines of business.
• Beneficiaries in the Two-Plan Model have a choice between the two plans. Beneficiaries who do not make a selection are automatically assigned to a plan. The DHCS uses an algorithm based on quality and use of safety net providers to make the assignments. Overall, there are nearly three times as many Medi-Cal beneficiaries enrolled in LI plans as in commercial plans in Two-Plan Model counties.3
• Medi-Cal providers who wish to provide services to managed care enrollees must participate in the managed care plan’s provider network.
• The LIs and the counties in which they provide services are as follows:
o Alameda Alliance For Health (Alameda Alliance) – Alameda o Contra Costa County Medical Services (Contra Costa Health Plan or Contra Costa) – Contra Costa o Fresno-Kings-Madera Regional Health Authority (CalViva) – Fresno, Kings, and Madera o San Joaquin County Health Commission (Health Plan of San Joaquin or San Joaquin) – San Joaquin
and Stanislaus o Inland Empire Health Plan (IEHP) – Riverside and San Bernardino o Kern Health Systems (Kern) - Kern o Local Initiative Health Authority for L.A County (L.A. Care) – Los Angeles o San Francisco Community Health Authority (San Francisco) – San Francisco o Santa Clara County Health Authority (Santa Clara) – Santa Clara
3 http://www.chcf.org/~/media/MEDIA LIBRARY Files/PDF/PDF M/PDF MonitoringPerformanceLocalVersusCommericalMediCalPlans.pdf
Financial Summary of Medi-Cal Managed Care Plans Page 4 QE 12/31/16
• LI plans reported combined enrollment of 5.1 million individuals as of December 31, 2016. Over 5 million (97%) of the total LI enrollment are Medi-Cal beneficiaries. The remaining 3% of non-Medi-Cal LI enrollment includes other lines of business such as In-Home Supportive Services (IHSS), Healthy Kids, or the Access for Infants and Mothers Program (AIM).
• Total LI plan enrollment increased by 8% from December 2015 to December 2016.
• Per member per month medical (PMPM) expenses and premium revenue stabilized at December 2016 as a result of Medi-Cal Coverage Expansion (MCE) rate adjustments for the 2016/2017 fiscal year. All LI plans’ PMPM premium revenue outpaced expenses for December 2016.
• LI plans reported $149 million in net income in December 2016, which was about 6% higher than the $141 million net income reported in December 2015, and 142% higher than the quarter ending September 30, 2016.
• The LIs reported TNE that ranged from 313% to 996% of required TNE. • The LIs reported negative $14 million in cash flow from operations, which was significantly lower than the $503
million reported in December 2015. This is a significant change from September 2016 when the LIs reported cash flow from operations of $1.3 billion. The variation in cash flow from operations is attributed to the timing of Medi-Cal premium revenue paid by DHCS and the MCE rate adjustments for the 2016/2017 fiscal year.

Financial Summary of Medi-Cal Managed Care Plans Page 5 QE 12/31/16
B. Enrollment Trends – LI
The LI plans serve 5.1 million enrollees in 13 counties in California. Total enrollment increased by 8% since December 2015. The table below lists LI total enrollment and the percentage of total LI enrollment accounted for by Medi-Cal lives. The table also shows the increase in enrollment from December 2015 to December 2016. L.A. Care and IEHP reported the largest percentage increases in enrollment at 9% and 12%, respectively.
Table 1 Enrollment in Local Initiatives
December 2015 – December 2016
Local Initiative
Total Medi-Cal
Enrollment December
2016
Percentage of Medi-Cal Enrollment December
2016
Total Enrollment December
20164
Total Enrollment December
2015
Enrollment Increase
Percentage Enrollment
Increase
Alameda Alliance 261,424 98% 267,040 266,603 437 0.2% Contra Costa 184,751 95% 195,278 187,885 7,393 3.9%
CalViva 359,697 100% 359,697 340,104 19,593 5.8% IEHP 1,235,065 98% 1,257,559 1,127,581 129,978 11.5% Kern 234,491 100% 234,491 216,581 17,910 8.3% L.A. Care 1,986,581 97% 2,056,926 1,894,463 162,463 8.6%
San Francisco 136,055 92% 148,160 146,784 1,376 0.9% San Joaquin 343,803 99% 347,717 326,800 20,917 6.4% Santa Clara 270,000 96% 280,127 271,984 8,143 3.0% Total 5,011,867 97% 5,146,995 4,778,785 368,210 7.7%
4 The total enrollment consists of Large Group Commercial, Medicare Risk, Medicare Supplement, Medi-Cal Risk, ASO, IHSS, and contracted from other plans.

Financial Summary of Medi-Cal Managed Care Plans Page 6 QE 12/31/16
Chart 1 illustrates the MCMC enrollment trend in LIs over the last four years by comparing December year-over-year data.
Chart 1
Medi-Cal enrollment in LIs continues to increase. Two Southern California LI plans, L.A. Care and IEHP, reported the highest number of enrollees and make up the majority of the enrollment increase. L.A. Care and IEHP reported Medi-Cal enrollment of 2 million and 1.25 million, respectively.
2,753
4,026
4,636
5,012
1,500
2,000
2,500
3,000
3,500
4,000
4,500
5,000
5,500
Dec-13 Dec-14 Dec-15 Dec-16
Thou
sand
s
Medi-Cal Enrollment - All LI Plans 2013-2016

Financial Summary of Medi-Cal Managed Care Plans Page 7 QE 12/31/16
Chart 2 shows the LI growth in Medi-Cal enrollment by plan over the past four years.
Chart 2
All nine LIs have experienced increases in enrollment. The majority of the increases were from their Medi-Cal lines of business. From December 2015 to December 2016, IEHP and L.A. Care experienced 12% and 9% increases in enrollment, respectively. Total Medi-Cal enrollment for LI plans increased by 82% from 2013 to 2016.
0
500
1,000
1,500
2,000
2,500
AlamedaAlliance
ContraCosta
CalViva IEHP Kern L.A. Care SanFrancisco
SanJoaquin
SantaClara
Thou
sand
s
Dec-13Dec-14Dec-15Dec-16
Medi-Cal Enrollment by LI Plan 2013 - 2016

Financial Summary of Medi-Cal Managed Care Plans Page 8 QE 12/31/16
C. Financial Trends - LI
Medical Expenses
Chart 3 illustrates total medical expenses for the LIs compared to the same quarter over the last four years. Total medical expenses continued to increase in the quarter ending December 2016. The change in medical expenses is correlated to the increase in the LIs’ enrollment and expanded Medi-Cal benefits. Generally, total medical expenses change as enrollment, enrollee mix (healthy or unhealthy, high or low utilizers) and Medi-Cal benefits change.
Chart 3
$1,623
$3,449
$3,864
$4,372
$0
$500
$1,000
$1,500
$2,000
$2,500
$3,000
$3,500
$4,000
$4,500
$5,000
Dec-13 Dec-14 Dec-15 Dec-16
Mill
ions
Total Medical Expenses - All LI Plans 2013 - 2016

Financial Summary of Medi-Cal Managed Care Plans Page 9 QE 12/31/16
Per Member Per Month Medical Expense and Premium Revenue – LI
Table 2 shows the PMPM medical expense and premium revenue of the LIs for the quarter ending in December for the past four years, as well as the difference in PMPM medical expense and premium revenue for December 2016. L.A. Care and San Francisco reported the highest PMPM medical expense and premium revenue. All LIs had higher PMPM premium revenue than medical expenses for December 2016.
Table 2 Per Member Per Month Medical Expenses and Premium Revenue – LI
2013 – 2016
Local Initiative
Dec-13 Dec-14 Dec-15 Dec-165 PMPM Medical Expense
PMPM Premium Revenue
PMPM Medical Expense
PMPM Premium Revenue
PMPM Medical Expense
PMPM Premium Revenue
PMPM Medical Expense
PMPM Premium Revenue
Net6 Revenue
Alameda Alliance $239 $226 $308 $335 $236 $263 $229 $279 $50
Contra Costa 134 132 285 307 293 306 280 283 $3
CalViva 163 182 283 295 252 265 266 277 $11
IEHP 163 172 275 301 270 304 269 301 $32
Kern 212 172 209 226 207 238 199 229 $30
L.A. Care 188 196 285 306 277 292 300 316 $16
San Francisco 231 265 316 349 291 329 296 318 $22
San Joaquin 171 175 241 267 222 240 201 239 $38
Santa Clara 155 186 249 268 277 294 280 301 $21 5 December 2015 and December 2016 PMPM Medical Expense and Premium Revenue information excludes pass through income and expense items. 6 Difference between December 2016 PMPM Medical Expense and PMPM Premium Revenue.

Financial Summary of Medi-Cal Managed Care Plans Page 10 QE 12/31/16
PMPM medical expense is calculated by dividing the total medical expenses by cumulative member months. PMPM premium revenue is calculated by dividing the premium revenues by cumulative member months. Fluctuations in PMPM medical expense and premium revenue can be due to a number of factors including utilization of medical services by enrollees, and premium rate adjustments.

Financial Summary of Medi-Cal Managed Care Plans Page 11 QE 12/31/16
PMPM Medical Expense vs. PMPM Premium Revenue - LI
Chart 4 illustrates the LI plans’ PMPM medical expense vs PMPM premium revenue for December 2016. The PMPM premium revenue received exceeded the PMPM medical expense for each LI.
Chart 4
$0
$50
$100
$150
$200
$250
$300
$350
AlamedaAlliance
ContraCosta
CalViva IEHP Kern L.A. Care SanFrancisco
SanJoaquin
SantaClara
PMPM Medical Expenses vs PMPM Premium Revenue - LI December 2016
PMPMMedicalExpenses
PMPMPremiumRevenue

Financial Summary of Medi-Cal Managed Care Plans Page 12 QE 12/31/16
Net Income - LI
Table 3 shows the Net Income for LI plans over the past six quarters. For the quarter ending (QE) December 2016, all except one LI plan reported positive net income. Net income or loss is directly related to premium revenue and medical expenses.
Table 3 LI Net Income by Quarter (in thousands)
Local Initiative QE Sep-15
QE Dec-15
QE Mar-16
QE Jun-16
QE Sep-16
QE Dec-16
Alameda Alliance $20,582 $7,833 $6,152 $13,817 $11,198 $27,886
Contra Costa 4,526 4,528 2,166 572 4,290 35
CalViva 3,058 2,942 2,443 3,086 3,320 3,332
IEHP 63,093 77,857 47,696 39,555 46,711 43,844
Kern 10,300 12,882 6,297 18,076 19,447 15,367
L.A. Care 128,078 12,532 21,180 36,535 (39,375) 21,262
San Francisco 10,345 8,661 4,833 6,085 1,165 (185)
San Joaquin 2,346 8,911 (2,911) 18,326 11,307 30,508
Santa Clara 3,319 4,428 3,259 16,656 3,655 7,205
Total LI Net Income $245,647 $140,574 $91,115 $152,708 $61,718 $149,254

Financial Summary of Medi-Cal Managed Care Plans Page 13 QE 12/31/16
Tangible Net Equity - LI
TNE is a reserve requirement described in section 1300.76 of the Knox-Keene regulations7 and a measure of the financial health of plans. TNE is defined as a health plan’s total assets minus total liabilities reduced by the value of intangible assets (i.e., goodwill8, organizational or start-up costs, etc.) and unsecured obligations of officers, directors, owners, or affiliates outside the normal course of business. Any debt that is properly subordinated9 may be added to the TNE calculation, which serves to increase the plan’s TNE. All the LIs had TNE that exceeded the regulatory requirements.
Chart 5
7 “Knox-Keene regulations” refer to the regulations promulgated pursuant to the Knox-Keene Health Care Service Plan Act, as amended, found at Title 28, Division 1, Chapter 1, California Code of Regulations, beginning with Section 1300.43. 8 Goodwill is an intangible asset that arises as a result of the acquisition of one company by another for a premium value. 9 Subordinated debt is a loan that ranks below other loans with regard to claims on assets or earnings. In the case of default, creditors with subordinated debt would not get paid out until after the other creditors were paid in full.
0%
200%
400%
600%
800%
1000%
1200%
Dec-15 Mar-16 Jun-16 Sep-16 Dec-16
Alameda Alliance
Contra Costa
CalViva
IEHP
Kern
L.A. Care
San Francisco
San Joaquin
Santa Clara
Percentage TNE - LI Plans December 2015 to December 2016

Financial Summary of Medi-Cal Managed Care Plans Page 14 QE 12/31/16
The Department’s minimum requirement for TNE reserves is 100% of required TNE. If the health plan’s TNE falls below 130%, the health plan must file monthly financial statements with the Department. If a health plan reports a TNE deficiency (TNE below 100%), the Department may take enforcement action against the plan.
The average TNE for the LIs overall was stable in 2015 and the trend continued in 2016. For December 2016, the reported TNE ranged from 313% to 996% of required TNE.
Cash Flow from Operations
Cash flow from operations measures the amount of cash generated by a plan’s normal business operations. This is important because it indicates whether a company is able to generate sufficient positive cash flow to maintain and grow operations.
Three of the nine LI plans reported negative cash flow from operations in December 2016. The cash flow from operations totaled negative $14 million in December 2016 compared to $502 million in December 2015. The variation in cash flow from operations is attributed to the timing of Medi-Cal premium revenue paid by DHCS and the MCE rate adjustments for the 2016/2017 fiscal year which occurred in July 2016.
Claims
Pursuant to the Knox-Keene Act, full service health plans are required to process 95% of their claims within 45 working days. Health plans are required to submit to the Department, on a quarterly basis, a claims settlement practice report if the Plan fails to process 95% of its claims timely and/or the plan identifies any emerging patterns of claims payment deficiencies. For the quarter ending December 31, 2016, Contra Costa failed to process 95% of their claims within 45 working days. Santa Clara reported emerging claims payment deficiencies. Each Plan submitted a corrective action plan outlining measures they are taking to comply with the regulations.

Financial Summary of Medi-Cal Managed Care Plans Page 15 QE 12/31/16
IV. County Organized Health Systems (COHS) A. Highlights
• Six COHS plans currently serve 22 counties. The COHS plans and the counties in which they provide services
are: o Orange County Health Authority (CalOptima) – Orange o Partnership HealthPlan of California (Partnership HealthPlan) – Del Norte, Humboldt, Lake, Lassen,
Marin, Mendocino, Modoc, Napa, Shasta, Siskiyou, Solano, Sonoma, Trinity, and Yolo o Santa Barbara San Luis Obispo Regional Health Authority (CenCal Health) – Santa Barbara and San
Luis Obispo o Santa Cruz-Monterey-Merced Managed Medical Care Commission (Central California Alliance for
Health) – Merced, Monterey, and Santa Cruz o San Mateo Health Commission (Health Plan of San Mateo) – San Mateo o Gold Coast Health Plan (Gold Coast) – Ventura
• Medi-Cal beneficiaries in COHS counties have only one MCMC option.
• While California law exempts COHS plans from Knox-Keene licensure for Medi-Cal, COHS plans must have a
Knox-Keene license for other lines of business. Only the Health Plan of San Mateo has voluntarily included its Medi-Cal enrollment under its Knox-Keene license, however, CalOptima, CenCal Health, Central California Alliance for Health and Partnership HealthPlan have Knox-Keene licenses for other lines of business such as Healthy Kids, IHSS, AIM and Medicare Advantage. Gold Coast Health Plan has no Knox-Keene license, and has only one Medi-Cal line of business. Therefore, this report does not include information for Gold Coast.
• Enrolled beneficiaries choose their health care provider from among the COHS plan contracted providers.
Financial Summary of Medi-Cal Managed Care Plans Page 16 QE 12/31/16
• COHS plans’ enrollment increased 2% from December 2015 to December 2016. Health Plan of San Mateo’s PMPM Medical Expense outpaced its premium revenue for December 2016. Medical expenses at CenCal Health decreased from December 2015.
• COHS plans reported $58,000 in net loss in December 2016 compared to $142 million in net income in December 2015 due to significant net loss for the Health Plan of San Mateo.
• Tangible net equity for COHS plans ranged from 700% to 1,478% of required TNE. Two of the five reporting COHS plans reported higher TNE from December 2015 to December 2016.
• COHS plans reported $571 million in cash flow from operations in December 2016 compared to $424 million in December 2015. The variation in cash flow from operations is attributed to the timing of Medi-Cal premium revenue paid by DHCS and the MCE rate adjustments for the 2016/2017 fiscal year.

Financial Summary of Medi-Cal Managed Care Plans Page 17 QE 12/31/16
B. Enrollment Trends - COHS COHS plans have reported consistent increases in enrollment since 2013; however, enrollment has stabilized in the 2016. CalOptima and Partnership HealthPlan reported the highest enrollment numbers. All COHS plans reported increases in total enrollment compared to December 2015, except the Health Plan of San Mateo, who had a slight decrease in total enrollment.
Table 4 Enrollment in County Organized Health Systems
December 2015 – December 2016
COHS
December 2016 Total Medi-Cal
Enrollment
December 2016
Percentage of Medi-Cal Enrollment
December 2016 Total Enrollment
December 2015 Total Enrollment
Enrollment Change from
December 2015 to December
2016
Percentage Enrollment
Change from December 2015 to
December 2016
CalOptima 781,733 98% 800,001 796,331 3,670 0.5%
CenCal Health 179,122 100% 179,155 172,812 6,343 3.7% Central California Alliance for Health 351,466 99.8% 352,112 340,028 12,084 3.6% Partnership HealthPlan 571,581 100.0% 571,581 557,869 13,712 2.5% Health Plan of San Mateo 124,554 91% 136,248 137,841 (1,593) -1.2%
Total 2,008,456 98% 2,039,097 2,004,881 34,216 1.7%

Financial Summary of Medi-Cal Managed Care Plans Page 18 QE 12/31/16
Chart 6 illustrates the Medi-Cal managed care enrollment trend in COHS plans. Medi-Cal enrollment in COHS plans has almost doubled over the last four years.
Chart 6
1,221
1,774
1,971 2,008
0
500
1,000
1,500
2,000
2,500
Dec-13 Dec-14 Dec-15 Dec-16
Thou
sand
s
Total Medi-Cal Enrollment in COHS Plans 2013 - 2016
Financial Summary of Medi-Cal Managed Care Plans Page 19 QE 12/31/16
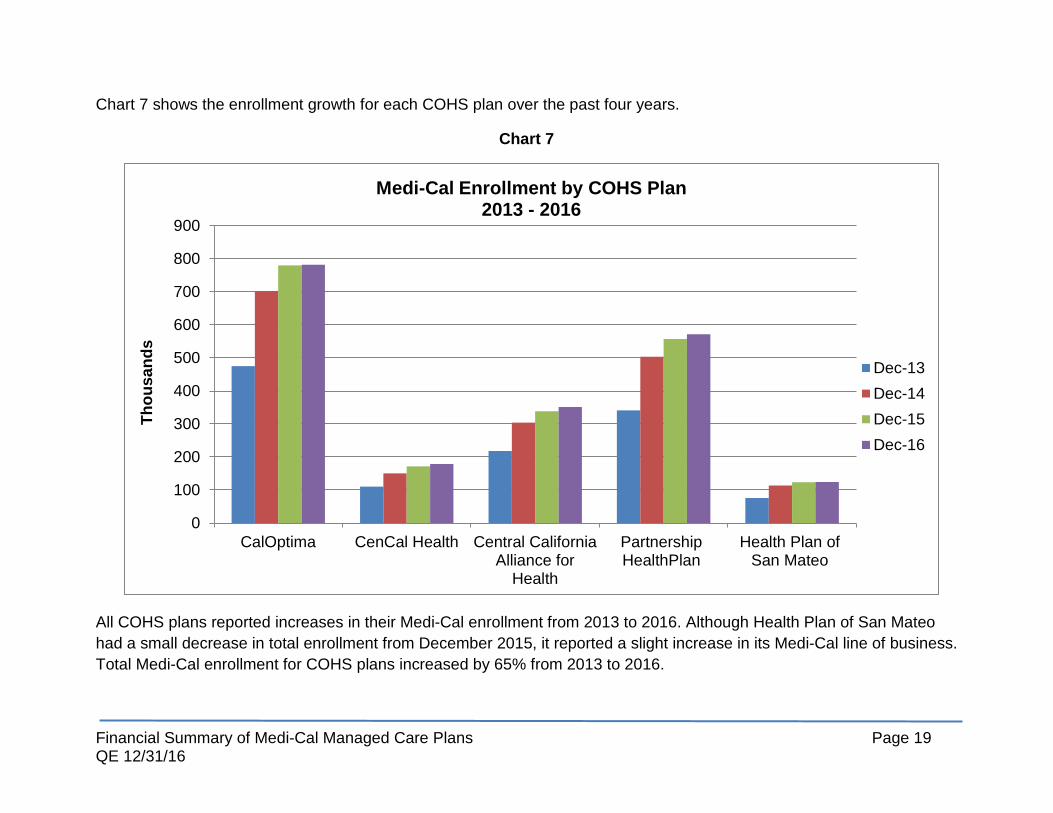
Chart 7 shows the enrollment growth for each COHS plan over the past four years.
Chart 7
All COHS plans reported increases in their Medi-Cal enrollment from 2013 to 2016. Although Health Plan of San Mateo had a small decrease in total enrollment from December 2015, it reported a slight increase in its Medi-Cal line of business. Total Medi-Cal enrollment for COHS plans increased by 65% from 2013 to 2016.
0
100
200
300
400
500
600
700
800
900
CalOptima CenCal Health Central CaliforniaAlliance for
Health
PartnershipHealthPlan
Health Plan ofSan Mateo
Thou
sand
s
Medi-Cal Enrollment by COHS Plan 2013 - 2016
Dec-13Dec-14Dec-15Dec-16

Financial Summary of Medi-Cal Managed Care Plans Page 20 QE 12/31/16
C. Financial Trends - COHS
Similar to LI plans, Chart 8 shows a continued increase in medical expenses for COHS plans.
Chart 8
$992
$1,728 $1,795 $1,945
$0
$500
$1,000
$1,500
$2,000
$2,500
Dec-13 Dec-14 Dec-15 Dec-16
Mill
ions
Total Medical Expenses - COHS 2013 - 2016

Financial Summary of Medi-Cal Managed Care Plans Page 21 QE 12/31/16
Per Member Per Month Medical Expense and Premium Revenue - COHS Table 5 shows the PMPM medical expense and premium revenue of the COHS plans for the quarter ending in December for the past four years, as well as the difference between the PMPM medical expense and premium revenue for December 2016.
Almost all COHS plans had higher PMPM premium revenue than medical expenses at December 2016. Only the Health Plan of San Mateo reported a higher PMPM medical expense than premium revenue.
Table 5 Per Member Per Month Medical Expense and Premium Revenue – COHS
2013-2016
COHS
Dec-13 Dec-14 Dec-15 Dec-1610
PMPM Medical Expense
PMPM Premium Revenue
PMPM Medical Expense
PMPM Premium Revenue
PMPM Medical Expense
PMPM Premium Revenue
PMPM Medical Expense
PMPM Premium Revenue
Net Revenue11
CalOptima $240 $266 $367 $402 $310 $322 $341 $352 $11
CenCal Health 236 260 266 308 269 340 248 291 $43 Central California Alliance for Health 202 349 205 262 227 264 232 274 $42 Partnership HealthPlan 297 343 299 358 304 349 328 347 $19 Health Plan of San Mateo 420 614 469 613 450 597 466 382 ($84)
10 December 2015 and December 2016 PMPM Medical Expense and PMPM Premium Revenue information excludes pass through income and expense items. 11 Difference between December 2016 PMPM Medical Expense and PMPM Premium Revenue.

Financial Summary of Medi-Cal Managed Care Plans Page 22 QE 12/31/16
PMPM Medical Expense vs PMPM Premium Revenue
Chart 9 illustrates the COHS plans’ PMPM medical expense vs PMPM premium revenue for December 2016. Almost all plans reported premium revenue that was higher than per member per month expenses.
Chart 9
$0
$100
$200
$300
$400
$500
CalOptima CenCal Health Central CaliforniaAlliance for Health
PartnershipHealthPlan
Health Plan of SanMateo
PMPM Medical Expenses vs PMPM Premium Revenue - COHS December 2016
PMPMMedicalExpenses
PMPMPremiumRevenue

Financial Summary of Medi-Cal Managed Care Plans Page 23 QE 12/31/16
Net Income - COHS
Favorable PMPM premium revenue ratios translated to positive net income for almost all of the COHS plans. Only the Health Plan of San Mateo reported a negative net income.
Table 6 COHS Net Income by Quarter (in thousands)
COHS
QE
Sep-15 QE
Dec-15 QE
Mar-16 QE
Jun-16 QE
Sep-16 QE
Dec-16
CalOptima $9,338 $(1,228) $15,025 $9,389 $2,564 $501
CenCal Health 8,664 24,117 19,769 8,672 15,802 15,878
Central California Alliance for Health 24,434 23,696 34,169 12,060 10,986 23,381
Partnership HealthPlan 52,384 50,926 34,908 28,817 18,771 6,132
Health Plan of San Mateo 28,861 44,758 11,976 14,013 (376) (45,950)
Total COHS Net Income $123,681 $142,269 $115,847 $72,951 $47,749 $(58)

Financial Summary of Medi-Cal Managed Care Plans Page 24 QE 12/31/16
Tangible Net Equity – COHS All COHS plans reported 700% or more of required TNE for December 2016. TNE to Required TNE ranged from 700% to 1,478%. The Health Plan of San Mateo reported a decrease in TNE from 1133% to 957% from September 2016 to December 2016.
Chart 10
0%
200%
400%
600%
800%
1000%
1200%
1400%
1600%
Dec-15 Mar-16 Jun-16 Sep-16 Dec-16
Percentage TNE by COHS December 2015 - December 2016
CalOptima
CenCal Health
Central CaliforniaAlliance for HealthPartnershipHealthPlanSan Mateo

Financial Summary of Medi-Cal Managed Care Plans Page 25 QE 12/31/16
Cash Flow from Operations
COHS plans reported $571 million in cash flow from operations in December 2016. Similar to the LIs, COHS plans’ variation in cash flow from operations is attributed to the timing of Medi-Cal premium revenue paid by DHCS and the MCE rate adjustments for the 2016/2017 fiscal year.
Claims
Pursuant to the Knox-Keene Act, full service health plans are required to process 95% of their claims within 45 working days. COHS plans did not report any claims processing or emerging claims payment deficiencies for December 2016.

Financial Summary of Medi-Cal Managed Care Plans Page 26 QE 12/31/16
V. Non-Governmental Medi-Cal Plans A. Highlights
• For the purposes of this report, Non-Governmental Medi-Cal (NGM) plans include plans with greater than 50%
Medi-Cal enrollment.
• Five NGM plans currently serve approximately 31 counties. The NGM plans and the counties in which they provide services are:
o California Health and Wellness Plan - Alpine, Amador, Butte, Calaveras, Colusa, Del Norte, El Dorado, Glenn, Imperial, Inyo, Mariposa, Mono, Nevada, Placer, Plumas, Sierra, Sutter, Tehama, Tuolumne, and Yuba.
o Care 1st Health Plan - Los Angeles and San Diego. o Community Health Group - San Diego. o Health Net Community Solutions, Inc. (HNCS) - Fresno, Kern, Kings, Los Angeles, Madera, Sacramento,
San Diego, San Joaquin, Stanislaus, and Tulare counties. In Kern, Los Angeles, San Joaquin, Stanislaus and Tulare counties, HNCS participates in the two-plan model and competes with the LI plans for enrollment. In Sacramento and San Diego counties, HNCS participates in the GMC model and contracts directly with DHCS.
o Molina Healthcare of California (Molina Healthcare) - Imperial, Los Angeles, Sacramento, Riverside, San Bernardino, and San Diego. In Sacramento and San Diego counties, Molina Healthcare participates in the GMC model and contracts directly with DHCS.
• The structure among the NGM plans varies in the following ways: o California Health and Wellness Plan is a for-profit wholly owned subsidiary of Centene Corporation
(Centene), a publicly traded company. o Care 1st Health Plan was acquired by California Physicians’ Services (Blue Shield) in October 2015 and
was converted from a for-profit plan to a not-for-profit plan.

Financial Summary of Medi-Cal Managed Care Plans Page 27 QE 12/31/16
o Community Health Group participates in the GMC model and contracts directly with DHCS. Community Health Group is a not-for-profit health plan.
o Health Net Community Solutions, Inc. is a for-profit wholly owned subsidiary of Health Net, Inc., which was recently acquired by Centene.
o Molina Healthcare of California is a for-profit wholly owned subsidiary of Molina Healthcare, Inc., a publicly traded company.
• NGM plans provide and administer health care services to Medi-Cal beneficiaries either as a direct contractor to DHCS, or as subcontractors to other health plans that contract with the DHCS. For example, L.A. Care subcontracts its Medi-Cal enrollment to Care 1st and Molina Healthcare in Los Angeles County.
• There also are two commercial plans that serve another 1.9 million Medi-Cal enrollees (Blue Cross of California (Blue Cross) – 1,267,094 enrollees and Kaiser Foundation Health Plan (Kaiser) – 647,873 enrollees). Enrollment information for these two plans was included in this report. However, financial solvency indicators are not included since both of these plans report over 50% of other types of enrollment (Commercial, Medicare) and their financial solvency is significantly impacted by these other lines of business. Both Anthem and Kaiser are in solid financial health.
• NGM plans’ enrollment increased 5% from December 2015 to December 2016. Similar to LI and COHS plans, per member per month expenses and premium revenue rose for NGM plans in conjunction with increased enrollment and expanded Medi-Cal benefits. NGM plans’ PMPM premium revenue outpaced expenses for December 2016.
• NGM plans reported $429 million in net income in December 2016, a significant increase compared to net income of $295 million reported in December 2015 and $270 million in September 2016.
• Tangible net equity for NGM plans ranged from 250% to 1010% of required TNE at December 2016. Four of the five reporting NGM plans reported progressively higher TNE from December 2015 to December 2016.
• NGM plans reported $930 million in cash flow from operations in December 2016 compared to $332 million at December 2015 and $721 million in September 2016.

Financial Summary of Medi-Cal Managed Care Plans Page 28 QE 12/31/16
B. Enrollment Trends - Non-Governmental Medi-Cal Plans
Like LI and COHS plans, NGM plans have reported consistent increases in enrollment since 2013. Health Net Community Solutions, Inc. and Molina Healthcare reported the highest enrollment numbers. In addition to the NGM plans, two other commercial plans serve 1.9 million Medi-Cal enrollees - Blue Cross of California and Kaiser Foundation Health Plan.
Table 7
Enrollment in Non-Governmental Medi-Cal Plans December 2015 – December 2016
Non-Governmental Medi-Cal Plans
December 2016 Total Medi-Cal
Enrollment
December 2016
Percentage of Medi-Cal Enrollment
December 2016 Total Enrollment
December 2015 Total Enrollment
Enrollment Change from
December 2015 to
December 2016
Percentage Enrollment
Change from December 2015 to
December 2016
California Health and Wellness Plan 188,366 100% 188,366 185,272 3,094 2% Care 1st Health Plan 409,344 85% 478,897 437,010 41,887 10% Community Health Group 291,313 100% 291,313 271,232 20,081 7% Health Net Community Solutions 1,859,525 99% 1,873,457 1,848,395 25,062 1% Molina Healthcare 617,472 90% 684,342 617,659 66,683 11% Total Medi-Cal Enrollment in NGMs 3,366,020 96% 3,516,375 3,359,568 156,807 5% Blue Cross 1,267,094 31% 4,066,964 3,890,326 176,638 5% Kaiser 647,873 8% 8,113,192 7,818,952 294,240 4%
Grand Total 5,280,987 34% 15,696,531 15,068,846 627,685 4%

Financial Summary of Medi-Cal Managed Care Plans Page 29 QE 12/31/16
Chart 11 illustrates the Medi-Cal Managed Care enrollment trend in NGM plans. This chart does not include the Medi-Cal Managed Care enrollment reported by Blue Cross and Kaiser.
Chart 11
1,918
2,880
3,282 3,366
0
500
1,000
1,500
2,000
2,500
3,000
3,500
4,000
Dec-13 Dec-14 Dec-15 Dec-16
Thou
sand
s
Total Medi-Cal Enrollment in Non-Governmental Medi-Cal Plans 2013-2016
Financial Summary of Medi-Cal Managed Care Plans Page 30 QE 12/31/16
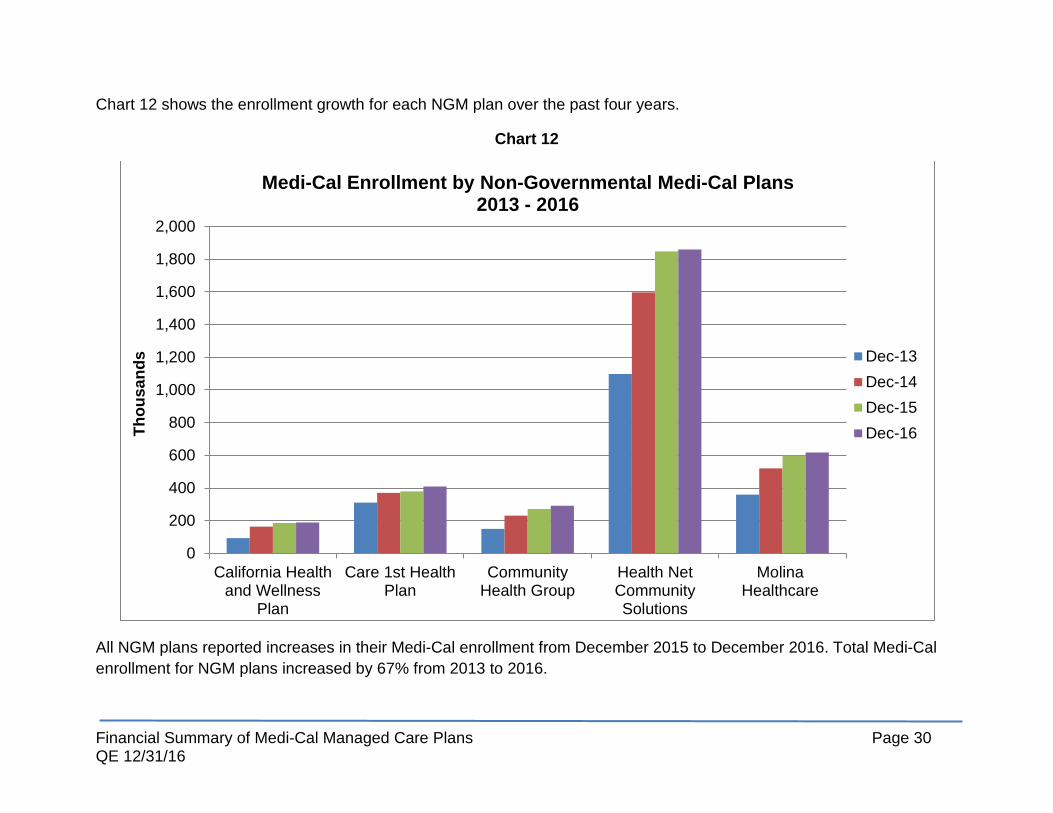
Chart 12 shows the enrollment growth for each NGM plan over the past four years.
Chart 12
All NGM plans reported increases in their Medi-Cal enrollment from December 2015 to December 2016. Total Medi-Cal enrollment for NGM plans increased by 67% from 2013 to 2016.
0
200
400
600
800
1,000
1,200
1,400
1,600
1,800
2,000
California Healthand Wellness
Plan
Care 1st HealthPlan
CommunityHealth Group
Health NetCommunitySolutions
MolinaHealthcare
Thou
sand
s
Medi-Cal Enrollment by Non-Governmental Medi-Cal Plans 2013 - 2016
Dec-13Dec-14Dec-15Dec-16

Financial Summary of Medi-Cal Managed Care Plans Page 31 QE 12/31/16
C. Financial Trends – Non-Governmental Medi-Cal Plans
Similar to LI and COHS plans, Chart 13 shows an increase in medical expenses for NGM plans. This chart does not include the medical expenses reported by Blue Cross and Kaiser.
Chart 13
$1,053
$2,218
$2,593
$3,172
$0
$500
$1,000
$1,500
$2,000
$2,500
$3,000
$3,500
Dec-13 Dec-14 Dec-15 Dec-16
Mill
ions
Total Medical Expenses - Non-Governmental Medi-Cal Plans 2013 - 2016

Financial Summary of Medi-Cal Managed Care Plans Page 32 QE 12/31/16
Per Member Per Month Medical Expenses and Premium Revenue - Non-Governmental Medi-Cal Plans Table 8 shows the PMPM medical expense and premium revenue of the NGM plans for the quarter ending in December for the past four years, as well as the difference in the PMPM medical expense and premium revenue for quarter ending December 2016. All NGM plans had higher PMPM premium revenue than medical expenses at December 2016. Care 1st Health Plan reported the highest PMPM medical expense and premium revenue.
Table 8
Per Member Per Month Medical Expenses and Premium Revenue – Non-Governmental Medi-Cal Plans 2013-2016
Non-Governmental Medi-Cal Plans
Dec-13 Dec-14 Dec-15 Dec-1612
PMPM Medical Expense
PMPM Premium Revenue
PMPM Medical Expense
PMPM Premium Revenue
PMPM Medical Expense
PMPM Premium Revenue
PMPM Medical Expense
PMPM Premium Revenue
Net 13 Revenue
California Health and Wellness Plan $149 $147 $179 $238 $217 $267 217 284 $67 Care 1st Health Plan14 223 252 283 334 337 367 380 438 $58 Community Health Group 191 198 298 337 283 360 272 337 $65 Health Net Community Solutions 146 149 232 219 221 295 289 385 $96
Molina Healthcare 158 183 243 302 266 319 265 287 $22
12 December 2016 PMPM Medical Expense and PMPM Premium Revenue information excludes pass through income and expense items. 13 Difference between December 2016 PMPM Medical Expense and PMPM Premium Revenue. 14 PMPM information for Care 1st includes commercial and other lines of business for 2013-2016.

Financial Summary of Medi-Cal Managed Care Plans Page 33 QE 12/31/16
PMPM Medical Expense vs PMPM Premium Revenue
Chart 9 illustrates the NGM plans’ PMPM medical expense vs PMPM premium revenue for December 2016. All plans reported premium revenue that was higher than per member per month expenses.
Chart 14
$0
$50
$100
$150
$200
$250
$300
$350
$400
$450
$500
California Healthand Wellness
Plan
Care 1st HealthPlan
CommunityHealth Group
Health NetCommunitySolutions
MolinaHealthcare
PMPM Medical Expenses vs PMPM Premium Revenue Non-Governmental Medi-Cal Plans - December 2016
PMPMMedicalExpensesPMPMPremiumRevenue

Financial Summary of Medi-Cal Managed Care Plans Page 34 QE 12/31/16
Net Income - Non-Governmental Medi-Cal Plans
Favorable PMPM premium revenue ratios translated to positive net income for almost all NGM plans from September 2016 to December 2016. Only Molina Healthcare reported negative net income at December 2016.
Table 9 Non-Governmental Medi-Cal Plans Net Income by Quarter (in thousands)
Non-Governmental Medi-Cal Plans
QE
Sep-15 QE
Dec-15 QE
Mar-16 QE
Jun-16 QE
Sep-16 QE
Dec-16
California Health and Wellness Plan $507 $6,973 $3,940 $3,946 $4,285 $15,196
Care 1st Health Plan 15,960 7,201 22,111 19,089 28,400 93,986
Community Health Group 9,296 77,057 78,864 21,851 81,095 47,781
Health Net Community Solutions 149,653 177,541 77,507 67,593 124,738 272,079
Molina Healthcare 24,991 26,879 10,675 5,999 22,329 (300)
Total Net Income $200,407 $295,651 $193,097 $118,478 $260,847 $428,742

Financial Summary of Medi-Cal Managed Care Plans Page 35 QE 12/31/16
Tangible Net Equity – Non-Governmental Medi-Cal Plans NGM plans’ TNE to Required TNE ranged from 250% to 1010%. TNE reported by most NGM plans is lower than the LI and COHS plans. Many NGM plans pay dividends to parent companies or shareholders thereby reducing the reserve levels. Community Health Group, a not-for-profit, reported TNE comparable to LIs and COHS.
Chart 15
0%
200%
400%
600%
800%
1000%
1200%
Dec-15 Mar-16 Jun-16 Sep-16 Dec-16
Percentage TNE by Non-Governmental Medi-Cal Plan December 2015 - December 2016
California Health andWellness
Care 1st Health Plan
Community HealthGroup
Health Net CommunitySolutions
Molina Healthcare

Financial Summary of Medi-Cal Managed Care Plans Page 36 QE 12/31/16
Cash Flow from Operations
NGM plans reported $930 million in cash flow from operations in December 2016, an increase of 29% from September 2016. NGM plans’ cash inflow from operations is primarily attributed to the Medi-Cal premium revenue paid by DHCS and/or capitation revenue from their plan-to-plan arrangements with plans directly contracted with DHCS.
Claims
Pursuant to the Knox-Keene Act, full service health plans are required to process 95% of their claims within 45 working days. NGM plans did not report any claims processing or emerging claims payment deficiencies for December 2016.
Conclusion
After the initial surge in LI and COHS plan’s enrollment brought on by the ACA in 2014, the rate of increase in enrollment slowed down for 2016. Most Medi-Cal managed care plans continue to see moderate increases in enrollment. Overall, expenses and premium revenue continue to rise as enrollment increases. The Medi-Cal managed care plans continue to meet or significantly exceed the minimum TNE requirement. The DMHC will continue to monitor the enrollment trends and financial solvency of all LI, COHS and NGM plans reporting to the Department.