Financial Suitability and Stability of Potential Kansas ... Reports/Penn Cherokee... · Any...
23
Financial Suitability of Potential Kansas Casino Operators Presented by John Mills, Ph.D., CPA July 24, 2008
Transcript of Financial Suitability and Stability of Potential Kansas ... Reports/Penn Cherokee... · Any...

Financial Suitability of
Potential Kansas Casino Operators
Presented by John Mills, Ph.D., CPA
July 24, 2008

July 24, 2008 [email protected] 775-827-2975 2
Peer Group Composite
Any financial analysis needs a comparative peer group base for the evaluation process. All current gaming jurisdictions provide analysis on a property basis, size or gaming revenues. See for example the Nevada Gaming Abstract which separates properties by location and size.
Evaluation on a corporate level does not provide the same segmentation. There are a wider range of sizes and industry segments. Many of the corporations are diversified with different types of segments. It is more difficult to define peer groups. Example: International Gaming Technology (IGT). Classified in the manufacturing segment and the gaming segment. Yet does not have a single casino.

July 24, 2008 [email protected] 775-827-2975 3
Standard & Poor’s Service Subgroup: Casino and Gaming
This subgroup currently consists of 60 different companiesThe top corporations include several corporations who have submitted proposals: (June 11, 2008)
Market CapitalizationMillions
1. Las Vegas Sands Corp. (LVS) $19,1112. MGM Mirage (MGM) 11,7973. Wynn Resorts, Limited (WYNN) 9,8984. International Gaming Technology (IGT) 9,7125. Melco PBL (MPEL) 4,3596. Penn National Gaming (PENN) 3,72913. Pinnacle Entertainment, Inc (PNK) 736
July 24, 2008 [email protected] 775-827-2975 4
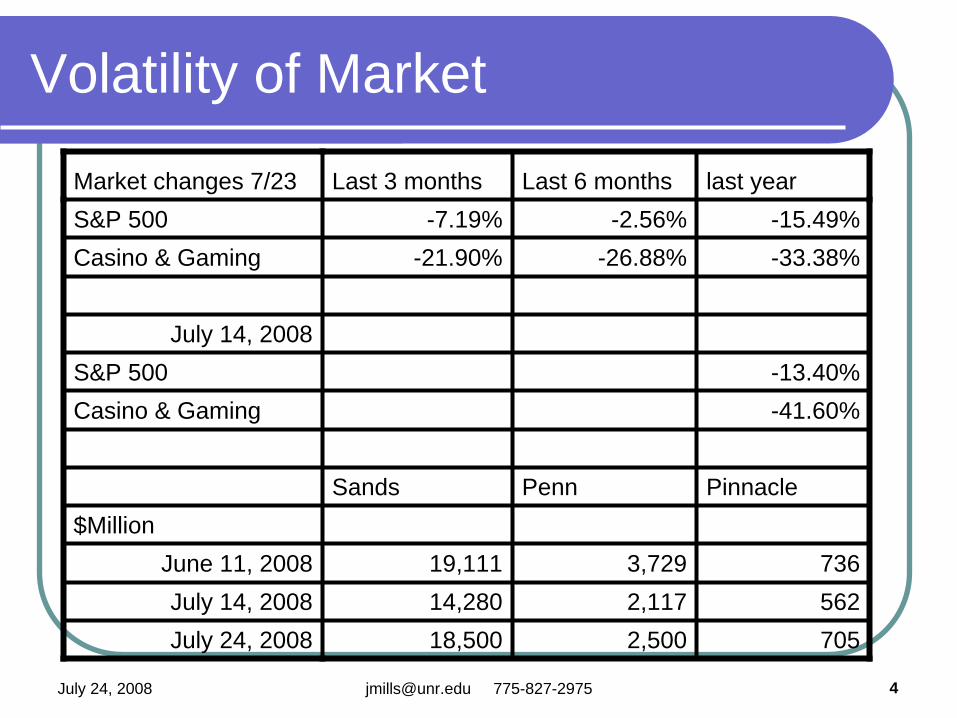
Volatility of Market
Market changes 7/23 Last 3 months Last 6 months last yearS&P 500 -7.19% -2.56% -15.49%Casino & Gaming -21.90% -26.88% -33.38%
July 14, 2008S&P 500 -13.40%Casino & Gaming -41.60%
Sands Penn Pinnacle$Million
June 11, 2008 19,111 3,729 736July 14, 2008 14,280 2,117 562July 24, 2008 18,500 2,500 705

July 24, 2008 [email protected] 775-827-2975 5
Stock price changes for last 12 months
Industry (41.60%)LVS (54.14%)PENN (52.89%)PNK (65.12%)BUKS (06.55%)

July 24, 2008 [email protected] 775-827-2975 6
Diversity of Group
One of the largest casino companies in the world, Harrah’s, is missing because it has been bought out by a private group of Investors (Hamlet Holdings)includes International Gaming Technology (IGT) ($7.9 b), a company that does not own one single casino.Includes Great American Financial Corp., a software development, marketing and Internet communications company specializing in the Internet market that conducts business in the gaming field.Medical Institutional Services Corp, is principally a provider of services to businesses engaged in electronic commerce on the Internet (e-commerce). Market Cap of $290,000.

July 24, 2008 [email protected] 775-827-2975 7
Diverse Group of Proposal Corporations
South East South Central South West North East
Completely new LLC Marvel Dodge Legends
New LLC & Public company
Harrah & Sumner
Speedway&Entertainment
100% Public company Penn Penn Butler Pinnacle
Sands

July 24, 2008 [email protected] 775-827-2975 8
Comparative Kansas Proposals
By Public Corporations
In $000 Harrah's Sands Penn PinnacleButler Nat.
Co.
Total Assets 23,357,700 11,466,517 4,967,032 2,193,544 20,444
Total Equity 6,626,900 2,260,274 1,120,962 1,052,359 10,648
Total Cltd + ltd 12,440,400 7,572,330 2,974,922 841,301 6,971
At 12/31/2007

July 24, 2008 [email protected] 775-827-2975 9
Comparative Financial Information
12/31/2007 In 000'sHarrah's Sands Penn Pinnacle Butler Nat. Co.
Sales 10,825,200 2,950,567 2,565,737 1,068,790 14,681 Net income before Taxes 892,500 138,279 292,240 (1,851) 717
Return on Income 8.24% 4.69% 11.39% -0.17% 4.88%Return on Assets 3.82% 1.21% 5.88% -0.08% 3.51%Return on Equity 13.47% 6.12% 26.07% -0.18% 6.73%
Current Ratio 93.01% 92.35% 61.29% 132.77% 203.12%Debt/Equity 187.73% 335.02% 265.39% 79.94% 65.47%
1st Quarter 2008% change in Sales -2.07% 71.76% 3.16% 12.68% 27.33%% change: Net income bef -231.25% -1108.39% -5.70% -596.00% -321.43%Current Ratio 113.83% 100.00% 61.00% 167.00% 202.00%Debt to Equity 612.53% 365.00% 262.00% 96.00% 73.00%
July 24, 2008 [email protected] 775-827-2975 10
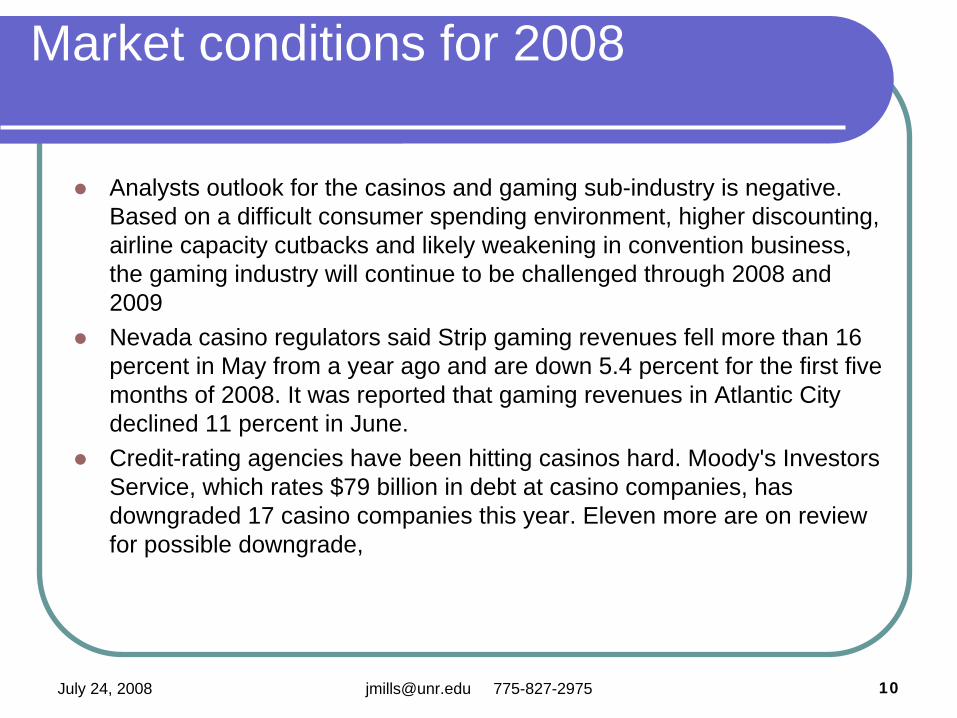
Market conditions for 2008
Analysts outlook for the casinos and gaming sub-industry is negative. Based on a difficult consumer spending environment, higher discounting, airline capacity cutbacks and likely weakening in convention business, the gaming industry will continue to be challenged through 2008 and 2009Nevada casino regulators said Strip gaming revenues fell more than 16 percent in May from a year ago and are down 5.4 percent for the first five months of 2008. It was reported that gaming revenues in Atlantic City declined 11 percent in June.Credit-rating agencies have been hitting casinos hard. Moody's Investors Service, which rates $79 billion in debt at casino companies, has downgraded 17 casino companies this year. Eleven more are on review for possible downgrade,

July 24, 2008 [email protected] 775-827-2975 12
Corporate Structure
Gaming Zone: SoutheastCounty: Cherokee and Crawford CountyProperty Name: Hollywood CasinoCompany Name: Kansas Penn Gaming LLCParent Company:Penn National Gaming, Inc. Ownership Interest: 100%
July 24, 2008 [email protected] 775-827-2975 13
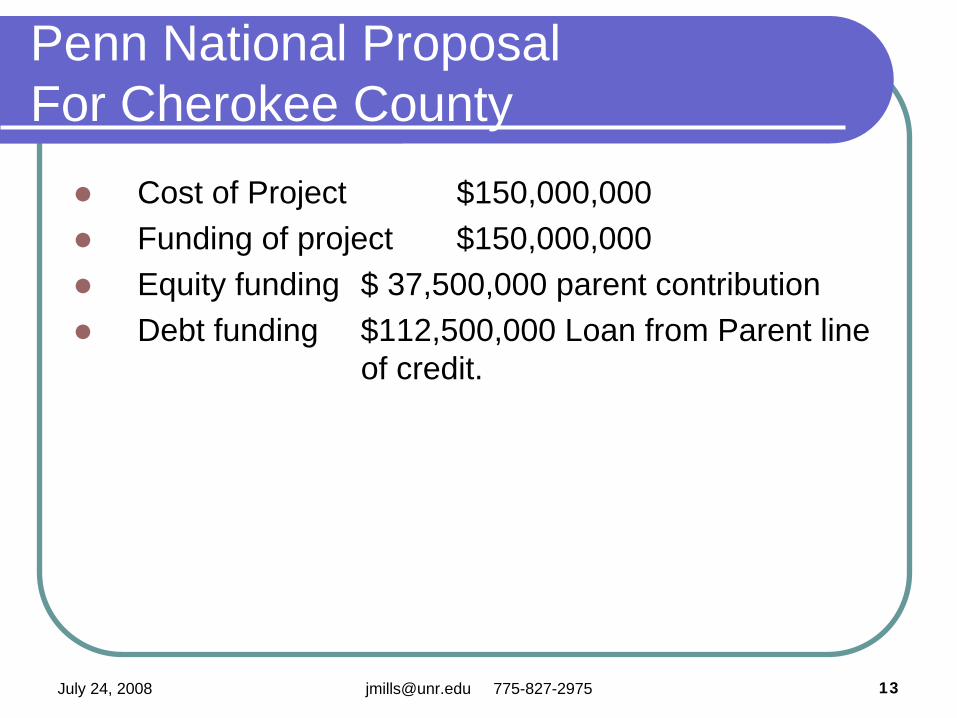
Penn National Proposal For Cherokee County
Cost of Project $150,000,000Funding of project $150,000,000Equity funding $ 37,500,000 parent contributionDebt funding $112,500,000 Loan from Parent line
of credit.
July 24, 2008 [email protected] 775-827-2975 14
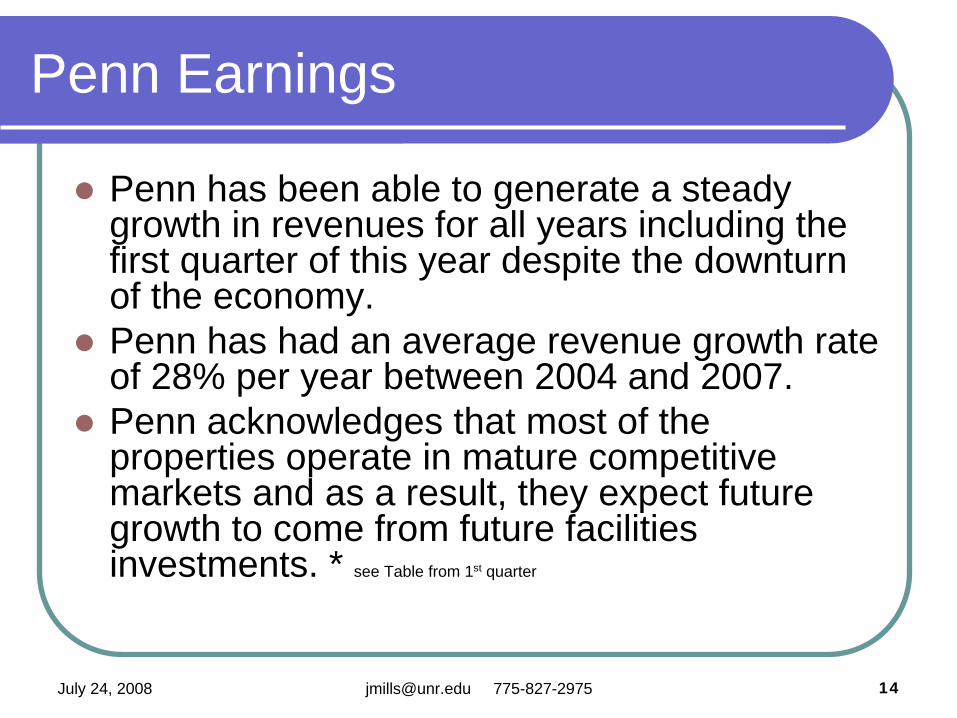
Penn Earnings
Penn has been able to generate a steady growth in revenues for all years including the first quarter of this year despite the downturn of the economy. Penn has had an average revenue growth rate of 28% per year between 2004 and 2007. Penn acknowledges that most of the properties operate in mature competitive markets and as a result, they expect future growth to come from future facilities investments. * see Table from 1st quarter

July 24, 2008 [email protected] 775-827-2975 15
Basic Fundamentals For Penn National Prior to Failed Merger
Liquidity and Solvency 2007 2006 2005 2004
Current Ratio 0.61 0.97 0.90 1.04
CFO $000 431,219 281,809 150,475 197,164
Interest coverage 2.51 2.92 2.66 2.87
Debt/Equity 2.65 3.07 5.10 2.16
CFO Interest charge 3.22 2.46 2.77 3.68
Free Cash Flow 70,064 -127,074 29,340 128,207
Presenter
Presentation Notes
Current ratio average is 1.6 Interest charge ratio is 3.6 debt to equity is 2.4 Note that our coverage ratios are based on income before taxes and interest.

July 24, 2008 [email protected] 775-827-2975 16
Financial Trends: Positive
Consistent increase in Revenues and EarningsConsistent increase in CFODebt to Equity ratio, while still high, shows declining trendInterest coverage greater than 2.5 times

July 24, 2008 [email protected] 775-827-2975 17
Financial Trends: Negative
Decreasing current ratio trendHighly leveraged Large decrease in cash for 1st Quarter of 2008 (by -48.66%)Will have $940 million due within 3 years

July 24, 2008 [email protected] 775-827-2975 18
Major Positive Event: Failed Merger Takeover
$200,000,000 cash break-up fee$1,250,000,000 redeemable preferred equity with a repurchase date of 2015The preferred equity allows Penn to forgo any interest or dividend paymentsProvides ability to reduce debt or invest in new proposals.

July 24, 2008 [email protected] 775-827-2975 19
Possible Changes In Financial Ratios
Prior Bal Addition Debt payment
3/31/2008 7/14/2008 7/14/2008
Current Ratio 0.61 4.88 2.11
Debt/Equity 2.62 1.12 0.71

July 24, 2008 [email protected] 775-827-2975 20
Latest Information On Use Of New Cash
Debt payment of $600 millionRepurchase of Stock $200 millionRemainder for new developments
Source: Susquehanna Financial Group, LLLP, July 8, 2008

July 24, 2008 [email protected] 775-827-2975 21
Concluding Points for Consideration
PositivesHealthy growth rate in revenues.Healthy growth rate in earnings.Healthy growth rate in cash flows from operations (CFO).CFO has exceeded capital expenditures.Failed merger generates $1.475 billion in cash.The additional cash flow changes the financial flexibility of company.
July 24, 2008 [email protected] 775-827-2975 22
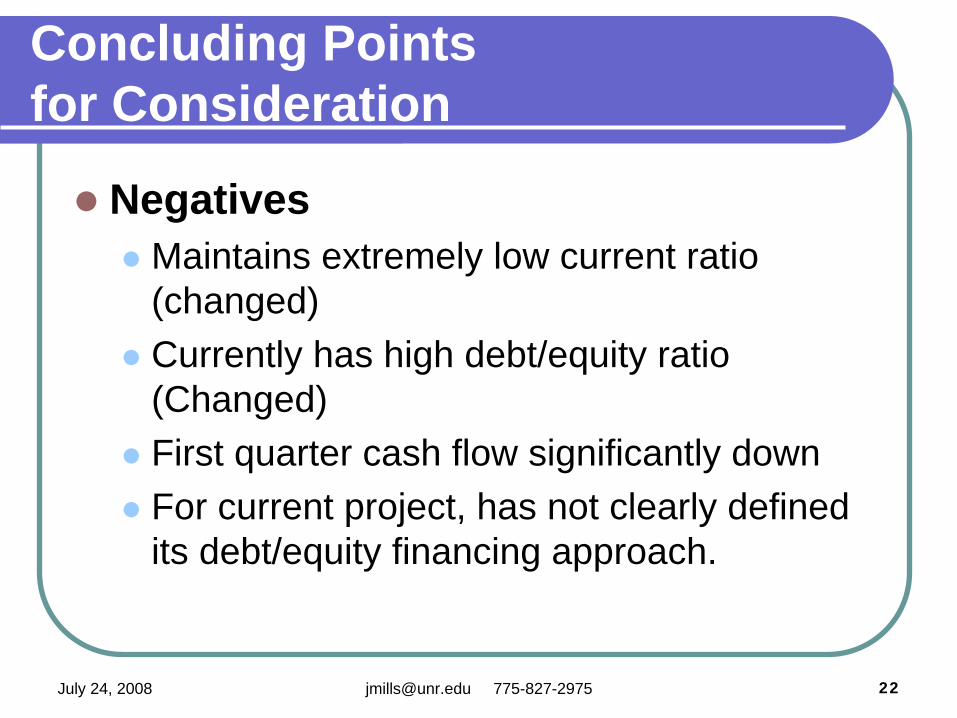
Concluding Points for Consideration
NegativesMaintains extremely low current ratio (changed)Currently has high debt/equity ratio (Changed)First quarter cash flow significantly downFor current project, has not clearly defined its debt/equity financing approach.

July 24, 2008 [email protected] 775-827-2975 23
Concluding Points for Consideration
Additional factorsOne of the top Casino Corporations in AmericaOwns or operates nineteen facilities in fifteen jurisdictionsHas experience in running smaller propertiesHas large number of employees and managersAfter the failed merger, has the cash and or financing to close a deal for either of its projects. Has cut back its original plans and is doing a two phase project. Taking a very conservative approach toward competition.