financial study of infosys BPO limited
74
1 EXECUTIVE SUMMARY Financial analysis of the data can be done on the basis of ratio analysis, is one of the techniques of financial analysis to evaluate the financial condition and performance of a business concern. Simply, ratio means the comparison of one figure to other relevant figure or figures. According to Myers, “Ratio analysis of financial statements is a study of relationship among various financial factors in a business as disclosed by a single set of statements and a study of trend of these factors as shown in a series of statements. There are various groups of people who are interested in analysis of financial position of a company. They use the ratio analysis to work out a particular financial characteristic of the company in which they are interested. Ratio analysis helps the various groups in the following Accounting ratio help to measure the profitability of the business by calculating the various profitability ratios. It helps the management to know about the earning capacity of the business concern. In this way profitability ratios show the actual performance of the business. There is no big increase in profitability ratios of Infosys limited but returns are more than last year. In other side Cipla decrease in profitability ratios. In HDFC the profit margin and returns are good. No major change is HPCL profitability ratios. The Infosys is the I.T sector company has more profitability margin as compare to other 4 industry. To work out the solvency: With the help of solvency ratios, solvency of the company can be measured. These ratios show the relationship between the liabilities and assets. In case external liabilities are more than that of the assets of the company, it shows the unsound position of the business. In this case the business has to make it possible to repay its loans.
-
Upload
nitin-gulgulia -
Category
Education
-
view
403 -
download
3
Transcript of financial study of infosys BPO limited
1
EXECUTIVE SUMMARY
Financial analysis of the data can be done on the basis of ratio analysis, is one of the
techniques of financial analysis to evaluate the financial condition and performance of a
business concern. Simply, ratio means the comparison of one figure to other relevant
figure or figures. According to Myers, “Ratio analysis of financial statements is a study of
relationship among various financial factors in a business as disclosed by a single set of
statements and a study of trend of these factors as shown in a series of statements.
There are various groups of people who are interested in analysis of financial position of
a company. They use the ratio analysis to work out a particular financial characteristic of
the company in which they are interested. Ratio analysis helps the various groups in the
following Accounting ratio help to measure the profitability of the business by calculating
the various profitability ratios. It helps the management to know about the earning
capacity of the business concern. In this way profitability ratios show the actual
performance of the business.
There is no big increase in profitability ratios of Infosys limited but returns are more than
last year. In other side Cipla decrease in profitability ratios. In HDFC the profit margin
and returns are good. No major change is HPCL profitability ratios. The Infosys is the I.T
sector company has more profitability margin as compare to other 4 industry. To work
out the solvency: With the help of solvency ratios, solvency of the company can be
measured. These ratios show the relationship between the liabilities and assets. In case
external liabilities are more than that of the assets of the company, it shows the unsound
position of the business. In this case the business has to make it possible to repay its
loans.

2
1.
INTRODUCTION

3
1.1 COMPANY PROFILE
Infosys BPO Ltd., the business process outsourcing subsidiary of Infosys Ltd. Mr. Anup
Upadhyay is CEO and managing director and Mr. Deepak Bhalla is CFO of Infosys BPO.
(NYSE: INFY), was set up in April 2002. Infosys BPO focuses on integrated end-to-end
outsourcing and delivers transformational benefits to its clients through reduced costs,
ongoing productivity improvements, and process reengineering. Infosys BPO operates in
India, Poland, the Czech Republic, the Netherlands, South Africa, Brazil, Mexico, Costa
Rica, the United States, Puerto Rico, China, the Philippines and Australia, and as of
March 31, 2014, employed 28,581 people.
Infosys business solutions and leadership are recognized by several global forums. We
have earned Level 5, the highest rating for the e-Sourcing Capability Model (eSCM–SP:
v2.0) by Carnegie Mellon University's IT Services Qualification Centre (ITSqc). We are
the second company in India and the third globally to receive the certification. Our senior
leaders participate at industry forums such as BPO Strategists, and speak regularly at
leading business schools including Harvard, Wharton and Sloan.
Infosys BPO addresses your business challenges and unlocks business value by applying
proven process methodologies with integrated IT and business process outsourcing
solutions. The company applies business excellence frameworks to significantly reduce
costs, enhance effectiveness, and optimize business processes. The company focuses on
integrated end-to-end outsourcing and delivery of result-oriented benefits to our clients
through reduced costs, ongoing productivity improvements, and process reengineering.
Our business solutions and leadership are recognized by several global forums. We are
consistently ranked among the leading BPO companies in India by industry bodies such
as Global Outsourcing 100 (The International Association of Outsourcing Professionals),
FAO Today, and Nelson Hall.
Infosys BPO has not only pioneered „Business Value Realization‟ (BVR), but has also
emerged as a trusted and valued collaboration partner through consistent focus on
improving process and end-business metrics. We continue to enable realization of
business value, customer satisfaction, and co-creation to sustain long-term partnerships.
4
Infosys BPO take pride in being a consistent performer and are endorsed by industry
analysts, customers (internal and external), and alliance partners. Infosys BPO is a global
company operating in the Americas, the Asia-Pacific, Australia and Europe with more
than 28,581 employees as of March 31, 2014.infosys BPO leverages global delivery
centres to deliver predictable and flexible business process management services. A key
aspect of our service delivery is the successful migration or transition of business
processes from the client‟s locations to our delivery centre(s).
Infosys BPO have a comprehensive and mature transition methodology that has been
refined and documented during the course of more than 1,000 transitions. Compliance is
monitored through check points at different stages. Company believe that a well managed
transition provides a robust foundation for a stable operation across the outsourcing cycle.
LIST OF INDUSTRIES WHERE INFOSYS BPO RENDER SERVICES
1. Communication and service provider
2. Energy and utility
3. Financial services
4. Health care
5. Insurance
6. Manufacturing
7. Media and entertainment
8. Retail, CPG and logistic
9. services
HISTORY
The company was started as Progeon Limited in April 2002 and is today amongst the
top BPOs in India according to NASSCOM. It was started as a 74% and 26% joint
venture between Infosys and Citibank Investments. In 2006, Infosys bought out Citibank's
share at a price of Rs. 592 per share, Citibank having invested at Rs 0.20 per share.

5
OPERATION
Infosys BPO operates in India, Canada, Czech Republic, Netherlands, United Kingdom,
Poland, Mexico, Brazil, USA, China, the Philippines, Japan, Australia and Costa Rica. It
is headquartered in Bangalore, India. About 60% business of Infosys BPO comes from
overlapping clients with the parent Infosys Ltd. During the FY 2013-14, it earned 48% of
its revenue from North America, 34% from Europe, 4% from India and remaining 14%
from other parts of the world. The proportion of voice and non-voice related revenue was
11:89 in the same financial year.
Main client of Infosys BPO limited are Apple Inc, Hyundai, ministry of finance, income
tax department of India, British telecom, staples limited, state bank of India etc.
LOCATION
Bangalore, India
Chennai, India
Gurgaon, India
Hyderabad, India
Jaipur, India
Pune, India
Belo Horizonte, Brazil
Dalian, China
Hangzhou, China
San José, Costa Rica [5]
Brno, Czech Republic
Prague, Czech Republic
Monterrey, Mexico
Eindhoven, Netherlands [6]
Manila, Philippines
Łódź, Poland
Johannesburg, South Africa
Atlanta, USA
Des Moines, USA [7]
Milwaukee, USA
6
VISION, MISSION, VALUE
"To be a globally respected corporation."
There are some companies who are striving for profit making. For Infosys BPO limited
it‟s not the prime vision to be a highly profit making company. The core objective is to be
a globally respected company. The company is following his own practical approach
toward reaching the core vision. Infosys BPO is using three R approach to reach at his
vision. Three R stand for
Reach
Respect
Relevance
MISSION
"Strategic Partnerships for Building Tomorrow‟s Enterprise."
VALUE
Believe that the softest pillow is a clear conscience. The values that drive us underscore
our commitment to: CLIFE
Client Value: To surpass client expectations consistently.
Leadership by Example: To set standards in our business and transactions and be an
exemplar for the industry and ourselves.
Integrity and Transparency: To be ethical, sincere and open in all our transactions.
Fairness: To be objective and transaction-oriented, and thereby earn trust and respect.
Excellence: To strive relentlessly, constantly improve ourselves, our teams, our services
and products to become the best.

7
1.2 OBJECTIVE
1) How organization can earn most possible return on investment.
2) Assessment of operational efficiency.
3) Analysis of past year financial performance forecasting of various financial and
accounting factor like GP,NP, ratio
4) To find out future trend by study of past data
5) How company can maximize value of shareholder and to find how risky or
riskless is to invest in company

8
1.3 RESEARCH METHODOLOGY
TYPE OF RESEARCH
Project is prepared with consideration of both quantitative and qualitative based research.
At a time it may be treated as exploratory research. As a finance project research is more
likely based in quantitative method hence quantitative theorem is explained more clearly.
DATA SOURCE
SECONDARY DATA
The research is based on secondary data and the data is collected from
various website, journals, magazines, articles and previous research paper.
9
1.4 LIMITATION
Some data were confidential therefore were not available for analysis.
Time and resource were a limiting factor.
Research is fully based on secondary data, there is no primary data hence
there may be mismatch between theory and practical implementation.
Continues previous four year data has been considered for this research
report.
Variance in analysis due to change in accounting and taxation policy lead
to improper analysis.

10
2.
LITERATURE REVIEW

11
2.1 LITERATURE REVIEW
Financial statement analysis:
Financial analysis is the process of identifying the strengths and weakness of the firm
with the help of accounting information provided in the Profit and Loss Account and
Balance Sheet. It is the process of evaluation of relationship between component parts of
financial statements to obtain a better understanding of the firm‟s position and performance.
Financial statement analysis (or financial analysis) is the process of reviewing and analyzing a company's
financial statements to make better economic decisions. These statements include the income
statement, balance sheet, statement of cash flows, and a statement of retained earnings. Financial
statement analysis is a method or process involving specific techniques for evaluating risks, performance,
financial health, and future prospects of an organization.
It is used by a variety of stakeholders, such as credit and equity investors, the government, the public, and
decision-makers within the organization. These stakeholders have different interests and apply a variety
of different techniques to meet their needs. For example, equity investors are interested in the long-term
earnings power of the organization and perhaps the sustainability and growth of dividend payments.
Creditors want to ensure the interest and principal is paid on the organizations debt securities (e.g., bonds)
when due.
Common methods of financial statement analysis
Fundamental analysis
Technical analysis
DuPont analysis
Horizontal and vertical analysis
Financial ratios analysis
All method of financial statement analysis we will discuss in more depth.

12
2.2 FUNDAMENTAL ANALYSIS
Fundamental analysis of a business involves analyzing its financial statements and health,
its management and competitive advantages, and its competitors and markets. When
applied to futures and forex, it focuses on the overall state of the economy, and considers
factors including interest rates, production, earnings, employment, GDP, housing,
manufacturing and management. When analyzing a stock, futures contract, or currency
using fundamental analysis there are two basic approaches one can use; bottom up
analysis and top down analysis. The term is used to distinguish such analysis from other
types of investment analysis, such as quantitative and technical analysis.
Fundamental analysis is performed on historical and present data, but with the goal of
making financial forecasts. There are several possible objectives:
To conduct a company stock valuation and predict its probable price evolution,
To make a projection on its business performance,
To evaluate its management and make internal business decisions,
To calculate its credit risk.
The fundamental school of thought appraised the intrinsic value of
share through
Economic analysis: The level of economic activity has an impact on investment
in many ways. If the economy grows rapidly, the industry can also be expected to
grow rapidly and vice versa, hence there is positive correlation between economy
and industry.
Several factor affect the situation and earning of organisation like GDP,
saving and investment, inflation, interest rates, budget, tax structure, BOP,
monsoon, infrastructure, demographic factor, economic forecasting, economic
indicator etc.
Industry analysis: An industry is a group of firms that have similar technological
structure of production and produce similar product. Industry is classified as
growth industry, cyclical industry, defensive industry, cyclical growth industry.

13
Stages of industry life cycle: pioneering stage, rapid growth stage, maturity and
stabilisation stage, declining stage.
Company analysis: In the company analysis the investor assimilates the several
bits of information related to the company and evaluates the present and future
values of stock. The risk and return associated with the purchase of the stock is
analysed to take better decision.
The valuation process depends upon the investors‟ ability to elicit
information from the relationship and interrelationship among the company
related variable. The present and future values are affected by a number of factor
and they are given below.
Factor affects future price- Competition, earning, capital structure, management,
operating efficiency, financial performance etc.
Factor affect present price- Historic price of stock, P/E ratio, economic
condition, stock market condition etc.

14
2.3 TECHNICAL ANALYSIS
Technical analysis is a process of identifying trend reversal at an earlier stage to
formulate the buying and selling strategy. With the help of several indicators we will
analysis relationship between price volume and supply demand for the overall market and
for individual stock.
ASSUMPTION
1. Market value of scrip is determined by the interaction of supply and demand.
2. The market discounts everything.
3. Market always moves in trend except for some deviation. Trend may be of
increasing and decreasing.
TECHNICAL TOOLS
TREND- in this research trend refers to direction of movement. Price can either increase
or decrease. When trend do deviate it may be called as trend reversal. When trend
increase its called as bull market and when trend decrease it‟s called as bear market.
Further I will divide trend in three different type according to nature.
PRIMARY TREND-each peak remain higher the previous peak and bottom also remain
higher than previous bottom.
SECONDARY TREND-the secondary trend or the intermediate trend moves against the
main trend lead to correction. In the bull market the secondary trend would result in the
fall of about 33-66% of earlier rise. In bear market, the trend carries a price upward and
corrects the main trend. The correction would be 33-66% again.
MINOR TREND-also called as random wriggles. Minor trend tries to correct the
secondary trend movement.
INDICATOR-technical indicators are used to find out the direction of the overall market.
Aggregate forecasting is considered to be more reliable than the individual forecasting.

15
Volume of trade, breadth of market, short sales, odd lot trading, moving average, index
comparison, relative strength, oscillators, graph, chart etc are indicator.
2.4 DuPont ANALYSIS
A method of performance measurement that was started by the DuPont Corporation in the
1920.With this method, assets are measured at their gross book value rather than at net
book value in order to produce a higher return on equity (ROE). It is also known as
"DuPont”.
DuPont analysis tells us that ROE is affected by three things:
1.Operating efficiency, which is measured by profit margin.
2. Asset use efficiency, which is measured by total asset turnover.
3. Financial leverage, which is measured by the equity multiplier.
ROA and ROE ratio
The return on assets (ROA) developed by DuPont for its own use is now used by many
firms to evaluate how effectively assets are used. It measures the combined effects of
profit margins and assets turnover.
ROA= 𝑵𝑬𝑻 𝑰𝑵𝑪𝑶𝑴𝑬 ÷ 𝑻𝑶𝑻𝑨𝑳 𝑺𝑨𝑳𝑬𝑺
The return on equity ratio is measure of the rate of return to stockholders.
ROE= NET INCOME ÷ EQUITY
Why DuPont:
The DuPont Analysis is important determines what is driving a company's ROE; Profit
margin shows the operating efficiency, asset turnover shows the asset use efficiency,
and leverage factor shows how much leverage is being used.
The method goes beyond profit margin to understand how efficiently a company's assets
generate sales or cash and how well a company uses debt to produce incremental returns.

16
Using these three factors, a DuPont analysis allows analysts to dissect a company,
efficiently determine where the company is weak and strong and quickly know what areas
of the business to look at (i.e., inventory management, debt structure, margins) for more
answers. The measure is still broad, however, and is not a substitute for detailed analysis.
The DuPont analysis looks uses both the income statement as well as the balance sheet to
perform the examination. As a result, major asset purchases, acquisitions, or other
significant changes can distort the ROE calculation. Many analysts use average assets and
shareholders' equity to mitigate this distortion, although that approach assumes the
balance sheet changes occurred steadily over the course of the year, which may not be
accurate either

17
2.5 HORIZONTAL AND VERTICAL ANALYSIS
HORIZONTAL ANALYSIS:
Horizontal analysis (also known as trend analysis) is a financial statement analysis
technique that shows changes in the amounts of corresponding financial statement items
over a period of time. It is a useful tool to evaluate the trend situations.
The statements for two or more periods are used in horizontal analysis. The earliest
period is usually used as the base period and the items on the statements for all later
periods are compared with items on the statements of the base period. The changes are
generally shown both in dollars and percentage.
Dollar and percentage changes are computed by using the following formulas:
Horizontal analysis may be conducted for following sources
Balance sheet
Income statement
Schedules of current and fixed assets
And statement of retained earnings

18
VERTICAL ANALYSIS:
Vertical analysis (also known as common-size analysis) is a popular method of financial
statement analysis that shows each item on a statement as a percentage of a base figure
within the statement.
To conduct a vertical analysis of balance sheet, the total of assets and the total of
liabilities and stockholders‟ equity are generally used as base figures. All individual
assets (or groups of assets if condensed form balance sheet is used) are shown as a
percentage of total assets. The current liabilities, long term debts and equities are shown
as a percentage of the total liabilities and stockholders‟ equity.
To conduct a vertical analysis of income statement, sales figure is generally used as the
base and all other components of income statement like cost of sales, gross profit,
operating expenses, income tax, and net income etc. are shown as a percentage of sales.
In a vertical analysis the percentage is computed by using the following formula:
A basic vertical analysis needs an individual statement for a reporting period but
comparative statements may be prepared to increase the usefulness of the analysis.

19
2.6 RATIO ANALYSIS
Ratio analysis is one of the techniques of financial analysis to evaluate the financial
condition and performance of a business concern. Simply, ratio means the comparison of
one figure to other relevant figure or figures. According to Myers , “Ratio analysis of
financial statements is a study of relationship among various financial factors in a
business as disclosed by a single set of statements and a study of trend of these factors as
shown in a series of statements."
Classification of ratio:
1. Liquidity ratio
2. Profitability ratio
3. Activity/turnover ratio
4. Solvency ratio
5. Balance sheet ratio
2.5.1 LIQUIDITY RATIO
Liquidity ratios are probably the most commonly used of all the business ratios. Creditors
may often be particularly interested in these because they show the ability of a business to
quickly generate the cash needed to pay outstanding debt. Liquidity ratios are sometimes
called working capital ratios because that, in essence, is what they measure. The liquidity
ratios are: the current ratio and the quick ratio.
Often liquidity ratios are commonly examined by banks when they are evaluating a loan
application. Once you get the loan, your lender may also require that you continue to
maintain a certain minimum ratio, as part of the loan agreement. A 1:1 is considered as
satisfactory ratio.
The quick ratio measures a company's ability to meet its short-term obligations with its
most liquid assets. The higher the quick ratio better will be the position of the company.
A 2:1 is considered as satisfactory ratio.
CURRENT RATIO = CA ÷ CL
QUCIK RATIO = CA – INVENTORIES ÷ CL

20
2.5.2 PROFITABILITY RATIO
Profitability ratios measure the efficiency of management in the employment of business
resources to earn profits. These ratios indicate the success or failure of a business
enterprise for a particular period of time. Profitability ratios are used by almost all the
parties connected with the business. A strong profitability position ensures common
stockholders a higher dividend income and appreciation in the value of the common stock
in future. Creditors, financial institutions and preferred stockholders expect a prompt
payment of interest and fixed dividend income if the business has good profitability
position. Management needs higher profits to pay dividends and reinvest a portion in the
business to increase the production capacity and strengthen the overall financial position
of the company.
GROSS PROFIT RATIO = GROSS PROFIT ÷ NET SALES X 100
OPERATING PROFIT RATIO
= COST OF GOODS SOLD + OPERATING EXPENSES ÷ NET SALES X 100
EXPENSES RATIO = PARTICULAR EXPENSES ÷ NET SALES X 100
NET PROFIT RATIO = NET PROFIT AFTER TAX ÷ NET SALES X 100
2.5.3 TURNOVER/ ACTIVITY RATIO
Activity ratios (also known as turnover ratios) measure the efficiency of a firm or
company in generating revenues by converting its production into cash or sales. Generally
a fast conversion increases revenues and profits.
Activity ratios show how frequently the assets are converted into cash or sales and,
therefore, are frequently used in conjunction with liquidity ratios for a deep analysis of
liquidity.
INVENTORY TURNOVER RATIO = NET SALES ÷ AVERAGE INVENTORY
RECEVABLE TURNOVER RATIO / DEBTOR TURNOVER RATIO
= NET CREDIT ANNUAL SALES ÷ AVG. TRADE DEBTOR
(Where, trade debtor is sundry debtor and B/R)

21
AVERAGE COLLECTION PERIOD
= AVERAGE TRADE DEBTOR ÷ SALES PER DAY
(Where, sales per day= net sales ÷ No. of working day)
PAYABLE TURNOVER RATIO/ CREDITOR TURNOVER RATIO
= NET CREDIT ANNUAL PURCHASE ÷ AVERAGE TRADE DEBTOR
AVERAGE PAYMENT PERIOD RATIO
= AVERAGE TRADE CREDITOR ÷ AVERAGE DAILY PURCHASE
WORKING CAPITAL TURNOVER RATIO
= COST OF SALES ÷ AVERAGE WORKING CAPITAL
(Where, average working capital = opening w/c + closing w/c ÷ 2)
2.5.4 SOLVENCY RATIO
Solvency ratios (also known as long-term solvency ratios) measure the ability of a
business to survive for a long period of time. These ratios are very important for
stockholders and creditors.
Solvency ratios are normally used to:
Analyze the capital structure of the company
Evaluate the ability of the company to pay interest on long term borrowings
Evaluate the ability of the company to repay principal amount of the long term
loans (debentures, bonds, medium and long term loans etc.).
Evaluate whether the internal equities (stockholders‟ funds) and external equities
(creditors‟ funds) are in right proportion.
DEBT-EQUITY RATIO = OUTSIDERS FUNDS ÷ SHAREHOLDERS FUND
DEBT TO EQUITY RATIO = EXTERNAL EQUTIES ÷ INTERNAL EQUITIES

22
PROPRIETORY/EQUITY RATIO = SHAREHOLDERS FUND ÷ TOTAL ASSETS
SOLVENCY RATIO = TOTAL LIABILITIES ÷ TOTAL ASSETS
FIXED ASSETS TO NETWORTH RATIO = F.A ÷ SHAREHOLDERS FUND
(Where, shareholders fund include equity share capital, preference share capital, capital reserve,
revenue reserve, reserve and surplus, accumulated profit, contingency sinking fund etc.)

23
3.
FINDINGS

24
3.1 FUNDAMENTAL ANALYSIS
3.1.1 ECONOMIC ANALYSIS:
The Indian economy is the fourth largest economy of the world on the basis of Purchasing
Power Parity (PPP). It is one of the most attractive destinations for business and
investment opportunities due to huge manpower base, diversified natural resources and
strong macro-economic fundamentals. Also, the process of economic reforms initiated
since 1991 has been providing an investor-friendly environment through a liberalized
policy framework spanning the whole economy.
The growth and performance of the Indian economy in the world market is explained in
terms of statistical information provided by the various economic parameters. For
example, Gross National Product (GNP), Gross Domestic product (GDP), Net National
Product (NNP), rate of inflation, per capita income, Gross Domestic Capital Formation
(GDCF), etc. are the various indicators relating to the national income sector of the
economy. They provide a wide view of the economy including its productive power for
satisfaction of human wants.
TREND IN ECONOMIC
Figure 1
10.3
6.6
4.7 5
7.6
10.7
9.3
5.115.7
7.2
5.6
0.390
2
4
6
8
10
12
2011 2012 2013 2014
Rat
e
trend in economy
GDP
CPI
WPI

25
Interpretation: for the past four year GDP showed both upward and downward
movement. But ultimately it reduced by fifty percent from 10.5% to 5%. Consumer price
inflation showed overall down movement from 7.6 to 5.11. and wholesale price index
lowered by more than 90% from 5.7 to .39.
GDP: The Gross Domestic Product (GDP) in India expanded 7.50 percent in the fourth
quarter of 2014 over the same quarter of the previous year. GDP Annual Growth Rate in
India averaged 5.83 percent from 1951 until 2014, reaching an all time high of 11.40
percent in the first quarter of 2010 and a record low of -5.20 percent in the fourth quarter
of 1979. GDP Annual Growth Rate in India is reported by the Ministry of Statistics and
program Implementation (MOSPI)
INFLATION RATE: The inflation rate in India was recorded at 5.11 percent in January
of 2015. Inflation Rate in India averaged 8.87 percent from 2012 until 2015, reaching an
all time high of 11.16 percent in November of 2013 and a record low of 4.38 percent in
November of 2014. Inflation Rate in India is reported by the Ministry of Statistics and
Program Implementation (MOSPI), India
CONSUMER PRICE INDEX: Consumer Price Index CPI in India remained unchanged
at 119.40 Index Points in January of 2015 from 119.40 Index Points in December of
2014. Consumer Price Index CPI in India averaged 125.38 Index Points from 2011 until
2015, reaching an all time high of 145.50 Index Points in November of 2014 and a record
low of 105 Index Points in February of 2011. Consumer Price Index CPI in India is
reported by the Ministry of Statistics and Program Implementation (MOSPI), India.
WHOLESALE PRICE INDEX: the wholesale price index (WPI) is the main measure of
inflation. The WPI measures the price of a representative basket of wholesale goods. In
India, wholesale price index is divided into three groups: Primary Articles (20.1 percent
of total weight), Fuel and Power (14.9 percent) and Manufactured Products (65 percent).
Food Articles from the Primary Articles Group account for 14.3 percent of the total
weight. The most important components of the Manufactured Products Group are
Chemicals and Chemical products (12 percent of the total weight); Basic Metals, Alloys
and Metal Products (10.8 percent); Machinery and Machine Tools (8.9 percent); Textiles

26
(7.3 percent) and Transport, Equipment and Parts (5.2 percent). Content for - India
Wholesale Price Index Change - was last refreshed on Monday, February 23, 2015.
Producer Prices in India decreased 0.39 percent in January of 2015 over the same month
in the previous year. Producer Prices Change in India averaged 7.63 percent from 1969
until 2014, reaching an all time high of 34.68 percent in September of 1974 and a record
low of -11.31 percent in May of 1976. Producer Prices Change in India is reported by the
Office of the Economic Advisor, India.
3.1.2 INDUSTRY ANALYSIS:
According to NASSCOM, in fiscal year 2014, India‟s information technology and
business process management (IT-BPM) industry will add $12-15 billion incremental
revenue, to existing industry revenues of $118 billion. During FY 2014, industry‟s
exports are estimated to grow 13 per cent at $86 billion, with domestic revenues up 9.7
per cent at Rs. 1,910 billion. NASSCOM reports also stated that the industry added
160,000 employees in 2013, and provided direct employment to 3.1 million people and
indirect employment to 10 million people.
Exports by India's IT outsourcing sector are expected to rise 13-15 percent in the fiscal
year starting April 2014, as an improving global economy encourages banks and
companies to boost spending on technology. NASSCOM has forecasted IT services
exports in 2014-15 to rise to as much $99 billion. The increase in growth rate compares
with an estimated 13 percent rise in fiscal year 2014. It also states that the Indian IT and
ITeS industry is likely to grow to about $300 billion by 2020, focusing on areas like e-
commerce, software products and the IT market.
Why is the sector growing?
Rapid industrialization and growth of IT parks in the country
Partial privatization of telecommunication
Development of SEZ; which also help IT companies get tax benefits
A large number of resource readily available in the country
Low operating costs
Tax breaks and sops offered by the government

27
Employment Trends
The IT and ITeS sector has generated massive employment in the past and continues the
trend of providing jobs. With online shopping, social media and cloud computing
flourishing more than ever before, there is great demand for IT professionals in e-
commerce and business to consumer firms.
3.1.3 COMPANY ANALYSIS:
Infosys overview: Infosys BPO, the business process outsourcing subsidiary of Infosys
(BSE, NSE, NYSE: INFY), is an end-to-end outsourcing services provider. Infosys BPO
addresses the business challenges and unlocks business value by applying proven process
methodologies with integrated IT and business process outsourcing solutions. The
company applies business excellence frameworks to significantly reduce costs, enhance
effectiveness, and optimize business processes. The company focuses on integrated end-
to-end outsourcing and delivery of result-oriented benefits to our clients through reduced
costs, ongoing productivity improvements, and process reengineering.
Our business solutions and leadership are recognized by several global forums. We are
consistently ranked among the leading BPO companies in India by industry bodies such
as Global Outsourcing 100 (The International Association of Outsourcing Professionals),
FAO Today, and Nelson Hall.
STRENGTH:
Pricing power: Customers typically rebel against price increases by switching to
competing products, but if a company has pricing power, customers will continue using
Infosys BPO‟s products and services. Infosys BPO has the ability to charge customers
higher prices
Financial leverage: financial leverage allows company to expand their assets year by
year.
Cost saving: Lower costs lead to higher profits for Infosys BPO. A low cost leader can
undercut rivals on price.

28
SWOT ANALYSIS:
Strength
Pricing power
Financial leverage
Cost saving
Economies of scale
Faster technology
3R approach
Creation of leader
Weakness
High staff turnover
Online presence
Weak supply chain
Weak management
Weak customer service
Past scam
Frequent changes in senior position
Opportunity
Financial leverage
Innovation
Emerging technology
New market
International expansion
Threat
Mature market
Intense competition
Political risk
Substitute project
Competitive edge
Table 1.
Economies of scale: Economies of scale is the cost advantages that Infosys BPO obtains
due to size. The greater the volume, the greater the advantage
Faster technology: technology used in Infosys is always one step ahead to others. It
provides latest technological based solution to client.
3R approach: Infosys serve client on the basis of 3R approach. Reach, relevance, respect
are the three component they take care about client,

29
Creation of leader: Infosys limited has his own corporate university to develop the skills
of employee. As per the client requirement they create the flexible leader.
WEAKNESS
Past scam: in 2014 there is lot of scam happen in Infosys BPO. That hurts the image and
value of reputed company.
Frequently change in senior position: changing senior position manager lead to
diversion of mission and value. Infosys BPO‟s senior level management is changing
frequently from last two year.
High staff turnover: High staff turnover can hurt Infosys BPO‟s ability to compete,
because replacing valuable staff is expense "High Staff Turnover (Infosys BPO )" has a
significant impact, so an analyst should put more weight into it.
Online presence: The online market is essential for displaying information and selling
products. A weak online presence can result in lost opportunities for Infosys BPO.
Weak supply chain: A weak supply chain can delay the arrival of products to Infosys
BPO‟s customers. Unnecessary delays can hurt Infosys BPO over the long run, because
customers will cancel orders.
Weak management: Weak management increases business risks and reduces profits for
Infosys BPO, because they are responsible for the health of the business.
Weak customer service: Weak management increases business risks and reduces profits
for Infosys BPO, because they are responsible for the health of the business.
OPPORTUNITY
Financial leverage: Leveraging the balance sheet allows Infosys BPO to quickly expand
into other markets and products, especially in fragmented industries.

30
Innovation: Greater innovation can help Infosys BPO to produce unique products and
services that meet customer‟s needs.
Emerging technology: Greater innovation can help Infosys BPO to produce unique
products and services that meet customer‟s needs.
New market: Emerging markets are fast growing regions of the world that enable Infosys
BPO to quickly expand.
International expansion: International markets offer Infosys BPO new opportunities to
expand the business and increase sales.
THREAT
Mature market: Mature markets are competitive. In order for Infosys BPO to grow in a
mature market, it has to increase market share, which is difficult and expensive.
Intense competition: Intense completion can lower Infosys BPO‟s profits, because
competitors can entice consumers away with superior products.
Political risk: Politics can increase Infosys BPO‟s risk factors, because governments can
quickly change business rules that negatively affect Infosys BPO‟s business "Political
Risk has a significant impact, so an analyst should put more weight into it. This statement
will lead to a decrease in profits.
Substitute product: The availability of substitute products hurts Infosys BPO‟s ability to
raise prices, because customers can easily switch to another product or service.
Competitive edge: there is a wide competition in IT and BPO industry. Price cutting is
not only solution for competitive market.

31
EARNING: Infosys BPO has earned revenue of 2,323 crore in financial year 2013-14 as
compared to 1,831 crore in financial year 2012-13. The company ended year with net
profit after tax of ` 512 crore when compared with the previous year of ` 428 crore. The
company‟s profitability after tax for the year is 22.04%. The company continues to be
amongst the most profitable BPO companies in India. The company added 6 (net)
customers and now has 150+ customers as on March 31, 2014. The company ended the
year with 28,658 employees having added 2,855 (net) employees during the year.
SHARE CAPITAL: During the year under review, the company has not issued any
shares and hence the outstanding issued, subscribed and paid-up equity share capital
stands at 33.83 Crore as on March 31, 2014 (33.83 Crore as on March 31, 2013). No
Employee Stock Options were granted and vested during the year.
SUBSIDIARIES:
Infosys BPO have five subsidiaries, namely- Infosys BPO s.r.o, Infosys BPO Poland Sp.
Z.o.o, Infosys McCamish Systems LLC , Portland Group Pty Ltd, and Infosys BPO S. de
R.L. de C.V.
A. Infosys BPO s.r.o
The financial year was a year of growth. We expanded the customer service portfolio
significantly. New lines of business were added and the subsidiary recruited 200+ new
employees. The second half of the year saw the start of an exciting engagement with a
reputed US-based financial institution, where the subsidiary assists the client to enter the
European market. Throughout the year, the Company‟s F&A operations have performed
well on operational parameters.
During the year under review the company generated revenue of ` 113.84 crore as against
a revenue of ` 89.54 crore for the year ended on March 31, 2013 with a loss of 2.56 crore
against the loss of ` 2.67 crore for the year ended on March 31, 2013.
B. Infosys BPO Poland Sp.Z.o.o
The centre continues to grow with existing and new clients (three new projects started in
this fiscal year), focusing on high-end services (Tax, SOX Compliance, FP&A reporting
and analysis, FP&A Consolidation of financial statements, BTS, onsite project work) as

32
well as European language based services as part of Infosys global delivery model. The
Center provides Business Transformation Services for local market companies and is
looking for opportunities to provide BPO services to those companies.
C. Infosys McCamish Systems LLC
During the financial year, the name of the subsidiary company was changed from
McCamish Systems LLC to Infosys McCamish Systems LLC. The Financial year 2014
for Infosys McCamish has been a turnaround year. Significant investment in the first half
of the year were made for the integration of the Des Moines operation which, not only
provided six new marquis logos, but also establishes our footprint in a new line of
business, Employer Sponsored Markets. With the majority of the Des Moines transition
complete, the company expects to finish it by Q2 of FY 15. Significant cost restructuring,
which began in earnest in the middle of the year, has greatly improved the company‟s
financial performance. During this year Infosys McCamish Life Insurance Platform was
recognized as a leader in Gartner's Magic Quadrant.
During Financial Year 2014 the company has generated revenue of ` 324.11 crore as
compared to ` 261.18 crore in the prior year with a profit of ` 7.47 crore as against the
prior year loss of ` 15.90 crore.
D. Portland Group Pty Limited
Portland Group had a strong financial year. There were large / multi-year joint deals sold
and delivered with Infosys Limited and Infosys BPO Limited. The keys financial points
are Revenue growth of 16% and Operating margin (after tax) of 15%.
There was also significant growth in the offshore team with a headcount increase of 58
(28 at 31 March 2013 to 86 as at 31 March 2014), with growth expected to continue. The
start of Financial Year 2015 is off to a promising start with a number of large deals being
sold and also the continuation of the joint deals sold between Portland Group and Infosys.
During the year under review the company generated revenue of ` 212.40 crore as against
a revenue of ` 181.93 crore for the year ended on March 31, 2013 with a profit of ` 22.10
crore against the profit of ` 0.61 crore for the year ended on March 31, 2013.

33
E. Infosys BPO S. de. R.L. de C.V.
During the financial year under review, Infosys have incorporated a subsidiary in Mexico
in the name and style of Infosys BPO S. de. R.L. de C.V. The subsidiary is yet to
commence business operations.
The Company has published the audited consolidated financial statements for the fiscal
year 2014 and the same forms part of this Annual Report. Accordingly, this project
Report does not contain the financial statements of Infosys subsidiaries. The audited
financial statements and related information of subsidiaries are available on company
website, www.infosysbpo.com. These documents will also be available for inspection
during business hours at registered office in Bangalore, India.

34
EARNING OF COMPANY: Consolidated Revenues for the year was ` 3,278.49 Cr. as
against ` 2,572.40 Cr. for the previous year. Gross Margin post depreciation for the year
was ` 1,035.47 Cr. compared to ` 794.97 Cr. during the previous year. Net Income for the
current year was ` 577.79 Cr. as compared to ` 458.49 Cr. for the previous year. Gross
Addition to headcount for the year ended March 31, 2014 was 13,092 compared to 12,152
as at the end of the previous year.
Rupees in crore
Table 2
Figure 2.TREND IN REVENUE, COST AND NET PROFIT OVER THE PAST
FOUR YEAR
Rupees in crore
1471.63 1468.71
2572
3278
1014.071117.91
1699
2152
197.43304.98
458578
0
500
1000
1500
2000
2500
3000
3500
2011 2012 2013 2014
REVENUE
COST
PAT

35
Interpretation: all of the above items are continually moving in upward direction that
show that the market response for the company is comparatively much more better.
Compare to year 2011 the revenue is hiked by more than 122%. And cost is increased by
112%. Overall profit is increased by 193%.
FORECASTING OF REVENUE, COST AND PAT OVER UPCOMING TWO
YEAR
There is upward trend in the sales of company as the percentage of net earnings (profit
after tax) to sales also show bit of upward trend except in year 2014. So, if we predict the
outcome of sales for year 2015 and 2016 by trend method we get 3828.18 and 4480.42
crore rupee sales for year 2015 and 2016 respectively.
Rupees in crore
Figure 3.
REVENUE BY GLOBAL PRESENCE: the major revenue of Infosys BPO is generated
from outside of India. Hence it shows the global presence of Infosys BPO in IT and BPO
industry. Domestic revenue contributes less than 1% in term of rupees. And slowly its
going upward year by year. In 2014 revenue from domestic market(India) is 21.10 crore
that is just .64% of 3257.40 crore. Table is given on next page.
1471.63 1468.71
2572
3278
3828.185
4480.425
1014.07 1117.91
1699
2152
2494.465
2893.953
197.43 304.98458
578708.285
837.758
0
500
1000
1500
2000
2500
3000
3500
4000
4500
5000
2011 2012 2013 2014 2015 2016
revenue
cost
pat

36
PARTICULAR 2011 2012 2013 2014
OVERSEAS 1471.63 1761.31 2554.70 3257.40
DOMESTIC 6.28 7.40 17.10 21.10
TOTAL 1477.91 1468.71 2571.80 3278.50
Table 3.
REVENUE BY INDUSTRY SEGMENT: Infosys BPO offers Business process
outsourcing solutions to several clients and its service offerings span across multiple
industry segments. Following is the revenue by industry:-
Figure 4.
Interpretation: Financial services like insurance, banking, mortgage and manufacturing
services cover more than 65% of total revenue. Lowest revenue comes from retail,
consumer, packaged goods, logistic and life science.
30
35
23
12
REVENUE BY INDUSTRY SEGMENT IN %
Financial service &
insurance
Mfg. services
Energy,utilities,communic
ation
Retail,consumer packaged
goods,logistic and life
science

37
3.2TECHNICAL ANALYSIS:
Infosys BPO limited is a subsidiary company of the Infosys technology limited. Hence
the share of Infosys BPO limited is not directly traded in market. Whole earning and fund
ultimately reflect in his holding company Infosys technologies, and Infosys limited is
cover to the entire subsidiary. So where in requirement of technical analysis in project we
will analysis about Infosys as a whole.
Infosys limited is listed company named as INFY in both Bombay stock exchange and
national stock exchange in India.
PAST FIVE YEAR TREND IN INFOSYS SHARE PRICE
In rupees
Time 2011 2012 2013 2014 2015 02/2015
Open 1722 1379 1163 1749 1962 2279
high 1734 1387 1164 1760 1975 2295
low 1713 1365 1138 1740 1956 2257
Pre. close 1729 1371 1143 1742 1966 2272
value 631.1 k 1.1 M 1 M 448.9 K 1.2 M 1.6 M
Table 4
Where;
K= thousand
M= million
Par value= 5 Rs.
By looking at data we can observe that there has been growth in the share prices over the
past five year but in 2012 and 2013 there is continuously decrease in share price. The
reason behind this may be lower economic position. That we can find by observing the
market index both sensex and nifty.

38
TECHNICAL ANALYSIS OF INFOSYS LIMITED
Figure 5
Interpretation: by looking at the graph we can simply draw a conclusion that price for
Infosys share was lower in 2011 to 2012 end. Again in December 2014 share price come
down till 1450 when founder of Infosys limited sell their personal holding. The reason
behind this was to balance the liquidity.

39
MARKET ANALYSIS OF PAST FIVE YEAR: analysis of market can be done with
the help of market index, beta, alpha and risk associated with stock. to complete this
analysis we assume that the risk of Infosys limited is neutral and flow same as market
index.
Analysis of sensex:
time 3Dec 2011 Dec 2012 Dec 2013 Dec 2014 Dec 2015
open 20274 15583 19364 21114 29446
high 20410 15694 19465 21235 29462
low 20274 15406 19346 21113 29178
close 20389 15454 19444 21193 29231
value 330 M 164 M 241 M 221 M 398 M
Table 5.
Figure 6.
Comment: from last five year in there is drastically changes in share market. From 2010
to February 2015 sensex show 70% of hike by touching amount of 29400. In 2015 sensex
remains all time high. From 2009 to 2011 sensex show upward and downward
movements

40
Analysis of nifty:
2011 2012 2013 2014 2015
OPEN 6172 4681 5901 6292 8883
HIGH 6181 4701 5919 6324 8913
LOW 6124 4639 5879 6289 8794
CLOSE 6146 4646 5905 6313 8895
Table 6.
In rupees
Figure 7.
Comment: Current market index as on February 25, 2015 was 8811 rs. In past
performance we can observe that year 2009 to 2010 and end of 2011 to mid of 2013
performance of nifty was very low. And after 2013 there is continuously increment in
nifty index.
In 2010 and 2012 there is lowest performance where index come down till 4500. After
2013 nifty index shows pure increment.
41
CORRELATION BETWEEN SENSEX AND NIFTY:
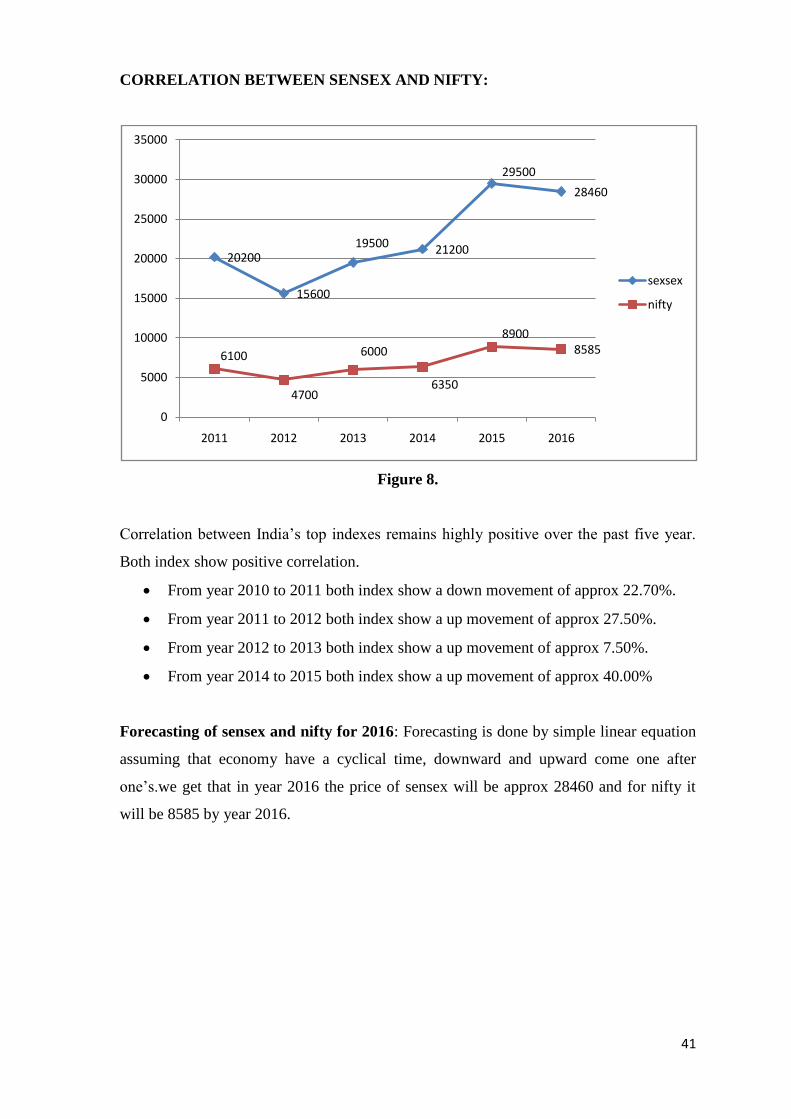
Figure 8.
Correlation between India‟s top indexes remains highly positive over the past five year.
Both index show positive correlation.
From year 2010 to 2011 both index show a down movement of approx 22.70%.
From year 2011 to 2012 both index show a up movement of approx 27.50%.
From year 2012 to 2013 both index show a up movement of approx 7.50%.
From year 2014 to 2015 both index show a up movement of approx 40.00%
Forecasting of sensex and nifty for 2016: Forecasting is done by simple linear equation
assuming that economy have a cyclical time, downward and upward come one after
one‟s.we get that in year 2016 the price of sensex will be approx 28460 and for nifty it
will be 8585 by year 2016.
20200
15600
19500 21200
29500
28460
6100
4700
6000
6350
89008585
0
5000
10000
15000
20000
25000
30000
35000
2011 2012 2013 2014 2015 2016
sexsex
nifty

42
PREDICTION OF YEAR 2016 SHARE PRICE:
Figure 9.
As per the announcement by the CEO of Infosys limited Dr. Vishal Sikka, the target price
of one equity share of Infosys is to cross the figure of 3000. If economy and market
remain in growth position it is not a tough task task to attain given figure, statement by
CFO of Infosys limited.
In Q2FY2015 the revenues of Infosys in the reported currency grew by 3.2% QoQ to
$2,201 million (revenues up 3.9% in constant currency terms, volumes up by a decent 3%
and realization up by 0.6% QoQ). On the margin front, the EBIT margin improved by
100BPS to 26.1%, driven by higher utilization and offshore shift. The net income rose by
7.3% QoQ to Rs3,096 crore. Dr. Vishal Sikka has given a strategic roadmap to take
Infosys back to its old way of predictable and sustainable earnings performance in the
coming quarters. Going forward, the emphasis will be on enhancing the service delivery
and product innovation through higher usage of automation, innovation and operational
efficiency, as well as on new technologies like big data analytics and design thinking
among others.
1734
1387
1164
1760
2295
3000
1713
1365
1138
1740
2257
2700
1729
1371
1143
1742
2272 2300
1000
1100
1200
1300
1400
1500
1600
1700
1800
1900
2000
2100
2200
2300
2400
2500
2600
2700
2800
2900
3000
3100
2011 2012 2013 2014 2015 2016
open
high
low
previous close
2 per. Mov. Avg. (previous close)
43
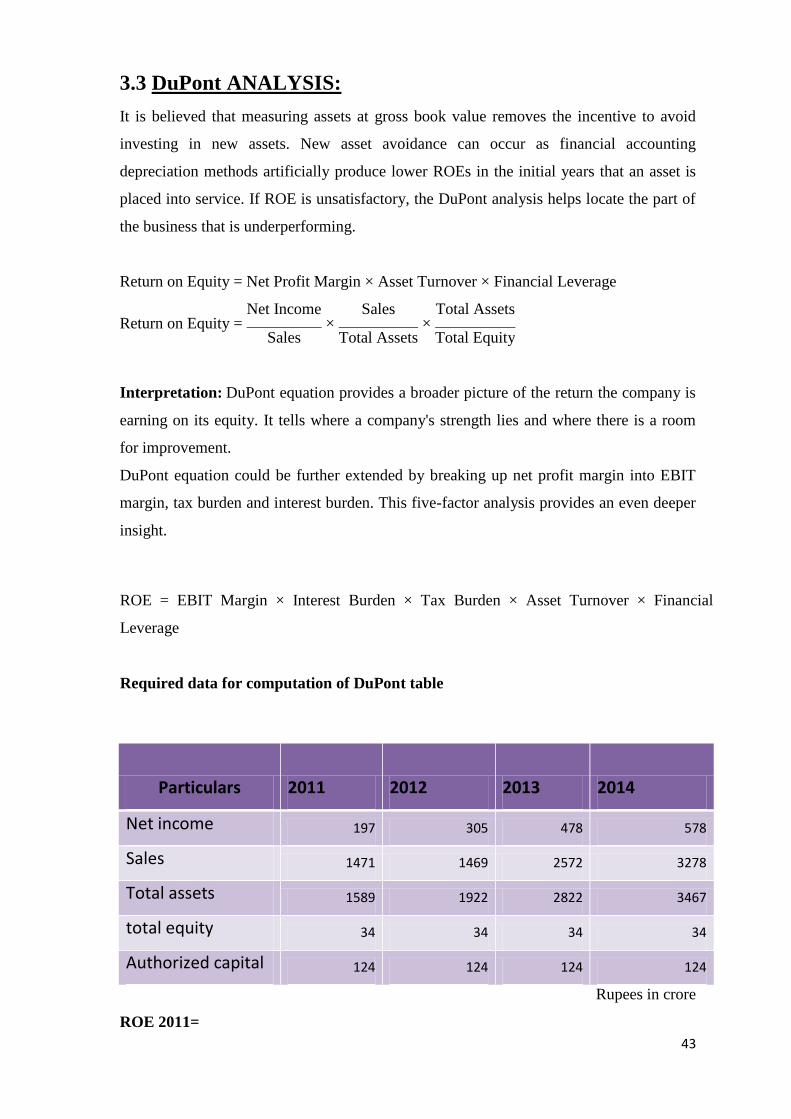
3.3 DuPont ANALYSIS:
It is believed that measuring assets at gross book value removes the incentive to avoid
investing in new assets. New asset avoidance can occur as financial accounting
depreciation methods artificially produce lower ROEs in the initial years that an asset is
placed into service. If ROE is unsatisfactory, the DuPont analysis helps locate the part of
the business that is underperforming.
Return on Equity = Net Profit Margin × Asset Turnover × Financial Leverage
Return on Equity = Net Income
× Sales
× Total Assets
Sales Total Assets Total Equity
Interpretation: DuPont equation provides a broader picture of the return the company is
earning on its equity. It tells where a company's strength lies and where there is a room
for improvement.
DuPont equation could be further extended by breaking up net profit margin into EBIT
margin, tax burden and interest burden. This five-factor analysis provides an even deeper
insight.
ROE = EBIT Margin × Interest Burden × Tax Burden × Asset Turnover × Financial
Leverage
Required data for computation of DuPont table
Particulars 2011 2012 2013 2014
Net income 197 305 478 578
Sales 1471 1469 2572 3278
Total assets 1589 1922 2822 3467
total equity 34 34 34 34
Authorized capital 124 124 124 124
Rupees in crore
ROE 2011=

44
197 ×
1471 ×
1589
1471 1589 34
=5.79%
ROE 2012=
305 ×
1469 ×
1922
1469 1922 34
= 8.97%
ROE 2013=
478 ×
2572 ×
2822
2572 2822 34
=14.05%
ROE 2014=
578 ×
3278 ×
3467
3278 3467 34
= 17.00%
Analysis
Particulars 2011 2012 2013 2014
net profit margin 13.40% 17.20% 17.80% 17.60%
assets turnover 0.92 0.76 0.91 0.94
financial leverage 46.75 56.52 83 101.97
Table 8.
3.4 HORIZONTAL AND VERTICAL ANALYSIS:

45
Consolidated balance sheet of last four year:
Consolidated balance sheet at 2011 2012 2013 2014
Consolidated balance sheet at 2011 2012 2013 2014
Equity and liabilities
Share capital 34 34 34 34
Reserve and surplus 1148 1465 1933 2536
1182 1499 1967 2570
Noncurrent liabilities
Long term provision
Other long term liability 75 70 69 44
75 70 69 44
Current liabilities
Trade payable 5 13 44 7
Other current liabilities 380 428 661 723
Short term provision 42 60 81 123
427 501 786 853
Total 1684 2070 2822 3467
Assets
Non current assets
Fixed assets
Tangible assets 171 248 246 256
Intangible assets 310 477 495 495
Capital work in progress 15 2 3 5
496 727 744 756
Noncurrent investment
3
Deferred tax assets, net 24 25 35 54
Long term loan and advance 108 85 98 110
Other noncurrent assets 24 32 38 47
156 142 171 214
Current assets
Current investment 21 20 151 275
Trade receivable 271 397 548 570
Cash and cash equivalent 567 630 906 1341
Short term loans and advances 123 145 302 311
Other current assets 50 10
1032 1202 1907 2497

46
Table. 9
Trend (Horizontal) analysis of balance sheet:
In %
Figure 10.
For the horizontal analysis year 2011 is been taken as base year as 0%. And share holder
fund include share capital and reserve & surplus. Other liability includes all noncurrent
and current liability. Assets include all kind of assets viz. current assets, noncurrent
assets, noncurrent and current investment.
Highest increment laid for share holder equity as the EPS (earning per share) in 2011
was 61.81 Rs. and for 2014 it touches 170 Rs. Par value of share is Rs. 10 per share.
Vertical analysis of consolidated balance sheet
Rupees in crore
0.00%
26.80%
66.40%
117.42%
0.00%
13.74%
70.30%78.70%
0.00%
22.92%
67.50%
105.87%
0.00%
20.00%
40.00%
60.00%
80.00%
100.00%
120.00%
140.00%
2011 2012 2013 2014
share holder fund
other liability
assets
Total 1684 2070 2822 3467

47
Table 10.
ITEMS 2011 % 2012 % 2013 % 2014 %
EQUITY AND
LIABILITIES
SHARE CAPITAL 34 2.02% 34 1.64% 34 1.20% 34 0.98%
RESERVE AND
SURPLUS 1148 68.17% 1465 70.77% 1933 68.50% 2536 73.15%
1182 70.20% 1499 72.41% 1967 69.70% 2570 74.12%
NON CURRENT
LIABILITIES 75 4.45% 70 3.38% 69 2.44% 44 1.69%
CURRENT
LIABILITIES 427 25.35% 501 24.20% 786 27.85% 853 24.60%
TOTAL 1684 100% 2070 100% 2822 100% 3467 100%
ASSETS
NON CURRENT
ASSETS 496 29.45% 727 53.12% 744 26.36% 756 21.80%
NONCURRENT
INVESTMENT 156 9.26% 142 6.85% 171 6.05% 214 6.17%
CURRENT ASSETS 1032 61.28% 1202 58.06% 1907 67.57% 2497 72.02%
TOTAL 1684 100% 2070 100% 2822 100% 3467 100%

48
CASH AND CASH EQUIVALENTS ITEMS:
The bank balances in India include both Rupee accounts and foreign currency accounts.
The bank balances in overseas current accounts are maintained to meet the expenditure
of the overseas branches and to meet project-related expenditure overseas. The deposit
account represents deposits for short tenures with banks and financial institutions.
Table 11
Consolidated Profit And Loss Account of Past Four Year:
Rupees in crore
consolidated statement of profit
and loss for
year
ended
31,
march
Year
ended
31,
march
Year
ended
31,
march
Year
ended
31,
march
2011 2012 2013 2014
Revenue from business process
management service 1472 1768 2572 3278
Other income 44 53 149 137
Total revenue 1516 1821 2721 3415

49
Expenses
Employee benefit expenses 842 917 1415 1808
Cost of technical subcontractor 76 60 136 185
Travel expenses 66 73 121 127
Cost of software packages 28 25 42 54
Communication expenses 41 32 42 59
Professional charges 28 54 72 63
Other expenses 44 46 56 64
Power and fuel 19 23 28 30
Insurance charges 9 10 11 15
Rent 55 63 87 104
Depreciation expenses 58 60 79 91
Other expenses 28 35 40 66
Total expenses 1294 1400 2129 2666
Profit before tax 222 422 592 749
Tax expenses
Current tax 21 101 147 192
Deferred tax -7 -0.55 -13 -21
14 100 134 171
Profit for the year 209 321 458 578
Earnings per share
Equity share par value of Rs 10 each
Basic 61.81 94.33 135.54 170.8
Diluted 61.81 94.33 135.54 170.8
Weighted Avg. no. Of share used in
computing EPS
Both basic and diluted 33827751 33827751 33827751 33827751
Table 12

50
Vertical analysis of profit and loss statement:
The function wise classification of statement of Profit and Loss account is as follows:
Rupees in crore
Rupees in crore
Table 13
Consolidated Revenues for the year 2014 was ` 3,278.49 Cr. as against ` 2,572.40 Cr. for
the previous year. Gross Margin post depreciation for the year was ` 1,035.47 Cr.
compared to ` 794.97 Cr. during the previous year. Net Income for the current year was `
577.79 Cr. as compared to ` 458.49 Cr. for the previous year. Gross Addition to
headcount for the year ended March 31, 2014 was 13,092 compared to 12,152 as at the
end of the previous year.

51
Revenue segment by industry:
Infosys BPO offers Business process outsourcing solutions to several clients and its
service offerings span across multiple industry segments. Following is the revenue by
industry:-
Table 14
Revenue by geographic segment:
Revenue is also analyzed in terms of the client locations spread across the globe. Infosys
BPO offers services to clients located at different parts of the world, both offshore and
onsite. Revenues by location are:-
Table 15

52
Cash flow statement of year 2014 and 2013

53
Cash flow statement of year 2011 and 2012
Table 16

54
3.5 RATIO ANALYSIS:
LIQUIDITY RATIO: Liquidity ratio determine liquidation position of company. It‟s
a comparative quantitative analysis of current assets to current liability. Past four year
ratio is computed below for Infosys BPO limited.
CURRENT RATIO: Current ratio is the relationship between current asset and
current liability. This ratio is also known as working capital ratio which measures the
other general liquidity and is most widely used to make the analysis of short term
financial position of a firm. It is calculated by dividing the total current asset by total
current liability.
Current Ratio=Current Assets/current Liabilities
A relatively high current ratio is an indication that the firm is liquid and has the ability to
pay its current obligation in time as and when they become due. The rule of thumb is 2:1
i.e. current asset as double the current liability is consider to be satisfactory.
CURRENT RATIO 2011
= 1032÷ 427
= 2.4
CURRENT RATIO 2012=
= 1202 ÷ 501
= 2.4
CURRENT RATIO 2013=
= 1907 ÷ 786
= 2.4
CURRENT RATIO 2014=
= 2497 ÷ 853
= 2.9

55
Significance and interpretation
Current ratio is a useful test of the short-term-debt paying ability of any business. A ratio
of 2:1 or higher is considered satisfactory for most of the companies but analyst should be
very careful while interpreting it. Simply computing the ratio does not disclose the true
liquidity of the business because a high current ratio may not always be a green signal. It
requires a deep analysis of the nature of individual current assets and current liabilities. A
company with high current ratio may not always be able to pay its current liabilities as
they become due if a large portion of its current assets consists of slow moving or
obsolete inventories. On the other hand, a company with low current ratio may be able to
pay its current obligations as they become due if a large portion of its current assets
consists of highly liquid assets i.e., cash, bank balance, marketable securities and fast
moving inventories. Consider the following example to understand how the composition
and nature of individual current assets can differentiate the liquidity position of two
companies having same current ratio figure.
From 2011 to 2014 current ratio is more than satisfactory ratio. That means that the
current assets is more than two time of current liabilities.

56
QUICK RATIO: Quick ratio is computed by reducing the inventories or marketable
securities from current assets. Past four year quick ratio is calculated below.
Quick Ratio= Current Assets - inventories/current Liabilities
Or
QUICK RATIO 2011=
=1032-50/427
= 2.29
QUICK RATIO 2012=
= 1202-10/501
=3.37
QUICK RATIO 2013=
=1907-0/786
=2.4
QUICK RATIO 2014=
=2497-0/853
=2.9
Significance and Interpretation
Quick ratio is considered a more reliable test of short-term solvency than current ratio
because it shows the ability of the business to pay short term debts immediately.
Inventories and prepaid expenses are excluded from current assets for the purpose of
computing quick ratio because inventories may take long period of time to be converted
into cash and prepaid expenses cannot be used to pay current liabilities.
Generally, a quick ratio of 1:1 is considered satisfactory. Like current ratio, this ratio
should also be interpreted carefully.. On the other hand, a company with low quick ratio
may have fast moving inventories. The analyst, therefore, must have a hard look on the
nature of individual assets.

57
PROFITABILITY RATIO: Profitability ratios measure the efficiency of
management in the employment of business resources to earn profits. These ratios
indicate the success or failure of a business enterprise for a particular period of time.
Profitability ratios are used by almost all the parties connected with the business. A strong
profitability position ensures common stockholders a higher dividend income and
appreciation in the value of the common stock in future. Creditors, financial institutions
and preferred stockholders expect a prompt payment of interest and fixed dividend
income if the business has good profitability position. Management needs higher profits
to pay dividends and reinvest a portion in the business to increase the production capacity
and strengthen the overall financial position of the company.
GROSS PROFIT RATIO: gross profit ratio is to compare gross profit to the total sales
by company for a time period. Higher the ratio determines higher the position of
company. Past four year gross profit ratio is computed below.
GROSS PROFIT RATIO 2011:
=222/1472X100
=15.08%
GROSS PROFIT RATIO 2012:
=422/1768X100
=23.86%
GROSS PROFIT RATIO 2013:
=873/2572X100
=33.94%
GROSS PROFIT RATIO 2014:
=1126/3278X100
=34.35%

58
Significance and interpretation:
Gross profit is very important for any business. It should be sufficient to cover all
expenses and provide for profit.
There is no norm or standard to interpret gross profit ratio (GP ratio). Generally, a higher
ratio is considered better.
The ratio can be used to test the business condition by comparing it with past years‟ ratio
and with the ratio of other companies in the industry. A consistent improvement in gross
profit ratio over the past years is the indication of continuous improvement . When the
ratio is compared with that of others in the industry, the analyst must see whether they use
the same accounting systems and practices.
As we see the trend of gross profit ratio its increasing year by year. Higher gross profit
ratio indicate more profit earning. Hence Infosys BPO is earning good gross profit as its
increasing year by year.

59
OPERATING PROFIT / MARGIN RATIO: operating profit ratio compare total
operating expenses to the total revenue received by company in a particular time period.
Past four year operating ratio is given below.
OPERATING PROFIT RATIO 2011:
==222/1472X100
=15.08%
OPERATING PROFIT RATIO 2012:
=422/1768X100
=23.86%
OPERATING PROFIT RATIO 2013:
=873/2572X100
=20.25%
OPERATING PROFIT RATIO 2014:
=703/3278X100
=21.44%
Significance and interpretation:
The operating profit margin ratio is a key indicator for investors and creditors to see how
businesses are supporting their operations. If companies can make enough money from
their operations to support the business, the company is usually considered more stable.
On the other hand, if a company requires both operating and non-operating income to
cover the operation expenses, it shows that the business' operating activities are not
sustainable.
A higher operating margin is more favorable compared with a lower ratio because this
shows that the company is making enough money from its ongoing operations to pay for
its variable costs as well as its fixed costs.

60
NET PROFIT RATIO: net profit ratio is computed by dividing the net income by total
sales of a particular time period. ratio is shown in percentage format. High percent of
ratio show higher profit. The past four year net profit ratio is computed below.
NET PROFIT RATIO 2011:
=209/1472x100
=14.20%
NET PROFIT RATIO 2012:
=321/1768x100
=18.16%
NET PROFIT RATIO 2013:
=458/2572x100
=17.80%
NET PROFIT RATIO 2014:
=578/3278x100
=17.63%
Significance and Interpretation:
Net profit (NP) ratio is a useful tool to measure the overall profitability of the business. A
high ratio indicates the efficient management of the affairs of business.
There is no norm to interpret this ratio. To see whether the business is constantly
improving its profitability or not, the analyst should compare the ratio with the previous
years‟ ratio, the industry‟s average and the budgeted net profit ratio.
The use of net profit ratio in conjunction with the assets turnover ratio helps in
ascertaining how profitably the assets have been used during the period.

61
BALANCE SHEET RATIO:
DEBT TO EQUITY RATIO: debt to equity ratio measure the proportion of capital mix.
It shows the mix of capital of company and how it is distributed among debt to equity. as
there is no debenture in the capital structure of Infosys BPO limited so there won‟t be any
calculation for debt to equity ratio.
CASH AND CASH EQUIVALENT / TOTAL ASSETS RATIO: The balance
sheet shows the amount of cash and cash equivalents at a given point in time, and the cash
flow statement explains the change in cash and cash equivalents over time.
Although there is some leeway for judgment, common examples of cash and cash
equivalents include bank accounts, money market funds, marketable securities, and
Treasury bills. To be considered a "cash equivalent," a security must be so
near maturity that there is little risk of change in its value if interest rates change (this
typically translates to less than three months of remaining maturity).
The Financial Accounting Standards Board (FASB) requires companies to establish
policies concerning which types of short-term, highly liquid investments are treated as
cash equivalents.
CASH AND CASH EQUIVALENT / TOTAL ASSETS RATIO 2011:
= 567/1684x100
=33.66%
CASH AND CASH EQUIVALENT / TOTAL ASSETS RATIO 2012:
=630/2070x100
=30.43%
CASH AND CASH EQUIVALENT / TOTAL ASSETS RATIO 2013:
=906/2822x100
=32.10%
CASH AND CASH EQUIVALENT / TOTAL ASSETS RATIO 2014:
=1341/3467x100
=38.67%
http://www.investinganswers.com/financial-dictionary/financial-statement-analysis/balance-sheet-1083
http://www.investinganswers.com/financial-dictionary/financial-statement-analysis/balance-sheet-1083

62
CASH AND CASH EQUIVALENT / TOTAL REVENUE RATIO:
CASH AND CASH EQUIVALENT / TOTAL REVENUE RATIO 2011:
=567/1516x100
=37.40%
CASH AND CASH EQUIVALENT / TOTAL REVENUE RATIO 2012:
=630/1821x100
=34.60%
CASH AND CASH EQUIVALENT / TOTAL REVENUE RATIO 2013:
=906/2721x100
=33.30%
CASH AND CASH EQUIVALENT / TOTAL REVENUE RATIO 2014:
=1341/3415x100
=39.26%
Significance and Interpretation:
The amount of cash and cash equivalents a company holds is very important and is a large
component of a company's overall operating strategy. For instance, companies with high
amounts of cash and cash equivalents are better able to get through hard times
when sales are low or expenses are particularly high. High cash reserves can also signal
that the company is "saving up" to make some significant acquisition.
However, companies with a lot of cash on hand are often takeover targets because their
excess cash essentially helps buyers finance their purchase. High cash reserves can also
indicate that management has not figured out how to best deploy the cash.
It is important to note that there is an opportunity cost to holding cash; that cost is the
return on equity that company could have earned by investing the cash in a new product
or expanding business.
63
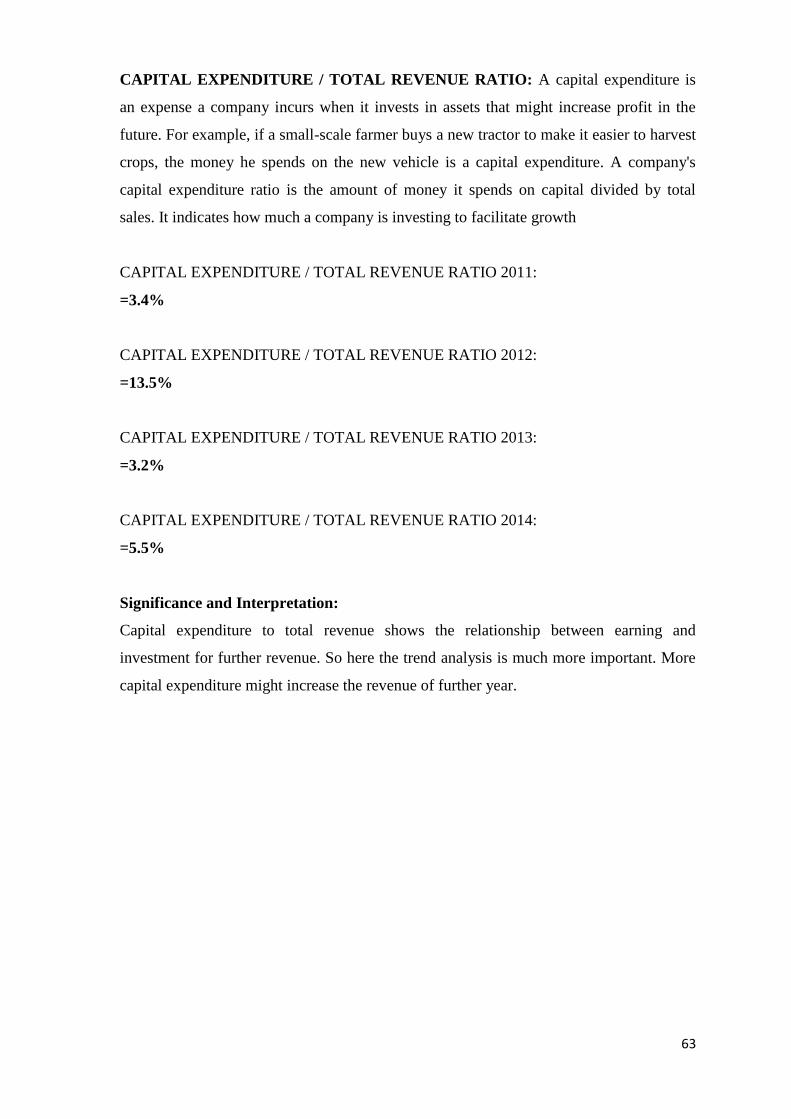
CAPITAL EXPENDITURE / TOTAL REVENUE RATIO: A capital expenditure is
an expense a company incurs when it invests in assets that might increase profit in the
future. For example, if a small-scale farmer buys a new tractor to make it easier to harvest
crops, the money he spends on the new vehicle is a capital expenditure. A company's
capital expenditure ratio is the amount of money it spends on capital divided by total
sales. It indicates how much a company is investing to facilitate growth
CAPITAL EXPENDITURE / TOTAL REVENUE RATIO 2011:
=3.4%
CAPITAL EXPENDITURE / TOTAL REVENUE RATIO 2012:
=13.5%
CAPITAL EXPENDITURE / TOTAL REVENUE RATIO 2013:
=3.2%
CAPITAL EXPENDITURE / TOTAL REVENUE RATIO 2014:
=5.5%
Significance and Interpretation:
Capital expenditure to total revenue shows the relationship between earning and
investment for further revenue. So here the trend analysis is much more important. More
capital expenditure might increase the revenue of further year.

64
OPERATING CASH FLOW / TOTAL REVENUE:
OPERATING CASH FLOW / TOTAL REVENUE 2011:
=173/1516x100
=11.41%
OPERATING CASH FLOW / TOTAL REVENUE 2012:
=263/1821x100
=14.44%
OPERATING CASH FLOW / TOTAL REVENUE 2013:
=347/2822x100
=12.29%
OPERATING CASH FLOW / TOTAL REVENUE 2014:
=406/3467x100
=11.71%
Significance and Interpretation: operating cash flow to total revenue measure the
operational efficiency of company. Higher ratio indicates high operational efficiency
company. Here operating cash flow doesn‟t mean just cash inflow from operational
activity. Its combined of inflow and outflow.

65
Summary table of ratios for year 2013 and 2014:
66
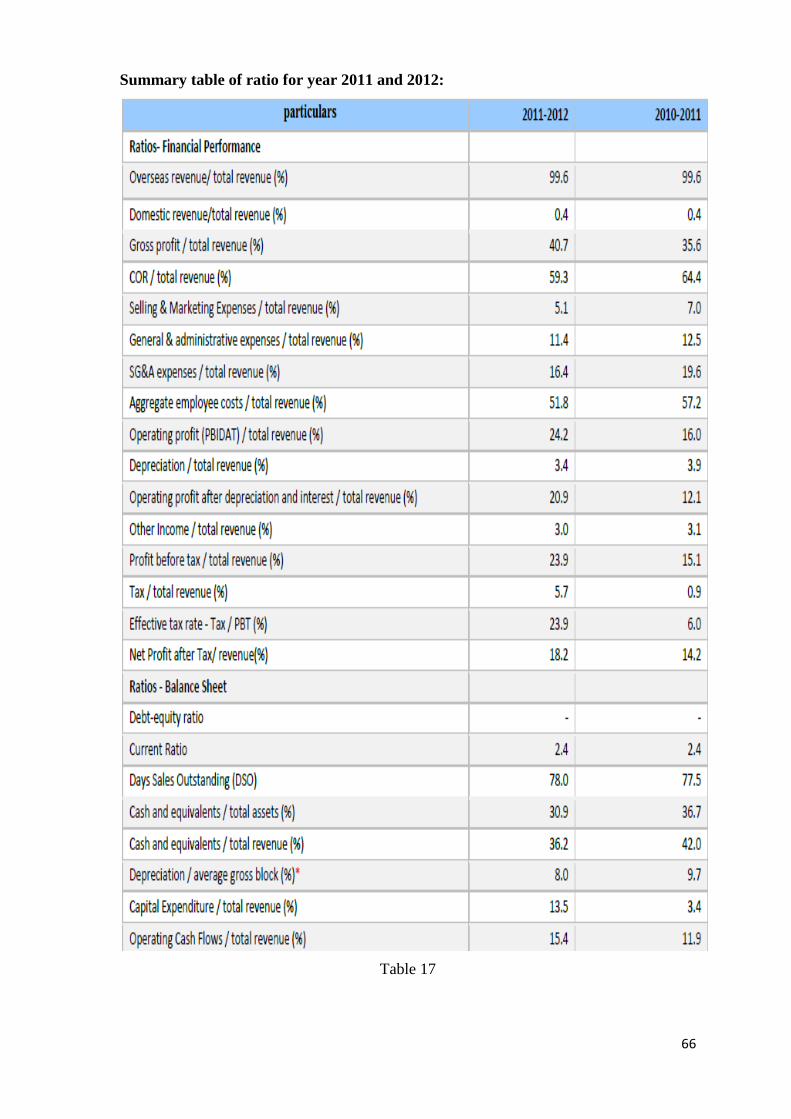
Summary table of ratio for year 2011 and 2012:
Table 17

67
4.
Summary of findings
68
4.1 PERFORMANCE OVERVIEW
Infosys BPO earned revenue of ` 2,323 crore in financial year 2013-14 as compared to `
1,831 crore in financial year 2012-13. The company ended year with net profit after tax of
` 512 crore when compared with the previous year of ` 428 crore. The company‟s
profitability after tax for the year is 22.04%. The company continues to be amongst the
most profitable BPO companies in India. The company added 6 (net) customers and now
has 144 customers as on March 31, 2014. The company ended the year with 28,658
employees having added 2,855 (net) employees during the year.
Focus on accelerating growth enabled company to grow revenue and strengthen the
market position through consistent value delivery and our presence in various external
forums has enhanced our relationship with our existing customers. Another year of
successful engagement has enhanced our relationship with one of the largest electronic
companies in the world operating in more than 60 countries. Some of the key clients won
this year include an American multinational conglomerate company, a Dutch
multinational Chemicals company, an Australian global investment banking company,
one Australian banking and financial services company, a multinational Internet
corporation headquartered in US, a leading private bank in UK that offers a wide range of
financial services to private and corporate clients, Australia's largest telecommunications
and media company, a US based insurance & financial services company specialized in
auto, property and life insurance and retirement annuities.
The year was very eventful for our global centers with the opening of 4 new delivery
centers in Puerto Rico, Phoenix, Milwaukee and Costa Rica. With this our total Delivery
Center count has increased to 26 locations in 13 countries. Our global presence has
helped us to add multiple new logos to our repertoire.
Infosys BPO continue to invest in his technology solutions to leverage recent advances
and trends in technology platforms to improve the end user experience. Our Technology
Value accelerators have continued to be significant levers with respect to enhancing
business value delivered to clients. For a few of their large clients, Infosys BPO have also
done global rollouts of our technology transformational suite of solutions, especially in
the F&A domain, covering multiple countries, integrating with leading ERPs like SAP,
Oracle and JD Edwards.

69
Increasing trend toward offshore technology services
Outsourcing the business process management critical business processes has become
increasingly important to companies. Due to the availability of large qualified talent pool
and the synergy with IT business, India plays an important strategic role in the off shoring
strategy of our clients. The effective use of offshore services offers a variety of benefits to
companies, including lower cost of ownership, lower labour costs, improved quality and
innovation, faster delivery of solutions and more flexibility in scheduling. This has
resulted in increased diversification in the range of services delivered offshore.
FORECASTING: forecasting and prediction include forecasting od share price, sales
revenue, cost, and net profit.
Share price trend and prediction: after analysis of all the factor like, economic factor,
industrial factor, strength of company, and other assumption it is been drawn that the
share price of Infosys limited will touch the figure of 2700 to 3000+. More weight age is
given to benchmark performance while prediction of future price. Upper, average, and
least prediction is given below.
Upper price: 3000+
Average price: 2700
Lower price: 2300
Forecasting is done on the basis of simple linear equation (trend) method. Past four year
data is taken into consideration for the calculation of future price.
Forecasting of sales, cost and net profit for the year 2015 and 2016: from
2011 to 2014 all of the items are continually moving in upward direction that show that
the market response for the company is comparatively much more better. Compare to
year 2011 the revenue is hiked by more than 122%. And cost is increased by 112%.
Overall profit is increased by 193%.

70
The estimation is for year 2016 is given below
Revenue: 4480 crore
Cost: 2893 crore
PAT: 0838 crore
Forecasting is done on the basis of simple linear equation (trend) method. Past four year
data is taken into consideration for the calculation of future price.

71
5.
Conclusion and suggestion

72
5.1 CONCLUSION
Infosys BPO, the business process outsourcing subsidiary of Infosys (BSE, NSE, NYSE:
INFY), is an end-to-end outsourcing services provider. Infosys BPO addresses the
business challenges and unlocks business value by applying proven process
methodologies with integrated IT and business process outsourcing solutions.
The company applies business excellence frameworks to significantly
Reduce costs
Enhance effectiveness
And optimize business processes
The company focuses on integrated end-to-end outsourcing and delivery of result-
oriented benefits to our clients through reduced costs, ongoing productivity
improvements, and process reengineering.
Infosys BPO always look for the potential growth and development of valuable business
and maintain strong client relationship.
Movement in Financial condition of Infosys BPO is varying according to the market and
industry variation. The regression line of NIFTY and SENSEX is a good source of
prediction as the fluctuation is in in same direction.
Infosys BPO is purely equity company hence company haven‟t issued debenture in
market. That lead to higher cost of capital.
Infosys BPO has operation in worldwide, so there is no doubt that is not up to date or
having outdated technology.
73
5.2 SUGGESTION
Cost of capital: Infosys BPO is only issued equity share capital of 34 crore against
124 crore of authorized capital. Issuing only equity shares capital lead to higher cost of
capital. so I would like to suggest that Infosys BPO may issue fixed rate bond/debenture
to reduce cost of capital.
Lack of leverage: lack of leverage is felt by Infosys BPO share holder because they
can‟t get benefit of arbitrage. Capital structure should include leverage.
Time to grow in Europe: overall business process outsourcing market has grown
significantly over the past five year with average annual growth of more than 25% for
finance outsourcing. However this growth is primary driven by large north American and
British firm.
The European market started moving in UK firm. And the same is a golden opportunity
for Infosys BPO to catch the superior client.
Cost of employee: Infosys BPO pay less salary to fresher and less than two year
experienced employee. The cost of training is much more high than compare to
competitive.
Operational efficiency: even though Infosys BPO limited is king of the industry
there is some lacking in operational efficiency. Efficiency can be improved by hiring
talented person. The perception about Mysore training is much higher than what it is
really.
So i would like to suggest that company should pay high payment and highly qualified
and talented person. That will increase the efficiency of operation. And this will also lead
to non bench of employee.

74
BIBLIOGRAPHY
WEBSITES
Infosys intranet (panorama, harmony, email,)
http://www.infosys.com/about
http://www.infosysbpo.com/
http://en.wikipedia.org/wiki/Infosys_BPO_Limited#cite_note-ARIl BPO2013-14-1
http://www.accountantnextdoor.com/
BOOKS
The times of India, the financial chronicle
Financial management by Jawahar lal (book)
Previous research and study on Infosys BPO limited
Security analysis Portfolio and management by Punithavani Pandian
Financial management by Sk. Gupta