FINANCIAL STATEMENTS - s3.amazonaws.comQ3+Financials.pdf · Foreign exchange (loss) gain ......
22
FINANCIAL STATEMENTS (Unaudited) September 30, 2017
Transcript of FINANCIAL STATEMENTS - s3.amazonaws.comQ3+Financials.pdf · Foreign exchange (loss) gain ......
FINANCIAL STATEMENTS (Unaudited)
September 30, 2017

1
KINDER MORGAN CANADA LIMITED
CONSOLIDATED STATEMENTS OF INCOME
(In millions of Canadian dollars, except per share amounts)
(Unaudited)
Three Months Ended
September 30, Nine Months
Ended September 30,
2017 2016 2017 2016
Revenues
Services 166.3 169.3 498.8 500.9
Product Sales and Other 0.7 0.2 1.4 1.0
Total Revenues 167.0 169.5 500.2 501.9
Operating Costs, Expenses and Other
Operations and maintenance 52.9 53.4 157.8 143.7
Depreciation, depletion and amortization 37.2 34.3 107.6 102.5
General and administrative 16.2 15.2 50.5 45.4
Taxes, other than income taxes 9.3 9.0 28.9 29.1
Other expense, net 0.8 0.2 3.0 0.2
Total Operating Costs, Expenses and Other 116.4 112.1 347.8 320.9
Operating Income 50.6 57.4 152.4 181.0
Other Income (Expense)
Interest, net (1.3 ) (7.0 ) (10.9 ) (22.9 )
Foreign exchange (loss) gain (0.2 ) (17.0 ) (5.3 ) 59.3
Capitalized equity financing costs 7.8 4.6 19.6 12.8
Other, net 0.2 — 0.9 0.1
Total Other Income (Expense) 6.5 (19.4 ) 4.3 49.3
Income Before Income Taxes 57.1 38.0 156.7 230.3
Income Tax Expense (14.7 ) (17.7 ) (42.4 ) (46.3 )
Net Income 42.4 20.3 114.3 184.0
Preferred share dividend (2.0 ) — (2.0 ) —
Net Income Attributable to Kinder Morgan Interest (28.7 ) (20.3 ) (96.4 ) (184.0 )
Net Income Available to Restricted Voting
Stockholders 11.7
—
15.9
—
Restricted Voting Shares
Basic and Diluted Earnings Per Restricted Voting
Share 0.11
0.22
Basic and Diluted Weighted Average Restricted
Voting Shares Outstanding 103.0
72.1
Dividends Per Restricted Voting Share Declared for the
Period 0.1625
0.2196
The accompanying notes are an integral part of these consolidated financial statements.

2
KINDER MORGAN CANADA LIMITED
CONSOLIDATED STATEMENTS OF COMPREHENSIVE INCOME
(In millions of Canadian dollars)
(Unaudited)
Three Months Ended
September 30, Nine Months
Ended September 30,
2017 2016 2017 2016
Net income 42.4 20.3 — 114.3 184.0
Other comprehensive income (loss)
Benefit plans (0.1 ) 0.5 (0.7 ) 2.5
Foreign currency translation adjustments (1.3 ) 0.9 (1.8 ) (3.1 )
Total other comprehensive (loss) income (1.4 ) 1.4 (2.5 ) (0.6 )
Comprehensive income 41.0 21.7 111.8 183.4
Comprehensive income attributable to Kinder Morgan
interest (27.8 ) (21.7 ) (94.9 ) (183.4 )
Comprehensive income attributable to Kinder Morgan
Canada Limited 13.2 —
16.9
—
The accompanying notes are an integral part of these consolidated financial statements.

3
KINDER MORGAN CANADA LIMITED
CONSOLIDATED BALANCE SHEETS
(In millions of Canadian dollars)
(Unaudited)
September 30, 2017 December 31, 2016
ASSETS
Current assets
Cash and cash equivalents 330.3 159.0
Accounts receivable 49.2 34.5
Accounts receivable-affiliates 3.9 39.1
Prepayments 21.2 3.7
Inventories 12.6 12.4
Other current assets 7.2 13.1
Total current assets 424.4 261.8
Property, plant and equipment, net 3,540.0 3,181.1
Investments 40.5 30.2
Goodwill 248.0 248.0
Deferred charges and other assets 103.9 18.3
Total Assets 4,356.8 3,739.4
LIABILITIES AND EQUITY
Current liabilities
Current portion of debt 165.0 —
Accounts payable 158.3 109.2
Accounts payable-affiliates 1.5 144.3
Accrued interest-affiliates — 61.8
Regulatory liabilities 107.9 122.9
Other current liabilities 35.9 24.2
Total current liabilities 468.6 462.4
Long-term liabilities and deferred credits
Long-term debt-affiliates (KMI Loans) — 1,362.1
Deferred income taxes 323.4 304.8
Retirement and postretirement benefits 73.9 74.9
Regulatory liabilities 41.2 37.6
Deferred revenues 51.9 51.6
Other deferred credits 5.0 10.0
Total long-term liabilities and deferred credits 495.4 1,841.0
Total Liabilities 964.0 2,303.4
Commitments and contingencies (Note 9)
Equity
Preferred share capital (Note 4) 293.5 —
Restricted and special voting share capital (Note 4) 1,701.4 —
Equity attributable to Kinder Morgan - pre-IPO — 1,475.0
Retained deficit (765.7 ) (13.1 )
Accumulated other comprehensive loss (8.5 ) (25.9 )
Total Kinder Morgan Canada Limited equity 1,220.7 1,436.0
Kinder Morgan interest 2,172.1 —
Total Equity 3,392.8 1,436.0
Total Liabilities and Equity 4,356.8 3,739.4
The accompanying notes are an integral part of these consolidated financial statements.

4
KINDER MORGAN CANADA LIMITED
CONSOLIDATED STATEMENTS OF CASH FLOWS
(In millions of Canadian dollars)
(Unaudited)
Nine Months
Ended September 30,
2017 2016
Operating Activities
Net income 114.3 184.0
Non-cash items:
Depreciation, depletion and amortization 107.6 102.5
Deferred income tax 38.5 45.0
Capitalized equity financing costs (19.6 ) (12.8 )
Unrealized foreign exchange loss (gain) 5.7 (59.3 )
Other non-cash items 9.4 2.2
Change in operating assets and liabilities (Note 8) (97.1 ) —
Cash provided by operating activities 158.8 261.6
Investing Activities
Capital expenditures (407.8 ) (177.4 )
Construction in advance (1.3 ) —
Contributions to Trusts (10.3 ) (12.1 )
Sale of property, plant and equipment, net of removal costs (0.2 ) (0.4 )
Change in restricted cash (0.4 ) (0.2 )
Cash used in investing activities (420.0 ) (190.1 )
Financing Activities
Proceeds received from IPO, net 1,671.0 —
Issuance of preferred shares, net 293.5 —
Issuances of debt 287.3 —
Payments of debt (122.3 ) —
Debt issue costs (74.7 ) —
(Repayments of) advances from debt with affiliate (1,606.3 ) 12.5
Dividend (4.3 ) —
Distributions to Kinder Morgan interests (10.4 ) —
Contributions from parent — 10.2
Distributions to parent — (10.3 )
Cash provided by financing activities 433.8 12.4
Effect of Exchange Rate Changes on Cash and Cash Equivalents (1.3 ) (1.6 )
Net increase in Cash and Cash Equivalents 171.3 82.3
Cash and Cash Equivalents, beginning of period 159.0 72.7
Cash and Cash Equivalents, end of period 330.3 155.0
Supplemental Disclosures of Cash Flow Information
Cash paid including affiliates during the period for interest (net of capitalized interest) 60.6 —
Cash paid during the period for income taxes 1.4 1.0
Noncash Investing and Financing Activities
Increase in property, plant and equipment from both accruals and contractor retainage 42.0 14.4
Decrease in property, plant and equipment due to foreign currency translation
adjustments
(2.2 ) (7.4 )
The accompanying notes are an integral part of these consolidated financial statements.
5
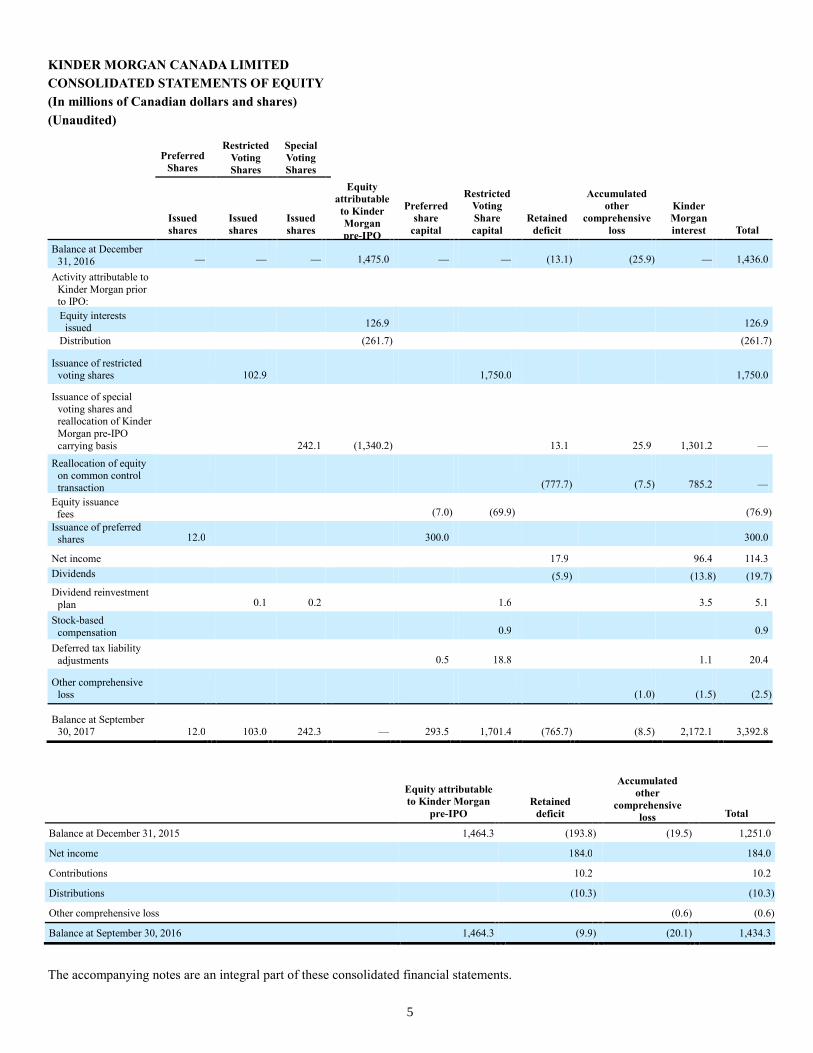
KINDER MORGAN CANADA LIMITED
CONSOLIDATED STATEMENTS OF EQUITY
(In millions of Canadian dollars and shares)
(Unaudited)
Preferred
Shares
Restricted
Voting
Shares
Special
Voting
Shares
Issued
shares Issued
shares Issued
shares
Equity
attributable
to Kinder
Morgan
pre-IPO
Preferred
share
capital
Restricted
Voting
Share
capital Retained
deficit
Accumulated
other
comprehensive
loss
Kinder
Morgan
interest Total
Balance at December
31, 2016 — —
—
1,475.0
—
—
(13.1 ) (25.9 ) —
1,436.0
Activity attributable to
Kinder Morgan prior to IPO:
Equity interests issued
126.9
126.9
Distribution (261.7 ) (261.7 )
Issuance of restricted voting shares 102.9
1,750.0
1,750.0
Issuance of special
voting shares and reallocation of Kinder
Morgan pre-IPO
carrying basis 242.1
(1,340.2 ) 13.1
25.9
1,301.2
—
Reallocation of equity on common control
transaction (777.7 ) (7.5 ) 785.2
—
Equity issuance fees (7.0 ) (69.9 ) (76.9 )
Issuance of preferred shares
12.0 300.0
300.0
Net income 17.9 96.4 114.3
Dividends
(5.9 ) (13.8 ) (19.7 )
Dividend reinvestment
plan 0.1
0.2
1.6
3.5
5.1
Stock-based
compensation 0.9
0.9
Deferred tax liability
adjustments 0.5
18.8
1.1
20.4
Other comprehensive loss (1.0 ) (1.5 ) (2.5 )
Balance at September 30, 2017 12.0
103.0
242.3
—
293.5
1,701.4
(765.7 ) (8.5 ) 2,172.1
3,392.8
Equity attributable
to Kinder Morgan
pre-IPO Retained
deficit
Accumulated
other
comprehensive
loss Total
Balance at December 31, 2015 1,464.3 (193.8 ) (19.5 ) 1,251.0
Net income 184.0 184.0
Contributions 10.2 10.2
Distributions (10.3 ) (10.3 )
Other comprehensive loss (0.6 ) (0.6 )
Balance at September 30, 2016 1,464.3 (9.9 ) (20.1 ) 1,434.3
The accompanying notes are an integral part of these consolidated financial statements.

6
KINDER MORGAN CANADA LIMITED
NOTES TO CONSOLIDATED FINANCIAL STATEMENTS
(Unaudited)
1. General
The Company was incorporated under the Business Corporations Act (Alberta) on April 7, 2017. On May 30, 2017,
we completed an initial public offering (“IPO”) of our Restricted Voting Shares and used the net proceeds of $1,671.0 million
to acquire an approximate 30% indirect interest in Kinder Morgan Canada Limited Partnership (“Limited Partnership”) from
certain affiliates of Kinder Morgan, Inc. (“Kinder Morgan”), who retained an approximate 70% ownership of the limited
partnership units in the Limited Partnership. When we refer to “us,” “we,” “our,” “ours,” “the Company,” or “KML,” we are
describing Kinder Morgan Canada Limited.
The Limited Partnership and Kinder Morgan Canada GP Inc. (the “General Partner”) were formed under the laws of
the Province of Alberta in conjunction with the IPO. The Limited Partnership, through its ownership of Kinder Morgan Cochin
ULC, indirectly consolidates Kinder Morgan Canada, Inc. (“KMCI”) and all or its proportion of the following operating entities
(collectively the “Operating Entities”):
• Kinder Morgan Cochin ULC(1)
• KM Canada Marine Terminal Limited Partnership
• KM Canada North 40 Limited Partnership
• KM Canada Rail Holdings GP Limited
• Trans Mountain (Jet Fuel) Inc.
• Trans Mountain Pipeline (Puget Sound) LLC
• Trans Mountain Pipeline ULC
• Trans Mountain Pipeline L.P.
(1) Kinder Morgan Cochin ULC indirectly owns a 50% undivided interest in the Edmonton Rail Terminal, the Alberta Crude Terminal and the
Base Line Terminal joint venture operations which are proportionally consolidated by subsidiaries of the Limited Partnership.
The Limited Partnership is a variable interest entity because a simple majority or lower threshold of the limited
partnership interests do not possess substantive “kick-out” rights (i.e., the right to remove the general partner or to dissolve
(liquidate) the entity without cause) or substantive participation rights. The General Partner is the primary beneficiary because
it has the power to direct the activities that most significantly impact the Limited Partnership’s performance and the right to
receive benefits, and obligation to absorb losses, that could be significant to the Limited Partnership. As a result, the General
Partner consolidates the Limited Partnership. The General Partner is a wholly-owned subsidiary of the Company.
Consequently, the Company indirectly consolidates the Limited Partnership and the Operating Entities in its consolidated
financial statements.
Business Description
We have two business segments: (i) the Pipelines segment which includes the Trans Mountain Pipeline system (“Trans
Mountain”) that currently transports approximately 300,000 barrels per day (“bpd”) of crude oil and refined petroleum from
Edmonton, Alberta to Burnaby, British Columbia (“B.C.”); the Trans Mountain (Puget Sound) pipeline serving Washington
State; the Trans Mountain Jet Fuel pipeline serving Vancouver International Airport; KMCI, the employer of Canadian staff;
and the Canadian segment of the Cochin pipeline, a 12-inch diameter multi-product pipeline which spans approximately 1,000
kilometers in Saskatchewan and Alberta; and (ii) the Terminals segment which includes the ownership and operation of liquid
product merchant storage and rail terminals in the Edmonton, AB market as well as a predominantly dry cargo import/export
facility in Vancouver, B.C.

7
2. Basis of Presentation
We have prepared the accompanying unaudited interim consolidated financial statements (the “Interim Consolidated
Financial Statements”) in accordance with the accounting principles contained in the Financial Accounting Standards Board's
(“FASB”) Accounting Standards Codification, the single source of United States Generally Accepted Accounting Principles
(“U.S. GAAP”) and referred to in this report as the Codification. U.S. GAAP means generally accepted accounting principles
that the Securities Exchange Commission has identified as having substantial authoritative support, as supplemented by
Regulation S-X under the 1934 Act, as amended from time to time.
In our opinion, all adjustments, which are of a normal and recurring nature, considered necessary for a fair statement
of our financial position and operating results for the interim periods have been included in the accompanying consolidated
financial statements. Interim results are not necessarily indicative of results for a full year; accordingly, you should read these
consolidated financial statements in conjunction with the Company’s audited consolidated financial statements for the years
ended December 31, 2016, 2015 and 2014 available on SEDAR.
In March 2017, the Alberta Securities Commission and Ontario Securities Commission issued a relief order which
permits us to continue to prepare our financial statements in accordance with U.S. GAAP until the earliest of: (i) January 1,
2019; (ii) the first day of the financial year that commences after the Company ceases to have activities subject to rate
regulation; or (iii) the effective date prescribed by the International Accounting Standards Board for the mandatory application
of a standard within International Financial Reporting Standards specific to entities with activities subject to rate regulation.
All significant intercompany balances between the companies included in the accompanying consolidated financial
statements have been eliminated. Management has evaluated subsequent events through October 24, 2017, the date the financial
statements were available to be issued. We evaluate goodwill for impairment on May 31 of each year. There were no
impairment charges resulting from our May 31, 2017 impairment testing, and no event indicating an impairment has occurred
subsequent to that date.
The Reorganization and our Initial Public Offering
On May 30, 2017, we completed an IPO of 102,942,000 restricted voting shares (“Restricted Voting Shares”) on the
Toronto Stock Exchange at a price to the public of $17.00 per Restricted Voting Share for total gross proceeds of approximately
$1.75 billion. We used our IPO proceeds to indirectly acquire from Kinder Morgan an approximate 30% economic interest in
the Limited Partnership, with Kinder Morgan retaining the remaining approximate 70% economic interest.
Concurrent with closing of our IPO, the Limited Partnership acquired an interest in the Operating Entities from Kinder
Morgan Canada Company (“KMCC”) and KM Canada Terminals ULC (“KM Canada Terminals”) in exchange for the issuance
to KMCC and KM Canada Terminals of Class B limited partnership units of the Limited Partnership. In addition, KMCC and
KM Canada Terminals were issued Special Voting Shares in the Company for nominal consideration.
Immediately following closing of our IPO, the Company used the proceeds from our IPO to indirectly subscribe for
Class A limited partnership units representing an approximate 30% economic interest in the Limited Partnership while the
Class B limited partnership units held by KMCC and KM Canada Terminals represent, in the aggregate, an approximate 70%
economic interest in the Limited Partnership’s total Class A units and Class B units. Following the issuance of the Series 1
Preferred Shares, the Company’s and Kinder Morgan’s respective interests in the Limited Partnership is subject to the preferred
shareholders’ priority on distributions and upon liquidation, see Note 4.
Upon completion of our IPO and the reorganization transaction described above, the issued and outstanding Restricted
Voting Shares comprise approximately 30% of the votes attached to all outstanding Company voting shares, and the Kinder
Morgan interest, which represents its indirect ownership of 100% of the Special Voting Shares, comprises approximately 70%
of the votes attached to all outstanding Company voting shares.
8
Subsequent to our IPO, Kinder Morgan retained control of KML and the Limited Partnership, as a result we accounted
for our acquisition of an approximate 30% economic interest in the Limited Partnership as a transfer of net assets among
entities under common control. Therefore, the assets and liabilities in the interim consolidated financial statements have been
reflected at historical carrying value of the immediate parent(s) within the Kinder Morgan organization structure including
goodwill and purchase price assigned amounts, as applicable.
In addition, as of and for the reporting periods after May 30, 2017, Kinder Morgan’s economic interest in the Limited
Partnership is reflected within “Kinder Morgan interest” in our consolidated statements of equity and consolidated balance
sheets and earnings attributable to Kinder Morgan’s economic ownership interest in the Limited Partnership are presented in
“Net Income Attributable to Kinder Morgan Interest” in our consolidated statements of income.
Kinder Morgan retained control of us, therefore, the amounts recorded to “Share capital,” “Retained deficit,”
“Accumulated other comprehensive loss” and “Kinder Morgan interest” presented in the consolidated statements of equity for
the nine months ended September 30, 2017 include (i) the “Reallocation of Kinder Morgan pre-IPO carrying basis” which
represents Kinder Morgan’s pre-IPO 100% ownership interest in us including net income for the period January 1 through May
29, 2017 and (ii) the “Reallocation of equity on common control transaction” which represents the difference between our book
value prior to our IPO and the proportionate ownership percentages in the book value in our net assets after our IPO.
Prior to May 30, 2017, our historical financial statements were presented as combined consolidated financial
statements derived from the consolidated financial statements and accounting records of Kinder Morgan. The reorganization
described above was treated as a common control transaction, therefore, the assets and liabilities for all periods presented herein
reflect the historical carrying value of the immediate parent(s) within the Kinder Morgan organization structure.
Foreign Currency
Amounts are stated in Canadian dollars unless otherwise noted which is the functional currency of most of our
operations. Transactions in foreign currencies are initially recorded at the exchange rate in effect at the time of the transactions.
Monetary assets and liabilities denominated in foreign currencies are translated to Canadian dollars using the closing exchange
rate at the balance sheet date. The resulting exchange rate differences are included in the consolidated statement of operations.
We translate the assets and liabilities of our indirectly owned subsidiary, Trans Mountain Pipeline (Puget Sound) LLC,
which uses U.S. dollars as its functional currency, to Canadian dollars using period-end exchange rates. Income and expense
items are translated at weighted-average rates of exchange prevailing during the year and our equity accounts are translated by
using historical exchange rates. The cumulative translation adjustments balance is included in the “Accumulated other
comprehensive loss” balance on our consolidated balance sheets and would be recognized in earnings upon the sale of those
U.S. operations.
Recent Accounting Pronouncements
Topic 606
On May 28, 2014, the FASB issued ASU No. 2014-09, “Revenue from Contracts with Customers” followed by a series
of related accounting standard updates (collectively referred to as “Topic 606”). Topic 606 is designed to create greater revenue
recognition and disclosure comparability in financial statements. The provisions of Topic 606 include a five-step process by
which an entity will determine revenue recognition, depicting the transfer of goods or services to customers in amounts
reflecting the payment to which an entity expects to be entitled in exchange for those goods or services. Topic 606 requires
certain disclosures about contracts with customers and provides more comprehensive guidance for transactions such as service
revenue, contract modifications, and multiple-element arrangements.
We are in the process of comparing our current revenue recognition policies to the requirements of Topic 606 for each
of our revenue categories. While we have not identified any material differences in the amount and timing of revenue

9
recognition for the categories we have reviewed to date, our evaluation is not complete, and we have not concluded on the
overall impacts of adopting Topic 606. Topic 606 will require that our revenue recognition policy disclosure include further
detail regarding our performance obligations as to the nature, amount, timing, and estimates of revenue and cash flows
generated from our contracts with customers. Topic 606 will also require disclosure of significant changes in contract asset and
contract liability balances period to period and the amount of the transaction price allocated to performance obligations that are
unsatisfied (or partially unsatisfied) as of the end of the reporting period, as applicable. We anticipate utilizing the modified
retrospective method to adopt the provisions of this standard effective January 1, 2018, which requires us to apply the new
revenue standard to (i) all new revenue contracts entered into after January 1, 2018 and (ii) all existing revenue contracts as of
January 1, 2018 through a cumulative adjustment to equity. In accordance with this approach, our consolidated revenues for
periods prior to January 1, 2018 will not be revised.
ASU No. 2015-11
On July 22, 2015, the FASB issued ASU No. 2015-11, “Inventory (Topic 330): Simplifying the Measurement of
Inventory.” This ASU requires entities to subsequently measure inventory at the lower of cost and net realizable value, and
defines net realizable value as the estimated selling price in the ordinary course of business, less reasonably predictable costs of
completion, disposal, and transportation. ASU No. 2015-11 was effective January 1, 2017. We adopted ASU No. 2015-11 with
no material impact to our financial statements.
ASU No. 2016-02
On February 25, 2016, the FASB issued ASU No. 2016-02, “Leases (Topic 842).” This ASU requires that lessees will
be required to recognize assets and liabilities on the balance sheet for the present value of the rights and obligations created by
all leases with terms of more than 12 months. The ASU also will require disclosures designed to give financial statement users
information on the amount, timing, and uncertainty of cash flows arising from leases. ASU 2016-02 will be effective for us as
of January 1, 2019. We are currently reviewing the effect of ASU No. 2016-02.
ASU No. 2016-18
On November 17, 2016, the FASB issued ASU No. 2016-18, “Statement of Cash Flows (Topic 230): Restricted Cash
(a consensus of the FASB Emerging Issues Task Force).” This ASU requires the statement of cash flows to explain the change
during the period in the total of cash, cash equivalents, and amounts generally described as restricted cash or restricted cash
equivalents. Therefore, amounts generally described as restricted cash and restricted cash equivalents are to be included with
cash and cash equivalents when reconciling the beginning of period and end of period amounts shown on the statement of cash
flows. ASU No. 2016-18 will be effective for us as of January 1, 2018. We are currently reviewing the effect of this ASU to our
financial statements.
ASU No. 2017-04
On January 26, 2017, the FASB issued ASU No. 2017-04, “Simplifying the Test for Goodwill Impairment (Topic 350)”
to simplify the accounting for goodwill impairment. The guidance removes Step 2 of the goodwill impairment test, which
requires a hypothetical purchase price allocation. A goodwill impairment will now be the amount by which a reporting unit’s
carrying value exceeds its fair value, not to exceed the carrying amount of goodwill. ASU No. 2017-04 will be effective for us
as of January 1, 2020. We are currently reviewing the effect of this ASU to our financial statements.
ASU No. 2017-07
On March 10, 2017, the FASB issued ASU No. 2017-07, “Compensation - Retirement Benefits (Topic 715).” This ASU
requires an employer to disaggregate the service cost component from the other components of net benefit cost, allows only the
service cost component of net benefit cost to be eligible for capitalization, and specifies how to present the service cost
component and the other components of net benefit cost in the income statement. ASU No. 2017-07 will be effective for us as
of January 1,2018. We are currently reviewing the effect of this ASU to our financial statements.
10
3. Debt
Credit Facility
On June 16, 2017, Kinder Morgan Cochin ULC and Trans Mountain Pipeline ULC, our indirect subsidiaries, entered
into a definitive credit agreement establishing (i) a $4.0 billion revolving construction facility for the purposes of funding the
development, construction and completion of the Trans Mountain Expansion Project (“TMEP”); (ii) a $1.0 billion revolving
contingent credit facility for the purpose of funding, if necessary, additional TMEP costs (and, subject to the need to fund such
additional costs, meeting the National Energy Board-mandated liquidity requirements); and (iii) a $500.0 million revolving
working capital facility, to be used for working capital and other general corporate purposes (collectively, the “Credit Facility”).
The Credit Facility has a five year term and is with a syndicate of financial institutions with Royal Bank of Canada as the
administrative agent. Any undrawn commitments under the Credit Facility incur a standby fee of 0.30% to 0.625%, with the
range dependent on our credit ratings. The Credit Facility is guaranteed by the Company and all of the non-borrower
subsidiaries of the Company and is secured by a first lien security interest on all of the assets of the Company and the equity
and assets of the other guarantors.
Draw downs of funds on the Credit Facility bear interest dependent on type of loans requested and are as follows:
• bankers’ acceptances or London Interbank Offered Rate loans are at an annual rate of approximately the Canadian
Dollar Offered Rate (“CDOR”) or the London Interbank Offered Rate, as the case may be, plus a fixed spread
ranging from 1.50% to 2.50%;
• loans in Canadian dollars or U.S. dollars are at an annual rate of approximately the Canadian prime rate or the
U.S. dollar base rate, as the case may be, plus a fixed spread ranging from 0.50% to 1.50%, in each case, with the
range dependent on the credit ratings of the Company; and
• letters of credit (under working capital facility only) will have issuance fees based on an annual rate of
approximately CDOR plus a fixed spread ranging from 1.50% to 2.50%, with the range dependent on the credit
ratings of the Company.
The foregoing rates and fees will increase by 0.25% on the fourth anniversary of the Credit Facility.
Our Credit Facility includes various financial and other covenants including:
• a maximum ratio of consolidated total funded debt to consolidated capitalization of 70%;
• restrictions on ability to incur debt;
• restrictions on ability to make dispositions, restricted payments and investments;
• restrictions on granting liens and on sale-leaseback transactions;
• restrictions on ability to engage in transactions with affiliates; and
• restrictions on ability to amend organizational documents and engage in corporate reorganization transactions.
As of September 30, 2017, we were in compliance with all required covenants. As of September 30, 2017, we had
$165.0 million outstanding on our construction facility and no outstanding borrowings under our working capital facility. For
the three and nine months ended September 30, 2017, we incurred $3.9 million and $4.6 million, respectively, in standby fees.

11
Fair Value of Financial Instruments
The carrying value and estimated fair value of debt-balances are disclosed below:
September 30, 2017 December 31, 2016
Carrying
value Estimated
fair value Carrying
value Estimated
fair value
(In millions of Canadian dollars)
Total debt(a) 165.0 165.0 1,126.2 1,183.3
_______
(a) September 30, 2017 debt balance is third party and December 31, 2016 debt balance is affiliate, and the December 31, 2016 amounts
exclude $235.9 million non-interest bearing notes payable.
Level 2 input values were used to measure the estimated fair value of the long-term debt-balances as of both
September 30, 2017 and December 31, 2016.
4. Equity
As of September 30, 2017, we had 103.0 million and 242.3 million of Restricted Voting Shares and Special Voting
Shares outstanding, respectively, with no par value for an aggregate of 345.3 million voting shares outstanding, and 12.0
million cumulative redeemable minimum rate reset preferred shares, Series 1 (Series 1 Preferred Shares).
Restricted Voting Shares
Restricted Voting Shares were issued to the public pursuant to the May 30, 2017 IPO. Holders of Restricted Voting
Shares are entitled to one vote for each Restricted Voting Share held at all meetings of shareholders of the Company, except
meetings at which or in respect of matters on which only holders of another class of shares are entitled to vote separately as a
class. Except as otherwise provided by the articles of the Company or required by law, the holders of Restricted Voting Shares
will vote together with the holders of Special Voting Shares as a single class.
The holders of Restricted Voting Shares are entitled to receive, subject to the rights of the holders of another class of
shares, any dividend declared by the Company and the remaining property of the Company on the liquidation, dissolution or
winding up of the Company, whether voluntary or involuntary. Notwithstanding the foregoing, the Company may not issue or
distribute to all or to substantially all of the holders of the Restricted Voting Shares either (i) Restricted Voting Shares, or
(ii) rights or securities of the Company exchangeable for or convertible into or exercisable to acquire Restricted Voting Shares,
unless contemporaneously therewith, the Company issues or distributes Special Voting Shares or rights or securities of the
Company exchangeable for or convertible into or exercisable to acquire Special Voting Shares on substantially similar terms
(having regard to the specific attributes of the Special Voting Shares) and in the same proportion.
On August 15, 2017, we paid a dividend of $0.0571 per Restricted Voting Share to restricted voting shareholders of
record as of the close of business July 31, 2017 for the quarterly period ended June 30, 2017. This initial dividend was prorated
from May 30, 2017, the day we closed on our IPO, to June 30, 2017 and amounted to approximately $5.9 million in total. We
paid approximately $4.3 million of this dividend to restricted voting shareholders in cash and $1.6 million of the remaining
dividend in the form of 94,003 Restricted Voting Shares issued in lieu of cash dividends under the restricted voting
shareholders’ Dividend Reinvestment Plan (DRIP). The DRIP allows holders of Restricted Voting Shares (excluding holders
not resident in Canada) to elect to have any or all cash dividends payable to such shareholder automatically reinvested in
additional Restricted Voting Shares at a price per share calculated by reference to the volume-weighted average of the closing
price of the Restricted Voting Shares on the stock exchange on which the Restricted Voting Shares are then listed for the five
trading days immediately preceding the relevant dividend payment date, less a discount of between 0% and 5% (as determined
from time to time by our board of directors, in its sole discretion). The market discount for the dividend paid on August 15,
2017 was 3%.
12
On October 17, 2017, our board of directors declared a dividend for the quarterly period ended September 30, 2017 of
$0.1625 per Restricted Voting Share ($0.65 annualized), payable on November 15, 2017, to restricted voting shareholders of
record as of the close of business on October 31, 2017.
Series 1 Preferred Share Offering
On August 15, 2017, we completed an offering of 12,000,000 cumulative redeemable minimum rate reset preferred
shares (Series 1 Preferred Shares) on the Toronto Stock Exchange at a price to the public of $25.00 per Series 1 Preferred Share
for total gross proceeds of $300.0 million. The net proceeds of $293.0 million from the offering were used to indirectly
subscribe for preferred units in the Limited Partnership, which in turn were used by the Limited Partnership to repay Credit
Facility indebtedness and for general corporate purposes. We have the option to redeem the Series 1 Preferred Shares on
November 15, 2022 and on November 15 in every fifth year thereafter by payment of $25.00 per Series 1 Preferred Share plus
all accrued and unpaid dividends. The holders of the Series 1 Preferred Shares will have the right to convert all or any of their
Series 1 Preferred Shares into cumulative redeemable floating rate Preferred Shares, Series 2 (Series 2 Preferred Shares),
subject to certain conditions, on November 15, 2022 and on November 15 in every fifth year thereafter. The Series 1 Preferred
Shares and the Series 2 Preferred Shares are series of shares in the same class. The conversion right entitles holders to elect
periodically which of the two series they wish to hold and does not entitle holders to receive a different class or type of security.
In the event of liquidation of the Company, the holders of Series 1 Preferred Shares shall be entitled to receive $25.00
per Series 1 Preferred Share plus all accrued and unpaid dividends thereon before any amount shall be paid or any property or
assets of the Company shall be distributed to the holders of the Restricted Voting Shares, Special Voting Shares and holders of
any other shares ranking junior to the Series 1 Preferred Shares.
Dividends on the Series 1 Preferred Shares are fixed, cumulative, preferential and $1.3125 per share annually, payable
quarterly on the 15th day of February, May, August and November, as and when declared by our board of directors, for the
initial fixed rate period to but excluding November 15, 2022.
On October 17, 2017, our board of directors declared a cash dividend of $0.3308 per share of our Series 1 Preferred
Shares for the period from and including August 15, 2017 through and including November 14, 2017, which is payable on
November 15, 2017 to series 1 preferred shareholders of record as of the close of business on October 31, 2017.
Special Voting Shares (Kinder Morgan Interest)
The Special Voting Shares are held by indirect wholly owned subsidiaries of Kinder Morgan. Holders of Special
Voting Shares are entitled to one vote for each Special Voting Share held at all meetings of shareholders of the Company,
except meetings at which or in respect of matters on which only holders of another class of shares are entitled to vote separately
as a class. The holders of Special Voting Shares are entitled to receive, subject to the rights of the holders of preferred shares
and in priority to the holders of Restricted Voting Shares, an amount per Special Voting Share equal to $0.000001 on the
liquidation, dissolution or winding-up of the Company, whether voluntary or involuntary. The Special Voting Shares are
subject to anti-dilution provisions, which provide that adjustments will be made to the Special Voting Shares in the event of a
change to the Restricted Voting Shares in order to preserve the voting equivalency of such shares.
On August 15, 2017, the Limited Partnership paid a pro rated distribution of $0.0571 per Class B limited partnership
unit to Kinder Morgan for the quarterly period ended June 30, 2017 that amounted to approximately $13.8 million in total.
Approximately $10.4 million of this distribution was paid to Kinder Morgan in cash, and $3.4 million of the remaining
distribution in the form of 202,826 Class B limited partnership units issued under its distribution reinvestment plan. Kinder
Morgan (as the sole holder of the Class B limited partnership units) subject to certain limitations, is entitled to reinvest its
distributions into additional Class B limited partnership units on the same general terms as described above for the restricted
voting shareholders’ distribution reinvestment plan.

13
Earnings per Share
We calculate earnings per share using the two-class method. Earnings were allocated to Restricted Voting Shares and
participating securities based on the amount of dividends paid in the current period plus an allocation of the undistributed
earnings or excess distributions over earnings to the extent that each security participates in earnings or excess distributions
over earnings. Our unvested restricted stock awards, which may be settled in Restricted Voting Shares issued to management
employees from treasury or in cash and include dividend equivalent payments, do not participate in excess distributions over
earnings.
The following table sets forth the allocation of net income available to shareholders of Restricted Voting Shares and
participating securities:
Three Months Ended
September 30, Nine Months
Ended September 30,
2017 2016 2017 2016
(In millions of Canadian dollars)
Restricted Voting Shares 11.6 — 15.8 —
Participating securities:
Restricted stock awards(a) 0.1 — 0.1 —
Net Income Available to Restricted Voting
Stockholders 11.7
—
15.9
—
_______
(a) As of September 30, 2017, there were approximately 0.8 million unvested restricted stock awards.
For the three months ended September 30, 2017 and for the period April 7, 2017 (from the date of our inception) to
September 30, 2017, the weighted average maximum number of potential Restricted Voting Share equivalents, consisting of
unvested restricted stock awards, was 0.6 million and 0.3 million, respectively.
5. Transactions with Related Parties
Affiliate Activities
The following table summarizes related party income statement activity. Revenues, operating costs and capitalized
costs are under normal trade terms.
Three Months Ended
September 30, Nine Months
Ended September 30,
2017 2016 2017 2016
(In millions of Canadian dollars)
Income Statement location
Revenues-Services (a) 14.6 14.6 44.2 44.2
Operations and maintenance and general and
administrative expense 1.2 0.5
2.4
1.2
Interest expense — 10.9 19.6 32.9
Other
Capitalized costs in property, plant and equipment 1.2 7.5 5.2 11.4
________
(a) Amounts represent sales to a customer that is a related party through joint ownership of a joint venture.

14
Accounts receivable and payable
Accounts receivable-affiliate and accounts payable-affiliate are non-interest bearing and are settled on demand.
Long-term debt-affiliates (KMI Loans)
During June, 2017 we repaid the principal on the Long-term debt-affiliates (KMI Loans) utilizing proceeds from our
IPO and the associated notes payable were terminated. As of December 31, 2016, the KMI Loans on the consolidated balance
sheet was $1,362.1 million, of primarily U.S. dollar denominated five-year notes payable with Kinder Morgan subsidiaries.
6. Income Taxes
Income tax expense included in our accompanying consolidated statements of income is as follows:
Three Months Ended
September 30, Nine Months
Ended September 30,
2017 2016 2017 2016
(In millions of Canadian dollars, except percentages)
Income tax expense 14.7 17.7 42.4 46.3
Effective tax rate 25.7 % 46.6 % 27.1 % 20.1 %
The effective tax rate for the three months ended September 30, 2017 was lower than the statutory federal and
provincial rate of 27% primarily due to (i) the U.S. tax on earnings from Trans Mountain Pipeline (Puget Sound) LLC which is
limited to the Company’s ownership interest therein and (ii) the impact of provincial allocation changes from the 2016 return
to provision true-up.
The effective tax rate for the three months ended September 30, 2016 was higher than the statutory federal and
provincial rate of 27% primarily as a consequence of the impact of (i) KMI Loans, which gave rise to foreign exchange
losses (which are considered capital losses that are only 50% tax-effected); (ii) the valuation allowances on capital loss
carryforwards as a result of the above-mentioned capital losses; and (iii) pension adjustments.
The effective tax rate for the nine months ended September 30, 2017 is slightly higher than the statutory federal and
provincial rate of 27% primarily due to (i) the tax impact of pension adjustments and the impact of foreign exchange rate gain
and loss in respect to the KMI Loans (which represented U.S. dollar denominated long-term notes payable to Kinder Morgan)
and (ii) the capital loss carryforwards for which we recorded a full valuation allowance. These increases to the effective tax
rate were offset by (i) the U.S. tax on earnings from Trans Mountain Pipeline (Puget Sound) LLC which are limited to the
Company’s ownership interest therein and (ii) the impact of provincial allocation changes from the 2016 return to provision
true-up.
The effective tax rate for the nine months ended September 30, 2016 was lower than the statutory federal and
provincial rate of 27% primarily due to (i) KMI Loans, which gave rise to foreign exchange gains (which are considered
capital gains that are only 50% tax-effected) and (ii) the release of valuation allowances on capital loss carryforwards utilized
as a result of the above-mentioned capital gains.
As a result of our IPO and subsequent revaluation (or rebalancing) of our investment in the Limited Partnership, our
tax basis exceeds our accounting basis in our investment in the Limited Partnership by approximately $830 million. This excess
tax basis results in a deferred tax asset of approximately $112 million. A full valuation allowance was taken against this
deferred tax asset as we determined it was more likely than not to not be realized.

15
7. Benefit Plans
Components of net benefit cost related to our pension plans and other postretirement benefit (OPEB) plans are as
follows:
Three Months Ended Nine Months Ended
September 30, September 30,
Pension OPEB Pension OPEB
2017 2016 2017 2016 2017 2016 2017 2016
(In millions of Canadian dollars)
Service cost 2.2 1.9 0.2 0.2 6.4 5.6 0.5 0.5
Interest cost 1.9 1.8 0.2 0.2 5.8 5.4 0.5 0.5
Expected return on assets (1.9 ) (1.7 ) — — (5.8 ) (5.1 ) — —
Amortization of prior service costs — — — — 0.1 0.1 — —
Amortization of net actuarial (gains) losses 1.0 0.7 — — 3.1 2.2 0.1 —
Total net benefit cost 3.2 2.7 0.4 0.4 9.6 8.2 1.1 1.0
8. Change in Operating Assets and Liabilities
Nine Months
Ended September 30,
2017 2016
(In millions of Canadian dollars) Cash inflow (outflow)
Accounts receivable-trade (15.1 ) (3.9 )
Accounts receivables-affiliates 27.2 29.9
Prepaid expenses and deposits (10.4 ) (9.4 )
Inventory (0.2 ) (0.4 )
Other current assets 11.5 3.4
Deferred amounts and other assets (15.8 ) (2.3 )
Accounts payable-trade 9.0 (1.7 )
Accounts payable-affiliates (26.5 ) 14.1
Accrued interest (61.5 ) 33.5
Other current liabilities 0.4 (23.0 )
Retirement and postretirement benefits obligation (2.4 ) (2.3 )
Regulatory liabilities and deferred credits (13.3 ) (37.9 )
(97.1 ) —
9. Contingencies and Litigation
Contingencies
We and our subsidiaries are subject to various legal and regulatory actions and proceedings which arise in the normal
course of business. While the final outcome of such actions and proceedings cannot be predicted with certainty, management
believes that the resolution of such actions and proceedings will not have material impact on our financial position or results of
operations.
We and our subsidiaries are also subject to environmental cleanup and enforcement actions from time to time.
Although we believe our operations are in substantial compliance with applicable environmental law and regulations, risks of
additional costs and liabilities are inherent in pipeline and terminal operations, and there can be no assurance that it will not
incur significant costs and liabilities. Moreover, it is possible that other developments, such as increasingly stringent

16
environmental laws, regulations and enforcement policies under the terms of authority of those laws, and claims for damages to
property or persons resulting from our operations, could result in substantial costs and liabilities to us.
Although it is not possible to predict the ultimate outcomes, we believe that the resolution of the environmental
matters to which we and our subsidiaries are a party, will not have a material adverse effect on our business, financial position,
results of operations or cash flows. As of September 30, 2017 and December 31, 2016, we have accrued a total reserve for
environmental liabilities in the amount of $8.1 million and $9.3 million, respectively.
Trans Mountain Expansion Project
Currently, the $7.4 billion Trans Mountain Expansion Project ( the “Project”) will increase throughput capacity of
Trans Mountain from approximately 300,000 to 890,000 barrels per day (‘‘bpd’’). The Project has transportation service
agreements for a total of 707,500 bpd representing approximately 80% of the expanded system’s capacity (with the remaining
capacity available for spot shippers consistent with the requirements of the National Energy Board (“NEB”)).
On May 19, 2016, the NEB recommended that the Governor in Council approve the Project, subject to 157 conditions.
On November 29, 2016, the Governor in Council approved the Project, and directed the NEB to issue, Amending Orders AO-
003-OC-2 and AO-002-OC-49, and Certificate of Public Convenience and Necessity OC-064, authorizing the construction of
the Project. On January 11, 2017, the Government of B.C. announced the issuance of an Environmental Assessment Certificate
(“EAC”) from B.C.’s Environmental Assessment Office to the Trans Mountain Pipeline ULC for the B.C. portion of the
Project. The EAC includes 37 conditions that are in addition to and designed to supplement the 157 conditions required by the
NEB. We have spent a cumulative total, net of contributions in aid of construction, of $778.8 million, which includes
capitalized equity financing costs, on development of the Project as of September 30, 2017 (December 31, 2016— $480.0
million).
Trans Mountain Expansion Project Litigation
There are numerous legal challenges pending before the Federal Court of Appeal which have been filed by various
governmental and non-governmental organizations, Aboriginal groups or other parties that seek judicial review of the
recommendation of the NEB and subsequent decision by the Federal Governor in Council to conditionally approve the Project.
The petitions allege, among other things, that additional consultation, engagement or accommodation is required and that
various non-economic impacts of the Project were not adequately considered. The remedies sought include requests that the
NEB recommendation be quashed, that additional consultations be undertaken, and that the order of the Governor in Council
approving the Project be quashed. After provincial elections in B.C. on May 9, 2017, the New Democratic Party and Green
Party formed a majority government. The new B.C. government sought and was granted limited intervenor status in the
Federal Court of Appeal proceedings to argue against the Federal government’s approval of the Project. A hearing was
conducted by the Federal Court of Appeal from October 2 through October 13, 2017. A decision is expected in the coming
months, and is subject to potential further appeal to the Supreme Court of Canada. Although we believe that each of the
foregoing appeals lacks merit, in the event an applicant is successful at the Supreme Court of Canada, among other potential
impacts, the NEB recommendation or Governor in Council’s approval may be quashed, permits may be revoked, the Project
may be subject to additional significant regulatory reviews, there may be significant changes to the Project plans, further
obligations or restrictions may be implemented, or the Project may be stopped altogether, which could materially impact the
overall feasibility or economic benefits of the Project, which in turn would have a material adverse effect on the Project and,
consequently, KML.
In addition to the judicial reviews of the NEB recommendation report and Governor in Council’s order, two judicial
review proceedings have been commenced at the Supreme Court of B.C. (Squamish First Nation and the City of Vancouver).
The petitions allege a duty and failure to consult or accommodate First Nations, and generally, among other claims, that the
Province ought not to have approved the EAC. Each Applicant seeks to quash the EAC that was issued by the B.C.
Environmental Assessment Office. On September 29, 2017, the B.C. government filed evidence in support of the EAC
approval in the judicial review proceeding involving the Squamish First Nation. Hearings are scheduled for October and

17
November 2017, for the City of Vancouver and the Squamish First Nation judicial review proceedings, respectively. Although
we believe that each of the foregoing appeals lacks merit, in the event that an applicant for judicial review is successful, among
other potential impacts, the EAC may be quashed, provincial permits may be revoked, the Project may be subject to additional
significant regulatory reviews, there may be significant changes to the Project plans, further obligations or restrictions may be
imposed or the Project may be stopped altogether. In the event that an applicant is unsuccessful at the Supreme Court of B.C.,
they may further seek to appeal the decision to the B.C. Court of Appeal. Any decision of the B.C. Court of Appeal may be
appealed to the Supreme Court of Canada. A successful appeal at either of these levels could result in the same types of
consequences described above.
10. Risk Management and Financial Instruments
Credit risk
We are exposed to credit risk, which is the risk that a customer or other counterparty will fail to perform an obligation
or settle a liability, resulting in a financial loss to our business. Our risk is primarily concentrated in the crude oil and refined
products transportation industry and is dependent upon the ability of our customers to pay for these services. A majority of our
customers operate in the oil and gas exploration and development, or energy marketing or transportation industries. We may be
exposed to long-term downturns in energy commodity prices, including the price for crude oil, or other credit events impacting
these industries.
We limit our exposure to credit risk by requiring shippers who fail to maintain specified credit ratings or a suitable
financial position to provide acceptable security, generally in the form of guarantees from credit worthy parties or letters of
credit from well rated financial institutions.
Our cash and cash equivalents are held with major financial institutions, minimizing the risk of non-performance by
counter parties.
Interest Rate Risk
We are exposed to interest rate risk attributed to floating rate debt, which is used to finance capital expansion projects,
including TMEP, and general corporate operations. The changes in interest rates may impact future cash flows and the fair
value of our financial instruments.

18
Foreign Currency Transactions and Translation
Foreign currency transaction gains or losses result from a change in exchange rates between the functional currency of
an entity, and the currency in which a transaction is denominated. Unrealized and realized gains and losses generated from
these transactions are recorded in Foreign exchange (loss) gain in the accompanying consolidated statements of income and
include:
• As of September 30, 2017, we had no notes payable outstanding with Kinder Morgan or any of its subsidiaries,
and as of December 31, 2016, we had $1,362.1 million of notes payable outstanding that are presented as Long-
term debt-affiliates (KMI Loans) in the accompanying balances sheets. These balances were U.S. dollar
denominated loans from Kinder Morgan subsidiaries to us. Foreign exchange rate changes on the long-term debt
with affiliates, and associated interest expense payable balances, resulted in a foreign exchange gain of $0.6
million and a foreign exchange loss of $2.4 million for the three and nine months ended September 30, 2017,
respectively, and a foreign exchange loss of $15.7 million and a gain of $54.2 million for the three and nine
months ended September 30, 2016, respectively. Although the U.S. dollar denominated long-term loans from
Kinder Morgan subsidiaries exposed KML to significant foreign exchange risk, there has historically been no
foreign currency exchange risk on the KMI Loans on a Kinder Morgan consolidated basis. As a result, KML had
not historically entered into any foreign currency derivatives and had not historically been engaged in hedging
activities related to foreign currency exchange risk. Interest expense on the long-term debt with affiliates is
translated at weighted-average rates of exchange prevailing during the year; and
• Additionally, foreign exchange losses and gains for the three and nine months ended September 30, 2017 include
losses of $0.8 million and $2.9 million, respectively, and for the three and nine months ended September 30, 2016
include a loss of $1.3 million, and a gain of $5.1 million, respectively, recognized due to changes in exchange
rates between the Canadian dollar and the U.S. dollar on U.S. dollar denominated balances. These currency
exchange rate fluctuations affect the expected Canadian dollar cash flows on unsettled U.S. dollar denominated
transactions, primarily related to cash bank accounts that are denominated in U.S. dollars and affiliate receivables
or payables that are denominated in U.S. dollars.
We translate the assets and liabilities of Trans Mountain Pipeline (Puget Sound) LLC that has the U.S. dollar as its
functional currency to Canadian dollars at period-end exchange rates. Foreign current translation adjustments are recognized in
other comprehensive income.
Liquidity risk
Liquidity risk is the risk that we will not be able to meet our financial obligations, including commitments, as they
become due. We manage our liquidity risk by ensuring access to sufficient funds to meet our obligations. We forecast cash
requirements to ensure funding is available to settle financial liabilities when they become due. Our primary sources of
liquidity and capital resources are funds generated from operations and our Credit Facility, see Note 3.
Fair value measurements
We do not carry any financial assets or liabilities measured at fair value on a recurring basis, other than the Trans
Mountain Pipeline Reclamation Trust and Cochin Pipeline Reclamation Trust (“Trusts”) that were established in 2015 in the
Province of Alberta to set aside funds collected through pipeline abandonment surcharges over a collection period established
by the NEB. The use of amounts in the Trusts is restricted to pay future abandonment costs. We disclose the fair value of other
financial instruments not measured at fair value. The fair value of financial instruments reflects our best estimate of market
value based on generally accepted valuation techniques or models and are supported by observable market prices and rates.
When such values are not available, we use discounted cash flow analysis from applicable yield curves based on observable
market inputs to estimate fair value.

19
Fair value of financial instruments
Fair value represents the price at which a financial instrument could be exchanged in an orderly market, in an arm’s
length transaction between knowledgeable and willing parties who are under no compulsion to act. We classify the fair value of
the financial instruments according to the following hierarchy based on the observable inputs used to value the instrument:
• Level 1 - inputs to the valuation methodology are quoted prices unadjusted for identical assets or liabilities in
active markets.
• Level 2 - inputs other than quoted prices included in Level 1 that are observable for the asset or liability either
directly (as prices) or indirectly (i.e. derived from prices).
• Level 3 - inputs to the valuation model are not based on observable market data.
Fair value measurements are classified in the fair value hierarchy based on the lowest level input that is significant to
that fair value measurement. This assessment requires judgment considering factors specific to an asset or liability and may
affect placement within the fair value hierarchy. Level 1 and Level 2 are used for the fair value of cash and cash equivalents
and restricted investments, respectively.
Due to the short-term or on demand nature of cash and cash equivalents, restricted cash, accounts receivable, accounts
receivable from affiliates, accounts payable, accounts payable to affiliates and accrued interest, it has been determined that the
carrying amounts for these balances approximate fair value.

1
11. Reportable Segments
The reportable business segments of KML are based on the way management organizes the enterprise. Each of our
reportable business segments represents a component of the enterprise that engages in a separate business activity and for
which discrete financial information is available.
Our reportable business segments are:
• Pipelines - the ownership and operation of (i) Trans Mountain that currently transports
approximately 300,000 bpd of crude oil and refined petroleum from Edmonton, Alberta to
Burnaby, B.C.; (ii) the Trans Mountain (Puget Sound) pipeline serving Washington State;
(iii) the Trans Mountain Jet Fuel pipeline serving Vancouver International Airport; (iv)
KMCI, the employer of Canadian staff; and (v) the Canadian segment of the Cochin
pipeline, a 12-inch diameter multi-product pipeline which spans approximately 1,000
kilometers in Saskatchewan and Alberta; and
• Terminals - which includes the ownership and operation of liquid product merchant storage
and rail terminals in the Edmonton, AB market as well as a predominantly dry cargo
import/export facility in North Vancouver, B.C.
We evaluate the performance of our reportable business segments by evaluating the earnings before depreciation and
amortization of each segment ("Segment EBDA"). We believe that Segment EBDA is a useful measure of the operating
performance of KML because it measures segment operating results before DD&A and certain expenses that are generally not
controllable by the operating managers of our respective business segments, such as general and administrative expense,
foreign exchange losses (or gains) on the KMI Loans, interest expense, and income tax expense. Our general and
administrative expenses include such items as employee benefits, insurance, rentals, and shared corporate services including
accounting, information technology, human resources and legal services. Certain general and administrative costs attributable
to Trans Mountain are billable as flow through items to shippers and result in incremental revenues.
We consider each period’s earnings before all non-cash DD&A expenses to be an important measure of business
segment performance for our reporting segments. We account for intersegment sales at market prices, while it accounts for
asset transfers at either market value or, in some instances, book value. Intercompany transactions are eliminated in
consolidation.
Financial information by segment follows:
Three Months Ended
September 30, Nine Months
Ended September 30,
2017 2016 2017 2016
(In millions of Canadian dollars)
Revenues
Pipelines 95.9 98.6 281.8 287.0
Terminals 71.1 70.9 218.4 214.9
Total consolidated revenues 167.0 169.5 500.2 501.9

2
Three Months Ended
September 30, Nine Months
Ended September 30,
2017 2016 2017 2016
(In millions of Canadian dollars)
Segment EBDA(a)(b)
Pipelines 58.5 58.2 5
6
,
2
7
1
.
0
169.0 184.3
Terminals 52.7 52.0 5
4
,
1
4
9
.
0
159.1 162.6
Total segment EBDA 111.2 110.2 1
1
0
,
4
2
0
.
0
328.1 346.9
DD&A (37.2 ) (34.3 ) — (107.6 ) (102.5 )
Foreign exchange gain (loss) on long-term debt-
affiliates (KMI Loans) 0.6
(15.7 )
1
0
,
1
1
9
.
0
(2.4 ) 54.2
General and administrative expenses (16.2 ) (15.2 ) — (50.5 ) (45.4 )
Interest, net (1.3 ) (7.0 ) (10.9 ) (22.9 )
Income tax expense (14.7 ) (17.7 ) (42.4 ) (46.3 )
Total consolidated net income 42.4 20.3 1
2
0
,
5
3
9
.
0
114.3 184.0
September 30, 2017 December 31, 2016
(In millions of Canadian dollars)
Assets
Pipelines 2,984.7 2,375.1
Terminals 1,372.1 1,364.3
Total consolidated assets 4,356.8 3,739.4
_______
(a) Includes revenues and other (income) expense less operating expenses and other, net. Operating expenses primarily include operations
and maintenance expenses, and taxes, other than income taxes. Segment EBDA for the three months ended September 30, 2017 and
2016 includes (i) $(1.5) million and $(1.4) million, respectively, of unrealized foreign exchange losses due to changes in exchange rates
between the Canadian dollar and the U.S. dollar on U.S. dollar denominated balances and (ii) $7.8 million and $4.6 million, respectively,
of capitalized equity financing costs. Segment EBDA for the nine months ended September 30, 2017 and 2016 includes (i) $(3.3)
million and $5.1 million, respectively, of unrealized foreign exchange (losses) gains due to changes in exchange rates between the
Canadian dollar and the U.S. dollar on U.S. dollar denominated balances and (ii) $19.6 million and $12.8 million, respectively, of
capitalized equity financing costs.
(b) The KMI Loans, which represented U.S. dollar denominated long-term notes payable to Kinder Morgan, were settled with proceeds
from our IPO.