FINANCIAL STATEMENTS - AVBOB - Home Page · 2017-11-15 · integrated annual report 2017 98 avbob...
37
98 INTEGRATED ANNUAL REPORT 2017 AVBOB MUTUAL ASSURANC SOCIETY AND IT’S SUBSIDIARIES FINANCIAL STATEMENTS FOR THE YEAR ENDED 30 JUNE 2017
Transcript of FINANCIAL STATEMENTS - AVBOB - Home Page · 2017-11-15 · integrated annual report 2017 98 avbob...

98INTEGRATED ANNUAL REPORT 2017
AVBOB MUTUAL ASSURANC SOCIETY AND IT’S SUBSIDIARIES
FINANCIAL STATEMENTSFOR THE YEAR ENDED 30 JUNE 2017

99 INTEGRATED ANNUAL REPORT 2017
AVBOB MUTUAL ASSURANCE SOCIETY AND ITS SUBSIDIARIES
SUMMARISED FINANCIAL STATEMENTSFOR THE YEAR ENDED
30 JUNE 2017
COMPANY INFORMATION
Registration number: Incorporated under Private Act No 7 of 1951(as revised March 1987)
Country of incorporation: Republic of South Africa
Registered address: 368 Madiba StreetPretoria0002
Postal address: PO Box 1661Pretoria0001
Internet address: www.avbob.co.za
Auditors: PricewaterhouseCoopers Incorporated
CONTENTS PAGE
Statement of responsibility by the Board of Directors 100
Report of the independent actuary 101 - 104
Independent auditor's report 105
Summarised statements of comprehensive income 106
Summarised statements of financial position 107
Summarised statements of changes in reserves 108
Summarised statements of cash flows 109
Notes to the summarised financial statements 110 - 129

100INTEGRATED ANNUAL REPORT 2017
AVBOB MUTUAL ASSURANCE SOCIETY AND ITS SUBSIDIARIES
STATEMENT OF RESPONSIBILITY BY THE BOARD OF DIRECTORSFOR THE YEAR ENDED 30 JUNE 2017
The audit report of PricewaterhouseCoopers Incorporated is presented on page 105.
______________________________ ______________________________PA DELPORT JF RADEMANCHAIRMAN CHIEF EXECUTIVE OFFICER
The responsibility of the external auditor, PricewaterhouseCoopers Incorporated, is to express an independent opinion onthe fair presentation of the summarised financial statements based on their audit of AVBOB Mutual Assurance Societyand its subsidiaries.
The directors of the Society are responsible for the preparation, integrity and fair presentation of the summarised financialstatements of AVBOB Mutual Assurance Society and its subsidiaries. The summarised financial statements aspresented on pages 106 to 129 have been prepared in accordance with the framework concepts and the measurementand recognition requirements of International Financial Reporting Standards (IFRS), IAS 34 Interim financial statementsand the requirements of the Companies Act 71 of 2008 of South Africa as applicable to summary financial statements.
The directors are responsible for and the Group Audit Committee has confirmed that effective systems of internal controland risk management are being maintained. There were no material breakdowns in the functioning of the internalfinancial control systems during the year. The Board is satisfied that the financial statements fairly present the financialposition, the results of operations and cash flows in accordance with the framework concepts and the measurement andrecognition requirements of IFRS, IAS 34 Interim financial statements and the requirements of the Companies Act 71 of2008 of South Africa as applicable to summary financial statements and that they are supported by reasonable andprudent judgements that are consistently applied.
The directors have also prepared all other information included in the annual report and are responsible for both itsaccuracy and consistency with the financial statements.
The going concern basis has been adopted in preparing the financial statements. Based on forecasts and available cashresources the directors have no reason to believe that the Society or any company within the Group will not comply withthe going concern principle in the foreseeable future. These financial statements support the viability of the Society andthe Group.
The summarised financial statements have been audited by the independent auditor, PricewaterhouseCoopersIncorporated, who were given unrestricted access to all financial records and related data, including minutes of allmeetings of policyholders, the Board of Directors and Committees of the Board. The directors believe that allrepresentations made to the independent auditors during their audit are valid and appropriate.
The summarised financial statements were approved by the Board of Directors on 21 September 2017 and are signed onits behalf by:

101 INTEGRATED ANNUAL REPORT 2017
REPORT OF THE INDEPENDENT ACTUARYFOR THE YEAR ENDED 30 JUNE 2017
Notes 2017 2016R 000 R 000
STATEMENT OF EXCESS ASSETS, LIABILITIES AND CAPITALADEQUACY REQUIREMENTS
Published Reporting Basis
Net assets as per statement of financial position 3 13 845 964 12 748 869
Policyholder liabilities 4 7 665 048 6 970 017
Excess of assets over liabilities 6 180 916 5 778 852
Statutory Basis
Net assets 3 13 674 530 12 659 161
Policyholder liabilities 4 7 651 612 6 958 230
Excess of assets over liabilities 6 022 918 5 700 931
Capital adequacy requirement 5 1 265 453 1 229 308
Ratio of excess assets to capital adequacy requirement 4.8 times 4.6 times
CERTIFICATION OF STATUTORY FINANCIAL POSITION
I hereby certify that:
•
•
•
•
C VAN DER RIET - FASSASTATUTORY ACTUARY
The valuation on the statutory basis of Avbob Mutual Assurance Society as at 30 June 2017, the results of which aresummarised above, has been conducted in accordance with, and this Statutory Actuary’s report has been produced inaccordance with, applicable Actuarial Society of South Africa Standards of Actuarial Practice and Actuarial PracticeNotes;
In my opinion the Society is financially sound at the valuation date and is expected to remain so for the foreseeablefuture, where financial soundness includes meeting the asset spreading requirements as prescribed by the Long-termInsurance Act.
Assets exceeded liabilities plus the Capital Adequacy Requirements at the valuation date;
The Society met the asset spreading requirements of the Long-term Insurance Act at the valuation date; and
21 September 2017

102INTEGRATED ANNUAL REPORT 2017
NOTES TO THE REPORT OF THE INDEPENDENT ACTUARYFOR THE YEAR ENDED 30 JUNE 2017
2017 2016R 000 R 000
1. RECONCILIATION OF STATUTORY BASIS TO PUBLISHED REPORTING BASIS
Excess of assets over liabilities - Published Reporting Basis 6 180 916 5 778 852 Excess of assets over liabilities - Statutory Basis 6 022 918 5 700 931
Difference 157 998 77 921
2. ANALYSIS OF CHANGE IN EXCESS ASSETS (PUBLISHED REPORTING BASIS)
Excess assets as at the end of the year 6 180 916 5 778 852 Excess assets as at the beginning of the year 5 778 852 5 271 404
Change in excess assets during the year 402 064 507 448
This change in the excess assets is due to the following:
Investment return on excess assets 151 325 465 288
Investment income 175 165 191 095 Capital (depreciation)/appreciation ( 23 840) 274 193
Tax on surplus investment return ( 25 491) ( 104 303) Change in valuation assumptions 151 229 702 547 Profit on new business ( 151 408) ( 118 166) Balance of profit/(losses) 276 409 ( 437 918)
Total change in excess assets 402 064 507 448
The main valuation assumptions were amended as follows:
•
•
•
•
•
•
3. PUBLISHED REPORTING ASSET VALUATION METHODS AND ASSUMPTIONS
Changes in the future economic assumptions increased the policy liabilities by R121,4 million. This includes achange in the inflation gap from 3.00% to 2.75%.
An increase in expenses above inflation increased the policy liabilities by R37,0 million.
Changes in the assumed mortality rates decreased the policy liabilities by R483,1 million.
An increase in policy benefit costs decreased the policy liabilities by R2,5 million.
An increase in the elimination of negative reserves increased the policy liabilities by R16,7 million.
An increase in the lapse rate increased the policy liabilities by R16,1 million.
The assets are valued at statement of financial position values, ie at market or directors’ values as described in theaccounting policies.
The differences are due to assets deemed to be inadmissible for statutory reportingpurposes.
The excess of assets over liabilities on the published reporting basis has changed asfollows over the year:
103 INTEGRATED ANNUAL REPORT 2017
NOTES TO THE REPORT OF THE INDEPENDENT ACTUARYFOR THE YEAR ENDED 30 JUNE 2017
(continued)
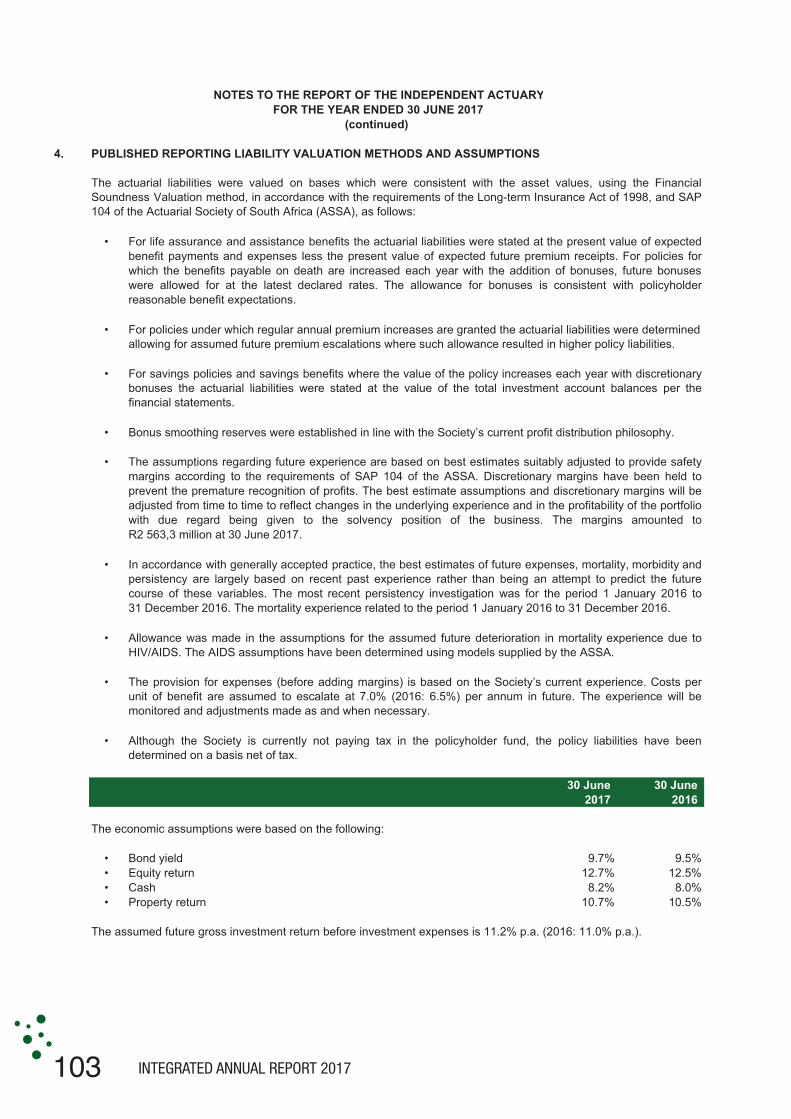
4. PUBLISHED REPORTING LIABILITY VALUATION METHODS AND ASSUMPTIONS
•
•
•
•
•
•
•
•
•
30 June 30 June2017 2016
The economic assumptions were based on the following:
• Bond yield 9.7% 9.5%• Equity return 12.7% 12.5%• Cash 8.2% 8.0%• Property return 10.7% 10.5%
The assumed future gross investment return before investment expenses is 11.2% p.a. (2016: 11.0% p.a.).
The provision for expenses (before adding margins) is based on the Society’s current experience. Costs perunit of benefit are assumed to escalate at 7.0% (2016: 6.5%) per annum in future. The experience will bemonitored and adjustments made as and when necessary.
Allowance was made in the assumptions for the assumed future deterioration in mortality experience due toHIV/AIDS. The AIDS assumptions have been determined using models supplied by the ASSA.
Although the Society is currently not paying tax in the policyholder fund, the policy liabilities have beendetermined on a basis net of tax.
In accordance with generally accepted practice, the best estimates of future expenses, mortality, morbidity andpersistency are largely based on recent past experience rather than being an attempt to predict the futurecourse of these variables. The most recent persistency investigation was for the period 1 January 2016 to31 December 2016. The mortality experience related to the period 1 January 2016 to 31 December 2016.
For policies under which regular annual premium increases are granted the actuarial liabilities were determined allowing for assumed future premium escalations where such allowance resulted in higher policy liabilities.
The actuarial liabilities were valued on bases which were consistent with the asset values, using the FinancialSoundness Valuation method, in accordance with the requirements of the Long-term Insurance Act of 1998, and SAP104 of the Actuarial Society of South Africa (ASSA), as follows:
The assumptions regarding future experience are based on best estimates suitably adjusted to provide safetymargins according to the requirements of SAP 104 of the ASSA. Discretionary margins have been held toprevent the premature recognition of profits. The best estimate assumptions and discretionary margins will beadjusted from time to time to reflect changes in the underlying experience and in the profitability of the portfoliowith due regard being given to the solvency position of the business. The margins amounted toR2 563,3 million at 30 June 2017.
For life assurance and assistance benefits the actuarial liabilities were stated at the present value of expectedbenefit payments and expenses less the present value of expected future premium receipts. For policies forwhich the benefits payable on death are increased each year with the addition of bonuses, future bonuseswere allowed for at the latest declared rates. The allowance for bonuses is consistent with policyholderreasonable benefit expectations.
For savings policies and savings benefits where the value of the policy increases each year with discretionarybonuses the actuarial liabilities were stated at the value of the total investment account balances per thefinancial statements.
Bonus smoothing reserves were established in line with the Society’s current profit distribution philosophy.

104INTEGRATED ANNUAL REPORT 2017
NOTES TO THE REPORT OF THE INDEPENDENT ACTUARYFOR THE YEAR ENDED 30 JUNE 2017
(continued)
5. STATUTORY CAPITAL ADEQUACY REQUIREMENTS
Credit risk has been allowed for this year as well as operational risk at one times the updated standard formula.
6. ALTERATIONS, NOTES AND QUALIFICATIONS
The actuarial assumptions will be reviewed from time to time to reflect changes in experience and/or expectations.
The off-setting management actions assumed above have been approved by specific resolution by the Board ofDirectors, and I am satisfied that these actions would be taken if the corresponding risks were to materialise.
When calculating the OCAR, allowance may be made for the impact of authorised management action. Themanagement action assumed in the Society is that after a material fall in asset values, the Society will remove 50% ofdeclared non-vesting claim bonuses and will suspend future bonus declarations for a period of three years or willreduce future bonus declarations. This assumed action reduces the OCAR by R1 206,6 million.
In deriving the investment resilience requirement in the ordinary capital adequacy requirement (OCAR) it wasassumed that a decline of 30% in equity asset values, 15% in property values, and a 30% increase in fixed interestasset values (as a result of a 25% reduction in fixed-interest yields) will occur, in accordance with SAP 104.
The statutory capital adequacy requirement is calculated to determine whether the excess of assets over liabilities issufficient to provide for the possibility of a significant negative departure of actual future experience from theassumptions made in calculating actuarial liabilities and for significant fluctuations in the value of assets. The capitaladequacy requirement has been calculated in accordance with SAP 104. At the previous year end the TerminationCapital Adequacy Requirement applied. This year the Termination Capital Adequacy Requirement again applies.The excess of the assets over the liabilities is 4.8 times (2016: 4.6 times) the capital adequacy requirement.
The Capital Adequacy Requirement is assumed to be backed by a combination of equity, property, bonds and cashinvestments.

105 INTEGRATED ANNUAL REPORT 2017
PricewaterhouseCoopers Inc., 2 Eglin Road, Sunninghill 2157, Private Bag X36, Sunninghill 2157, South AfricaT: +27 (0) 11 797 4000, F: +27 (0) 11 797 5800, www.pwc.co.za
Chief Executive Officer: T D ShangoManagement Committee: S N Madikane, J S Masondo, P J Mothibe, C Richardson, F Tonelli, C VolschenkThe Company's principal place of business is at 2 Eglin Road, Sunninghill where a list of directors' names is available for inspection.Reg. no. 1998/012055/21, VAT reg.no. 4950174682
Independent auditor’s report on the summary consolidated andseparate financial statements
To the Members of AVBOB Mutual Assurance Society and its subsidiaries
Opinion
The summary consolidated and separate financial statements of AVBOB Mutual Assurance Societyand its subsidiaries, set out on pages 106 to 129 which comprise the summarised Group and Societystatements of financial position as at 30 June 2017, the summarised Group and Society statements ofcomprehensive income, changes in reserves and cash flows for the year then ended, and related notes,are derived from the audited consolidated and separate financial statements of AVBOBMutualAssurance Society and its subsidiaries for the year ended 30 June 2017.
In our opinion, the accompanying summary consolidated and separate financial statements areconsistent, in all material respects, with the audited consolidated and separate financial statements, inaccordance with note 2 and the requirements of the Companies Act of South Africa as applicable tosummary financial statements.
Summary Consolidated and Separate Financial Statements
The summary consolidated and separate financial statements do not contain all the disclosuresrequired by International Financial Reporting Standards and the requirements of the Companies Actof South Africa as applicable to annual financial statements. Reading the summary consolidated andseparate financial statements and the auditor’s report thereon, therefore, is not a substitute forreading the audited consolidated and separate financial statements and the auditor’s report thereon.
The Audited Consolidated and Separate Financial Statements and Our Report Thereon
We expressed an unmodified audit opinion on the audited consolidated and separate financialstatements in our report dated 21 September 2017.
Director’s Responsibility for the Summary Consolidated and Separate FinancialStatements
The directors are responsible for the preparation of the summary consolidated and separate financialstatements in accordance with note 2 and the requirements of the Companies Act of South Africa asapplicable to summary financial statements.
Auditor’s Responsibility
Our responsibility is to express an opinion on whether the summary consolidated and separatefinancial statements are consistent, in all material respects, with the audited consolidated andseparate financial statements based on our procedures, which were conducted in accordance withInternational Standard on Auditing (ISA) 810 (Revised), Engagements to Report on SummaryFinancial Statements.
PricewaterhouseCoopers Inc.Director: F.J. KrugerRegistered AuditorSunninghill21 September 2017

106INTEGRATED ANNUAL REPORT 2017
AVBOB MUTUAL ASSURANCE SOCIETY AND ITS SUBSIDIARIES
SUMMARISED STATEMENTS OF COMPREHENSIVE INCOMEFOR THE YEAR ENDED 30 JUNE 2017
SOCIETY GROUP
Notes 2017 2016 2017 2016R 000 R 000 R 000 R 000
Services - - 372 648 326 867Goods - - 99 938 105 419
Total revenue - - 472 586 432 286
Cost of sales 8 - - ( 420 049) ( 382 961)
Gross profit - - 52 537 49 325
Premium revenue 6 3 130 301 2 698 116 3 130 301 2 698 116
Investment income 53 738 63 018 6 438 1 891
Net fair value gains on assets at fair value through profit or loss 466 181 859 127 466 181 859 127
Other income 13 311 536 15 092 5 324
Net income 3 663 531 3 620 797 3 670 549 3 613 783
Contract benefits and claims 7 (1 158 064) ( 926 633) (1 019 526) ( 816 994)
Expenses for the acquisition of insurance contracts ( 592 662) ( 522 412) ( 592 662) ( 522 412)
Marketing expenses 8 ( 294 898) ( 256 783) ( 321 996) ( 280 655)
Operating and administration expenses 8 ( 483 827) ( 409 906) ( 577 181) ( 491 020)
Expenses for asset management servicesrendered ( 63 511) ( 57 040) ( 63 511) ( 57 040)
Transfer to policyholder liabilities ( 690 253) ( 780 747) ( 687 200) ( 771 300)
Profit before income tax 380 316 667 276 408 473 674 362
Income tax expense 21 761 ( 160 303) 5 226 ( 171 738)
PROFIT AFTER TAX 402 077 506 973 413 699 502 624
Other comprehensive income/(loss)Items that will not be reclassified to profit or loss
Gains on revaluation of land and buildings 2 841 9 251 5 895 18 698Realisation of depreciation ( 1 993) ( 1 534) ( 1 213) ( 2 905)Net change in liabilities for insurance contracts arising
from unrealised gains on owner-occupied properties ( 848) ( 7 717) ( 4 682) ( 15 793)Remeasurement of the net defined employee benefits ( 13) 475 ( 766) 28
TOTAL COMPREHENSIVE INCOME FOR THE YEAR 402 064 507 448 412 933 502 652
Attributable to:Majority stakeholders of the Group 402 064 507 448 412 739 501 993Non-controlling interests - - 194 659
TOTAL COMPREHENSIVE INCOME FOR THE YEAR 402 064 507 448 412 933 502 652
107 INTEGRATED ANNUAL REPORT 2017
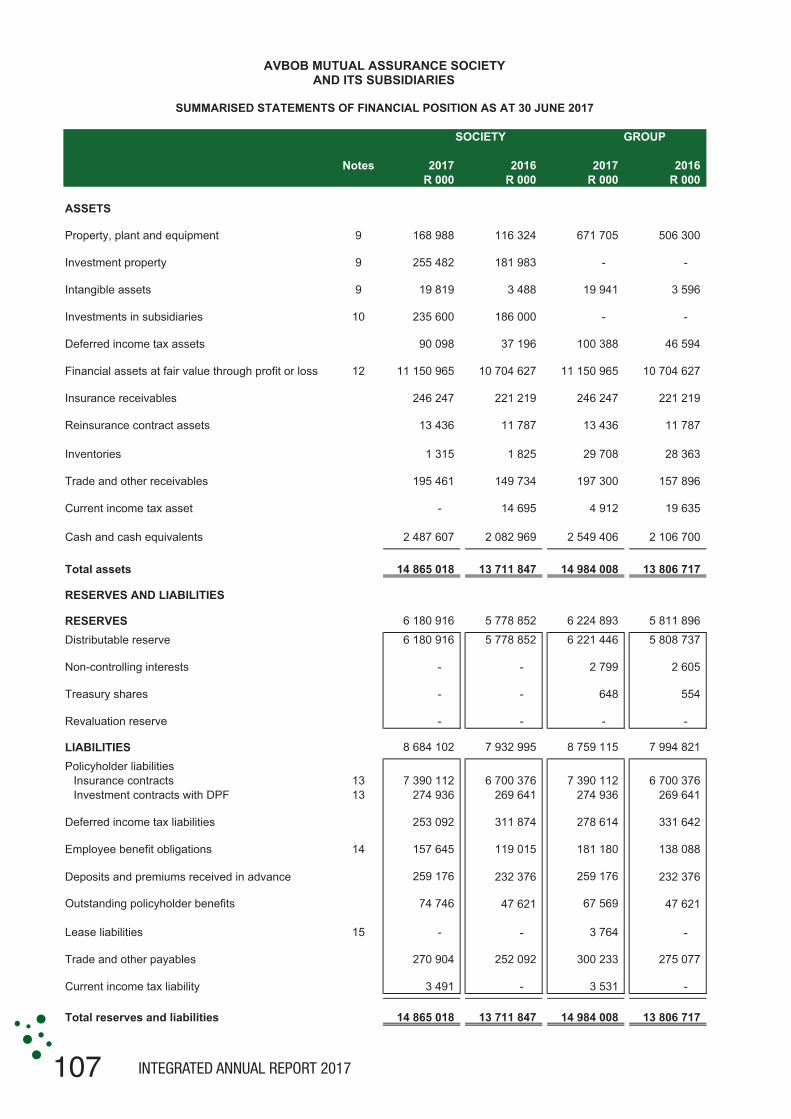
AVBOB MUTUAL ASSURANCE SOCIETY AND ITS SUBSIDIARIES
SUMMARISED STATEMENTS OF FINANCIAL POSITION AS AT 30 JUNE 2017
SOCIETY GROUP
Notes 2017 2016 2017 2016R 000 R 000 R 000 R 000
ASSETS
Property, plant and equipment 9 168 988 116 324 671 705 506 300
Investment property 9 255 482 181 983 - -
Intangible assets 9 19 819 3 488 19 941 3 596
Investments in subsidiaries 10 235 600 186 000 - -
Deferred income tax assets 90 098 37 196 100 388 46 594
Financial assets at fair value through profit or loss 12 11 150 965 10 704 627 11 150 965 10 704 627
Insurance receivables 246 247 221 219 246 247 221 219
Reinsurance contract assets 13 436 11 787 13 436 11 787
Inventories 1 315 1 825 29 708 28 363
Trade and other receivables 195 461 149 734 197 300 157 896
Current income tax asset - 14 695 4 912 19 635
Cash and cash equivalents 2 487 607 2 082 969 2 549 406 2 106 700
Total assets 14 865 018 13 711 847 14 984 008 13 806 7170 ( 0) 0
RESERVES AND LIABILITIES
RESERVES 6 180 916 5 778 852 6 224 893 5 811 896
Distributable reserve 6 180 916 5 778 852 6 221 446 5 808 737
Non-controlling interests - - 2 799 2 605
Treasury shares - - 648 554
Revaluation reserve - - - -
LIABILITIES 8 684 102 7 932 995 8 759 115 7 994 821
Policyholder liabilitiesInsurance contracts 13 7 390 112 6 700 376 7 390 112 6 700 376Investment contracts with DPF 13 274 936 269 641 274 936 269 641
Deferred income tax liabilities 253 092 311 874 278 614 331 642
Employee benefit obligations 14 157 645 119 015 181 180 138 088
Deposits and premiums received in advance 259 176 232 376 259 176 232 376
Outstanding policyholder benefits 74 746 47 621 67 569 47 621
Lease liabilities 15 - - 3 764 -
Trade and other payables 270 904 252 092 300 233 275 077
Current income tax liability 3 491 - 3 531 -
Total reserves and liabilities 14 865 018 13 711 847 14 984 008 13 806 717
108INTEGRATED ANNUAL REPORT 2017
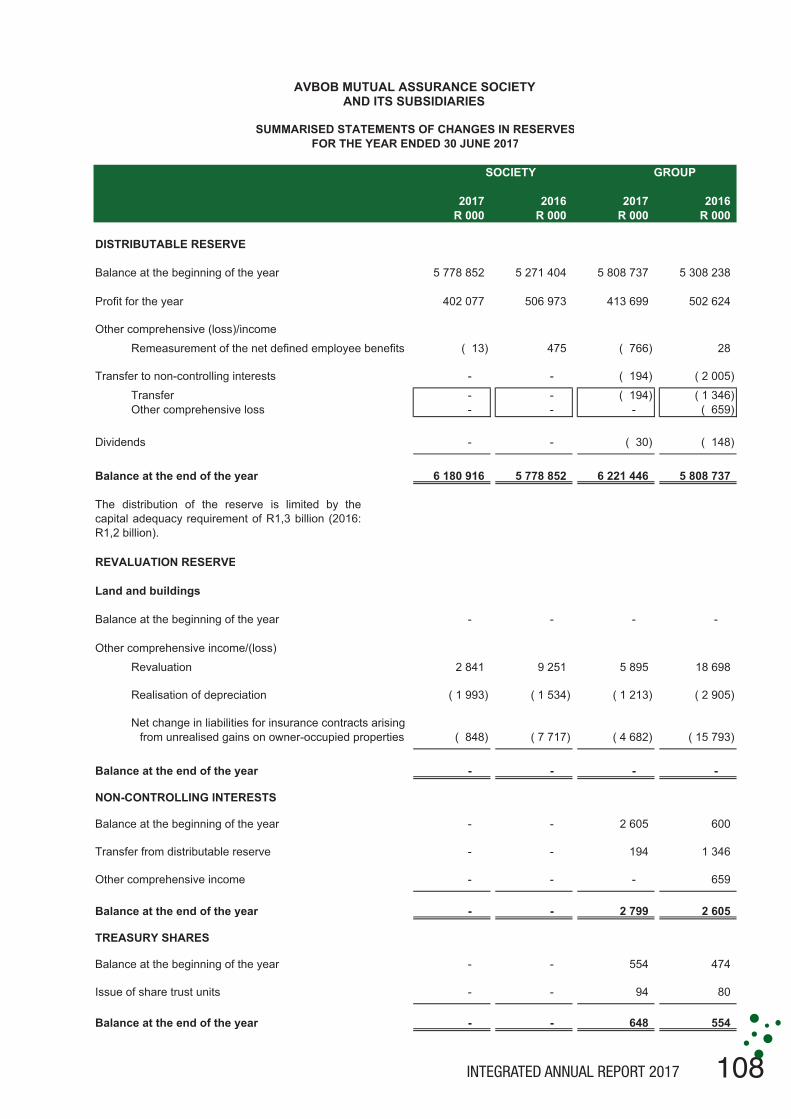
AVBOB MUTUAL ASSURANCE SOCIETY AND ITS SUBSIDIARIES
SUMMARISED STATEMENTS OF CHANGES IN RESERVESFOR THE YEAR ENDED 30 JUNE 2017
SOCIETY GROUP
2017 2016 2017 2016R 000 R 000 R 000 R 000
DISTRIBUTABLE RESERVE
Balance at the beginning of the year 5 778 852 5 271 404 5 808 737 5 308 238
Profit for the year 402 077 506 973 413 699 502 624
Other comprehensive (loss)/income
Remeasurement of the net defined employee benefits ( 13) 475 ( 766) 28
Transfer to non-controlling interests - - ( 194) ( 2 005)
Transfer - - ( 194) ( 1 346)Other comprehensive loss - - - ( 659)
Dividends - - ( 30) ( 148)
Balance at the end of the year 6 180 916 5 778 852 6 221 446 5 808 737
REVALUATION RESERVE
Land and buildings
Balance at the beginning of the year - - - -
Other comprehensive income/(loss)
Revaluation 2 841 9 251 5 895 18 698
Realisation of depreciation ( 1 993) ( 1 534) ( 1 213) ( 2 905)
Net change in liabilities for insurance contracts arisingfrom unrealised gains on owner-occupied properties ( 848) ( 7 717) ( 4 682) ( 15 793)
Balance at the end of the year - - - -
NON-CONTROLLING INTERESTS
Balance at the beginning of the year - - 2 605 600
Transfer from distributable reserve - - 194 1 346
Other comprehensive income - - - 659
Balance at the end of the year - - 2 799 2 605
TREASURY SHARES
Balance at the beginning of the year - - 554 474
Issue of share trust units - - 94 80
Balance at the end of the year - - 648 554
The distribution of the reserve is limited by thecapital adequacy requirement of R1,3 billion (2016:R1,2 billion).

109 INTEGRATED ANNUAL REPORT 2017
AVBOB MUTUAL ASSURANCE SOCIETY AND ITS SUBSIDIARIES
SUMMARISED STATEMENTS OF CASH FLOWSFOR THE YEAR ENDED 30 JUNE 2017
SOCIETY GROUP
Notes 2017 2016 2017 2016R 000 R 000 R 000 R 000
Cash inflows/(outflows) from operating activities 594 283 ( 38 255) 666 971 15 755Cash generated by operating activities 981 114 936 987 1 063 208 999 162
Interest received 17 236 14 256 19 465 14 617
Dividends paid - - ( 30) ( 148)
Dividends received 222 614 190 450 222 614 190 450
Movement in financial assets at fair valuethrough profit or loss
Additions 12 (5 582 664) (4 490 149) (5 582 664) (4 490 149)Disposals 12 5 027 720 3 413 169 5 027 720 3 413 169
Tax paid ( 71 737) ( 102 968) ( 83 342) ( 111 346)
Cash outflows from investment activities ( 189 645) ( 82 593) ( 228 029) ( 128 402)Loans to subsidiaries ( 4 138) ( 4 847) - -
Acquisition of property, plant and equipment 9 ( 73 534) ( 18 010) ( 212 536) ( 129 814)
Acquisition of investment property 9 ( 73 375) ( 57 230) - -
Acquisition of intangible assets 9 ( 21 376) ( 3 909) ( 21 508) ( 3 908)
Investment in subsidiaries ( 19 800) - - -
Treasury shares issued - - 94 80
Proceeds on disposal of investment property 256 1 147 - -
Proceeds on disposal of property, plantand equipment 2 322 256 5 921 5 240
Cash inflows from financing activities - - 3 764 -Increase in lease liabilities - - 3 764 -
404 638 ( 120 848) 442 706 ( 112 647)
2 082 969 2 203 817 2 106 700 2 219 347#REF! #REF! #REF! #REF!2 487 607 2 082 969 2 549 406 2 106 7002 487 607 2 082 969 2 549 406 2 106 700
( 0) -
Cash and cash equivalents at the beginning of the
year
yearCash and cash equivalents at the end of the
Net increase/(decrease) in cash and cash equivalents
110INTEGRATED ANNUAL REPORT 2017
AVBOB MUTUAL ASSURANCE SOCIETY AND ITS SUBSIDIARIES
NOTES TO THE SUMMARISED FINANCIAL STATEMENTSFOR THE YEAR ENDED 30 JUNE 2017
1. General information
2. Basis of preparation
3. Accounting policies
4. Critical accounting estimates and judgements
4.1 Policyholder liabilities
4.2 Other assumptions and estimates
- Provision for deaths not yet reported - Valuation of investment property- Valuation of subsidiaries- Employee benefit obligations- Assets at fair value through profit and loss with unobservable inputs- Deferred tax asset.
There are a number of amendments, interpretations and improvements to standards that are mandatory for the Groupin 2017. The adoption of these standards have resulted in some additional disclosure contained in the annual financialstatements for the year.
The Group has not early adopted any of the standards or interpretations applicable to the Group's 2018 financialreporting period or later financial periods. The application of these standards and interpretations to the 2018 financialreporting period is not expected to have a significant impact except for IFRS 9,15,16 and 17 where the Group isevaluating the impact on the Group's reported results, financial position and cash flows.
The value of the policyholder liabilities is based on estimates that are in turn based on assumptions. Theassumptions represent best estimates of the expected future experience and are based on actual experienceand reasonable expectations of what may happen in future. The future experience will probably differ fromthese assumptions, which may in turn require the value of policyholder liabilities to be adjusted. The full detailsof these valuation assumptions for estimates are set out in note 13 of the notes to the summarised financialstatements for the year ended 30 June 2017.
The Group makes estimates and assumptions in respect of assets and liabilities. Estimates and assumptions are re-evaluated on an on-going basis, based on historic experience and other factors, including expectations with regard tofuture events that are deemed reasonable under the circumstances. Actual results may differ from these estimates.
Other assumptions and estimates included in the annual financial statements for the year ended 30 June 2017addressed the following items:
The Group has applied the provisions of the Companies Act no 71 of 2008, which allows for summarised financialresults as disclosed in this report.
The summarised financial statements should be read in conjunction with the annual financial statements for the yearended 30 June 2017, which have been prepared in accordance with the framework concepts and the measurementand recognition requirements of International Financial Reporting Standards (IFRS), IAS 34 Interim financialstatements and the requirements of the Companies Act of South Africa as applicable to summary financial statements.
The Society is a funeral assurance provider and the subsidiaries manufacture, distribute and sell funeralware andconduct funerals. The Group has a manufacturing plant in Bloemfontein and conducts business in South Africa andNamibia.
These summarised financial statements have been audited.
The accounting policies adopted are consistent with those of the previous financial year.
The complete accounting policies are not disclosed in the summarised financial statements and should be read inconjunction with the annual financial statements for the year ended 30 June 2017.
111 INTEGRATED ANNUAL REPORT 2017
AVBOB MUTUAL ASSURANCE SOCIETY AND ITS SUBSIDIARIES
NOTES TO THE SUMMARISED FINANCIAL STATEMENTSFOR THE YEAR ENDED 30 JUNE 2017
5. Management of insurance and financial risk
5.1 Insurance and financial risk
5.2 Capital management
#REF!
The Society and the Group are exposed to financial risk through their financial assets, financial liabilities,reinsurance contracts and insurance liabilities. In essence, the financial risk is the possibility that adversechanges in the market will result in the Society not being able to meet its obligations. The most importantelements of financial risk include market risk (equity risk, interest rate risk and currency risk), credit andcounterparty risk and liquidity risk.
The Society manages financial assets within an asset distribution analysis that was developed to maximise long-term investment yield, while taking into consideration the nature of its liabilities. The Society outsources themanagement of its investments to five leading asset managers. With effect from 1 July 2017 a sixth assetmanager has been appointed. These asset managers are expected to manage their portfolio in accordance withagreed-upon mandates. In addition, total asset distribution of the Society is managed in accordance with theguidelines set by the Financial Services Board.
Asset-liability modelling investigations are performed periodically by the Statutory Actuary. The outcome is usedto determine whether the asset distribution guidelines unduly expose the Society to insolvency risk based onthe nature of the liabilities (guaranteed and discretionary liabilities). The last exercise was performed during the2016 financial year.
The summarised financial statements do not include all financial risk management information and disclosuresrequired in the annual financial statements and should be read in conjunction with the annual financialstatements for the year ended 30 June 2017.
The Group’s objectives when managing capital is to safeguard the Society’s ability to continue as a goingconcern to provide policyholder benefits. The Society ensures that regulatory capital requirements are met atall times and that it is capitalised in line with the Society's risk appetite.
The Group manages capital using the capital adequacy requirement ratio (statutory capital) and by ensuringthat sufficient liquid assets are available if required and that the available investments are of a suitable quality.
The capital adequacy requirement is the minimum amount by which the value of assets must exceed the valueof the policyholder liabilities as required by the Regulator. As a mutual society, the Society does not haveaccess to capital markets and consequently targets to keep excess assets as a multiple of the capital adequacyrequirement. If the ratio decreases, following for instance a market value shock or other catastrophe, the Boardof Directors has approved planned management actions which allow the Society to remove non-vesting andspecial bonuses.
The Society's capital adequacy ratio is 4.8 times the minimum requirements for the 2017 and 4.6 for the 2016financial years. The Society did not experience an event which negatively impacted its capital adequacy ratio tosuch an extent that the planned management actions had to be invoked.
The Group issues contracts that contain either insurance or financial risks, or both. Insurance risk is the riskthat claims and expenses exceed the value placed on insurance liabilities. The Group’s activities expose it to avariety of financial risks: market risk (including equity risk, currency risk and interest rate risk), credit andcounterparty risk, liquidity risk and contractual risk.
(continued)
112INTEGRATED ANNUAL REPORT 2017
AVBOB MUTUAL ASSURANCE SOCIETY AND ITS SUBSIDIARIES
NOTES TO THE SUMMARISED FINANCIAL STATEMENTSFOR THE YEAR ENDED 30 JUNE 2017
(continued)
5. Management of insurance and financial risk (continued)
5.2 Capital management (continued)
Core aspects of the mandate given to the asset managers:
•
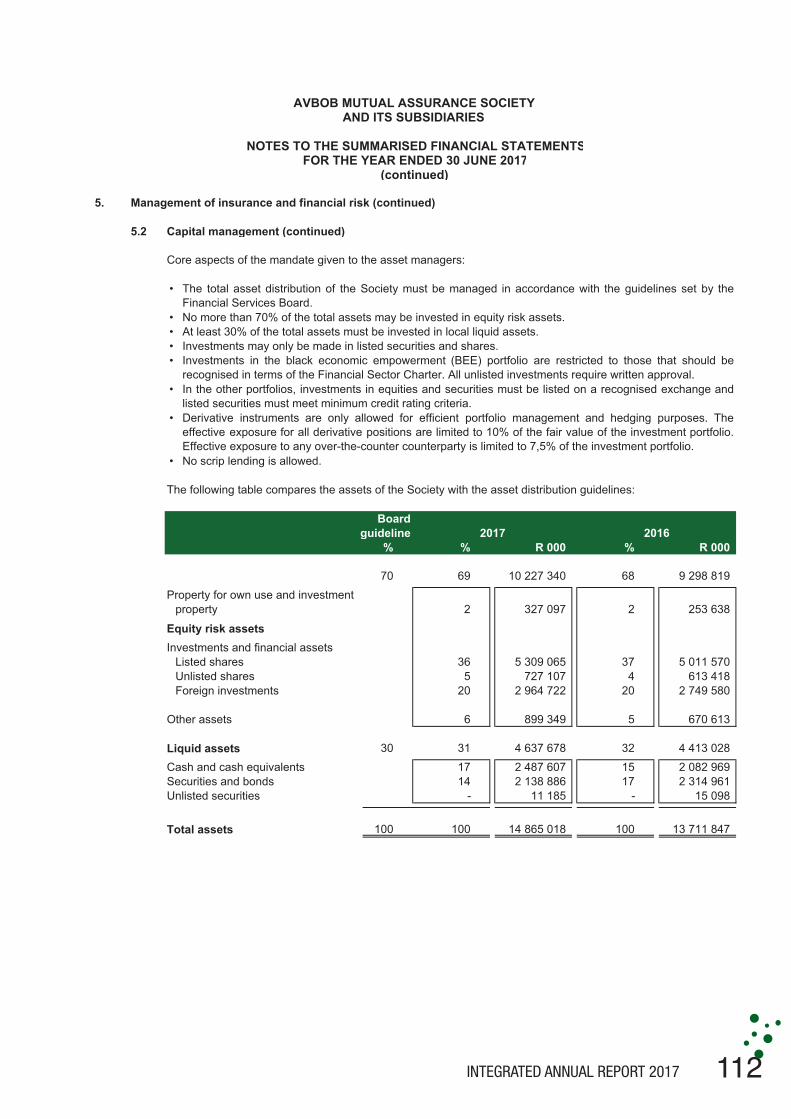
• No more than 70% of the total assets may be invested in equity risk assets.• At least 30% of the total assets must be invested in local liquid assets.• Investments may only be made in listed securities and shares.•
•
•
• No scrip lending is allowed.
Boardguideline 2017 2016
% % R 000 % R 000
70 69 10 227 340 68 9 298 819Property for own use and investment
property 2 327 097 2 253 638
Equity risk assets Investments and financial assets
Listed shares 36 5 309 065 37 5 011 570Unlisted shares 5 727 107 4 613 418Foreign investments 20 2 964 722 20 2 749 580
Other assets 6 899 349 5 670 613
Liquid assets 30 31 4 637 678 32 4 413 028Cash and cash equivalents 17 2 487 607 15 2 082 969Securities and bonds 14 2 138 886 17 2 314 961Unlisted securities - 11 185 - 15 098
Total assets 100 100 14 865 018 100 13 711 847
0
The following table compares the assets of the Society with the asset distribution guidelines:
The total asset distribution of the Society must be managed in accordance with the guidelines set by theFinancial Services Board.
Investments in the black economic empowerment (BEE) portfolio are restricted to those that should berecognised in terms of the Financial Sector Charter. All unlisted investments require written approval.In the other portfolios, investments in equities and securities must be listed on a recognised exchange andlisted securities must meet minimum credit rating criteria.Derivative instruments are only allowed for efficient portfolio management and hedging purposes. Theeffective exposure for all derivative positions are limited to 10% of the fair value of the investment portfolio.Effective exposure to any over-the-counter counterparty is limited to 7,5% of the investment portfolio.

113 INTEGRATED ANNUAL REPORT 2017
AVBOB MUTUAL ASSURANCE SOCIETY AND ITS SUBSIDIARIES
NOTES TO THE SUMMARISED FINANCIAL STATEMENTSFOR THE YEAR ENDED 30 JUNE 2017
(continued)
5. Management of insurance and financial risk (continued)
5.3 Fair value hierarchy
• Quoted prices (unadjusted) in active markets for identical assets or liabilities (Level 1).
•
•
Level 1. Level 2 Level 3. TotalR 000 R 000 R 000 R 000
At 30 June 2016AssetsAt fair value through profit or loss
Listed fixed income securities 2 314 961 - - 2 314 961Listed shares 5 011 570 - - 5 011 570Non-listed foreign investments - 2 749 580 - 2 749 580Unlisted investments - 404 089 224 427 628 516
Investments in subsidiaries - - 186 000 186 000
Total assets 7 326 531 3 153 669 410 427 10 890 627
LiabilitiesInvestment contracts with discretionary
participation features (DPF) - - 269 641 269 641
Total liabilities - - 269 641 269 641
At 30 June 2017AssetsAt fair value through profit or loss
Listed fixed income securities 2 138 886 - - 2 138 886Listed shares 5 309 065 - - 5 309 065Non-listed foreign investments - 2 964 722 - 2 964 722Unlisted investments - 485 591 252 701 738 292
Investments in subsidiaries - - 235 600 235 600
Total assets 7 447 951 3 450 313 488 301 11 386 565
0
Inputs other than quoted prices included within Level 1 that are observable for the asset or liability, eitherdirectly (that is, as prices) or indirectly (that is, derived from prices) (Level 2).
Inputs for the asset or liability that are not based on observable market data (that is, unobservable inputs)(Level 3).
The following fair value measurement hierarchy is applied to financial instruments that are measured in thestatements of financial position:
The following table presents the Society's assets and liabilities that are measured at fair value:
114INTEGRATED ANNUAL REPORT 2017
AVBOB MUTUAL ASSURANCE SOCIETY AND ITS SUBSIDIARIES
NOTES TO THE SUMMARISED FINANCIAL STATEMENTSFOR THE YEAR ENDED 30 JUNE 2017
(continued)
5. Management of insurance and financial risk (continued)
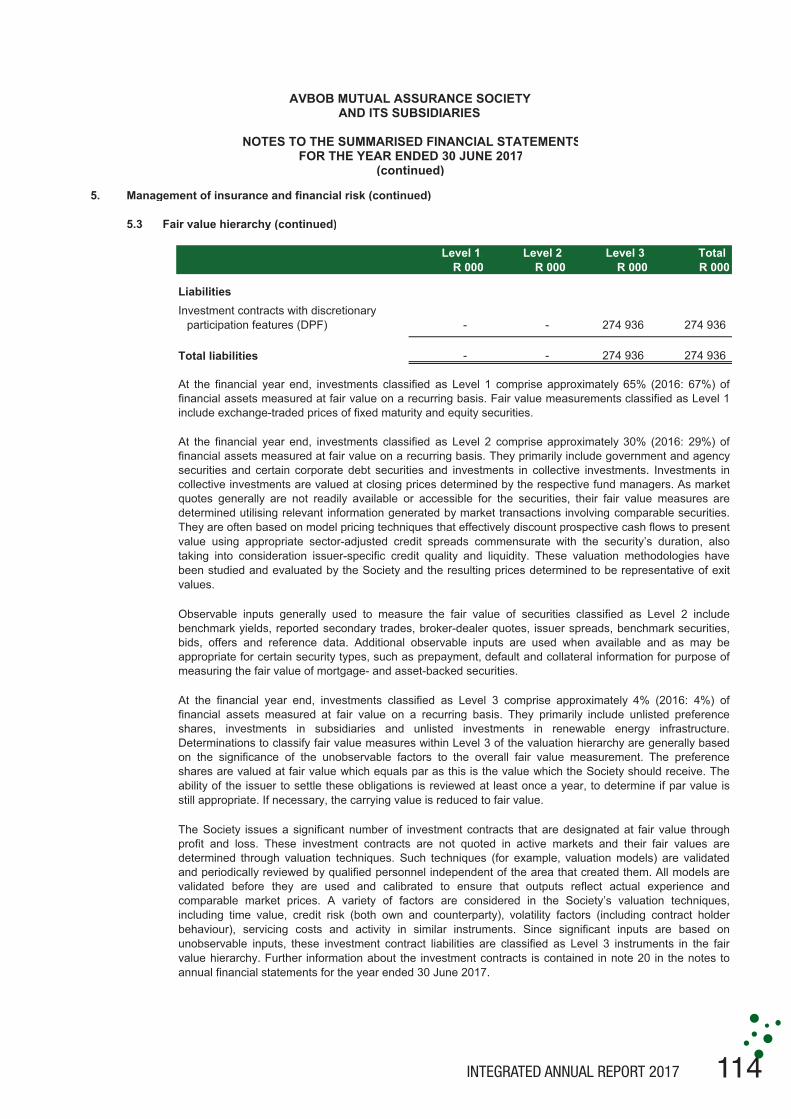
5.3 Fair value hierarchy (continued)
Level 1. Level 2 Level 3. TotalR 000 R 000 R 000 R 000
LiabilitiesInvestment contracts with discretionary
participation features (DPF) - - 274 936 274 936
Total liabilities - - 274 936 274 936
At the financial year end, investments classified as Level 1 comprise approximately 65% (2016: 67%) offinancial assets measured at fair value on a recurring basis. Fair value measurements classified as Level 1include exchange-traded prices of fixed maturity and equity securities.
At the financial year end, investments classified as Level 2 comprise approximately 30% (2016: 29%) offinancial assets measured at fair value on a recurring basis. They primarily include government and agencysecurities and certain corporate debt securities and investments in collective investments. Investments incollective investments are valued at closing prices determined by the respective fund managers. As marketquotes generally are not readily available or accessible for the securities, their fair value measures aredetermined utilising relevant information generated by market transactions involving comparable securities.They are often based on model pricing techniques that effectively discount prospective cash flows to presentvalue using appropriate sector-adjusted credit spreads commensurate with the security’s duration, alsotaking into consideration issuer-specific credit quality and liquidity. These valuation methodologies havebeen studied and evaluated by the Society and the resulting prices determined to be representative of exitvalues.
Observable inputs generally used to measure the fair value of securities classified as Level 2 includebenchmark yields, reported secondary trades, broker-dealer quotes, issuer spreads, benchmark securities,bids, offers and reference data. Additional observable inputs are used when available and as may beappropriate for certain security types, such as prepayment, default and collateral information for purpose ofmeasuring the fair value of mortgage- and asset-backed securities.
At the financial year end, investments classified as Level 3 comprise approximately 4% (2016: 4%) offinancial assets measured at fair value on a recurring basis. They primarily include unlisted preferenceshares, investments in subsidiaries and unlisted investments in renewable energy infrastructure.Determinations to classify fair value measures within Level 3 of the valuation hierarchy are generally basedon the significance of the unobservable factors to the overall fair value measurement. The preferenceshares are valued at fair value which equals par as this is the value which the Society should receive. Theability of the issuer to settle these obligations is reviewed at least once a year, to determine if par value isstill appropriate. If necessary, the carrying value is reduced to fair value.
The Society issues a significant number of investment contracts that are designated at fair value throughprofit and loss. These investment contracts are not quoted in active markets and their fair values aredetermined through valuation techniques. Such techniques (for example, valuation models) are validatedand periodically reviewed by qualified personnel independent of the area that created them. All models arevalidated before they are used and calibrated to ensure that outputs reflect actual experience andcomparable market prices. A variety of factors are considered in the Society’s valuation techniques,including time value, credit risk (both own and counterparty), volatility factors (including contract holderbehaviour), servicing costs and activity in similar instruments. Since significant inputs are based onunobservable inputs, these investment contract liabilities are classified as Level 3 instruments in the fairvalue hierarchy. Further information about the investment contracts is contained in note 20 in the notes toannual financial statements for the year ended 30 June 2017.
115 INTEGRATED ANNUAL REPORT 2017
AVBOB MUTUAL ASSURANCE SOCIETY AND ITS SUBSIDIARIES
NOTES TO THE SUMMARISED FINANCIAL STATEMENTSFOR THE YEAR ENDED 30 JUNE 2017
(continued)
5. Management of insurance and financial risk (continued)
5.3 Fair value hierarchy (continued)
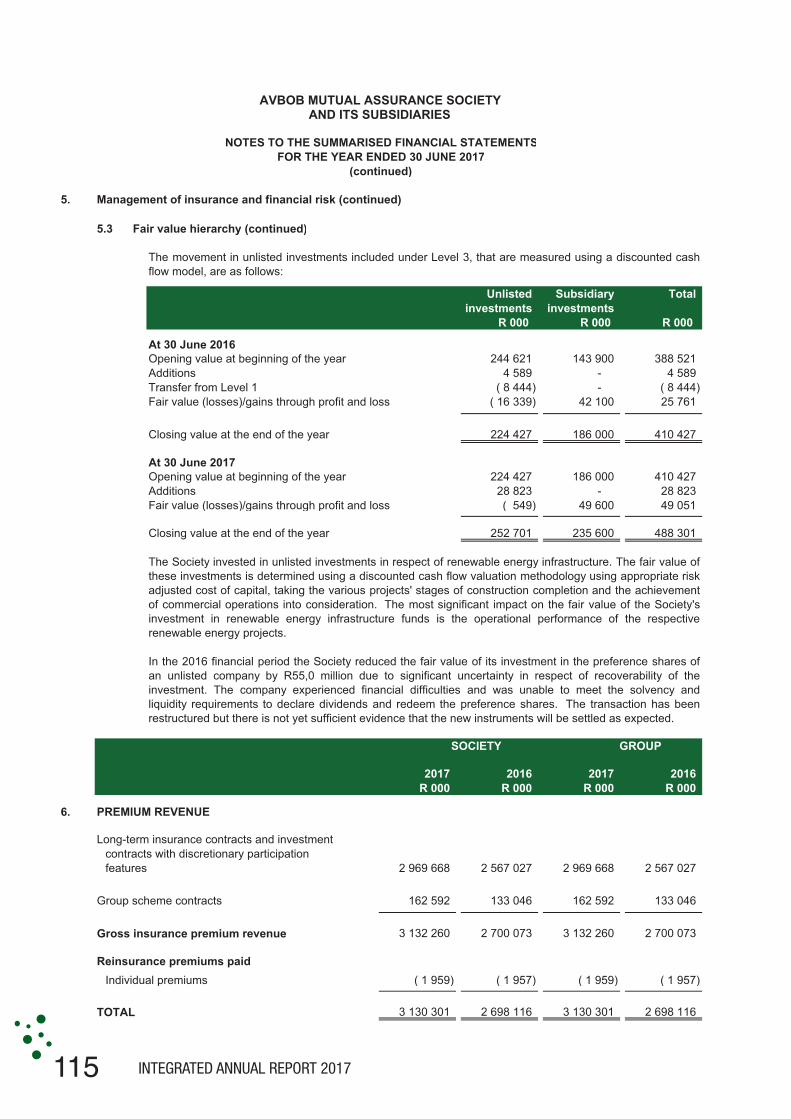
Unlisted Subsidiary Totalinvestments investments
R 000 R 000 R 000
At 30 June 2016Opening value at beginning of the year 244 621 143 900 388 521Additions 4 589 - 4 589Transfer from Level 1 ( 8 444) - ( 8 444)Fair value (losses)/gains through profit and loss ( 16 339) 42 100 25 761
Closing value at the end of the year 224 427 186 000 410 427
At 30 June 2017Opening value at beginning of the year 224 427 186 000 410 427Additions 28 823 - 28 823Fair value (losses)/gains through profit and loss ( 549) 49 600 49 051
Closing value at the end of the year 252 701 235 600 488 301
SOCIETY GROUP
2017 2016 2017 2016R 000 R 000 R 000 R 000
6. PREMIUM REVENUE
Long-term insurance contracts and investment contracts with discretionary participation features 2 969 668 2 567 027 2 969 668 2 567 027
Group scheme contracts 162 592 133 046 162 592 133 046
Gross insurance premium revenue 3 132 260 2 700 073 3 132 260 2 700 073
Reinsurance premiums paid Individual premiums ( 1 959) ( 1 957) ( 1 959) ( 1 957)
TOTAL 3 130 301 2 698 116 3 130 301 2 698 116
The Society invested in unlisted investments in respect of renewable energy infrastructure. The fair value ofthese investments is determined using a discounted cash flow valuation methodology using appropriate riskadjusted cost of capital, taking the various projects' stages of construction completion and the achievementof commercial operations into consideration. The most significant impact on the fair value of the Society'sinvestment in renewable energy infrastructure funds is the operational performance of the respectiverenewable energy projects.
The movement in unlisted investments included under Level 3, that are measured using a discounted cashflow model, are as follows:
In the 2016 financial period the Society reduced the fair value of its investment in the preference shares ofan unlisted company by R55,0 million due to significant uncertainty in respect of recoverability of theinvestment. The company experienced financial difficulties and was unable to meet the solvency andliquidity requirements to declare dividends and redeem the preference shares. The transaction has beenrestructured but there is not yet sufficient evidence that the new instruments will be settled as expected.

116INTEGRATED ANNUAL REPORT 2017
AVBOB MUTUAL ASSURANCE SOCIETY AND ITS SUBSIDIARIES
NOTES TO THE SUMMARISED FINANCIAL STATEMENTSFOR THE YEAR ENDED 30 JUNE 2017
(continued)
SOCIETY GROUP
2017 2016 2017 2016R 000 R 000 R 000 R 000
7. CONTRACT BENEFITS AND CLAIMS
Long-term insurance contracts and investment contracts with discretionary participation features 921 025 740 209 921 025 740 209
Death and disability claims 718 432 546 957 718 432 546 957Maturities 727 881 727 881Surrenders/lapses 201 866 192 371 201 866 192 371
Group scheme contracts Death and disability claims 76 260 59 000 76 260 59 000
Expenses 161 784 128 462 23 246 18 823
Insurance claims recovered from reinsuranceLong-term insurance contracts ( 1 005) ( 1 038) ( 1 005) ( 1 038)
NET BENEFITS 1 158 064 926 633 1 019 526 816 994
8. EXPENSES BY FUNCTION
Comprising:- - 420 049 382 961
- - 22 255 21 545- - 397 794 361 416
294 898 256 783 321 996 280 655
146 083 133 029 158 858 144 171 148 815 123 754 163 138 136 484
483 827 409 906 577 181 491 020
274 358 234 587 325 256 279 405 209 469 175 319 251 925 211 615
778 725 666 689 1 319 226 1 154 636
Number of full-time employees at 30 June 466 439 916 851
Number of representatives at 30 June 6 327 4 815 6 327 4 815
Other expenses
Cost of sales
Marketing expenses
Employee benefit expenses Other expenses
Employee benefit expenses Other expenses
Operating and administrative expenses
Employee benefit expenses
117 INTEGRATED ANNUAL REPORT 2017
AVBOB MUTUAL ASSURANCE SOCIETY AND ITS SUBSIDIARIES
NOTES TO THE SUMMARISED FINANCIAL STATEMENTSFOR THE YEAR ENDED 30 JUNE 2017
(continued)
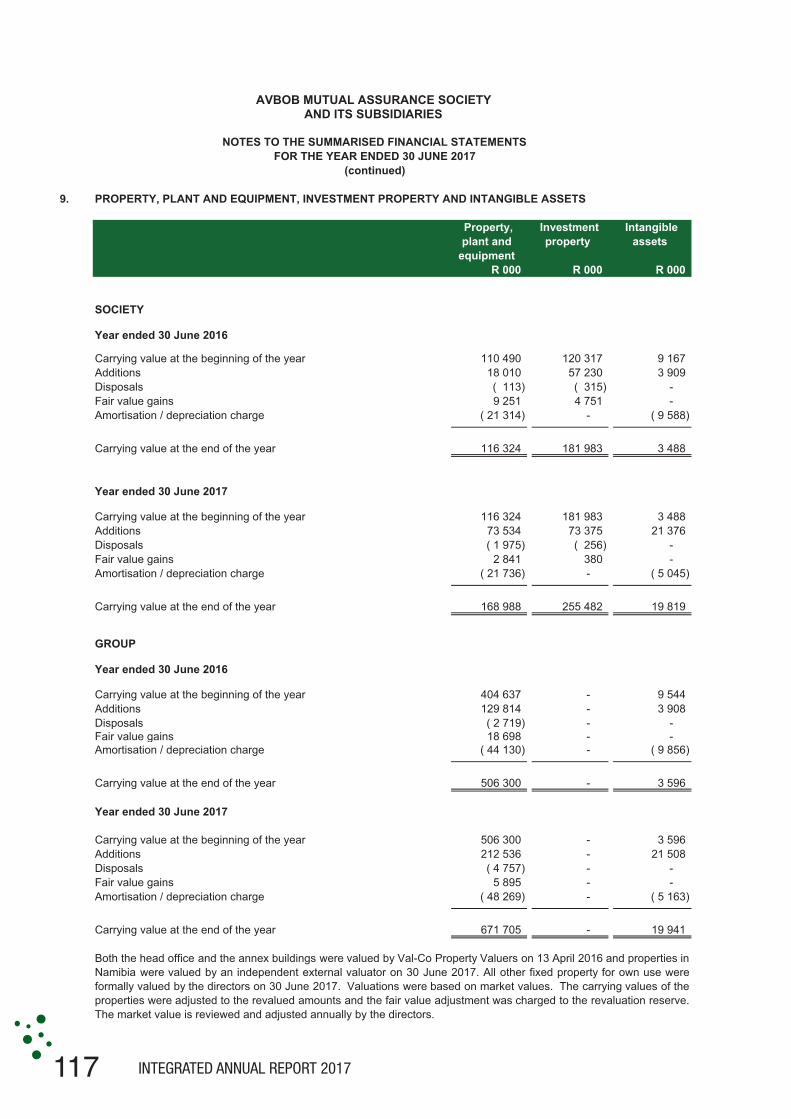
9. PROPERTY, PLANT AND EQUIPMENT, INVESTMENT PROPERTY AND INTANGIBLE ASSETS
R 000 R 000 R 000
SOCIETY
Year ended 30 June 2016
Carrying value at the beginning of the year 110 490 120 317 9 167 Additions 18 010 57 230 3 909 Disposals ( 113) ( 315) - Fair value gains 9 251 4 751 - Amortisation / depreciation charge ( 21 314) - ( 9 588)
Carrying value at the end of the year 116 324 181 983 3 488
Year ended 30 June 2017
Carrying value at the beginning of the year 116 324 181 983 3 488 Additions 73 534 73 375 21 376 Disposals ( 1 975) ( 256) - Fair value gains 2 841 380 - Amortisation / depreciation charge ( 21 736) - ( 5 045)
Carrying value at the end of the year 168 988 255 482 19 819
GROUP
Year ended 30 June 2016
Carrying value at the beginning of the year 404 637 - 9 544 Additions 129 814 - 3 908 Disposals ( 2 719) - -Fair value gains 18 698 - -Amortisation / depreciation charge ( 44 130) - ( 9 856)
Carrying value at the end of the year 506 300 - 3 596
Year ended 30 June 2017
Carrying value at the beginning of the year 506 300 - 3 596 Additions 212 536 - 21 508 Disposals ( 4 757) - - Fair value gains 5 895 - - Amortisation / depreciation charge ( 48 269) - ( 5 163)
Carrying value at the end of the year 671 705 - 19 941
Property, plant and
equipment
Investment property
Intangible assets
Both the head office and the annex buildings were valued by Val-Co Property Valuers on 13 April 2016 and properties inNamibia were valued by an independent external valuator on 30 June 2017. All other fixed property for own use wereformally valued by the directors on 30 June 2017. Valuations were based on market values. The carrying values of theproperties were adjusted to the revalued amounts and the fair value adjustment was charged to the revaluation reserve.The market value is reviewed and adjusted annually by the directors.

118INTEGRATED ANNUAL REPORT 2017
AVBOB MUTUAL ASSURANCE SOCIETY AND ITS SUBSIDIARIES
NOTES TO THE SUMMARISED FINANCIAL STATEMENTSFOR THE YEAR ENDED 30 JUNE 2017
(continued)
9. PROPERTY, PLANT AND EQUIPMENT, INVESTMENT PROPERTY AND INTANGIBLE ASSETS (continued)
SOCIETY GROUP
2017 2016 2017 2016R 000 R 000 R 000 R 000
10. INVESTMENTS IN SUBSIDIARIES
UnlistedShares at cost 35 658 15 858 - - Fair value adjustment 199 942 170 142 - -
Directors' valuation (Non-current asset) 235 600 186 000 - -
Directors' valuation of subsidiaries
AVBOB Funeral Service Limited 126 200 89 500 - - AVBOB Industries Limited 74 000 49 000 - - AVBOB Namibia Holdings (Proprietary) Limited and
subsidiaries 35 400 47 500 - -
235 600 186 000 - -
All the Society's investment properties are owner occupied within the Group. No investment property is pledged assecurity. The fair value measurement is classified as Level 3.
Investment property for the Society's and Group's use was formally valued by the directors on 30 June 2017, based onmarket values. The carrying values of the properties were adjusted to the revalued amounts and the fair valueadjustment was charged to investment income. The market value is reviewed and adjusted annually by the directors.
The recoverable amount of a subsidiary is determined based on an income approach calculation. These calculationsuse cash flow projections based on approved financial budgets covering a five-year period. Cash flows beyond the five-year period are extrapolated using the estimated growth rates.
The fair values of investments in subsidiaries are based on the weighted average cost of capital (WACC) of eachsubsidiary, which is calculated based on a gross risk-free interest rate, an assumed equity risk premium, a marketassessed risk factor (beta), and an allowance for subordinated debt on a market value basis. The market assessed riskfactor (beta) captures the market’s view of the effect of all types of risk on the subsidiaries' operations, includingoperational and other non-economic risk.
119 INTEGRATED ANNUAL REPORT 2017
AVBOB MUTUAL ASSURANCE SOCIETY AND ITS SUBSIDIARIES
NOTES TO THE SUMMARISED FINANCIAL STATEMENTSFOR THE YEAR ENDED 30 JUNE 2017
(continued)
Assets at fair value
throughprofit or loss
Total
R 000 R 000 R 000
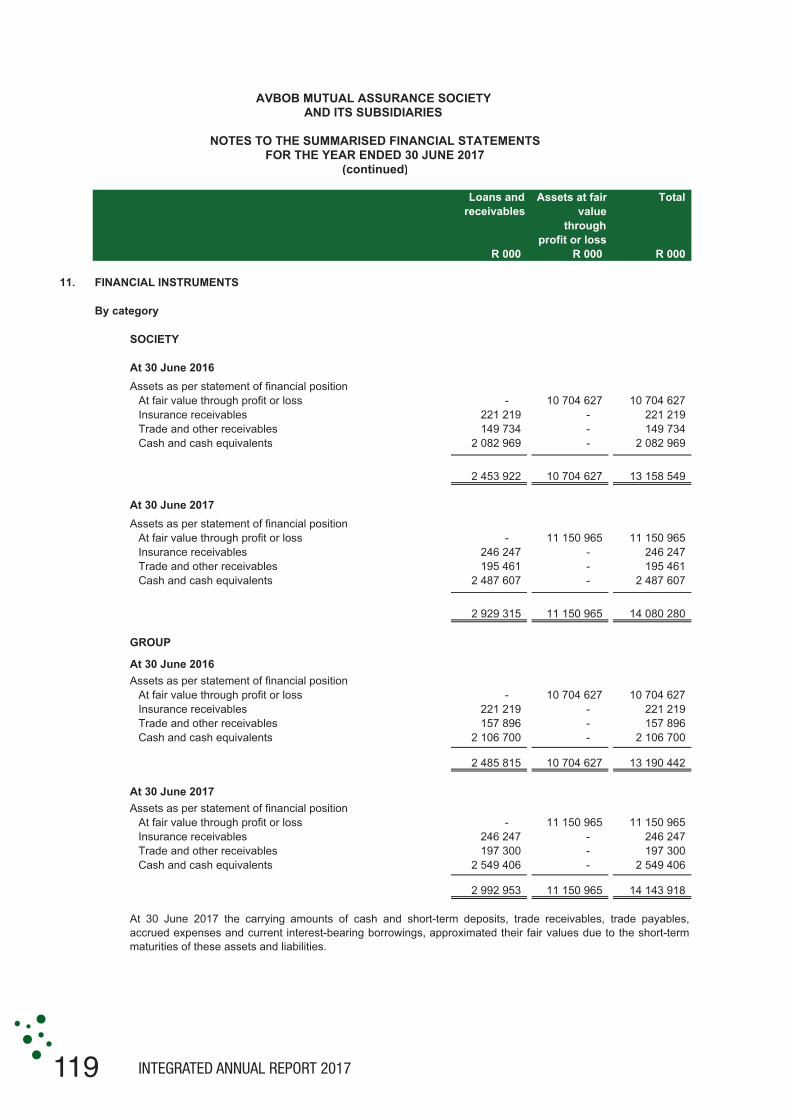
11. FINANCIAL INSTRUMENTS
By category
SOCIETY
At 30 June 2016Assets as per statement of financial position
At fair value through profit or loss - 10 704 627 10 704 627 Insurance receivables 221 219 - 221 219 Trade and other receivables 149 734 - 149 734 Cash and cash equivalents 2 082 969 - 2 082 969
2 453 922 10 704 627 13 158 549
At 30 June 2017Assets as per statement of financial position
At fair value through profit or loss - 11 150 965 11 150 965 Insurance receivables 246 247 - 246 247 Trade and other receivables 195 461 - 195 461 Cash and cash equivalents 2 487 607 - 2 487 607
2 929 315 11 150 965 14 080 280
GROUP
At 30 June 2016Assets as per statement of financial position
At fair value through profit or loss - 10 704 627 10 704 627 Insurance receivables 221 219 - 221 219 Trade and other receivables 157 896 - 157 896 Cash and cash equivalents 2 106 700 - 2 106 700
2 485 815 10 704 627 13 190 442
At 30 June 2017Assets as per statement of financial position
At fair value through profit or loss - 11 150 965 11 150 965 Insurance receivables 246 247 - 246 247 Trade and other receivables 197 300 - 197 300 Cash and cash equivalents 2 549 406 - 2 549 406
2 992 953 11 150 965 14 143 918
Loans and receivables
At 30 June 2017 the carrying amounts of cash and short-term deposits, trade receivables, trade payables,accrued expenses and current interest-bearing borrowings, approximated their fair values due to the short-termmaturities of these assets and liabilities.

120INTEGRATED ANNUAL REPORT 2017
AVBOB MUTUAL ASSURANCE SOCIETY AND ITS SUBSIDIARIES
NOTES TO THE SUMMARISED FINANCIAL STATEMENTSFOR THE YEAR ENDED 30 JUNE 2017
(continued)#REF!
SOCIETY GROUP
2017 2016 2017 2016R 000 R 000 R 000 R 000
12.
Balance at the beginning of the year 10 704 627 9 305 356 10 704 627 9 305 356 Additions 5 582 664 4 490 149 5 582 664 4 490 149 Disposals (5 027 720) (3 419 461) (5 027 720) (3 419 461) Fair value gains through profit and loss in
the statement of comprehensive income ( 108 606) 322 291 ( 108 606) 322 291 Exchange differences - 6 292 - 6 292
Balance at the end of the year 11 150 965 10 704 627 11 150 965 10 704 627 TRUE (2 565 824)
Listed fixed income securities 2 138 886 2 314 961 2 138 886 2 314 961 Listed shares 5 309 065 5 011 570 5 309 065 5 011 570 Non-listed foreign investments 2 964 722 2 749 580 2 964 722 2 749 580 Unlisted investments 738 292 628 516 738 292 628 516
11 150 965 10 704 627 11 150 965 10 704 627
Current assets 249 703 209 955 249 703 209 955 Non-current assets 10 901 262 10 494 672 10 901 262 10 494 672
FINANCIAL ASSETS AT FAIR VALUE THROUGH
Financial assets comprise the following:
PROFIT OR LOSS
Financial assets at fair value through profit or loss are classified as non-current assets, unless their maturity is within ayear, as the assets are kept for long-term yield to the benefit of policyholders. All proceeds from disposals during theyear are utilised for additions.
Financial assets at fair value through profit or loss are managed by Investec Asset Management, Old Mutual InvestmentGroup SA, Prudential Investment Managers, Sanlam Investment Management and Stanlib Asset Management.
121 INTEGRATED ANNUAL REPORT 2017
AVBOB MUTUAL ASSURANCE SOCIETY AND ITS SUBSIDIARIES
NOTES TO THE SUMMARISED FINANCIAL STATEMENTSFOR THE YEAR ENDED 30 JUNE 2017
(continued)
SOCIETY GROUP
2017 2016 2017 2016R 000 R 000 R 000 R 000
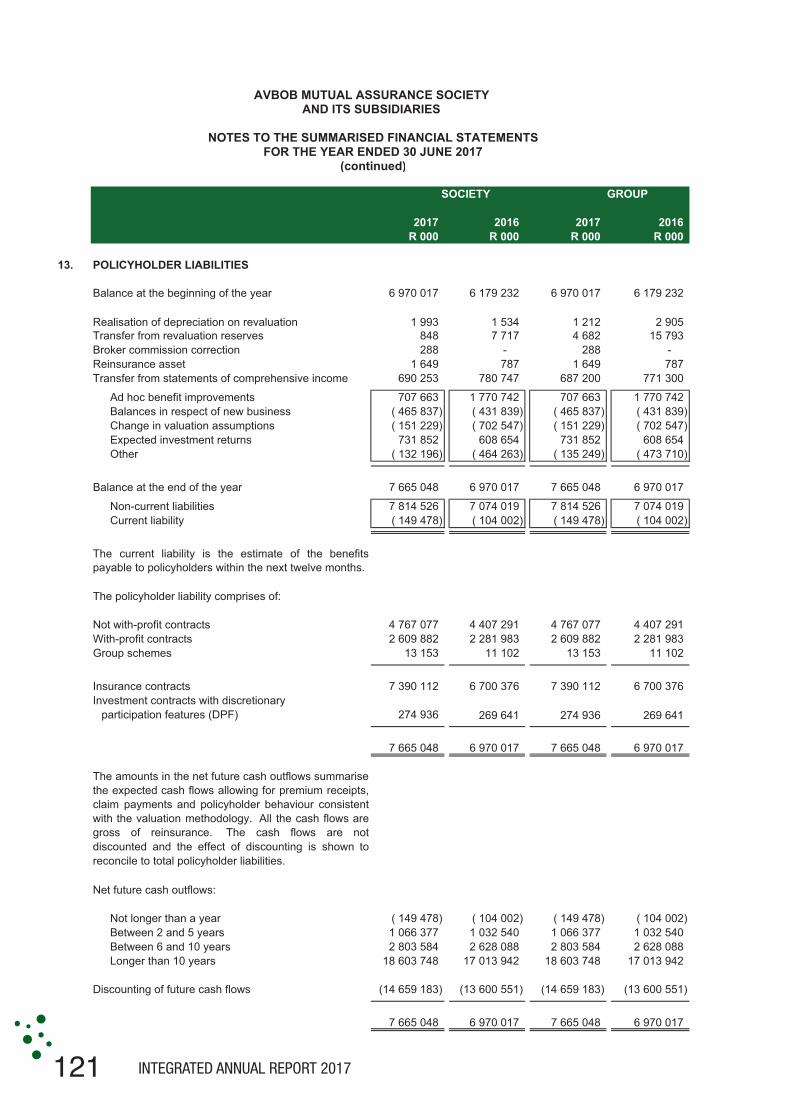
13. POLICYHOLDER LIABILITIES
Balance at the beginning of the year 6 970 017 6 179 232 6 970 017 6 179 232
Realisation of depreciation on revaluation 1 993 1 534 1 212 2 905 Transfer from revaluation reserves 848 7 717 4 682 15 793 Broker commission correction 288 - 288 - Reinsurance asset 1 649 787 1 649 787 Transfer from statements of comprehensive income 690 253 780 747 687 200 771 300
Ad hoc benefit improvements 707 663 1 770 742 707 663 1 770 742 Balances in respect of new business ( 465 837) ( 431 839) ( 465 837) ( 431 839) Change in valuation assumptions ( 151 229) ( 702 547) ( 151 229) ( 702 547) Expected investment returns 731 852 608 654 731 852 608 654 Other ( 132 196) ( 464 263) ( 135 249) ( 473 710)
Balance at the end of the year 7 665 048 6 970 017 7 665 048 6 970 017
Non-current liabilities 7 814 526 7 074 019 7 814 526 7 074 019 Current liability ( 149 478) ( 104 002) ( 149 478) ( 104 002)
Not with-profit contracts 4 767 077 4 407 291 4 767 077 4 407 291 With-profit contracts 2 609 882 2 281 983 2 609 882 2 281 983 Group schemes 13 153 11 102 13 153 11 102
Insurance contracts 7 390 112 6 700 376 7 390 112 6 700 376 Investment contracts with discretionary
participation features (DPF) 274 936 269 641 274 936 269 641
7 665 048 6 970 017 7 665 048 6 970 017 TRUE TRUE TRUE TRUE
Net future cash outflows:
Not longer than a year ( 149 478) ( 104 002) ( 149 478) ( 104 002) Between 2 and 5 years 1 066 377 1 032 540 1 066 377 1 032 540 Between 6 and 10 years 2 803 584 2 628 088 2 803 584 2 628 088 Longer than 10 years 18 603 748 17 013 942 18 603 748 17 013 942
Discounting of future cash flows (14 659 183) (13 600 551) (14 659 183) (13 600 551)
7 665 048 6 970 017 7 665 048 6 970 017
The current liability is the estimate of the benefitspayable to policyholders within the next twelve months.
The policyholder liability comprises of:
The amounts in the net future cash outflows summarisethe expected cash flows allowing for premium receipts,claim payments and policyholder behaviour consistentwith the valuation methodology. All the cash flows aregross of reinsurance. The cash flows are notdiscounted and the effect of discounting is shown toreconcile to total policyholder liabilities.

122INTEGRATED ANNUAL REPORT 2017
AVBOB MUTUAL ASSURANCE SOCIETY AND ITS SUBSIDIARIES
NOTES TO THE SUMMARISED FINANCIAL STATEMENTSFOR THE YEAR ENDED 30 JUNE 2017
(continued)
13. POLICYHOLDER LIABILITIES (continued)
Long-term life insurance contracts
13.1 Assumptions
• Mortality assumption
• Lapse and surrender assumptions
Premium Premiumpaying paying
2017 2016
Year 1: 39.5% 36.5%Year 2: 19.5% 18.5%Year 3: 12.0% 12.0%Year 4: 7.5% 7.5%
• Expense assumptions
• Economic assumptions
The cost of administering a life policy of the principal policyholder is R153.17 (2016: R141.52) per annum andthe premium collection cost is 3.0% (2016: 3.0%) of each premium.
The assumed future investment return is based on the assumed spread between asset classes and theassumed returns on each asset class. The assumed spread of assets has remained the same as theprevious year.
The value of the policyholder liabilities has been calculated using best estimate assumptions regarding the futureexperience of the business. These assumptions are generally determined based on recent past experience withappropriate adjustments for future trends. For prudence the Statutory Actuary adds compulsory and discretionarymargins to the best estimate liability. The best estimate assumptions and compulsory margins are set out in thissection.
The mortality assumptions have been based on the results of the most recent mortality investigation for theSociety. This investigation covers the period from 1 January 2016 to 31 December 2016. The assumptionswere revised so that the level of the best estimate assumption is closer to the current actual experience in linewith the investigation resulting in lower reserves. As the cashback funeral product is still a new product themortality experience of the predecessor product is used.
A full withdrawal investigation was performed for the period 1 January 2016 to 31 December 2016. Thewithdrawal rates were split into two categories: premium paying and paid-up policies. The withdrawalassumptions for premium paying policies has remained largely consistent with the previous year's experience.The best estimate lapse assumption was updated to track actual experience more closely. These withdrawalassumptions are as follows:
The valuation assumption at the previous year end (including the assumed level of inflation for the year) islower than both the actual 2017 cost per policy and the 2018 forecast cost per policy. The assumedmaintenance cost in 2017 has been set to a level half-way between the 2017 valuation assumption and the2018 forecast cost per policy including inflation.
Administration costs are expressed separately for costs relating to premium collection and administration, andother administration costs. It is further assumed that the administration cost of an assistance policy is two-thirds the level of cost of a life policy. It is also assumed that the cost of administering a life policy increasesby 20% for each additional life assured under the policy. The assumptions are consistent with the approach inthe previous year.
123 INTEGRATED ANNUAL REPORT 2017
AVBOB MUTUAL ASSURANCE SOCIETY AND ITS SUBSIDIARIES
NOTES TO THE SUMMARISED FINANCIAL STATEMENTSFOR THE YEAR ENDED 30 JUNE 2017
(continued)
13. POLICYHOLDER LIABILITIES (continued)
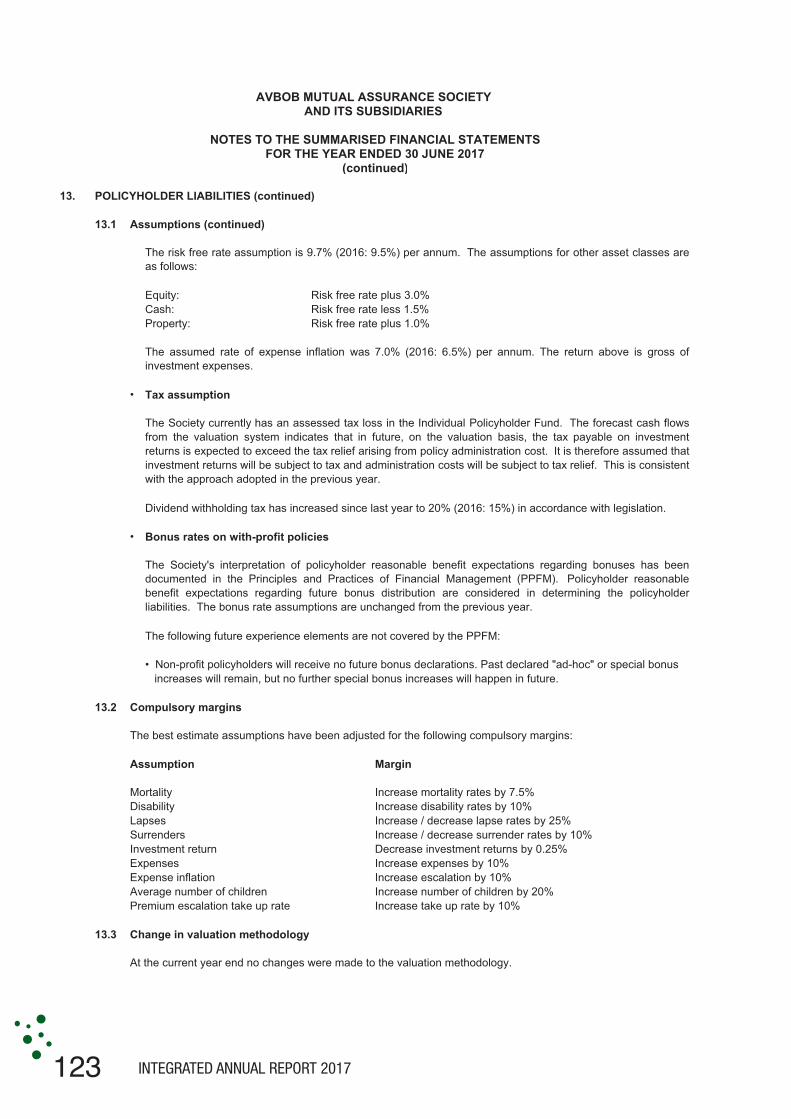
13.1 Assumptions (continued)
Equity: Risk free rate plus 3.0%Cash: Risk free rate less 1.5%Property: Risk free rate plus 1.0%
• Tax assumption
• Bonus rates on with-profit policies
The following future experience elements are not covered by the PPFM:
• Non-profit policyholders will receive no future bonus declarations. Past declared "ad-hoc" or special bonus increases will remain, but no further special bonus increases will happen in future.
13.2 Compulsory margins
The best estimate assumptions have been adjusted for the following compulsory margins:
Assumption Margin
Mortality Increase mortality rates by 7.5%Disability Increase disability rates by 10%Lapses Increase / decrease lapse rates by 25%Surrenders Increase / decrease surrender rates by 10%Investment return Decrease investment returns by 0.25%Expenses Increase expenses by 10%Expense inflation Increase escalation by 10%Average number of children Increase number of children by 20%Premium escalation take up rate Increase take up rate by 10%
13.3 Change in valuation methodology
At the current year end no changes were made to the valuation methodology.
The assumed rate of expense inflation was 7.0% (2016: 6.5%) per annum. The return above is gross ofinvestment expenses.
The risk free rate assumption is 9.7% (2016: 9.5%) per annum. The assumptions for other asset classes areas follows:
The Society currently has an assessed tax loss in the Individual Policyholder Fund. The forecast cash flowsfrom the valuation system indicates that in future, on the valuation basis, the tax payable on investmentreturns is expected to exceed the tax relief arising from policy administration cost. It is therefore assumed thatinvestment returns will be subject to tax and administration costs will be subject to tax relief. This is consistentwith the approach adopted in the previous year.
Dividend withholding tax has increased since last year to 20% (2016: 15%) in accordance with legislation.
The Society's interpretation of policyholder reasonable benefit expectations regarding bonuses has beendocumented in the Principles and Practices of Financial Management (PPFM). Policyholder reasonablebenefit expectations regarding future bonus distribution are considered in determining the policyholderliabilities. The bonus rate assumptions are unchanged from the previous year.

124INTEGRATED ANNUAL REPORT 2017
AVBOB MUTUAL ASSURANCE SOCIETY AND ITS SUBSIDIARIES
NOTES TO THE SUMMARISED FINANCIAL STATEMENTSFOR THE YEAR ENDED 30 JUNE 2017
(continued)
13. POLICYHOLDER LIABILITIES (continued)
13.4 Change to valuation assumptions
•
•
•
•
•
•
13.5 Sensitivity analysis of the policyholder liabilities
Change in the liability2017 2016
R 000 R 000
10% increase in mortality 676 535 685 882 1% decrease in investment return 481 897 458 926 10% increase in expenses 433 693 362 469 1% increase in expense inflation 448 864 361 794 20% increase in lapses ( 79 616) ( 136 633) 10% increase in surrenders 7 153 9 192 10% decrease in surrenders ( 5 226) ( 7 238)
At the current year end a number of changes were made to the assumptions which had an impact on earnings.The impact of these changes on the pre-tax earnings for the year is as follows:
The best estimate mortality assumptions was updated to track the current actual experience more closely.This resulted in a profit of R483,1 million.
The elimination of negative balances was increased by R16,7 million to prevent the premature recognition ofprofits in alignment with the Society's practice.
The best estimate lapse assumption was updated to track the current actual experience more closely. Thisresulted in a loss of R16,1 million. Change in the direction of lapses planned margin for years 4+ resulted in aloss of R110,6 million.
Maintenance expenses increased by more than the assumed inflation rate resulting in an increase in liabilitiesof R37,0 million. An additional expense liability was set up for once-off centenary expenses, increasing theliability by R32,4 million.
The economic assumptions were amended to reflect the expected future investment returns based on the long-term assumed assets held by the Society. The increase in the assumed investment return resulted in a loss ofR121,4 million. This includes a reduction in the inflation gap from 3.0% to 2.75%.
The transport and funeral subsidy cost changed from R84.48 to R89.76 per policy per annum to provideimproved benefits. This decreased the liabilities by R2,5 million.
The policyholder liabilities are calculated according to best estimate assumptions plus compulsory margins - thevaluation assumptions. To illustrate sensitivity to the assumptions, changes in the valuation assumptions werecalculated, as set out in the following table:
The analyses are based on a change in an assumption while holding all other assumptions constant. Inpractice this is unlikely to occur, as changes in some of the assumptions may be correlated. A correlationexists between the inflation rate and investment returns, as well as between the inflation rate and renewalexpenses.

125 INTEGRATED ANNUAL REPORT 2017
AVBOB MUTUAL ASSURANCE SOCIETY AND ITS SUBSIDIARIES
NOTES TO THE SUMMARISED FINANCIAL STATEMENTSFOR THE YEAR ENDED 30 JUNE 2017
(continued)
14. EMPLOYEE BENEFIT OBLIGATIONS
Five year summary of employee benefit obligations:
At 30 June 2017 2016 2015 2014 2013R 000 R 000 R 000 R 000 R 000
SOCIETY
Present value of obligations 157 645 119 015 100 219 88 895 45 844 Experience adjustments on plan liabilities 13 ( 475) 2 124 5 545 2 785
GROUP
Present value of obligations 181 180 138 088 119 596 121 257 73 248 Experience adjustments on plan liabilities 766 ( 28) 4 050 8 685 4 179
Long-term incentive plan
Appreciation Retention Total Unit valueUnits issued units units units units 2017
For the 2013 financial year (issued at R10.00) 546 862 - 546 862 25.70
For the 2014 financial year(issued at R11.28) 633 318 198 711 1 420 906 22.54
For the 2015 financial year(issued at R12.44) 767 025 420 787 1 597 312 21.16
For the 2016 financial year(issued at R13.65) 1 101 461 367 709 1 948 058 16.54
For the 2017 financial year(issued at R14.57) 1 059 778 390 379 1 952 493 14.57
4 108 444 1 377 586 7 465 631
The Group has liabilities in respect of gratuities and medical benefits payable to qualifying employees with- and post-retirement. The gratuities payable with-retirement is a percentage of total guaranteed package, with certain employeesbeing limited to a R50 000 benefit. The medical benefits payable post-retirement are equivalent to 50% of the totalmedical contribution on the chosen benchmark plan at retirement. The medical contribution subsidy increases annuallywith CPI up to a maximum of 10%. The current benchmark plan is the Discovery Health Classic Priority plan with 25%savings. The estimated cost of these benefits is provided over the projected service periods of employees. Thevaluation of these liabilities is performed by management based on the projected unit credit method. Any surplus orshortfall between the actuarial valuation and the accumulated liability is apportioned to and from the statement ofcomprehensive income as other comprehensive income. New appointments after 1 November 1998 (post-retirementbenefit) and 1 November 2000 (with-retirement benefit) do not qualify for these benefits.
The number of participating members in respect of gratuity payments of the Society totals 100 (2016: 112) and themedical benefit totals 12 (2016: 12). The number of participating members in respect of gratuity payments of the Grouptotals 176 (2016: 202) and the medical benefit totals 33 (2016: 34).
588 877
Performance
-
The Group operates an LTIP. The increase in the fair value of the share scheme units is recognised as an expense inthe period in which the employees' services are rendered. The issued units at the end of the year are as follows:
The Group operates a Long-term incentive plan (LTIP) in the Society in which the South African subsidiaries participate.In Namibia, The Avbob Share Trust was established to provide cash-settled incentives for employees of the Namibiansubsidiaries. The increase in the fair value of the share scheme units is recognised as an expense in the same period inwhich the employees' services are rendered.
502 336
409 500
478 888
SOCIETY
1 979 601
126INTEGRATED ANNUAL REPORT 2017
AVBOB MUTUAL ASSURANCE SOCIETY AND ITS SUBSIDIARIES
NOTES TO THE SUMMARISED FINANCIAL STATEMENTSFOR THE YEAR ENDED 30 JUNE 2017
(continued)
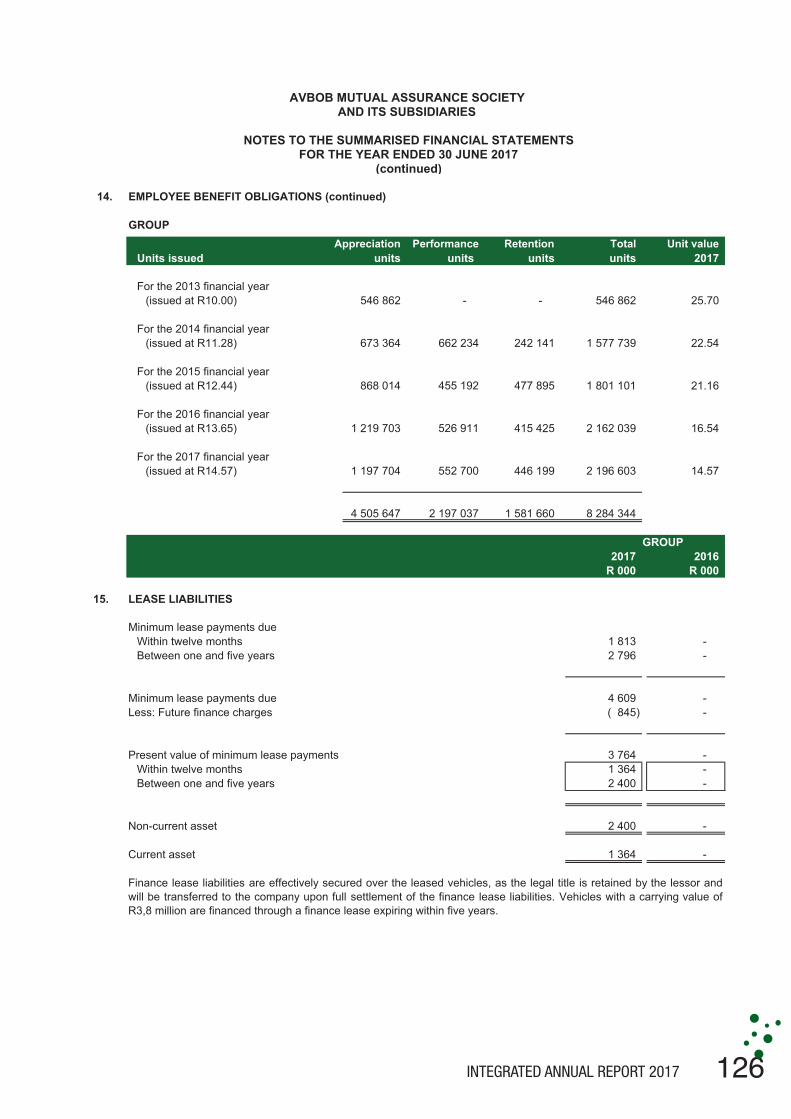
14. EMPLOYEE BENEFIT OBLIGATIONS (continued)
GROUPAppreciation Retention Total Unit value
Units issued units units units units 2017
For the 2013 financial year (issued at R10.00) 546 862 - 546 862 25.70
For the 2014 financial year(issued at R11.28) 673 364 242 141 1 577 739 22.54
For the 2015 financial year(issued at R12.44) 868 014 477 895 1 801 101 21.16
For the 2016 financial year(issued at R13.65) 1 219 703 415 425 2 162 039 16.54
For the 2017 financial year(issued at R14.57) 1 197 704 446 199 2 196 603 14.57
4 505 647 1 581 660 8 284 344
GROUP2017 2016
R 000 R 000
15. LEASE LIABILITIES
Minimum lease payments dueWithin twelve months 1 813 - Between one and five years 2 796 -
Minimum lease payments due 4 609 - Less: Future finance charges ( 845) -
Present value of minimum lease payments 3 764 - Within twelve months 1 364 - Between one and five years 2 400 -
Non-current asset 2 400 -
Current asset 1 364 -
#REF! #REF!
Finance lease liabilities are effectively secured over the leased vehicles, as the legal title is retained by the lessor andwill be transferred to the company upon full settlement of the finance lease liabilities. Vehicles with a carrying value ofR3,8 million are financed through a finance lease expiring within five years.
2 197 037
455 192
526 911
552 700
Performance
-
662 234

127 INTEGRATED ANNUAL REPORT 2017
AVBOB MUTUAL ASSURANCE SOCIETY AND ITS SUBSIDIARIES
NOTES TO THE SUMMARISED FINANCIAL STATEMENTSFOR THE YEAR ENDED 30 JUNE 2017
(continued)
16. RELATED PARTY TRANSACTIONS
The following entities are deemed to be related parties:
Purchase of goods and services
SOCIETY
2017 2016R 000 R 000
Inter-company sales
To AVBOB Funeral Service Limited 983 707
From AVBOB Funeral Service Limited 157 817 124 834
Property rentals
To AVBOB Funeral Service Limited 17 448 13 519
Inter-company administration cost
AVBOB Funeral Service Limited 33 553 31 224
AVBOB Funeral Service Limited 3 911 3 408
Inter-company salaries
AVBOB Funeral Service Limited 44 927 36 766
Receivable from related parties
AVBOB Funeral Service Limited - loan 16 300 11 717 AVBOB Namibia Holdings (Proprietary) Limited - long-term loan 4 376 4 821
20 676 16 538
AVBOB Mutual Assurance Society pays AVBOB Funeral Service Limited a 2.8%commission for the collection of insurance premiums on a monthly basis.
AVBOB Funeral Service Limited, AVBOB Industries Limited and AVBOB Namibia Holdings (Proprietary) Limited arewholly owned subsidiaries of AVBOB Mutual Assurance Society. AVBOB Namibia Holdings (Proprietary) Limited owns53% (2016: 53%) of the issued shares of AVBOB Namibia (Proprietary) Limited.
Numerous transactions occurred between fellow subsidiaries of the holding entity, AVBOB Mutual Assurance Society,during the year. These transactions were conducted on the same terms as would apply to third parties. All transactionsbetween fellow subsidiaries and the holding entity were eliminated for consolidation purposes.
Commission paid for premium collection
AVBOB Mutual Assurance Society invoices AVBOB Funeral Service Limited on amonthly basis for administration expenses incurred in respect of the Group's headoffice and provincial structure.
AVBOB Mutual Assurance Society charges AVBOB Funeral Service Limited forsalaries and salary related expenses rendered to AVBOB Funeral Service Limited on amonthly basis.
128INTEGRATED ANNUAL REPORT 2017
AVBOB MUTUAL ASSURANCE SOCIETY AND ITS SUBSIDIARIES
NOTES TO THE SUMMARISED FINANCIAL STATEMENTSFOR THE YEAR ENDED 30 JUNE 2017
(continued)
SOCIETY
2017 2016R 000 R 000
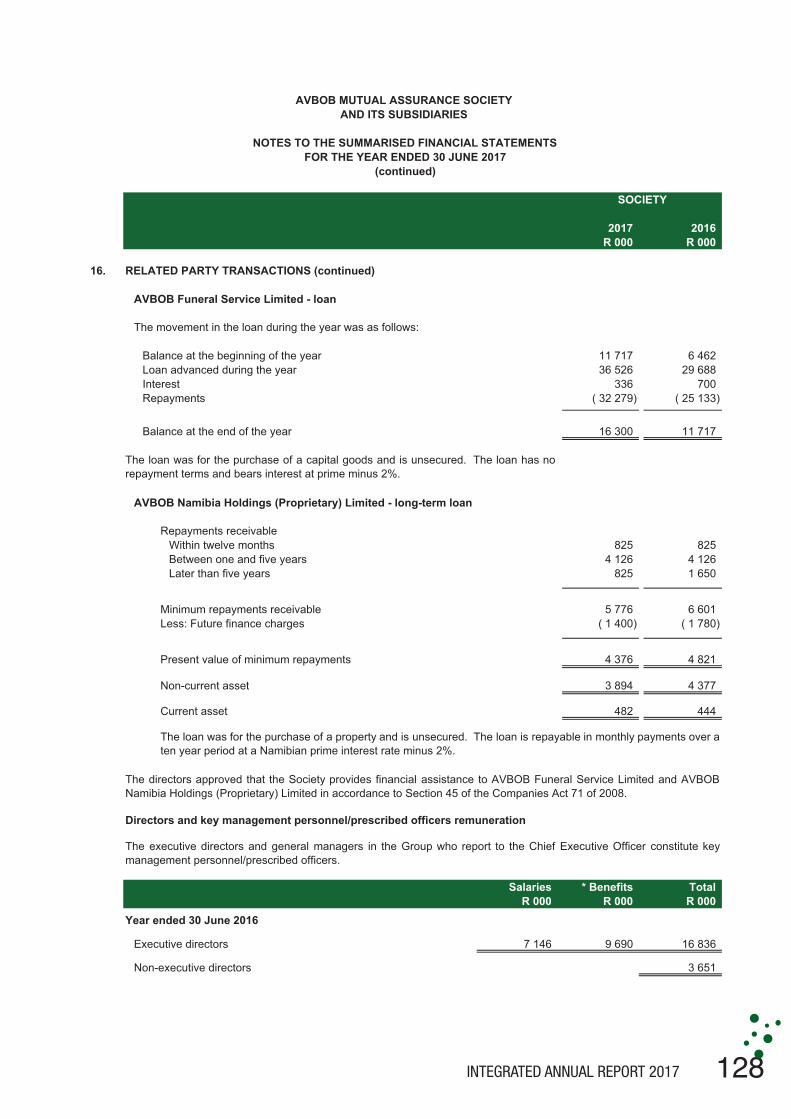
16. RELATED PARTY TRANSACTIONS (continued)
AVBOB Funeral Service Limited - loan
Balance at the beginning of the year 11 717 6 462 Loan advanced during the year 36 526 29 688 Interest 336 700 Repayments ( 32 279) ( 25 133)
Balance at the end of the year 16 300 11 717
AVBOB Namibia Holdings (Proprietary) Limited - long-term loan
Repayments receivableWithin twelve months 825 825 Between one and five years 4 126 4 126 Later than five years 825 1 650
Minimum repayments receivable 5 776 6 601 Less: Future finance charges ( 1 400) ( 1 780)
Present value of minimum repayments 4 376 4 821
Non-current asset 3 894 4 377
Current asset 482 444
Directors and key management personnel/prescribed officers remuneration
Salaries * Benefits TotalR 000 R 000 R 000
Executive directors 7 146 9 690 16 836
Non-executive directors 3 651
The loan was for the purchase of a capital goods and is unsecured. The loan has norepayment terms and bears interest at prime minus 2%.
The movement in the loan during the year was as follows:
Year ended 30 June 2016
The directors approved that the Society provides financial assistance to AVBOB Funeral Service Limited and AVBOBNamibia Holdings (Proprietary) Limited in accordance to Section 45 of the Companies Act 71 of 2008.
The loan was for the purchase of a property and is unsecured. The loan is repayable in monthly payments over aten year period at a Namibian prime interest rate minus 2%.
The executive directors and general managers in the Group who report to the Chief Executive Officer constitute keymanagement personnel/prescribed officers.

129 INTEGRATED ANNUAL REPORT 2017
AVBOB MUTUAL ASSURANCE SOCIETY AND ITS SUBSIDIARIES
NOTES TO THE SUMMARISED FINANCIAL STATEMENTSFOR THE YEAR ENDED 30 JUNE 2017
(continued)
16. RELATED PARTY TRANSACTIONS (continued)
Salaries * Benefits TotalR 000 R 000 R 000
Directors of other Group companies remunerated by the Society
AVBOB Funeral Service Limited 10 894 12 381 23 275
AVBOB Industries Limited 10 894 12 381 23 275
AVBOB Namibia Holdings (Proprietary) Limited 7 983 9 238 17 221
General managers/prescribed officers remunerated by the Society 9 615 8 592 18 207
Executive directors 8 472 14 752 23 224
Non-executive directors 4 364
Directors of other Group companies remunerated by the Society
AVBOB Funeral Service Limited 11 501 17 894 29 395
AVBOB Industries Limited 11 501 17 884 29 385
AVBOB Namibia Holdings (Proprietary) Limited 8 333 14 949 23 282
General manager/prescribed officer remunerated by the Society 1 750 922 2 672
*
Declaration of interest by directors and key management personnel/prescribed officers
17. OTHER COMMITMENTS
18. CONTINGENT LIABILITY
The Society has a 16,8% interest in a private equity infrastructure partnership. The Society committed itself to a R200,0million investment, of which the partnership can still call on R69,8 million at 30 June 2017 (2016: R91,3 million). Thepartnership calls on funds in relation to the partnership interest.
All directors of AVBOB Mutual Assurance Society and key management personnel/prescribed officers in the Groupdeclared that they have no interest in contractual agreements with the Society or any company in the Group that mayresult in a conflict of interest. All directors and key management personnel have an AVBOB policy.
Benefits include bonuses, LTIP, leave pay, employer pension contributions and gratuities at retirementpayments.
Year ended 30 June 2017
A summons for R3,5 million was issued against a group company in 2014 in respect of a cancelled lease agreement.The other party claimed damages after three months notice was given to cancel a lease with a remaining period of nineyears and five months. Attorneys have been appointed to defend the matter and notwithstanding that the matter is beingdefended, we have attempted to settle the matter. We have since assessed our maximum liability payable in the matterto be an amount of R750 000. This amount has been provided for as a loss to the Group for the year ended 30 June2017.

131INTEGRATED ANNUAL REPORT 2017
NOTESNOTESEEEEEEEEEEEEEEEEEEEEEEEEEEEEEO SSSSSSSSSSSSSSN SSSSSSNNNN SSSSSSNNNNN

132INTEGRATED ANNUAL REPORT 2017
NOTESNOTESEEEEEEEEEEEEEEEEEEEEEEEEEEEEEO SSSSSSSSSSSSSSN SSSSSSNNNN SSSSSSNNNNN

131INTEGRATED ANNUAL REPORT 2017
NOTESNOTESEEEEEEEEEEEEEEEEEEEEEEEEEEEEEO SSSSSSSSSSSSSSN SSSSSSNNNN SSSSSSNNNNN

132INTEGRATED ANNUAL REPORT 2017
NOTESNOTESEEEEEEEEEEEEEEEEEEEEEEEEEEEEEO SSSSSSSSSSSSSSN SSSSSSNNNN SSSSSSNNNNN

130INTEGRATED ANNUAL REPORT 2017
GROUP SECRETARY K Gounden
ACTUARIES Deloitte Actuarial and Insurance Solutions
ATTORNEYS Norton Rose Fulbright Adams and Adams Bester and Rhoodie
AUDITORS PricewaterhouseCoopers
INVESTMENT MANAGERS Investec Asset Management Old Mutual Investment Group SA Sanlam Asset Management Stanlib Asset Management Prudential Investment Management
HEAD OFFICE 368 Madiba Street Pretoria 0002 PO Box 1661 Pretoria 0001
Telephone no (012) 303 1000 Fax no (012) 323 4461 E-mail [email protected] Internet address www.avbob.co.za