FINANCIAL STATEMENTS 2018 Statement2018.pdf · 30 (39) (70) (354) Share of other comprehensive...
86
FINANCIAL STATEMENTS Fiscal Period Ended December 31, 2018 2018
Transcript of FINANCIAL STATEMENTS 2018 Statement2018.pdf · 30 (39) (70) (354) Share of other comprehensive...

FINANCIAL STATEMENTS
Fiscal Period Ended December 31, 2018
2018

- 1 -
1. Consolidated Financial Statements
(1) Consolidated financial statements
(i) Consolidated statement of financial position at December 31, 2018
Millions of yen Thousands of
U.S. dollars
Notes December 31, 2018 December 31, 2017
December 31, 2018
Assets
Current assets
Cash and cash
equivalents 6, 33 ¥29,269 ¥34,095
$263,691
Trade and other
receivables 7, 33 54,077 50,434
487,181
Other short-term
financial assets 8, 33 1,107 1,698
9,977
Inventories 9 33,297 30,363 299,977
Income tax refund
receivable 186 359
1,684
Other current assets 10 3,403 2,152 30,661
Total current assets 121,342 119,103 1,093,173
Non-current assets
Property, plant and
equipment 11 44,920 38,454
404,691
Goodwill and intangible
assets 12 64,255 67,792
578,880
Investments accounted
for using the equity
method
13 1,299 1,198
11,708
Long-term financial
assets 8, 33 13,825 15,354
124,557
Deferred tax assets 14 2,735 1,913 24,639
Other non-current
assets 10 1,409 875
12,697
Total non-current assets 128,446 125,588 1,157,175
Total assets ¥249,788 ¥244,692 $2,250,348

- 2 -
Millions of yen Thousands of
U.S. dollars
Notes December 31, 2018 December 31, 2017
December 31, 2018
Liabilities and equity
Liabilities
Current liabilities
Bonds and short-term
borrowings 15, 33 ¥40,056 ¥76,975
$360,867
Trade and other
payables 16, 33 27,380 22,624
246,666
Other short-term
financial liabilities
17, 18,
33 626 573
5,648
Income taxes payable 1,977 1,237 17,810
Provisions 19 1,347 1,513 12,136
Other current liabilities 20 15,658 11,006 141,066
Total current liabilities 87,045 113,930 784,196
Non-current liabilities
Long-term borrowings 15, 33 76,996 45,553 693,663
Other long-term
financial liabilities
17, 18,
33 1,050 569
9,463
Net defined benefit
liabilities 21 3,217 3,287
28,983
Provisions 19 213 176 1,924
Deferred tax liabilities 14 2,807 4,269 25,292
Other non-current
liabilities 20 118 117
1,070
Total non-current
liabilities 84,404 53,974
760,398
Total liabilities 171,450 167,905 1,544,594
Equity
Share capital 22 6,544 6,544 58,958
Capital surplus 22 11,069 11,099 99,724
Treasury shares 22 (2,544) (2,543) (22,923)
Other components of
equity 22 1,851 6,268
16,676
Retained earnings 22 59,703 53,682 537,871
Equity attributable to
owners of the Company 76,624 75,051
690,306
Non-controlling
interests 1,714 1,736
15,447
Total equity 78,338 76,787 705,754
Total liabilities and equity ¥249,788 ¥244,692 $2,250,348

- 3 -
(ii) Consolidated statement of profit or loss and consolidated statement of other comprehensive
income
Consolidated statement of profit or loss for the year ended December 31, 2018
Millions of yen Thousands of
U.S. dollars
Notes Year ended
December 31, 2018
Year ended
December 31, 2017
Year ended
December 31, 2018
Revenue 24 ¥165,326 ¥140,912 $1,489,425
Cost of sales 9 (108,349) (92,304) (976,119)
Gross profit 56,977 48,608 513,306
Selling, general and
administrative expenses 25 (47,123) (42,218)
(424,536)
Other income 26 805 2,554 7,254
Other expenses 27 (356) (227) (3,208)
Operating profit 10,302 8,718 92,814
Financial income 28 528 493 4,760
Financial costs 29 (1,355) (1,112) (12,209)
Share of profit of
associates and joint
ventures accounted for
using the equity method
13 266 210
2,396
Profit before tax 9,741 8,310 87,762
Income tax expenses 14 (2,146) (3,005) (19,337)
Profit for the year 7,595 5,304 68,425
Profit for the year
attributable to:
Owners of the Company 7,448 5,182 67,104
Non-controlling interests 146 121 1,320
Profit for the year ¥7,595 ¥5,304 $68,425
Earnings per share
(Yen or U.S. dollars):
Yen U.S. dollars
Basic 31 ¥104.63 ¥72.82 $0.94
Diluted 31 ¥97.09 ¥63.97 $0.87

- 4 -
Consolidated statement of other comprehensive income for the year ended December 31, 2018
Millions of yen Thousands of
U.S. dollars
Notes Year ended
December 31, 2018
Year ended
December 31, 2017
Year ended
December 31, 2018
Profit for the year ¥7,595 ¥5,304 $68,425
Other comprehensive
income:
Items that will not be
reclassified subsequently
to profit or loss
Financial assets
measured at fair value
through other
comprehensive income
30 (1,207) 1,674
(10,880)
Remeasurements of
defined benefit pension
plans
30 (39) (70)
(354)
Share of other
comprehensive income
(loss) of associates and
joint ventures
accounted for using the
equity method
30 3 0
27
Total (1,244) 1,603 (11,207)
Items that may be
reclassified subsequently
to profit or loss
Exchange differences
on translation of foreign
operations
30 (2,885) 3,357
(25,996)
Gain (loss) on cash
flow hedges 30 (294) 14
(2,649)
Share of other
comprehensive income
(loss) of associates and
joint ventures
accounted for using the
equity method
30 (59) 31
(540)
Total (3,239) 3,403 (29,186)
Other comprehensive
income, net of tax (4,483) 5,007
(40,394)
Total comprehensive income
for the year 3,111 10,311
28,031
Total comprehensive income
for the year attributable to:
Owners of the Company 2,991 9,717 26,952
Non-controlling interests 119 593 1,078
Total comprehensive income
for the year ¥3,111 ¥10,311
$28,031

- 5 -
(iii) Consolidated statement of changes in equity for the year ended December 31, 2018 Millions of yen
Notes
Equity attributable to owners of the Company
Share capital Capital surplus Treasury shares
Other components of equity
Financial assets
measured at fair
value through
other comprehensive
income
Remeasure-
ments
of defined
benefit pension
plans
Exchange
differences on
translation of
foreign
operations
Balance as of January 1, 2017 ¥6,544 ¥11,103 ¥(2,578) ¥3,754 ¥(1,798)
Profit for the year
Other comprehensive income 30 1,674 ¥(70) 2,917
Total comprehensive income for
the year 1,674 (70) 2,917
Purchase of treasury shares (0)
Disposal of treasury shares 3 35
Dividends 23
Share-based payments (7)
Transfer to retained earnings 70
Total transactions with owners (3) 34 70
Balance as of December 31, 2017 ¥6,544 ¥11,099 ¥(2,543) ¥5,428 ¥1,118
Adjustment resulting from
changing an accounting policy
Balance as of January 1, 2018 ¥6,544 ¥11,099 ¥(2,543) ¥5,428 ¥1,118
Profit for the year
Other comprehensive income 30 (1,204) ¥(39) (2,918)
Total comprehensive income for
the year (1,204) (39) (2,918)
Purchase of treasury shares (0)
Disposal of treasury shares 0 0
Dividends 23
Share-based payments 30
Changes in ownership interests
in a subsidiary (61)
Transfer to retained earnings 39
Total transactions with owners (30) (0) 39
Balance as of December 31, 2018 ¥6,544 ¥11,069 ¥(2,544) ¥4,223 ¥(1,800)

- 6 -
Thousands of
U.S. dollars
Notes
Equity attributable to owners of the Company
Share capital Capital surplus Treasury shares
Other components of equity
Financial assets
measured at fair
value through
other comprehensive
income
Remeasure-
ments
of defined
benefit pension
plans
Exchange
differences on
translation of
foreign
operations
Balance as of December 31, 2017 $58,958 $99,999 $ (22,918) $48,904 $ 10,073
Adjustment resulting from
changing an accounting policy
Balance as of January 1, 2018 $58,958 $99,999 $ (22,918) $48,904 $ 10,073
Profit for the year
Other comprehensive income 30 (10,853) $ (354) (26,294)
Total comprehensive income for
the year
(10,853) (354) (26,294)
Purchase of treasury shares (5)
Disposal of treasury shares 0 0
Dividends 23
Share-based payments 277
Changes in ownership interests
in a subsidiary (552)
Transfer to retained earnings 354
Total transactions with owners (274) (5) 354
Balance as of December 31, 2018 $58,958 99,724 $(22,923) $38,051 $16,221

- 7 -
Millions of yen
Notes
Equity attributable to owners of the Company Non-
controlling
interests
Total equity Other components of equity
Retained earnings
Total Profit (loss) in cash flow hedges
Total
Balance as of January 1, 2017 ¥(292) ¥1,662 ¥49,709 ¥66,441 ¥1,222 ¥67,664
Profit for the year 5,182 5,182 121 5,304
Other comprehensive income 30 14 4,535 4,535 471 5,007
Total comprehensive income for
the year 14 4,535 5,182 9,717 593 10,311
Purchase of treasury shares (0) (0)
Disposal of treasury shares 38 38
Dividends 23 (1,138) (1,138) (80) (1,219)
Share-based payments (7) (7)
Transfer to retained earnings 70 (70)
Total transactions with owners 70 (1,209) (1,108) (80) (1,188)
Balance as of December 31, 2017 ¥(278) ¥6,268 ¥53,682 ¥75,051 ¥1,736 ¥76,787
Adjustment resulting from
changing an accounting policy (248) (248) (248)
Balance as of January 1, 2018 ¥(278) ¥6,268 ¥53,433 ¥74,802 ¥1,736 ¥76,538
Profit for the year 7,448 7,448 146 7,595
Other comprehensive income 30 (294) (4,456) (4,456) (26) (4,483)
Total comprehensive income for
the year (294) (4,456) 7,448 2,991 119 3,111
Purchase of treasury shares (0) (0)
Disposal of treasury shares 0 0
Dividends 23 (1,139) (1,139) (136) (1,275)
Share-based payments 30 30
Changes in ownership interests
in a subsidiary (61) (4) (66)
Transfer to retained earnings 39 (39)
Total transactions with owners 39 (1,178) (1,170) (141) (1,311)
Balance as of December 31, 2018 ¥(572) ¥1,851 ¥59,703 ¥76,624 ¥1,714 ¥78,338
Thousands of
U.S. dollars
Notes
Equity attributable to owners of the Company Non-
controlling
interests
Total equity Other components of equity
Retained
earnings Total Profit (loss) in
cash flow hedges Total
Balance as of December 31, 2017 $(2,504) $56,473 $483,624 $676,137 $15,641 $691,778
Adjustment resulting from
changing an accounting policy (2,241) (2,241) (2,241)
Balance as of January 1, 2018 (2,504) 56,473 481,383 673,896 15,641 689,536
Profit for the year 67,104 67,104 1,320 68.424
Other comprehensive income 30 (2,649) (40,152) (40,152) (242) (40,394)
Total comprehensive income for
the year (2,649) (40,152) 67,104 26,952 1,078 28,030
Purchase of treasury shares (5) (5)
Disposal of treasury shares 0 0
Dividends 23 (10,261) (10,261) (1,228) (11,489)
Share-based payments 277 277
Changes in ownership interests
in a subsidiary (552) (44) (596)
Transfer to retained earnings 354 (354)
Total transactions with owners 354 (10,615) (10,541) (1,272) (11,813)
Balance as of December 31, 2018 $(5,154) $16,676 $537,871 $690,306 $15,447 $705,754

- 8 -
(iv) Consolidated statement of cash flows for the year ended December 31, 2018
Millions of yen Thousands of
U.S. dollars
Notes Year ended
December 31, 2018
Year ended
December 31, 2017
Year ended
December 31, 2018
Operating activities:
Profit before tax ¥9,741 ¥8,310 $87,762
Depreciation and
amortization 6,335 5,246
57,073
Interest and dividend
income (357) (350)
(3,216)
Interest expense 1,074 856 9,683
Exchange difference (59) 612 (535)
Share of profit of
associates and joint
ventures accounted for
using equity method
(266) (210)
(2,396)
Losses (gains) on sale and
disposal of property, plant
and equipment
77 (1,191)
696
Increase in trade and other
receivables (4,791) (5,375)
(43,169)
(Increase) decrease in
inventories (3,661) 2,094
(32,983)
Increase (decrease) in
trade and other payables 5,469 (1,921)
49,276
Decrease in net defined
benefit liabilities (91) (470)
(827)
Other 4,359 2,098 39,274
Subtotal 17,830 9,696 160,637
Interest and dividends
received 422 441
3,803
Interest paid (1,014) (688) (9,137)
Income taxes paid (3,162) (4,534) (28,492)
Net cash generated by
operating activities 14,076 4,915
126,811
Investing activities:
Payments into time
deposits (420) (467)
(3,783)
Proceeds from withdrawal
of time deposits 370 839
3,340
Purchase of property, plant
and equipment (11,959) (5,604)
(107,747)
Proceeds from sale of
property, plant and
equipment
627 1,703
5,655
Purchase of intangible
assets (909) (508)
(8,193)

- 9 -
Millions of yen Thousands of
U.S. dollars
Notes Year ended
December 31, 2018
Year ended
December 31, 2017
Year ended
December 31, 2018
Proceeds from sale of
intangible assets ¥70 ¥9
$639
Purchase of equity
instruments (1,734)
Payments for acquisition
of subsidiaries (42,299)
Payments made for short-
term loans receivable (9) (6)
(87)
Proceeds from collection
of short-term loans
receivable
10 11
98
Payments made for long-
term loans receivable (0) (1)
(2)
Net cash used in investing
activities ¥(12,218) ¥(48,058)
$(110,080)

- 10 -
Millions of yen Thousands of
U.S. dollars
Notes Year ended
December 31, 2018
Year ended
December 31, 2017
Year ended
December 31, 2018
Financing activities:
Proceeds from short-term
borrowings ¥29,778 ¥53,118
$268,272
Repayments of short-term
borrowings (49,055) (13,296)
(441,943)
Repayments of finance
lease obligations (71) (75)
(644)
Proceeds from long-term
borrowings 40,700 16,886
366,666
Redemption of bonds and
repayments of long-term
borrowings
(25,769) (4,398)
(232,157)
Payments for purchase of
treasury shares (0) (0)
(5)
Proceeds from sale of
treasury shares 0
Dividends paid 23 (1,139) (1,138) (10,261)
Dividends paid to non-
controlling interests (136) (80)
(1,228)
Payments for acquisition
of interests in subsidiaries
from non-controlling
interests
(76)
(692)
Net cash generated by/ used
in financing activities 33 (5,771) 51,015
(51,994)
Effects of exchange rate
changes on the balance of
cash and cash equivalents
held in foreign currencies
(911) 302
(8,209)
(Decrease) increase in cash
and cash equivalents (4,825) 8,175
(43,473)
Cash and cash equivalents at
the beginning of the year 6 34,095 25,919
307,164
Cash and cash equivalents at
the end of the year 6 ¥29,269 ¥34,095
$263,691

- 11 -
Notes to Consolidated Financial Statements
1. Reporting Entity
NIKKISO CO., LTD. (the “Company”) is a corporation located in Japan. Information on the registered
head office of the Company is made available in Japanese on the corporate website
(https://www.nikkiso.co.jp/). The Company and domestic and overseas consolidated subsidiaries
(collectively the “Group”) engage in business activities in two segments, the Industrial Business and
Medical Business. The Industrial Business is categorized into the Industrial Division, Precision
Equipment Business Division, Aerospace Division, and the Deep Ultraviolet LED Division. The
Medical Business consists of the Medical Division only. Each of the divisions manufactures, sells, and
performs maintenance on the Company’s products in Japan and overseas.
The Company’s consolidated financial statements incorporate the Group’s interests in the Group and its
associates. The end of the fiscal year is December 31.
2. Basis for Preparation
(1) Compliance with International Financial Reporting Standards (“IFRS”)
The Company prepares its consolidated financial statements in conformity with IFRS, established
by the International Accounting Standards Board.
To conform to IFRS, the accompanying consolidated financial statements have been prepared by
making certain adjustments to the financial statements of the Company and its subsidiaries, which
have been prepared in accordance with the accounting principles prevailing in their countries of
incorporation.
The Company’s consolidated financial statements were approved on March 28, 2019 by Toshihiko
Kai, President and Chief Executive Officer.
(2) Basis of measurement
The consolidated financial statements have been prepared based on historical cost, except for
financial instruments measured at fair values as described in Note “3. Significant Accounting
Policies.”
(3) Functional currency and presentation currency
These consolidated financial statements are presented in Japanese yen, which is the Company’s
functional currency, and figures are rounded to the nearest million yen.
The translation of Japanese yen amounts into U.S. dollar amounts for the year ended December
31, 2018 is included solely for the convenience of readers outside Japan and has been made at the
rate of ¥111 to $1, the approximate rate of exchange at December 31, 2018. Such translations
should not be construed as representations that the Japanese yen amounts could be converted into
U.S. dollars at that or any other rate.
(4) Significant accounting judgments, estimates, and assumptions
In preparing the consolidated financial statements in accordance with IFRS, management makes
judgments, estimates, and assumptions that affect the application of accounting policies and
reporting amounts of assets, liabilities, revenue, and expenses. Actual results may differ from
those estimates. The estimates and underlying assumptions are reviewed on an ongoing basis. The
effects of revisions on accounting estimates are recognized in the period in which the estimate is
revised and in future periods. Among the items for which estimates and judgments have been
made, the items which significantly affect the amounts in the Company’s consolidated financial
statements for the year and thereafter are as follows:

- 12 -
Scope of consolidation – Note “3. Significant Accounting Policies, (1) Basis of consolidation”
Revenue recognition – Note “3. Significant Accounting Policies, (14) Revenue”
Impairment of non-financial assets – Note “3. Significant Accounting Policies, (10)
Impairment of non-financial assets” and Note “12. Goodwill and Intangible Assets”
Recoverability of deferred tax assets – Note “14. Income Taxes”
Accounting and evaluation for provisions – Note “19. Provisions”
Determination of defined benefit obligations – Note “21. Employee Benefits”
Measurement of fair value of financial instruments – Note “33. Financial instruments”
(5) Early adoption of new accounting standards
Not applicable
3. Significant Accounting Policies
(1) Basis of consolidation
(i) Subsidiaries
A subsidiary is an entity controlled by the Group. Whether the Group controls an entity is
determined by whether the Group is exposed, or has rights, to returns that vary as a result of
the entity’s operating performance and has the ability to affect those returns through its power
over the entity, based on comprehensive consideration of various elements indicative of
possible control, including not only ownership of voting rights but also the existence of
substantively exercisable potential voting rights and whether corporate officers and/or
employees dispatched to the entity from the Company or its subsidiaries constitute a majority
of the entity’s board of directors.
Subsidiaries’ financial statements are consolidated into the Group’s consolidated financial
statements from the date of acquisition of control to the date of loss of control.
Transactions that result in changes in the Group’s ownership interest in a subsidiary are
accounted for as equity transactions if the Group retains control of the subsidiary. Differences
between adjustments of non-controlling interests and the fair value of consideration paid or
received are recognized directly in equity and attributed to the Group.
If accounting policies applied by a subsidiary differ from those applied by the Group, the
Group adjusts the subsidiary’s financial statements as necessary. If a subsidiary’s reporting
date differs from the consolidated reporting date, the subsidiary prepares separate financial
statements as of the consolidated reporting date for the purpose of preparing the Group’s
consolidated financial statements.
Intragroup balances, intragroup transactions, and unrealized gains/losses on intragroup
transactions are eliminated in the consolidated financial statements. Comprehensive income is
attributed to owners of the parent and non-controlling interests even if this results in the non-
controlling interests having a deficit balance.

- 13 -
(ii) Associates and joint ventures
An associate is an entity over whose financial and operating policies the Group has significant
influence but does not control. The Group determines whether it has significant influence
based on comprehensive consideration of various elements, including not only ownership of
voting rights but also the existence of substantively exercisable potential voting rights and the
percentage of the seats on the entity’s board of directors held by corporate officers and/or
employees dispatched to the entity from the Company or its subsidiaries.
A joint venture is an arrangement over which multiple parties, including the Group, share
contractually agreed upon control, wherein decisions regarding relevant activities require the
unanimous consent of the parties sharing control and the Group has rights to the
arrangement’s net assets.
Investments in associates and joint ventures are accounted for using the equity method. The
Group amends associates and joint ventures’ accounting policies as necessary to harmonize
them with accounting policies applied by the Group.
The Group’s consolidated financial statements include investments in an associate with a
fiscal year-end that differs from the consolidated fiscal year-end because relationships with
co-shareholders, among other factors, render synchronization of fiscal year-ends impractical.
The Group makes adjustments as necessary for significant transactions and events that occur
between its fiscal year-end and the associate’s fiscal year-end. Said associate’s fiscal year-end
is March 31.
Equity-method investments are initially measured at cost; their investment carrying amounts
are subsequently adjusted in response to post-acquisition changes in the Group’s pro-rata
share of associates and joint ventures’ net assets. When adjusting carrying amounts, the Group
recognizes its pro-rata share of associates’ and joint ventures’ profit or loss in its own profit or
loss. Additionally, the Group recognizes its pro-rata share of associates’ and joint ventures’
other comprehensive income in its own other comprehensive income. The Group recognizes
its pro-rata share of associates’ and joint ventures’ losses in its own profit or loss to the extent
that any such losses do not exceed the investment’s carrying amount. Any losses in excess of
the carrying amount are recognized only to the extent that the Group is legally or
constructively obligated to bear the losses or make payments on behalf of the associate or
joint venture.
Profits derived from significant intergroup transactions are eliminated to the extent of the
Group’s interest in the involved associate or joint venture.
The Group recognizes goodwill to the extent that the consideration it exchanged to acquire its
interest in an associate or joint venture exceeds the net fair value of the assets and liabilities
recognized on the associate or joint venture’s acquisition date. The goodwill is included in the
investment’s carrying amount and not amortized.

- 14 -
(2) Business combinations
Business combinations are accounted for using the acquisition method. Acquisition consideration
is measured as the sum of the acquisition-date fair value of assets transferred, liabilities assumed
and equity issued by the Company in exchange for control of the acquiree. The acquiree’s
identifiable assets and liabilities are measured at fair value at the acquisition date. Acquisition-
related costs are expensed. Any excess of acquisition consideration over the identifiable assets’
and liabilities’ net fair value is recognized as goodwill. Conversely, if the acquisition
consideration is less than the identifiable assets’ and liabilities’ net fair value, the difference is
immediately recognized in profit or loss.
Non-controlling interests are measured as their pro-rata shares of the difference between the
acquiree’s identifiable assets and liabilities. Follow-on acquisitions of non-controlling interests
are accounted for as equity transactions. Accordingly, no goodwill is recognized in conjunction
with such transactions.
If a business combination’s initial accounting is not complete by the business combination’s
reporting date, the Group reports provisional values for items not yet finalized. The provisional
values recognized at the acquisition date are retrospectively adjusted to reflect new information
obtained during a certain designated period (the “measurement period”) on facts and
circumstances that existed at the acquisition date and, if known at the acquisition date, would have
affected the measurement of the amounts recognized. When such newly obtained information
gives rise to recognition of previously unrecognized assets and/or liabilities, the Group recognizes
the additional assets and/or liabilities. The measurement period may not exceed one year.
Business combinations under common control (i.e., transactions in which all of the combining
entities and/or businesses are ultimately controlled by the same party or parties both before and
after the business combination and the common control is not transitory) are accounted for at book
value.
(3) Foreign currency translation
Group companies’ financial statements are prepared in the currency of the primary economic
environment in which they operate (functional currency). Transactions in currencies other than
their respective functional currencies (foreign currencies) are translated to the functional currency
using the exchange rate prevailing at or near the transaction date.
Monetary items denominated in foreign currencies are translated using the exchange rate
prevailing at the reporting date. Non-monetary items denominated in foreign currencies are
translated at transaction-date exchange rates if measured at historical cost and at measurement-
date exchange rates if measured at fair value. Exchange differences arising from translation or
settlement are recognized in profit or loss.
The consolidated financial statements are prepared in Japanese yen, the Company’s functional
currency and the consolidated financial statements’ presentation currency. Foreign operations’
assets and liabilities are translated to Japanese yen for presentation in the consolidated financial
statements using reporting-date exchange rates; their income and expenses are translated at
period-average exchange rates, except when the exchange rate varies significantly during the
period. Any currency translation differences are recognized in other comprehensive income and
accumulated in a separate component of other components of equity.

- 15 -
In the event of loss of control or significant influence over foreign operations, the cumulative
amount of currency translation differences associated with those operations is recognized in profit
or loss in the reporting period during which the loss of control or significant influence occurred.
Goodwill and fair value adjustments that arise due to acquisition of foreign operations are
translated to the presentation currency as assets and/or liabilities of the foreign operations as of the
end of the reporting period. Any resultant currency translation differences are classified in other
components of equity.
(4) Financial instruments
(i) Financial assets
1) Initial recognition and measurement
The Group classifies non-derivative financial assets as either financial assets measured at
amortized cost or financial assets measured at fair value and designates the financial
assets’ classification at the time of initial recognition. Financial assets measured at
amortized cost are initially recognized on the date the Group becomes a party to the
financial asset’s contractual provisions; other financial assets are initially recognized on
their transaction date.
Financial assets that meet the following conditions at the time of initial recognition are
classified as financial assets measured at amortized cost and initially measured at fair
value plus any transaction costs directly incurred in acquiring them.
The financial asset is held pursuant to a business model with the objective of holding
assets to collect contractual cash flows.
The financial asset’s contractual terms give rise on specified dates to cash flows that
are solely payments of principal and interest on the principal amount outstanding.
Except for said financial assets measured at amortized cost, financial assets are classified
as equity instruments measured at fair value through other comprehensive income
(FVTOCI) or financial assets measured at fair value through profit or loss (FVTPL). The
Group irrevocably elects to measure FVTOCI-designated equity instruments at fair value
and recognizes changes in their carrying amounts through other comprehensive income.
Financial assets that are neither equity instruments nor meet the requirements for
measurement at amortized cost are measured at fair value with changes in their fair value
recognized through profit or loss.
Equity instruments measured at FVTOCI are initially measured at fair value plus
transaction costs directly incurred in acquiring them. Financial assets measured at FVTPL
are measured at fair value when initially recognized and transaction costs are recognized
in profit or loss when incurred.

- 16 -
2) Subsequent measurement
Financial assets measured at amortized cost are measured using the effective interest
method. Amounts amortized by the effective interest method and gains and losses on
derecognition are recognized in profit or loss.
Gains or losses on the disposal, or changes in the fair value, of equity instruments
measured at FVTOCI are recognized in other comprehensive income. Upon derecognition
of an equity instrument, the cumulative net change in its fair value included in other
components of equity is directly transferred to retained earnings. Dividends on equity
instruments are recognized in profit or loss when the right to their receipt is established.
Gains or losses on the disposal, or changes in the fair value, of financial assets measured
at FVTPL are recognized in profit or loss.
3) Impairment of financial assets measured at amortized cost
To account for impairment of financial assets and others measured at amortized cost, the
Group recognizes impairment losses for expected credit losses on such financial assets.
At every fiscal year-end, the Group evaluates whether credit risk associated with financial
instruments has increased significantly since initial recognition. If the credit risk
associated with financial instruments has not increased significantly since initial
recognition, the Group measures the impairment losses for those financial instruments at
the equivalent of 12 months of expected credit losses. The impairment losses for credit-
impaired financial instruments, defined as financial instruments whose credit risk has
increased significantly since initial recognition and are deemed wholly or partially
unrecoverable or infeasible to recover, is measured at the equivalent of the assets’ lifetime
expected credit losses.
However, the impairment losses for trade receivables and the like are always measured at
the equivalent of lifetime expected credit losses.
Expected credit losses on financial instruments are estimated by methods that reflect:
Significant changes in a financial asset’s external credit rating(s);
Internal credit rating downgrades;
Deterioration in the debtor’s operating performance; and
Past-due information.
Among financial assets measured at amortized cost, for trade receivables, future expected
credit losses are estimated in view of historical data on the percentage of expected credit
losses actually incurred on similar receivables, and others.
Impairment losses on such financial assets are recognized in profit or loss. In the event of
a reduction in accumulated impairment losses, the impairment losses are reversed into
profit or loss to the extent of the reduction.

- 17 -
4) Derecognition
The Group derecognizes financial assets when the contractual rights to the cash flows
from the financial assets expire, or when substantially all the risks and rewards of
ownership of the financial assets transfer.
(ii) Financial liabilities
1) Initial recognition and measurement
The Group classifies financial liabilities as financial liabilities measured at amortized
cost, except for derivatives, and measures them at initial recognition by deducting
transaction costs directly attributable to the issuance from the fair value.
2) Subsequent measurement
After initial recognition, financial liabilities are measured at amortized cost using the
effective interest method. Amortized cost using the effective interest method and
derecognized gains and losses are recognized in profit of loss.
3) Derecognition
The Group derecognizes financial liabilities at the time the obligation specified in contract
ceases (i.e., the obligation is discharged, canceled, or expired).
(iii) Hedge accounting and derivatives
The Group utilizes derivatives such as currency swaps, interest rate swaps, and forward
currency contracts to hedge interest rate risks and foreign exchange risks. These derivatives
are initially measured at fair value when the contract is entered into, and are subsequently
remeasured at fair value as of the end of the reporting period.
Derivatives held by the Group for hedging purposes may include some that do not meet hedge
accounting requirements. All changes in these non-compliant derivatives’ fair values are
immediately recognized in profit or loss.
The Group only uses cash flow hedges as a hedge accounting method. The effective portion of
gains or losses on hedging instruments is recognized in other comprehensive income; the
ineffective portion is immediately recognized in profit or loss. A hedging instrument’s net
cumulative gain or loss recognized in other comprehensive income is transferred to profit or
loss when the hedged transaction affects profit or loss.
When a hedge accounted for using hedge accounting ceases to meet hedge accounting
requirements, or when a hedging instrument expires or is sold, terminated, or exercised, or
when a hedge designation is revoked, application of hedge accounting is prospectively
discontinued for the hedge in question.
(iv) Compound financial instruments
The liability component of bonds issued by the Company with stock acquisition rights
convertible into the Company’s ordinary shares at their holder’s election (the “convertible
bonds”) is initially recognized at fair value as implied by the fair value of similar debt
instruments without an equity conversion option. The convertible bonds’ equity component is
initially recognized as the difference between their total fair value and their liability
component’s fair value.
After initial recognition, the liability component is measured at amortized cost using the
effective interest method; the equity component is not remeasured after initial recognition.

- 18 -
(5) Cash and cash equivalents
Cash and cash equivalents consist of cash on hand, demand deposits, and short-term investments
that are readily convertible to known amounts of cash, subject to insignificant risk of change in
value and due within three months from the date of acquisition.
(6) Inventories
Inventories are stated at the lower of cost or net realizable value. Inventories include costs of
purchase, costs of conversion, and other costs incurred in bringing the inventories to their present
location and condition, and historical cost includes borrowing costs eligible for capitalization.
Historical cost is determined at cost mainly by using the moving-average method. Finished goods
and work in progress in the Industrial Division are stated at cost determined by the identified cost
method.
Net realizable value represents the estimated selling price in the ordinary course of business less
the estimated costs of completion and estimated costs necessary to make the sale.
(7) Property, plant and equipment
The Group uses a cost model to measure property, plant and equipment, which are carried at
historical cost less accumulated depreciation and accumulated impairment losses.
Historical cost includes costs directly related to an asset’s acquisition, site restoration costs related
to the asset’s dismantlement and/or removal and borrowing costs eligible for capitalization. When
multiple different significant components can be identified in a unit of property, plant and
equipment, each component is accounted for as a separate item of property, plant and equipment.
Property, plant and equipment are derecognized upon their disposal or when no further economic
benefit is expected to be derived from their use or disposal. Gains or losses on derecognition of
property, plant and equipment are measured as the difference between their net disposal proceeds
and carrying amount, and recognized in profit or loss at the time of derecognition.
Items of property, plant and equipment other than land and construction in progress are mostly
depreciated by the straight-line method over their respective estimated useful lives. Estimated
useful lives for major asset categories are as follows:
Buildings and structures: 3 to 50 years
Machinery and vehicles: 4 to 8 years
The estimated useful lives, residual values, and depreciation method are reviewed at each fiscal
year-end. If there are any changes made to the estimated useful lives, residual values, or
depreciation method, such changes are accounted for as changes in accounting estimates and
applied prospectively.
(8) Goodwill and intangible assets
(i) Goodwill
Goodwill arising from business combinations is recorded as intangible assets. Goodwill
measurements at initial recognition are presented in Note “3. Significant Accounting Policies,
(2) Business combinations.”
Goodwill is not amortized and is tested for impairment each fiscal year, or whenever there is
any indication of impairment. Impairment tests for goodwill and measurements for
impairment losses are presented in Note “3. Significant Accounting Policies, (10) Impairment
of non-financial assets.” Impairment losses on goodwill are recognized in profit or loss and

- 19 -
are not reversed in subsequent periods. Goodwill is recorded at cost less accumulated
impairment losses.
On disposal of a cash-generating unit (“CGU”), the amount of allotted goodwill is included in
the calculation of profit or loss on disposal.
(ii) Intangible assets
Intangible assets with finite useful lives are carried at historical cost less accumulated
amortization and accumulated cumulative impairment losses.
Intangible assets are amortized based on the straight-line method in accordance with their
estimated useful lives. The estimated useful lives of major intangible assets are as follows:
Customer-related assets: 7 to 10 years
Technological assets: 7 to 17 years
Software: 5 years
The estimated useful lives, residual values, and amortization method are reviewed at each
fiscal year-end. If there are any changes made to the estimated useful lives, residual values, or
the amortization method, such changes are accounted for as changes in accounting estimates
and applied prospectively.
Intangible assets acquired separately with indefinite useful lives are not amortized, but are
tested for impairment and carried at historical cost less accumulated impairment losses.
Impairment tests are performed individually or in CGUs in each fiscal year or whenever there
is any indication of impairment.
(iii) Internally-generated intangible assets
Expenditures on research activities are recognized in profit or loss in the fiscal year in which
they are incurred.
Internally-generated intangible assets arising from development (or from the development
phase of an internal project) are recognized if, and only if, all of the following have been
demonstrated:
The technical feasibility of completing the intangible asset so that it will be available for
use or sale;
The Company’s intention to complete the intangible asset and use or sell it;
The ability to use or sell the intangible asset;
How the intangible asset will generate probable future economic benefits;
The availability of adequate technical, financial, and other resources to complete the
development and to use or sell the intangible asset; and
The ability to measure reliably the expenditure attributable to the intangible asset during
its development.
The amount initially recognized for internally-generated intangible assets is the sum of the
expenses incurred from the date when the intangible assets first meet all of the recognition
criteria listed above to completion of development. Where no internally-generated intangible
asset can be recognized, development costs are recognized as profit or loss in the fiscal year
in which they are incurred. After initial recognition, internally-generated intangible assets are
recorded at amount less accumulated amortization and accumulated impairment losses from
acquisition cost.

- 20 -
(9) Leases
A finance lease is a lease that transfers substantially all the risks and rewards incidental to
ownership of an asset to the lessee. An operating lease is a lease other than a finance lease.
Determination of whether an arrangement is, or contains, a lease is based on the substance of the
arrangement, even if the arrangement does not take the legal form of a lease.
Leased assets and lease obligations through finance lease transactions are recognized at the lower
of the fair value of the leased property or the present value of the minimum lease payments, each
determined at the initial date of the lease terms. Leased assets are depreciated by using the
straight-line method based on the accounting policies applied to said assets.
Leased assets are derecognized upon their disposal or when no further economic benefit is
expected to be derived from their use or disposal. Gains or losses on derecognition of leased
assets are measured as the difference between their net disposal proceeds and carrying amount,
and recognized in profit or loss at the time of derecognition.
The amount of lease payments from operating lease transactions is recognized as an expense by
using the straight-line method over the lease terms.
(10) Impairment of non-financial assets
At every fiscal year-end, the Group assesses its non-financial assets’ carrying amounts for
indications of impairment. When indications of impairment exist, the Group estimates the
recoverable value of the asset in question. For goodwill and intangible assets with an indefinite
useful life, recoverable value is estimated annually, at the same time of year, even in the absence
of indications of impairment.
The recoverable value of assets and CGUs is the greater of their value in use or their fair value
less costs to sell. Value in use is measured as estimated future cash flows discounted to present
value using a pre-tax discount rate that reflects the time value of money and risks specific to the
asset in question.
Assets not individually tested for impairment are grouped into the smallest CGUs that, through
ongoing use of their assets, generate cash inflows largely independent of cash inflows from other
assets or asset groups. When conducting goodwill impairment tests, CGUs to which goodwill is
allocated are aggregated so that the goodwill testing reflects the smallest goodwill-related units.
Goodwill acquired through business combinations is allocated to CGUs expected to benefit from
synergies arising from the combination.
The Group’s corporate assets do not generate independent cash inflows. In the event of
indications of impairment of corporate assets, the Group estimates the recoverable value of the
CGU to which the corporate assets belong.
An impairment loss is recognized in profit or loss when the carrying amount of an asset or a CGU
exceeds its estimated recoverable value. Impairment losses recognized with respect to a CGU are
allocated to specific assets by first reducing the carrying amount of any goodwill allocated to the
CGU and then reducing the carrying amounts of other assets in the CGU on a pro-rata basis.
Goodwill impairment losses are not reversed, but other assets against which impairment losses
were previously recognized are assessed at every fiscal year-end for indications that their
impairment losses have decreased or ceased to exist. The impairment losses are reversed if the
estimates used to determine recoverable value have changed. Impairment losses are reversed up to
a maximum of the amount that restores the asset’s carrying amount, net of any required

- 21 -
depreciation or amortization, to what it would have been had the impairment loss not been
recognized.
(11) Non-current assets held for sale
An asset or asset group which is expected to be recovered through a sale transaction rather than
through continued use is classified as a non-current asset or disposal group held for sale if it is
highly probable that the asset or asset group will be sold within one year and the asset or asset
group is available for immediate sale in its present condition and the management of the Group is
committed to such sale. In such cases, non-current assets are neither depreciated nor amortized,
and are measured at carrying amount or fair value less cost of sales, whichever is lower.
(12) Provisions
Provisions are recognized when a present legal or constructive obligation exists as the result of a
past event, an outflow of resources embodying economic benefits will likely be required for the
Group to settle the obligation, and the amount of the obligation can be reliably estimated. When
the effect of the time value of money is significant, provisions are measured at the present value
of estimated future cash flows discounted using a pre-tax discount rate that reflects the time value
of money and the current market assessment of risks specific to the liability in question. Discounts
are recognized as finance costs as they unwind over time.
(13) Employee benefits
(i) Post-employment benefits
The Group has adopted defined benefit pension plans and defined contribution plans.
The Company and certain subsidiaries have established defined benefit retirement pension
plans and lump-sum retirement benefit plans.
Liabilities associated with retirement benefit pension plans are measured at the present value
of defined benefit plan obligations less the fair value of the plans’ assets to be used to settle
those liabilities.
Defined benefit obligation is measured on a plan-by-plan basis as the present value of
estimated future benefits payable as compensation for employees’ services rendered in prior
fiscal years and the current fiscal year. They are measured annually by a pension actuary
using the projected unit credit method. As a discount rate, the Group uses the fiscal-year-end
yield of a high-quality corporate bond with a maturity approximately equivalent to the
duration of the Group’s defined benefit obligation. Past service cost is recognized in profit or
loss when incurred.
Service costs and net interest on net defined benefit liabilities are recognized in profit or loss
in the reporting period incurred.
Remeasurements of net defined benefit liabilities are recognized in other comprehensive
income and transferred from other components of equity to retained earnings when they
occur.
The Company and certain subsidiaries have established defined contribution plans. Employer
contributions to defined contribution plans are recognized as expenses in the reporting period
in which the beneficiary employees rendered services.

- 22 -
(ii) Other long-term employee benefits
For other long-term employee benefit plans, the Group measures benefit obligations by
estimating future benefits based on the plan arrangements and discounting the estimate to
present value if the Group has a present constructive obligation to pay benefits contingent on
satisfaction of certain conditions and the amount of said benefits can be reliably estimated. As
a discount rate, the Group uses the fiscal-year-end yield of a high-quality corporate bond with
a maturity approximately equivalent to the duration of the Company’s obligations.
(iii) Short-term employee benefits
Short-term employee benefits are recognized undiscounted as expenses when the services that
entitle employees to the benefits are rendered.
For bonuses, the Group recognizes a liability in the estimated amount to be paid based on the
bonus arrangements if the Group has a present legal or constructive obligation to pay the
bonuses as a result of labor previously provided by employees and the amount payable can be
reliably estimated.
(14) Revenue
Based on the following five-step approach, the Group recognizes revenue at the amount that
reflects consideration to which the Group expects to be entitled in exchange for transferring goods
or services to a customer.
Step 1: Identify the contract(s) with a customer
Step 2: Identify the performance obligations in the contract
Step 3: Determine the transaction price
Step 4: Allocate the transaction price to the separate performance obligations in the contract
Step 5: Recognize revenue when (or as) the entity satisfies a performance obligation
As for its products, etc., that the Group has promised to deliver to a customer, the time when the
customer is deemed to obtain control of the product, etc., in light of contractual terms and
conditions is the timing of satisfaction of a performance obligation in the contract, and the Group
recognizes revenue at the time of arrival of the product at the customer’s location or the time of
acceptance inspection, or based on terms and conditions of trade and others. In addition, the
Group may provide services related to these products, including maintenance and operation, to
customers. Because performance obligations for these services are basically satisfied over time,
revenue from them is recorded in proportion to the contractual period. Certain infrastructure,
systems, etc. are individually made to order based on unique specifications designated by
customers. Performance obligations for these products are satisfied as the production progresses.
When the outcome of the performance obligation can be reasonably measured, revenue is
recorded in accordance with the proportion of cost actually incurred to the estimated total cost.
When the outcome of the performance obligation cannot be reasonably measured, revenue is
recorded only to the extent of cost incurred.
(15) Government grants
The Group measures and recognizes government grant revenue at fair value if there is reasonable
assurance that the Group will comply with the grant’s conditions and receive the grant.
Government grants that compensate for expenses already incurred are recognized as revenue in
the same reporting period in which the expenses were incurred. Government grants that subsidize

- 23 -
acquisition of an asset are deducted from the asset’s acquisition cost in measuring the asset’s
carrying amount.
(16) Income taxes
Income tax expense represents the sum of current income taxes and deferred income taxes.
Income taxes are recognized in profit or loss, except for taxes arising from business combinations,
and taxes arising from items that are recognized directly in equity or other comprehensive income.
Current income taxes are measured at the amount expected to be recovered from or paid to the
taxation authorities. The amount of taxes is calculated based on the tax rates and tax laws that are
enacted or substantively enacted at the end of the fiscal year.
Deferred income taxes are recognized on temporary differences between assets and liabilities’ tax
bases and carrying amounts at the end of the reporting period. Deferred tax assets are recognized
for deductible temporary differences, unused deferred tax credits, and unused tax losses to the
extent of the probable availability of taxable profits against which the deferred tax assets can be
recovered. Deferred tax liabilities are, as a general rule, recognized for taxable temporary
differences. Deferred tax assets and liabilities are not recognized for:
temporary differences arising from initial recognition of goodwill;
temporary differences arising from initial recognition of an asset or liability in conjunction
with a transaction that is not a business combination and has no effect on either accounting
profit or taxable profit (or loss) at the time of the transaction;
deductible temporary differences related to an investment in a subsidiary, an associate, or a
joint venture interest if there is a low probability of the temporary difference reversing in the
foreseeable future or of sufficient taxable profits being available to utilize the temporary
difference; and
taxable temporary differences related to an investment in a subsidiary, an associate, or a joint
venture interest if the timing of the temporary difference’s reversal is within the Group’s
control and the temporary difference has a low probability of reversing in the foreseeable
future.
Deferred tax assets and liabilities are measured at the tax rates that are expected to apply to the
fiscal year when the asset is realized or the liability is settled, based on tax rates that have been
enacted or substantively enacted by the end of the reporting period.
Deferred tax assets are reviewed at the end of every reporting period and reduced to the extent
that it is no longer probable that sufficient taxable profits will be available to allow part or all of
the deferred tax asset to be utilized. Unrecognized deferred tax assets are reviewed at the end of
every reporting period and recognized to the extent that their recovery against future taxable
profits has become probable.
For uncertain income tax positions, the Group recognizes an asset or a liability in a reasonably
estimated amount if the tax position has a high probability of being accepted based on a tax law
interpretation.
The Group offsets deferred tax assets and deferred tax liabilities against each other when it has a
legally enforceable right to set off current tax assets and current tax liabilities against each other
and when the taxes in question are levied by the same taxation authority on the same taxable
entity.

- 24 -
(17) Equity
(i) Ordinary shares
With regard to equity instruments issued by the Company, the issuance value is recorded in
share capital and capital surplus, and costs directly attributable to the issue of equity
instruments (after tax effect) are deducted from capital surplus.
(ii) Treasury shares
When the Group acquires treasury shares, it recognizes the after-tax consideration paid,
including direct transaction costs, as a deduction from equity. Any gain or loss on the sale of
treasury shares, including treasury shares disposed of in conjunction with the exercise of stock
options, is recognized as capital surplus.
(18) Fair value measurement
Certain assets and liabilities are required to be recorded at fair value. The fair value of said assets
and liabilities is determined based on market information, such as market price, and calculation
procedure, including market approach, income approach, and cost approach. The input
information used to measure fair value is classified into the following three levels.
(i) Level 1
Market prices of identical assets or liabilities in an active market (a market in which
transactions for the asset or liability take place with sufficient frequency and volume on an
ongoing basis) accessible to the Group at the measurement date are used without adjustment.
(ii) Level 2
Inputs include quoted prices for similar assets or liabilities in active markets, quoted prices for
identical assets or liabilities in inactive markets, inputs other than quoted prices that are
observable for the asset or liability, and inputs that are derived principally from or
corroborated by observable market data by correlation or other means.
(iii) Level 3
When sufficient market data are not available, the Group uses unobservable inputs that reflect
its judgment regarding assumptions used by market participants in pricing assets and
liabilities. The Group measures said inputs based on the best available information, including
its own data.
Transfers of assets and liabilities between levels of the fair value hierarchy are recognized as
if they occurred at fiscal year-end.
(19) Share-based payments
The Group has adopted an equity-settled share-based payment plan as a stock compensation plan.
Services received in exchange for equity-settled share-based payments and the corresponding
increase in equity are measured at the grant-date fair value of the equity instruments involved in
the transaction. The measured value of the services is recognized as an expense and an equivalent
amount is recognized as an increase in equity.

- 25 -
(20) Earnings per share
Basic earnings per share are calculated by dividing profit/loss for the year attributable to owners
of the parent by the weighted-average number of issued ordinary shares less treasury shares
during the fiscal year.
Diluted earnings per share are calculated by adjusting profit for the year attributable to owners of
the parent and the weighted-average number of issued ordinary shares less treasury shares as if all
dilutive potential shares have hypothetically been converted.
(21) Changes in accounting policies
The Group has adopted IFRS 15 “Revenue from Contracts with Customers” (issued in May 2014)
and “Clarifications to IFRS 15” (issued in April 2016) (hereinafter, “IFRS 15” collectively), from
the fiscal year ended December 31, 2018.
The Group has applied IFRS 15 retrospectively in accordance with the transitional provisions and
recognized the cumulative effect from initial application as an adjustment to the beginning
balance of retained earnings.
In line with the application of IFRS 15, based on the following five-step approach, the Group
recognizes revenue at the amount that reflects consideration to which the Group expects to be
entitled in exchange for transferring goods or services to a customer.
Step 1: Identify the contract(s) with a customer
Step 2: Identify the performance obligations in the contract
Step 3: Determine the transaction price
Step 4: Allocate the transaction price to the separate performance obligations in the contract
Step 5: Recognize revenue when (or as) the entity satisfies a performance obligation
As for its products, etc. that the Group has promised to deliver to a customer, the time when the
customer is deemed to obtain control of the product, etc. in light of contractual terms and
conditions is the timing of satisfaction of a performance obligation in the contract, and the Group
recognizes revenue at the time of arrival of the product at the customer or the time of acceptance
inspection, or based on terms and conditions of trade and others. In addition, the Group may
provide services related to these products, including maintenance and operation, to customers.
Because performance obligations for these services are basically satisfied over time, revenue from
them is recorded in proportion to the contractual period. Certain infrastructure, systems, etc. are
individually made to order based on unique specifications designated by customers. Performance
obligations for these products are satisfied as the production progresses. When the outcome of the
performance obligation can be reasonably measured, revenue is recorded in accordance with the
proportion of cost actually incurred to the estimated total cost. When the outcome of the
performance obligation cannot be reasonably measured, revenue is recorded only to the extent of
cost incurred.
The effects of adopting IFRS 15 on the Company’s consolidated financial statements are
insignificant.
4. New Accounting Standards Not Yet Adopted
New accounting standards, interpretations, and amended standards have been issued mainly as follows
by the date of approval of the Group’s consolidated financial statements. The Group has not early
adopted these standards.

- 26 -
IFRS Name of standard
Mandatory
adoption (from the
fiscal year
beginning on or
after)
To be adopted by
the Group
Description of new standards
and amendments
IFRS 16 Leases January 1, 2019 Fiscal year ending
December 31, 2019
New requirements in
accounting for lease contracts
Due to the application of IFRS 16, a single accounting model under which leases are recognized on
balance sheet will be introduced. With regard to operating leases, which the Group, as the lessee, has
conventionally accounted for over the lease period using the straight-line method, this requires the
Group to recognize right-of-use assets that represent rights to use underlying assets and lease liabilities
that represent obligations to make lease payments.
In addition, since depreciation of right-of-use assets and interest expenses on lease liabilities are to be
recognized, the nature of expenses related to these leases will be changed.
Based on currently available information, the Group estimates that right-of-use assets of ¥13,245
million and lease liabilities of ¥12,837 million will be additionally recognized in the consolidated
statement of financial position as of January 1, 2019. These estimated amounts may be changed
because the Group has not completed internal control testing and assessment for the new IT system.
The Group plans to apply IFRS 16 on January 1, 2019 using the modified retrospective approach and
recognize cumulative effect of the application as an adjustment to the beginning balance of retained
earnings as of January 1, 2019.

- 27 -
5. Segment Information
(1) Reportable segments outline
The Group’s reportable segments are Group components for which separate financial information
is available which is evaluated regularly by management in deciding how to allocate management
resources and in assessing performance.
The Group has two reportable segments, the Industrial Business and Medical Business, based
largely on product manufacturing methods or processes and methods of providing services.
The reportable segments’ operations are summarized as follows:
Industrial Business
Manufacturing, sales, and maintenance of specialty industrial pumps, mainly non-leakage pumps
(Non-Seal Pump), precision metering pumps (LEWA Group products, Milflow Pump), high-speed
centrifugal pumps (Sundyne Pump), and cryogenic pumps used for pumping liquefied natural gas
(LNG) (Nikkiso cryogenic pumps, ACD LNG pumps), etc.; manufacturing, sales, and
maintenance of various industrial water conditioning systems, mainly for thermal and nuclear
power plants, system products that combine water conditioning systems with automation and/or
other functions, warm laminating systems and other electronic component manufacturing
equipment, particle size distribution analyzers, and specific surface area analyzers, etc.;
manufacturing and sales of carbon fiber reinforced plastic products for various civilian aircraft;
and manufacturing and sales of deep ultraviolet LEDs and related products.
Medical Business
Manufacturing, sales, and maintenance of products and medical supplies for hemodialysis,
peritoneal dialysis, and continuous renal replacement therapy, including dialysis systems,
dialyzers, blood tubing lines, and powder-type dialysate; blood glucose controllers (artificial
pancreases); and microwave surgical instrument.
(2) Segment revenues and performance
Information by the reportable of segment is as follows. Reportable segments’ accounting policies
are identical to the Group’s accounting policies disclosed in Note “3. Significant Accounting
Policies.”

- 28 -
Year ended December 31, 2017
Millions of yen
Reportable segment
Reconciliations
(Note 1)
Per consolidated
financial
statements
(Note 2)
Industrial
Business
Medical
Business Total
Revenue
Revenue from external
customers ¥85,228 ¥55,684 ¥140,912 ¥140,912
Intersegment revenue or
transfers 69 27 97 ¥(97)
Total ¥85,297 ¥55,712 ¥141,009 ¥(97) ¥140,912
Segment profit ¥7,539 ¥3,950 ¥11,489 ¥(2,771) ¥8,718
Other items
Financial income 493
Financial costs (1,112)
Share of profit of
associates and joint
ventures accounted for
using the equity method
210
Profit before tax 8,310
Other items for profit (loss)
Depreciation and
amortization ¥3,462 ¥1,540 ¥5,002 ¥243 ¥5,246
Notes 1. The segment profit adjustment of ¥(2,771) million consists mostly of corporate expenses not allocated to either
reportable segment. The corporate expenses are mainly general and administrative expenses not attributable to
the reportable segments.
2. Segment profit is reconciled to operating profit as presented in the consolidated statement of profit or loss.
Year ended December 31, 2018
Millions of yen
Reportable segment
Reconciliations
(Note 1)
Per consolidated
financial
statements
(Note 2)
Industrial
Business
Medical
Business Total
Revenue
Revenue from external
customers ¥104,501 ¥60,824 ¥165,326 ¥165,326
Intersegment revenue or
transfers 43 1 45 ¥(45)
Total ¥104,545 ¥60,825 ¥165,371 ¥(45) ¥165,326
Segment profit ¥8,140 ¥5,582 ¥13,722 ¥(3,419) ¥10,302
Other items
Financial income 528
Financial costs (1,355)
Share of profit of
associates and joint
ventures accounted for
using the equity method
266
Profit before tax 9,741
Other items for profit (loss)
Depreciation and
amortization ¥4,423 ¥1,688 ¥6,111 ¥223 ¥6,335

- 29 -
Year ended December 31, 2018
Thousands of
U.S. dollars
Reportable segment
Reconciliations
(Note 1)
Per consolidated
financial
statements
(Note 2)
Industrial
Business
Medical
Business Total
Revenue
Revenue from external
customers $941,459 $547,966 $1,489,425 $1,489,425
Intersegment revenue or
transfers 393 12 405 $(405)
Total $941,852 $547,978 $1,489,831 $(405) $1,489,425
Segment profit $73,334 $50,290 $123,625 $(30,810) $92,814
Other items
Financial income 4,760
Financial costs $(12,209)
Share of profit of
associates and joint
ventures accounted for
using the equity method
2,396
Profit before tax 87,762
Other items for profit (loss)
Depreciation and
amortization $39,848 $15,207 $55,056 $2,016 $57,073
Notes 1. The segment profit adjustment of ¥(3,419) million ($(30,810) thousand) consists mostly of corporate expenses
not allocated to either reportable segment. The corporate expenses are mainly general and administrative
expenses not attributable to the reportable segments.
2. Segment profit is reconciled to operating profit as presented in the consolidated statement of profit or loss.
(3) Information about products and services
This information is omitted because the classification of products and services is the same as the
classification of reportable segments.
(4) Information by geographical area
(i) Revenue from external customers
Millions of yen Thousands of
U.S. dollars
Year ended
December 31, 2018
Year ended
December 31, 2017
Year ended
December 31, 2018
Japan ¥60,313 ¥55,409 $543,361
Asia 41,267 33,915 371,782
North America 29,363 20,483 264,539
Europe 29,307 27,745 264,034
Other 5,073 3,359 45,708
Total ¥165,326 ¥140,912 $1,489,425
Note Revenue is categorized by country or area based on the product’s destination.

- 30 -
(ii) Non-current assets
Millions of yen Thousands of
U.S. dollars
December 31, 2018 December 31, 2017 December 31, 2018
Japan ¥27,585 ¥20,164 $248,521
Asia 9,724 9,080 87,605
North America 40,324 43,245 363,286
Europe 32,415 33,827 292,031
Other 535 805 4,823
Total ¥110,585 ¥107,122 $996,269
Note Non-current assets are categorized by countries and areas based on the location of the Group’s headquarters.
Financial instruments, deferred tax assets, and net defined benefit assets are not included in non-current assets.
(5) Information about major customers
As no revenue from a single external customer exceeds 10% of the consolidated revenue,
information on major customers is omitted.
6. Cash and Cash Equivalents
Cash and cash equivalents consist of the following. The balance of cash and cash equivalents presented
on the consolidated statement of financial position is equal to cash and cash equivalents’ fiscal-year-end
balance on the consolidated statement of cash flows.
Millions of yen Thousands of
U.S. dollars
December 31, 2018 December 31, 2017 December 31, 2018
Cash and deposits ¥29,269 ¥34,095 $263,691
7. Trade and Other Receivables
Trade and other receivables consist of the following:
Millions of yen Thousands of
U.S. dollars
December 31, 2018 December 31, 2017 December 31, 2018
Notes and accounts receivable - trade ¥49,874 ¥51,005 $449,316
Contract assets 4,741 42,713
Other 387 277 3,489
Allowance for doubtful accounts (925) (848) (8,338)
Total ¥54,077 ¥50,434 $487,181
Notes 1. Presented net of the allowance for doubtful accounts on the consolidated statement of financial position.
2. Refer to Note “33. Financial Instruments” for credit risk management.

- 31 -
8. Other Financial Assets
The breakdown of other financial assets is as follows:
(1) Current assets
Millions of yen Thousands of
U.S. dollars
December 31, 2018 December 31, 2017 December 31, 2018
Deposits ¥978 ¥1,099 $8,813
Other 129 597 1,164
Total ¥1,107 ¥1,698 $9,977
(2) Non-current assets
Millions of yen Thousands of
U.S. dollars
December 31, 2018 December 31, 2017 December 31, 2018
Equity securities ¥12,856 ¥14,597 $115,828
Other 1,192 994 10,742
Allowance for doubtful accounts (Note) (223) (238) (2,013)
Total ¥13,825 ¥15,354 $124,557
Note Presented net of the allowance for doubtful accounts on the consolidated statement of financial position.
9. Inventories
Inventories consist of the following:
Millions of yen Thousands of
U.S. dollars
December 31, 2018 December 31, 2017 December 31, 2018
Merchandise and finished goods ¥11,634 ¥10,924 $104,816
Work in process 7,841 7,091 70,647
Raw materials and supplies 13,821 12,347 124,513
Total ¥33,297 ¥30,363 $299,977
Notes 1. The cost of inventories recognized as cost of sales totaled ¥101,243 million ($912,104 thousand) and ¥88,751
million for the years ended December 31, 2018 and 2017, respectively.
2. The cost of inventories recognized as cost of sales includes ¥465 million ($4,195 thousand) and ¥532 million in
respect of write-downs of inventory to net realizable value for the years ended December 31, 2018 and 2017,
respectively.
3. The cost of inventories recognized as cost of sales has been reduced by ¥59 million ($540 thousand) and ¥64
million in respect of the reversal of such write-downs for the years ended December 31, 2018 and 2017,
respectively.
4. No inventories are pledged as collateral for liabilities.

- 32 -
10. Other Assets
Other assets consist of the following:
(1) Current assets
Millions of yen Thousands of
U.S. dollars
December 31, 2018 December 31, 2017 December 31, 2018
Consumption tax refund receivable ¥1,320 ¥636 $11,892
Advance payments 691 457 6,231
Prepaid expenses 968 637 8,722
Other 423 420 3,815
Total ¥3,403 ¥2,152 $30,661
(2) Non-current assets
Millions of yen Thousands of
U.S. dollars
December 31, 2018 December 31, 2017 December 31, 2018
Long-term prepaid expenses ¥1,390 ¥853 $12,522
Other 19 22 174
Total ¥1,409 ¥875 $12,697

- 33 -
11. Property, Plant and Equipment
(1) Changes in acquisition cost, accumulated depreciation and impairment losses, and carrying
amount of property, plant and equipment
Millions of yen
Land
Buildings
and
structures
Machinery
and vehicles Other
Construction
in progress Total
January 1, 2017
Acquisition cost ¥6,253 ¥33,594 ¥25,633 ¥11,478 ¥2,618 ¥79,578
Accumulated depreciation and
impairment losses (15) (16,429) (18,231) (9,222) (43,899)
Carrying amount 6,238 17,165 7,401 2,255 2,618 35,679
December 31, 2017
Acquisition cost 6,272 35,752 28,004 12,020 3,445 85,496
Accumulated depreciation and
impairment losses (15) (17,258) (20,277) (9,490) (47,042)
Carrying amount 6,257 18,494 7,727 2,530 3,445 38,454
December 31, 2018
Acquisition cost 6,014 43,580 31,120 12,180 1,435 94,331
Accumulated depreciation and
impairment losses (15) (18,259) (21,662) (9,473) (49,411)
Carrying amount 5,998 25,320 9,458 2,707 1,435 44,920
Millions of yen
Land
Buildings
and
structures
Machinery
and vehicles Other
Construction
in progress Total
January 1, 2017 ¥6,238 ¥17,165 ¥7,401 ¥2,255 ¥2,618 ¥35,679
Acquisition 1,390 688 894 561 3,481 7,017
Business combinations 355 448 122 90 1,017
Sale or disposal (1,569) (304) (36) (171) (2,082)
Transfer of accounts (Note 1) 53 1,391 1,032 339 (2,816)
Depreciation (Note 2) (1,136) (1,994) (767) (3,898)
Foreign currency translation
differences 138 173 28 95 69 506
Other 5 161 (48) 95 1 214
December 31, 2017 ¥6,257 ¥18,494 ¥7,727 ¥2,530 ¥3,445 ¥38,454
Acquisition 3 7,064 1,945 1,041 2,131 12,186
Sale or disposal (161) (396) (107) (87) (34) (787)
Transfer of accounts (Note 1) 1,737 2,205 71 (4,014)
Depreciation (Note 2) (1,288) (2,131) (769) (4,188)
Foreign currency translation
differences (94) (299) (177) (80) (87) (739)
Other (5) 8 (2) 1 (5) (3)
December 31, 2018 ¥5,998 ¥25,320 ¥9,458 ¥2,707 ¥1,435 ¥44,920

- 34 -
Thousands
of1
U.S. dollars
Land
Buildings
and
structures
Machinery
and vehicles Other
Construction
in progress Total
December 31, 2017 $56,369 $166,614 $69,614 $22,793 $31,044 $346,436
Acquisition 29 63,645 17,523 9,381 19,205 109,785
Sale or disposal (1,453) (3,576) (969) (784) (309) (7,092)
Transfer of accounts (Note 1) 15,655 19,869 644 (36,169)
Depreciation (Note 2) (11,606) (19,199) (6,930) (37,736)
Foreign currency translation
differences (853) (2,695) (1,602) (724) (790) (6,666)
Other (49) 78 (25) 12 (50) (34)
December 31, 2018 $54,042 $228,115 $85,211 $24,392 $12,929 $404,691
Notes 1. Transfer of construction in progress upon completion.
2. Depreciation of property, plant and equipment is included in cost of sales and selling, general and
administrative expenses in the consolidated statement of profit or loss.
The carrying amounts (net of accumulated depreciation and accumulated impairment losses) of assets
included in property, plant and equipment that are leased under finance leases are as follows:
Millions of yen Thousands of
U.S. dollars
December 31, 2018 December 31, 2017 December 31, 2018
Machinery and vehicles ¥194 ¥125 $1,752
Other 17 12 154
Total ¥211 ¥138 $1,907
(2) Commitments
Contractual commitments related to acquisition of property, plant and equipment are as follows:
Millions of yen Thousands of
U.S. dollars
December 31, 2018 December 31, 2017 December 31, 2018
Commitments for acquisition of property,
plant and equipment ¥705 ¥715 $6,358

- 35 -
12. Goodwill and Intangible Assets
(1) Changes in acquisition cost, accumulated amortization and impairment losses, and carrying
amount of goodwill and intangible assets
Millions of yen
Goodwill
Intangible assets
Total Trade-
marks
Customer-
related
assets
Technolog-
ical assets Software
Other
(Note 1)
January 1, 2017
Acquisition cost ¥22,100 ¥2,030 ¥3,867 ¥524 ¥4,312 ¥2,130 ¥34,965
Accumulated amortization and
impairment losses (1,104) (1,361) (30) (2,939) (1,431) (6,866)
Carrying amount 22,100 926 2,505 494 1,372 699 28,098
December 31, 2017
Acquisition cost 52,604 5,957 5,399 3,536 4,734 2,936 75,169
Accumulated amortization and
impairment losses (1,085) (1,690) (244) (3,335) (1,021) (7,376)
Carrying amount 52,604 4,872 3,709 3,292 1,398 1,915 67,792
December 31, 2018
Acquisition cost 51,369 5,464 4,849 3,474 4,498 2,531 72,187
Accumulated amortization and
impairment losses (755) (1,906) (386) (3,221) (1,660) (7,931)
Carrying amount 51,369 4,708 2,943 3,087 1,277 870 64,255
Millions of yen
Goodwill
Intangible assets
Total Trade-
marks
Customer-
related
assets
Technolog-
ical assets Software
Other
(Note 1)
January 1, 2017 ¥22,100 ¥926 ¥2,505 ¥494 ¥1,372 ¥699 ¥28,098
Acquisition 304 172 476
Business combinations 30,158 3,905 1,492 3,005 56 1,338 39,955
Sale or disposal (1) (9) (11)
Transfer of accounts (Note 2) 290 (290)
Amortization (Note 3) (28) (373) (213) (650) (81) (1,347)
Foreign currency translation
differences 345 95 84 6 29 88 650
Other (27) (2) (30)
December 31, 2017 ¥52,604 ¥4,872 ¥3,709 ¥3,292 ¥1,398 ¥1,915 ¥67,792
Acquisition 3 462 446 912
Sale or disposal (207) (47) (24) (280)
Transfer of accounts (Note 2) 129 (129)
Amortization (Note 3) (24) (610) (255) (659) (596) (2,146)
Foreign currency translation
differences (1,027) (54) (156) (62) (28) (100) (1,430)
Other (39) 0 112 (665) (591)
December 31, 2018 ¥51,369 ¥4,708 ¥2,943 ¥3,087 ¥1,277 ¥870 ¥64,255
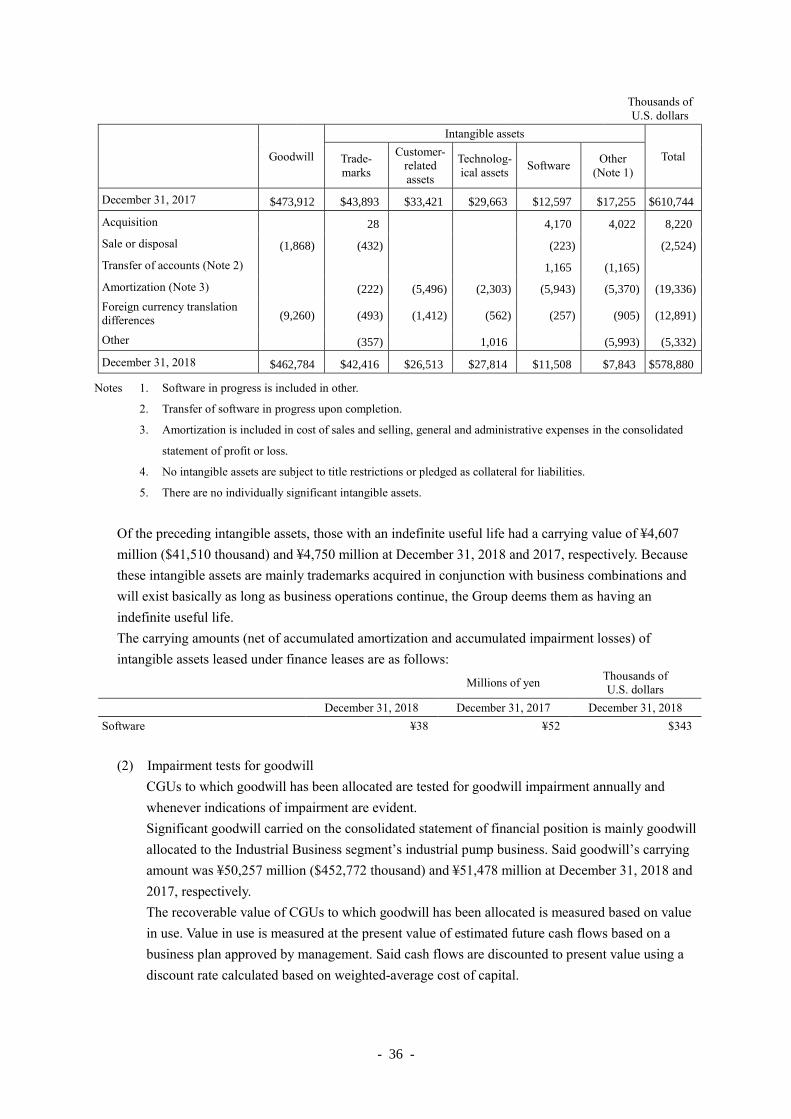
- 36 -
Thousands of
U.S. dollars
Goodwill
Intangible assets
Total Trade-
marks
Customer-
related
assets
Technolog-
ical assets Software
Other
(Note 1)
December 31, 2017 $473,912 $43,893 $33,421 $29,663 $12,597 $17,255 $610,744
Acquisition 28 4,170 4,022 8,220
Sale or disposal (1,868) (432) (223) (2,524)
Transfer of accounts (Note 2) 1,165 (1,165)
Amortization (Note 3) (222) (5,496) (2,303) (5,943) (5,370) (19,336)
Foreign currency translation
differences (9,260) (493) (1,412) (562) (257) (905) (12,891)
Other (357) 1,016 (5,993) (5,332)
December 31, 2018 $462,784 $42,416 $26,513 $27,814 $11,508 $7,843 $578,880
Notes 1. Software in progress is included in other.
2. Transfer of software in progress upon completion.
3. Amortization is included in cost of sales and selling, general and administrative expenses in the consolidated
statement of profit or loss.
4. No intangible assets are subject to title restrictions or pledged as collateral for liabilities.
5. There are no individually significant intangible assets.
Of the preceding intangible assets, those with an indefinite useful life had a carrying value of ¥4,607
million ($41,510 thousand) and ¥4,750 million at December 31, 2018 and 2017, respectively. Because
these intangible assets are mainly trademarks acquired in conjunction with business combinations and
will exist basically as long as business operations continue, the Group deems them as having an
indefinite useful life.
The carrying amounts (net of accumulated amortization and accumulated impairment losses) of
intangible assets leased under finance leases are as follows:
Millions of yen Thousands of
U.S. dollars
December 31, 2018 December 31, 2017 December 31, 2018
Software ¥38 ¥52 $343
(2) Impairment tests for goodwill
CGUs to which goodwill has been allocated are tested for goodwill impairment annually and
whenever indications of impairment are evident.
Significant goodwill carried on the consolidated statement of financial position is mainly goodwill
allocated to the Industrial Business segment’s industrial pump business. Said goodwill’s carrying
amount was ¥50,257 million ($452,772 thousand) and ¥51,478 million at December 31, 2018 and
2017, respectively.
The recoverable value of CGUs to which goodwill has been allocated is measured based on value
in use. Value in use is measured at the present value of estimated future cash flows based on a
business plan approved by management. Said cash flows are discounted to present value using a
discount rate calculated based on weighted-average cost of capital.

- 37 -
Business plans are formulated based on forecasts with a maximum five-year horizon that have
been approved by management. Forecasts of post-business-plan cash flows are estimates based on
the long-term average growth rate of the market(s) in which the CGU in question operates. The
long-term average growth rates used to estimate post-business-plan cash flows were 4.1% and
3.7% in the fiscal years ended December 31, 2018 and 2017, respectively.
The discount rate is calculated based on historical weighted-average cost of capital and also
reflects current market assessments of the time value of money, risks specific to the assets in
question, and other relevant factors. Pre-tax discount rates used for value-in-use measurements
were 8.6% and 9.1% in the fiscal years ended December 31, 2018 and 2017, respectively.
In the Group’s assessment, the value in use of the CGUs in question is sufficiently above their
carrying amount and has a low probability of falling below said carrying amount even if the
discount rate and/or growth rate used to measure value in use were to change to a reasonable
extent.
(3) Research and development expenditures
Research and development expenditures recognized in profit or loss for the year ended December
31, 2018 and 2017 are as follows. These figures are included in cost of sales and selling, general
and administrative expenses in the consolidated statement of profit or loss.
Millions of yen Thousands of
U.S. dollars
Year ended
December 31, 2018
Year ended
December 31, 2017
Year ended
December 31, 2018
Research and development expenditure ¥2,387 ¥2,435 $21,510
13. Investments Accounted for Using the Equity Method
Carrying amounts and summary of financial data for individually insignificant investments in
associates and joint ventures are as follows.
The values are prorated based on the Group’s percentage ownership interests.
(1) Investments in associates
Millions of yen Thousands of
U.S. dollars
December 31, 2018 December 31, 2017 December 31, 2018
Carrying amount of investments ¥431 ¥411 $3,883
Millions of yen Thousands of
U.S. dollars
Year ended
December 31, 2018
Year ended
December 31, 2017
Year ended
December 31, 2018
Profit for the year ¥102 ¥96 $924
Other comprehensive income 1 7 10
Total comprehensive income
for the year ¥103 ¥104 $935

- 38 -
(2) Investments in joint ventures
Millions of yen Thousands of
U.S. dollars
December 31, 2018 December 31, 2017 December 31, 2018
Carrying amount of investments ¥868 ¥787 $7,824
Millions of yen Thousands of
U.S. dollars
Year ended
December 31, 2018
Year ended
December 31, 2017
Year ended
December 31, 2018
Profit for the year ¥163 ¥114 $1,472
Other comprehensive income (58) 23 (523)
Total comprehensive income
for the year ¥105 ¥138 $949
14. Income Taxes
(1) Deferred tax assets and deferred tax liabilities
Changes in deferred tax asset and deferred tax liability balances broken down by major causative
factor are as follows:
Year ended December 31, 2017
Millions of yen
Beginning
balance
Recognized in
profit or loss
Recognized in
other compre-
hensive
income
Foreign
currency
translation
differences
Other
(Note)
Ending
balance
Deferred tax assets
Trade and other
receivables ¥361 ¥(215) ¥0 ¥(18) ¥128
Inventories 596 (52) 1 (44) 501
Accrued expenses 853 (184) (10) 15 674
Provisions 551 (10) (2) (10) 527
Net defined benefit
liabilities 975 (144) ¥25 5 (10) 852
Tax loss carryforwards 771 325 (2) 1,094
Other 877 (279) (6) (17) (146) 427
Total ¥4,987 ¥(560) ¥19 ¥(24) ¥(215) ¥4,205
Deferred tax liabilities
Inventories ¥(274) ¥231 ¥(0) ¥(89) ¥(132)
Property, plant and
equipment (599) 78 8 (14) (527)
Intangible assets (607) 162 (19) (2,048) (2,513)
Investment in equity
instruments (1,663) ¥(738) (2,402)
Reserve for advanced
depreciation of non-
current assets
(766) 70 (695)
Other (665) 187 21 42 121 (292)
Total ¥(4,576) ¥730 ¥(717) ¥31 ¥(2,030) ¥(6,562)
Net amount 410 170 (698) 6 (2,245) (2,356)
Note The breakdown of other consists mainly of deferred tax assets and deferred tax liabilities which were recognized at
time of the business combinations.

- 39 -
Year ended December 31, 2018
Millions of yen
Beginning
balance
Recognized in
profit or loss
Recognized in
other compre-
hensive
income
Foreign
currency
translation
differences
Other Ending
balance
Deferred tax assets
Trade and other
receivables ¥128 ¥123 ¥(1) ¥250
Inventories 501 308 14 824
Accrued expenses 674 142 (1) 815
Provisions 527 89 4 622
Net defined benefit
liabilities 852 (69) ¥15 (14) 783
Tax loss carryforwards 1,094 614 (9) 1,698
Other 427 124 252 (7) 797
Total ¥4,205 ¥1,332 ¥268 ¥(14) ¥5,792
Deferred tax liabilities
Inventories ¥(132) ¥47 ¥1 ¥(83)
Property, plant and
equipment (527) (141) (5) ¥(44) (718)
Intangible assets (2,513) 226 (14) (2,300)
Investment in equity
instruments (2,402) ¥533 (1,869)
Reserve for advanced
depreciation of non-
current assets
(695) 64 (630)
Other (292) 45 (122) 2 104 (262)
Total ¥(6,562) ¥243 ¥410 ¥(15) ¥59 ¥(5,864)
Net amount (2,356) 1,576 678 (30) 59 (72)

- 40 -
Year ended December 31, 2018
Thousands of
U.S. dollars
Beginning
balance
Recognized in
profit or loss
Recognized in
other compre-
hensive
income
Foreign
currency
translation
differences
Other Ending
balance
Deferred tax assets
Trade and other
receivables $1,160 $1,109 $(10) $2,258
Inventories 4,513 2,778 132 7,425
Accrued expenses 6,073 1,288 (14) 7,347
Provisions 4,754 807 42 5,603
Net defined benefit
liabilities 7,680 (628) $140 (130) 7,061
Tax loss carryforwards 9,857 5,532 (87) 15,302
Other 3,850 1,120 2,275 (63) 7,182
Total $37,890 $12,008 $2,415 $(132) $52,181
Deferred tax liabilities
Inventories $(1,189) $426 $14 $(748)
Property, plant and
equipment (4,748) (1,276) (46) $(404) (6,475)
Intangible assets (22,640) 2,044 (128) (20,724)
Investment in equity
instruments (21,642) $4,801 (16,841)
Reserve for advanced
depreciation of non-
current assets
(6,264) 583 (5,680)
Other (2,634) 413 (1,102) 19 939 (2,363)
Total $(59,119) $2,191 $3,699 $(140) $535 $(52,834)
Net amount $(21,228) $14,199 $6,114 $(273) $535 $(652)
Deferred tax assets and deferred tax liabilities in the consolidated statement of financial position are
as follows:
Millions of yen Thousands of
U.S. dollars
December 31, 2018 December 31, 2017 December 31, 2018
Deferred tax assets ¥2,735 ¥1,913 $24,639
Deferred tax liabilities (2,807) (4,269) (25,292)
Net amount ¥(72) ¥(2,356) $(653)
In recognizing deferred tax assets, the Group takes into account the probability of its being able to
partially or fully utilize deductible temporary differences and unused tax losses against future
taxable profits. In assessing recoverability, the Group takes into account scheduled reversals of
deferred tax liabilities, expected future taxable profits and tax planning. In the Group’s judgment,
realization of tax benefits from recognized deferred tax assets is probable based on past levels of
taxable profits and the expectation that future taxable profits during the period in which the deferred
tax assets remain can be recognized.

- 41 -
Deductible temporary differences and tax loss carryforwards not recognized as deferred tax assets
are as follows:
Millions of yen Thousands of
U.S. dollars
December 31, 2018 December 31, 2017 December 31, 2018
Deductible temporary differences ¥11,072 ¥7,340 $99,755
Unused tax losses 3,921 3,136 35,332
Total ¥14,994 ¥10,476 $135,088
Tax loss carryforwards not recognized as deferred tax assets are scheduled to expire as follows:
Millions of yen Thousands of
U.S. dollars
December 31, 2018 December 31, 2017 December 31, 2018
1st year ¥512 ¥631 $4,614
2nd year 524 512 4,725
3rd year 314 524 2,833
4th year 160 314 1,444
5th year and thereafter 2,410 1,152 21,714
Total ¥3,921 ¥3,136 $35,332
Taxable temporary differences related to investments in associates that were not recognized as
deferred tax liabilities totaled ¥28,352 million ($255,430 thousand) and ¥27,032 million at
December 31, 2018 and 2017, respectively. These taxable temporary differences were not recognized
as deferred tax liabilities because the timing of their reversal is within the Group’s control and they
had a high probability of not reversing within a foreseeable timeframe.

- 42 -
(2) Income tax expenses
Income tax expenses consist of the following:
Millions of yen Thousands of
U.S. dollars
Year ended
December 31, 2018
Year ended
December 31, 2017
Year ended
December 31, 2018
Current tax expense ¥3,723 ¥3,175 $33,541
Deferred tax expense
Origination and reversal of temporary
differences and others (1,531) (420) (13,799)
Change in tax rates (3) 209 (33)
Assessment of recoverability of
deferred tax assets (41) 40 (372)
Total deferred tax expense (1,576) (170) (14,204)
Total income tax expenses 2,146 3,005 19,337
Income taxes relating to other
comprehensive income ¥(678) ¥698 $(6,114)
Current tax expense includes tax benefits arising from tax loss carryforwards, tax credits, and/or
prior-period temporary differences not previously recognized as deferred tax assets. Said tax benefits
reduced current tax expense by ¥6 million ($60 thousand) and ¥24 million for the years ended
December 31, 2018 and 2017, respectively.
The Company’s effective statutory tax rates were 30.9% and 30.9% for the years ended December
31, 2018 and 2017, respectively. Taxes in other tax jurisdictions were calculated based on those tax
jurisdictions’ respective general tax rates.
Factors of difference between the average effective tax rate and effective statutory tax rate in the
consolidated statements of profit or loss are as follows:
%
Year ended
December 31, 2018
Year ended
December 31, 2017
Effective statutory tax rate 30.9 30.9
Non-tax-deductible expenses 1.1 1.7
Non-taxable income (0.2) (1.2)
Tax credit (2.5) (2.0)
Difference on applicable tax rates for overseas
subsidiaries (6.6) (3.1)
Income taxes for prior periods (1.6) 3.2
Share of profit (loss) of associates and joint ventures
accounted for using the equity method (0.9) (0.6)
Effect of change in tax rates (0.5) 1.9
Unrecognized deferred tax assets 5.0 6.9
Other (2.6) (1.5)
Average effective tax rate 22.0 36.2

- 43 -
15. Bonds and Borrowings
(1) Breakdown of bonds and borrowings
Bonds and borrowings consist of the following:
Millions of yen Thousands of
U.S. dollars
December 31,
2018
December 31,
2017
Average
interest rate
(%)
(Note 2)
Maturity December 31,
2018
With collateral
Long-term borrowings to be repaid
within one year ¥160 ¥214 2.3 $1,447
Long-term borrowings 160
Without collateral
Short-term borrowings 33,984 52,674 1.1 306,163
Long-term borrowings to be repaid
within one year 5,911 9,129 0.6 53,255
Long-term borrowings 76,996 45,392 0.8
March 2020
to
April 2027
693,663
Convertible bonds (Note 3) 14,956
Total ¥117,052 ¥122,528 $1,054
Notes 1. The Group is subject to certain externally-imposed capital restrictions in the form of bank financial covenants
pertaining to a portion of its borrowings. To comply with these capital restrictions, the Group is periodically
evaluated and monitored. The Group has been in compliance with said capital restrictions through the fiscal
year ended December 31, 2018.
2. Average interest rates are weighted-average interest rates weighted based on borrowings balances at fiscal year-
end.
3. The convertible bonds are yen-denominated convertible bonds maturing in 2018 that were issued by the
Company on August 2, 2013. These bonds were redeemed in the fiscal year ended December 31, 2018.
(2) Assets pledged as collateral
Contractual terms for bank loans customarily require the borrower to pledge collateral or furnish a
guarantee against existing or future liabilities if requested to do so by the bank and to grant the
bank the right to offset debts against the borrower’s bank deposits on the debt’s due date or in the
event of default.
The Group has pledged shares of consolidated subsidiaries (carrying amounts are before
eliminations) as follows:
Millions of yen Thousands of
U.S. dollars
December 31, 2018 December 31, 2017 December 31, 2018
Shares of consolidated subsidiaries
(before eliminations) ¥24,140 ¥24,140 $217,484

- 44 -
16. Trade and Other Payables
The breakdown of trade and other payables consists of the following:
Millions of yen Thousands of
U.S. dollars
December 31, 2018 December 31, 2017 December 31, 2018
Notes and accounts payable trade ¥24,167 ¥21,079 $217,724
Other 3,212 1,544 28,942
Total ¥27,380 ¥22,624 $246,666
17. Lease Transactions
(1) Finance leases (lessee)
The breakdown of finance lease obligations is as follows:
Millions of
yen
Thousands of
U.S. dollars
Millions of
yen
Thousands of
U.S. dollars
Minimum lease payments Present value of
minimum lease payments
December 31,
2018
December 31,
2017
December 31,
2018
December 31,
2018
December 31,
2017
December 31,
2018
Within 1 year ¥84 ¥67 $762 ¥83 ¥67 $755
1–5 years 174 130 1,573 169 126 1,527
Over 5 years 1 4 15 1 3 14
Total ¥261 ¥202 $2,352 ¥255 ¥197 $2,297
Deduction: future finance
costs (6) (4) $(54)
Present value of
minimum lease payments ¥255 ¥197 $2,297
Amounts in the consolidated statement
of financial position
Lease obligations
(current) ¥83 ¥67 $755
Lease obligations (non-
current) ¥171 ¥130 $1,542
(2) Operating leases (lessee)
The Group has operating lease contracts mainly for land, buildings, and office equipment, etc.
Lease payments expensed totaled ¥2,374 million ($21,390 thousand) and ¥2,183 million for the
years ended December 31, 2018 and 2017, respectively.
Future minimum lease payments based on non-cancelable operating leases are as follows:
Millions of yen Thousands of
U.S. dollars
Minimum lease payments
December 31, 2018 December 31, 2017 December 31, 2018
Within 1 year ¥975 ¥923 $8,783
1–5 years 1,607 1,383 14,479
Over 5 years 173 115 1,562
Total ¥2,755 ¥2,422 $24,826

- 45 -
18. Other Financial Liabilities
Other financial liabilities consist of the following:
(1) Current liabilities
Millions of yen Thousands of
U.S. dollars
December 31, 2018 December 31, 2017 December 31, 2018
Deposits received ¥543 ¥492 $4,893
Lease obligations 83 67 755
Derivative liabilities 2
Other 11
Total ¥626 ¥573 $5,648
(2) Non-current liabilities
Millions of yen Thousands of
U.S. dollars
December 31, 2018 December 31, 2017 December 31, 2018
Derivative liabilities ¥840 ¥398 $7,569
Lease obligations 171 130 1,542
Other 39 41 352
Total ¥1,050 ¥569 $9,463
19. Provisions
Changes in provisions are as follows:
Millions of yen
Provision for loss on
orders received
Provision for product
warranties
Asset retirement
obligations Total
January 1, 2018 ¥901 ¥626 ¥161 ¥1,690
Increase during the year 141 276 46 464
Decrease during the year
(utilization) (318) (105) (424)
Decrease during the year
(reversal) (59) (78) (138)
Interest expense over the
discount period 1 1
Foreign currency translation
differences (16) (14) (1) (31)
December 31, 2018 ¥648 ¥704 ¥208 ¥1,560

- 46 -
Thousands of
U.S. dollars
Provision for loss on
orders received
Provision for product
warranties
Asset retirement
obligations Total
January 1, 2018 $8,124 $5,645 $1,456 $15,226
Increase during the year 1,273 2,491 416 4,181
Decrease during the year
(utilization) (2,870) (954) (3,825)
Decrease during the year
(reversal) (540) (705) (1,245)
Interest expense over the
discount period 11 11
Foreign currency translation
differences (144) (132) (10) (287)
December 31, 2018 $5,842 $6,344 $1,874 $14,060
Provisions in consolidated statements of financial position consist of the following:
Millions of yen Thousands of
U.S. dollars
December 31, 2018 December 31, 2017 December 31, 2018
Current liabilities ¥1,347 ¥1,513 $12,136
Non-current liabilities 213 176 1,924
Total ¥1,560 ¥1,690 $14,060
Changes in provisions are as follows:
(1) Provision for loss on orders received
As a provision for future losses on orders received from customers on which the Group expects to
incur a loss in a future fiscal year in conjunction with execution of the order agreement, the Group
recognizes such losses in advance if the amount of the loss can be reasonably estimated. Such loss
provisions are generally expended within one year of loss recognition.
(2) Provision for product warranties
As a provision for costs to be incurred in repairing sold products free of charge, the Group
recognizes future product warranty expenses based on the warranty claim history of previously
sold products. Such warranty expense provisions are generally expended within one year of
recognition.
(3) Asset retirement obligations
Based on past experience and other relevant factors, the Group reasonably estimates and
recognizes liabilities arising pursuant to statutorily, regulatorily, or contractually prescribed legal
obligations, or other obligations analogous thereto, related to future retirement of property, plant,
equipment or other fixed assets used by the Group. Payments to settle such liabilities are mostly
expected to occur more than one year from recognition, but their timing is influenced by future
business plans and other factors.

- 47 -
20. Other Liabilities
Other liabilities consist of the following:
(1) Current liabilities
Millions of yen Thousands of
U.S. dollars
December 31, 2018 December 31, 2017 December 31, 2018
Advances received ¥2,935
Contract liabilities ¥6,482 $58,404
Accrued expenses 5,573 4,702 50,209
Accrued bonuses 1,668 1,610 15,027
Accrued paid absences 842 977 7,588
Other 1,091 781 9,836
Total ¥15,658 ¥11,006 $141,066
(2) Non-current liabilities
Millions of yen Thousands of
U.S. dollars
December 31, 2018 December 31, 2017 December 31, 2018
Long-term employee obligations ¥67 ¥60 $607
Other 51 56 463
Total ¥118 ¥117 $1,070
21. Employee Benefits
(1) Post-employment benefits
The Company and its consolidated subsidiaries adopt defined benefit pension plans and defined
contribution plans to cover post-employment benefits for employees.
The Company has introduced a funded cash balance plan in defined benefit pension plans, and
provides lump-sum money or pensions based on salary and service period. Under the plan, a
virtual individual account, which is equivalent to a source of funds for the reserve fund and
pension amount, has been set up for each participant, and interest credits mainly based on trends
in market interest rate and contribution credits based on the salary level and other factors
accumulate in the account. On April 1, 2017, some of the defined benefit corporate pension plans
were changed to defined contribution pension plans.
In the contract-type defined benefit corporate pension plan, the Company is responsible for
complying with laws, regulations, and terms and for carrying out operations related to
management and investment of reserve funds faithfully for participants, and is required to make a
contribution. The Company and the managing trustee of plan assets are required to behave in a
way that gives utmost priority to the interest of plan participants and have a responsibility to
invest plan assets in accordance with predetermined policies. In domestic corporate pension plans,
the Company makes an actuarial review every five years based on the Company’s financial
conditions, outlook for investment operations, and other factors and increases contributions if the
reserve amount is less than the funding standard.
Although the Company basically makes sound investments of plan assets, the plans are exposed to
investment risk on financial instruments. In addition, since defined benefit obligations are
measured based on various actuarial assumptions, including discount rate, the plans are exposed to
risk of fluctuation in regard to these assumptions.

- 48 -
Investments of plan assets have been designed to promote optimization of investment return under
tolerable risk to ensure payment of future benefits for employees. Investments of plan assets have
been broadly diversified, principally in domestic and foreign shares and bonds. For investments,
the Company prepares an optimal basic portfolio and endeavors to maintain the asset allocation of
the portfolio in order to ensure payment of pension benefits and others in the future while making
it a rule to consider whether or not to rebalance the allocation when necessary.
(i) Defined benefit pension plans
1) Reconciliation of defined benefit obligations and plan assets
Millions of yen Thousands of
U.S. dollars
December 31, 2018 December 31, 2017 December 31, 2018
Ending balance of present value of
defined benefit obligations ¥16,210 ¥16,478 $146,042
Ending balance of plan assets 12,993 13,190 117,059
Net amount of defined benefit
obligations and assets 3,217 3,287 28,983
Amounts in the consolidated statement of
financial position
Net defined benefit liabilities ¥3,217 ¥3,287 $28,983
2) Changes in defined benefit obligations
Millions of yen Thousands of
U.S. dollars
Year ended
December 31, 2018
Year ended
December 31, 2017
Year ended
December 31, 2018
Beginning balance of present value of
defined benefit obligations ¥16,478 ¥18,412 $148,454
Service cost 656 637 5,916
Interest expenses related to defined
benefit obligations 106 114 957
Actuarial changes (in demographics) (174) 32 (1,574)
Actuarial changes (in finance) (247) 340 (2,225)
Benefits paid (782) (1,181) (7,047)
Transfer of assets due to changes to
defined contribution pension plans
(Note)
(1,951)
Other 173 73 1,563
Ending balance of present value of
defined benefit obligations ¥16,210 ¥16,478 $146,042
Note The Company changed some defined benefit corporate pension plans to defined contribution pension plans and
recognized gains or losses on settlement in the fiscal year ended December 31, 2017 due to this change.

- 49 -
3) Changes in fair value of plan assets
Millions of yen Thousands of
U.S. dollars
Year ended
December 31, 2018
Year ended
December 31, 2017
Year ended
December 31, 2018
Beginning balance of fair value of plan
assets ¥13,190 ¥14,795 $118,836
Interest income for plan assets 81 88 736
Return on plan assets other than interest (477) 283 (4,302)
Contributions (Note 1) 827 838 7,457
Benefits paid (782) (1,181) (7,047)
Transfer of assets due to change to
defined contribution pension plans
(Note 2)
(1,671)
Other 153 37 1,379
Ending balance of fair value of plan
assets ¥12,993 ¥13,190 $117,059
Notes 1. The amount of contributions to be made by the Group in the following fiscal year is ¥768 million ($6,921
thousand).
2. The Company changed some defined benefit corporate pension plans to defined contribution pension plans and
recognized gains or losses on settlement in the fiscal year ended December 31, 2017 due to this change.

- 50 -
4) Major breakdown of plan assets
Fair values of plan assets in the fiscal years ended December 31, 2018 and 2017 are as
follows:
Millions of yen Thousands of
U.S. dollars
Asset category
December 31, 2018 December 31, 2017 December 31, 2018
Plan
assets
with
quoted
market
prices in
active
markets
Plan
assets
without
quoted
market
prices in
active
markets
Total
Plan
assets
with
quoted
market
prices in
active
markets
Plan
assets
without
quoted
market
prices in
active
markets
Total
Plan
assets
with
quoted
market
prices in
active
markets
Plan
assets
without
quoted
market
prices in
active
markets
Total
Equity instruments
Japanese equity
securities ¥52 ¥52 ¥83 ¥162 ¥246 $475 $475
Overseas equity
securities 166 166 186 155 342 1,503 1,503
Commingled
funds (domestic) ¥639 639 370 370 $5,765 5,765
Commingled
funds (overseas) 19 1,997 2,016 18 762 781 171 17,996 18,168
Total equity
instruments ¥238 ¥2,637 ¥2,876 ¥288 ¥1,451 ¥1,740 $2,150 $23,761 $25,912
Debt instruments
Japanese debt
securities ¥330 ¥330 ¥247 ¥1,001 ¥1,249 $2,976 $2,976
Overseas debt
securities 361 361 344 142 487 3,254 3,254
Commingled
funds (domestic) ¥2,921 2,921 2,438 2,438 $26,320 $26,320
Commingled
funds (overseas) 1,751 1,751 2,834 2,834 15,781 15,781
Total debt
instruments ¥691 ¥4,673 ¥5,365 ¥591 ¥6,417 ¥7,009 $6,230 $42,102 $48,333
Other (Note) 243 4,508 4,752 88 4,352 4,441 2,191 40,620 42,812
Total ¥1,173 ¥11,819 ¥12,993 ¥968 ¥12,222 ¥13,190 $10,573 $106,485 $117,058
Note “Other” mainly includes cash equivalents.
5) Actuarial assumptions
The main actuarial assumption used in each fiscal year is as follows:
%
December 31, 2018 December 31, 2017
Discount rate 0.6 0.6
6) Sensitivity analysis
The estimated impact on the defined benefit obligation of changes in the main assumption
used in actuarial calculations is as follows. The following analysis provides a rough
estimate of the defined benefit obligation’s sensitivity to the main actuarial assumption. It
does not take into account all forecasted cash-flow information impacts.
Impact on defined benefit obligation at December 31, 2018
Discount rate decreases by 0.5% ¥873 million ($7,872 thousand) increase
Discount rate increases by 0.5% ¥801 million ($7,218 thousand) decrease

- 51 -
7) Information on defined benefit obligation duration analysis
The defined benefit obligation’s weighted-average duration was 11.4 years and 11.4 years
in the years ended December 31, 2018 and 2017, respectively.
(ii) Defined contribution plans
The Company and certain subsidiaries have adopted defined contribution pension plans.
Expenses recognized in connection with the defined contribution plans in the fiscal years
ended December 31, 2018 and 2017 were ¥1,211 million ($10,916 thousand) and ¥1,156
million, respectively.
(2) Defined benefits costs
Defined benefits costs recognized as expenses in the fiscal years ended December 31, 2018 and
2017 totaled ¥43,290 million ($390,002 thousand) and ¥36,681 million, respectively. Defined
benefits costs are included in cost of sales and selling, general and administrative expenses on the
consolidated statement of profit or loss.
22. Equity and Other Equity Items
(1) Total number of authorized shares and total number of issued shares
Changes in the total number of authorized shares and the total number of issued shares are as
follows:
Authorized shares
(Shares)
Issued shares
(Shares)
January 1, 2017 249,500,000 74,286,464
Increase (Decrease)
December 31, 2017 249,500,000 74,286,464
Increase (Decrease)
December 31, 2018 249,500,000 74,286,464
Notes 1. Shares issued by the Company are ordinary shares with no par value.
2. Issued shares are fully paid.
(2) Capital surplus
Details of capital surplus are as follows:
(i) Capital reserves
The Companies Act allows for paid-in capital for issuance of shares or at least 50% of the
contribution for share issue to be credited to share capital, and for the remainder to be credited
to capital reserves included in capital surplus.
(ii) Other capital surplus
This is surplus arising from certain capital transactions and the reversal of share capital and
capital reserves and others.

- 52 -
(iii) Stock acquisition rights
The Company has adopted an equity-settled stock option plan for certain executives, and
these rights represent the portion of capital increase in the share-based compensation.
(3) Treasury shares
The Companies Act allows for an entity to determine the number of shares acquired, the total
amount of acquisition cost and others, and acquire treasury shares by resolution at the General
Meeting of Shareholders to the extent of the distributable amount. In addition, in the case of
acquisition through market transactions or tender offer, treasury shares may be acquired by
resolution of the Board of Directors to the extent of requirements stipulated in the Companies Act,
pursuant to provisions of the Articles of Incorporation. The breakdown of changes in treasury
shares during the period is as follows:
Number of shares
(Shares)
Amount
(Millions of yen)
Amount
(Thousands of U.S. dollars)
January 1, 2017 3,140,763 ¥2,578
Increase (Decrease)
(Note 1) (42,274) (34)
December 31, 2017 3,098,489 ¥2,543 $22,918
Increase (Decrease)
(Note 2) 502 0 5
December 31, 2018 3,098,991 ¥2,544 $22,923
Notes 1. This consists of an increase of 726 shares due to the purchase of shares less than one unit and a decrease of
43,000 shares due to the exercise of stock options.
2. This consists of an increase of 502 shares due to the purchase of shares less than one unit.
(4) Retained earnings
Details of retained earnings are as follows:
(i) Retained legal reserves
The Companies Act stipulates that 10% of the amount paid as dividends of surplus shall be
appropriated as capital reserves or retained legal reserves until the aggregate amount of the
capital reserves and the retained legal reserves equals 25% of share capital. The accumulated
retained legal reserves may be used to compensate for a deficit, or may also be reversed upon
resolution at the General Meeting of Shareholders.
(ii) Other retained earnings
This represents accumulated earnings earned by the Group.
(5) Other components of equity
Details of other components of equity are as follows:
(i) Gain or loss on investment in financial assets measured through other comprehensive income
This is the cumulative amount of valuation gain or loss on financial assets measured at fair
value through other comprehensive income.

- 53 -
(ii) Remeasurements of defined benefit pension plans
Remeasurements of defined benefit pension plans consist of the effect of differences between
the actuarial assumptions at the beginning of the period and the actual result and the effect of
changes in actuarial assumptions, and are recognized in other comprehensive income when
they are incurred and immediately transferred from other components of equity to retained
earnings.
(iii) Exchange differences on translation of foreign operations
These exchange differences are translation differences arising from translation of financial
statements of the Group’s foreign operations from their functional currencies to Japanese yen,
which is the Group’s presentation currency.
(iv) Profit (loss) in cash flow hedges
This profit (loss) is the cumulative amount of the hedge-effective portion of gain or loss
arising from changes in fair value of the hedging instrument in cash flow hedges.

- 54 -
23. Dividends
Dividends paid in the fiscal years ended December 31, 2018 and 2017 are as follows:
Resolution Class of shares Total dividends
(Millions of yen)
Dividends per
share
(Yen or U.S.
dollars)
Record date Effective date
Board of Directors
Meeting held on
February 24, 2017
Ordinary shares ¥569 ¥8.00 December 31,
2016 March 13, 2017
Board of Directors
Meeting held on
August 7, 2017
Ordinary shares ¥569 ¥8.00 June 30, 2017 September 5, 2017
Board of Directors
Meeting held on
February 23, 2018
Ordinary shares ¥569 ¥8.00
$0.07
December 31,
2017 March 12, 2018
Board of Directors
Meeting held on
August 10, 2018
Ordinary shares ¥569 ¥8.00
$0.07 June 30, 2018 September 7, 2018
Of dividends for which the record date falls in the fiscal year ended December 31, 2018, the total
amount of dividends for which the effective date falls in the following fiscal year is as follows:
Resolution Class of shares Source of
dividends
Total dividends
(Millions of
yen)
Dividends per
share
(Yen or U.S.
dollars)
Record date Effective date
Board of
Directors
Meeting held on
February 14,
2019
Ordinary shares Retained
earnings ¥711
¥10.00
$0.09
December 31,
2018 March 11, 2019
24. Revenue
(1) Disaggregation of revenue
The Group consists of the Industrial Business and the Medical Business.
The Group sells to customers engaged in manufacturing in the Industrial Business, and mainly to
customers such as hospitals, other medical institutions, and medical equipment trading companies
in the Medical Business.
The relationships between each reportable segment’s major operations and manufactured products
are as follows:
Reportable segment Operations Products
Industrial Business
Industrial
Industrial pumps and compressors
Equipment and devices related to liquefied and industrial
gases
Precision Equipment
Water conditioning systems for power-generation plants
Electronic component manufacturing related equipment
Particle analyzers
Aerospace Carbon fiber reinforced plastic products for civilian aircraft
Medical Business Medical Dialysis related products
Continuous renal replacement related products and others

- 55 -
The relationships between business revenue and segment revenue that were disaggregated into
these operations are as follows:
Year ended December 31, 2018
Millions of yen
Reportable segment Reportable segment
Industrial Business Medical Business Total
Industrial ¥76,763 ¥76,763
Precision Equipment 10,682 10,682
Aerospace 16,909 16,909
Medical ¥60,824 60,824
Other 146 146
Total ¥104,501 ¥60,824 ¥165,326
Year ended December 31, 2018
Thousands of
U.S. dollars
Reportable segment Reportable segment
Industrial Business Medical Business Total
Industrial $691,562 $691,562
Precision Equipment 96,238 96,238
Aerospace 152,337 152,337
Medical $547,966 547,966
Other 1,321 1,321
Total $941,459 $547,966 $1,489,425
Note The table above shows amounts after elimination of intragroup transactions.
As for revenue, consideration based on the contract with the customer is allocated to identified
performance obligations in view of manufacturing cost, past records of sales, etc. and revenue is
recorded when the performance obligation is satisfied.
As for its products, etc., that the Group has promised to deliver to a customer, the time when the
customer is deemed to obtain control of the product, etc., in light of contractual terms and
conditions is the timing of satisfaction of a performance obligation in the contract, and the Group
recognizes revenue at the time of arrival of the product at the customer’s location or the time of
acceptance inspection, or based on terms and conditions of trade and others. In addition, the
Group may provide services related to these products, including maintenance and operation, to
customers. Because performance obligations for these services are basically satisfied over time,
revenue for them is recorded in proportion to the contractual period. Such consideration is
generally paid within three months of the time when the performance obligation is satisfied.
Certain infrastructure, systems, etc. are individually made to order based on unique specifications
designated by customers. Performance obligations for these products are satisfied as the
production progresses. When the outcome of the performance obligation can be reasonably
measured, revenue is recorded in accordance with the proportion of cost actually incurred to the
estimated total cost. When the outcome of the performance obligation cannot be reasonably
measured, revenue is recorded only to the extent of cost incurred. Consideration for these
products is paid before or after the completion of the product based on the payment terms and

- 56 -
conditions under the contract. In addition, revenue is recorded, contract assets are recorded for
unbilled consideration, and contract liabilities are recorded for advances received from customers.
(2) Contract balances
Millions of yen Thousands of
U.S. dollars
December 31, 2018 January 1, 2018 December 31, 2018
Receivables from contracts with
customers
Notes and accounts receivable - trade ¥49,874 ¥42,962 $449,316
Contract assets 4,741 8,042 42,713
Contract liabilities ¥6,482 ¥2,935 $58,504
Revenue recognized in the fiscal year ended December 31, 2018 that was included in the contract
liability balance at the beginning of the period was ¥2,404 million ($21,663 thousand).
(3) Transaction price allocated to remaining performance obligations
Transaction price allocated to remaining performance obligations is as follows. Although revenue
for many of remaining performance obligations of the Group is realized within one year of the
fiscal year-end, there are some large pumps and system products in the Industrial Business for
which revenue is realized beyond one year.
Millions of yen Thousands of
U.S. dollars
December 31, 2018 January 1, 2018 December 31, 2018
Industrial Business ¥51,947 ¥44,971 $467,996
Medical Business ¥3,272 ¥3,064 $29,480
(4) Assets recognized from costs incurred to obtain or fulfil contracts with customers
In the fiscal year ended December 31, 2018, the amount of assets recognized from the cost to
obtain or fulfill contracts with customers was not material. In addition, when the amortization
period of assets to be recognized is one year or less, incremental cost to obtain a contract is
recognized as expenses as incurred, using the practical expedient.
25. Selling, General and Administrative Expenses
Selling, general and administrative expenses consist of the following:
Millions of yen Thousands of
U.S. dollars
Year ended
December 31, 2018
Year ended
December 31, 2017
Year ended
December 31, 2018
Defined benefits costs ¥21,960 ¥20,387 $197,840
Transportation and warehousing
expenses 3,668 3,289 33,052
Depreciation 2,954 2,135 26,613
Traveling and transportation expenses 2,023 1,867 18,228
Research and development costs 2,017 2,177 18,176
Sales commissions 1,486 884 13,392
Other 13,012 11,476 117,231
Total ¥47,123 ¥42,218 $424,536

- 57 -
26. Other Income
Other income consists of the following:
Millions of yen Thousands of
U.S. dollars
Year ended
December 31, 2018
Year ended
December 31, 2017
Year ended
December 31, 2018
Gain on disposal of fixed assets ¥22 ¥1,283 $205
Rental income 188 178 1,696
Government grant income (Note) 130 71 1,179
Insurance claim income 167 178 1,510
Gain on revision to retirement benefit
plan 275
Other 295 567 2,662
Total ¥805 ¥2,554 $7,254
Note Government grant income principally represents Ishikawa prefecture’s grant for promoting the establishment of
new business facilities related to the expansion of job opportunities and a grant for promoting the establishment of
new facilities for creative industries and others. There are no unexecuted incidental conditions or other
contingencies.
27. Other Expenses
Other expenses consist of the following:
Millions of yen Thousands of
U.S. dollars
Year ended
December 31, 2018
Year ended
December 31, 2017
Year ended
December 31, 2018
Loss on disposal of fixed assets ¥100 ¥91 $901
Loss on disaster 63 575
Other 192 135 1,732
Total ¥356 ¥227 $3,208
28. Finance Income
Finance income consists of the following:
Millions of yen Thousands of
U.S. dollars
Year ended
December 31, 2018
Year ended
December 31, 2017
Year ended
December 31, 2018
Interest income
Financial assets measured at amortized
cost ¥108 ¥102 $976
Dividend income
Financial assets measured at fair value
through other comprehensive income 248 247 2,240
Other finance income 171 143 1,543
Total ¥528 ¥493 $4,760

- 58 -
29. Finance Costs
Finance costs consist of the following:
Millions of yen Thousands of
U.S. dollars
Year ended
December 31, 2018
Year ended
December 31, 2017
Year ended
December 31, 2018
Interest expenses and discounts paid
Financial liabilities measured at
amortized cost ¥1,049 ¥820 $9,452
Net interest of defined benefit pension
plans 23 23 212
Other 2 12 19
Exchange difference losses (Note) 232 252 2,097
Other finance costs 47 4 427
Total ¥1,355 ¥1,112 $12,209
Note Exchange difference losses include gains or losses on currency-related derivative transactions.

- 59 -
30. Other Comprehensive Income
The breakdown of each item of other comprehensive income (including non-controlling interests) is as
follows:
Millions of yen Thousands of
U.S. dollars
Year ended
December 31, 2018
Year ended
December 31, 2017
Year ended
December 31, 2018
Items that will not be reclassified
subsequently to profit or loss
Financial assets measured at fair value
through other comprehensive income
Amount arising during the year ¥(1,740) ¥2,413 $(15,682)
Income taxes 533 (738) 4,801
Total ¥(1,207) ¥1,674 $(10,880)
Remeasurements of defined benefit
pension plans
Amount arising during the year ¥(54) ¥(96) $(494)
Income taxes 15 25 140
Total ¥(39) ¥(70) $(354)
Share of other comprehensive income
(loss) of associates and joint ventures
accounted for using the equity method
Amount arising during the year ¥3 ¥0 $27
Total ¥3 ¥0 $27
Items that may be reclassified
subsequently to profit or loss
Exchange differences on translation of
foreign operations
Amount arising during the year ¥(2,885) ¥3,357 $(25,996)
Total ¥(2,885) ¥3,357 $(25,996)
Gain (loss) in cash flow hedges
Amount arising during the year ¥(892) ¥(47) $(8,037)
Reclassification amount to profit or loss 467 68 4,215
Income taxes 130 (6) 1,172
Total ¥(294) ¥14 $(2,649)
Share of other comprehensive income
(loss) of associates and joint ventures
accounted for using the equity method
Amount arising during the year ¥(59) ¥31 $(540)
Total ¥(59) ¥31 $(540)
Other comprehensive income, net of tax ¥(4,483) ¥5,007 $(40,394)

- 60 -
31. Earnings per Share
Year ended
December 31, 2018
Year ended
December 31, 2017
Year ended
December 31, 2018
Millions of yen Millions of yen Thousands of U.S. dollars
Profit for the year attributable to owners
of the parent ¥7,448 ¥5,182 $67,104
Profit (loss) adjusted for the effect of
dilution ¥0 ¥(29)
Diluted profit for the year ¥7,448 ¥5,152 $67,104
Weighted-average number of ordinary
shares outstanding (Thousands of shares) 71,187 71,177
Increase in weighted-average number of
ordinary shares due to dilution
(Thousands of shares)
Increase of convertible bonds with stock
acquisition rights 5,420 9,287
Increase from stock options 110 89
Diluted weighted-average number of
ordinary shares (Thousands of shares) 76,718 80,555
Yen Yen U.S. dollars
Basic earnings per share ¥104.63 ¥72.82 $0.94
Diluted earnings per share ¥97.09 ¥63.97 $0.87
Diluted potential ordinary shares not
included in the calculation of diluted
earnings per share because their inclusion
would have been anti-dilutive

- 61 -
32. Share Based Payment
The Group has adopted an equity-settled share based payment plan (stock option plan) for certain
executives and employees, for the purpose of improving the Group’s medium- to long-term business
performance and corporate value, based on the resolution of the Company’s Board of Directors.
Expenses recorded in relation to the equity-settled share based payment were ¥30 million ($276
thousand) and ¥31 million in the years ended December 31, 2018 and 2017, respectively.
(1) Details of the stock option plan
Company name Filing company
Resolution date July 2, 2012
Category and number of persons granted Six directors of the Company (excluding outside directors)
Class and number of share options granted (shares) Ordinary shares: 20,000 shares
Grant date July 18, 2012
Vesting conditions
(1) Any allottee of stock acquisition rights may exercise the
stock acquisition rights only during 10 days from the day
following the day on which the allottee loses the status of
Company director.
(2) In the event that a holder of stock acquisition rights dies,
his or her heir shall be able to exercise his or her stock
acquisition rights. Conditions for the exercise of stock
acquisition rights by such heirs shall be stipulated in the
stock acquisition rights allotment agreement.
(3) Conditions for the exercise of stock acquisition rights in
other than the above conditions shall be stipulated in the
stock acquisition rights allotment agreement.
Target service period There is no provision for the requisite service period.
Exercise period July 19, 2012 to July 18, 2042
Company name Filing company
Resolution date July 1, 2013
Category and number of persons granted Six directors of the Company (excluding outside directors)
Class and number of share options granted (shares) Ordinary shares: 20,000 shares
Grant date July 18, 2013
Vesting conditions
(1) Any allottee of stock acquisition rights may exercise the
stock acquisition rights only during 10 days from the day
following the day on which the allottee loses the status of
Company director.
(2) In the event that a holder of stock acquisition rights dies,
his or her heir shall be able to exercise his or her stock
acquisition rights. Conditions for the exercise of stock
acquisition rights by such heirs shall be stipulated in the
stock acquisition rights allotment agreement.
(3) Conditions for the exercise of stock acquisition rights in
other than the above conditions shall be stipulated in the
stock acquisition rights allotment agreement.
Target service period There is no provision for the requisite service period.
Exercise period July 19, 2013 to July 18, 2043

- 62 -
Company name Filing company
Resolution date July 7, 2014
Category and number of persons granted Five directors of the Company (excluding outside directors)
Class and number of share options granted (shares) Ordinary shares: 30,000 shares
Grant date July 23, 2014
Vesting conditions
(1) Any allottee of stock acquisition rights may exercise the
stock acquisition rights only during 10 days from the day
following the day on which the allottee loses the status of
Company director.
(2) In the event that a holder of stock acquisition rights dies,
his or her heir shall be able to exercise his or her stock
acquisition rights. Conditions for the exercise of stock
acquisition rights by such heirs shall be stipulated in the
stock acquisition rights allotment agreement.
(3) Conditions for the exercise of stock acquisition rights in
other than the above conditions shall be stipulated in the
stock acquisition rights allotment agreement.
Target service period There is no provision for the requisite service period.
Exercise period July 24, 2014 to July 23, 2044
Company name Filing company
Resolution date July 6, 2015
Category and number of persons granted Five directors of the Company (excluding outside directors)
Class and number of share options granted (shares) Ordinary shares: 28,000 shares
Grant date July 23, 2015
Vesting conditions
(1) Any allottee of stock acquisition rights may exercise the
stock acquisition rights only during 10 days from the day
following the day on which the allottee loses the status of
Company director.
(2) In the event that a holder of stock acquisition rights dies,
his or her heir shall be able to exercise his or her stock
acquisition rights. Conditions for the exercise of stock
acquisition rights by such heirs shall be stipulated in the
stock acquisition rights allotment agreement.
(3) Conditions for the exercise of stock acquisition rights in
other than the above conditions shall be stipulated in the
stock acquisition rights allotment agreement.
Target service period There is no provision for the requisite service period.
Exercise period July 24, 2015 to July 23, 2045

- 63 -
Company name Filing company
Resolution date April 4, 2016
Category and number of persons granted Six directors of the Company (excluding outside directors)
Class and number of share options granted (shares) Ordinary shares: 37,000 shares
Grant date April 21, 2016
Vesting conditions
(1) Any allottee of stock acquisition rights may exercise the
stock acquisition rights only during 10 days from the day
following the day on which the allottee loses the status of
Company director.
(2) In the event that a holder of stock acquisition rights dies,
his or her heir shall be able to exercise his or her stock
acquisition rights. Conditions for the exercise of stock
acquisition rights by such heirs shall be stipulated in the
stock acquisition rights allotment agreement.
(3) Conditions for the exercise of stock acquisition rights in
other than the above conditions shall be stipulated in the
stock acquisition rights allotment agreement.
Target service period There is no provision for the requisite service period.
Exercise period April 22, 2016 to April 21, 2046
Company name Filing company
Resolution date April 10, 2017
Category and number of persons granted Six directors of the Company (excluding outside directors)
Class and number of share options granted (shares) Ordinary shares: 34,000 shares
Grant date April 28, 2017
Vesting conditions
(1) Any allottee of stock acquisition rights may exercise the
stock acquisition rights only during 10 days from the day
following the day on which the allottee loses the status of
Company director.
(2) In the event that a holder of stock acquisition rights dies,
his or her heir shall be able to exercise his or her stock
acquisition rights. Conditions for the exercise of stock
acquisition rights by such heirs shall be stipulated in the
stock acquisition rights allotment agreement.
(3) Conditions for the exercise of stock acquisition rights in
other than the above conditions shall be stipulated in the
stock acquisition rights allotment agreement.
Target service period There is no provision for the requisite service period.
Exercise period April 29, 2017 to April 28, 2047

- 64 -
Company name Filing company
Resolution date April 9, 2018
Category and number of persons granted Six directors of the Company (excluding outside directors)
Class and number of share options granted (shares) Ordinary shares: 30,000 shares
Grant date April 27, 2018
Vesting conditions
(1) Any allottee of stock acquisition rights may exercise the
stock acquisition rights only during 10 days from the day
following the day on which the allottee loses the status of
Company director.
(2) In the event that a holder of stock acquisition rights dies,
his or her heir shall be able to exercise his or her stock
acquisition rights. Conditions for the exercise of stock
acquisition rights by such heirs shall be stipulated in the
stock acquisition rights allotment agreement.
(3) Conditions for the exercise of stock acquisition rights in
other than the above conditions shall be stipulated in the
stock acquisition rights allotment agreement.
Target service period There is no provision for the requisite service period.
Exercise period April 28, 2018 to April 27, 2048
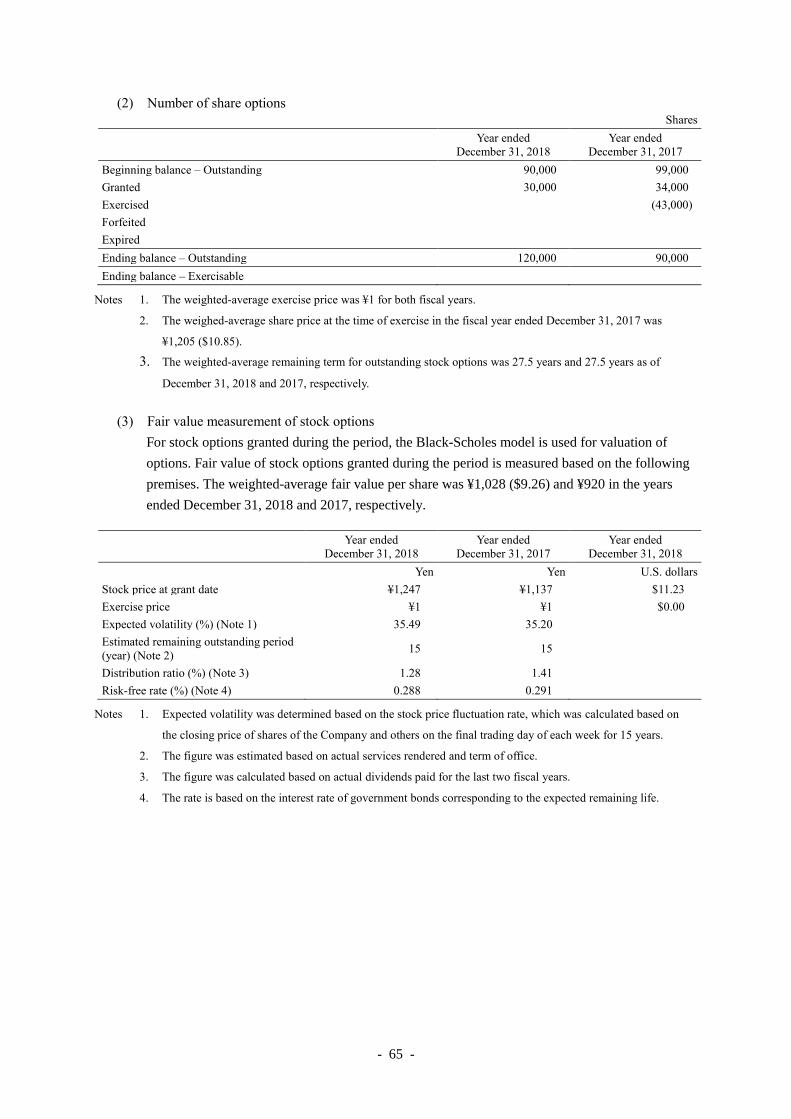
- 65 -
(2) Number of share options
Shares
Year ended
December 31, 2018
Year ended
December 31, 2017
Beginning balance – Outstanding 90,000 99,000
Granted 30,000 34,000
Exercised (43,000)
Forfeited
Expired
Ending balance – Outstanding 120,000 90,000
Ending balance – Exercisable
Notes 1. The weighted-average exercise price was ¥1 for both fiscal years.
2. The weighed-average share price at the time of exercise in the fiscal year ended December 31, 2017 was
¥1,205 ($10.85).
3. The weighted-average remaining term for outstanding stock options was 27.5 years and 27.5 years as of
December 31, 2018 and 2017, respectively.
(3) Fair value measurement of stock options
For stock options granted during the period, the Black-Scholes model is used for valuation of
options. Fair value of stock options granted during the period is measured based on the following
premises. The weighted-average fair value per share was ¥1,028 ($9.26) and ¥920 in the years
ended December 31, 2018 and 2017, respectively.
Year ended
December 31, 2018
Year ended
December 31, 2017
Year ended
December 31, 2018
Yen Yen U.S. dollars
Stock price at grant date ¥1,247 ¥1,137 $11.23
Exercise price ¥1 ¥1 $0.00
Expected volatility (%) (Note 1) 35.49 35.20
Estimated remaining outstanding period
(year) (Note 2) 15 15
Distribution ratio (%) (Note 3) 1.28 1.41
Risk-free rate (%) (Note 4) 0.288 0.291
Notes 1. Expected volatility was determined based on the stock price fluctuation rate, which was calculated based on
the closing price of shares of the Company and others on the final trading day of each week for 15 years.
2. The figure was estimated based on actual services rendered and term of office.
3. The figure was calculated based on actual dividends paid for the last two fiscal years.
4. The rate is based on the interest rate of government bonds corresponding to the expected remaining life.

- 66 -
33. Financial Instruments
(1) Classification of financial instruments
The carrying amount of financial assets by category is as follows:
Millions of yen Thousands of
U.S. dollars
December 31, 2018 December 31, 2017 December 31, 2018
Financial assets measured at amortized
cost
Cash and cash equivalents ¥29,269 ¥34,095 $263,691
Trade and other receivables 54,077 50,434 487,181
Other 1,755 1,693 15,818
Financial assets measured at fair value
through profit or loss
Derivatives 467
Other 320 293 2,888
Financial assets measured at fair value
through other comprehensive income
Equity securities 12,856 14,597 115,828
Total ¥98,280 ¥101,582 $885,407
Because shares are principally held for policy investment purposes and not aimed at profit taking
through their sale and purchase in the short term, shares are designated as financial assets
measured at fair value through other comprehensive income.
Major components and fair values of financial assets measured at fair value through other
comprehensive income are as follows:
December 31, 2017
Millions of yen
Stock name Amount
JGC CORPORATION ¥2,225
Weihai Weigao Blood Purification Product Co., Ltd. 1,731
Sumitomo Realty & Development Co., Ltd. 1,089
Okuma Corporation 1,082
TAIHEI DENGYO KAISHA, LTD. 1,043
Seika Corporation 914
Daifuku Co., Ltd. 910
Iwatani Corporation 848
NIHON KOHDEN CORPORATION 630
Mitsubishi UFJ Financial Group, Inc. 398

- 67 -
December 31, 2018
Millions of yen Thousands of
U.S. dollars
Stock name Amount Amount
Weihai Weigao Blood Purification Product Co., Ltd. ¥1,812 $16,330
JGC CORPORATION 1,732 15,610
Sumitomo Realty & Development Co., Ltd. 1,217 10,969
TAIHEI DENGYO KAISHA, LTD. 988 8,908
Iwatani Corporation 891 8,030
NIHON KOHDEN CORPORATION 868 7,828
Daifuku Co., Ltd. 824 7,424
Okuma Corporation 782 7,045
Seika Corporation 486 4,386
SHIN NIPPON AIR TECHNOLOGIES Co., LTD. 459 4,140
Dividend income on financial assets measured at fair value through other comprehensive income
is as follows:
Millions of yen Thousands of
U.S. dollars
Year ended
December 31, 2018
Year ended
December 31, 2017
Year ended
December 31, 2018
Dividend income related to investments
held as of December 31 ¥248 ¥247 $2,240
The carrying amount of financial liabilities by category is as follows:
Millions of yen Thousands of
U.S. dollars
December 31, 2018 December 31, 2017 December 31, 2018
Financial liabilities measured at
amortized cost
Bonds and borrowings ¥117,052 ¥122,528 $1,054,530
Trade and other payables 27,380 22,624 246,666
Other 837 742 7,542
Financial liabilities measured at fair
value through profit or loss
Derivatives 840 400 7,569
Total ¥146,110 ¥146,295 $1,316,309
(2) Financial risk management policy
The basic capital policy of the Group is to achieve sustainable growth and improve corporate
value in the medium to long term while seeking an optimal balance among financial health,
capital efficiency, and return of profits to its shareholders. Based on the recognition that
continuous and stable return of profits to shareholders who support the Group is an important
pillar of the Company’s capital policy, the Group promotes the growth of existing businesses and
appropriately applies internal reserves to reinvestments for development of new businesses and
promotion and improvement of productivity in order to achieve sustainable development from a
longer-term perspective. As of December 31, 2018, no capital control was externally imposed on
the Group.
The Group is exposed to financial risks (credit risk, liquidity risk, foreign exchange risk, interest
rate risk, market price fluctuation risk) in the course of operating activities and conducts risk

- 68 -
management based on a certain policy to mitigate these financial risks. The fund management
policy has been approved by management, and transactions and risk management during the
period have been conducted principally in accordance with internal management regulations. The
Group uses derivatives to mitigate the risks stated below and does not perform any speculative
transactions, as a matter of policy.
(i) Credit risk management
The Group is exposed to the credit risk of customers in association with notes and accounts
receivable, which are trade receivables, and contract assets. Shares and others held for policy
purposes are exposed to the credit risk of issuers. Furthermore, derivative transactions
conducted for the purpose of mitigating market risk are exposed to the credit risk of financial
institutions that are counterparties to the transactions.
Based on the policy of credit management, the Group manages due dates and balances by
counterparty for trade receivables. With regard to counterparties for which the Group
particularly has concerns about credit risk, the Group early captures concerns about collection
due to deterioration of financial conditions, etc. by regularly monitoring such conditions, and
examines and implements protection measures on an individual basis. In addition, the Group
monitors economic conditions, market trends, and others surrounding debtors and examines
future trends in credit risk. The Group does not have any credit risk that is overly concentrated
in a sole counterparty or group to which the counterparty belongs. Since derivative
transactions are restricted to financial institutions with high credit ratings as counterparties to
mitigate counterparty risk, the Company deems there to be hardly any credit risk.
These financial instruments are considered to be debt defaults when all or part of the
instruments cannot be collected or it is considered extremely difficult to collect them.

- 69 -
1) Maximum exposure to credit risk
The Group’s exposure to credit risk by rating is as follows. The Group does not have
anything deemed to be collateral or credit enhancement.
December 31, 2017
Millions of yen
Days in arrears
Financial assets
measured at the
amount equivalent to
12-month expected
credit losses
Financial assets measured at the amount
equivalent to lifetime expected credit losses
Total Financial assets of
which credit risk has
increased significantly
since the initial
recognition
Financial assets in
which an allowance for
doubtful accounts are
always measured at the
amount equal to
lifetime expected
credit losses
No arrears ¥798 ¥41,783 ¥42,581
Within 1 month 1 ¥0 3,393 3,395
Over 1 month but
within 2 months 1,265 1,265
Over 2 months but
within 3 months 7 837 844
Over 3 months 56 222 3,751 4,030
Total ¥863 ¥222 ¥51,030 ¥52,117
December 31, 2018
Millions of yen
Days in arrears
Financial assets
measured at the
amount equivalent to
12-month expected
credit losses
Financial assets measured at the amount
equivalent to lifetime expected credit losses
Total Financial assets of
which credit risk has
increased significantly
since the initial
recognition
Financial assets in
which an allowance for
doubtful accounts are
always measured at the
amount equal to
lifetime expected
credit losses
No arrears ¥939 ¥42,048 ¥42,987
Within 1 month 4 6,357 6,362
Over 1 month but
within 2 months 0 2,377 2,377
Over 2 months but
within 3 months 7 885 892
Over 3 months 59 ¥204 2,966 3,231
Total ¥1,011 ¥204 ¥54,635 ¥55,851

- 70 -
December 31, 2018
Thousands of U.S. dollars
Days in arrears
Financial assets
measured at the
amount equivalent to
12-month expected
credit losses
Financial assets measured at the amount
equivalent to lifetime expected credit losses
Total Financial assets of
which credit risk has
increased significantly
since the initial
recognition
Financial assets in
which an allowance for
doubtful accounts are
always measured at the
amount equal to
lifetime expected
credit losses
No arrears $8,461 $378,812 $387,273
Within 1 month 40 57,278 57,318
Over 1 month but
within 2 months 6 21,416 21,423
Over 2 months but
within 3 months 69 7,973 8,043
Over 3 months 532 $1,846 26,729 29,108
Total $9,110 $1,846 $492,210 $503,167
2) Changes in allowance for doubtful accounts
Changes in allowance for doubtful accounts of the Group’s credit risk by rating are as
follows. If trade and other receivables are impaired, the Group records an allowance for
doubtful accounts, instead of directly reducing the carrying amount.
Millions of yen
Financial assets
measured at the amount
equivalent to 12-month
expected credit losses
Financial assets measured at the amount
equivalent to lifetime expected credit losses
Total Financial assets of
which credit risk has
increased significantly
since the initial
recognition
Financial assets in
which an allowance for
doubtful accounts are
always measured at the
amount equal to
lifetime expected credit
losses
January 1, 2017 ¥14 ¥198 ¥675 ¥887
Increase during the
year 5 186 191
Decrease during the
year (Utilization) (3) (43) (47)
Decrease during the
year (Reversal) (44) (44)
Other (14) 19 98 103
December 31, 2017 ¥1 ¥217 ¥872 ¥1,091
Increase during the
year 328 328
Decrease during the
year (Utilization) (56) (56)
Decrease during the
year (Reversal) (0) (141) (142)
Other (0) (12) (56) (68)
December 31, 2018 ¥1 ¥204 ¥946 ¥1,152

- 71 -
Thousands of U.S. dollars
Financial assets
measured at the amount
equivalent to 12-month
expected credit losses
Financial assets measured at the amount
equivalent to lifetime expected credit losses
Total Financial assets of
which credit risk has
increased significantly
since the initial
recognition
Financial assets in
which an allowance for
doubtful accounts are
always measured at the
amount equal to
lifetime expected credit
losses
December 31, 2017 $13 $1,961 $7,856 $9,832
Increase during the
year 2,963 2,963
Decrease during the
year (Utilization) (509) (509)
Decrease during the
year (Reversal) (0) (1,278) (1,279)
Other (0) (115) (505) (620)
December 31, 2018 $12 $1,846 $8,526 $10,385
(ii) Liquidity risk management
While most of trade liabilities of the Group are due within one year and funds are raised
through borrowings, the Group is exposed to liquidity risk of failure to repay on the due date
resulting from deterioration of the financing environment, etc. The Group manages liquidity
risk by developing and updating a funding plan in a timely manner based on reports from each
department and other means.
Balances of financial liabilities by due date are as follows:
December 31, 2017
Millions of yen
Carrying
amount
Contract
amount Within 1 year
Over 1 year but
within 5 years Over 5 years
Non-derivative financial
liabilities
Bonds and borrowings ¥122,528 ¥122,572 ¥78,046 ¥27,677 ¥16,847
Trade and other payables 22,624 22,624 22,624
Other 742 746 574 130 42
Derivative financial liabilities
Derivatives ¥400 ¥400 ¥2 ¥142 ¥255
December 31, 2018
Millions of yen
Carrying
amount
Contract
amount Within 1 year
Over 1 year but
within 5 years Over 5 years
Non-derivative financial
liabilities
Borrowings ¥117,052 ¥117,052 ¥40,056 ¥44,532 ¥32,464
Trade and other payables 27,380 27,380 27,380
Other 837 843 628 174 40
Derivative financial liabilities
Derivatives ¥840 ¥840 ¥15 ¥184 ¥640

- 72 -
December 31, 2018
Thousands of U.S. dollars
Carrying
amount
Contract
amount Within 1 year
Over 1 year but
within 5 years Over 5 years
Non-derivative financial
liabilities
Borrowings $1,054,530 $1,054,530 $360,867 $401,189 $292,473
Trade and other payables 246,666 246,666 246,666
Other 7,542 7,597 5,661 1,573 361
Derivative financial liabilities
Derivatives $7,569 $7,569 $136 $1,658 $5,773
To prepare for liquidity risk, the Group has credit lines such as commitment line contracts
with several financial institutions in an effort to reduce liquidity risk. Credit lines held by the
Group are as follows:
Millions of yen Thousands of
U.S. dollars
December 31, 2018 December 31, 2017 December 31, 2018
Credit lines ¥46,967 ¥60,595 $423,130
Credit lines used (33,434) (49,259) (301,209)
Credit lines unused ¥13,533 ¥11,335 $121,921
(iii) Currency risk management
The Group enters into transactions in foreign currencies because of its global business
development, and is exposed to risk that profit or loss, cash flows, and others are subject to
fluctuations in foreign exchange rates.
To mitigate the risk of fluctuations in foreign exchange rates, the Group principally uses
foreign exchange forward contracts for the position of trade receivables and payables in
foreign currency netted. The Group performs risk management based on the derivative
transaction management regulations that provide for authority for transactions, amount limits
and others, and reports trading conditions to management.
Consolidated subsidiaries also perform risk management in accordance with the derivative
transaction management regulations.
The impact of a 1% appreciation of the Japanese yen against the US Dollar on profit before
tax in each fiscal year is as follows. In this analysis, translation was made with foreign
exchange rates at the end of the fiscal year adjusted for 1% fluctuation, based on the
assumption that other variable factors (such as balances and interest rate) are constant.
Millions of yen Thousands of
U.S. dollars
December 31, 2018 December 31, 2017 December 31, 2018
Profit before tax
USD ¥(82) ¥(69) $(740)

- 73 -
(iv) Interest rate risk management
The Group is exposed to the risk of interest rate fluctuations mainly related to long-term
borrowings, and manages changes in cash flows principally by entering into interest rate swap
contracts to minimizes the effects of these changes. Interest rate swap contracts are contracts
with receivable floating rates and payable fixed rates, and long-term liabilities on a floating
interest rate basis are treated as long-term liabilities on a fixed interest rate basis by receiving
the portion of the floating rate paid on borrowings and by paying the fixed rate.
The Group performs risk management in accordance with the derivative transaction
management regulations that provide for authority for transactions, amount limits and others,
and reports trading conditions to management. Consolidated subsidiaries also conduct
investments in accordance with the derivative transaction management regulations.
For financial instruments held by the Group as of December 31, 2017 and December 31,
2018, the impact of a 1% increase in the interest rate on profit before tax is as follows.
However, this analysis is based on the assumption that other variable factors (such as
balances) are constant. In the analysis, the amount of impact was calculated by multiplying
the net balance of financial instruments that are affected by fluctuations in interest rates at the
end of each reporting period by 1%.
Millions of yen Thousands of
U.S. dollars
December 31, 2018 December 31, 2017 December 31, 2018
Profit before tax ¥(287) ¥(510) $(2,585)
(v) Market price fluctuation risk management
The Group is exposed to risk of fluctuations in share prices arising from equity instruments
(shares).
The Group holds shares of business partners and others with the aim of establishing stable and
long-term transaction relationships and business alliances and strengthening transaction
relationships with business partners and others from a standpoint of pursuing sustainable
growth and improvement in corporate value in the medium to long term and examines
medium- to long-term economic rationality and the effects of the shareholding from a
perspective of maintaining and enhancing relationships with business partners and others each
fiscal period. No equity instruments are held for the purpose of short-term trading, and the
Group does not sell these equity instruments actively.
In the fiscal years ended December 31, 2017 and 2018, the impact on other comprehensive
income before tax, on the assumption that share prices decrease by 1%, is as follows. Since
marketable shares held by the Group have been designated as financial assets measured at fair
value through other comprehensive income, there is no impact on profit before tax on the
assumption that share prices decrease by 1%.
Millions of yen Thousands of
U.S. dollars
December 31, 2018 December 31, 2017 December 31, 2018
Other comprehensive income before tax ¥(109) ¥(127) $(98,879)

- 74 -
(3) Fair values of financial instruments
Fair values of financial instruments are as follows. Fair values are classified into three levels
based on valuation techniques used, and the details have been provided in “3. Significant
Accounting Policies (18) Fair value measurements.”
(i) Fair values of financial instruments measured at amortized cost
Carrying amounts and fair values of financial instruments measured at amortized cost in the
fiscal years ended December 31, 2018 and 2017 are as follows. A note has been omitted with
regard to financial assets and liabilities with fair values that approximate the carrying amount.
Fair values of bonds and long-term borrowings for which the contract term is over one year
were determined based on the present value, which was calculated by discounting the total
sum of principal and interest using the interest rate assumed to be applied for a new, similar
borrowing.
Millions of yen Thousands of
U.S. dollars
December 31, 2018 December 31, 2017 December 31, 2018
Carrying
amount Fair value
Carrying
amount Fair value
Carrying
amount Fair value
Financial liabilities
Bonds ¥14,956 ¥15,037
Long-term borrowings ¥83,068 ¥83,337 53,868 53,963 $748,366 $750,792
Note The fair value measurement level of bonds and borrowings is Level 2.
(ii) Fair values of financial instruments measured at fair values on a recurring basis
The fair value hierarchy of financial instruments measured at fair value on a recurring basis in
the fiscal years ended December 31, 2018 and 2017 is as follows. There is no significant
financial instrument measured at fair value on a non-recurring basis.
Derivatives are principally transactions related to foreign exchange forward contracts, interest
rate swaps, cross-currency interest rate swaps, and interest rate caps. Their fair value is
calculated based on observable market data presented by financial institutions and others with
which the Group has transactions.
Fair value of listed shares is based on prices at the stock exchange.
Fair value measurements of unlisted shares and others is calculated using a valuation
technique based on discounted future cash flows, a valuation technique based on the market
prices of comparable companies, a valuation technique based on net asset value and other
valuation techniques. In the measurement of fair value of unlisted shares, unobservable
inputs, such as discount rate and valuation multiples, are used, and certain non-current
discounts and non-controlling interest discount are taken into account where necessary.
The Group measures fair value related to Level 3 financial instruments in accordance with
relevant internal regulations, and uses valuation techniques and inputs that must appropriately
reflect the nature, characteristics, and risks of the financial instrument to be measured. Results
of the measurement are reviewed by senior executives. Of unobservable inputs that are used
to determine fair value of equity instruments classified as Level 3, the major input is the
price-book value ratio in the comparable company analysis method. Fair value increases
(decreases) due to an increase (decrease) in the price-bookvalue ratio. For financial
instruments classified as Level 3, a significant increase or decrease in fair value is not

- 75 -
expected in cases where unobservable inputs are changed to reasonably possible alternative
assumptions.
December 31, 2017
Millions of yen
Fair value
Level 1 Level 2 Level 3 Total
Other short-term financial assets
Derivatives designated as hedge ¥467 ¥467
Other ¥64 64
Long-term financial assets
Investment securities ¥12,797 1,800 14,597
Other 16 212 228
Total assets ¥12,797 ¥484 ¥2,076 ¥15,358
Other short-term financial liabilities
Derivatives designated as hedge 2 2
Other long-term financial liabilities
Derivatives designated as hedge 398 398
Total liabilities - ¥400 - ¥400
December 31, 2018
Millions of yen
Fair value
Level 1 Level 2 Level 3 Total
Other short-term financial assets
Other ¥65 ¥65
Long-term financial assets
Investment securities ¥10,975 1,881 12,856
Other ¥21 232 254
Total assets ¥10,975 ¥21 ¥2,180 ¥13,177
Other long-term financial liabilities
Derivatives designated as hedge 840 840
Total liabilities - ¥840 - ¥840
December 31, 2018
Thousands of
U.S. dollars
Fair value
Level 1 Level 2 Level 3 Total
Other short-term financial assets
Other $591 $591
Long-term financial assets
Investment securities $98,879 16,949 115,828
Other $197 2,098 2,296
Total assets $98,879 $197 $19,640 $118,716
Other long-term financial liabilities
Derivatives designated as hedge 7,569 7,569
Total liabilities - $7,569 - $7,569

- 76 -
Changes in financial instruments classified as Level 3 from the beginning to the end of the
fiscal year are as follows:
Millions of yen Thousands of
U.S. dollars
Year ended
December 31, 2018
Year ended
December 31, 2017
Year ended
December 31, 2018
Beginning balance ¥2,076 ¥668 $18,709
Gains or losses recognized as profit or
loss 6 (19) 55
Gains or losses recognized as other
comprehensive income 80 41 729
Purchases 20 1,777 183
Effects of change in scope of
consolidation (162)
Sales (18) (247) (170)
Transfer to (from) Level 3
Other 14 19 133
Ending balance ¥2,180 ¥2,076 $19,640
(4) Hedge accounting
Changes in fair value of interest rate swap contracts designated against interest rate cash flows
related to borrowings and currency swap contracts designated against fluctuations in foreign
exchange rates of borrowings in foreign currency are treated as other comprehensive income and
treated as finance costs over the period during which interest on the borrowings affects the
consolidated statement of profit or loss. In the fiscal years ended December 31, 2017 and 2018,
there was no significant amount recognized as profit or loss with regard to the ineffective portion
of hedges and the portion excluded from assessment of hedge effectiveness. There is no amount
that was reclassified from valuation difference on cash flow hedges to profit or loss because a
forecast transaction was no longer expected to occur.
As of December 31, 2018, the period in which cash flows of hedged items are expected to occur
and in which these cash flows are expected to affect profit or loss was from March 2020 to March
2025.
(i) Hedging instruments
December 31, 2017
Millions of yen
Risk
classification Hedging instruments
Contract
amount Assets Liabilities
Line item in the
consolidated
statement of
financial position
Changes in fair
value used in
calculation of
ineffective portion
of hedges
Interest rate
risk Interest rate swaps ¥21,428 ¥399
Other short-term
financial liabilities
Other long-term
financial liabilities
¥15
Currency risk Cross-currency interest
rate swaps 2,500 ¥467
Other short-term
financial assets (68)

- 77 -
December 31, 2018
Millions of yen
Risk
classification Hedging instruments
Contract
amount Assets Liabilities
Line item in the
consolidated
statement of
financial position
Changes in fair
value used in
calculation of
ineffective portion
of hedges
Interest rate
risk Interest rate swaps ¥37,322 ¥840
Other long-term
financial liabilities ¥(425)
December 31, 2018
Thousands of U.S. dollars
Risk
classification Hedging instruments
Contract
amount Assets Liabilities
Line item in the
consolidated
statement of
financial position
Changes in fair
value used in
calculation of
ineffective portion
of hedges
Interest rate
risk Interest rate swaps $336,234 $7,567
Other long-term
financial liabilities $3,828
(ii) Hedged items
December 31, 2017
Millions of yen
Risk classification Hedged items
Changes in fair value used in
calculation of ineffective portion of
hedges
Reserve of cash flow hedges
Interest rate risk Borrowings ¥15 ¥(278)
Currency risk Borrowings ¥(68)
December 31, 2018
Millions of yen
Risk classification Hedged items
Changes in fair value used in
calculation of ineffective portion of
hedges
Reserve of cash flow hedges
Interest rate risk Borrowings ¥(425) ¥(572)
December 31, 2018
Thousands of U.S. dollars
Risk classification Hedged items
Changes in fair value used in
calculation of ineffective portion of
hedges
Reserve of cash flow hedges
Interest rate risk Borrowings $(3,828) $(5,154)

- 78 -
(iii) Effect of consolidated statement of profit or loss and consolidated statement of
comprehensive income
Year ended December 31, 2017
Millions of yen
Risk classification Hedging instruments
Gains or losses on
hedges recognized in
other comprehensive
income
Amount transferred
from reserve of cash
flow hedges to profit or
loss
Line item in profit or
loss affected by the
transfer
Interest rate risk Interest rate swaps ¥15
Currency risk Cross-currency interest
rate swaps (68) ¥(68) Finance costs
Note The figure represents an amount before tax effect adjustments.
Year ended December 31, 2018
Millions of yen
Risk classification Hedging instruments
Gains or losses on
hedges recognized in
other comprehensive
income
Amount transferred
from reserve of cash
flow hedges to profit or
loss
Line item in profit or
loss affected by the
transfer
Interest rate risk Interest rate swaps ¥(425)
Currency risk Cross-currency interest
rate swaps (467) ¥(467) Finance costs
Note The figure represents an amount before tax effect adjustments.
Year ended December 31, 2018
Thousands of
U.S. dollars
Risk classification Hedging instruments
Gains or losses on
hedges recognized in
other comprehensive
income
Amount transferred
from reserve of cash
flow hedges to profit or
loss
Line item in profit or
loss affected by the
transfer
Interest rate risk Interest rate swaps $(3,828)
Currency risk Cross-currency interest
rate swaps (4,215) $(4,215) Finance costs
Note Figures represent amounts before tax effect adjustments.

- 79 -
(5) Changes in liabilities arising from financing activities
Year ended December 31, 2017
Millions of yen
Beginning
balance Cash flows
Non-cash flows
Ending
balance Acquisition Changes in
fair value
Foreign
currency
translation
Other
Short-term borrowings ¥13,795 ¥39,821 ¥150 ¥(64) ¥53,703
Bonds and long-term
borrowings 56,088 12,488 174 73 68,825
Lease obligations 194 (75) ¥76 2 197
Derivative assets 536 ¥(68) 467
Derivative liabilities 421 73 (88) (4) 400
Note Other includes changes and others in amortized cost.
Year ended December 31, 2018
Millions of yen
Beginning
balance Cash flows
Non-cash flows
Ending
balance Acquisition Changes in
fair value
Foreign
currency
translation
Other
Short-term borrowings ¥53,703 ¥(19,277) ¥(505) ¥64 ¥33,984
Bonds and long-term
borrowings 68,825 14,930 (730) 43 83,068
Lease obligations 197 (71) ¥127 (0) 2 255
Derivative assets 467 ¥(467)
Derivative liabilities 400 474 (53) 18 840
Note Other includes changes and others in amortized cost.
Year ended December 31, 2018
Thousands of
U.S. dollars
Beginning
balance Cash flows
Non-cash flows
Ending
balance Acquisition Changes in
fair value
Foreign
currency
translations
Other
Short-term borrowings $483,812 $(173,670) $(4,557) $579 $306,163
Bonds and long-term
borrowings 620,050 134,508 $(6,582) 390 748,366
Lease obligations 1,776 (644) $1,152 $(5) 18 2,297
Derivative assets 4,215 $(4,215)
Derivative liabilities $3,610 $4,272 $(483) $170 $7,569
Note Other includes changes and others in amortized cost.

- 80 -
34. Related-party Disclosures
(1) Transactions with related parties
Year ended December 31, 2017
Type Related-party transactions
Amount of
transaction
(Millions of yen)
Account title Outstanding balance
(Millions of yen)
Joint ventures
Sale of goods ¥2,384 Trade receivables ¥450
Purchase of goods 18 Trade payables
Loan of funds 0 Loans 67
Associates
Sale of goods 529 Trade receivables 483
Purchase of goods 136 Trade payables 7
Deposit of funds 0 Deposits received 29
Note The price of transactions with related parties has been determined through negotiations, taking the prevailing market
price into account.
Year ended December 31, 2018
Type Related-party transactions
Amount of
transaction
(Millions of yen)
Account title Outstanding balance
(Millions of yen)
Joint ventures
Sale of goods ¥2,790 Trade receivables ¥896
Purchase of goods 393 Trade payables 1
Loan of funds Loans 63
Associates
Sale of goods 775 Trade receivables 773
Purchase of goods 149 Trade payables 12
Deposit of funds 0 Deposits received 60
Year ended December 31, 2018
Type Related-party transactions
Amount of
transaction
(Thousands of
U.S. dollars)
Account title
Outstanding balance
(Thousands of
U.S. dollars)
Joint ventures
Sale of goods $25,137 Trade receivables $8,072
Purchase of goods 3,540 Trade payables 14
Loan of funds Loans 572
Associates
Sale of goods 6,982 Trade receivables $6,968
Purchase of goods 1,350 Trade payables 116
Deposit of funds $2 Deposits received 545
Note The price of transactions with related parties has been determined through negotiations, taking the prevailing market
price into account.
(2) Remuneration for management personnel
Millions of yen Thousands of
U.S. dollars
Year ended
December 31, 2018
Year ended
December 31, 2017
Year ended
December 31, 2018
Basic remuneration and bonuses ¥139 ¥133 $1,261
Share-based payment 30 31 $277
Total ¥170 ¥164 $1,538

- 81 -
35. Business Combinations
Year ended December 31, 2017
(1) Outline of the business combinations
(i) Names and business descriptions of acquiree
The Company acquired all shares of a total of 21 companies consisting of ACD, LLC,
Cosmodyne, LLC, Cryoquip, LLC, CIS and their 17 subsidiaries which served as operating
companies under the control of Cryogenic Industries group through NIKKISO
INTERNATIONAL Co., Ltd., a consolidated subsidiary of the Company and the newly
established Cryogenic Industries Holdings, Inc. (the company name was changed to
Cryogenic Industries, Inc. as of September 27, 2017).
Name and business description of major acquirees are as follows.
Name of acquiree Business description
ACD, LLC
Manufacturing and sales of industrial gas, centrifugal
pumps for energy industries, reciprocating pumps,
and turbo expanders, etc.
Cosmodyne, LLC EPC for industrial gas, air separation for energy
industries, gas purifying and gas liquidation plants
Cryoquip, LLC Manufacturing and sale of heat exchangers for
industrial gas and energy industries
Cryogenic Industries AG Business management of subsidiaries
(ii) Main reasons for the business combinations
With ACD, Cosmodyne, and Cryoquip, CIS under the control of Cryogenic Industries group,
is one of the world’s leading companies providing a wide range of products and services for
plants in fields of industrial gases such as oxygen, nitrogen, and argon, and of natural gases
such as methane. The Group, including LEWA and Geveke, which became subsidiaries of the
Company, has established a strong position in the market as one of world’s rare pump and
system manufactures with various products and services for upstream fields, such as
development of crude oil and natural gas, to the downstream fields including transportation of
liquefied natural gas (LNG), petroleum refinery, and petroleum chemistry.
Cryogenic Industries group’s core technology, centrifugal and reciprocating pumps, is a
common element in the Group’s technology, moreover, the company has vaporization and
liquefaction technologies which are expected to enhance the Company’s existing business.
The combination of each operating company under the control of Cryogenic Industries group
will create business synergy effects to improve products, services, and network for services. It
is also expected to create opportunities to join growing markets, such as industrial gas and
clean energy, including hydrogen.
(iii) Date of business combinations
August 21, 2017
(iv) Legal form of business combinations
Acquisition of shares
(v) Ratio of voting rights of major companies acquired
ACD, LLC 100%
Cosmodyne, LLC 100%
Cryoquip, LLC 100%
Cryogenic Industries AG 100%

- 82 -
(2) Breakdown of fair value of assets and liabilities and consideration for acquisition as of the
acquisition date
Millions of yen
Amount
Cash and cash equivalents ¥5,715
Trade and other receivables 3,077
Other short-term financial assets 616
Inventories 4,541
Other current assets 391
Property, plant and equipment 895
Intangible assets 9,434
Long-term financial assets 35
Other non-current assets 2
Trade and other payables (2,044)
Other current liabilities (1,520)
Other long-term financial liabilities (18)
Deferred tax liabilities (2,148)
Goodwill 28,863
Total ¥47,840
Cash 47,840
Total consideration transferred ¥47,840
Notes 1. The fair value of trade and other receivables is largely the same as the carrying amount.
2. No contingent liabilities other than liabilities assumed have been identified.
Major components of goodwill are synergy effects with the existing business that are expected to
arise from the acquisition and excess earnings power, which do not meet the recognition criteria
individually. The goodwill is not deductible for tax purposes. Acquisition-related costs associated
with the business combinations were ¥948 million, fully expensed in “selling, general and
administrative expenses.”
(3) Cash flows associated with the acquisition
Millions of yen
Amount
Total consideration transferred ¥47,840
Cash and cash equivalents that were held by the acquired
companies at the time of the acquisition (5,715)
Payments for acquisition of subsidiaries ¥42,125
(4) Impact on the financial results of the Group
The consolidated statement of profit or loss includes ¥5,498 million of revenue and ¥268 million
of loss for the year from Cryogenic Industries group on and after the acquisition date. On the
assumption that the business combinations had been conducted at the beginning of the fiscal year,
revenue would have been ¥13,877 million and profit for the year would have been ¥1,133 million.
The Company has not received an audit certificate for these estimated amounts.

- 83 -
Year ended December 31, 2018
There was no significant business combination.
36. Information on Affiliates
In the fiscal years ended December 31, 2018 and 2017, there were no affiliates that had individually
significant non-controlling interests, and there were no material restrictions, etc. on the ability to access
or use assets of affiliates and settle their liabilities.
37. Events after the Reporting Period
The Company resolved, at the Board of Directors meeting held on February 22, 2019, to submit a
proposal for reduction of capital reserves to the 78th Ordinary General Meeting of Shareholders held on
March 28, 2019, and the proposal was resolved at said general meeting.
1. Purpose of reduction of capital reserves
To secure mobility and flexibility in future capital policies, capital reserves shall be reduced and
transferred to other capital surplus on the basis of Article 448, Paragraph 1 of the Companies Act.
2. Outline of reduction of capital reserves
(1) Reduction of capital reserves
Capital reserves shall be reduced from ¥10,700,690,213 ($96,402 thousand) to ¥174,234,798
($1,569 thousand), with a reduced amount of ¥10,526,455,415 ($94,832 thousand).
(2) Method of reduction of capital reserves
Capital reserves shall be reduced, and all of the reduced amount shall be transferred to other
capital surplus.
3. Schedule of reduction of capital reserves
(1) Date of resolution of the Board of Directors February 22, 2019
(2) Date of resolution of the General Meeting of
Shareholders March 28, 2019
(3) Initial date of public notice for creditors to make
objections April 1, 2019 (planned)
(4) Final due date for creditors to make objections May 7, 2019 (planned)
(5) Effective date May 8, 2019 (planned)

- 84 -
38. Other Information
Quarterly financial information for the year ended December 31, 2018
(Cumulative) First quarter Second quarter Third quarter Year total
Revenue (Millions of yen) ¥34,492 ¥75,578 ¥115,437 ¥165,326
Profit before income taxes
(Millions of yen) 83 2,762 6,175 9,741
Profit attributable to owners of
parent
(Millions of yen)
37 2,033 4,296 7,448
Basic earnings per share
(Yen) ¥0.53 ¥28.57 ¥60.35 ¥104.63
(Cumulative) First quarter Second quarter Third quarter Year total
Revenue (Thousands of U.S.
dollars) $310,743 $680,884 $1,039,980 $1,489,425
Profit before income taxes
(Thousands of U.S. dollars) 756 24,884 55,635 87,762
Profit attributable to owners of
parent
(Thousands of U.S. dollars)
337 18,322 38,704 67,104
Basic earnings per share
(U.S. dollars) $0.00 $0.26 $0.54 $0.94
(Accounting period) First quarter Second quarter Third quarter Fourth quarter
Basic earnings per share (Yen) ¥0.53 ¥28.06 ¥31.78 ¥44.28
(Accounting period) First quarter Second quarter Third quarter Fourth quarter
Basic earnings per share
(U.S. dollars) $0.00 $0.25 $0.28 $0.39