FINANCIAL STATEMENTS 2017 - gard.no - GARD M&E Insurance (Europe...Personnel and organisation As a...
53
FINANCIAL STATEMENTS 2017 GARD MARINE & ENERGY INSURANCE (EUROPE) AS for the year to 20 February 2017
Transcript of FINANCIAL STATEMENTS 2017 - gard.no - GARD M&E Insurance (Europe...Personnel and organisation As a...

FINANCIAL STATEMENTS 2017
GARD MARINE & ENERGY INSURANCE (EUROPE) AS
for the year to 20 February 2017

Gard Marine & Energy Insurance (Europe) AS
Board of Directors’ Report INTRODUCTION The Board of Directors hereby submits the report and accounts of Gard Marine & Energy Insurance (Europe) AS for the 2017 financial year, covering the 12 month period to 20 February 2017. This is Gard Marine & Energy Insurance (Europe) AS (the “Company”) third year of operation. In the opinion of the Board of Directors the report and accounts for the year to 20 February 2017 gives a true and fair picture of the Company and its activities and result. The Company is complying with all statutory solvency and capital requirements. Beyond what has been dealt with in this report, and the risks and uncertainties the marine insurance industry in general is faced with, the Board of Directors does not consider there to be any special risks or uncertainties connected to the business activities of the Company. The Company is a wholly owned subsidiary of Gard Marine & Energy Limited. CHANGES IN EXTERNAL CONDITIONS The Solvency II requirements came into force from 1 January 2016 through the new Norwegian Finance Institutions Act of 2015 no. 17. Solvency II means harmonized EU regulations for calculating capital requirements and eligible capital, requirements for risk management as well as reporting requirements for risk and capital situation. THE OPERATION IN GENERAL Marine & Energy insurance The Company is a joint stock company established in Arendal on 26 June 2014. As from 1 January 2015, the Company has offered marine and energy insurance to its customers in countries where there is a requirement that the insurer is domiciled within the European Union/European Economic Area. The customers are shipowners, shipyards, contractors and oil companies. The Company’s branch office in the United Kingdom With effect from 1 January, 2017 Gard Marine & Energy Insurance Europe AS established a branch in the United Kingdom. Gard AS Gard AS is the general agent for the Company. All insurance products are offered through Gard AS on basis of delegation of authority. Gard AS is registered as insurance agent for Gard P. & I. (Bermuda) Ltd, Assuranceforeningen Gard - gjensidig -, Gard Marine & Energy Limited (the Norwegian branch of the parent company), and the Company in accordance with the Norwegian legislation on insurance intermediary activities based on the EU insurance mediation directive. Gard AS has offices in Arendal, Bergen and Oslo. Further, Gard AS has wholly owned subsidiaries in London (Gard (UK) Limited), New York (Gard (North America) Inc.), Hong Kong (Gard (HK) Ltd), Helsinki (Oy Gard (Baltic) Ab), Piraeus (Gard (Greece) Ltd), Tokyo (Gard (Japan) K.K.) and Singapore (Gard (Singapore) Pte. Ltd). The subsidiaries main function is to be the local representative of the parent company.
Personnel and organisation As a result of the appointment of Gard AS as the agent of the Company there are at the end of the year only 14 persons employed in the Company. These persons include, inter alia, the Managing Director, the Legal Director (Company Secretary) and the Accounting Manager. In the period from 21 February, 2016 to 20 February, 2017 the level of absence due to sickness has been below the corresponding average in the insurance industry. The total number of days of absence due to sickness corresponded to a percentage of 2.9 per cent against 4.8 per cent for the insurance industry in general. The organisation is focusing on preventing occupational injuries as a result of long time use of PCs and other office equipment. There have been no injuries or accidents in connection with the operations. The Company’s objective is to promote gender equality, ensure equal opportunities and rights, and to prevent discrimination due to ethnicity, national origin, descent, skin color, language, religion and faith. The working environment in the Company has in the period to 20 February 2017 been good. Environmental damage The Company is an insurance provider and the environmental footprint is therefore limited as the products, in the form of insurance cover, do not have an environmental impact. The Company’s impact on climate and the environment is therefore primarily connected to business travel made by the limited number of staff. The Company fully supports the UN Principles of Responsible Investment and actively encourage the fund managers to sign up to them. These Principles recognise that long term sustainable returns are dependent on stable, well-functioning and well governed social, environmental and economic systems. Research and development The Company does not carry out research and development activities. FUND MANAGEMENT
A major part of the Company’s investment portfolio is invested through a “Common Contractual Fund” structure established in Ireland. The investment structure represents a common legal framework for the management of the funds belonging to all risk carriers in the Gard group consisting of Assuranceforeningen Gard - gjensidig -, Gard P. & .I (Bermuda) Ltd, Gard Marine & Energy Limited, Gard Marine & Energy Insurance (Europe) AS and Gard Reinsurance Co Ltd. The objective of the investment structure is saving of management costs and optimizing the total returns within the investment guidelines. The portfolio managers in the Common Contractual Fund structure are all specialists within the class of assets the individual manager has been given a mandate to manage. The general investment guidelines for the management of the funds of the Company are determined by the Board of Directors. The general guidelines determined by the Board of Directors contain, inter alia, provisions as to the currency composition of the investments and the types of financial instruments that can be used. The percentage of the investment held in US dollar must be in the range between 30 per cent and 75 per cent. Each portfolio manager employed shall not manage more than 30 per cent of the total fund. The guidelines permit also investments in real estate funds, futures, options and other derivatives for the purpose of improving risk management, efficiency and liquidity of the portfolio. The individual portfolio manager’s mandate is composed on the basis of an index enabling the Company to measure the individual manager’s performance against a benchmark.

The Administration reports on the performance and composition of the portfolio at each Board of Directors meeting. For each meeting, a compliance report is produced showing whether there are non-conformities in relation to the investment guidelines.
In the view of the Board of Directors the Company’s investments can be described as having a medium risk profile. INSURANCE BUSINESS Market share At the inception of the accounts for the year 2017, the global market share for the parent company Gard Marine & Energy Limited including its subsidiaries was 5 per cent for the business area Marine and 3 per cent for the business area Energy. The market shares were unchanged at the end of the year. Reinsurance The insurance activities of the Company is reinsured in the commercial reinsurance market. The retention for any one event any one vessel was in accounts for the year to 20 February 2017, USD 40 million. The Company has entered into a separate reinsurance treaty with its parent company. The reinsurance treaty covers a proportion of the risks retained under the above market reinsurance arrangements. Pursuant to this separate reinsurance treaty 90 percent of the insurance liabilities of the Company not covered by the market reinsurance arrangements was ceded to the parent company as reinsurance in the accounts for the year to 20 February 2017.
The quota share reinsurance treaty between the Company and Gard Marine & Energy Limited has been amended. With effect from 20 February 2017, the quota share to be ceded to the Gard Marine & Energy Limited is reduced from 90 to 70 percent. FINANCIAL RISK Insurance risk The Company has the benefit of Gard group’s external reinsurance programs in addition to the internal reinsurance contracts. A set of extreme events for insurance risk have been identified and the realistic possible loss to the Company has been calculated. The highest insurance loss for own account from the identified extreme events is USD 6 million, which is 17 percent of the company’s equity. Reverse stress testing has been conducted. A net insurance loss of USD 17 million will endanger the Company’s solvency. This corresponds to 2 losses in excess of USD 40 million. The expected number of claims in the same size order is below one. Market risk The Company has increased the equity exposure during the year, but still has low exposure to risky assets compared to the Gard group strategic asset allocation. The entity remains over weighted to developed government bonds and investment grade corporates. The economic capital required for the market risk is up from last year due to gain in equity exposure. Equity risk is the main contributor to increased economic capital this year. According to the stress tests, the highest estimated market loss to the Company is USD 3 million due to a 25 percent increase in exchange rates of USD. A reverse stress test demonstrates that a market loss of USD 18 million will endanger the company’s solvency.
With the increase in the assets held by the Company, the market risk profile is likely to be changed during the next 12 months to be more in line with the market risk profile of the Gard group overall. Counterparty default risk The main sources of counterparty default risk are the parent company Gard Marine & Energy Limited, reinsurers, cash deposits at banks, and receivables from policyholders. In addition, the company is exposed to counterparty default risk on claims recoveries, claims paid for co-insurers and fronting for direct insurers. Counterparty default risk on securities is included in market risk. The main reinsurer of the Company is Gard Marine & Energy Limited, which covers 70 percent as from 20 February 2017 (earlier 90 percent) of all risks undertaken not reinsured elsewhere. The counterparty exposure against the intra-group reinsurer is large compared to the overall operation and the capitalization. Gard Marine & Energy Limited has issued a parent company guarantee covering the Company’s obligations arising out of or in connection with any policy of insurance, contract of reinsurance or surety bond issued by the Company Liquidity risk The duration of investable assets shall meet the pay-out profile of the Association’s liabilities. The investable asset consist of a liquid portfolio that can be liquidated in a short period of time. The liquidity risk is deemed low. Operational risk The operational risk of the Gard group is assessed annually through the internal self-assessment. Results of the self-assessment are used to quantify the operational risk of the group. Based on the business volume, a share of the group wide operational risk has been attributed to the Company. Capital and solvency position The Company is complying with all statutory solvency and capital requirements. The parent company, Gard Marine & Energy Limited, is well capitalized and is expected to be in a position to inject capital in the Company in the event this would be required to meet strategic goals. ACCOUNTS FOR THE YEAR 2017 The Company has been granted dispensation by the Norwegian Financial Supervisory Authority and the Tax Authority from the requirements to present the annual accounts in Norwegian currency and in the Norwegian language. In accordance with this the annual accounts are presented in United States Dollar (USD) and in the English language. Comparing figures as per 20 February 2016 are included in brackets. Result The net result was a profit of USD 2.5 million (deficit of USD 4.4 million). The technical result was a profit of USD 1.5 million (deficit of USD 4.1 million). Premiums The gross earned premium in the year ending 20 February 2017 was USD 84.9 million (USD 69.6 million). Earned premium for own account was USD 7.2 million (USD 5.8 million) and

below plan. A softer market has resulted in falling rate levels and corresponding decrease in expected profitability, increasing share of business not being renewed and lower new acquisition ratio. There is also low demand in some segments. Claims Gross incurred claims during the period was USD 57.4 million (USD 57.1 million). Net incurred claims for own account was USD 5.3 million (USD 7.9 million). The claims development has been better than plan and with no large claims in the year to 20 February, 2017. Non-technical result The net income derived from assets was a profit of USD 0.9 million in the year ending 20 February 2017 (USD 0.1 million). Total equity Total equity has increased to USD 35.5 million (USD 33.0 million). The equity shall meet unforeseen fluctuations in claims exposure, possible catastrophes, extraordinary claims patterns that fall within the Company’s liabilities and to meet capital requirements Technical provisions As at 20 February 2017 the Company’s net premium reserve was USD 3.3 million (USD 4.2 million) as provision for the part of agreed premium written that exceeds the end of the financial year. As at 20 February 2017 the Company’s net provision to cover reported and unreported claims amounted to USD 7.1 million (USD 5.7 million). The Board of Directors are of the opinion that the equity and technical provisions are sufficient to cover all technical liabilities for year to 20 February 2017 and earlier. Cash flow analysis The Company’s bank deposit as of 20 February 2017 amounted to USD 18.0 million (USD 22.8 million). Net cash flows from operating activities consist primarily of incoming payments in the form of premiums and outgoing payments in the form of claims and operating expenses. Operating liquidity (cash) is balanced by transfers to and from the investment portfolio. CONTINUED OPERATION AND THE FUTURE DEVELOPMENT The Board of Directors expects a moderate and stable premium growth over the next three years. A stable combined ratio net around 100 percent is expected and a positive return from the investment portfolio of around 2 to 4 percent per year. Against this background and pursuant to the Norwegian Accounting Act of 1998, section 3-3a, the Board of Directors is of the opinion that it is basis for continued operation. The year-end accounts are based on these premises. GOVERNING CORPORATE BODIES The Board of Directors of the Company are composed as shown on page 1. Board of Directors Ian Beveridge, Morten Høegh and Yngvil Åsheim shall retire by rotation at the forthcoming Annual General Meeting but can be re-elected.

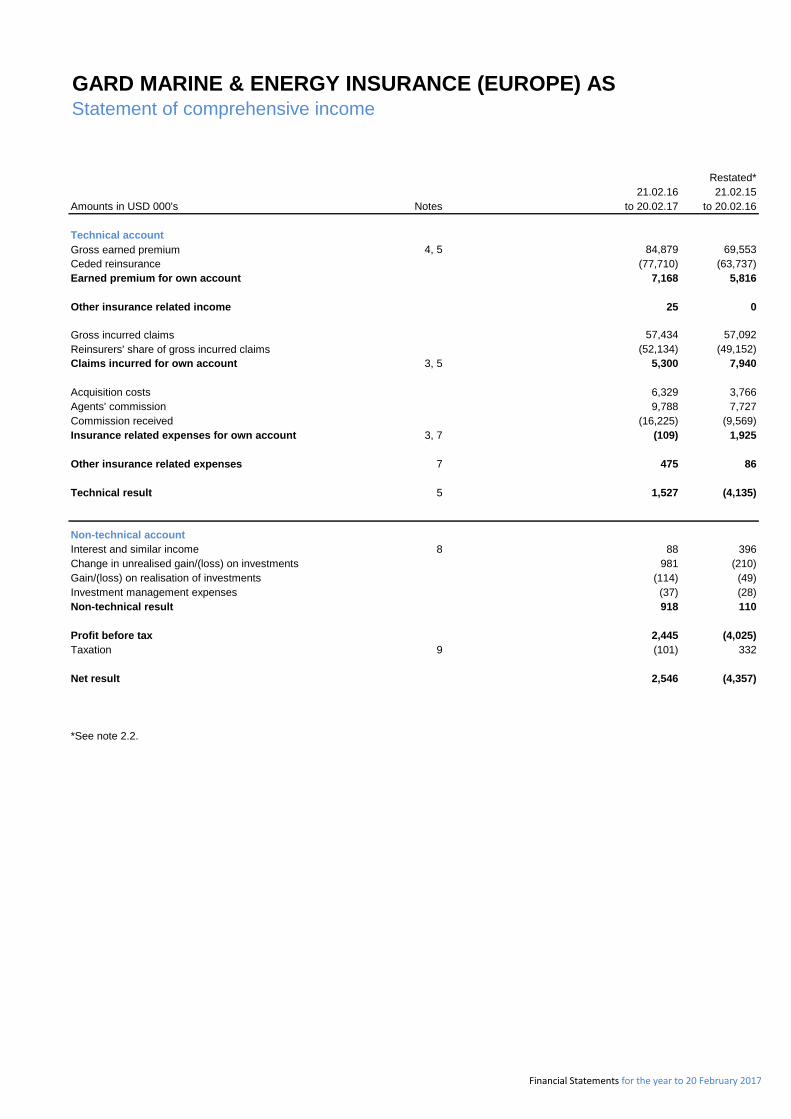
GARD MARINE & ENERGY INSURANCE (EUROPE) ASStatement of comprehensive income
Restated*
21.02.16 21.02.15
Amounts in USD 000's Notes to 20.02.17 to 20.02.16
Technical account
Gross earned premium 4, 5 84,879 69,553
Ceded reinsurance (77,710) (63,737)
Earned premium for own account 7,168 5,816
Other insurance related income 25 0
Gross incurred claims 57,434 57,092
Reinsurers' share of gross incurred claims (52,134) (49,152)
Claims incurred for own account 3, 5 5,300 7,940
Acquisition costs 6,329 3,766
Agents' commission 9,788 7,727
Commission received (16,225) (9,569)
Insurance related expenses for own account 3, 7 (109) 1,925
Other insurance related expenses 7 475 86
Technical result 5 1,527 (4,135)
Non-technical account
Interest and similar income 8 88 396
Change in unrealised gain/(loss) on investments 981 (210)
Gain/(loss) on realisation of investments (114) (49)
Investment management expenses (37) (28)
Non-technical result 918 110
Profit before tax 2,445 (4,025)
Taxation 9 (101) 332
Net result 2,546 (4,357)
*See note 2.2.
Financial Statements for the year to 20 February 2017

GARD MARINE & ENERGY INSURANCE (EUROPE) ASBalance sheet
Restated*
As at As at
Amounts in USD 000's Notes 20.02.17 20.02.16
Assets
Investments
Financial investments at fair value through profit or loss
Equities and investment funds 10, 11 1,876 1,512
Bonds 11 17,408 16,956
Other financial investments 11 259 191
Total investments 19,542 18,659
Reinsurers' share of technical provisions
Reinsurers' share of gross premium reserve 32,218 40,071
Reinsurers' share of gross claims reserve 3, 5 50,197 43,896
Total reinsurers' share of technical provisions 82,415 83,968
Receivables
Receivables from direct insurance operations
Policyholders 12 953 76
Intermediaries 12 33,912 40,056
Receivables from reinsurance operations
Receivables from reinsurance operations 1,705 0
Receivables from group companies 16 3,772
Other receivables 13 9 9
Total receivables 11 36,595 43,913
Other assets
Cash and cash equivalents 14 18,006 22,825
Deferred tax asset 9 275 820
Total other assets 18,281 23,645
Prepayments and accrued income
Accrued income and other prepayments 4,178 5,302
Total prepayments and accrued income 4,178 5,302
Total assets 161,011 175,486
*See note 2.2.
Financial Statements for the year to 20 February 2017

GARD MARINE & ENERGY INSURANCE (EUROPE) ASBalance sheet
Restated*
As at As at
Amounts in USD 000's Notes 20.02.17 20.02.16
Equity and liabilities
Equity
Statutory reserve 15 33,268 33,268
Other equity 16 2,236 (310)
Total equity 35,504 32,958
Technical provisions
Gross premium reserve 35,525 44,255
Gross claims reserve 5 57,336 49,582
Total technical provisions 92,861 93,838
Provision for other liabilities
Income tax payable 9 0 645
Total provisions for other liabilities 0 645
Payables
Payables arising out of direct insurance operations 154 706
Payables arising out of reinsurance operations 24,615 38,391
Payables to group companies 272 0
Other payables 10, 11, 13 143 108
Total payables 25,184 39,205
Accruals and deferred income
Accruals and deferred income 7,462 8,839
Total accruals and deferred income 7,462 8,839
Total liabilities 125,507 142,528
Total equity and liabilities 161,011 175,486
*See note 2.2.
Financial Statements for the year to 20 February 2017

GARD MARINE & ENERGY INSURANCE (EUROPE) ASStatements of changes in equity
Statutory Other
Amounts in USD 000's reserve equity Total
Equity as at 20.02.2015 13,833 0 13,833
Change in accounting policies related to contingency reserve 3,843 3,843
Tax effect on change in accouting policies 205 205
Equity as at 21.02.2015 13,833 4,048 17,881
Net result (4,357) (4,357)
Capital increase 19,435 0 19,435
Equity as at 20.02.2016 33,268 (310) 32,958
Equity as at 20.02.2016 33,268 (310) 32,958
Net result 2,546 2,546
Equity as at 20.02.2017 33,268 2,236 35,503
Financial Statements for the year to 20 February 2017

GARD MARINE & ENERGY INSURANCE (EUROPE) ASCash flow analysis
Restated*
21.02.16 21.02.15
Amounts in USD 000's Notes to 20.02.17 to 20.02.16
Cash flow from operating activities
Profit before tax 2,445 (4,025)
Tax paid 8 0 (732)
Change in unrealised (gain)/loss on investments (981) 210
Change in receivables and payables (6,704) (5,092)
Change in technical provisions and other accruals 323 8,829
Financial investments 97 (10,222)
Net cash flow from operating activities (4,820) (11,032)
Cash flow from investment activities
Net cash flow from investment activities 0 0
Cash flow from financial activities
Increase of share capital 0 19,435
Net cash flow from financial activities 0 19,435
Net change in cash and cash equivalents (4,820) 8,403
Cash and cash equivalents at beginning of year 22,825 14,422
Cash and cash equivalents at end of year 18,006 22,825
Financial Statements for the year to 20 February 2017

GARD M&E INSURANCE (EUROPE) AS Notes to the accounts
Financial Statements for the year to 20 February 2017
Note 1 – Corporate information
Gard Marine & Energy Insurance (Europe) AS (“the Company”) is a wholly owned subsidiary of Gard Marine & Energy Ltd (“Gard M&E”). The Company is registered and domiciled in Norway and licensed by the Norwegian Ministry of Finance to carry out direct insurance of Marine and Energy risks.
Note 2 - Accounting policies 2.1 Basis of preparation of the Accounts This year’s accounts include the activity from 21 February 2016 to 20 February 2017. The financial statements have been prepared in accordance with Regulations for annual accounts for general insurance companies approved by the Norwegian Ministry of Finance. 2.2 Changes to presentation and classification As a result of change in Norwegian accounting regulations for insurance companies, the Company has applied the following changes to accounting principles: 1. Contingency reserve has been reclassified to
other equity. Related deferred tax asset has been recognized as applicable depending on tax jurisdiction. As a result, the Statement of comprehensive income no longer includes the line item “change in contingency reserve”. See Note 17 for further details.
2. Gross written premium and Change in gross
premium reserve is presented net as Gross earned premium while Gross settled claims and Change in gross claims reserve is presented net as Gross incurred claims.
Comparative information has been restated accordingly. 2.3 Use of accounting estimates when preparing the accounts The preparation of the accounts requires the management to make estimates and assumptions that affect valuation of assets, liabilities, revenues, expenses and contingent liabilities. Due to circumstances in the future these estimates may change. Estimates and their assumptions are considered continuously and accounts adjusted accordingly. Insurance contract liabilities Insurance contract liabilities are the main items in the balance sheet based upon judgements and estimates. Estimates have to be made both for the expected total cost of claims reported and for the expected total cost of claims incurred but not reported at the balance sheet date. Standard actuarial methods are used in estimating the total cost of outstanding claims. The actuarial method uses historical data as one of the elements in the model to estimate the future claims costs. It can take a significant period of time before the ultimate claims cost can be established with certainty.
2.4 Foreign currency Functional currency and presentation currency The accounts are prepared in USD, which is both the functional currency and presentation currency of the Company. Transactions in foreign currency Transactions in foreign currencies are translated at the rate applicable on the transaction date. Monetary items in a foreign currency are retranslated into USD using the exchange rate applicable on the balance sheet date. The currency exposure of the provision for claims is assessed to be equivalent to the same currency exposure as claims paid. The opening and closing balances of the provision for claims in foreign currency are translated into USD based on the same method as for monetary items. Non-monetary items that are measured at fair value expressed in foreign currency are translated into USD using the exchange rate applicable on the transaction date. Translation differences are recognised in the income statement as they occur during the accounting period. Foreign exchange gains and losses that relate to borrowings, cash and cash equivalents and financial investments are presented as part of the non-technical result as interest and similar income and Change in unrealised gain/loss on investments respectively. All foreign exchange gains and losses relating to technical operations are presented in the income statement as part of the technical result. 2.5 Revenue and expense recognition Premiums Premiums are based on the insurance contracts where one party (the insurer) has accepted a significant risk from another party (the policyholder) by agreeing to compensate the policyholder if a specified uncertain future event adversely affects the policyholder. Premiums are recognised over the insurance policy period. Unearned premiums are those proportions of premiums written in a year that relate to periods of risk after the reporting date. Unearned premiums are calculated on a daily pro rata basis. The proportion attributable to subsequent periods is deferred as gross premium reserve. Reinsurance premiums Reinsurance premiums are recognised as an expense over the underlying policy period.
Claims expenses Expenses regarding incurred claims and other administrative expenses are recognised in the period in which they are incurred. Paid claims include an allocated portion of both direct and indirect claims handling cost. Insurance related expenses for own account Insurance related expenses for own account consist of broker and agent commissions, sales and administrative expenses, less commission received on ceded reinsurance premiums. Sales expenses are recognised in the period in which they are incurred. The administrative expenses and commission received are expensed over the underlying policy period. Other Other income and expenses are accounted for in the period they are incurred.

GARD M&E INSURANCE (EUROPE) AS Notes to the accounts
Financial Statements for the year to 20 February 2017
Note 2 - Accounting policies continued 2.6 Income tax The tax expense consists of tax payable and changes in deferred tax.
Deferred tax/tax asset is calculated on all differences between the book value and the tax value of assets and liabilities. Deferred tax is calculated at the nominal tax rate of temporary differences and the tax effect of tax losses carried forward at the tax rate at the end of the accounting year. Changes in tax rates are accounted for when the new rate has been approved and changes are presented as part of the tax expense in the period the change has been made. A deferred tax asset is recorded in the balance sheet, when it is more likely than not that the tax asset will be utilised. 2.7 Financial instruments Classification The Company classifies its financial assets in the following categories: at fair value through profit or loss, loans and receivables and held to maturity investments. The classification depends on the purpose for which the financial assets were acquired. Management determines the classification of the financial assets at initial recognition. Financial assets at fair value through profit or loss Financial assets at fair value through profit or loss are financial assets held for trading. A financial asset is classified in this category if acquired principally for the purpose of selling in the short term. Derivative financial instrument are also categorised as held for trading. Loans and receivables Loans and receivables are non-derivative financial assets with fixed or determinable payments that are not quoted in an active market. They are classified as receivables and payables in the balance sheet. Recognition and measurement Regular purchases and sales of financial assets are recognised on the trade date – the date on which the Company commits to purchase or sell the asset. Investments are initially recognised at fair value plus transaction costs for all financial assets not carried at fair value through profit or loss. Financial assets carried at fair value through profit or loss is initially recognised at fair value, and transaction costs are expensed in the income statement. Financial assets
are derecognised when the rights to receive cash flows from the investments have expired or have been transferred and the Company has transferred substantially all risks and rewards of ownership. Loans and receivables are initially recognised at fair value including direct and incremental transaction costs and measured subsequently at amortised cost, using the effective interest method. Unrealised gains or losses arising from changes in the fair value of the ‘financial assets at fair value through profit or loss’ category are presented in the income statement within Change in unrealised gain (loss) on investments in the period in which they arise. Realised gains or losses are presented within gains on realisation of investments. Dividends and
interest income from financial assets at fair value through profit or loss is recognised in the income statement as part of interest and similar income when the right to receive payments is established. Dividend from investments is recognised when the Company has an unconditional right to receive the dividend. Dividend paid is recognised as a liability at the time when the General Meeting approves the payment of the dividend. Offsetting financial instruments Financial assets and liabilities are offset and the net amount reported in the balance sheet when there is a legally enforceable right to offset the recognised amounts and there is an intention to settle on a net basis or realise the asset and settle the liability simultaneously. 2.8 Cash and cash equivalents Cash and cash equivalents include cash in hand and deposits held at call with banks, brokers and fund managers. In the balance sheet, cash and cash equivalents that relate to investment management is presented as other financial investments. All other cash is presented as cash and cash equivalents. In the cash flow statement, cash and cash equivalents do not include cash and cash equivalents presented as other financial investments. 2.9 Technical provisions Technical provisions are calculated in accordance with the Regulations for annual accounts for insurance companies. Gross premium reserve The gross premium reserve is amortised over the risk period and is calculated and accounted for in the balance sheet as a provision for the part of premium written that exceeds the end of the financial year. Changes in the provision are charged to the income statement. Gross claims reserve The gross claims reserve comprises estimates of the expected remaining exposure from claims that have been reported to the Company (RBNS), and from claims that have been incurred but which have not yet been reported (IBNR). Provisions for reported claims are made by assessing the liability of each claim. Actuarial methods are used in estimating the total cost of outstanding claims. The claim provisions have not been discounted. In accordance with the Norwegian regulations for insurance companies provisions for internal claims handling expenses (unallocated loss adjustment expenses, or ULAE) and binary events are included in the ‘Gross claims reserve’.

GARD M&E INSURANCE (EUROPE) AS Notes to the accounts
Financial Statements for the year to 20 February 2017
Note 2 - Accounting policies continued 2.10 Provisions, contingent liabilities and assets Provisions are recognised when the Company has a present obligation (legal or constructive) as a result of a past event, and it is probable that an outflow of resources embodying economic benefits will be required to settle the obligation and a reliable estimate can be made of the amount of the obligation. For potential obligations whose likelihood is neither remote nor not probable (i.e. not ‘more likely than not’), a contingent liability is disclosed. There is no provision for contingent liabilities recognised in the balance sheet. Contingent assets are not recognised in the financial statements but are disclosed if it is likely that resources embodying economic benefits will flow to the Company.
2.11 Events after the reporting period New and material information on the Company’s financial position at the end of the reporting period, which becomes known after the end of the reporting period, is recorded in the annual accounts. Events after the reporting period that do not affect the Company’s financial position at the end of the reporting period but which will affect the financial position in the future are disclosed if significant.

GARD MARINE & ENERGY INSURANCE (EUROPE) ASNotes to the accounts
Note 3 - Intra-group transactions
Reinsurance agreement with Gard M&E Ltd.
The Company cedes to Gard M&E Ltd. by way of reinsurance 90 percent of the Company's Marine & Energy risk underwritten by
the Company that is not reinsured elsewhere.
21.02.16 21.02.15
Amounts in USD 000's to 20.02.17 to 20.02.16
Reinsurance 64,516 52,189
Reinsurers' share of gross settled claims 36,846 22,914
Reinsurance commission 14,827 8,621
21.02.16 21.02.15
Amounts in USD 000's to 20.02.17 to 20.02.16
Reinsurers' share of claims reserve 4,517 4,997
Insurance agency agreement
The operations and insurance activities of the Company are carried out by the insurance intermediaries Gard AS, Gard (UK) Ltd.,
and Oy Gard Baltic Ab. All mentioned companies are fully owned by Gard AS. Gard AS is a fully owned daugther
company of Gard P. & I. (Bermuda) Ltd.
21.02.16 21.02.15
Amounts in USD 000's to 20.02.17 to 20.02.16
Gard AS 5,828 5,919
Gard (Sweden) AB. 0 259
Gard (UK) Ltd. 605 717
Oy Gard Baltic Ab 452 465
Note 4 - Gross written premium by geographical areas
21.02.16 21.02.15
Amounts in USD 000's to 20.02.17 to 20.02.16
EEA 67,891 81,570
Norway (85) (1,144)
Other areas 8,342 9,103
Total gross written premium 76,148 89,528
The geographical split is made based on the location of the individual Member or client.
Insurance services invoiced
Ceded to Gard M&E Ltd.
Ceded to Gard M&E Ltd.
Financial Statements for the year to 20 February 2017
GARD MARINE & ENERGY INSURANCE (EUROPE) ASNotes to the accounts
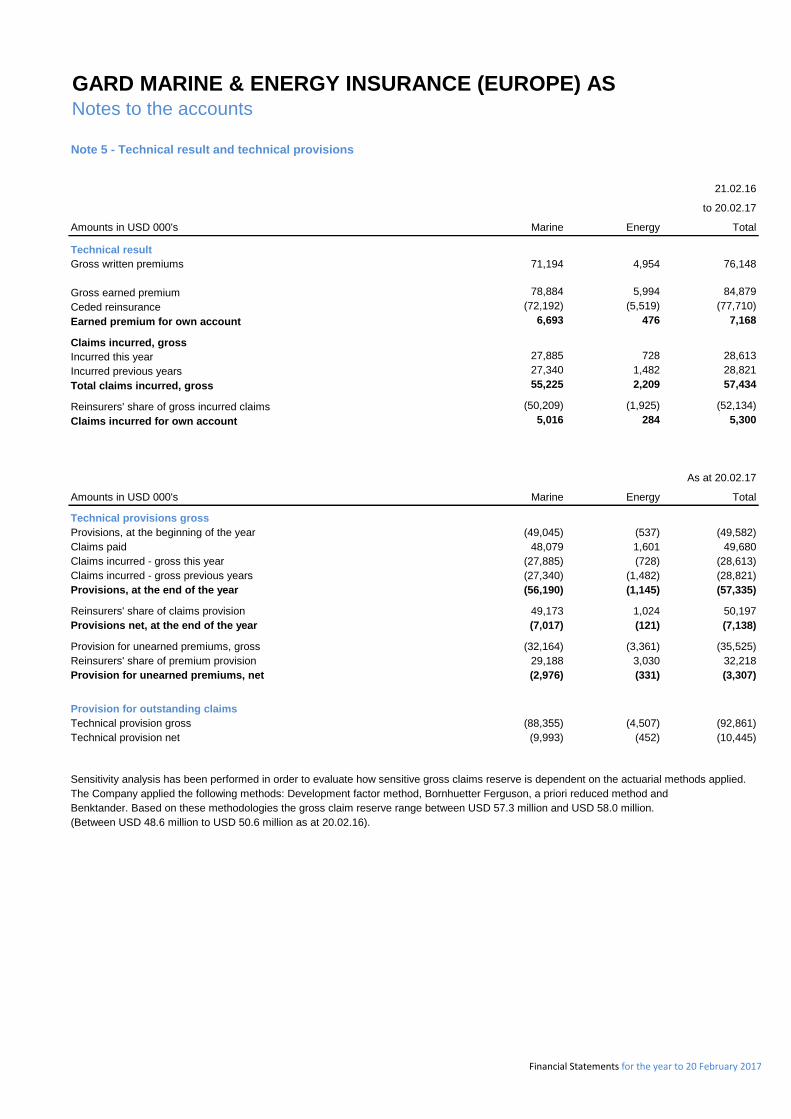
Note 5 - Technical result and technical provisions
21.02.16
to 20.02.17
Amounts in USD 000's Marine Energy Total
Technical result
Gross written premiums 71,194 4,954 76,148
Gross earned premium 78,884 5,994 84,879
Ceded reinsurance (72,192) (5,519) (77,710)
Earned premium for own account 6,693 476 7,168
Claims incurred, gross
Incurred this year 27,885 728 28,613
Incurred previous years 27,340 1,482 28,821
Total claims incurred, gross 55,225 2,209 57,434
Reinsurers' share of gross incurred claims (50,209) (1,925) (52,134)
Claims incurred for own account 5,016 284 5,300
As at 20.02.17
Amounts in USD 000's Marine Energy Total
Technical provisions gross
Provisions, at the beginning of the year (49,045) (537) (49,582)
Claims paid 48,079 1,601 49,680
Claims incurred - gross this year (27,885) (728) (28,613)
Claims incurred - gross previous years (27,340) (1,482) (28,821)
Provisions, at the end of the year (56,190) (1,145) (57,335)
Reinsurers' share of claims provision 49,173 1,024 50,197
Provisions net, at the end of the year (7,017) (121) (7,138)
Provision for unearned premiums, gross (32,164) (3,361) (35,525)
Reinsurers' share of premium provision 29,188 3,030 32,218
Provision for unearned premiums, net (2,976) (331) (3,307)
Provision for outstanding claims
Technical provision gross (88,355) (4,507) (92,861)
Technical provision net (9,993) (452) (10,445)
Sensitivity analysis has been performed in order to evaluate how sensitive gross claims reserve is dependent on the actuarial methods applied.
The Company applied the following methods: Development factor method, Bornhuetter Ferguson, a priori reduced method and
Benktander. Based on these methodologies the gross claim reserve range between USD 57.3 million and USD 58.0 million.
(Between USD 48.6 million to USD 50.6 million as at 20.02.16).
Financial Statements for the year to 20 February 2017

GARD MARINE & ENERGY INSURANCE (EUROPE) ASNotes to the accounts
Note 6 - Differences between Solvency II and balance valuation
As at 20.02.17
Amounts in USD 000's Solvency II Balance sheet Differences
Assets
Reinsurance recoverables from non-life excluding health:
Reinsurers' share of gross premium reserve 0 32,218 (32,218)
Reinsurers' share of expected cash flow for unexpired cover net of reinsurer commission provision 24,492 0 24,492
Reinsurers' share of gross claims reserves 50,197 50,197 0
Discounting effect of reinsurers' share of gross claims reserves (1,693) 0 (1,693)
Reinsurers' share of Bound but not incepted (BBNI) - net (68) 0 (68)
Losses occuring during - net (339) 0 (339)
Reinsurance recoverables from non-life excluding health 72,589 82,415 (9,826)
Liabilities
Technical provisions - non life
Gross premium reserves 0 35,525 (35,525)
Gross expected cash flow for unexpired cover net of commission provision 30,320 0 30,320
Gross claims reserves 57,336 57,336 0
Discounting effect of gross claims reserves (1,934) 0 (1,934)
Risk Margin 1,358 0 1,358
Other equity 0 2,236 (2,236)
Technical provisions - non life 87,080 95,097 (8,017)
Reinsurance recoverables
Reinsurers’ share of expected cash flow for unexpired cover net of reinsurer commission provision claims covers the combined ratio
share of reinsurers’ share of gross premium reserves less reinsurance commission provisions.
Discounting effect of reinsurers’ share of gross claims reserve shows the reduction in reinsurers’ share of gross claims reserve, in order
to arrive at net present value of the reserves as at balance sheet date.
Reinsurers’ share of Bound but not incepted (BBNI) – net, covers the net of reinsurers’ share of premiums, claims and commission
based on agreements with customers entered into but not incepted as at the balance sheet date.
Losses occurring during is covering expected cash flow of extended reinsurance in order to align the coverage period with
the premium reserve period.
Technical provisions - non-life
Bound but not incepted (BBNI) – net is covering the net of gross premiums, claims and commission from customer agreements
entered into, but not incepted as at the balance sheet date.
Gross expected cash flow for unexpired cover net of commission provision is covering the combined ratio share of gross premium reserve
less commission provisions. This represents the expected claims costs related to the gross premiums reserve as at balance sheet date.
Discounting effect of gross claims reserve is showing the reduction in gross claims reserve, in order to arrive at net present value of
the reserves as at balance sheet date.
The risk margin is calculated as a 6% charge on future yearly cash flows, which is based on Solvency Capital Requirement in respect of
non-hedgeable risks. The risk margin represents cost of capital an insurance company would require to take on the obligations
of a given company. Other equity is covering retained reserves to meet unforeseen fluctuations in claims exposure, possible
catastrophes and extraordinary claims patterns that fall within the Company’s liabilities. For Balance values other equity
is included in the Technical provisions – non-life, while other equity is included in Excess of assets over liabilities for Solvency II
values.
Financial Statements for the year to 20 February 2017

GARD MARINE & ENERGY INSURANCE (EUROPE) ASNotes to the accounts
Note 7 - Other insurance related expenses and number of staff
A 5 percent Finance tax has been implemented from 1 January 2017. This tax will apply for earned holiday allowance for 2016 to be paid in 2017,
on pensions and on wage cost January and February 2017. This has been accrued for in the accounts.
21.02.16 21.02.15
Amounts in USD 000's to 20.02.17 to 20.02.16
Acquisition costs and commissions
Sales related salaries and wages (625) 47
Other acquisition costs 6,954 3,719
Agents' commission 9,788 7,727
Commission received (16,225) (9,569)
Insurance related expenses for own account (109) 1,925
Number of staff 14 14
Remuneration to Group Leadership Team, Board of Directors and Committees
The Group Leadership Team consists of the Group Directors.
Amounts in USD 000's
Salary incl.
bonus
Board
remuneration
Total
remuneration
Group Leadership Team
Rolf Thore Roppestad (CEO) 67 67
Bjørnar Andresen (SVP) 35 35
Steinar Bye (SVP) 37 37
Kristian Dalene (SVP) 26 26
Kjetil Eivindstad (SVP) 30 30
Members of the Board of Directors of the Company
Trond Eilertsen (Chairman) 20 20
Morten Høegh (Member) 15 15
Jane Sy (Member) 15 15
Yngvil Åsheim (Member) 15 15
Ian Beveridge (Member) 15 15
Members of the Supervisory Committee of the Company
Stephen Knudtzon (Chairman) 7 7
Arne Falkanger Thorsen (Member) 5 5
Claus Theodor Mørch (Member) 5 5
Helge Aamodt (Member) 5 5
Total 195 101 297
Remuneration auditor
21.02.16 21.02.15
Amounts in USD 000's to 20.02.17 to 20.02.16
Statutory audit 24 30
Non audit services 10 2
Total auditors' fee 34 32
Financial Statements for the year to 20 February 2017

GARD MARINE & ENERGY INSURANCE (EUROPE) ASNotes to the accounts
Note 8 - Financial income and expenses
21.02.16 21.02.15
Amounts in USD 000's to 20.02.17 to 20.02.16
Interest and similar income
Interest income 0 16
Income from financial instruments held for trading (portfolio investments) 374 284
Foreign exchange gains/(losses) (329) 96
Dividend 42 0
Total interest and similar income 88 396
Financial Statements for the year to 20 February 2017
GARD MARINE & ENERGY INSURANCE (EUROPE) ASNotes to the accounts
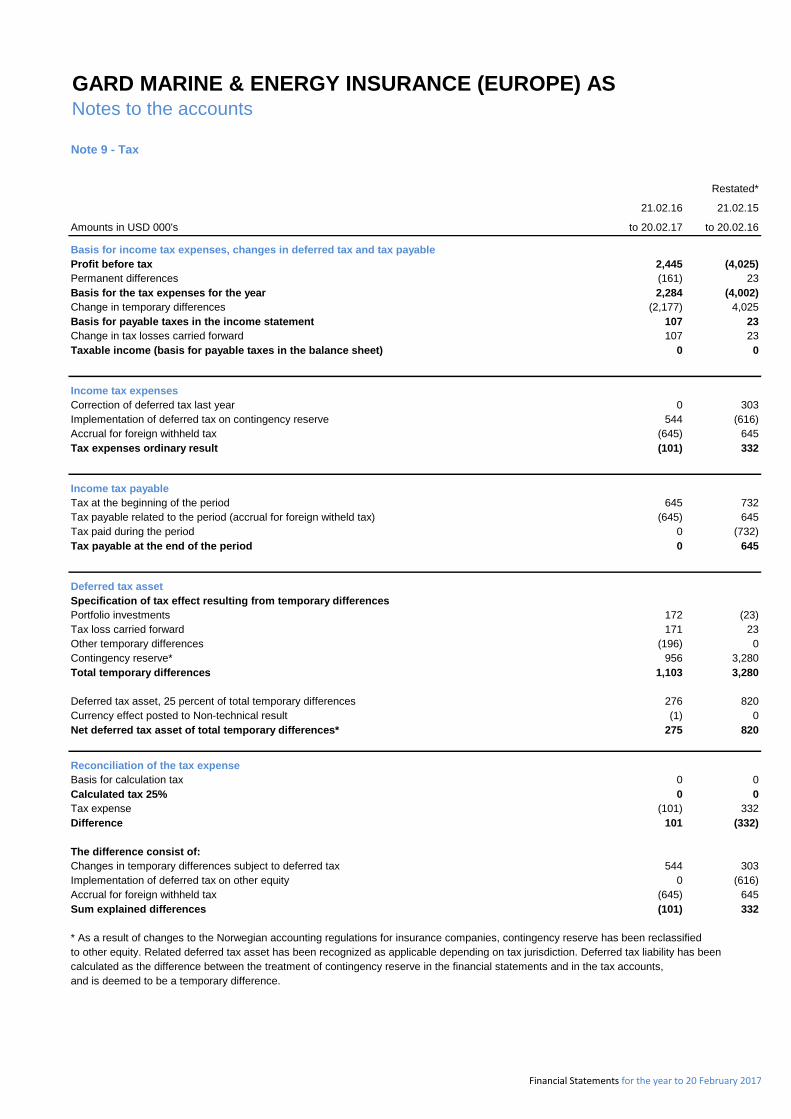
Note 9 - Tax
Restated*
21.02.16 21.02.15
Amounts in USD 000's to 20.02.17 to 20.02.16
Basis for income tax expenses, changes in deferred tax and tax payable
Profit before tax 2,445 (4,025)
Permanent differences (161) 23
Basis for the tax expenses for the year 2,284 (4,002)
Change in temporary differences (2,177) 4,025
Basis for payable taxes in the income statement 107 23
Change in tax losses carried forward 107 23
Taxable income (basis for payable taxes in the balance sheet) 0 0
Income tax expenses
Correction of deferred tax last year 0 303
Implementation of deferred tax on contingency reserve 544 (616)
Accrual for foreign withheld tax (645) 645
Tax expenses ordinary result (101) 332
Income tax payable
Tax at the beginning of the period 645 732
Tax payable related to the period (accrual for foreign witheld tax) (645) 645
Tax paid during the period 0 (732)
Tax payable at the end of the period 0 645
Deferred tax asset
Specification of tax effect resulting from temporary differences
Portfolio investments 172 (23)
Tax loss carried forward 171 23
Other temporary differences (196) 0
Contingency reserve* 956 3,280
Total temporary differences 1,103 3,280
Deferred tax asset, 25 percent of total temporary differences 276 820
Currency effect posted to Non-technical result (1) 0
Net deferred tax asset of total temporary differences* 275 820
Reconciliation of the tax expense
Basis for calculation tax 0 0
Calculated tax 25% 0 0
Tax expense (101) 332
Difference 101 (332)
The difference consist of:
Changes in temporary differences subject to deferred tax 544 303
Implementation of deferred tax on other equity 0 (616)
Accrual for foreign withheld tax (645) 645
Sum explained differences (101) 332
* As a result of changes to the Norwegian accounting regulations for insurance companies, contingency reserve has been reclassified
to other equity. Related deferred tax asset has been recognized as applicable depending on tax jurisdiction. Deferred tax liability has been
calculated as the difference between the treatment of contingency reserve in the financial statements and in the tax accounts,
and is deemed to be a temporary difference.
Financial Statements for the year to 20 February 2017
GARD MARINE & ENERGY INSURANCE (EUROPE) ASNotes to the accounts
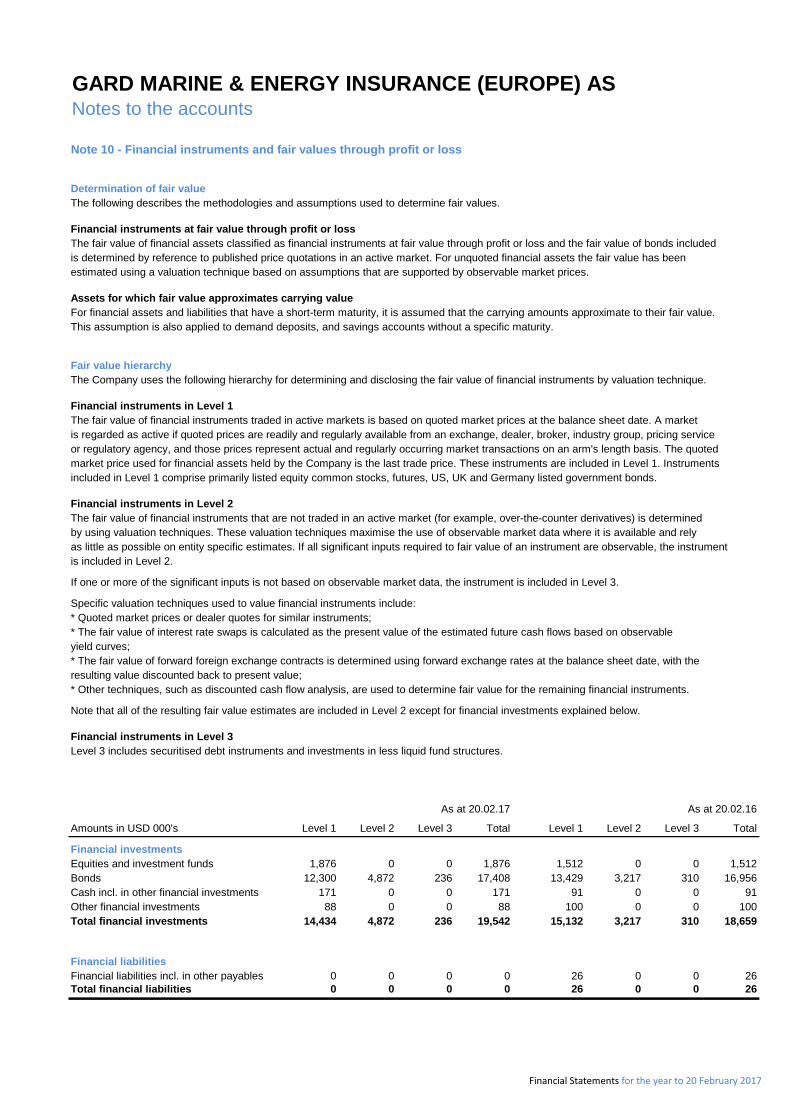
Note 10 - Financial instruments and fair values through profit or loss
Determination of fair value
The following describes the methodologies and assumptions used to determine fair values.
Financial instruments at fair value through profit or loss
The fair value of financial assets classified as financial instruments at fair value through profit or loss and the fair value of bonds included
is determined by reference to published price quotations in an active market. For unquoted financial assets the fair value has been
estimated using a valuation technique based on assumptions that are supported by observable market prices.
Assets for which fair value approximates carrying value
For financial assets and liabilities that have a short-term maturity, it is assumed that the carrying amounts approximate to their fair value.
This assumption is also applied to demand deposits, and savings accounts without a specific maturity.
Fair value hierarchy
The Company uses the following hierarchy for determining and disclosing the fair value of financial instruments by valuation technique.
Financial instruments in Level 1
The fair value of financial instruments traded in active markets is based on quoted market prices at the balance sheet date. A market
is regarded as active if quoted prices are readily and regularly available from an exchange, dealer, broker, industry group, pricing service
or regulatory agency, and those prices represent actual and regularly occurring market transactions on an arm's length basis. The quoted
market price used for financial assets held by the Company is the last trade price. These instruments are included in Level 1. Instruments
included in Level 1 comprise primarily listed equity common stocks, futures, US, UK and Germany listed government bonds.
Financial instruments in Level 2
The fair value of financial instruments that are not traded in an active market (for example, over-the-counter derivatives) is determined
by using valuation techniques. These valuation techniques maximise the use of observable market data where it is available and rely
as little as possible on entity specific estimates. If all significant inputs required to fair value of an instrument are observable, the instrument
is included in Level 2.
If one or more of the significant inputs is not based on observable market data, the instrument is included in Level 3.
Specific valuation techniques used to value financial instruments include:
* Quoted market prices or dealer quotes for similar instruments;
* The fair value of interest rate swaps is calculated as the present value of the estimated future cash flows based on observable
yield curves;
* The fair value of forward foreign exchange contracts is determined using forward exchange rates at the balance sheet date, with the
resulting value discounted back to present value;
* Other techniques, such as discounted cash flow analysis, are used to determine fair value for the remaining financial instruments.
Note that all of the resulting fair value estimates are included in Level 2 except for financial investments explained below.
Financial instruments in Level 3
Level 3 includes securitised debt instruments and investments in less liquid fund structures.
As at 20.02.17 As at 20.02.16
Amounts in USD 000's Level 1 Level 2 Level 3 Total Level 1 Level 2 Level 3 Total
Financial investments
Equities and investment funds 1,876 0 0 1,876 1,512 0 0 1,512
Bonds 12,300 4,872 236 17,408 13,429 3,217 310 16,956
Cash incl. in other financial investments 171 0 0 171 91 0 0 91
Other financial investments 88 0 0 88 100 0 0 100
Total financial investments 14,434 4,872 236 19,542 15,132 3,217 310 18,659
Financial liabilities
Financial liabilities incl. in other payables 0 0 0 0 26 0 0 26
Total financial liabilities 0 0 0 0 26 0 0 26
Financial Statements for the year to 20 February 2017

GARD MARINE & ENERGY INSURANCE (EUROPE) ASNotes to the accounts
Note 10 - Financial instruments and fair values through profit or loss continued
The Company possesses only minority interests in quoted companies. The Company has an equity exposure of 9.6 percent of its total
investments.
Equities at market value
As at
Amounts in USD 20.02.17
AGL Energy Limited 1,453
Amcor Limited 1,024
AMP Limited 1,099
Aurizon Holdings Limited 834
Australia and New Zealand Banking Group 5,622
Bendigo and Adelaide Bank Limited 478
BHP Billiton Limited 8,988
Brambles Limited 589
Caltex Australia Ltd. 706
Commonwealth Bank of Australia 6,468
Fortescue Metals Group Ltd 2,129
Insurance Australia Group Limited 817
Macquarie Group Limited 1,543
National Australia Bank Limited 4,359
Newcrest Mining Limited 389
Origin Energy Limited 2,106
QBE Insurance Group Limited 1,534
Rio Tinto Limited 1,455
Santos Limited 673
Scentre Group Limited 1,189
Suncorp Group Limited 1,818
Telstra Corporation Limited 1,510
Wesfarmers Limited 1,854
Westfield Corporation Limited 941
Westpac Banking Corporation 5,714
Woodside Petroleum Ltd. 1,836
Woolworths Ltd. 2,566
Australia Total 59,692
Erste Group Bank AG 752
OMV Aktiengesellschaft 1,348
Raiffeisen-Landesbanken-Holding GmbH 1,000
Voestalpine AG 870
Austria Total 3,970
Ageas N.V. 1,068
Anheuser-Busch InBev 2,176
KBC Groep 1,366
Proximus NV 590
Solvay 741
Umicore 479
Belgium Total 6,420
Agrium Inc. 829
Alimentation Couche-Tard Inc. 703
ARC Resources Ltd. 280
Bank of Montreal 3,408
Barrick Gold Corporation 1,331
BCE Inc. 1,212
Bank of Nova Scotia 5,561
Financial Statements for the year to 20 February 2017

GARD MARINE & ENERGY INSURANCE (EUROPE) ASNotes to the accounts
Note 10 - Financial instruments and fair values through profit or loss continued
As at
Amounts in USD 20.02.17
Brookfield Asset Management Inc 1,195
Canadian Pacific Railway Limited 299
Canadian Imperial Bank of Commerce 2,580
Canadian Tire Corporation, Limited 962
Canadian National Railway Company 1,505
Canadian Natural Resources Limited 3,307
Cenovus Energy Inc. 1,680
Crescent Point Energy Corp. 1,153
Enbridge Inc. 1,469
Encana Corporation 4,169
Fairfax Financial Holdings Limited 472
First quantum Minerals Ltd. 2,142
Fortis Inc. 429
George Weston Limited 507
Goldcorp Inc. 869
Great-West Lifeco Inc 828
Husky Energy Inc. 1,036
Intact Financial Corporation 886
Loblaw Companies Limited 729
Magna International Inc. 1,821
Manulife Financial Corporation 2,598
Metro Inc. 522
National Bank of Canada 1,779
Pembina Pipeline Corporation 884
Potash Corporation of Saskatchewan Inc. 1,516
Power Corporation of Canada 1,231
Power Financial Corporation 680
RioCan Real Estate Investment Trust 513
Rogers Communications Inc. 1,362
Royal Bank of Canada 7,265
Shaw Communications Inc. 1,156
SNC-Lavalin Group Inc. 925
Sun Life Financial Inc. 1,181
Suncor Energy Inc. 4,151
Teck Resources Ltd. 4,039
TELUS Corporation 403
Thomson Reuters Corporation 1,304
The Toronto-Dominion Bank 6,152
TransCanada Corporation 1,664
Valeant Pharmaceuticals International 32
Yamana Gold Inc. 287
Canada Total 81,004
Yum China Holdings Inc. 452
China Total 452
A.P. Moller - Maersk A/S 3,338
Carlsberg A/S 788
Danske Bank A/S 2,028
Novo Nordisk A/S 633
TDC A/S 572
Denmark Total 7,359
Financial Statements for the year to 20 February 2017

GARD MARINE & ENERGY INSURANCE (EUROPE) ASNotes to the accounts
Note 10 - Financial instruments and fair values through profit or loss continued
As at
Amounts in USD 20.02.17
Fortum Oyj 809
KONE Oyj 617
Nokia Oyj 1,439
Sampo Oyj 1,111
Stora Enso Oyj 732
UPM-Kymmene Oyj 1,594
Finland Total 6,303
ACCOR 452
Air France - KLM 633
Air Liquide SA 2,228
Airbus Group 1,908
Alstom SA 638
ArcelorMittal S.A. 5,395
Arkema 1,125
AXA 5,675
BNP Paribas 8,154
Bouygues 997
Capgemini 614
Carrefour 1,706
Casino Guichard-Perrachon 1,477
Christian Dior SA 636
Compagnie De Saint-Gobain 2,821
Federation Nationale du Credit Agricole 1,923
Danone 1,748
Electricité de France S.A. 434
Eiffage 515
Engie 3,168
Essilor International SA 458
Kering 725
Lagardere SCA 455
Legrand SA 469
L'Oreal 733
LVMH Moet Hennessy Louis Vuitton 1,798
Michelin Group 1,902
Natixis SA 596
Orange 3,079
Pernod Ricard 1,261
Peugeot SA 1,030
Publicis Groupe SA 535
Renault 1,561
Rexel 969
Safran 832
Sanofi 6,844
Schneider Electric SE 2,353
SCOR SE 343
SES S.A. 377
Societe Generale 5,950
Sodexo 772
STMicroelectronics N.V. 1,140
SUEZ Environnement Company 747
Thales 574
Total SA 14,906
Unibail-Rodamco SE 937
Valeo 1,063
Vallourec 377
Financial Statements for the year to 20 February 2017

GARD MARINE & ENERGY INSURANCE (EUROPE) ASNotes to the accounts
Note 10 - Financial instruments and fair values through profit or loss continued
As at
Amounts in USD 20.02.17
Veolia Environnement-VE 1,156
VINCI 2,402
Vivendi 2,700
France Total 101,290
Adidas AG 1,576
Allianz SE 9,060
Aurubis AG 472
BASF SE 8,759
Bayer Aktiengesellschaft 3,643
Bayerische Motoren Werke Aktiengesellschaft 4,174
Brenntag AG 640
COMMERZBANK Aktiengesellschaft 1,635
Continental Aktiengesellschaft 1,421
Daimler AG 6,912
Deutsche Bank Aktiengesellschaft 5,147
Deutsche Borse Aktiengesellschaft 1,165
Deutsche Lufthansa Aktiengesellschaft 1,015
Deutsche Post AG 3,500
Deutsche Telekom AG 4,867
E.ON SE 5,819
Fresenius Medical Care AG & Co. KGaA 489
Fresenius SE & Co. KGaA 1,205
HeidelbergCement AG 1,091
Henkel AG & Co. KGaA 927
Infineon Technologies AG 594
K+S Aktiengesellschaft 529
LANXESS Aktiengesellschaft 931
Linde Aktiengesellschaft 1,961
Metro Ag 1,799
Munchener Ruckversicherungs-Gesellschaft 2,646
Porsche Automobil Holding SE 516
ProSiebenSat.1 Media SE 290
RWE Aktiengesellschaft 3,072
Sap Se 2,498
Siemens Aktiengesellschaft 7,743
ThyssenKrupp AG 1,656
TUI AG 339
Uniper SE 1,095
Volkswagen AG 6,201
Germany Total 95,388
AIA Group Limited 2,758
Bank of Ching (Hong Kong) Limited 1,175
CK Hutchison Holdings Limited 992
Cheung Kong Property Holdings Limited 626
CLP Holdings Limited 379
Hang Seng Bank Limited 967
Henderson Land Development Company Limited 499
Hongkong Land Holdings Ltd 790
Jardine Matheson Holdings Limited 511
Link Real Estate Investment Trust 818
New World Development Company Limited 1,020
Sands Chine Ltd 608
Financial Statements for the year to 20 February 2017

GARD MARINE & ENERGY INSURANCE (EUROPE) ASNotes to the accounts
Note 10 - Financial instruments and fair values through profit or loss continued
As at
Amounts in USD 20.02.17
Sun Hung Kai Properties Limited 1,160
Swire Pacific Ltd 600
Wharf (Holdings) Limited 1,636
Hong Kong Total 14,539
Bank of Ireland Rg 765
CRH PLC 1,771
Smurfit Kappa Group PLC 504
Ireland Total 3,040
Bank Hapoalim B.M. 792
Bezeq The Israel Telecommunication Corp. 105
Teva Pharmaceutical Industries Limited 1,045
Israel Total 1,942
Assicurazioni Generali S.P.A. 2,801
Atlantia S.p.A. 746
Banco BPM 264
BCA MPS 240
BPER Banca 265
CNH Industrial N.V. 1,104
ENEL - SPA 4,782
Eni S.p.A. 7,174
Fiat Chrysler Automobiles N.V. 3,874
Intesa Sanpaolo S.p.A. 2,722
Italgas S.p.A. 181
Leonardo S.p.A 202
Mediobanca S.p.A 813
Snam S.p.A. 906
Telecom Italia S.p.A. DI RISP 820
Telecom Italia S.p.A. 1,643
Tenaris 1,267
Terna - Rete Elettrica Nazionale S.p.A. 637
UniCredit S.p.A. 3,196
Unione Di Banche Italiane Societa' Per A 936
Unipol Gruppo Finanziario S.p.A. 406
Italy Total 34,978
Aeon Co., Ltd. 2,002
Aisin Seiki Co., Ltd. 1,551
Ajinomoto Co., Inc. 390
Alfresa Holdings Corporation 371
Asahi Glass Co., Ltd. 1,566
Asahi Group Holdings, Ltd. 1,054
Asahi Kasei Corp. 561
Astellas Pharma Inc. 963
Bridgestone Corporation 1,930
Canon Inc. 2,123
Central Japan Railway Company 988
Chubu Electric Power Co., Inc. 1,220
Chugoku Electric Power Co., Inc 584
Concordia Financial Group 418
Dai-Ichi Life Holdings, Inc. 2,672
Daiichi Sankyo Company, LTD 1,042
Daikin Industries, Ltd. 1,232
Daito Trust Construction Co., Ltd. 837
Financial Statements for the year to 20 February 2017

GARD MARINE & ENERGY INSURANCE (EUROPE) ASNotes to the accounts
Note 10 - Financial instruments and fair values through profit or loss continued
As at
Amounts in USD 20.02.17
Daiwa House Industry Co., Ltd. 1,209
Daiwa Securities Group Inc. 968
DENSO Corporation 1,708
Dentsu Inc. 686
East Japan Railway Company 2,634
Eisai Co., Ltd. 540
Electric Power Development Co., Ltd. 404
FANUC Corporation 1,185
Fast Retailing Co., Ltd. 619
Fuji Heavy Industries, Ltd. 871
FUJIFILM Holdings Corporation 1,349
Fujitsu Limited 2,811
Fukuoka Financial Group, Inc. 688
Hankyu Hanshin Holdings, Inc. 765
Hitachi, Ltd. 4,166
Honda Motor Co., Ltd. 6,951
Hoya Corporation 1,118
Idemitsu Kosan Co., Ltd. 1,037
IHI Corporation 1,501
INPEX Corp. 1,374
Isetan Mitsukoshi Holdings Ltd. 636
Isuzu Motors Limited 654
ITOCHU Corporation 2,779
J.Front Retailing Co., Ltd. 502
Japan Post Bank Co., Ltd. 756
Japan Post Holdings Co., Ltd. 1,134
Japan Tobacco Inc. 1,335
JFE Holdings, Inc. 2,632
JX Holdings Inc. 950
Kajima Corporation 380
KANI Electric Power 956
Kao Corporation 861
Kawasaki Heavy Industries, Ltd. 301
Kawasaki Kisen Kaisha, Ltd. 858
KDDI Corporation 2,154
Kintetsu Group Holdings Co., Ltd. 431
Kirin Holdings Company, Limited 1,400
Kobe Steel, Ltd. 1,359
Komatsu Ltd. 2,154
Konica Minolta Holdings, Inc. 664
Kubota Corporation 1,259
KYOCERA Corporation 1,707
Kyushu Electric Power Co Inc 385
Marubeni Corporation 2,144
Mazda Motor Corporation 814
Meiji Holdings Co., Ltd. 613
Mitsubishi Chemical Holdings Corporation 395
Mitsubishi Corporation 3,599
Mitsubishi Electric Corporation 2,571
Mitsubishi Estate Co., Ltd 1,158
Mitsubishi Heavy Industries, Ltd. 909
Mitsubishi Materials Corporation 849
Mitsubishi Motors Corporation 289
Mitsubishi UFJ Financial Group, Inc. 11,579
Mitsui & Co., Ltd. 3,222
Mitsui Chemicals, Inc. 469
Mitsui Fudosan Co., Ltd. 1,345
Financial Statements for the year to 20 February 2017

GARD MARINE & ENERGY INSURANCE (EUROPE) ASNotes to the accounts
Note 10 - Financial instruments and fair values through profit or loss continued
As at
Amounts in USD 20.02.17
Mitsui O.S.K. Lines, Ltd. 1,055
Mizuho Financial Group, Inc. 5,260
MS&AD Insurance Group Holdings, Inc. 1,700
Murata Manufacturing Co., Ltd. 1,159
NEC Corp. 1,176
NH Foods Ltd. 515
Nidec Corporation 1,134
Nikon Corporation 438
Nintendo Co., Ltd. 817
Nippon Express Co., Ltd. 583
Nippon Steel & Sumitomo Metal Corporatio 2,342
Nippon Telegraph and Telephone Corporati 1,856
Nippon Yusen Kabushiki Kaisha 758
Nissan Motor Co., Ltd. 2,487
Nitto Denko Corporation 842
Nomura Holdings, Inc. 2,287
NTT DoCoMo, Inc. 1,475
Oji Holdings Corporation 533
OMRON Corporation 429
ORIX Corporation 1,495
Osaka Gas Co., Ltd. 1,102
Otsuka Holdings Co.,Ltd. 684
Panasonic Corporation 2,778
Resona Holdings, Inc. 1,608
Ricoh Company, Ltd. 1,028
SECOM Co., Ltd. 435
Sekisui Chemical Co., Ltd. 215
Sekisui House, Ltd. 922
Seven & I Holdings Co Ltd 2,257
Sharp Corporation 1,475
Shin-Etsu Chemical Co., Ltd. 2,006
Shiseido Company, Limited 584
Showa Denko K.K. 613
Showa Shell Sekiyu K.K. 383
SMC Corporation 560
Softbank Group Corp. 3,885
Sojitz Corporation 601
Sompo Japan Nipponkoa Holdings, Inc. 2,119
Sony Corporation 2,822
Sumitomo Chemical Co., Ltd. 1,416
Sumitomo Corporation 2,035
Sumitomo Electric Industries Ltd. 1,978
Sumitomo Metal Mining Co., Ltd. 544
Sumitomo Mitsui Financial Group, Inc. 7,037
Sumitomo Mitsui Trust Holdings,Inc. 1,494
Sumitomo Realty & Development Co., Ltd. 545
Suzuken Co., Ltd. 712
Suzuki Motor Corporation 1,635
T&D Holdings, Inc. 1,422
Taisei Corporation 684
Takeda Pharmaceutical Co Ltd 2,317
TDK Corporation 693
Tohoku Electric Power Co., Inc. 764
Tokio Marine Holdings, Inc. 2,969
Tokyo Electric Power Co. Holdings Inc. 1,684
Tokyo Electron Limited 593
Financial Statements for the year to 20 February 2017

GARD MARINE & ENERGY INSURANCE (EUROPE) ASNotes to the accounts
Note 10 - Financial instruments and fair values through profit or loss continued
As at
Amounts in USD 20.02.17
Tokyo Gas Co., Ltd. 967
Tonengeneral Sekiyu K.K. 675
Toppan Printing Co., Ltd. 769
Toray Industries, Inc. 825
Toshiba Corporation 2,255
Toyota Industries Corporation 589
Toyota Motor Corporation 12,964
Toyota Tsusho Corp 973
West Japan Railway Company 1,235
Yamaha Motor Co., Ltd. 572
Yamato Holdings Co., Ltd. 616
Japan Total 215,671
Hana Financial Group Inc. 822
Hyundai Heavy Industries Co., Ltd. 647
Hyundai Mobis Co., Ltd. 455
Hyundai Motor Company 2,353
Hyundai Steel Company 777
Industrial Bank of Korea 445
KB Financial Group Inc. 1,444
KIA Motors Corporation 1,021
Korea Electric Power Corp. 1,050
KT Corporation 661
LG Chem, Ltd. 728
LG Corp. 221
LG Display Co., Ltd. 931
LG Electronics Inc. 1,081
POSCO 2,479
Samsung Electronics Co., Ltd. 14,815
Samsung Fire & Marine Insurance Co., Ltd 674
Samsung Life Insurance Co., Ltd. 458
Shinhan Financial Group Co Ltd 769
SK Hynix Inc. 2,435
SK Innovation Co., Ltd. 1,338
Sk Telecom Co Ltd 395
Korea (South) Total 35,999
Aegon N.V. 2,997
Akzo Nobel N.V. 1,071
Asml Holding N.V. 880
Coca-Cola European Partners PLC 354
Delta Lloyd N.V. 550
Heineken Holding N.V. 683
Heineken N.V. 735
ING Groep N.V. 4,630
Koninklijke Ahold N.V 1,406
Koninklijke DSM N.V. 972
Koninklijke KPN N.V. 870
Koninklijke Philips N.V. 2,042
NN Group N.V. 1,535
Randstad Holding N.V. 531
Relx N.V 193
Stichting Administratiekantoor Unilever 3,024
Netherlands Total 22,473
Financial Statements for the year to 20 February 2017

GARD MARINE & ENERGY INSURANCE (EUROPE) ASNotes to the accounts
Note 10 - Financial instruments and fair values through profit or loss continued
As at
Amounts in USD 20.02.17
DNB ASA 1,708
Marine Harvest ASA 422
Norsk Hydro ASA 591
Orkla ASA 462
Seadrill Limited 1,277
Statoil ASA 3,010
Subsea 7 S.A. 1,471
Telenor ASA 968
Yara International ASA 667
Norway Total 10,576
EDP- Energias de Portugal, S.A. 1,009
Galp Energia, SGPS, S.A. 814
Portugal Total 1,823
CapitaLand Limited 476
DBS Group Holdings Ltd 1,409
Keppel Corp Ltd. 1,072
Oversea-Chinese Banking Corporation Limited 1,518
Singapore Telecommunications Limited 1,456
United Overseas Bank Limited 1,489
Wilmar International Limited 264
Singapore Total 7,683
Abertis Infraestructuras, S.A. 530
ACS, Actividades de Construccion y Servi 1,564
Amadeus IT Holding, S.A. 553
Banco Popular Espanol, S.A. 478
Banco Santander, S.A. 17,487
Bankia SA 690
Banco Bilbao Vizcaya Argentaria, S.A. 4,498
Banco de Sabadell, S.A. 1,169
CaixaBank 1,056
Distribuidora Internacional De Alimentac 376
Endesa SA 1,059
Ferrovial, S.A. 794
Gas Natural SDG, S.A. 867
Iberdrola, S.A. 2,173
Industria de Diseno Textil, S.A. 953
International Airlines Group S.A. 490
Mapfre S.A. 727
Red Electrica Corporacion, S.A. 515
Repsol, S.A. 4,255
Telefonica S.A. 6,670
Spain Total 46,906
ASSA ABLOY AB 610
Atlas Copco AB A 786
Atlas Copco AB B 442
Boliden AB 853
Aktiebolaget Electrolux 717
Ericsson 1,273
H & M Hennes & Mauritz AB 1,120
Aktiebolaget Industrivarden 577
Nordea Bank AB 3,556
Sandvik AB 1,566
Financial Statements for the year to 20 February 2017

GARD MARINE & ENERGY INSURANCE (EUROPE) ASNotes to the accounts
Note 10 - Financial instruments and fair values through profit or loss continued
As at
Amounts in USD 20.02.17
Skandinaviska Enskilda Banken AB 1,494
Skanska AB 511
SKF AB 537
Svenska Cellulosa Aktiebolaget SCA 880
Svenska Handelsbanken AB 1,560
Swedbank AB 1,294
Tele2 AB 322
TeliaSonera AB 737
Volvo AB 2,078
Sweden Total 20,915
ABB Ltd. 3,253
Adecco S.A. 1,136
Baloise-Holding AG 648
Credit Suisse Group AG 3,330
Lafargeholcim Ltd 1,476
Nestle S.A. 10,452
Novartis AG 6,582
Compagnie Financiere Richemont SA 1,970
Roche Holding AG 5,600
Swatch Group AG 679
Swiss Life Holding AG 1,260
Swiss Re AG 3,252
Swiss AG 902
Syngenta AG 1,704
Transocean Ltd. 1,370
UBS Group AG 2,325
Zurich Insurance Group AG 5,292
Switzerland Total 51,230
Amec Foster Wheele PLC 628
Anglo American PLC 6,039
Antafagasta PLC 739
Associated British Foods PLC 512
AstraZeneca PLC 4,275
Aviva PLC 2,856
BAE Systems PLC 1,618
Barclays PLC 6,935
BHP Billiton PLC 4,732
BP p.l.c. 18,137
British American Tobacco p.l.c. 4,599
British Land Company PLC 526
BT Group PLC 1,347
Bunzl Public Limited Company 435
Capita PLC 173
Carnival PLC 812
Centrica PLC 2,528
Compass Group PLC 1,159
DCC PLC 763
Diageo PLC 1,895
Direct Line Insurance Group PLC 573
Experian PLC 702
G4S PLC 380
GKN PLC 448
GlaxoSmithKline PLC 6,165
Glencore PLC 10,426
Financial Statements for the year to 20 February 2017

GARD MARINE & ENERGY INSURANCE (EUROPE) ASNotes to the accounts
Note 10 - Financial instruments and fair values through profit or loss continued
As at
Amounts in USD 20.02.17
Hammerson PLC 308
HSBC Holdings PLC 21,590
Imperial Brands PLC 2,051
International Consolidated Airlines Group 774
Johnson Matthey PLC 611
Kingfisher PLC 1,051
Land Securities Group PLC 713
Legal & General Group PLC 1,306
Lloyds Banking Group PLC 3,905
Marks and Spencer Group P.L.C. 673
Mondi plc 465
National Grid PLC 2,984
NEXT PLC 240
Old Mutual Public Limited Company 1,472
Pearson PLC 898
Prudential Public Limited Company 3,408
Reckitt Benckiser Group PLC 1,493
Relx PLC 148
Rio Tinto PLC 5,230
Rolls-Royce Holdings plc 1,139
Royal Bank of Scotland 1,892
Royal Dutch Shell PLC 28,646
Royal Mail PLC 394
RSA Insurance Group PLC 987
Sainsbury (J) plc 1,087
Severn Trent PLC 632
Shire PLC 359
Sky PLC 671
Smith & Nephew PLC 285
Smiths Group PLC 416
SSE PLC 1,776
Standard Chartered PLC 4,122
Standard Life PLC 993
TechnipFMC PLC 1,015
Tesco PLC 2,789
Unilever PLC 1,593
United Utilities Group PLC 687
Vodafone Group Public Limited Company 6,997
WM Morrison Supermarkets P L C 1,110
Wolseley Limited 1,251
WPP PLC 1,767
United Kingdom Total 189,332
3M Company 3,476
5th Third Bancorp 2,066
Abbott Laboratories 2,190
AbbVie Inc. 2,038
Accenture Public Limited Company 1,576
Activision Blizzard, Inc. 1,224
Adient PLC 64
Adobe Systems Incorporated 957
AdvanSix Inc 29
AES Corporation 1,238
Aetna Inc. 1,503
AFLAC Incorporated 2,204
Financial Statements for the year to 20 February 2017

GARD MARINE & ENERGY INSURANCE (EUROPE) ASNotes to the accounts
Note 10 - Financial instruments and fair values through profit or loss continued
As at
Amounts in USD 20.02.17
AGCO Corporation 512
AGNC Investment Corp. 819
Air Products and Chemicals, Inc. 1,415
Allergan Public Limited Company 1,731
Alliant Energy Corporation 724
Allstate Corp. 2,494
Ally Financial Inc. 2,228
Alphabet Inc. A 3,386
Alphabet Inc. C 3,312
Altria Group, Inc. 4,013
Amazon.com, Inc. 1,690
American Electric Power Company, Inc. 1,859
Ameren Corporation 1,014
American Express Company 3,029
American International Group, Inc. 6,500
American Tower Corporation 432
American Water Works Company, Inc. 443
Ameriprise Financial, Inc. 1,419
AmerisourceBergen Corporation 1,906
Amgen Inc. 2,079
Anadarko Petroleum Corporation 3,472
Analog Devices, Inc. 1,072
Annaly Capital Management, Inc. 1,277
Anthem, Inc. 2,564
Aon PLC 1,175
Apache Corporation 2,162
Apple Inc. 17,915
Applied Materials, Inc. 1,926
Arch Capital Group Ltd. 752
Archer-Daniels-Midland Company 2,815
ARINC Incorporated 1,645
Arrow Electronics, Inc. 1,250
Assurant, Inc. 387
AT&T Inc. 16,260
Autoliv, Inc. 635
Automatic Data Processing, Inc. 1,495
Avis Budget Group, Inc. 405
Avnet, Inc. 789
Avon Products, Inc. 433
Baker Hughes Incorporated 2,552
Bank of New York Mellon Corporation 2,451
Bank of America Corporation 19,837
Baxter International Inc. 1,144
BB&T Corporation 2,590
Becton, Dickinson and Company 1,266
Bed Bath & Beyond Inc. 494
Berkshire Hathaway Inc. 11,463
Best Buy Co., Inc. 1,810
Biogen Inc. 1,156
Bioverativ Inc. 95
BlackRock, Inc. 2,333
Boeing Company 3,972
Boston Scientific Corporation 914
Bristol-Myers Squibb Company 2,675
Boston Properties, Inc. 1,098
Bunge Limited 2,256
Financial Statements for the year to 20 February 2017

GARD MARINE & ENERGY INSURANCE (EUROPE) ASNotes to the accounts
Note 10 - Financial instruments and fair values through profit or loss continued
As at
Amounts in USD 20.02.17
C.H. Robinson Worldwide, Inc. 474
CA, Inc. 481
Calpine Corporation 401
Capital One Financial Corporation 3,672
Cardinal Health, Inc. 1,695
CarMax, Inc. 871
Carnival Corporation 831
Caterpillar Inc. 4,547
CBS Corporation 1,511
Celgene Corporation 969
CenterPoint Energy, Inc. 1,219
CenturyLink, Inc. 2,064
CF Industries Holdings, Inc. 341
Charter Communications, Inc. 2,286
Chesapeake Energy Corporation 2,245
Chevron Corporation 19,418
Chubb Limited 2,179
Cigna Corporation 1,723
Cincinnati Financial Corporation 291
Cisco Systems, Inc. 5,837
CIT Group Inc. 525
Citigroup Inc. 15,223
Citizens Financial Group Inc. 2,270
CME Group Inc. 2,330
Community Health Systems Inc. 414
Coach, Inc. 726
Coca-Cola Enterprises, Inc. 4,865
Cognizant Technology Solutions Corporati 696
Colgate-Palmolive Company 1,080
Alcoa Inc. 652
Comcast Corporation 7,080
Comerica Incorporated 941
Conagra Brands, Inc. 1,149
Conduent Inc. 330
ConocoPhillips 8,077
Consolidated Edison, Inc. 1,397
CONSOL Energy Inc. 1,338
Corning Incorporated 1,770
Costco Wholesale Corporation 2,990
Crown Castle International Corp. 446
CSX Corporation 2,524
Cummins Inc. 1,835
CVS Health Corporation 3,347
Danaher Corporation 672
Darden Restaurants, Inc. 614
DaVita HealthCare Partners Inc. 803
Deere & Company 2,757
Dell Technologies Inc. 452
Delphi Automotive PLC 755
Devon Energy Corporation 4,019
Discover Financial Services 1,783
Discovery Communications, Inc. 421
Dish Network Corporation 252
Dollar General Corporation 1,165
Dominion Resources, Inc. 1,770
Donnelley Financial Solutions Inc. 148
Donnelley R. R & Sons Company 299
Financial Statements for the year to 20 February 2017

GARD MARINE & ENERGY INSURANCE (EUROPE) ASNotes to the accounts
Note 10 - Financial instruments and fair values through profit or loss continued
As at
Amounts in USD 20.02.17
Dover Corporation 640
DOW Chemical Company 4,227
Dr Pepper Snapple Group, Inc. 376
DTE Energy Company 1,276
E. I. du Pont de Nemours and Company 3,565
Duke Energy Corporation 3,134
Eastman Chemical Company 883
Eaton Corporation Public Limited Company 1,719
eBay Inc. 1,182
Ecolab Inc. 1,240
Edison International 1,298
Eli Lilly and Company 3,376
Emerson Electric Co. 1,671
Ensco PLC 1,105
Entergy Corporation 1,692
EOG Resources, Inc. 2,476
Equity Residential 801
Eversource Energy 842
Exelon Corporation 3,416
Express Scripts Holding Company 2,589
Exxon Mobil Corporation 23,302
Facebook, Inc. 1,869
Fedex Corporation 2,518
Fidelity National Financial, Inc. 489
Fidelity National Information Services, 1,067
FirstEnergy Corp. 837
Fiserv, Inc. 224
Flextronics International Ltd. 1,611
Fluor Corporation 564
Ford Motor Company 4,554
Fortive Corporation 231
Freeport-McMoRan Inc. 4,294
Franklin Resources, Inc. 1,403
Frontier Communications Corporation 503
Gap Inc. 612
General Motors Company 4,392
General Dynamics Corporation 2,458
General Electric Company 13,454
General Mills, Inc. 1,244
Genuine Parts Company 604
Genworth Financial, Inc. 1,688
GGP Inc. 300
Gilead Sciences, Inc. 1,607
Goldman Sachs Group Inc. 6,760
Goodyear Tire & Rubber Company 757
Grainger W. W. Inc. 510
Halliburton Company 2,900
Harley-Davidson, Inc. 683
Hartford Financial Services Group Inc. 1,838
HCA Holdings, Inc. 2,116
HCP, Inc. 1,025
Helmerich & Payne Inc. 819
Henry Schein, Inc. 672
Herc Holdings Inc. 396
Hershey Company 429
Hertz Global Holdings, Inc. 460
Hess Corporation 1,397
Financial Statements for the year to 20 February 2017

GARD MARINE & ENERGY INSURANCE (EUROPE) ASNotes to the accounts
Note 10 - Financial instruments and fair values through profit or loss continued
As at
Amounts in USD 20.02.17
Hewlett Packard Enterprise Company 4,856
HollyFrontier Corporation 1,227
Home Depot Inc. 3,861
Honeywell International Inc. 2,865
Host Hotels & Resorts, Inc. 497
HP Inc. 2,887
Humana Inc. 2,046
Huntington Bancshares Incorporated 1,031
Illinois Tool Works Inc. 1,694
Ingersoll-Rand Public Limited Company 810
Intel Corporation 8,938
Intercontinental Exchange, Inc. 642
International Business Machines Corporat 9,034
International Paper Company 2,399
Invesco Ltd. 748
Iron Mountain Inc. 483
Jabil Circuit, Inc. 544
Jacobs Engineering Group Inc. 576
Johnson & Johnson 11,411
Johnson Controls, Inc. 587
JPMorgan Chase & Co. 20,753
Kellogg Company 875
KeyCorp 758
Kimberly-Clark Corporation 1,583
Kinder Morgan, Inc. 2,917
Kohl's Corporation 630
Kraft Heinz Company 967
Kroger Company 2,347
L Brands, Inc. 518
L3 Technologies Inc. 1,178
Laboratory Corporation of America Holding 558
Lamb Weston Holdings Inc. 396
Las Vegas Sands Corp. 624
Lear Corporation 1,139
Leucadia National Corporation 537
L-3 Communications Holdings, Inc. 860
Liberty Global PLC C 1,322
Liberty Interactive Corporation 695
Liberty Media SiriusXM Group 151
Liberty Media Braves Group 21
Liberty Media Corporation 32
Lincoln National Corporation 2,366
Lockheed Martin Corporation 2,919
Loews Corporation 1,691
Lowe's Companies, Inc. 2,072
LSC Communications Inc. 161
LyondellBasell Industries N.V. 2,880
M&T Bank Corporation 1,679
Macy's, Inc. 808
Manpowergroup Inc. 876
Marathon Oil Corporation 4,268
Marathon Petroleum Corporation 4,102
Marsh & McLennan Companies, Inc. 1,691
MasterCard Incorporated 1,313
Mattel, Inc. 261
Maxim Integrated Products, Inc. 180
Financial Statements for the year to 20 February 2017

GARD MARINE & ENERGY INSURANCE (EUROPE) ASNotes to the accounts
Note 10 - Financial instruments and fair values through profit or loss continued
As at
Amounts in USD 20.02.17
McDonald's Corporation 3,451
McKesson Corporation 3,155
Medtronic Public Limited Company 2,682
Merck Sharp & Dohme Corp. 8,239
MetLife, Inc. 4,820
MGM Resorts International 505
Micron Technology, Inc. 2,685
Microsoft Corporation 11,890
Mondelez International, Inc. 2,720
Monsanto Company 1,853
Morgan Stanley 4,292
Mosaic Company 1,209
Motorola Solutions, Inc. 714
Murphy Oil Corporation 1,770
Murphy USA Inc. 521
Mylan Group B.V. 421
Nabors Industries Ltd 352
National Oilwell Varco, Inc. 1,966
Navient Corporation 1,035
New York Community Bancorp, Inc. 258
Newmont Mining Corporation 1,221
News Corporation A 249
News Corporation B 81
NextEra Energy, Inc. 1,649
Nielsen Holdings PLC 496
NIKE, Inc. 1,192
Noble Corporation PLC 314
Nordstrom, Inc. 366
Norfolk Southern Corporation 1,473
Northern Trust Corporation 1,046
Northrop Grumman Corporation 1,705
NRG Energy, Inc. 1,402
Nucor Corporation 1,598
O'Reilly Automotive, Inc. 536
Occidental Petroleum Corporation 2,386
Office Depot, Inc. 236
Omnicom Group Inc. 1,109
ONEOK, Inc. 1,019
Oracle Corporation 4,038
Owens-Illinois, Inc. 234
PACCAR Inc 1,584
Parker-Hannifin Corporation 1,231
Paychex, Inc. 769
PayPal Holdings Inc 671
Penney (JC) Corporation, Inc. 527
Pentair Public Limited Company 407
PepsiCo, Inc. 4,759
Pfizer Inc. 10,288
PG&E Corporation 1,214
Philip Morris International Inc. 5,805
Phillips 66 2,910
Pioneer Natural Resources Company 384
PNC Financial Services Group 3,679
PPG Industries, Inc. 921
PPL Corporation 819
Praxair, Inc. 1,526
Principal Financial Group, Inc. 1,180
Financial Statements for the year to 20 February 2017
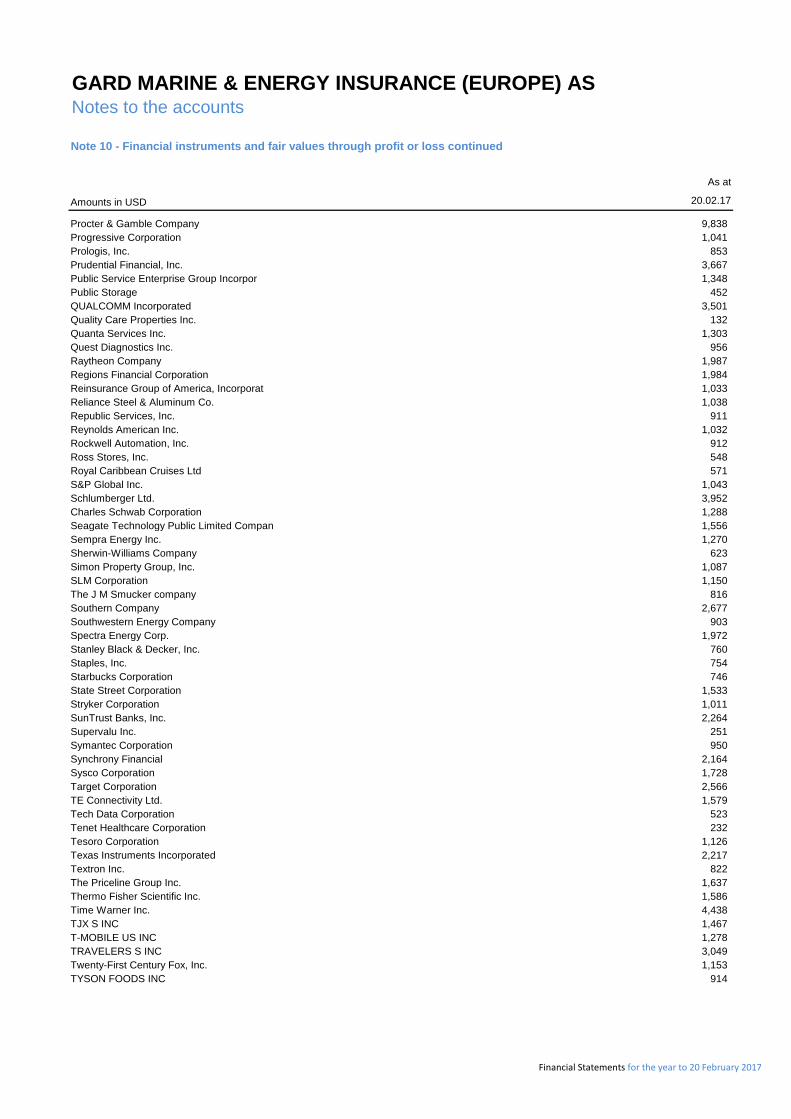
GARD MARINE & ENERGY INSURANCE (EUROPE) ASNotes to the accounts
Note 10 - Financial instruments and fair values through profit or loss continued
As at
Amounts in USD 20.02.17
Procter & Gamble Company 9,838
Progressive Corporation 1,041
Prologis, Inc. 853
Prudential Financial, Inc. 3,667
Public Service Enterprise Group Incorpor 1,348
Public Storage 452
QUALCOMM Incorporated 3,501
Quality Care Properties Inc. 132
Quanta Services Inc. 1,303
Quest Diagnostics Inc. 956
Raytheon Company 1,987
Regions Financial Corporation 1,984
Reinsurance Group of America, Incorporat 1,033
Reliance Steel & Aluminum Co. 1,038
Republic Services, Inc. 911
Reynolds American Inc. 1,032
Rockwell Automation, Inc. 912
Ross Stores, Inc. 548
Royal Caribbean Cruises Ltd 571
S&P Global Inc. 1,043
Schlumberger Ltd. 3,952
Charles Schwab Corporation 1,288
Seagate Technology Public Limited Compan 1,556
Sempra Energy Inc. 1,270
Sherwin-Williams Company 623
Simon Property Group, Inc. 1,087
SLM Corporation 1,150
The J M Smucker company 816
Southern Company 2,677
Southwestern Energy Company 903
Spectra Energy Corp. 1,972
Stanley Black & Decker, Inc. 760
Staples, Inc. 754
Starbucks Corporation 746
State Street Corporation 1,533
Stryker Corporation 1,011
SunTrust Banks, Inc. 2,264
Supervalu Inc. 251
Symantec Corporation 950
Synchrony Financial 2,164
Sysco Corporation 1,728
Target Corporation 2,566
TE Connectivity Ltd. 1,579
Tech Data Corporation 523
Tenet Healthcare Corporation 232
Tesoro Corporation 1,126
Texas Instruments Incorporated 2,217
Textron Inc. 822
The Priceline Group Inc. 1,637
Thermo Fisher Scientific Inc. 1,586
Time Warner Inc. 4,438
TJX S INC 1,467
T-MOBILE US INC 1,278
TRAVELERS S INC 3,049
Twenty-First Century Fox, Inc. 1,153
TYSON FOODS INC 914
Financial Statements for the year to 20 February 2017

GARD MARINE & ENERGY INSURANCE (EUROPE) ASNotes to the accounts
Note 10 - Financial instruments and fair values through profit or loss continued
As at
Amounts in USD 20.02.17
UGI Corporation 712
Union Pacific Corporation 3,404
United Parcel Service, Inc. 2,245
United States Steel Corporation 3,065
United Technologies Corporation 4,486
UnitedHealth Group Incorporated 5,359
Unum Group 1,795
U.S. Bancorp 3,622
V.F. Corporation 421
Valero Energy Corporation 2,882
Ventas, Inc. 932
Verizon Communications, Inc. 9,789
Versum Materials Inc 155
Viacom Inc. 1,056
Visa Inc. 1,137
Vornado Realty Trust 878
Voya Financial, Inc. 922
Walgreens Boots Alliance, Inc. 2,748
Wal-Mart Stores, Inc. 8,949
Walt Disney Co 3,852
Waste Management, Inc. 1,666
Weatherford International Ltd. 1,106
WEC Energy Group Inc. 288
Wells Fargo & Company 13,942
Welltower Inc. 857
Western Union Company 614
Western Digital Corporation 1,948
Westrock Company 316
Weyerhaeuser Company 1,676
Whirlpool Corporation 1,063
Whiting Petroleum Corporation 1,178
Whole Foods Market, Inc. 525
Williams Companies Inc. 2,284
World Fuel Services Corporation 728
Wynn Resorts, Limited 767
Xcel Energy Inc. 966
Xerox Corporation 818
Xl Group Public Limited Company 1,024
Yahoo! Inc. 2,435
Yum! Brands, Inc. 1,163
Zimmer Biomet Holdings, Inc. 701
USA Total 856,662
Total equities at market value 1,875,647
Financial Statements for the year to 20 February 2017

GARD MARINE & ENERGY INSURANCE (EUROPE) ASNotes to the accounts
Note 11 - Financial risk
Risk management framework
The purpose of the risk management system is to ensure that material risks are managed in accordance with the Company’s corporate
objectives and risk carrying capacity. The risk management system consists of the following components:
Risk appetite and limits: Overall Risk Appetite and Comfort Zone (target range for capitalisation) are defined in accordance with risk
carrying capacity and corporate objectives. This cascades into limits by risk type and legal entities. This forms the basis for all risk
management, monitoring and reporting.
Risk policies: There are group policies describing the processes and procedures for managing material risk exposures. The purpose of the
policies is to ensure consistent and adequate risk and capital management.
Risk management cycle: Material risks are identified, assessed regulary, managed proactively, monitored regulary and reported to relevant
responsible body.
Main financial risks
Insurance risk
Insurance risk arises from the underwriting activities (“premium risk”) and existing insurance liabilities (“reserve risk”). The Gard group is a
high capacity provider of risk mitigation products and services to industrial customers. While parts of the Gard group’s portfolio are high
frequency and low severity, many of the covers provided by the Gard group are “catastrophic” in their nature: High exposures and therefore
potentially very high severity. A small number of claims represent a large share of the claims cost in any year. The insurance risk profile is
managed by having limits on the risks written and mitigated through reinsurance.
Market risk
Market risk consists of equity risk, interest rate risk, credit risk, currency risk, property risk, and alternatives risk.
Equity beta risk
The risk of economic losses resulting from deviations in the value of market indices from their expected values. The equity portfolio is broadly
diversified. Compared to a global benchmark portfolio based on market capitalizations, the equity portfolio is skewed towards emerging
markets and smaller companies, which is expected to have a higher volatility than the global market as a whole. Through a portable alpha
program, parts of the equity market exposure are hedged into fixed income exposure through a rolling equity futures program.
Interest rate risk
The risk of economic losses resulting from deviations in actual interest rates from expected interest rates. The term structure of interest
bearing assets in the Gard group is matched to the expected duration of the liabilities. The sensitivity analysis of the bond assets of the Gard
group has been modelled by reference to a reasonable approximation of the weighted average interest rate sensitivity of the investments held.
Credit risk
The risk of economic losses resulting from the default of third parties.
The following tables shows information regarding credit risk exposure as at 20.02.2017, by classifying assets according to the median rating
amongst the three market leading providers, Standard & Poor's, Moody's and Fitch. This principle is in line with new Solvency ll requirements.
AAA is the highest possible rating. The US long-term sovereign credit rating is considered to be AAA due to an applied median approach.
Financial Statements for the year to 20 February 2017

GARD MARINE & ENERGY INSURANCE (EUROPE) ASNotes to the accounts
Note 11 - Financial risk continued
Credit risk exposure in balance sheet
As at As at
Amounts in USD 000's 20.02.17 20.02.16
Bonds
AAA 14,019 13,491
AA 312 133
A 866 636
BBB 2,043 2,397
BB 135 239
B 32 60
Total bonds 17,408 16,956
Cash included in other financial investments
A 171 91
Total cash included in other financial investments 171 91
Other financial investments
A 88 100
Total other financial investments 88 100
Reinsurers` share of gross premium reserve
A 32,218 40,071
Total reinsurers' share of gross premium reserve 32,218 40,071
Reinsurers` share of gross claim reserve
A 45,658 36,748
BBB 3,287 7,148
Not rated 1,252 0
Total reinsurers' share of gross claim reserve 50,197 43,896
Receivables
A 0 4
Not rated 36,595 40,141
Total receivables 36,595 43,913
Cash and cash equivalents
AA 18,006 22,825
Total cash and cash equivalents 18,006 22,825
Financial Statements for the year to 20 February 2017

GARD MARINE & ENERGY INSURANCE (EUROPE) ASNotes to the accounts
Note 11 - Financial risk continued
Alternatives risk
The risk that the actual return of investments due to alternatives decisions by the asset managers will be lower than expected.
Active asset managers, who are aiming to outperform a given benchmark, manage most of Gard’s investment mandates. The ability to
outperform also comes with the risk of significant underperformance versus the benchmark, which is referred to as alternatives risk.
Through the portable alpha programme, most of the alternatives risk is skewed towards active equity managers, but also include a
global tactical allocation fund, which is exposed to different types of asset classes on a macro-based approach.
Real estate risk
The risk of economic losses resulting from deviations in the value of real estate investments from their expected values. The global
property exposure includes own buildings and both indirect and direct investments in real estates. The indirect investment is through
purchasing equities of listed real estate companies whereas through the direct exposure we own real estate properties through a pool
together with other investors.
Currency risk
The risk of economic losses resulting from actual currency rates differing from expected currency rates. The currency
exposure on the asset side is matched to the assumed currency exposure of liabilities. The assumed currency exposure to liabilities differs
from the accounting exposure to currencies because the reserving currency is not always the actual currencies of the future cash
flow. There is an acceptable mismatch between the currency exposure on assets and on liabilities. The currency exposure is managed
through a rolling forward program.
Currency split balance sheet
Restated*
As at As at
Amounts in USD 000's 20.02.17 20.02.16
Assets
USD 117,562 108,343
EUR 37,960 31,760
GBP 2,338 1,947
Other 3,150 33,436
Total assets 161,011 175,486
Equity and liabilities
USD 130,421 113,033
EUR 30,349 28,201
GBP (6) 49
Other 247 34,204
Total equity and liabilities 161,011 175,486
Net currency exposure
USD 12,859 4,690
EUR (7,611) (3,559)
GBP (2,345) (1,899)
Other (2,903) 768
0
Net exposure in %
USD 8% 3%
EUR -5% -2%
GBP -1% -1%
Other -2% 0%
Financial Statements for the year to 20 February 2017
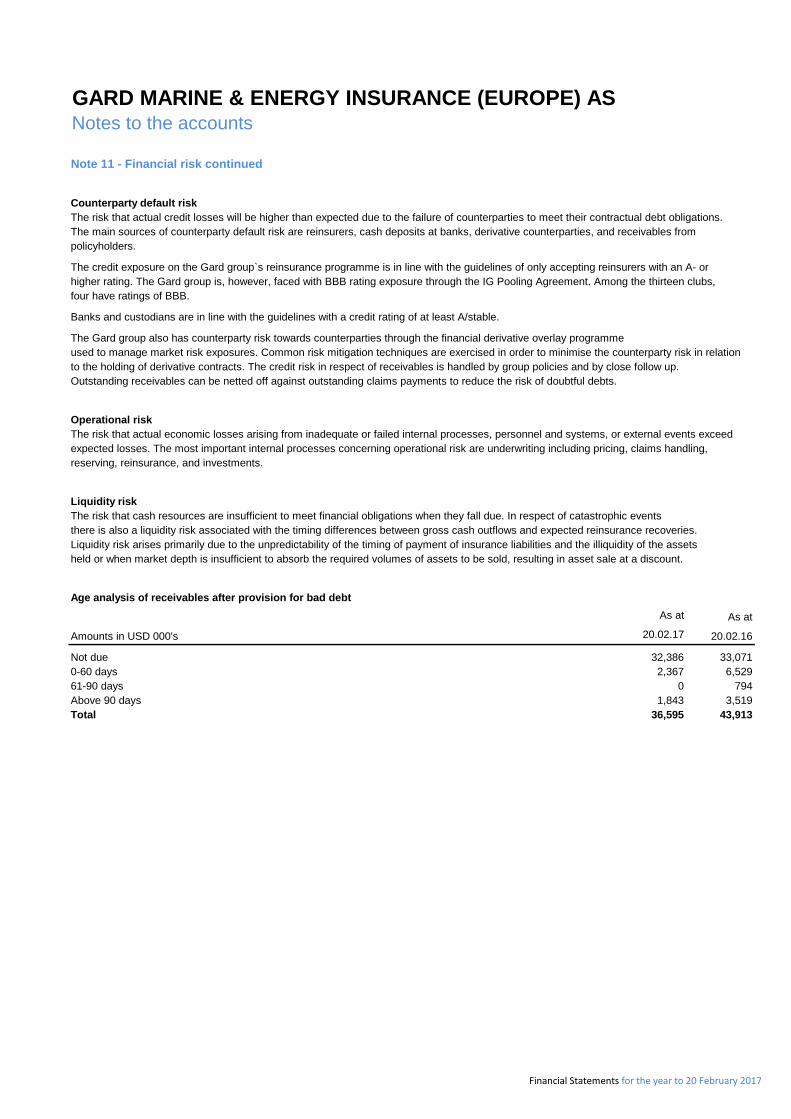
GARD MARINE & ENERGY INSURANCE (EUROPE) ASNotes to the accounts
Note 11 - Financial risk continued
Counterparty default risk
The risk that actual credit losses will be higher than expected due to the failure of counterparties to meet their contractual debt obligations.
The main sources of counterparty default risk are reinsurers, cash deposits at banks, derivative counterparties, and receivables from
policyholders.
The credit exposure on the Gard group`s reinsurance programme is in line with the guidelines of only accepting reinsurers with an A- or
higher rating. The Gard group is, however, faced with BBB rating exposure through the IG Pooling Agreement. Among the thirteen clubs,
four have ratings of BBB.
Banks and custodians are in line with the guidelines with a credit rating of at least A/stable.
The Gard group also has counterparty risk towards counterparties through the financial derivative overlay programme
used to manage market risk exposures. Common risk mitigation techniques are exercised in order to minimise the counterparty risk in relation
to the holding of derivative contracts. The credit risk in respect of receivables is handled by group policies and by close follow up.
Outstanding receivables can be netted off against outstanding claims payments to reduce the risk of doubtful debts.
Operational risk
The risk that actual economic losses arising from inadequate or failed internal processes, personnel and systems, or external events exceed
expected losses. The most important internal processes concerning operational risk are underwriting including pricing, claims handling,
reserving, reinsurance, and investments.
Liquidity risk
The risk that cash resources are insufficient to meet financial obligations when they fall due. In respect of catastrophic events
there is also a liquidity risk associated with the timing differences between gross cash outflows and expected reinsurance recoveries.
Liquidity risk arises primarily due to the unpredictability of the timing of payment of insurance liabilities and the illiquidity of the assets
held or when market depth is insufficient to absorb the required volumes of assets to be sold, resulting in asset sale at a discount.
Age analysis of receivables after provision for bad debt
As at As at
Amounts in USD 000's 20.02.17 20.02.16
Not due 32,386 33,071
0-60 days 2,367 6,529
61-90 days 0 794
Above 90 days 1,843 3,519
Total 36,595 43,913
Financial Statements for the year to 20 February 2017

GARD MARINE & ENERGY INSURANCE (EUROPE) ASNotes to the accounts
Note 11 - Financial risk continued
Analysis of provision for bad debt
As at As at
Amounts in USD 000's 20.02.17 20.02.16
Balance as at the beginning of the period 0 0
Provision for receivables impairment 13 0
Receivables written off during the year as uncollectable (8) 0
Unused amounts reversed 8 0
Exchange adjustment 0 0
Balance as at the end of the period 13 0
The creation and release of provision for impaired receivables has been included in 'other insurance related expenses' in the income
statement. Amounts charged to the allowance account are generally written off, when there is no expectation of recovering additional cash.
Maturity profile
The following tables set out the maturity profile of liabilities combining amounts expected to be recovered within one year, between
one and five years and more than five years. Liabilities not covered by IFRS 7 are classified as other liabilities
in the table below.
The Company maintains highly marketable financial instruments and diverse assets that can be easily liquidated in the event of an unforeseen
interruption of cash flow. This, combined with the credit facility and cash pool to meet liquidity needs, gives a presentation of how assets and
liabilities have been matched.
As at
20.02.2017
Within 1 1-5 More than No maturity
Amounts in USD 000's year years 5 years date Total
Payables and accruals 25,040 0 0 0 25,040
Other payables 143 0 0 0 143
Financial Statements for the year to 20 February 2017

GARD MARINE & ENERGY INSURANCE (EUROPE) ASNotes to the accounts
Note 11 - Financial risk continued
Portfolio asset allocation
The table below sets out the portfolio allocation by exposure to asset classes and the balance sheet categories. Equities and investment
funds are divided among the asset classes in the interest of two important assumptions; Investment funds include mutual funds in asset
classes such as real estate, corporate bonds and absolute return. Equities include common stocks and an adjustment for a derivative
overlay programme. Equity market exposure is sold out through equity index future derivaties in order to maintain total equity market
exposure within the desired range, and simultaneously bond exposure is gained through buying interest rate swap contracts.
Fair value As at
Amounts in USD 000's 20.02.17 20.02.17
Financial investments EquityFixed income
Other
Equities and investment funds 1,876 1,876 0 0
Bonds 17,408 0 17,408 0
Other financial investments * 259 2 0 257
Total financial investments 19,542 1,877 17,408 257
Financial liabilities
Financial liabilities incl. in other payables 0 0 0 0
Total financial liabilities 0 0 0 0
Net financial investments 19,542 1,877 17,408 257
Net percent 100% 10% 89% 1%
Financial instruments - sensitivity analysis
The analysis below is performed for reasonably possible movements in key market variables with all other variables held constant.
As at As at
Amounts in USD 000's 20.02.17 20.02.16
Impact on fixed income portfolio investments given an increase of 50 basis points (167) (134)
Impact on equity portfolio given a 10 percent drop in quoted market prices (188) (151)
Impact on total investment portfolio given a change of 10 percent in foreign
exchange rates against USD (235) (256)
The sensitivity analysis assumes no correlation between equity price, property market and foreign currency rate risk. It also assumes that all
other receivables and payables remain unchanged and that no management action is taken. The Company has no significant risk
concentrations which are not in line with the overall investment guidelines set by the Company`s Board of Directors. Any impact from risk
tested in the table above is not, due to tax regulations, assumed to have any taxable impact.
The methods used above for deriving sensitivity information and significant variables have not changed from the previous period.
* Other includes cash and cash equivalents, accrued income/expense.
Financial Statements for the year to 20 February 2017

GARD MARINE & ENERGY INSURANCE (EUROPE) ASNotes to the accounts
Note 12 - Receivables from direct insurance operations
As at As at
Amounts in USD 000's 20.02.17 20.02.16
Direct and received premium 1,397 912
Direct and received premium through broker 18,792 27,570
Not closed premium 7,333 9,119
Claims related debtors, co-insurers 7,357 2,530
Provision for bad debts (13) 0
Receivables from direct insurance operations 34,866 40,132
Note 13 - Other receivables and other payables
As at As at
Amounts in USD 000's 20.02.17 20.02.16
Other receivables
Other receivables 9 9
Total other receivables 9 9
Other payables
Other payables 143 82
Financial liabilities incl. in other payables* 0 26
Total other payables 143 108
*Investment transactions in progress refers to sales and purchases of investments at the balance sheet date, where settlements are
executed after the balance sheet date.
Note 14 - Cash and cash equivalents
Cash and cash equivalents includes bank deposits and cash in hand, of which USD 21,789 as at 20.02.2017 is restricted cash.
(Restricted cash previous year; USD 20,744).
Financial Statements for the year to 20 February 2017
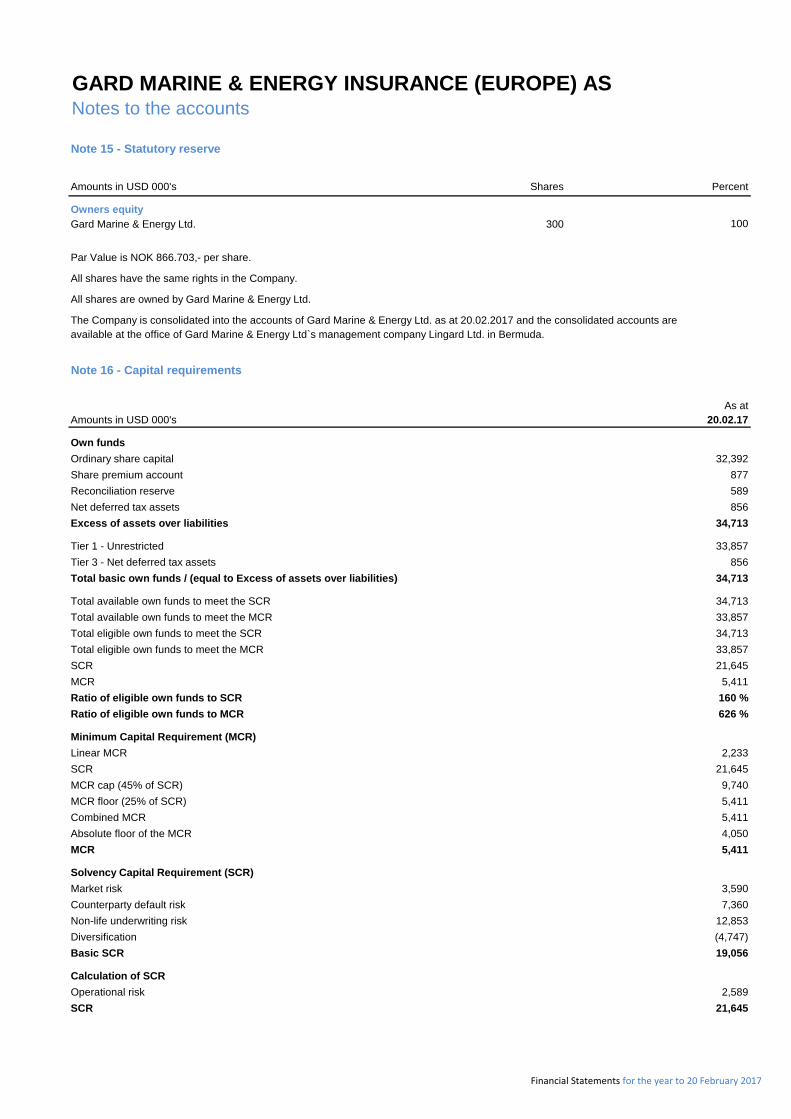
GARD MARINE & ENERGY INSURANCE (EUROPE) ASNotes to the accounts
Note 15 - Statutory reserve
Amounts in USD 000's Shares Percent
Owners equity
Gard Marine & Energy Ltd. 300 100
Par Value is NOK 866.703,- per share.
All shares have the same rights in the Company.
All shares are owned by Gard Marine & Energy Ltd.
The Company is consolidated into the accounts of Gard Marine & Energy Ltd. as at 20.02.2017 and the consolidated accounts are
available at the office of Gard Marine & Energy Ltd`s management company Lingard Ltd. in Bermuda.
Note 16 - Capital requirements
As at
Amounts in USD 000's 20.02.17
Own funds
Ordinary share capital 32,392
Share premium account 877
Reconciliation reserve 589
Net deferred tax assets 856
Excess of assets over liabilities 34,713
Tier 1 - Unrestricted 33,857
Tier 3 - Net deferred tax assets 856
Total basic own funds / (equal to Excess of assets over liabilities) 34,713
Total available own funds to meet the SCR 34,713
Total available own funds to meet the MCR 33,857
Total eligible own funds to meet the SCR 34,713
Total eligible own funds to meet the MCR 33,857
SCR 21,645
MCR 5,411
Ratio of eligible own funds to SCR 160 %
Ratio of eligible own funds to MCR 626 %
Minimum Capital Requirement (MCR)
Linear MCR 2,233
SCR 21,645
MCR cap (45% of SCR) 9,740
MCR floor (25% of SCR) 5,411
Combined MCR 5,411
Absolute floor of the MCR 4,050
MCR 5,411
Solvency Capital Requirement (SCR)
Market risk 3,590
Counterparty default risk 7,360
Non-life underwriting risk 12,853
Diversification (4,747)
Basic SCR 19,056
Calculation of SCR
Operational risk 2,589
SCR 21,645
Financial Statements for the year to 20 February 2017

GARD MARINE & ENERGY INSURANCE (EUROPE) ASNotes to the accounts
Note 17 - Change in accounting policy
As a result of a change in Norwegian accounting regulations for insurance companies the contingency reserve has been reclassified to other equity.
Related deferred tax asset has been recognized as applicable depending on tax jurisdiction. As a result, the Statement of comprehensive income
no longer includes the line item “change in contingency reserve".
Impact of change in accounting policy on balance sheet
As at As at
20.02.16 as Change in As at 20.02.15 as Change in As at
previously accounting 20.02.16 previously accounting 20.02.15
Amounts in USD 000's stated policy Restated stated policy Restated
Assets
Other assets
Deferred tax asset 0 820 820 303 205 508
Total other assets 0 820 820 303 205 508
Total assets 174,666 820 175,486 91,772 205 91,977
Equity and liabilities
Equity
Statutory reserve 33,268 0 33,268 13,833 0 13,833
Other equity 0 (310) (310) 0 4,048 4,048
Total equity 33,268 (310) 32,958 13,833 4,048 17,881
Contingency reserve
Contingency reserve (1,130) 1,130 0 3,843 (3,843) 0
Total contingency reserve (1,130) 1,130 0 3,843 (3,843) 0
Total liabilities 141,397 1,130 142,528 77,938 (3,843) 74,095
Total equity and liabilities 174,666 820 175,486 111,207 205 111,412
Impact of change in accounting policy on statement of comprehensive income
As at
20.02.16 as Change in As at
previously accounting 20.02.16
Amounts in USD 000's stated policy Restated
Technical result before change in contingency reserve (4,135) 0 (4,135)
Change in contingency reserve (4,973) 4,973 0
Technical result 838 (4,973) (4,135)
Profit before tax 948 0 (4,025)
Taxation 948 (616) 332
Net result 0 (4,357) (4,357)
Financial Statements for the year to 20 February 2017