Financial Statement Analysis of Mercantile Bank Limited
55
This assignment report is a partial fulfillment of course “Business Finance” ASSIGNMENT TOPIC
-
Upload
nisshpaap-shoytaan -
Category
Documents
-
view
47 -
download
7
description
This study has been focused on financialstatement analysis of Mercantile Bank Limited.The objective of the study is to evaluate the financial performance of Mercantile BankLimited. Mainly secondary data have been used to gather information which is necessary toprepare this study. The performance of MBL during last five years (2008-2012) hasprovided that with strong desire and will power is achieving whatever target he may have.Last year the bank has increased the total operating profit. Liquidity position of the bank issatisfactory. The Bank focused in all key areas like capital adequacy, quality asset growthand strong liquidity thereby ensuring sound revenue.Finally, at the time of the study we found that current ratio and net working capital of MBLis increasing year by year. On the other hand the liabilities and borrowing are increasingduring last couple of years leading decreased the total revenue. MBL should be moreefficient using its assets to generate its operating income. It needs to improve its assetquality position by utilizing assets in right way. Cash and bank balance to total deposit isnot good because higher liquidity means the greater amount of idle money, which cannotgenerate the revenue.
Transcript of Financial Statement Analysis of Mercantile Bank Limited
This assignment report is a partial fulfillment of course “Business Finance”
ASSIGNMENT TOPIC

Submitted By,
Tanvir Mohammad Hayder Arif MSc. International Business Management (UK), MBA in Finance (CU, BD)
Associate Professor, Department of Finance and Banking
University of Chittagong
Academic Advisor, Cox’s Bazar International University
ALPHA Group
Bachelor of Business Administration
2ND
Batch
Cox’s Bazar International University
Date of Submission 27th
June, 2015
Submitted To,

Group Profile
Name ID
MD. Rifat Zahir 2014201004
Wasif Kabir 2014201018
Wahedul Islam Oahid 2014205003
MD. Tahmidullah 2014101028
MD. Imtiaj Ahmed

27th June, 2015 Tanvir Mohammad Hayder Arif Associate Professor, Department of Finance and Banking, University of Chittagong Academic Advisor, Cox’s Bazar International University
Subject: To submit an assignment report on “Financial Statement Analysis of
Mercantile Bank Limited (MBL)”. Dear Sir, This is to inform you that we have completed our report on “Financial Statement Analysis of Mercantile Bank Limited (MBL)”. This report was assigned to us as a partial requirement of the “Business Finance” course in second semester. Here we tried our best to give an overview of Mercantile Bank Limited and analyzed financial statements of 5 years. We realize that certain information enclosed in this Project Paper is not imaginary but real and should attach academic interest. We have tried sincerely to comprehend and translate our knowledge in writing this report. We enjoyed this project work and gladly attend any of your calls to clarify points, if necessary. In preparing this report we have followed the instructions of yours. We will be glad to clarify any discrepancy that may arise. Thank you for your cooperation. Sincerely, ALPHA GROUP BBA 2ND Batch Faculty of Business Administration Cox’s Bazar International University
MD. Rifat Zahir (Group Leader of ALPHA)

At the beginning we would like to convey our sincere appreciation to the almighty Allah for
giving us the strength & the ability to finish the task within the planned time. This assignment
report is an accumulation of many people’s endeavor. So we would like to expressly sincere
gratitude to everyone who contributed towards preparing & making this successfully.
First of all, we would like to express my Sincere & Immense gratitude to our course teacher
Mr. Tanvir Mohammad Hayder Arif, Associate Professor, Department of Finance and
Banking, University of Chittagong and also Academic Advisor of Cox’s Bazar International
University. Then we would like to thank Miss Kazi Noor-E- Jannat ma’am for her intensive
support and care. We are deeply indebted to her for whole hearted supervision to me during
the study period. Her valuable suggestion & guideline helped us a lot to prepare the report in
a well-organized manner.
ALPHA Group
BBA 2ND Batch
Faculty of Business Administration
Cox’s Bazar International University
We have completed our assignment report. This study has been focused on financial statement analysis of Mercantile Bank Limited. The objective of the study is to evaluate the financial performance of Mercantile Bank Limited. Mainly secondary data have been used to gather information which is necessary to prepare this study. The performance of MBL during last five years (2008-2012) has provided that with strong desire and will power is achieving whatever target he may have. Last year the bank has increased the total operating profit. Liquidity position of the bank is satisfactory. The Bank focused in all key areas like capital adequacy, quality asset growth and strong liquidity thereby ensuring sound revenue. Finally, at the time of the study we found that current ratio and net working capital of MBL is increasing year by year. On the other hand the liabilities and borrowing are increasing during last couple of years leading decreased the total revenue. MBL should be more efficient using its assets to generate its operating income. It needs to improve its asset quality position by utilizing assets in right way. Cash and bank balance to total deposit is not good because higher liquidity means the greater amount of idle money, which cannot generate the revenue.
I

NAME Page no
EXECUTIVE SUMMARY I
CHAPTER - 01
1.1 Introduction 1
1.2 Rationale of studies 2
1.3 Objective of the report 2
1.4 Scope 2
1.5 Methodology 2
1.6 Limitations 3
CHAPTER - 02
2.1 Financial Performance Analysis 4
2.2 Balance Sheet 4
2.3 Income Statement 4
2.4 Common Size Analysis of Financial Statement 4
2.5 Ratio analysis 5
2.6 Groups of Financial Ratios 5
2.7 Liquidity Ratio 5
2.8 Activity Ratio 6
2.9 Debt Ratio 7
2.10 Activity Ratio 7
CHAPTER - 03
3.1 Historical Background of MBL 10
3.2 Vision 10
3.3 Mission 10
3.4 Objectives of MBL 10
3.5 Goals of MBL 11
3.6 Management Structure of MBL 11
3.7 Organizational Hierarchy of MBL 11
3.8 Divisions of MBL 12
3.9 Products & Services of MBL 13
CHAPTER - 04 4.1 THEORETICAL FRAME WORK OF THE STUDY
(HOW PERFORMANCES OF BANK ARE EVALUATED) 14
CHAPTER - 05
5.1 Financial Highlights 15
5.2 Common Size Analysis 15
5.3 Ratio Analysis 16
CHAPTER - 06
6.1 Findings 25
6.2 Recommendations 25
6.3 Conclusion 25
Bibliography 27
Appendix 28

Financial Statement Analysis “A Study on financial performance of Mercantile Bank Limited”
1
CHAPTER – 1
INTRODUCTION
1.1 Introduction
The Jews in Jerusalem introduced a kind of banking in the form of money lending before the
birth of Christ. The word „bank‟ was probably derived from the word „bench‟ as during ancient
time Jews used to do money -lending business sitting on long benches.
First modern banking was introduced in 1668 in Stockholm as „Savings Piss Bank‟, which
opened up a new era of banking activities throughout the European Mainland.
In the South Asian region, early banking system was introduced by the Afghan traders popularly
known as Kabuliwalas. Muslim businessmen from Kabul, Afghanistan came to India and started
money-lending business in exchange of interest sometime in 1312 A.D. They were known as
„Kabuliawalas‟.
The financial system of Bangladesh consists of Bangladesh Bank (BB) as the central bank, 4
nationalized commercial banks (NCB), and 5 government owned specialized banks, 30 domestic
private banks, 10 foreign banks and 28 non-bank financial institutions. The financial system also
embraces insurance companies, stock exchanges and co-operative banks .The structure of the
banking system has changed substantially over the last few years. NCBs‟ role has gone down.
Their share in total assets went down from 54 percent in 1998 to 40 percent in 2006. On the other
hand, PCBs‟ share went up from 27 percent in 1998 to 43 percent in 2006. The change reflects
adoption and implementation of new policies for the banking sector
Banks are become more important to the economy as a whole and to local communities.
Certainly, banks can be identified by the functions they perform in the economy. Bank is a
financial intermediary accepting deposits and granting loans offers the widest menu of services
of any financial institution. Banks are the most important financial institution in the economy.
They are the principal sources of credit (loan able funds) for millions of individuals and families
for many units of the government.
Banks are also closely watched because of their power to create money in the form of easily
spend able deposits by making loans and investment. Changing in the volume of money created
by banks appears to be closely correlated with economic conditions, especially the growth of
jobs and the presence of absence of inflation. The fact that banks creates money, which impacts
Financial Statement Analysis “A Study on financial performance of Mercantile Bank Limited”
2
the vitality of the economy. Bank provides individuals and business with loans that support
consumption and Servicing.
Banking sector is expanding its hand in different events every day. At the same time the banking
process is becoming faster, easier, and the banking area becoming wider. As the demand for
better service increases day by day, they are coming with different innovative ideas and products.
In order to survive in the competitive field of the banking sector, all banking organization are
looking for better service opportunity to provide their fellow clients. As a result, it has become
essential for every person to have some idea on the bank and banking procedure.
1.2 - Rationale of the study
The report is assigned by our Course teacher Tanvir M. H. Arif sir as a part of our “Business
Finance” course. The topic of the report is “Financial Statement Analysis of Mercantile Bank
Limited (MBL)”. By conducting this study we can enhance our knowledge and skill to apply
various research methods in professional life or higher educational life. This assignment report
helped us to make a bridge between the gap of classroom learning and practical learning.
1.3 Objectives of the report
Primary objective:
To evaluate the financial performance of Mercantile Bank Limited. To enhance and utilize our
knowledge and skill to analyze the financial statement of a bank.
Secondary objectives:
The report has the following objectives
► To familiar with the banking activities.
► To analyze the financial position and performance of the Mercantile Bank Ltd.
► To focus on products, services and financial condition of MBL.
► To expose strengths and weakness of MBL in comparison with competitors.
1.4 Scope
Mercantile Bank Ltd is one of the leading banks in Bangladesh. The scope of the study is
limited. The assignment Report covers the organizational structure, background, functions,
financial position and performance of the bank. The scope of the study is just to acquaint with
the operational scenario of Mercantile Bank Limited.
1.5 Methodology

Financial Statement Analysis “A Study on financial performance of Mercantile Bank Limited”
3
This study is based on secondary data. Secondary data collected by the following ways-
► Annual Report of Mercantile Bank Limited 2008-2012.
► Different text book and journals.
► Accounts Department guidelines.
► Various reports and articles related to study.
► The websites of Mercantile Bank Limited.
► Different related booklets and company files and documents.
► Official website of Company
Sources of Data
Here the secondary sources of information were used. The secondary sources are:
► Annual Reports of Mercantile Bank Ltd.
► Bank records.
► Journals of the Bank.
► Official Website of the Bank.
► Different financial statements.
► Periodicals published by Bangladesh bank.
1.6 Limitations
The present study was not out of limitations. But it was a great opportunity for me to know the
banking activities of Bangladesh specially Mercantile Bank. Some constraints are as follows:
► The main constraints of the dissertation are inadequate access to information, which has
hampered the scope of analysis required for the dissertation.
► Every organization has their own secrecy that is not revealed to others. While collecting
data they did not disclose much information for the sake of organizational confidentiality.
► The bank personnel and officials were very busy with their occupational activities. Hence
it was little bit difficult for them to help within their high schedule.
► Due to time limitations many of the aspects could not be discussed in the dissertation.
► Lack of current information.
► Because of time shortage many related area cannot be focused in depth.
► Recent data and information on different activities was unavailable.
► We were short in hands.
► We have limited funds to travel the places physically.
► Lack of the part of experience of the researchers.
► Unconfirmed accuracy of certain information acquired.
► Lack of information from the primary source.
► The comparisons may not be effective enough.

Financial Statement Analysis “A Study on financial performance of Mercantile Bank Limited”
4
CHAPTER – 2
THEORITICAL ASPECTS
2.1 Financial performance analysis
Financial performance analysis of a company is very important to get an overall view about an
organization. It generally consists of interpretation of balance sheet and interpretation of income
statement. By using these two sources one can perform the ratio analysis and trend analysis
which are the major tools for analyzing the financial performance of a bank.
(Lawrence J. Gitman, Principle of managerial Finance 10th
edition)
2.2 Balance sheet
In financial accounting, a balance sheet or statement of financial position is a summary of the
financial balances of a sole proprietorship, a business partnership or a company. Assets,
liabilities and ownership equity are listed as of a specific date, such as the end of its financial
year. A balance sheet is often described as a “snapshot of a company‟s financial condition”. Of
the four basic financial statements, the balance sheet is the only statement which applies to a
single point in time of a business‟ calendar year. A standard company balance sheet has three
parts: assets, liabilities and ownership equity. (www.google.com)
2.3 Income statement
Income statement also referred as profit and loss statement, earnings statement, operating
statement or statement of operations is a company‟s financial statement that indicates how the
revenue is transformed into the net income. It displays the revenues recognized for a specific
period, and the cost and expenses charged against these revenues, including write-offs (e.g.,
depreciation and amortization of various assets) and taxes. The purpose of the income statement
is to show managers and investors whether the company made or lost money during the period
being reported. (www.google.com & yahoo.com)
2.4 Common-Size Analysis of Financial Statements
A common-size financial statement is simply one that is created to display line items on a
statement as a percentage of one selected or common figure. Creating common-size financial
statements makes it easier to analyze a company over time and compare it with peers. Using
common-size financial statements helps investors spot trends that a raw financial statement may
not uncover.
All three of the primary financial statements can be put into a common-size format. Financial
statements in dollar amounts can easily be converted to common-size statements using a
spreadsheet, or they can be obtained from online resources like Mergent Online. Below is an

Financial Statement Analysis “A Study on financial performance of Mercantile Bank Limited”
5
overview of each and a more detailed summary of the benefits, as well as drawbacks, that such
an analysis can provide investors. (www.investopedia.com)
Balance Sheet Analysis
The common figure for a common-size balance sheet analysis is total assets. Based on the
accounting equation, this also equals total liabilities and shareholders‟ equity, making either term
interchangeable in the analysis. It is also possible to use total liabilities when focusing on
liabilities to indicate where a company‟s obligations lie and whether it is being conservative or
risky in managing its debts. (www.investopedia.com)
Analyzing the Income Statement
The common figure for an income statement is total top-line sales. This is actually the same
analysis as calculating a company's margins. For instance, a net profit margin is simply net
income divided by sales, which also happens to be a common-size analysis. The same goes
for calculating gross and operating margins. The common-size method is appealing for research-
intensive companies, for example, because they tend to focus on research and development
(R&D) and what it represents as a percent of total sales. (www.investopedia.com)
2.5 Ratio Analysis
Ratio is a method of interpreting the financial statement of a company. The purpose of ratio
analysis is identifying the risk of business firm and the financial statement of a business firm,
performance evaluation, compare income analysis.
(Lawrence J. Gitman, Principle of managerial Finance 10th
edition)
2.6 Groups of Financial Ratios
Financial ratios can be divided into four basic groups or categories:
► Liquidity ratios
► Activity ratios
► Debt ratios &
► Profitability ratios Liquidity, activity, and debt ratios primarily measure risk, profitability ratios measure return. In
the near term, the important categories are liquidity, activity, and profitability, because these
provide the information that is critical to the short-run operation of the firm. Debt ratios are
useful primarily when the analyst is sure that the firm will successfully weather the short run.
2.7 Liquidity Ratio
The liquidity of a business firm is measured by its ability to satisfy its short term obligations as
they come due. Liquidity refers to the solvency of the firm‟s overall financial position. The three
basic measures of liquidity are- (Stephen A. Ross, Randolph W.Westerfield, Jeffrey Jaffe (2005-06) corporate finance 7
th edition)
A. Current Ratio:
Financial Statement Analysis “A Study on financial performance of Mercantile Bank Limited”
6
One of the most general and frequently used of these liquidity ratios is the current ratio.
Organizations use current ratio to measure the firm‟s ability to meet short-term obligations. It
shows the banks‟ ability to cover its current liabilities with its current assets.
Current Ratio =
(Lawrence J. Gitman, Principle of managerial Finance 10
th edition)
B. Quick Ratio: The quick ratio is a much more exacting measure than current ratio. This ratio shows a firm‟s
ability to meet current liabilities with its most liquid assets.
Quick Ratio =
(Lawrence J. Gitman, Principle of managerial Finance 10
th edition)
C. Net Working Capital: Net Working Capital, although not actually a ratio is a common measure of a firm‟s overall
liquidity. A measure of liquidity is calculated by subtracting total current liabilities from total
current assets.
Net Working Capital =
(Stephen A. Ross, Randolph W.Westerfield, Jeffrey Jaffe (2005-06) corporate finance 7
th edition)
2.8 Activity Ratio
Activity ratios measure the speed with which accounts are converted into sale or cash. With
regard to current accounts measures of liquidity are generally inadequate because differences in
the composition of a firm‟s current accounts can significantly affects its true liquidity. A number
of ratios are available for measuring the activity of the important current accounts which includes inventory, accounts receivable, and account payable. The activity (efficiency of utilization) of
total assets can also be assessed. (www.google.com & yahoo.com)
A. Total Asset Turnover: The total asset turnover indicates the efficiency with which the firm is able to use all its assets to
generate sales.
Total Asset Turnover =
(Lawrence J. Gitman, Principle of managerial Finance 10
th edition)
B. Investment to Deposit Ratio:

Financial Statement Analysis “A Study on financial performance of Mercantile Bank Limited”
7
Investment to Deposit Ratio shows the operating efficiency of a particular Bank in promoting its
investment product by measuring the percentage of the total deposit disbursed by the Bank as
long & advance or as investment. The ratio is calculated as follows:
Investment to Deposit Ratio =
(Lawrence J. Gitman, Principle of managerial Finance 10
th edition)
2.9 Debt Ratio
The debt position of that indicates the amount of other people‟s money being used in attempting
to generate profits. In general, the more debt a firm uses in relation to its total assets, the greater
its financial leverage, a term use to describe the magnification of risk and return introduced
through the use of fixed-cost financing such as debt and preferred stock.
A. Debt Ratio:
The debt ratio measures the proportion of total assets provided by the firm‟s creditors.
Debt Ratio =
(Stephen A. Ross, Randolph W.Westerfield, Jeffrey Jaffe (2005-06) corporate finance 7
th edition)
B. Equity Capital Ratio: The ratio shows the position of the Bank‟s owner‟s equity by measuring the portion of total asset
financed by the shareholders invested funds and it is calculated as follows:
Equity Capital Ratio =
(Stephen A. Ross, Randolph W.Westerfield, Jeffrey Jaffe (2005-06) corporate finance 7
th edition)
C. Time Interest Earned Ratio:
This ratio measures the ability to meet contractual interest payment that means how much the
company able to pay interest from their income.
Time Interest Earned Ratio =
(Stephen A. Ross, Randolph W.Westerfield, Jeffrey Jaffe (2005-06) corporate finance 7
th edition)
2.10 Activity Ratio
These measures evaluate the bank‟s earnings with respect to a given level of sales, a certain level
of assets, the owner‟s investment, or share value. Without profits, a firm could not attract outside
capital. Moreover, present owners and creditors would become concerned about the company‟s

Financial Statement Analysis “A Study on financial performance of Mercantile Bank Limited”
8
future and attempt to recover their funds. Owners, creditors, and Management pay close attention
to boosting profits due to the great importance placed on earnings in the marketplace.
A. Operating Profit Margin:
The Operating Profit Margin represents what are often called the pure profits earned on each
sales dollar. A high operating profit margin is preferred. The operating profit margin is
calculated as follows:
Operating Profit Margin =
(Lawrence J. Gitman, Principle of managerial Finance 10
th edition)
B.Net profit Margin:
The net profit margin measures the percentage of each sales dollar remaining after all expenses,
including taxes, have deducted. The higher the net profit margin is better. The net profit margin
is calculated as follows:
Net profit Margin =
(Lawrence J. Gitman, Principle of managerial Finance 10
th edition)
C. Return on Equity (ROE):
The Return on Equity (ROE) measures the return earned on the owners (both preferred and
common stockholders) investment. Generally, the higher this return, the better off the owners.
Return on Equity (ROE) =
(Lawrence J. Gitman, Principle of managerial Finance 10
th edition)
D. Price/ Earnings ratio (PE ratio):
The Price/ Earnings ratio (price-to-earnings ratio) of a stock is a measure of the price paid for a
share relative to the income or profit earned by the firm per share.
P/E ratio =
(Lawrence J. Gitman, Principle of managerial Finance 10
th edition)
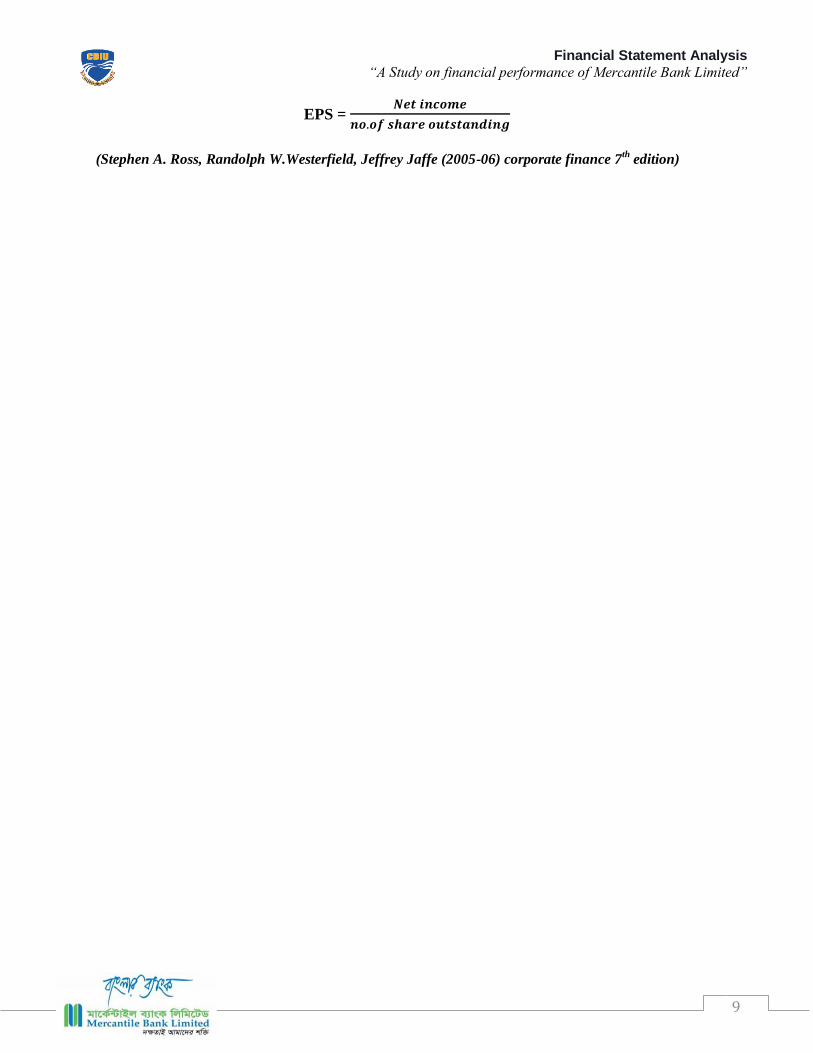
E. Earnings per share (EPS):
EPS represents the dollar amount earned behalf of each outstanding share of common stock.
Financial Statement Analysis “A Study on financial performance of Mercantile Bank Limited”
9
EPS =
(Stephen A. Ross, Randolph W.Westerfield, Jeffrey Jaffe (2005-06) corporate finance 7
th edition)

Financial Statement Analysis “A Study on financial performance of Mercantile Bank Limited”
10
CHAPTER – 3
Mercantile Bank Limited
3.1 HISTORICAL BACKGROUND OF MBL
Mercantile Bank Limited is adjudged as one of the leading bangs in Bangladesh. The bank is a
blend of development and commercial bank. It has been established to promote banking
activities in the country.
Mercantile bank ltd was incorporated on May 20, 1999 and it started its operation on June 02,
1999. It was established as banking company under the companies Act 1913. The bank
is governed by the bank companies Act 1991.According to CAMEL rating, the was given the
top ranking after applying all the ten creation that are required to judge a bank‟s overall
performance, informed banking sources said.
The Authorized Capital of the Bank is Tk. 1200 million and the Paid -up Capital is Tk. 799.41
million. Total employee more than 16,000 at the end of November 2012.
The first branch of MBL was opened at Dilkusha commercial area in Dhaka on the inauguration
day of the bank. At the end of 2011, the number branches of the bank stood at 80, including 5
SME / krishi branches, of which 57 branches are located at major trade centers of the country
and other 23 branches are at rural areas of country.
The Bank provides a broad range of financial services to its customers and corporate clients. The
Board of Directors consists of eminent personalities from the realm of commerce and industries
of the country.
The Bank is manned and managed by qualified and efficient professionals. The former Governor
of the Central Bank of Bangladesh was the Chief Advisor of the Bank. He brings with him a
wealth of experience of managing both public and private sector banks.
3.2 Vision of the bank
Would make finest corporate citizen
3.3 Mission of the bank
Will become most caring, focused for equitable growth based on diversified deployment of
resources, and nevertheless would remain healthy and gainfully profitable Bank.
3.4 Objectives of MBL
Strategic Objective
► To achieve positive Economic Value Added (EVA)each year.
► To become market leader in product innovation.

Financial Statement Analysis “A Study on financial performance of Mercantile Bank Limited”
11
► To be one of the top three Financial Institutions in Bangladesh in terms of cost efficiency.
► To be one of the top five Financial Institutions in terms of market share in all significant
market segments serve.
Financial objectives
To achieve 20% return on shareholders‟ equity or more, on average.
3.5 Goals of MBL
The main goal of Mercantile Bank Limited is to become a leading private bank of the
3rd
generation by providing better service to the clients along with other quality operations in the
banking sector.
3.6 Management structure of MBL
The Chairman is the head of the Board of Directors. There is one Managing Director who is also
the President mainly controls and supervises the major divisions of the bank. He directly
supervises the branch “Control and Inspection Division”. One Deputy managing director reports
to him. Four Executive Vice President (EVP) and one Senior Executive Vice President (SEVP)
report to the Deputy Managing Director. Executive Vice President controls the credit, loan
administration, international division, information technology and financial control and accounts
division. Senior Executive Vice Presidents work under Executive Vice Presidents.
The organizational structure of MBL is quite horizontal where each person reports to only one
person, which refers to a very good working environment.
Head Office of MBL
61,Dilkusha Commercial Area Dhaka-1000,Bangladesh
PABX: 9559333, 9553892, 9561140, Fax: 88-02-9561213
Swift: MBLBBDDH, E-mail : [email protected]
Zonal Office of MBL
Mishkat Arcade (Level-1) 21/1, Agrabad C/A, chittagong
Phone: 031-2529445, 716421, 723181, 721772 FAX: 031-716459
Training Institute of MBL
Swadesh Tower, Level – 6, 41/6,Purana Paltan Lane, Dhaka – 1000, Phone: 7174016, 7172282,
Fax: 9571096
3.7 ORGANIZATIONAL HIERACHY OF MBL

Financial Statement Analysis “A Study on financial performance of Mercantile Bank Limited”
12
GSD General Service Division
CAD Central account Division
A&I Audit and Inspect
CB Central Bank
D&M Developing & Marketing
R&D Research and Planning
ID International Division
3.8 Divisions of MBL
► Board Audit Division
► Board Division
► General Banking Division
► Law & Recovery Division
► General Services Division
► Marketing & Branches Division
► Card & Mobile Banking Division
► Human Resources Division
► NRB Division
► Credit Risk Management Division
► Treasury (Front Office) Division
► Internal Control & Compliance Division
► Research & Planning Division
► Credit Administration Division
► International Division
► SME & Retail Banking Division
► Credit Risk Management Division
► IT Division
► Treasury (Back Office) Division
► Financial Administration Division
► Risk Management Division.

Financial Statement Analysis “A Study on financial performance of Mercantile Bank Limited”
13
3.9 PRODUCT AND SERVICES OF MBL
Based on the customer satisfaction, MBL provides many products to its clients and customers.
For this reason, MBL made significant progress in all areas of its operation, such as deposit
mobilization, credit management, remittance handling, foreign exchange and foreign trade.
MBL offers different products and services to its customers. These are follows-
► Saving Scheme.
► Family Maintenance Scheme.
► Double Benefit Deposit Scheme.
► Monthl Customer‟s Credit Scheme.
► Small Loan Scheme.
► Lease Finance.
► Doctor‟s Credit Scheme
► Personal Loan Scheme.
► Home Loan Scheme.
► Car Loan Scheme
► Overseas employment loan scheme.
► Rural Development Scheme.
► SME Financing Scheme.
► Woman Int: Develop

Financial Statement Analysis “A Study on financial performance of Mercantile Bank Limited”
14
CHAPTER – 4
THEORETICAL FRAME WORK OF THE STUDY (HOW PERFORMANCES OF BANK ARE EVALUATED)
Bank performance evaluation is traditionally based on the analysis of financial ratios.
However, regardless of how many ratios are being used, a model that would fully satisfy the
analysis of needs and bank operations‟ efficiency evaluation has not been developed yet. For this
reason, the financial ratio analysis is complemented with different quality evaluations, with
features such as management quality, equity structure, competitive position and others to be
included into the final evaluation.
There are various motives to support the efforts of searching for the best method of bank
performance evaluation. Managing the financial system of a country requires the kind of
methods which enable the financial institutions to recognize the management problems on time
so that steps for the protection of citizens and the whole system can be undertaken, since the
level of problems resulting from poor bank management threaten the whole financial system of
the country. From an individual bank‟s point of view, the interest of the bank for its efficient
operation finds it important to be able to compare with the competitive banks and identify
the causes of its efficiency. Bank performance evaluation is of great importance for individuals,
due to their need to protect against banking with a risk-running bank or due to the speculative
motives linked to the activities on the capital market.
Mercantile Bank Ltd. is committed to provide high quality services to its constituents through
different financial products and profitable utilization of fund and contribute to the growth of
GDP of the country by financing trade and commerce, helping industrialization, boosting export,
creating employment opportunities for the educated youth and encouraging micro-credit leading
to poverty alleviation and improving the quality of life of the people and thereby contributing to
the overall socio-economic development of the country.
With a view to achieving the aforesaid objectives of the bank, Credit operation is of paramount
importance as the greatest share of the total revenue of the bank is generated from it. The success
of a bank, therefore, depends on how efficiently and judiciously it makes use of its available
resources. In other words, prudent and efficient management of its credit portfolio is very
essential for the success of a bank.
The Credit Policy of any banking institution is a combination of certain accepted, time tested
standards and other dynamic factors dictated by the realities of changing situations in different
market places.
The accepted standards relate to safety, liquidity and profitability of the advance whereas the
dynamic factors relates to aspects such as the nature and extent of risk, interest or margin, credit
spread and credit dispersal. In all business dealings, officers and employees must be guided by
the principles of honesty, integrity and safe-guard the interest of the depositors and shareholders
of the bank. They should strictly adhere to the Banking Laws, Rules and Regulations of the
Govt. of Bangladesh / the instructions and guidelines issued by the Bangladesh Bank / Head
Office from time to time which affect the business practices of the Bank. However, the key to
safe, liquid, healthy and profitable credit operations lies in the quality of judgment used by the
Executive‟s / Officers making lending decisions and their knowledge of the borrower and the
market place.

Financial Statement Analysis “A Study on financial performance of Mercantile Bank Limited”
15
CHAPTER – 5
FINANCIAL STATEMENT ANALYSIS OF MBL
5.1 Financial Highlights
years
Particulars 2008
Tk in million 2009
Tk in million 2010
Tk in million 2011
Tk in million 2012
Tk in million
Paid up capital 1199.12 1498.90 1798.08 2158.42 4072.21
Total Loans &
Advances 26842.14 31877.86 43419.36 48295.55 66377.70
Price earnings
ratio 9 times 12 times 10 times 11 times 14 time
Earnings per
share 41.22 30.05 28.53 30.67 41.04
Income from
investment 369.12 764.48 520.33 696.66 919.45
Total asset 37159.65 44940.54 55928.72 66166.52 87140.11
Total deposit 33317.64 39348.00 49538.35 58033.47 75629.14
5.2 Common Size Analysis
Mercantile Bank Limited Common-Size Balance Sheet Analysis 2008-2012
Common Size Asset
Title 2008 2009 Change 2010 Change 2011 Change 2012 Change
Current Assets Cash 7.82% 7.24% – 0.58% 5.59% – 1.65% 5.96% 0.37% 6.51% 0.55%
Balance with
other bank and
financial
institution.
0.59% 1.54% 95% 1.04% – 50% 5.52% 4.48% 5.13% – 0.39%
Money at call
and short
notice
investment.
11.20% 14.61% 3.41% 12.55% – 2.06% 21.15% 8.60% 21.24% 0.09%
Loans and
Advances 77.63% 73.75% – 3.88% 76.18% 2.43% 66.64% – 9.54% 60.34% – 6.30%
Fixed Assets 1.22% 1.56% 0.34% 1.90% 0.30% 2.33% 0.43% 2.87% 0.55%
Other Assets 1.53% 2.06% 0.53% 2.74% 0.68% 1.38% – 1.36% 3.67% 2.29%

Financial Statement Analysis “A Study on financial performance of Mercantile Bank Limited”
16
Mercantile Bank Limited Common-Size Balance Sheet Analysis 2008-2012
Common Size Share Holders Equity
Title 2008 2009 Change 2010 Change 2011 Change 2012 Change
Share Holder
equity 6.20% 6.49% 29% 8.25% + 1.76% 8.29% 0.04% 8.56% 0.27%
5.3 Ratio and Trend Analysis
Current ratio:
Current Ratio =
Year 2008 2009 2010 2011 2012
Current Ratio 1.00 1.01 1.02 1.04 1.05
Graphical Presentation:
Interpretation:
The graph shows an upward trend in MBL‟s current ratio. This indicates that MBL‟s has
increased its liquidity position and thereby it has reduced the change of being technically
insolvent.
Net Working capital:
Net Working Capital = Current Asset-Current Liabilities
1
1.01
1.02
1.04
1.05
0.97
0.98
0.99
1
1.01
1.02
1.03
1.04
1.05
1.06
2008 2009 2010 2011 2012
Current Ratio
Current Ratio

Financial Statement Analysis “A Study on financial performance of Mercantile Bank Limited”
17
Tk (Million)
Year 2008 2009 2010 2011 2012
Net Working Capital Tk.822.34 Tk.1056.25 T.k1471.08 T.k2150.14 Tk.2447.97
Graphical Presentation:
Interpretation:
Net working capital measures the liquidity position of the firm. In 2008 the net working capital
was Tk 822.34 million which was gradually increased to tk 2447.97 million in 2012. The graph
shows that increase trend of MBLs liquidity position this indicates that MBL has increased its
ability to pay short term obligation out of its currents assets.
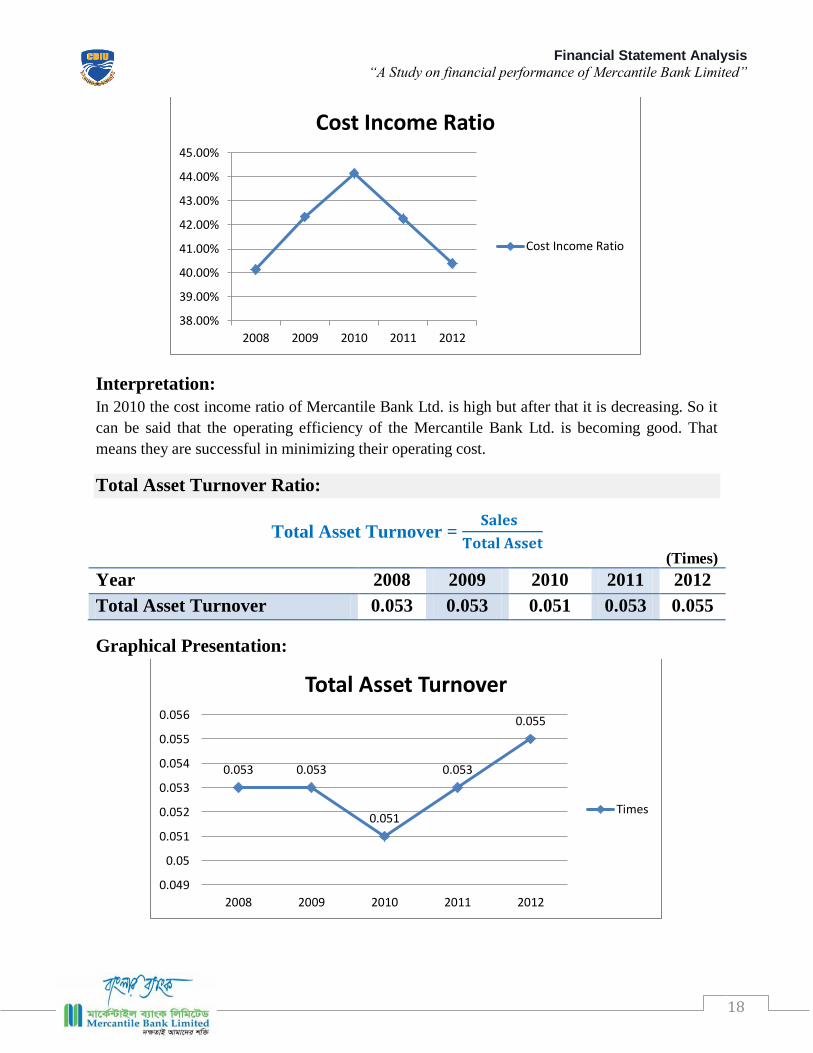
Cost Income Ratio:
It measures a particular Bank‟s operating efficiency by measuring the percent of the total
operating income that the Bank spends to operate its daily activities. It is calculated as follows:
Cost Income Ratio =
2008 2009 2010 2011 2012
Cost Income Ratios 40.13% 42.33% 44.15% 42.25% 40.38%
Graphical Presentation:
822.34 1056.25
1471.08
2150.14
2447.97
0
500
1000
1500
2000
2500
3000
2008 2009 2010 2011 2012
TK
in M
illi
on
Net Working Capital
Net Working Capital
Financial Statement Analysis “A Study on financial performance of Mercantile Bank Limited”
18
Interpretation:
In 2010 the cost income ratio of Mercantile Bank Ltd. is high but after that it is decreasing. So it
can be said that the operating efficiency of the Mercantile Bank Ltd. is becoming good. That
means they are successful in minimizing their operating cost.
Total Asset Turnover Ratio:
Total Asset Turnover =
(Times)
Year 2008 2009 2010 2011 2012
Total Asset Turnover 0.053 0.053 0.051 0.053 0.055
Graphical Presentation:
38.00%
39.00%
40.00%
41.00%
42.00%
43.00%
44.00%
45.00%
2008 2009 2010 2011 2012
Cost Income Ratio
Cost Income Ratio
0.053 0.053
0.051
0.053
0.055
0.049
0.05
0.051
0.052
0.053
0.054
0.055
0.056
2008 2009 2010 2011 2012
Total Asset Turnover
Times

Financial Statement Analysis “A Study on financial performance of Mercantile Bank Limited”
19
Interpretation:
We know that this ratio measures the efficiency of the bank in using its total assets to generate
operating income and the higher the ratio, the higher the efficiency of the bank is in using its
assets. The graph shows an upward trend in total asset tarn over except in 2010. Its total asset
turnover is lowest in 2010, but it is highest in 2012. This indicates that MBL is becoming more
efficient in using its assets to generate operating income.
Investment to Deposit ratio:
Investment to Deposit Ratio =
Year 2008 2009 2010 2011 2012
Investment to Deposit Ratio .21 .19 .15 .25 .15
Graphical Presentation:
Interpretation:
In 2011 the unexpected investment was made by the Bank, the 25% of total deposit are in the
form of investment. But this ratio drastically falls from 25% to 15% which is not good sign for
the company.
Net Profit Margin:
Net Profit Margin =
2008 2009 2010 2011 2012
Net Profit Margin 0.21 0.23 0.22 0.23 0.30
0.21 0.19
0.15
0.25
0.15
0
0.05
0.1
0.15
0.2
0.25
0.3
2008 2009 2010 2011 2012
Investment to Deposit Ratio
Investment to DepositRatio

Financial Statement Analysis “A Study on financial performance of Mercantile Bank Limited”
20
Graphical Presentation:
Interpretation:
We know that this ratio shows the portion of total operating income that remains after deducting
all the costs and expenditure for particular period of time. From the graph I have seen that the net
profit margin is raising position in 2008 to 2012 except 2010. Their profit margin is in strong
position.
Return on Asset (ROA):
Return on Asset (ROA ) =
2008 2009 2010 2011 2012
Return On Asset 1.33% 1.20% 1.10% 1.22% 1.64%
Graphical Presentation:
0.21 0.23 0.22 0.23
0.3
0
0.05
0.1
0.15
0.2
0.25
0.3
0.35
2008 2009 2010 2011 2012
Net Profit Margin
Net Profit Margin
1.33% 1.20%
1.10% 1.22%
1.64%
0.00%
0.20%
0.40%
0.60%
0.80%
1.00%
1.20%
1.40%
1.60%
1.80%
2008 2009 2010 2011 2012
Return on Asset
Return on Asset

Financial Statement Analysis “A Study on financial performance of Mercantile Bank Limited”
21
Interpretation:
Return on assets is an indicator of how profitable a company is. This ratio is used annually to
compare the business performance to its norms. The banks return on asset was increasing from
1.33 to 1.64 in the preceding 5 years. It can be said that MBL‟s earning capacity is increasing
year by year. This is good sign for the Bank.
Return on Equity (ROE):
Return on Asset (ROA ) =
2008 2009 2010 2011 2012
Return on Equity 21.94% 18.45% 17.75% 18.80% 19.84%
Graphical Presentation:
Interpretation:
The return on equity ratio was decreasing from 2008 to 2012. That was decreased from 21.94%
to 19.84%. This is not desirable. So, the management should work hard to increase the return
associated with equity. Though return on equity has slightly increased in 2012 from preceding
year, still it is significantly deviated from that of in 2008.
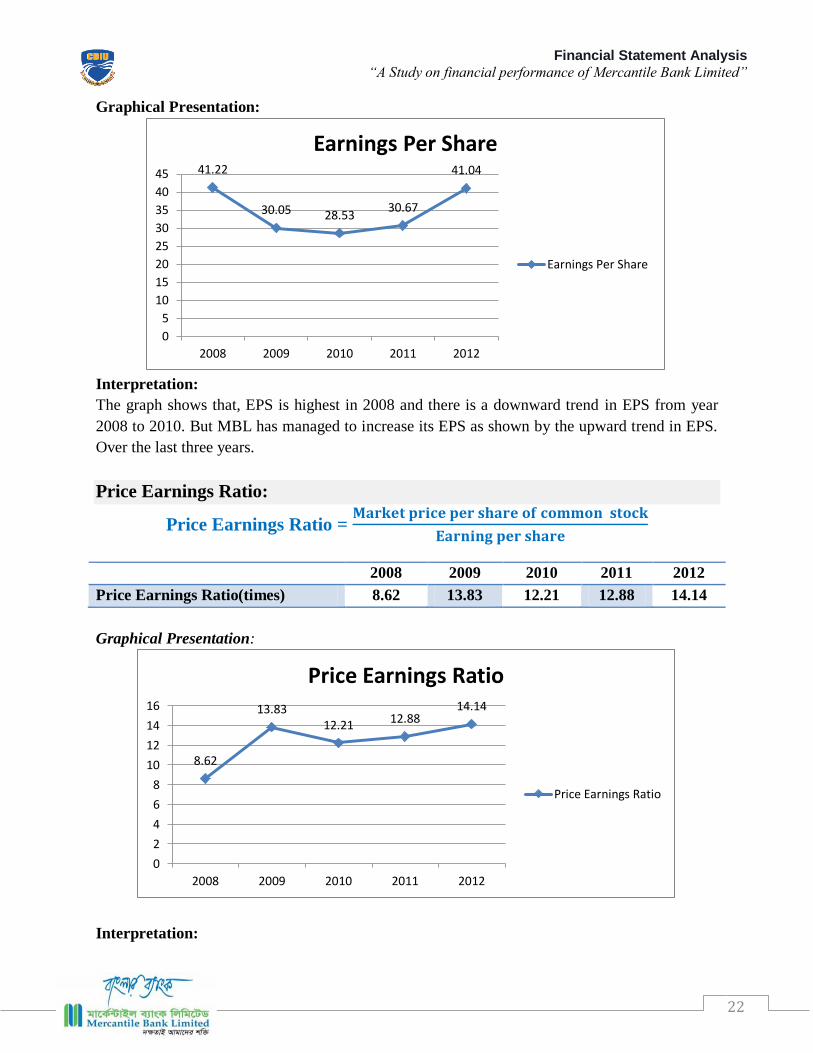
Earnings per Share
Earnings per Share =
2008 2009 2010 2011 2012
EPS 41.22 30.05 28.53 30.67 41.04
21.94%
18.45% 17.75% 18.80%
19.84%
0.00%
5.00%
10.00%
15.00%
20.00%
25.00%
2008 2009 2010 2011 2012
Return on Equity
Return on Equity
Financial Statement Analysis “A Study on financial performance of Mercantile Bank Limited”
22
Graphical Presentation:
Interpretation:
The graph shows that, EPS is highest in 2008 and there is a downward trend in EPS from year
2008 to 2010. But MBL has managed to increase its EPS as shown by the upward trend in EPS.
Over the last three years.
Price Earnings Ratio:
Price Earnings Ratio =
2008 2009 2010 2011 2012
Price Earnings Ratio(times) 8.62 13.83 12.21 12.88 14.14
Graphical Presentation:
Interpretation:
41.22
30.05 28.53 30.67
41.04
0
5
10
15
20
25
30
35
40
45
2008 2009 2010 2011 2012
Earnings Per Share
Earnings Per Share
8.62
13.83 12.21 12.88
14.14
0
2
4
6
8
10
12
14
16
2008 2009 2010 2011 2012
Price Earnings Ratio
Price Earnings Ratio

Financial Statement Analysis “A Study on financial performance of Mercantile Bank Limited”
23
It measures the level of price that the investors are paying for per taka of earnings offered by the
bank. From the graph I have seen that in year 2012 the investors has paid maximum amount of
price for per unit of earnings in which the bank issued its share in the market. This indicates the
investors are paying more and willing to invest in MBL.
Debt Ratio:
Debt ratio =
2008 2009 2010 2011 2012
Debt Ratio .92 0.93 0.94 0.94 0.92
Graphical Presentation:
Interpretation:
The graph shows that debt ratio of MBL is fluctuating. The MBL has reduced its debt ratio and
thereby it has reduced financial leverage and financial risk.
Time Interest Earned Ratio
Time Interest Earned Ratio =
2008 2009 2010 2011 2012
Time Interest Earned Ratio 1.13 1.22 1.37 1.54 1.28
Graphical Presentation:
0.92
0.93
0.94 0.94
0.92
0.91
0.915
0.92
0.925
0.93
0.935
0.94
0.945
2008 2009 2010 2011 2012
Debt ratio
Debt ratio

Financial Statement Analysis “A Study on financial performance of Mercantile Bank Limited”
24
Interpretation:
Their Time Interest Earned ratio was not satisfactory because, they have only 1.54tk.against 1
taka interest obligation which is not good .They should reduce their interest obligation or
increase the EBIT in order to smoothly operate their business..
1.13 1.22
1.37
1.54
1.28
0
0.2
0.4
0.6
0.8
1
1.2
1.4
1.6
1.8
2008 2009 2010 2011 2012
Time Interest Earned Ratio
Time Interest Earned Ratio

Financial Statement Analysis “A Study on financial performance of Mercantile Bank Limited”
25
CHAPTER – 6
Findings of the Study
6.1 Findings
During this study we have some findings about MBL. Those are following-
► The current ratio of MBL is increasing year by year. Mercantile Bank Limited net
working capital has gradually increasing year by year it is good sign for the bank.
► Cash and bank balance to total deposit of MBL is higher but it is not good because higher
liquidity position shows the greater amount of idle money, which cannot generate the
revenue.
► Cost income ratio of the MBL was decreasing gradually it is good sign for the bank.
► Total asset turnover of MBL is not good at all and it had been decreased 2008. But in
2011 this ratio is increasing mode.
► The liabilities and borrowing are increasing last couple of years that ultimately
decreasing the total revenue it is harmful.
► The profit margin of MBL is in strong position and earning per share (EPS) over the last
three years in upward trend.
► MBL had good return on asset and equity during 2012 but both of return falls in 2011.
► Invest to deposit drastically falls last year that is not good sign.
6.2 Recommendations
It is not unexpected to have problems in any organization. There must be problems to
operate an organization. But there must be remedies to follow. The following
commendations can be suggested to solve the above mentioned problems.
► MBL should be more efficient using its assets to generate it operating income. And it should need to increase investment to deposit.
► It should maintain its large capital to continue its strong position in capital adequacy.
► They should need to invest their idle money in right way and continue to grip up net working capital for pay short term obligation
► It should give more concern in their management quality to improve it satisfactory position.
► Management should be careful enough to control the excessive cost. ► Operational efficiency of every branch should be examined to profoundly and
regularly. Management should give more concern and directions to reduce the operating cost of branches.
► MBL should pay attention to increase the net interest margin by decreasing interest expenses.
6.3 Conclusion

Financial Statement Analysis “A Study on financial performance of Mercantile Bank Limited”
26
Mercantile Bank Limited (MBL) is setting new standards in the banking arena in the time of
turbulent economic conditions. As part of the long term financial reform and
modernization plan of the government, the bank had been converted into a public limited
company. Bank is a financial intermediary that collects money as deposit from idle section
i.e. household by providing interest against deposit and mobilize this money into
productive sector i.e. industry, agriculture, manufacturing from by collecting interest
against loan. The difference between interest expense and interest gain is the bank’s main
profit. In banking language it is called spread. Without a bank an economic development
cannot be imagined. The mercantile bank one of the leading banks in our country that also
plays a vital role undoubtlly. In 2010 the Mercantile Bank total deposit was (75629.14)
million and provide loan (66377.70) million. Mercantile bank collect deposit by providing
different types attracting deposit product and provide loan by offering different types of
investment product. In developing economic condition mercantile bank has the huge
contribution i.e. in 2010 the contribution was in garments sector (11,211,457,626),
agriculture sector (2,038,915,000), government sector (9,565,346,007). So it can be said
that Mercantile Bank plays a very important role in economic development.

Financial Statement Analysis “A Study on financial performance of Mercantile Bank Limited”
27
Bibliography Websites
www.mblbd.bd ( Accessed on 26.06.20015) pranfoods.net ( Accessed on 26.06.20015)
money.cnn.com ( Accessed on 26.06.20015)
WiKipedia.org ( Accessed on 26.06.20015)
Marketingdictionary.com ( Accessed on 26.06.20015)
Busidocx.com ( Accessed on 26.06.20015)
Businessinbox.com ( Accessed on 26.06.20015)
Books & Journals
► Annual Report of Mercantile Bank Ltd., 2008 to 2012
► Besley Scott & Brigham Eugene F. Essentials of Managerial Finance, 12th
Edition, The Dnyden Press, HarcourtCollege Publications.
► Peter S. Rose & Sylvia C. Hudgins. Bank Management & Financial Service, 6th
Edition, McGraw – Hall/Irwin.
► Ross Stephen A., Westerfield Randolph W. & Jaffe Jeffrey, Corporate Finance,
7th Edition, McGraw.Hill International Edition.
► Foster George, (1996) Financial Statement Analysis. Second Edition, Pearson
Education Pte. Ltd, Singapore.
► Gitman, J Lawrence, (1997). Principle of Managerial Finance. 10th edition,
Pearson Education Pte. Ltd, Singapore.
► Stephen A. Ross, Randolph W. Westerfield and Jaffery Jaffe,
(2003).Corporate Finance. Seventh Edition, Tata McGraw-Hill Publishing
Company Limited.
Lectures & Handouts
► Tanvir Mohammad Hayder Arif;
MSc. International Business Management (UK), MBA in Finance (CU, BD)
Associate Professor, Department of Finance and Banking
University of Chittagong
Academic Advisor, Cox’s Bazar International University
Financial Statement Analysis “A Study on financial performance of Mercantile Bank Limited”
28
Appendix

Financial Statement Analysis “A Study on financial performance of Mercantile Bank Limited”
29

Financial Statement Analysis “A Study on financial performance of Mercantile Bank Limited”
30

Financial Statement Analysis “A Study on financial performance of Mercantile Bank Limited”
31

Financial Statement Analysis “A Study on financial performance of Mercantile Bank Limited”
32

Financial Statement Analysis “A Study on financial performance of Mercantile Bank Limited”
33

Financial Statement Analysis “A Study on financial performance of Mercantile Bank Limited”
34

Financial Statement Analysis “A Study on financial performance of Mercantile Bank Limited”
35

Financial Statement Analysis “A Study on financial performance of Mercantile Bank Limited”
36
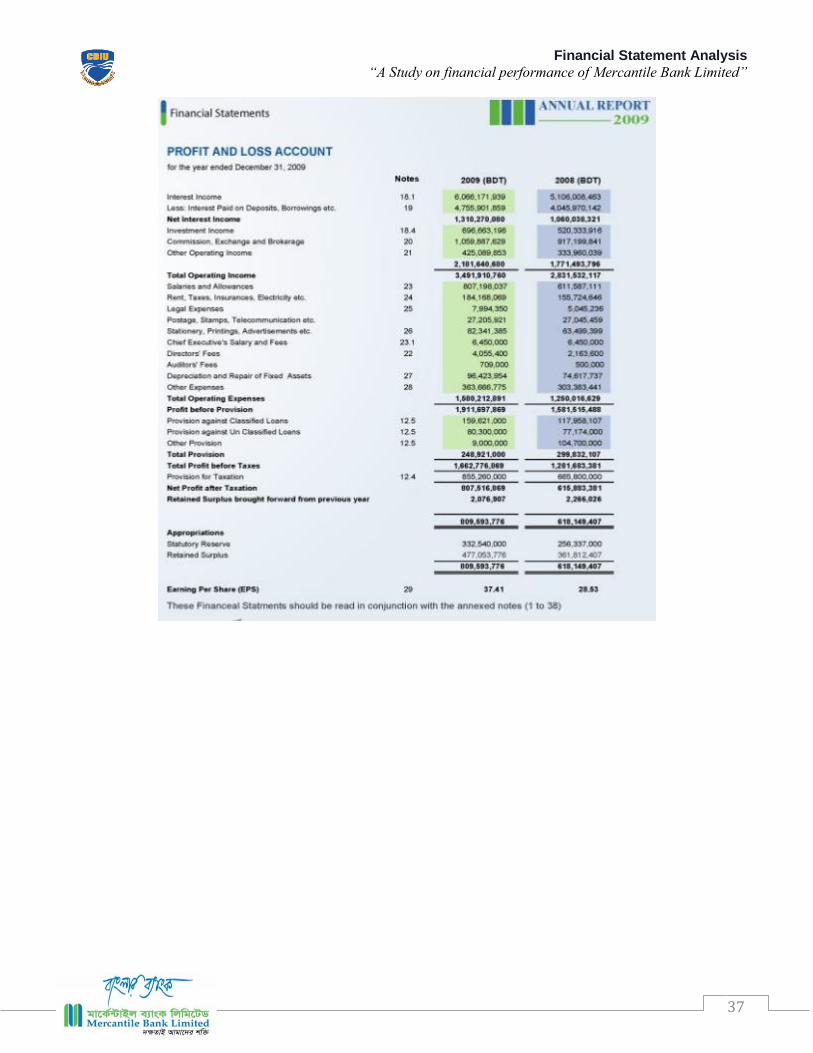
Financial Statement Analysis “A Study on financial performance of Mercantile Bank Limited”
37

Financial Statement Analysis “A Study on financial performance of Mercantile Bank Limited”
38

Financial Statement Analysis “A Study on financial performance of Mercantile Bank Limited”
39

Financial Statement Analysis “A Study on financial performance of Mercantile Bank Limited”
40
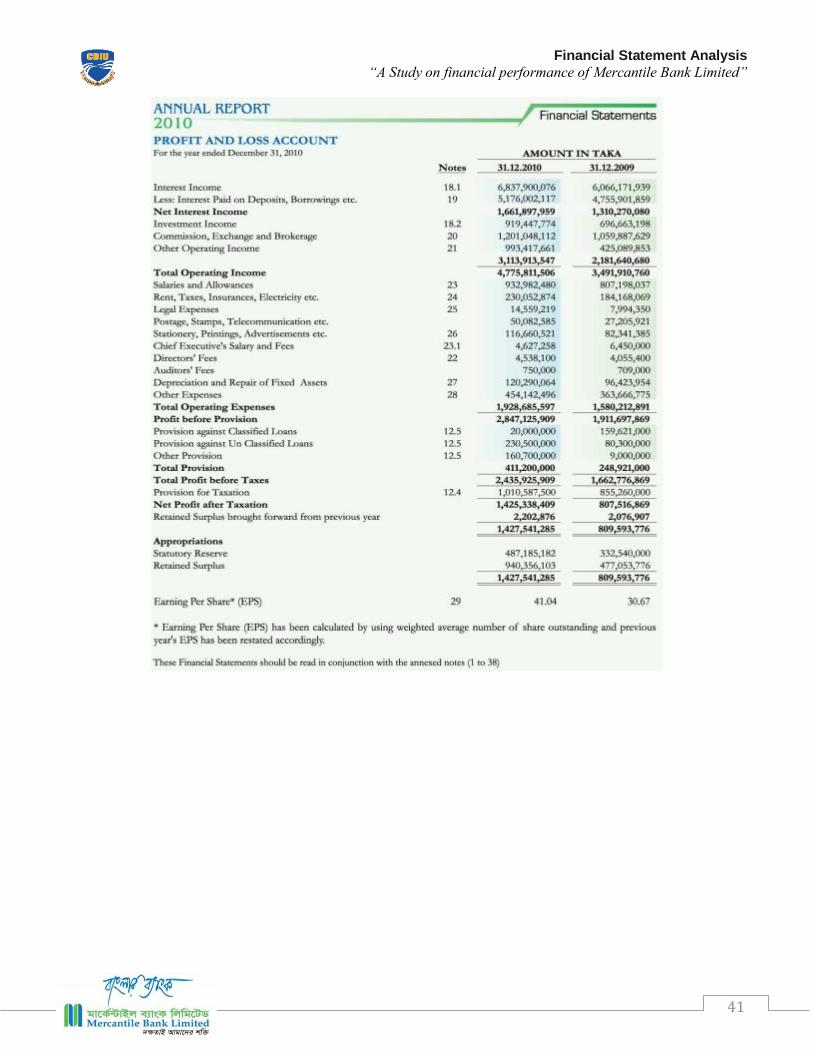
Financial Statement Analysis “A Study on financial performance of Mercantile Bank Limited”
41

Financial Statement Analysis “A Study on financial performance of Mercantile Bank Limited”
42

Financial Statement Analysis “A Study on financial performance of Mercantile Bank Limited”
43

Financial Statement Analysis “A Study on financial performance of Mercantile Bank Limited”
44

Financial Statement Analysis “A Study on financial performance of Mercantile Bank Limited”
45
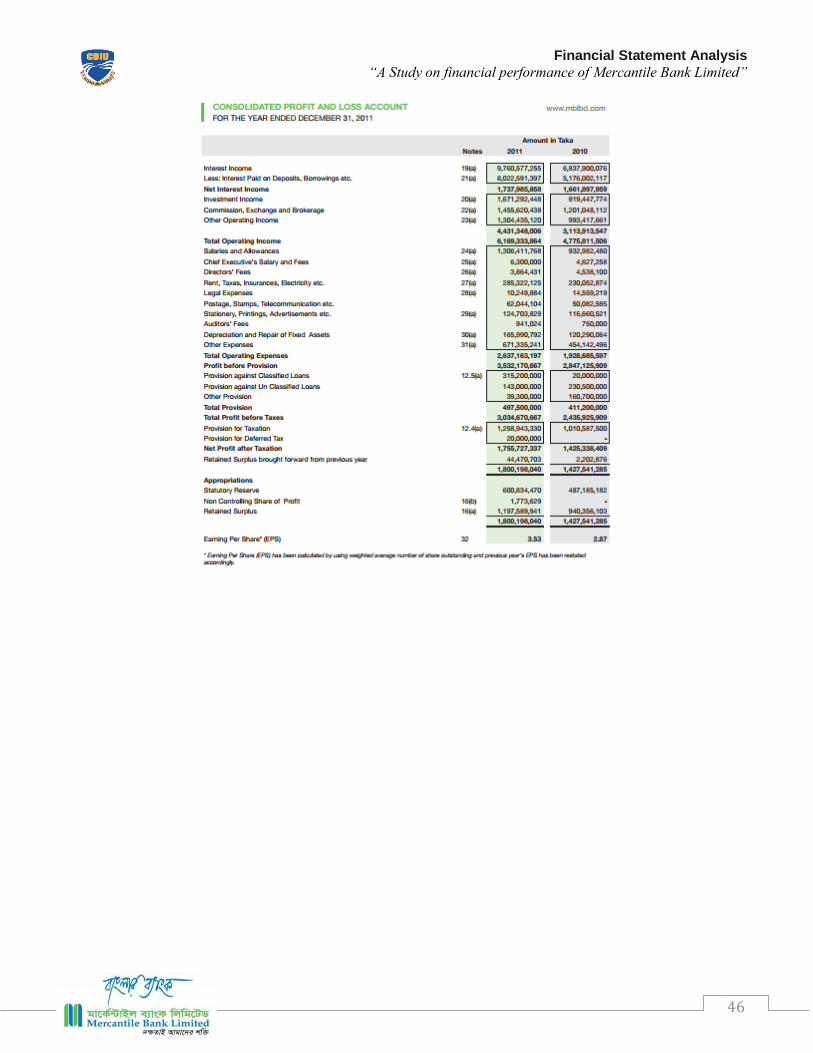
Financial Statement Analysis “A Study on financial performance of Mercantile Bank Limited”
46
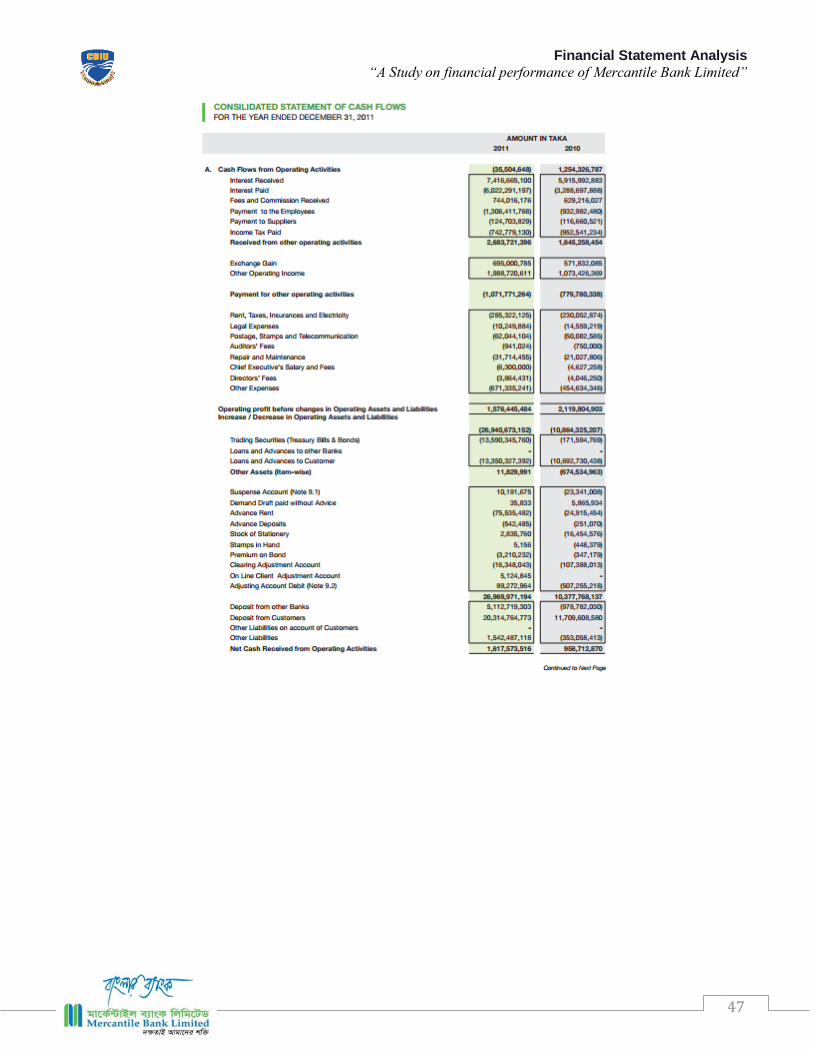
Financial Statement Analysis “A Study on financial performance of Mercantile Bank Limited”
47

Financial Statement Analysis “A Study on financial performance of Mercantile Bank Limited”
48