Financial Statement Analysis / Entrepreneurial Finance.
54
Financial Statement Analysis / Entrepreneurial Finance
-
Upload
marsha-lyons -
Category
Documents
-
view
218 -
download
0
Transcript of Financial Statement Analysis / Entrepreneurial Finance.

Financial Statement Analysis / Entrepreneurial
Finance

Financial Analysis Overview
• An assessment of a company’s past, present and future financial condition
• Purpose is to diagnose company’s financial strengths and weaknesses
• Primary tools– Financial Statements– Ratios
Financial Statements
Main Financial Statements
• Balance Sheet
• Income Statement
• Statement of Cash Flows

The Balance Sheet
• The balance sheet shows a firm’s assets (what it owns) and liabilities (what it owes)
• The difference between a firm’s assets and liabilities is the firm’s net worth
• A snapshot in time

Balance Sheet Items
Assets• Current assets:
– Cash & securities– Accounts Receivable– Inventories
• Fixed assets:– Tangible assets like
PPE– Intangible assets
Liabilities and Equity• Current liabilities:
– Accounts payable– Short-term debt
• Long-term liabilities• Shareholders' equity
Anheuser-Busch Example

Income Statement
• The income statement summarizes revenues and expenses for the business
• Covers an interval of time (monthly, quarterly, annually)
• Major components:– Revenues– Expenses– Taxes– Extraordinary Items

Income Statement Format
Sales revenue- Cost of goods sold= Gross profit margin- Operating expenses= EBITDA- Depreciation & Amortization= EBIT (Operating income)- Interest payments= Taxable income- Taxes= Net Income

Anheuser-Busch Example
Accounting vs. Economic Earnings
• Accounting definition of earnings ignores unrealized changes in market value of assets and liabilities
• Accounting profit does not recognize cost of equity capital
• Accounting profit may not contain all relevant costs– e.g., opportunity cost of entrepreneur’s time

Cash Flow Statement
• Summarizes the levels of cash being generated or consumed by the business
• Covers an interval of time (monthly, quarterly, annually)

Cash Flow Statement Format
Cash flow from operationsNet income
+ Depreciation- Increase in accounts receivable- Increase in inventories+ Increase in accounts payable
Total cash flow from operations
Cash flow from investing activities- Investment in plant and equipment
Cash flow from financing activities- Dividends paid+ Increase in short-term debt
= Change in cash

Anheuser-Busch Example
Statement Connections
• Excel example
Ratio Analysis

Why do ratio analysis?
• A means of evaluating and diagnosing performance• Ratios standardize numbers and facilitate comparisons
– Comparing performance to competitors or industry standards (horizontal comparison)
– Comparing performance to prior history (vertical comparison)
• Examine a variety of areas– Liquidity– Solvency– Efficiency– Profitability
• Remember that ratios are meaningless unless you have something to compare
Major Ratio Categories
• Liquidity– ability to cover short-term obligations
• Solvency– ability to cover long-term obligations; examines mix of debt and
equity
• Efficiency– amount of activity generated by resources deployed
• Profitability– amount of profit generated by resources deployed
• Market value (if applicable)– some of these ratios (e.g. price-earnings ratio, market-to-book
ratio) are useful in valuation analysis, such as valuing private firms

Liquidity Ratios
• Current Ratio– The ratio between all current assets and all current liabilities.– Formula:
• Current Assets Current Liabilities
• Quick Ratio – The ratio between all assets quickly convertible into cash (this
excludes inventory) and all current liabilities. – Formula:
• Cash + Accounts Receivable + Short-Term Investments Current Liabilities

Anheuser-Busch Example
Current Ratio:
1829.5 / 2246.1 = 0.81
Quick Ratio:
(219.2 + 720.1 + 195.2) / 2246.1 = 0.51

Solvency Ratios
• Debt to Equity – Shows the ratio between capital invested by the owners and the
funds provided by lenders.– Formula:
• Total Liabilities Total Equity
• Interest coverage ratio – A measurement of the number of times a company could make
its interest payments with its earnings before interest and taxes; the lower the ratio, the higher the company’s debt burden.
– Formula:• Pretax Operating Income + Interest Expense Interest Expense

Anheuser-Busch Example
Debt to Equity:
(2246.1 + 1191.5 + 7653.5 + 1194.5 + 152.9) / 3938.7 = 3.16

Anheuser-Busch Example
Interest Coverage Ratio:
(2719.6) / 451.3 = 6.03

Profitability
• Gross Profit Margin – Indicator of how much profit is earned on products
without consideration of selling and administration costs.– Formula:
• Sales - COGS Sales
• Net Profit Margin / Return on Sales (ROS)– Shows how much profit comes from every dollar of
sales.– Formula:
• Net Income Sales

Anheuser-Busch Example
Gross Profit Margin:
5552.1 / 15717.1 = 35.3%
Net Profit Margin:
1965.2 / 15717.1 = 12.5%

Profitability
• Return on Equity (ROE) – Determines the rate of return on the investment in the business. – Formula:
• Net Income Equity
• Return on Assets (ROA) – Considered a measure of how effectively assets are used to
generate a return. – Formula:
• Net Income Total Assets
• Return on Invested Capital (ROIC) – Formula:
• Net Income Total Liabilities + Stockholder’s Equity – Current Liabilities

Anheuser-Busch Example
Return on Equity:
1965.2 / 3938.7 = 49.9%
Return on Assets:
1965.2 / 16377.2 = 12.0%
Return on Invested Capital:
1965.2 / (12438.5 + 3938.7 – 2246.1) = 13.9%
Info from income statement and balance sheet
Info from income statement and balance sheet
Info from income statement and balance sheet

Efficiency
• Days in Receivables – This calculation shows the average number of days it takes to
collect accounts receivable (number of days of sales in receivables).
– Formula:• Accounts Receivable
Sales / 365 days• Compare to industry standards.
• Accounts Receivable Turnover – Number of times that trade receivables turnover during the year.– Formula:
• Net Sales Accounts Receivable
Efficiency
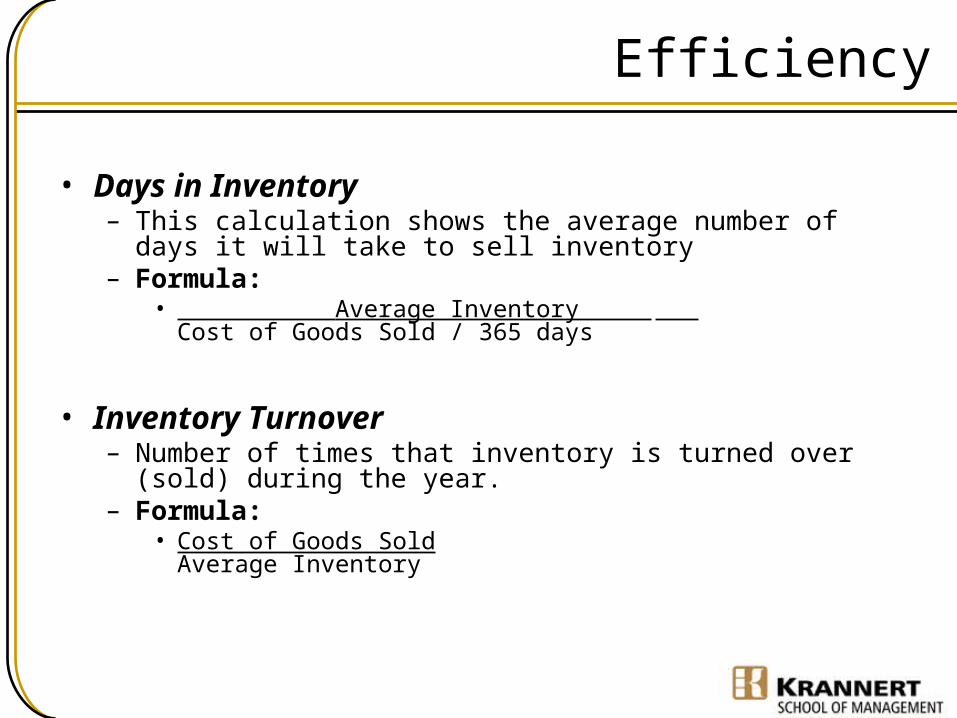
• Days in Inventory – This calculation shows the average number of days it will take to
sell inventory – Formula:
• Average Inventory Cost of Goods Sold / 365 days
• Inventory Turnover – Number of times that inventory is turned over (sold) during the
year.– Formula:
• Cost of Goods SoldAverage Inventory

Efficiency
• Asset Turnover– Indicates how efficiently business generates sales on each dollar of
assets.– Formula:
• Sales Total Assets
• Days in Accounts Payable – This calculation shows the average length of time trade payables are
outstanding before they are paid.– Formula:
• Accounts Payable COGS / 365 days
• Accounts Payable Turnover – The number of times trade payables turnover during the year.– Formula:
• COGS Accounts Payable
Anheuser-Busch Example
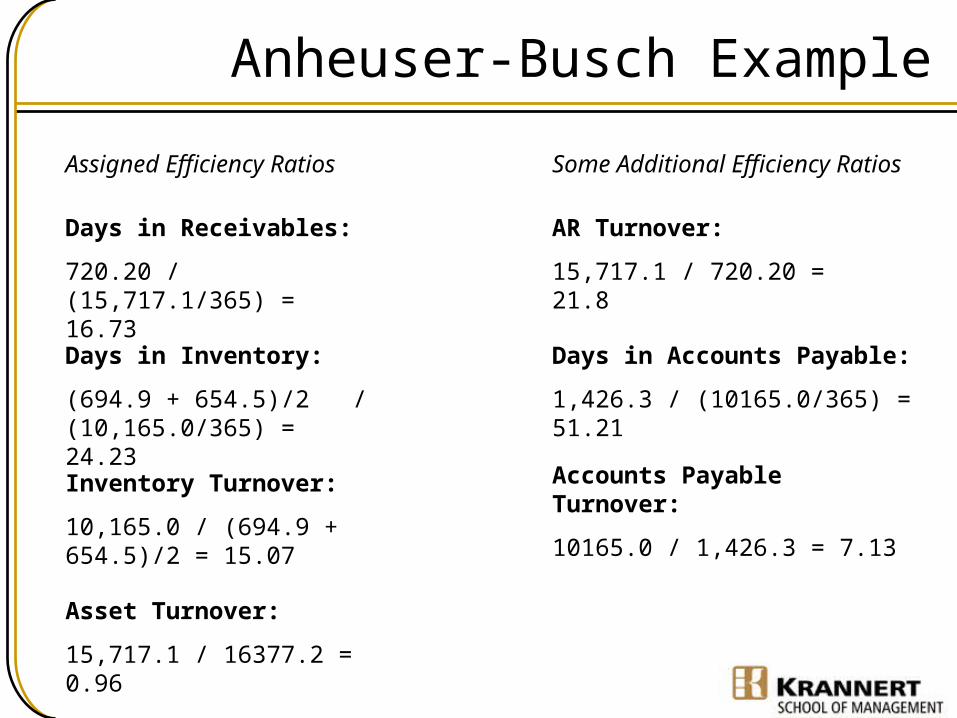
Days in Inventory:
(694.9 + 654.5)/2 / (10,165.0/365) = 24.23
Inventory Turnover:
10,165.0 / (694.9 + 654.5)/2 = 15.07
Days in Accounts Payable:
1,426.3 / (10165.0/365) = 51.21
Days in Receivables:
720.20 / (15,717.1/365) = 16.73
AR Turnover:
15,717.1 / 720.20 = 21.8
Asset Turnover:
15,717.1 / 16377.2 = 0.96
Some Additional Efficiency Ratios
Accounts Payable Turnover:
10165.0 / 1,426.3 = 7.13
Assigned Efficiency Ratios

The DuPont Equation
• ROE = (Net Income/Sales) x (Sales/Total Assets) x (Total Assets/Equity
= profit margin x asset turnover x leverage multiplier• DuPont equation shows how three different areas combine to determine
ROE– expense management (measured by the profit margin)– asset management (measured by asset turnover)– debt management (represented by the debt ratio or leverage
multiplier)

Using Ratio Analysis to Better Understand Profitability

Seemingly Similar Companies
Outback Steakhouses, Inc.
NASDAQ: OSI
Brinker International, Inc.
NYSE: EAT
Darden Restaurants, Inc.
NYSE: DRI
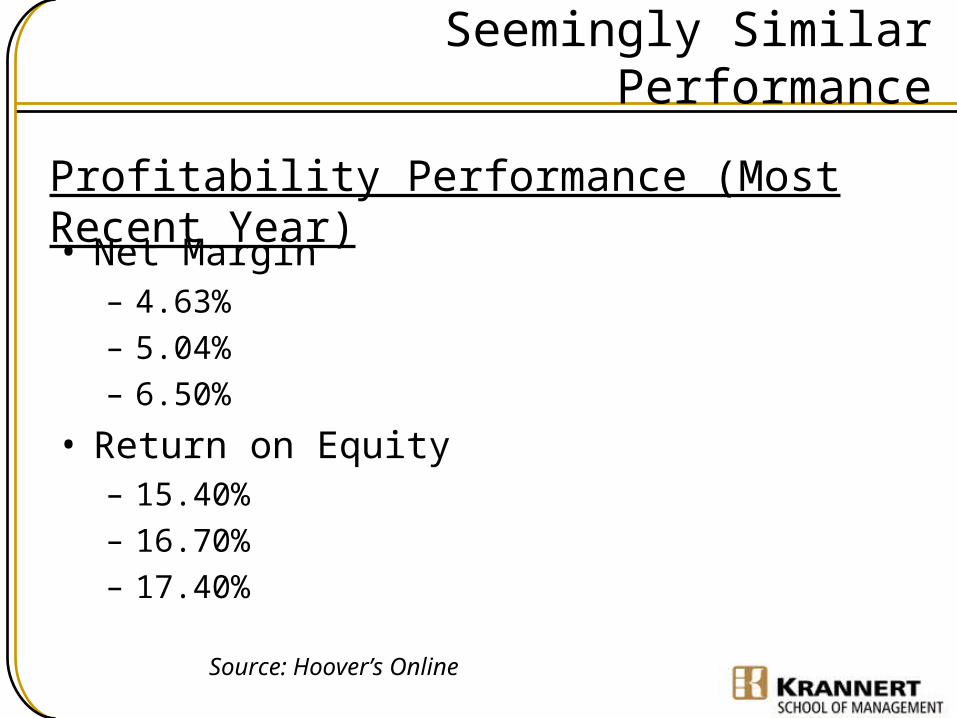
Seemingly Similar Performance
• Net Margin– 4.63%– 5.04%– 6.50%
• Return on Equity– 15.40%– 16.70%– 17.40%
Source: Hoover’s Online
Profitability Performance (Most Recent Year)

Potential Paths to Performance
• High Margins
• High Efficiency
• High Leverage

Beginning the Investigation
• Use company’s financial statements– Income Statement and Balance Sheet
• Examine and compare common ratios– Across time– Across companies
• Use three year period (2000 – 2002)
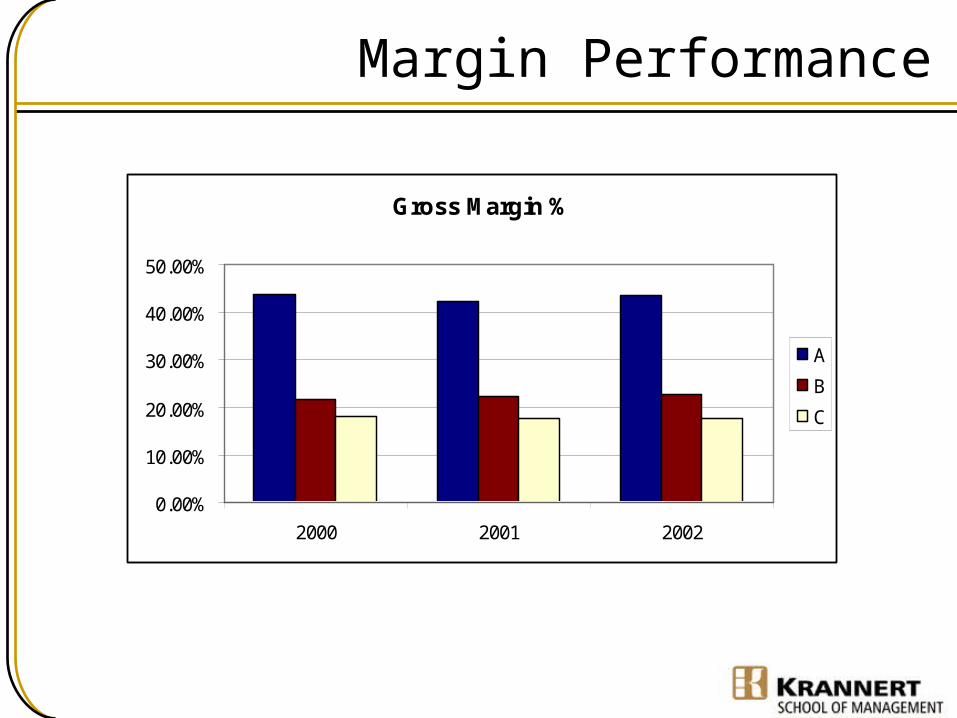
Margin Performance
Gross Margin %
0.00%
10.00%
20.00%
30.00%
40.00%
50.00%
2000 2001 2002
A
B
C
Cost Efficiency
SG&A / Sales
0.00%
5.00%
10.00%
15.00%
20.00%
25.00%
30.00%
2000 2001 2002
A
B
C
Inventory Turnover
0.00
20.00
40.00
60.00
80.00
100.00
120.00
2000 2001 2002
A
B
C
AP Turnover
0.00
5.00
10.00
15.00
20.00
25.00
30.00
35.00
2000 2001 2002
A
B
C
Higher = better
Lower = better

Leverage
Long-Term Debt / Equity
0.00%
10.00%
20.00%
30.00%
40.00%
50.00%
60.00%
70.00%
80.00%
2000 2001 2002
A
B
C
Interest Coverage Ratio
0.005.00
10.0015.0020.0025.0030.0035.0040.0045.0050.00
2000 2001 2002
A
B
C
Higher = more levered
Lower = more levered

Summary
• Company A– High margins– Less efficient– Low leverage
• Company B– Moderate margins– Moderate efficiency– High leverage
• Company C– Low margins– High efficiency– Moderate leverage
They run very similar businesses and deliver similar results, but the paths are very different.
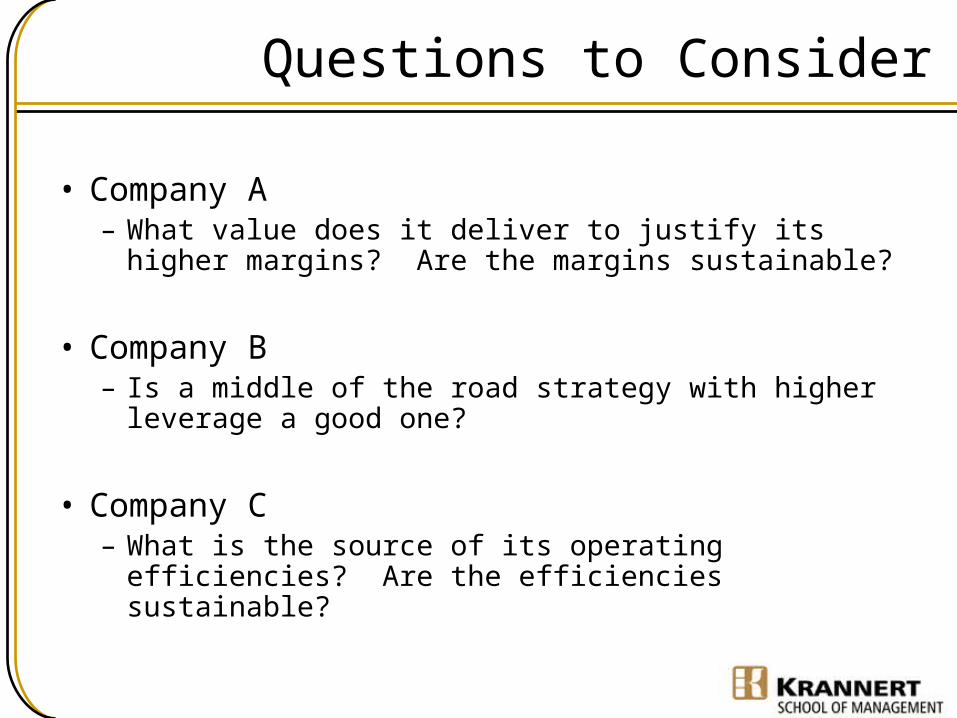
Questions to Consider
• Company A– What value does it deliver to justify its higher
margins? Are the margins sustainable?
• Company B– Is a middle of the road strategy with higher leverage a
good one?
• Company C– What is the source of its operating efficiencies? Are
the efficiencies sustainable?

Who is Who?
• A few additional clues– 2002 sales ($millions)
• A: 2,362• B: 4,369• C: 2,887
– Sales growth (2002 – 2003)• A: 14.4%• B: 6.4%• C: 13.5%

Using Financial in New Ventures

How to use financial ratios in new ventures?
• Remember, financial statements are pro-forma (expectations about what financial position will be)
• Could use average industry ratios as a starting point for generating pro-forma statements
• Pro-forma statements should reflect the underlying strategy of the firm

Adjusting ratios according to your strategy
Key restaurant ratios
Low Cost Strategy
Differentiation strategy
Inventory turnover
(Wages & benefits) / sales
Liquidity
Gross profit margin
Operating costs / sales

Limitations of Ratios
• They are outcome measures; if you have a problem with a ratio, you still have to figure out what’s causing the problem
• Choosing the right comparison data is sometimes difficult– What’s the right industry?– Published industry averages are just rough guidelines– Who are the competitors? – Accounting practices can differ across firms
• Seasonality may affect ratios
• We have only discussed ratios generated from financial statements– These are based on historical data; we would like something that helps predict
future performance– Operational / marketing measures may be more critical– Recall the Balanced Scorecard

Other Values to Consider
• SG&A to Sales– Is company controlling overhead expenses?
• Direct labor utilization– Often critical in professional services companies
• Customer acquisition cost– Compare to lifetime value of a customer
• Others (company-specific)
• Create a Balanced Scorecard

The Balanced Scorecard
Kaplan and Norton (1992)
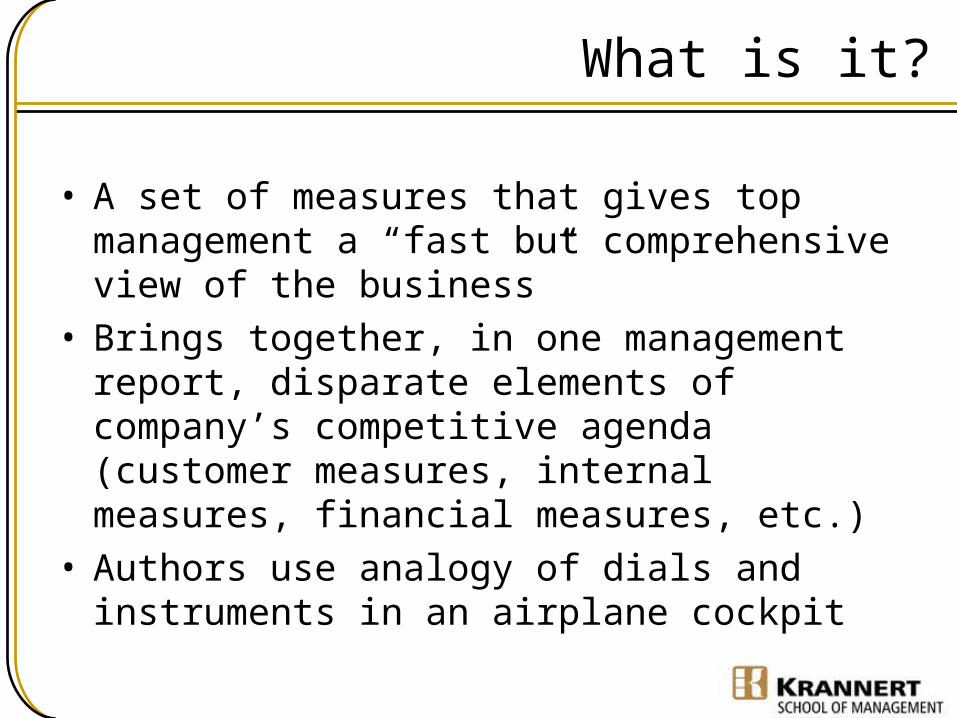
What is it?
• A set of measures that gives top management a “fast but comprehensive view of the business”
• Brings together, in one management report, disparate elements of company’s competitive agenda (customer measures, internal measures, financial measures, etc.)
• Authors use analogy of dials and instruments in an airplane cockpit

Why do it?
• No single measure is adequate
• It’s important to examine the means used to achieve financial outcomes
• Many operational measures translate into future financial results
• Traditional measures might give misleading signals regarding continuous improvement and innovation (focus on short-term results)

The Four Perspectives
• Customer Perspective: How do customers see us?
• Internal Business Perspective: What must we excel at?
• Innovation and Learning Perspective: Can we continue to improve and create value?
• Financial Perspective: How do we look to shareholders?
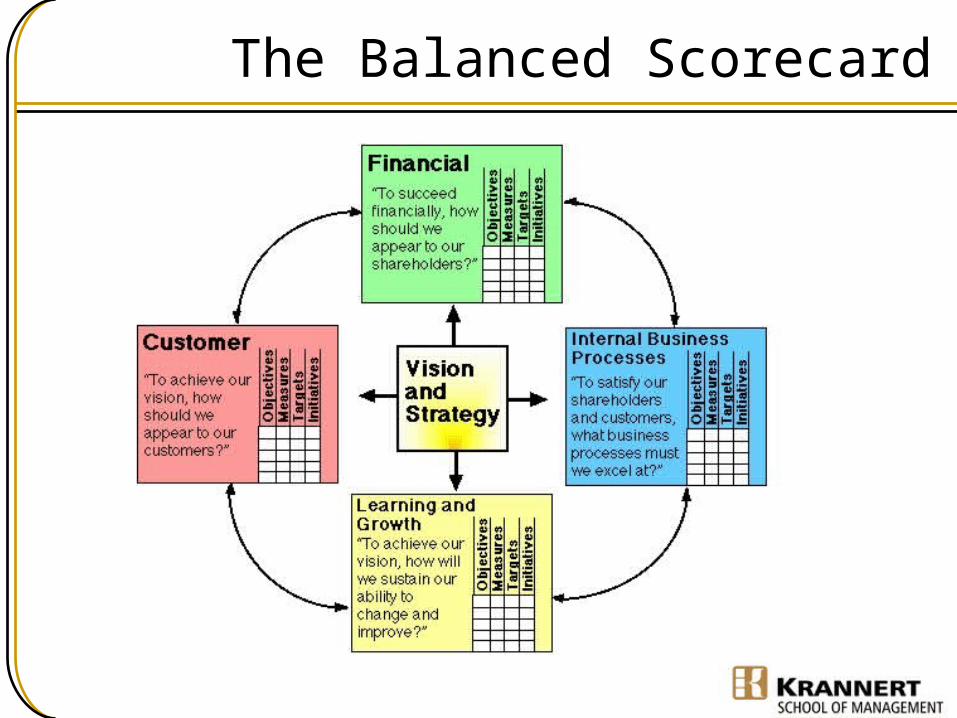
The Balanced Scorecard

Next Time
• Zipcar case on Monday– This requires some financial thinking /
analysis– Think about what key measures / ratios
should be for the business