Financial Stability Review - South African rand and... · Nevertheless, the South African banking...
55
Financial Stability Review September 2015 South African Reserve Bank
Transcript of Financial Stability Review - South African rand and... · Nevertheless, the South African banking...

Financial Stability ReviewSeptember 2015
South African Reserve Bank

Financial Stability ReviewSeptember 2015

Financial Stability Review September 2015
© South African Reserve Bank
All rights reserved. No part of this publication may be reproduced, stored in a retrieval system, or transmitted in any form or by any means, electronic, mechanical, photocopying, recording or otherwise, without fully acknowledging the Financial Stability Review of the South African Reserve Bank as the source. The contents of this publication are intended for general information only and are not intended to serve as financial or other advice. While every precaution is taken to ensure the accuracy of information, the South African Reserve Bank shall not be liable to any person for inaccurate information or opinions contained in this publication. Unless indicated otherwise, data were supplied by the South African Reserve Bank.
This issue of the Financial Stability Review focuses mainly on the six-month period ending June 2015. However, selected developments up to the date of publication are also reported on. Data may include own calculations made for the purposes of this publication.
Comments and enquiries relating to this Financial Stability Review are welcomed and should be addressed to:
Head: Financial Stability Department South African Reserve Bank P O Box 427 Pretoria 0001
Tel. +27 12 313 3601 E-mail: [email protected]
http://www.reservebank.co.za ISSN: 1811-2226

Financial Stability Review September 2015
Purpose of the Financial Stability Review
The primary objective of the South African Reserve Bank (the Bank) is to protect the value of the currency in the interest of balanced and sustainable economic growth in South Africa.
In addition to this, the Bank’s function and mandate of maintaining, promoting and enhancing financial stability in the Republic of South Africa is affirmed in the Financial Sector Regulation Bill of 2015, which is expected to be promulgated in 2016. In pursuit of this objective and to promote a stable financial system, the Bank publishes a semi-annual Financial Stability Review. The publication aims to identify and analyse potential risks to financial system stability, communicate such assessments, and stimulate debate on pertinent issues. The Bank recognises that it is not the sole custodian of financial system stability but that it contributes significantly towards and coordinates a larger effort involving government, other regulators, self-regulatory agencies and financial market participants.
Defining ‘financial stability’
Financial stability is not an end in itself but, like price stability, is generally regarded as an important precondition for sustainable economic growth, development and employment creation.
Financial stability refers to a financial system which is resilient to systemic shocks, facilitates efficient financial intermediation, and mitigates the macroeconomic costs of disruptions in such a way that confidence in the system is maintained.

Financial Stability Review September 2015d

Financial Stability Review September 2015
Contents
Overview ........................................................................................................................ 1Financial stability developments and trends .................................................................... 3 Economic growth and outlook .................................................................................. 3 Financial market developments and trends ................................................................ 5 Banks and bank-lending conditions ........................................................................... 7 Non-bank financial institutions................................................................................. 10 Confidence in the financial services sector ................................................................ 12 Shadow banking ........................................................................................................ 13 Non-financial institutions ......................................................................................... 14 Households ................................................................................................................ 17 Residential real estate ................................................................................................ 19 Government finances ................................................................................................ 20 Foreign-exchange reserves .......................................................................................... 20The robustness of the domestic financial infrastructure .................................................. 24 A resolution framework for South Africa .................................................................. 24 Cybersecurity............................................................................................................. 25 Regulatory developments affecting the domestic banking sector ............................... 26 Regulatory developments affecting the domestic insurance sector ............................. 30 Regulatory developments affecting the domestic financial markets ........................... 33Financial stability risks and outlook ................................................................................ 38 Assessing financial stress ............................................................................................ 38 Assessing financial stability risks ............................................................................... 38Macroprudential policy regulation .................................................................................. 43 Assessing the application of the countercyclical capital buffer for banks .................... 43 Consideration for the activation of the countercyclical capital buffer for banks ......... 44Abbreviations .................................................................................................................. 47
Boxes
1 Leveraged finance of China’s stock market ................................................................ 222 Interconnectedness in the financial system ................................................................ 233 A summary of the draft review of limitations on fees and interest rates ..................... 364 Financial cycles .......................................................................................................... 45
Figures
1 Real economic growth in selected countries .............................................................. 32 Normalised volatility over the interest rate outlook ................................................... 53 Implied probability of a hike in the US Fed funds rate .............................................. 54 Global credit default swap spreads and the US FOMC meeting ................................ 55 Global currency volatility .......................................................................................... 66 Commodity futures price and the US dollar index .................................................... 67 Global financial stress index and financial conditions ............................................... 68 Risk aversion in the equity market ............................................................................. 79 Commodity-led equity market correction .................................................................. 710 Global market equity indices ..................................................................................... 711 and 12 Global equity market capitalisation and bond market value ....................... 813 Low global inflation and fall in the oil price .............................................................. 814 OPEC crude oil output and Brent crude oil price ...................................................... 815 CFTC net-long positions in the price of Brent crude oil ............................................ 916 Total banking sector assets ........................................................................................ 917 Capital adequacy ....................................................................................................... 9

Financial Stability Review September 2015
18 Capital adequacy by bank: June 2015 ........................................................................ 1019 Profitability ............................................................................................................... 1020 Return on equity (smoothed) by bank: June 2015 ...................................................... 1021 Impaired advances: Total bank sector ........................................................................ 1122 Credit risk of the five biggest banks ........................................................................... 1123 Sources of deposits ..................................................................................................... 1124 Network systemic index for the interbank market ..................................................... 1225 Total assets of pension fund industry ......................................................................... 1226 Penetration rate (total assets as a percentage of gross domestic product) .................... 1227 Investment allocation of pension funds ..................................................................... 1328 Underwriting results of primary short-term insurers .................................................. 1329 Composition of credit extension in South Africa by source........................................ 1330 Distribution of total assets between financial intermediaries in South Africa:
broad measure of shadow banking ............................................................................. 1431 Distribution of total assets between financial intermediaries in South Africa:
narrow measure of shadow banking ........................................................................... 1432 Non-financial corporates’ domestic debt securities, international debt
securities and the Experian Business Debt Index ....................................................... 1533 Non-financial corporates investment and total domestic corporate debt .................... 1634 Non-financial corporate sector: Aggregate interest-coverage ratio .............................. 1635 Non-financial corporate sector: Industry interest-coverage ratio ................................ 1636 Non-financial corporate sector: EDF distribution of South African
incorporated firms ..................................................................................................... 1737 Prime lending rate, household debt to disposable income and debt servicing
cost to disposable income .......................................................................................... 1738 Household net wealth to disposable income ratio and Debt-service Risk Index ......... 1839 Consumer Financial Vulnerability Index and the Consumer Confidence Index ........ 1840 House price indices and morgage advances ................................................................ 1941 Mortgage instalment-to-rent and price-to-rent ratios ................................................. 1942 Increasing loan debt of national government ............................................................. 2043 General goverment debt-to-GDP ratios of BRICS countries ...................................... 2044 Public debt holding by financial institutions ............................................................. 2045 South Africa’s one-year default probability ................................................................ 2146 Reserve adequacy for South Africa ............................................................................ 2147 Index of exchange market pressure ............................................................................ 2148 Financial Stress Index for South Africa ...................................................................... 3849 Private-sector total credit-to-gross domestic product gap ........................................... 4348 Selected private-sector credit-to-gross domestic product gaps according
to selected credit categories ........................................................................................ 43
Tables
1 Selected indicators of real economic activity .............................................................. 42 Selected indicators of the South African banking sector ............................................ 83 Spread and categorisation of assets of primary long-term insurers.............................. 114 Free assets-to-capital-adequacy requirement of all primary long-term insurers .......... 115 Performance indicators for primary short-term insurers ............................................. 126 EY Financial Services Index and its components ....................................................... 127 Classification by economic function .......................................................................... 148 Selected indicators for the corporate sector ................................................................ 149 Business confidence index ......................................................................................... 1510 Selected indicators for the household sector ............................................................... 1711 Sovereign debt ratings for South Africa ..................................................................... 2012 Risk assessment matrix .............................................................................................. 38

1Financial Stability Review September 2015
Overview
Emerging-market economies (EMEs) are currently facing significant challenges, with concerns over China’s slowdown and the effects of monetary policy normalisation in the United States (US) weighing on growth prospects. The devaluation of China’s currency during the period under review caused increased volatility in global financial markets and extensive equity market losses. The equity market crash and generally weak economic fundamentals suggest that China’s economy could be heading for a sharp slowdown. Slowing demand from China has led to a slump in global commodity prices, with adverse effects for commodity-exporting countries, the majority of which are EMEs. A surge in global financial market volatility in the run-up to the US Federal Reserve’s (the Fed) September meeting on its interest rate abated somewhat after its decision to keep rates on hold. EMEs, including South Africa, are particularly vulnerable as they could face a reversal of portfolio flows as policy normalisation in the US commences.
The South African economy contracted in the second quarter of 2015. The lacklustre production performance was also reflected in meagre levels of job creation. As a result, the Bank revised downwards its estimates for future economic growth, taking into account the pronounced downward trend reflected by the Bank’s leading indicator of economic acitivity. Nevertheless, the South African banking sector remained sound, maintaining capital levels well in excess of the minimum prudential requirement. Profitability also remained high and credit risks well managed. To improve on the soundness of banks, the remaining prudential requirements related to liquidity management are being phased in. In addition, the Bank is currently in the process of conducting stress tests on banks as well as the financial system in general to ensure and contribute to its future soundness. Communication of the results will be done in future editions of the Financial Stability Review. The Bank once again participated in the global assessment of so-called ‘shadow banks’ with the intention of further improving on its measurement. Even though the credit intermediation conducted by these non-bank financial institutions are currently relatively small in South Africa compared to the regulated banking sector, they might pose risks to the system which need to be monitored.
During the period under review, corporate sector profit continued to contract due to increased average unit cost of production brought about by higher electricity tariffs and lower economic growth. Business confidence also continued to deteriorate. Growth in credit extended to households moderated in the first half of 2015, mainly due to a deceleration in the growth rate of credit-card advances and instalment sales, which is also a reflection of generally weaker economic conditions. Household debt remained elevated despite having decreased marginally as a percentage of disposable income. Given the subdued economic outlook and persistently high levels of unemployment, a reduction in household debt levels is unlikely, making it more difficult for households to withstand economic contractions. The subdued economic conditions were also reflected in house prices, which impacted negatively on the balance sheets of households.
Total loan debt of government maintained a steady upward trend during the period under review but this trend should moderate should government succeed in its fiscal rebalancing strategy, according to the International Monetary Fund (IMF). Accomplishing fiscal rebalancing is important as South Africa’s public debt, with other factors, weigh on the country’s sovereign ratings.
To ensure the robustness of the regulatory financial infrastructure, regular assessments of regulatory standards are conducted by international standard setters. The outcome of a recent Regulatory Consistency Assesment Programme by the Basel Committee on Banking

Financial Stability Review September 20152
Supervision (BCBS) on South African banks found that banks are compliant with all components of the capital framework. Furthermore, in August 2015, National Treasury (NT), the Bank and the Financial Services Board (FSB) published a discussion paper on strengthening South Africa’s resolution framework. The paper sets out key proposals for strengthening South Africa’s resolution framework for designated resolution institutions to provide for the management of such institutions in case of failure and in a manner that seeks to mitigate any negative impact on financial stability in South Africa.
In terms of the Basel III regulatory framework, the Bank will be able to deploy a countercyclical capital buffer from January 2016 if needed. Based on its assessment for the period under review, the Bank does not currently consider the activation of such a buffer to be warranted. Analysis and decisions regarding the countercyclical capital buffer will be regularly communicated in the Financial Stability Review.

3Financial Stability Review September 2015
Financial stability developments and trends
Economic growth and outlook
Risks to the global economic outlook have increased against the backdrop of a slowing Chinese economy. Global growth in the first half of 2015 was lower than in the second half of 2014, reflecting a further slowdown in EMEs and a weaker recovery in most advanced economies.
Economic activity of advanced economies is projected to pick up modestly in the second half of 2015 and into 2016, but for emerging markets, economic growth is expected to slow again.1 In the US, economic growth was, on average, lower in the first half of 2015 compared with the second half of 2014, despite a strong rebound in the second quarter (Figure 1).
In Japan, a strong rebound in the first quarter was followed by a contraction in the second quarter due to a sharp fall in exports and private consumption expenditure, which was driven by the slowdown in emerging markets and weak compensation growth. In the euro area, preliminary second-quarter growth was somewhat weaker than expected, with unexpected negative growth reported by Germany despite stronger-than-expected growth in Italy, Ireland and Spain. In the United Kingdom (UK), the outlook for growth remains characterised by a number of opposing influences.2 While consumer spending, in particular, has been resilient, supported by a recovery in real income growth and productivity, accomodative monetary policy as well as robust business and consumer confidence, the ongoing fiscal consolidation has had a restraining influence on activity. Global growth has continued at below-average rates.
The global economic outlook has become more uncertain, driven in part by strong financial market reactions to the deteriorating outlook for the Chinese economy (see Box 1 on page 22).
In emerging markets, growth has been slowing, with marked differences across countries and regions. The slowdown reflects the impact of lower commodity prices for commodity exporters; tighter external financial conditions, particularly in Latin America and oil exporters; the rebalancing in China; structural bottlenecks; and geopolitical factors.
In South Africa, after recording positive growth rates of 4,1 per cent and 1,3 per cent (quarter on quarter, annualised and seasonally adjusted) in the fourth quarter of 2014 and the first quarter of 2015 respectively, domestic economic growth contracted by 1,3 per cent in the second quarter. The largest contributors to this contraction were the manufacturing; mining and quarrying; agriculture, forestry and fishing; and electricity industries. A combination of electricity-supply shortages, low commodity prices, weak domestic and global demand as well as widespread domestic drought conditions earlier in 2015 contributed to the pedestrian performance of the domestic economy.
The BankservAfrica Economic Transaction Index (BETI)3 for August 2015 increased for a second consecutive month compared to the year before but also pointed to a shrinking economy both in its monthly and in its quarterly changes. 1 International Monetary Fund, Global Prospects and Policy Challenges, September 2015.
2 Bank of England, ‘Monetary Policy Summary’, 8 October 2015.
3 BankservAfrica BETI, Johannesburg: BankservAfrica, 9 September 2015. The BETI is designed as an early economic scorecard which will give an overall trend in economic activity in the near term.
Percentage change
-10
-8
-6
-4
-2
0
2
4
6
8
10
Figure 1 Real economic growth in selected countries
2013 2014 2015
United States Euro area
Source: Bloomberg
United Kingdom Japan

Financial Stability Review September 20154
The Barclays Purchasing Managers’ Index (PMI)4 (seasonally adjusted) in September 2015 remained below the 50 neutral point for a second consecutive month. Moreover, the composite leading business cycle indicator of the Bank points to the continued weakening in economic conditions over the short term.5
Furthermore, short-term indicators of real economic activity (Table 1) recorded mostly negative growth in the period under review. Building plans passed and buildings completed were off to a slow start at the beginning of the year, but had, by the end of the period under review, recorded substantial growth. Retail sales were the only indicator that reflected positive growth throughout the entire first half of 2015 while wholesale trade sales experienced positive growth in only two of the six months. Both new vehicle sales and new passenger car sales recorded mostly negative growth figures throughout the first six months of the year, and continued negative growth was recorded up to August.
Table 1 Selected indicators of real economic activity1
Annual percentage change in monthly indicators
Activity indicators2015
Jan Feb Mar Apr May Jun
Building plans passed ....................... -8,35 -3,88 9,80 12,43 27,67 29,80
Buildings completed .......................... -18,54 -7,73 6,10 -10,25 39,79 29,19
Retail sales ........................................ 1,33 3,54 4,10 3,42 2,38 3,48
Wholesale trade sales ........................ -4,91 -2,25 2,36 -4,93 0,75 -1,79
New vehicle sales .............................. -1,16 1,37 1,86 -5,26 -3,47 -4,73
New passenger car sales .................. -4,14 1,71 -2,55 -2,54 -5,59 -6,61
Electric current generated .................. -1,70 -2,09 -0,24 -4,39 -3,47 -1,58
Utilisation of production capacity2...... … … 81,52 … … 80,73
1 At constant prices, seasonally adjusted2 Quarterly indicator, per cent… Denotes unavailability of data
Sources: Statistics South Africa. Data on new vehicle and new passenger car sales were obtained from the National Association of Automobile Manufacturers of South Africa.
Following actual growth of 1,5 per cent in 2014, the Bank revised downwards its estimates for growth to 1,5 per cent and 1,6 per cent for 2015 and 2016 respectively. These forecasts consider the risks to growth to be more or less balanced, taking into account the pronounced downward trend reflected by the Bank’s leading indicator of economic activity.
Unemployment
Unemployment remains one of the biggest concerns in South Africa even though it decreased to 25 per cent in the second quarter of 2015, from 26,4 per cent in the first quarter.6 Youth unemployment7 fell from 50,3 per cent in the first quarter to 49,9 per cent in the second quarter but, overall, it is still high and remains a concern.
The stability of the domestic financial system could be impeded by the high levels of unemployment, and there is a possibility that unemployment could increase further due to weak global and domestic economic growth prospects. The mining industry, unions and government have, however, signed a broad plan to stem job losses by delaying layoffs, selling distressed mining assets, and creating a development fund to assist laid-off workers.
4 Barclays PMI, Stellenbosch, October 2015.
5 South African Reserve Bank, ‘Composite business cycle indicators for South Africa’, 22 September 2015. See http://www.resbank.co.za/Publications/.
6 Statistics South Africa, Quarterly Labour Force Survey, Quarter 2, 2015.
7 ‘Youth unemployment’ refers to the unemployed between the ages of 15 and 24 years.

5Financial Stability Review September 2015
Financial market developments and trends
The sell-off of financial assets and financial market volatility
The August 2015 global financial markets sell-off happened against the backdrop of heightened financial market volatility, which increased significantly during the period leading up to the US Federal Open Market Committee (FOMC) meeting held on 15 and 16 September. Uncertainty regarding the outlook for US interest-rates was one of the main reasons for elevated levels of volatility. The normalised volatility on three-month options for US five-year interest-rate swaps, called ‘3m5y swaptions’, and the US ten-year interest-rate swaps, referred to as ‘3m10y swaptions’, increased on average by 10 basis points during the July–August 2015 period. However, from the beginning of September, volatility regarding the US interest-rate outlook began to fall as the probability of an interest-rate increase in the US Fed funds rate at the September meeting began to drop (Figure 2).
After the September FOMC meeting, the implied probability of an increase in the US Fed funds rate at the 28 October and 16 December 2015 FOMC meetings dropped to 8 per cent and 39,3 per cent respectively (Figure 3). The prospect of a start in the nomalisation of the US interest-rate in 2015 is therefore not high according to market participants. Instead, financial markets are only pricing in the probability (of higher than 50 per cent) for an increase at the March 2016 meeting.
Around the 15–16 September FOMC meeting, global sovereign credit default swap spreads increased for countries in Europe, the Middle East and Africa (EMEA), Asia Pacific and the Americas. The devaluation of the Chinese yuan and subsequent sell-off in global equity and bond markets increased the level of uncertainty. The five-year credit default swap (CDS) spreads for South Africa, Turkey, Brazil, Venezuela and Russia (Figure 4) recorded some of the most pronounced reactions to the uncertainty surrounding the US interest-rate decision. While there are country-specific reasons that may have contributed to the upward revision of risk premiums, the general effect was a jump in the spreads during that period.
Concerns about implications of the devaluation of the yuan for global economic growth, the sell-off in equities and bonds, and heightened levels of volatility across different asset classes weighed on the possibility that the Fed could postpone its first increase in the Fed funds rate. These concerns led to an outflow of capital from emerging markets as investors rebalanced their exposure from perceived riskier assets. This reaction was especially notable in the sharp increase in the three-month currency option implied in the volatility measures of certain currencies. The South African rand has been one of the more volatile currencies as a result compared with other commodity currencies (Figure 4). This could raise foreign-exchange-related risks and increase prospects of capital-flow reversals as investors become wary of exposures to volatile and vulnerable currencies.
As risk aversion increased, the US dollar appreciated against a basket of major trading currencies and against emerging-market currencies. The current wedge between the US dollar index and the index of commodity futures prices is similar to the one observed during the March 2013 and April 2014 period (Figure 6). Following the strengthening of the US dollar index, commodity prices remained on a downward spiral until bottoming
Basis point
70
75
80
85
90
95
Figure 2 Normalised volatility1 over the interest rate outlook
June July2015
August September
Normalised volatility on 3 month-options for US 10–year interest rate swap Normalised volatility on 3 month-options for US 5–year interest rate swap1 Normalised volatility, adjusted for the interest-rate struck on the swaptions, signals traders’ expectations for the fluctuations in the swap rates.
Source: Bloomberg
0
20
40
60
80
100Per cent
Implied probability of fed funds hikeas at 13 October 2015
Figure 3 Implied probability of a hike in the US Fed funds rate
28Oct
16Dec
27Jan
16Mar
27Apr
15Jun
17Jul
21Aug
02Nov
14Dec
2015 2016
Dates of US FOMC meetings
Source: Bloomberg
Basis points
100
200
300
400
500
600
200
300
400
500
600
700
Figure 4 Global credit default swap spreads and the US FOMC meeting1
Turkey Hungary Russia 1 The dotted line depicts the date of the 15–16 September FOMC meeting
Source: Bloomberg
South Africa Brazil
Jan Mar2015
May Jul Sep
(right-hand scale)

Financial Stability Review September 20156
out in January 2014. The re-establishment of a close relationship between the dollar index and the commodity futures price would require either commodity prices to rebound from current levels as they did during the 2013–14 period or the US dollar to weaken. However, in the near term it is likely that the dollar index will strengthen given the Fed’s intention to normalise interest-rates.
Financial conditions deteriorated in the US, euro area and Asia during the period under review, even as Asian stock markets fell sharply and a much more pronounced sell-off of emerging-market currencies ensued. In the US, the deterioration in financial conditions was partly captured in the sharp rise of the VIX8 and the widening of the US Baa/10-year spread by about 89 basis points in August 2015 from 222 basis points in April 2015. In the euro area, the deterioration in financial conditions was reflected in the rise in the VDAX9 volatility index and a sharp decline in the Euro Stoxx index, which fell by 20 per cent from its peak in May 2015. However, after the September FOMC meeting, there was an improvement recorded by measures of financial conditions in the US, Asia and euro area, and the global financial stress index retreated (Figure 7).
Uncertainty in the equity market spiked towards the end of August 2015 as the number of investors expecting a fall in Standard & Poor’s (S&P) 500 index increased significantly more than those expecting a rise (Figure 8). As global equity market corrections became entrenched, the high-beta index10 of shares in both the emerging and the developed economies recorded double-digit declines.
The emerging market high-beta index fell by 22 per cent from its seven-year high recorded in April 2015. Leading this decline were commodity equities that dropped 37 per cent. The South African resources index was no different and dropped 55 per cent in US dollar terms from its high recorded in July 2014 (Figure 9). Emerging markets have been affected the most by the China-led global equity market correction (see Box 1 on page 22) and by September 2015 had recorded net outflows of foreign portfolio capital for three consecutive months. For the third quarter of 2015, total outflows from emerging markets are estimated to be US$40 billion, the largest outflow since the height of the global financial crisis.11 Furthermore, during August 2015 the Morgan Stanley Capital International (MSCI) Emerging Markets Index dropped the most compared to the MSCI Developed Market Index, Euro Stoxx 50 index and the JSE All-share Index (Figure 10). In US dollar terms, the index declined by 22 per cent from its peak in April 2015. The Euro Stoxx 50 index recorded a smaller decline of 11 per cent over the same period.
Following the stock market collapse which started in China and worsened following increased levels of risk aversion associated with the devaluation of the Chinese yuan on 11 August 2015 by the People’s Bank of China, the Shanghai stock market capitalisation fell by 51 per cent to US$5 trillion in August 2015 from US$10 trillion in June 2015. Global market capitalisation recorded a 17 per cent drop (US$12 trillion) to US$60,5 trillion during the period. Likewise, the JPMorgan global bond market index fell from US$38 trillion in August 2014 to US$36 trillion in August 2015 (Figures 11 and 12).
8 The VIX is the Chicago Board Options Exchange (CBOE) volatility index, which shows the market’s expectations of volatility over a 30-day period. It is constructed using the implied volatilites of a range of S&P 500 index options.
9 The VDAX volatility index is an indication of the expected volatility of the DAX equity index over the following 30-day period.
10 The high-beta index consists of 100 stocks in the index that fluctuated the most in the previous year.
11 Institute of International Finance, ‘EM Portfolio Flows Tracker and Flows Alert ‘, September 2015.
Basis points
4
8
12
16
20
24
Figure 5 Global currency volatility
Three-month global currency option implied volatility Three-month emerging market currency option implied volatility Three-month G7 currency option implied volatility Three-month ZAR-US dollar option implied volatility
Source: Bloomberg
Jan Mar2014 2015
May Jul Sep Nov Jan Mar May Jul Sep
Indices
80
90
100
110
120
130
140
150
160
170
180 60
70
80
90
100
110
120
Figure 6 Commodity futures price and the US dollar index
Bloomberg commodity futures price index US dollar index (right-hand scale and inverted)
Source: Bloomberg
2010 2012 20132011 2014 2015
Indices
-2,5
-2,0
-1,5
-1,0
-0,5
0,0
0,5
1,0
-0,1
0,0
0,1
0,2
0,3
0,4
0,5
0,6
Figure 7 Global financial stress index and financial conditions index
EU financial conditions index United States financial conditions index Asia ex-Japan financial conditions index BofA Merril Lynch global financial stress index (right-hand scale)
Source: Bloomberg
Jan Mar2015
May Jul Sep

7Financial Stability Review September 2015
Persistently low oil prices and the global inflation outlook
Weak global demand and the fall in commodity prices, including a sharp decrease in the price of oil supported by a strong US dollar, coupled with increased global oil production, are expected to exert continued downward pressure on global inflation (Figure 13). This could put a ceiling on nominal interest-rates as deflation threats remain a risk in some advanced economies such as Japan and the euro area. Since 2006, the price of oil has established a close positive correlation with global inflation rates. The price of Brent crude oil fell by more than 50 per cent from its June 2014 high of US$105 per barrel to US$47 per barrel in July 2015 (Figure 14). The last time that the oil price recorded a similar trend was during the 2008 global financial crisis.
Data compiled by the US Department of Energy show a steady increase in the global supply of oil since 2013. The prospect of a removal of sanctions on Iran is expected to contribute to continued low global oil prices. Furthermore, support for such low oil prices also comes from speculators who continue to hold a dim view on future energy prices. Speculators’ net long positions in Brent crude oil declined by more than 60 per cent in August 2015 from the high level recorded in May 2015 (Figure 15).
Persistent low oil prices are expected to have a negative effect on the fiscal revenue of oil-exporting countries while benefiting oil-importing countries. Previously, the IMF highlighted the risks to the banking systems of oil- exporting nations associated with persistent low oil prices. The IMF indicated that the impact of lower oil prices on oil exporters’ banking systems was likely to be muted in the near term, but downside risks were likely to increase over time as low oil prices became entrenched. Second-round effects of lower oil prices on economic activity could weaken banks’ asset quality, liquidity and profitability, but the speed of adjustment is likely to vary across countries.12
Banks and bank-lending conditions
Bank-lending conditions in emerging markets continued to tighten in the second quarter of 2015, albeit at a more moderate pace. While loan demand picked up, supply-side conditions deteriorated as bank funding conditions worsened and non-performing loans accelerated. This led banks to tighten credit standards for new loans. The composite index for emerging-market bank-lending conditions increased slightly in the second quarter but stayed below the threshold of 50, implying that bank-lending conditions continued to tighten. According to the Institute of International Finance (IIF), some improvement on the demand side was largely offset by a deterioration on the supply side.13
In South Africa, the five largest banks continued to hold over 90 per cent of total banking-sector assets in the year to June 2015 (Table 2). The Herfindahl–Hirschman Index (H-index) confirmed the continued high level of concentration in the domestic banking sector. Total banking-sector assets continued to increase during the first half of 2015 with the growth rate accelerating to 10,2 per cent year on year by the end of June 2015 (January 2015: 7,4 per cent), mainly driven by increases in gross loans and advances as well as investment and trading securities (Figure 16). Gross loans and advances increased by 8,9 per cent at the end of June 2015 (January 2015: 7,9 per cent) due to increases in term loans and ‘other’ loans and advances.
12 IMF Regional Economic Outlook Update, ‘Learning to live with cheaper oil amid weaker demand’, January 2015. See http://www.imf.org/external/pubs/ft/reo/2015/mcd/eng/pdf/mreo0115.pdf.
13 Institute of International Finance, ‘Emerging Markets Bank Lending Conditions Survey’, 2015 second quarter.
Ratio Index
0,3
0,4
0,5
0,6
0,7
0,8
0,9
1,0
1,1
1600
1700
1800
1900
2000
2100
2200
Figure 8 Risk aversion in the equity market
S&P 500 index 10 per cent moving average (CBOE equity put/call ratio) CBOE equity put/call ratio (right-hand scale)
Source: Bloomberg
Jan Mar2014 2015
May Jul Sep Nov Jan Mar May Jul Sep
Indices
30
40
50
60
70
80
90
100
110
120
130
Figure 9 Commodity-led equity market correction
S&P 500 index S&P 500 high-beta index Bloomberg commodity index Emerging Market high beta index JSE all share index JSE RES120 index
Source: Bloomberg
2014 2015
Indices
100
150
200
250
300
Figure 10 Global market equity indices
S&P 500 index Euro Stoxx 50 JSE all share index MSCI emerging market index JMSCI developed market index
Source: Bloomberg
2012201120102009 2013 2014 2015

Financial Stability Review September 20158
The banking sector remained sound and adequately capitalised. The banking sector’s total capital-adequacy ratio (CAR) remained well above the regulatory requirement of 10 per cent but dropped slightly from 14,53 per cent in January 2015 to 14,35 per cent in June (Figure 17). Similarly, the tier 1 and the common equity tier 1 (CETI) CARs dropped from 11,77 per cent to 11,56 per cent and from 11,31 per cent to 11,12 per cent respectively over this period. Figure 18 shows the relative positions of all banks in South Africa in terms of capital adequacy and also presents the extent to which banks hold capital in addition to the minimum regulatory requirement of 10 per cent.
Table 2 Selected indicators of the South African banking sector1
Per cent, unless indicated otherwise
2015
Jan Feb Mar Apr May Jun
Market share (top five banks) ............... 90,16 90,39 90,25 90,51 90,32 90,20
Gini concentration index ...................... 82,50 82,56 82,52 82,60 82,48 82,34
Herfindahl–Hirschman Index (H-index) .............................................. 0,183 0,184 0,183 0,183 0,182 0,182
Banks’ share prices (year-on-year percentage change) ............................. 34,65 36,22 36,65 36,46 26,12 18,67
Capital adequacy
Total capital adequacy ratio ................. 14,53 14,28 14,12 14,06 14,25 14,35
Tier 1 capital adequacy ratio ............... 11,77 11,56 11,44 11,42 11,54 11,56
Common equity tier 1 capital adequacy ratio..................................... 11,31 11,11 11,00 10,98 10,09 11,12
Credit risk
Gross loans and advances (R billions) ............................................ 3 253,6 3 303,7 3 367,7 3 357,6 3 389,6 3 441,3
Impaired advances (R billions)2 ............ 106,7 106,8 108,0 108,3 110,4 112,0
Impaired advances to gross loans and advances ............................ 3,28 3,23 3,21 3,22 3,26 3,25
Specific credit impairments (R billions) ............................................ 52,1 52,2 53,1 53,0 52,9 52,1
Specific credit impairments to impaired advances .............................. 48,88 48,92 49,19 48,95 47,93 46,48
Specific credit impairments to gross loans and advances ................... 1,60 1,58 1,58 1,58 1,56 1,51
Profitability
Return on assets (smoothed)............... 1,09 1,11 1,16 1,17 1,16 1,19
Return on equity (smoothed) ............... 14,85 15,18 15,90 16,08 15,98 16,34
Interest margin to gross income (smoothed) .......................................... 55,72 55,40 55,38 55,27 55,52 55,35
Operating expenses to gross income (smoothed) .................... 54,42 54,07 54,33 54,49 54,67 54,97
Liquidity
Liquid assets to total assets (liquid-asset ratio) ................................ 9,08 9,15 8,98 9,21 9,36 9,50
Liquid assets to short-term liabilities ............................................... 17,77 17,69 17,25 18,05 18,40 18,29
Liquidity coverage ratio (LCR) .............. 76,89 77,85 79,57 80,72 83,29 87,14
Effective net open foreign-currency position to qualifying capital and reserve funds ....................................... 0,57 0,51 0,53 0,81 0,91 0,74
1 Data were updated on 30 June 2015 2 Impaired advances are advances in respect of which the bank has raised a specific impairment.
Sources: South African Reserve Bank. Data on share prices were obtained from JSE Limited.
US dollar trillion
Source: Bloomberg
US dollar trillion
34
35
36
37
38
39
Figure 11 and 12 Global equity market capitalisation and bond market value
World stock market China stock market capilisation (right-hand scale)
34567891011
596163656769717375
JP Morgan global bond market value index
2014
2014
2015
2015
Per cent US dollar per barrel
30
60
90
120
150
0
1
2
3
4
5
6
7
8
Figure 13 Low global inflation and fall in the oil price
Global inflation rate Average ten-year nominal interest rate (UK, US, France and Germany) Oil price (right-hand scale)
Source: Bloomberg
2012201020082006 2015
US dollar per barrel Millions of barrels per day
28,0
28,5
29,0
29,5
30,0
30,5
31,0
31,5
32,0
32,5
40
60
80
100
120
140
160
Figure 14 OPEC crude oil output and Brent crude oil price
Brent crude oil price OPEC crude oil output (right-hand scale)
Source: Bloomberg
2013201120092007 2015

9Financial Stability Review September 2015
Banking-sector profitability, as measured by the return-on-equity (ROE) ratio (smoothed), improved from 14,85 per cent in January 2015 to 16,34 per cent in June (Figure 19). Net interest income remained the largest contributor to total income at 55 per cent in June 2015. The cost-to-income ratio (or efficiency ratio), an indication of the portion of operating expenses used to generate operating income, deteriorated marginally over this period from 54,42 per cent in January to 54,97 per cent in June 2015. Staff expenses remained the largest component of operating expenses at 56,7 per cent in June 2015. Most banks, including the five biggest banks, recorded ROEs that were higher than the domestic inflation rate as measured by the consumer price index, implying positive real returns for investors (Figure 20).
Gross loans and advances remained the largest component of the banking sector’s assets at 75,8 per cent at the end of June 2015. Impaired advances, an indicator of the banking sector’s credit risk, increased from R106,7 billion in January 2015 to R112 billion in June (Figure 21). The ratio of impaired advances to gross loans and advances as well as specific credit impairments remained relatively unchanged over this period.
A credit analysis of the loan books of the five largest banks indicates a slight increase in impaired advances from R79,6 billion in January 2015 to R81,8 billion in June (Figure 22), but this is in line with the moderate increase from 7,9 per cent to 8,6 per cent in the total loan book over the same period.
Banks’ main source of funds remained deposits, which in June 2015 constituted about 88 per cent of banks’ total liabilities (Figure 23). Of these deposits, about 42,7 per cent originated from corporates and about 24,1 per cent from retail customers. While most banking-sector assets have long-term maturity durations, these are funded mainly by liabilities with short contractual terms.
To promote the short-term resilience of the liquidity risk profile of banks, one of the requirements of Basel III14 is to ensure that banks have adequate stock of unencumbered high-quality liquid assets (HQLAs) available that can be converted easily and immediately into cash. This requirement, the ‘liquidity coverage ratio’ (LCR), came into effect in South Africa on 1 January 2015 with the minimum set at 60 per cent and to then be phased in with equal annual increments of 10 percentage points to reach 100 per cent by 1 January 2019.15 Currently, the banks recorded an LCR of 87,14 per cent
Interbank loans are among the most vital interconnections between banks in addressing liquidity needs. In well-functioning interbank markets, banks with excess liquidity provide loans to banks with a demand for liquidity, usually on a short-term basis and without underlying collateral. This interconnection therefore leads to enhanced liquidity allocation in the banking system. However, due to increased risk-sharing in the banking system, monitoring and understanding this network structure has also become increasingly important.
A methodology for analysing the network structure of the South African interbank market was elaborated on in the March 2011 Financial Stability Review. The network systemic index (NSII) for the interbank market of South African banks is the sum of three (normalised) subcomponents: (i) the size of the bank’s interbank liabilities; (ii) its interconnectedness or the
14 Basel Committee on Banking Supervision, ‘Basel III: international framework for liquidity risk measurement, standards and monitoring’, December 2010.
15 Also see ‘The committed liquidity facility available to banks’, Financial Stability Review, September 2012: 47 for a discussion of the LCR requirements.
Thousand contracts
0
50
100
150
200
250
300
350
400
Figure 15 CFTC net-long positions in the price of Brent crude oil
Source: Bloomberg
2014 2015
500
1000
1500
2000
2500
3000
3500
4000
4500
5000
Total assets Gross loans and advances Growth in total assets (right-hand scale) Growth in gross loans and advances (right-hand scale)
R billions
0
2
4
6
8
10
12
14
16
18
20
Figure 16 Total banking sector assets
2013 2014 2015
0
2
4
6
8
10
12
14
16
18
Common equity tier 1 capital adequacy ratio Tier 1 capital adequacy ratio Total capital adequacy ratio Minimum common equity tier 1 capital adequacy ratio (6,5 per cent) Minimum tier 1 capital adequacy ratio (8,0 per cent) Minimum total capital adequacy ratio (10,0 per cent)
R billions
Figure 17 Capital adequacy
2013 2014 2015

Financial Stability Review September 201510
‘node in-degree’ of the bank; and (iii) a node’s ‘betweenness’, which is the number of shortest paths between any other two nodes in the network that pass through the node in question. The methodology uses actual exposures of banks obtained from the South African Multiple Option Settlement (SAMOS) system.
The results for the NSII of three groups of South African banks are shown in Figure 24. The first group consists of ‘large’ banks and includes all banks that had a network systemic importance index smaller than 2 in June 2010. Banks with an index between 0,5 and 2 are classified as the ‘medium’ group. All other banks are defined as ‘small’. The increase in the NSII observed from January 2013 was driven by an increase in the size of interbank loans in addition to the betweenness of large banks. An increase in betweenness centrality is due to the fact that more liquidity flows are going through a specific node; large banks have thus become more central in the intermediation network (i.e. they facilitate more liquidity exchange between the smaller banks that do not lend to one another directly). Interconnectedness of medium banks declined between 2007 and 2011 but has remained relatively constant since then (see Box 2 on page 23).
In addition to the above analysis of the banking sector, the Bank also utilises stress testing as an additional tool to evaluate the soundness of the banking sector. In discharging the new financial stability responsibilities of the Bank, the Financial Stability Committee (FSC) of the Bank has instructed the Financial Stability Department to conduct stress-testing exercises on a regular basis. These exercises will be coordinated with the Bank Supervision Department, being the microprudential regulator in South Africa. In addition, the outcome of these exercises will also serve as inputs in the monitoring of systemically important financial institutions (SIFIs) and financial market infrastructures. The results of these exercises will also be communicated in future editions of the Financial Stability Review.
Non-bank financial institutions
Pension and provident funds
Pension and provident funds play a crucial role in the process of financial intermediation. For example, their holdings of fixed-interest securities and ordinary shares represent an important part of their connectedness with the rest of the financial system and, as such, represent some of the channels through which risks may spread in the financial system. In terms of assets, the size of the pension and provident funds industry (including both official and private self-administered funds) increased by 10,8 per cent year on year in 2014 (Figure 25).
The penetration rate of the pension and provident funds industry (including both official and private self-administered funds) increased somewhat in 2014 compared to the previous year. This ratio is calculated as the total size of assets over gross domestic product (GDP) and gives an indication of the relative wealth accumulated by the sector (Figure 26).
Overall, the investment allocation of the pension and provident funds industry (including both official and private self-administered funds) remained broadly unchanged in 2014 (Figure 27). Ordinary shares and government bonds accounted for the highest share in the portfolio investment allocation of pension funds.
Small banks Five biggest banks
R billions
Figure 18 Capital adequacy by bank: June 2015
0 5 10 15 20 25 30-20
0
20
40
60
80
100
120
-150
-100
-50
0
50
100
150
200
250
-150
-100
-50
0
50
100
150
200
250
Net interest income Net fee and commission income Other income Staff expenses Other expenses Return on equity (smoothed) (right-hand scale)
R billions Per cent
0
2
4
6
8
10
12
14
16
18
20
Figure 19 Profitability
2013 2014 2015
Small banks Five biggest banks
Figure 20 Return on equity (smoothed) by bank: June 2015
0 5 10 15 20 25 30-30
-20
-10
0
10
20
30
40R billions

11Financial Stability Review September 2015
Insurance sector
During the second quarter of 2015, the life insurance industry experienced growth in share prices, increasing by an average annual rate of 16,4 per cent. The assets of the industry increased at an annual rate of 5,4 per cent in the second quarter, down from 9,7 per cent during the previous quarter. Compared to the size of the domestic economy, the total assets of life insurers amounted to 62,2 per cent of South Africa’s annual GDP.
Table 3 Spread and categorisation of assets of primary long-term insurers (excluding professional reinsurers and insurance companies in runoff)
Kinds of assets
12 months ended December 2013
12 months ended December 2014
6 months ended June 2015
R millions Per cent R millions Per cent R millions Per cent
Cash and deposits 193 901 9 186 022 7 209 570 8
Government and semi-government 178 194 8 190 478 8 202 666 8
Equities and collective investment schemes 1 470 533 65 1 637 469 65 1 668 389 64
Debentures and loan stock 215 743 9 257 257 10 275 153 11
Immovable properties 49 571 2 49 473 2 51 602 2
Fixed assets ....... 2 367 0 2 153 0 2 184 0
Debtors .............. 133 930 6 147 790 6 161 868 6
Other assets ....... 33 909 1 34 007 1 33 972 1
Total ................... 2 278 148 100 2 504 650 100 2 432 454 100
Percentages might not add up to 100 due to rounding.
Source: Financial Services Board
While long-term insurers have benefited from strong investment market performance over the past few years, the outlook in South Africa remains challenging. The biggest risk facing the long-term insurance sector is market risk since more than half of its assets are invested in equities. A large portion of these equity investments, however, relates to linked business where the policyholders carry the risk but also benefit from the gains.
Long-term primary insurers16 maintained adequate capital buffers. Most long-term insurance companies were covered by a free assets-to-capital-adequacy requirement – also referred to as CAR cover – of 2–5 times (Table 4). Any insurer with a CAR cover below 1 is investigated and corrective measures are taken by the Registrar of Long-term Insurance. There is currently only one of the smaller insurers with a CAR cover below 1.
16 The primary long-term insurance industry includes typical insurers, niche insurers, cell captive insurers, linked investment insurers and assistance insurers, but excludes reinsurers.
0
20
40
60
80
100
120
Impaired advances Impaired advances to gross loans and advances (right-hand scale)
3,0
3,5
4,0
4,5
5,0
5,5
Figure 21 Impaired advances: Total bank sector
2013 2014 2015
R billions Per cent
72
74
76
78
80
82
84
86
88
90
92
Impaired advances Impaired advances to gross loans and advances (right-hand scale) Growth in gross loans and advances (year on year) (right-hand scale)
0
2
4
6
8
10
12
Figure 22 Credit risk of the five biggest banks
2013 2014 2015
R billions Per cent
0
500
1 000
1 500
2 000
2 500
3 000
3 500
4 000
Sovereigns Other Public sector and local authorities Banks and securities firms Retail customers Corporate customers
Figure 23 Sources of deposits
2013 2014 2015
R billions
Table 4 Free assets-to-capital-adequacy requirement of all primary long-term insurers1
Number of insurers
12 months ended
Dec 2013
12 months ended
Dec 2014
6 months ended
June 2014
6 months ended
June 2015
Covered 0–1 time .................. 0 2 1 1
Covered 1–2 times ................ 19 23 16 19
Covered 2–5 times ................ 32 30 38 33
Covered 5–10 times .............. 11 6 9 11
Covered 10+ times ............... 3 6 4 4
Source: Financial Services Board

Financial Stability Review September 201512
In June 2015, the net premiums of the short-term typical insurers increased by 17 per cent when compared to June 2014. The biggest contribution to total net premiums of the primary short-term insurers came from motor vehicle insurance (43 per cent), followed by property insurance (32 per cent).
Underwriting results (where underwriting profit is expressed as a percentage of net written premiums) for the primary short-term insurers17 sector increased to 15 per cent in the second quarter of 2015 (Figure 28).
Confidence in the financial services sector
According to the EY Financial Sector Survey, sentiment in the financial services industry continued to improve in the first half of 2015, following a marked improvement in the Financial Services Index to 66 index points in the fourth quarter of 2014 (Table 6). Life insurers remained the most optimistic of the financial services segments but the improvement in confidence in the second quarter of 2015 was also supported by a marked increase in the confidence of asset managers. The increase in confidence of asset managers was almost entirely attributed to a large asset management firm18 that reported positive net inflows, modest income growth, contained cost increases and a slight improvement in net profit growth.
Table 6 EY Financial Services Index and its components
2013 2014 2015
3rd qr 4th qr 1st qr 2nd qr 3rd qr 4th qr 1st qr 2nd qr
EY Financial Services Index .............. 69 72 67 61 58 66 73 77
Retail banking ................................ 25 30 38 46 50 60 74 67
Investment banking and specialised finance ........................ 93 82 73 69 64 89 82 75
Asset management ....................... 92 96 77 66 52 33 45 74
Life insurance ................................ 67 80 79 64 67 81 92 93
Source: EY
17 Primary short-term insurers include typical insurers, niche insurers, cell captive insurers and captive insurers, but exclude reinsurers.
18 ‘Large asset managers’ refers to firms with funds under management in excess of R40 billion in 2013.
Table 5 Performance indicators for primary short-term insurers
Performance indicators12 months ended
Dec 201312 months ended
Dec 20146 months ended
June 2015
Net premium increase (year-on-year percentage change) ...............
6 11 17
Loss ratio* ................................................... 58 60 53
Combined ratio# .......................................... 83 83 76
Management expenses** ............................. 23 24 23
Commission** .............................................. 7 7 6
Underwriting profit/loss ratio** ..................... 9 9 15
Underwriting and investment income ratio** ..............................................
17 17 23
Capital-adequacy ratio cover (median) ......... 2,7 2,3 2,2
* Expressed as a percentage of net earned premium during the period.** Expressed as a percentage of net written premium during the period.# Claims plus commission plus expenses less total investment income as a percentage of net earned premium.
Source: Financial Services Board.
0
2
4
6
8
10
Small
Figure 24 Network systemic index for the interbank market
20092007 20132011 2015
Medium Large
Indices
0
500
1 000
1 500
2 000
2 500
3 000
3 500
Total assets Year-on-year growth (right-hand scale)
0
2
4
6
8
10
12
14
16
18
20142013201220112010
Figure 25 Total assets of pension fund industry
Rand billion Per cent
2014201320122011201060
65
70
75
80
Figure 26 Penetration rate (total assets as a percentage of gross domestic product)
Per cent

13Financial Stability Review September 2015
Shadow banking
Growth in the shadow-banking industry needs to be balanced with the needs of South Africa as an emerging market that has to improve on financial inclusion and increase access to finance. Given these needs, growth in shadow-banking activities could therefore provide broader access to finance to more people and thereby also contribute to economic growth. Growth in credit extension by non-bank financial intermediaries has remained moderate over the past few years, growing at roughly the same pace as credit extension by banks (Figure 29).
South Africa again participated in the annual Financial Stability Board’s shadow-banking monitoring exercise. In addition to the annual monitoring exercise, South Africa also participated in an information-sharing exercise and a peer review. The annual monitoring exercise comprised the broad measure of the shadow-banking system in South Africa. The results showed that assets held by other financial intermediaries (OFIs) (the broad measure for shadow banks) continued to increase at a faster pace than those of banks, pension funds and insurance companies during the period under review (Figure 30). In 2014, the assets held by OFIs increased to 18,8 per cent (from 13,4 per cent in 2008) of financial intermediaries’ assets in South Africa, while banks’ assets decreased to 33,5 per cent (from 43,0 per cent in 2008).
The broad shadow-banking measure consists of unit trusts (including money-market funds (MMFs)), finance companies, structured finance vehicles, hedge funds, real-estate investment trusts, trust companies and participation bond schemes. Unit trusts, excluding MMFs have been one of the fastest-growing subcomponents of OFIs over the past few years. These funds typically have large exposures to the equity market, and hence valuations play an important role when estimating their asset size. By using the annual returns of unit trusts as well as their asset holdings on an individual fund level, the asset values of unit trusts excluding valuation effects were calculated from 2009 onwards. The balance sheets of insurance companies and pension funds were also scrutinised, and similar valuation adjustments were made to take exposures to unit trusts and to the equity market directly into account.
When excluding valuation effects (i.e. equity market performance and the returns on unit trust funds from the asset values of unit trust funds, pension funds and insurance companies), the distribution of assets among financial intermediaries in South Africa changes significantly. The asset holdings of OFIs excluding valuation effects remained more or less constant as a percentage of financial intermediaries’ assets between 2008 and 2014, at about 14 per cent. Furthermore, the decrease in banks’ share of assets also then appears less severe than the results shown in Figure 30, decreasing from 43 per cent to 36 per cent over the same period.
While the broad conservative estimate ensures that data gathering and surveillance cover the areas where shadow banking-related risks might arise, the narrower measure of shadow banking is constructed by filtering out non-bank financial activities that have no direct relation to credit intermediation or that are already prudentially consolidated into banking groups. By focusing on the underlying economic functions or activities rather than legal forms, shadow-banking activities in non-bank financial entities can be assessed more consistently.
201420132012201120100
20
40
60
80
100
Government bonds Public enterprise securities Private sector securities Ordinary shares Cash and deposits Other assets
Figure 27 Investment allocation of pension funds
Per cent
2015201320112010200720055
10
15
20
25
30
Underwriting profit ratio Underwriting and investment income ratio* June 2015
Source: Financial Services Board
Figure 28 Underwriting results of primary short-term insurers
Per cent
*
*
0
10
20
30
40
50
60
70
80
90
100
Ratio of credit by banks to total private sector Ratio of credit by non-bankfinancial institutions to total private sector Total credit extended by private sector (right-hand scale)
0
500
1 000
1 500
2 000
2 500
3 000
3 500
Figure 29 Compostition of credit extension in South Africa by source
2007 2009 2011 2013 2015
Per cent Rand billions

Financial Stability Review September 201514
During the information-sharing exercise, the broad measure of shadow banking (OFIs) was narrowed to arrive at a measure of shadow banking based on economic activities. More than 50 per cent of OFIs were not classified and therefore do not form part of the narrow shadow-banking measure. As a percentage of total assets, the share of shadow banking’s assets (the narrow measure) dropped significantly from 18 per cent of total financial assets (broad measure) to 8 per cent in 2014 (Figure 31). The majority of OFIs that were classified were grouped into Economic Function 1 (the management of collective investment vehicles with features that make them susceptible to runs) and Economic Function 2 (loan provision that is dependent on short-term funding). The five economic functions that were used are set out in Table 7. The asset share of shadow-banking entities as a percentage of total assets of financial intermediaries has remained relatively constant since 2008 at less than 10 per cent.
Non-financial institutions
Growth in credit extension to the domestic non-financial corporate sector moderated to 11,1 per cent in the second quarter of 2015 but was in line with slower economic growth (credit as a percentage of GDP) reported for
Table 7 Classification by economic function
Economic function Definition Typical entity types*
EF1Management of collective investment vehicles with features that make them susceptible to runs
Fixed income funds, mixed funds, credit hedge funds
EF2Loan provision that is dependent on short-term funding
Finance companies, leasing companies, consumer credit companies
EF3
Intermediation of market activities that is dependent on short-term funding or on secured funding of client assets
Broker-dealers
EF4 Facilitation of credit creation Insurance companies
EF5Securitisation-based credit intermediation and funding of financial entities
Securitisation vehicles
Per cent
0
10
20
30
40
50
Figure 31 Distribution of total assets between financial intermediaries in South Africa: narrow measure of shadow banking
SARB Insurance companies Public financial institutions OFIs – Not classified
Source: South African Reserve Bank
2012201020082006 2015
Banks Pension funds OFIs – Classified
Table 8 Selected indicators for the corporate sector
Annual percentage change, unless indicated otherwise
Performance indicators2014 2015
2nd qr 3rd qr 4th qr 1st qr 2nd qr
Bank credit granted1 ...................................... 13,8 15,1 13,2 13,9 11,1
Gross fixed capital formation2 ......................... 7,7 2,8 1,6 5,1 6,2
Credit as a percentage of GDP....................... 39,2 40,5 40,1 42,7 42,9
Credit as a percentage of annualised profits3 .......................................... 167,7 185,0 205,4 220,7 190,7
Net operating surplus4 .................................... -1,5 3,5 -4,3 -9,1 -2,2
Deposits ......................................................... 6,2 11,6 7,7 9,5 11,3
1 Bank credit to the corporate sector in this case includes instalment sale and leasing finance, mortgage advances, overdrafts, credit card debtors, and other loans and advances.
2 At current prices (seasonally adjusted).3 Bank credit to the corporate sector and net operating surpluses of corporations were used as proxies for corporate
debt and for corporate profits respectively.4 Gross operating surplus minus depreciation (seasonally adjusted rates).
Source: South African Reserve Bank
Per cent
0
10
20
30
40
50
Figure 30 Distribution of total assets between financial intermediaries in South Africa: broad measure of shadow banking
SARB Insurance companies Public financial institutions
Source: South African Reserve Bank
2012201020082006 2015
Banks Pension funds OFIs

15Financial Stability Review September 2015
this period (Table 8). Growth in credit to domestic firms was driven mainly by loans for investment as well as other loans and advances. Deposits by the corporate sector increased by 11,3 per cent year on year in the second quarter of 2015 from 9,5 per cent in the first quarter.
Corporate-sector profits, as measured by the net operating surplus, continued to contract in the period under review. The ongoing contraction in corporate-sector profits is a result of increased average unit costs as higher electricity tariffs, continued load-shedding and lower economic growth weighed on profits. The contraction in profits in the first half of the year had an adverse effect on the corporate sector’s ability to meet its debt obligations, as shown by the Experian Business Debt Index (BDI)19 (Figure 32). This suggests that, while the financial health of the corporate sector is still improving, the rate at which it is doing so has slowed markedly. Growth in gross fixed capital investment (at current prices) by the corporate sector, however, rose sharply in the period under review from 1,6 per cent in the fourth quarter of 2014 to 5,1 per cent and 6,2 per cent in the first and second quarters of 2015 respectively. According to the Bureau for Economic Research (BER),20the acceleration in investment has not been aimed at capacity expansion but rather at purchasing machinery and equipment in order to replace existing capacity and to build inventories.
Table 9 Business confidence index1
Indices2014 2015
1st qr 2nd qr 1st qr 2nd qr 3rd qr
Business confidence index ........................... 46 51 49 43 38
New vehicle dealers’ confidence ................ 28 30 44 23 27
Retail traders’ confidence ........................... 60 55 60 52 34
Wholesale traders’ confidence .................... 59 60 61 64 50
Building contractors’ confidence ................ 53 66 49 48 45
Manufacturers’ confidence ......................... 28 42 30 29 34
1 The business confidence level is measured on a scale of 0 to 100, where 0 indicates ‘an extreme lack of confidence’, 50 ‘neutral’ and 100 ‘extreme confidence’.
Source: Bureau for Economic Research, Stellenbosch University
Business confidence continued to deteriorate, falling by 5 index points to 38 index points in the third quarter of 2015 (Table 9). This indicates that less than 40 per cent of the firms surveyed are satisfied with the current business conditions. The fall in the business confidence index was driven by marked decreases in the retail traders’ and wholesale traders’ subcomponents, falling by 18 index points and 14 index points respectively in the third quarter of 2015. Weak domestic economic conditions, slower demand growth, moderating wage inflation, higher tax rates and rising interest-rates affected consumer confidence and led to lower sales volumes and profitability in the retail sector. Wholesale traders’ confidence was also negatively affected by dwindling sales volumes. On the upside, increased export sales volumes, which rebounded following a depreciation of the rand, increased confidence among manufacturers. While new vehicle dealers’ confidence also increased in the third quarter, the confidence index remained well within negative territory at 27 index points.
19 The Experian Business Debt Index is a measure of the debt stress experienced by domestic corporates.
20 Bureau for Economic Research, ‘Manufacturing Survey’, Stellenbosch: Bureau for Economic Research, June 2014.
0
5
10
15
20
25
30
35
40
45
Non-financial corporates’ international debt securities Non-financial corporates domestic debt securities Experian BDI (right-hand scale)1 For the Experian Business Debt Index 0 is the base, > 0indicates improving business conditions and < 0 showsdeteriorating business conditions.Sources: Bank for International Settlements and Econometrix
-3,0
-2,5
-2,0
-1,5
-1,0
-0,5
0,0
0,5
1,0
Figure 32 Non-financial corporates’ domestic debt securities, international debt securities and the Experian Business Debt Index1
2005 20092007 2011 2013 2015
US dollar billions Index

Financial Stability Review September 201516
Since the first quarter of 2014, there has been a marked decrease in the issuance of both domestic and international debt securities by South African non-financial corporates (Figure 33). The issuance of international debt securities has decreased at a faster rate than its domestic counterpart. International debt issuances continue to make up an increasing proportion of total debt issuances. This reflects the growing importance of access to international markets for corporate financing but also the increased exposure that South African corporates have to any international shocks.
The recent decrease in the issuance of debt securities is to be expected given the weakness of the rand, but possible domestic and international interest-rate increases could also increase the burden of servicing such debt. The adverse effects of the deterioration of domestic and international conditions have impacted on corporates’ ability to service debt. This has been shown by the decrease in the BDI since the first quarter of 2014. Currently at 0,2 index points, South African non-financial corporates are moving closer to facing deteriorating business conditions, according to the BDI.
South Africa’s non-financial corporates have been decreasing their capital investment (in nominal terms) since the 2008 global financial crisis (Figure 33). Mostly funded through debt accumulation,21 corporate capital investment has nevertheless grown much slower than corporate debt. As a result, gross capital formation as a percentage of total domestic corporate debt decreased to 32 per cent in the second quarter of 2015 from its recent peak of 36 per cent in the last quarter of 2013. Should this trend continue, it could become increasingly difficult in future for corporates to service their growing debt burden given the rising level of corporate debt and an increased interest-rate environment.
The interest coverage ratio (ICR) can be used as an indicator to estimate a firm’s ability to generate sufficient cash flows to finance its interest expenses on outstanding debt. According to a benchmark set by the IMF, ‘weak firms’ are identified as those with an ICR below 2. The results of this measure for South African corporates show that the ICR of South African corporates increased to a level of 5 (Figure 34). This indicates that, on an aggregate level, South African corporates still generate enough cash to service these commitments.
However, at an economic industry level (Figure 35), the ICR of the electricity, gas and water supply industry as well as the mining and quarrying industry were, in the first quarter of 2015, below the IMF benchmark. Furthermore, while corporates in most industries are generally able to cover their interest expense, the majority had lower ICRs in the first quarter of 2015 compared to the fourth quarter of 2014. Therefore, while these corporates have generated enough cash to service their debt, they seem to be more constrained as the subdued domestic and international economic growth prospects negatively affected net profits.
The expected default frequency (EDF) of a firm measures the probability that a firm will default within a given time horizon by failing to make an interest or principal payment. Higher market values serve as an incentive and generate the ability for equity holders to pay the debt obligations of a firm by selling its assets to raise cash or by issuing additional debt or equity.
21 Bank credit to corporates and domestic corporate bond issuances were used as proxies due to data constraints.
30
32
34
36
38
40
42
Gross fixed capital formation to total debt ratio Total corporate domestic debt (right-hand scale) Gross fixed capital formation (right-hand scale)
-20
-10
0
10
20
30
40
Figure 33 Non-financial corporates investment and total domestic corporate debt
2006 20102008 2012 2015
Per cent Annual percentage change
1
2
3
4
5
All industries IMF benchmark1 Excluding public administration, defence activities and education
Sources: Statistics South Africa and International Monetary Fund
Figure 34 Non-financial corporate sector: Aggregate interest-coverage ratio1
2010 2011 2012 2013 2014 2015
Interest coverage ratio
2014 Q3 2014 Q4 2015 Q1 IMF benchmark1 Excluding public administration, defence activitiesand education
Source: Statistics South Africa
Personal services
Trade
Manufacturing
Construction
Business services
Transport, storage andcommunication
Mining and quarrying
Electricity, gas andwater supply
0 1 2 3 4 5 6 7 8 9 10 11 12
Figure 35 Non-financial corporate sector: Industry interest-coverage ratio1
Interest-coverage ratio

17Financial Stability Review September 2015
Therefore, the value of the firm’s assets and liabilities drives the EDF of that firm. The majority of South African corporates (just over 70 per cent of the 219 companies included in the portfolio) have EDFs below 3 per cent (Figure 36), meaning that there is a less than 3 per cent chance that these corporates will not be able to honour their debt obligations in the following year. Furthermore, 9,13 per cent of South African corporates have an EDF above 10 per cent, with four corporates having an EDF higher than 30 per cent. South African non-financial corporates have an average one-year EDF of 3,33 per cent,22 up from 2,95 per cent in March 2015, which shows some deterioration in the debt-servicing ability during the period under review.
Households
Growth in credit extended to households moderated in the first half of 2015 (Table 10). The slowdown in credit extended was driven by a deceleration in the growth rate of credit card advances, instalment sales as well as leasing finance loans, which is a reflection of generally weaker economic conditions. Household disposable income growth has moderated since the second half of 2014. This moderation is in line with the BankServAfrica Disposable Salary Index, which shows that disposable salaries increased by only 6,3 per cent in the first six months of 2015 – slower than the 8,3 per cent increase experienced in the first six months of 2014. The slowdown was affected by lower inflation, higher personal tax deductions and medical insurance payments. The weaker growth in disposable income was further reflected in the continued fall in savings by households as well as a slowdown in consumption expenditure during the first half of 2015.
22 As measured at 9 September 2015.
30.01– 50
10.01–30
3.01–10
1.01– 3
0.31–1
0.11– 0.3
0.031– 0.1
0.011– 0.03
0
5
10
15
20
Source: Moody’s Analytics; CreditEdge
Figure 36 Non-financial corporate sector: EDF distribution of South African incorporated firms
Percentage of population
4
6
8
10
12
14
16
18
Prime lending rate Debt-service cost to disposable income Household debt to disposable income (right-hand scale)Source: South African Reserve Bank
Per cent
50
55
60
65
70
75
80
85
90
Figure 37 Prime lending rate, household debt to disposable income and debt servicing cost to disposable income
2000 2002 2004 2006 2008 2010 2012 2015
Table 10 Selected indicators for the household sector
Annual percentage change, unless indicated otherwise
2014 2015
2nd qr 3rd qr 4th qr 1st qr 2nd qr
Disposable income .................................................. 7,5 7,4 7,0 5,4 6,2
Financial assets ....................................................... 20,4 13,0 8,9 10,6 4,5
Total assets ............................................................. 17,5 13,1 8,7 10,4 5,1
Net wealth1.............................................................. 20,5 14,9 9,3 11,5 5,0
Consumption expenditure (at current prices) ........... 7,6 7,2 6,5 5,1 5,9
Consumption expenditure to GDP .......................... 61,2 60,8 60,2 60,2 61,1
Capital gearing2 ...................................................... 18,0 18,1 18,2 17,8 18,0
Credit extension ...................................................... 4,3 3,8 3,6 3,6 3,5
Mortgage advances extended to domestic private sector ...........................................
3,4 3,3 4,3 4,7 4,8
Savings as a percentage of disposable income ...... -2,50 -2,31 -2,24 -2,32 -2,20
Mortgage debt as percentage of household disposable income .................................................
37,9 37,5 37,2 37,4 36,9
Debt as a percentage of disposable income ............ 78,5 78,1 78,0 78,7 77,8
Debt to GDP ........................................................... 46,8 46,4 45,9 46,3 46,5
Debt-service cost of household debt ...................... 12,2 14,5 16,1 12,2 10,6
Debt-service cost as a percentage of disposable income ...................................................................
9,0 9,1 9,3 9,4 9,4
Debt ..................................................................... 5,2 5,7 5,8 5,4 5,3
1 Household net wealth is defined as total assets of households less total financial liabilities.2 Capital gearing’ refers to household debt as a percentage of total assets of households. Data are preliminary.
Sources: South African Reserve Bank and Statistics South Africa

Financial Stability Review September 201518
Households seemed not to have taken advantage of the low interest-rates to significantly lower their debt burdens. Household debt has remained stubbornly high despite having been decreasing marginally (as a percentage of disposable income) since 2009 (Table 10). Furthermore, household debt has remained above 45 per cent of GDP since 2006. Given the subdued domestic economic outlook and persistently high levels of unemployment, a reduction in household debt to levels seen before the global financial crisis seems unlikely. This could pose a risk to financial stability as such high debt levels could make it even more difficult for households to withstand economic contractions. Growth in household debt moderated somewhat in the first half of 2015, also contributing to a marginal moderation in the debt-service costs faced by households. This moderation, however, has not decreased the strain that debt-servicing costs have had on households’ disposable income (Figure 37). Furthermore, in the longer run, the rising interest-rate environment along with the subdued growth in household disposable income has resulted in a gradual deterioration in short-term debt-servicing capacity of households since the end of 2013.
A rise in wealth, especially in a relatively low interest-rate environment, might entice households to incur more debt. As net worth increases, households feel more secure and are more likely to increase living standards. Household net wealth relative to disposable income in South Africa has been rising since 2011 and is currently more than three times that of disposable income (Figure 38). However, the growth rate of households’ net wealth moderated markedly to 5 per cent in the second quarter of the year from 11,5 per cent in the first quarter. Given that growth in household debt was largely stagnant in the period under review, this sharp moderation was largely caused by a slowdown in the growth rate of total assets. This was driven by a significant drop in the growth of financial assets which fell by more than 50 per cent in the second quarter of 2015. The deterioration in share prices in the second quarter of the year therefore had a marked adverse impact on households’ balance sheets.
The vulnerability of households to interest-rate or economic shocks was further demonstrated by the deterioration in the First National Bank (FNB) Household Debt Service Risk Index.23 The index, at 5,99 index points in the first quarter of 2015, remained above the key level of 5,7 index points, a level which indicates that households still fall within the ‘high risk range’. As Figure 38 also shows, during times of rising wealth, households have low or falling debt-service risk, reflecting the security that wealth offers in terms of households’ ability to pay their future debt obligations. In recent quarters, however, while wealth has continued to rise, households’ ability to service their debt in future has deteriorated, as reflected by the FNB Household Debt Service Risk Index.
The FNB/BER Consumer Confidence Index (CCI) improved somewhat in the third quarter of 2015 to -5 index points after dropping markedly in the second quarter to -15 index points, from -4 index points in the first quarter of 2015 (Figure 39). Despite this improvement, it remains well below the long-term average of -5 index points. Although the economic outlook and time to buy durable goods sub-indices improved somewhat in the third quarter, most consumers are still of the opinion that South Africa’s economic prospects will deteriorate further over the next year.
23 The FNB Household Debt Service Risk Index is compiled from three variables, namely the debt-to-disposable-income ratio of the household sector, the trend in the debt-to-disposable-income ratio, and the level of interest-rates relative to long-term average (five-year average) consumer price inflation.
2,3
2,5
2,7
2,9
3,1
3,3
3,5
3,7
Household wealth to disposable income Debt-service Risk Index (right-hand scale)
Sources: South African Reserve Bank and First National Bank
Ratio Index
3,0
3,7
4,4
5,1
5,8
6,5
7,2
7,9
Figure 38 Household net wealth to disposable income ratio and Debt-service Risk Index
2001 2003 2005 2007 2009 2011 2013 2015
45
47
49
51
53
55
57
59
61
Consumer Financial Vulnerability Index (CFVI) Consumer Confidence Index (CCI) (right-hand scale)
Indices
-20
-15
-10
-5
0
5
10
15
20
Figure 39 Consumer Financial Vulnerability Index1 and the Consumer Confidence Index2
2009 2011 2013 2015
110-20 means ‘financially very vulnerable’, 20-39,9 ‘financially vulnerable’, 40-49,9 ‘financially very exposed’, 50-59,9 ‘financially mildly exposed’, 60-79,9 ‘financially secure’ and 80-100 ‘financially very secure’.2The consumer confidence index is expressed as a net balance between optimistic and pessimistic consumers. According to the Bureau for Economic Research (BER) at the University of Stellenbosch, the index can vary between -100 for ‘extreme pessimism’ and 100 for ‘extreme optimism’, with 0 being ‘neutral’.
Sources: MBD Credit Solutions; Bureau of Market Research, Unisa; First National Bank (FNB)/ BER, Stellenbosch University

19Financial Stability Review September 2015
The MBD Credit Solutions/Bureau of Market Research (MBD/BMR) Consumer Financial Vulnerability Index (CFVI)24 confirmed that households continued to view their financial situation as mildly exposed, with the index dropping to 50,8 index points. The fall in the CFVI was caused by the decrease in all vulnerability sub-indices. The fall in the CFVI was a result of a more than 7 per cent and 5 per cent deterioration compared to the previous quarter in the expenditure and debt-servicing vulnerability sub-indices respectively. While all the other sub-indices fell in the ‘mildly exposed’ category, the debt-servicing vulnerability index continued to fall in the very exposed category, making households’ debt-servicing ability their biggest concern. This is understandable not only because of the rising interest-rate environment that consumers are currently facing but also because macroeconomic conditions, including high fuel prices, high electricity tariffs and high unemployment, impacted negatively on their ability to service existing debt. This is echoed by the rise in the debt-servicing cost.
Residential real estate
Housing market trends and developments are vital as they serve as an indicator of financial system health, the availability of credit and confidence in the economy. Furthermore, not only does residential housing make up approximately 24 per cent of households’ total assets; mortgage advances is also the largest component of banks’ assets, accounting for over 40 per cent of total credit. Therefore, house prices impact on the balance sheets of both households and banking institutions.
The recent slowdown in house price growth that began in the second half of 2014 continued into 2015 (Figure 40). House prices grew more moderately (5,7 per cent) in the second quarter of 2015 compared with the first quarter (6,4 per cent).25 The moderation in house price growth was driven by subdued domestic economic conditions and constrained household finances. While mortgage loan growth has been persistently low since 2011 (also contributing to the moderate house price growth), the marginal increase in mortgage loans in the first half of 2015 could support future house prices.
The mortgage instalment-to-rent and price-to-rent ratios (Figure 41) indicate the affordability and profitability of owning residential property in South Africa. Both these indicators have decreased somewhat since the last quarter of 2014, indicating that households prefer to rent rather than to buy, confirming also the record-low confidence levels. The FNB/BER Building Confidence Index26 fell for the second consecutive quarter to 53 index points in the second quarter of 2015. This was mainly due to a steep decline in overall confidence by retailers of building materials. Weaker building activity for residential and non-residential contractors weighed on the confidence of main contractors. Conversely, confidence among building material manufacturers, while still below 50 index points, increased by 13 index points. The rise in this subcomponent was due to an improvement in domestic sales and production. Despite a fall in overall building confidence, the fact that over 50 per cent of respondents were still satisfied with current business conditions was probably supported by a strong increase (17,6 per cent year on year) in the number of plans approved in the second quarter for new housing units.27
24 Compiled by MBD Credit Solutions and the Bureau of Market Research.
25 Calculated by taking the average of all three house price indices’ growth rates.
26 The FNB Building Confidence Index measures the business confidence of all the major role players and suppliers involved in the building industry such as architects, quantity surveyors, contractors, subcontractors, retail merchants, and manufacturers of building materials. The index is compiled quarterly from the building, manufacturing, retail and wholesale opinion surveys undertaken by the Bureau for Economic Research at Stellenbosch University. See the FNB/BER Building Confidence Index, Johannesburg: FNB/BER, 17 September 2014.
27 Statistics South Africa, ‘Selected building statistics of the private sector as reported by local government institutions’, June 2015.
-10
0
10
20
30
40
Mortgage advances FNB HPI ABSA HPI Lightstone HPISources: South African Reserve Bank, Absa Bank Limited,First National Bank and Lightstone Property
Annual percentage change
Figure 40 House price indices and mortgage advances
2002 2004 2006 2008 2010 2012 2014
90
95
100
105
110
115
Mortgage-to-rent ratio Price-to-rent ratio (right-hand scale)
1 A ratio of 6–15: more affordable to buy, 16-25: rentingless expensive but buying might be better, 26-35: moreaffordable to rent
Sources: Absa Bank Limited, Statistics South Africa and South African Reserve Bank computations
Index: 2012 = 100 Ratio
18,0
18,5
19,0
19,5
20,0
20,5
Figure 41 Mortgage instalment-to-rent and price-to-rent1 ratios
2012 2013 2014 2015

Financial Stability Review September 201520
Government finances
Since the latter part of 2008, the total loan debt of government has maintained a steady upward trend, with domestic debt contributing 91 per cent at the end of June 2015 (Figure 42). The year-on-year growth rate of government debt slowed from a peak of almost 30 per cent in April 2010 to 12,9 per cent in June 2015 and amounted to R1,85 trillion. Total loan debt as a percentage of GDP increased from 47,1 per cent at the end of 2014 to 47,5 per cent in the second quarter of 2015. Government announced a fiscal rebalancing in the 2015 Budget Review by focusing on lowering expenditure and increasing taxes. The aim is to narrow the budget deficit to 2,5 per cent of GDP by 2017/18.
Compared to other BRICS countries (Brazil, Russia, India, China and South Africa), in 2014 South Africa recorded the third-highest government debt in relation to its GDP at 45,9 per cent and the steepest upward trend of all these countries (Figure 43). The IMF predicts that the upward trend in South Africa’s government-debt-to-GDP ratio will moderate somewhat from 2015 onwards and will increase only marginally to just under 50 per cent of GDP by 2020.
Growth in demand for local government debt has continued its steady upward trend. Pension and provident funds remained the largest holder of government debt of almost R520 billion in the first quarter of 2015, representing an annual increase of 15,4 per cent year on year (Figure 44).
South Africa’s sovereign one-year default probability is currently classified as ‘medium risk’ (Figure 45). Only twice since 2005 has South Africa been classified as ‘low risk’. During the period under review, all three major rating agencies (Moody’s Investors Service, Standard & Poor’s and Fitch Ratings) maintained both the rating and the outlook, taking into account the high levels of public debt and the high debt-to-GDP ratio as well as electricity-supply constraints, potential job losses and a generally sluggish global and domestic economy.
Foreign-exchange reserves
After falling for six consecutive quarters since the second half of 2012, the Guidotti ratio28 (GR) increased to 1,16 during the second quarter of 2015 (Figure 46). This was mainly due to a slowdown in annual short-term foreign debt growth to 9,0 per cent and a less severe contraction of -3,7 per cent in foreign-exchange reserves (down from -6,1 per cent in the first
28 The Guidotti–Greenspan rule states that a country’s reserves should equal short-term external debt (maturity of one year or less), implying a ratio of reserves of short-term debt of 1.
0
400
800
1 200
1 600
2 000
Total gross loan debt as a percentage of GDP Total foreign debt (right-hand scale) Total outstanding domestic debt (right-hand scale)
Per cent R billions
0
5
10
15
20
25
30
35
40
45
50
Figure 42 Increasing loan debt of national government
2000 20042002 2006 2008 20142010 2012
Brazil China India Russia South Africa
* Data after 2013 for India and Russia and data after 2014for Brazil, China and South Africa are InternationalMonetary Fund estimates
Source: International Monetary Fund
Per cent
0
10
20
30
40
50
60
70
80
Figure 43 General government debt-to-GDP ratios of BRICS countries
2008 2014* 2016* 2018*2010 2012
Pension and provident funds Insurers Banks
Source: South African Reserve Bank
R billions
0
100
200
300
400
500
600
Figure 44 Public debt holding by financial institutions
2000 20042002 2006 2008 20152010 2012
Table 11 Sovereign debt ratings for South Africa
Agencies2014 2015
2nd qr 3rd qr 4th qr 1st qr 2nd qr
Moody’s Investor Services .....................
Baa1Negative
Baa1 Negative
Baa2 Stable
Baa2Stable
Baa2Stable
Standard & Poor’s ......BBB-Stable
BBB-Stable
BBB-Stable
BBB-Stable
BBB-Stable
Fitch Ratings ..............BBB
NegativeBBB
NegativeBBB
NegativeBBB
NegativeBBB
Negative
Sources: Moody’s Investors Services, Standard & Poor’s and Fitch Ratings

21Financial Stability Review September 2015
quarter). This implies that, should access to foreign-exchange markets be reduced, there would still be sufficient funding to service the short-term external debt due within the next 12 months. It should, however, be noted that although the downward trend of the GR has been disrupted, it is not near the levels experienced from 2010 to 2013.
The augmented GR (AGR), although recording an increase, remained below the threshold of 1 for the 13th consecutive quarter. The AGR is calculated by extending the GR to take into account the current account (as a proxy for total external financing needs) and gives a more extensive picture of possible capital flight. At 0,93, the AGR suggests that existing foreign-exchange reserves are about 7 percentage points below the country’s total external financing needs. The main reason for the increase in the AGR was the significant narrowing of the current-account deficit combined with a slowdown in short-term foreign debt during the second quarter of 2015. The AGR is a more accurate assessment than the GR as it provides a more realistic picture. This could indicate a possible problem in the event of access to the foreign-exchange market suddenly being reduced.
The import cover ratio (ICR) remained at around 4,7 months in the first half of 2015, which is more than the three months required as per the generally accepted rule of thumb. Another broadly used rule of thumb is to compare international reserves to broad money (M2). Traditionally, a cover of 5 – 20 per cent was considered adequate, but more recently it has been argued that it should be about 50 per cent.29 South Africa had a rate of 24,78 per cent at the end of June 2015, which is above the traditional benchmark and higher than the 24,36 per cent recorded at the same time in 2014.
South Africa’s high gross external financing requirements make the country vulnerable to the possibility of market volatility, which is associated with increases in US policy rates, and therefore needs to strengthen or increase its buffers to combat this vulnerability. Official gross reserves shrank to around US$45 billion in July 2015 and this is relatively low compared to other emerging-market countries and also below the revised IMF reserve adequacy metric.30
The index of exchange market pressure (Figure 47) remained comfortably below the threshold level for the period under review and last breached the threshold during the 2008/09 financial crisis. A rapid increase in interest-rates in developed markets (especially the US) could lead to increased capital outflows and pressure on the rand.
29 Obstfeld, M, Shambaugh, J C and Taylor, A M. 2010. ‘Financial stability, the trilemma, and international reserves’, American Economic Journal: Macroeconomics, American Economic Association 2(2):57–94.
30 South Africa: Concluding statement of an IMF staff visit, 23 June 23 2015. See https://www.imf.org/external/np/ms/2015/062315.htm.
Low risk Medium risk
Per cent
0,0
0,1
0,2
0,3
0,4
0,5
0,6
0,7
0,8
0,9
Figure 45 South Africa’s one-year default probability
2005 2007 2009 20152011 2013
Note: 0 to 0,50 is regarded as ‘low risk’, 0,50 to 1,50 is ‘medium risk’ and 1,50 and above is ‘high risk’
Source: Bloomberg
Guidotti ratio Augmented Guidotti ratio Threshold (Guidotti-Greenspan rule of a ratio of reserves to short-term debt of 1)
Source: South African Reserve Bank
Ratios
0,0
0,2
0,4
0,6
0,8
1,0
1,2
1,4
1,6
1,8
Figure 46 Reserve adequacy for South Africa
2006 2008 2010 2012 2014
Distress episodes IEMP (rand/US dollar) Threshold (two-standard deviations from the mean)
Index
Asian PostSeptember 11
Globalfinancial crisis
-0,4
-0,3
-0,2
-0,1
0,0
0,1
0,2
0,3
0,4
0,5
Figure 47 Index of exchange market pressure1
1998 2000 2002 2004 2006 2008 20122010 2014
1 The Index of exchange market pressure is usually defined as a weighted average of the depreciation of the local currency, the percentage change in international reserves and the change in the domestic interest rates. A rise in the value of the index indicates increasing pressure on the local currency and vice versaSource: South African Reserve Bank

Margin debt purchases of stocks by retail investors were behind the precipitous rise in China’s equity market. Stock market leverage as a percentage of market capitalisation reached its highest level in July before the crash, making the system more vulnerable to a sudden correction in the market. Deleveraging in China’s stock market brought the procyclical margin financing down by 48 per cent from its record-high outstanding balance of US$225 billion to US$110 billion in August 2015.33
Margin debt purchases increased significantly when the number of retail accounts held at stockbroking firms spiked. Previously, this sharp rise in these leveraged financed accounts coincided with the spike in the stock market index. It was the collapse in the number of these accounts that also fuelled the sharp drop in the market during August 2015 (Figures 1A and 1B).
An analysis of China’s stock market reveals that state-owned enterprises (SOEs), whose half-year profits plunged by 21 per cent on an annual basis in 2015, were very dominant. These SOEs would unavoidably be affected by adverse projections of China’s economic performance. In that regard, uncertainty about economic growth was at the epicenter of the Chinese equity market correction that spilled over to global markets, as it pointed to further weakening of a projected earnings outlook. The slump in the manufacturing Purchasing Managers’ Index (PMI) for new orders pointed towards a weakening manufacturing sector in the next three to six months. A combination of these factors prompted a significant sell-off in China’s equity market (Figure 1C).
In July 2015, a sharp and rapid decline in factory prices reached their lowest level in six years amid weak domestic and foreign demand and declining capacity utilisation, which all pointed towards diminishing prospects of positive growth in revenue sales at the SOEs (Figure 1D). The International Monetary Fund’s (IMF) annual assessment report on China remarks that the country is moving towards ‘a new normal’ of slower yet safer and sustainable growth. This involves giving the market a more decisive role in the economy.34
A new normal could imply getting used to single-digit gross domestic product (GDP) growth rates for a long period. China’s economic growth moderated steadily in the first half of this decade. In 2014 its economy expanded by 7,3 per cent – the slowest annual rate recorded since 1990 and below the government’s target of 7,5 per cent. That was the first time since 1998 that this target was missed (Figure 1E).
Accompanying the slowdown in China’s economic growth was the slowdown in demand for commodities. The prices of many commodities declined from 2012 and then dropped sharply in 2014. Although commodity prices are still above historical levels, the combination of a global surplus in many commodity markets and expectations of a further slowdown in demand from China continues to underpin current commodity-market weakness.
A slowdown in economic growth and subsequent decrease in household income raises household vulnerability to increases in indebtedness. Systemic risks could arise in China if end-borrowers come close to or exceed their budget constraints when financial sector leverage is high or when there is excessive maturity transformation. China’s outstanding loans for companies and households stood at a record 207 per cent of GDP at the end of June 2015 which is nearly double the 125 per cent level recorded in December 2008. The excessive leverage could continue, fuelled by a record-low one-year lending rate of 4,60 per cent, which is down from an all-time high of 10,98 per cent recorded in June 1996.
While the reduction in interest-rates by the People’s Bank of China helped reduce the debt-servicing cost in 2014 through to June 2015, this could prove to be a minor reprieve for highly indebted households and corporates. Lower interest-rates have the potential of increasing risks of instability in China’s financial system if not accompanied by a commensurate increase in household income at the prevailing levels of indebtedness.
Interest-rate cuts and a liquidity injection by the People’s Bank of China could take some time to take effect as overstretched households and corporates mend their balance-sheet positions amid a slowdown in economic activity and deteriorated wealth effects.
33 With the stock market crash, investors had to submit more cash or other assets to meet their margin calls since their borrowings were secured by the value of the stocks they bought, and the market crash had diluted that collateral.
34 International Monetary Fund Survey Magazine, ‘China’s transition to slower but better growth’, August 2015. See http://www.imf.org/external/pubs/ft/survey/so/2015/CAR081415B.htm.
Box 1: Leveraged finance of China’s stock market
Financial Stability Review September 201522
Figure 1A and 1B China’s stock market leverage performance and brokerage retail accounts
Index US dollar billions Number of accounts, millions
Jan MarMay Jul SepMarMayJul JanSep Nov2014 2015
2005 2007 2009 2011 2013 20150
1 000
2 000
3 000
4 000
5 000
6 000
0
5
10
15
20
0
1 000
2 000
3 000
4 000
5 000
1 000
2 000
3 000
4 000
5 000
6 000
Shanghai stock exchange index Shenzhen stock exchange composite index Chinese margin debt (right-hand scale)
Source: Bloomberg
QB3-2013BOP11
Shanghai composite stock index China new A-share retail accounts (right-hand scale)
Index
Figure 1C Declining profits in China’s state-owned enterprises threaten the growth outlook
Annual percentage Index
-50
-40
-30
-20
-10
0
10
20
30
48
49
50
51
52
53
54
2013 2014 2015
China industrial total profits SOEs China industrial enterprises total profits China PMI new orders (right-hand scale)
Source: Bloomberg L.P

Box 1: Leveraged finance of China’s stock market Box 1: Leveraged finance of China’s stock market
Box 2: Interconnectedness in the financial system
In order to safeguard financial stability, both the direct and the indirect linkages between banks and other financial intermediaries have to be understood. Significant market turbulence following the fear of spillovers from a possible default of African Bank to South African money-market funds (MMFs) highlighted the need to better understand interconnectedness based on both direct and indirect linkages between any banks and non-bank financial institutions in South Africa. Several indications show possible sizeable linkages between banks and other financial institutions in South Africa. For example, Figure 2A shows that banks’ exposure to the private financial corporate sector (comprising money-market unit trusts, other unit trusts, fund managers and medical schemes) has increased as a percentage of bank assets from around 10 per cent from 2002 onwards, stabilising at around 20 per cent from 2012 to 2014.
Other linkages that could be of interest include simple bilateral exposures (e.g. deposits), exposures to securities, exposures through joint market access (where there is a possibility of spillover via fire sales), exposures through joint portfolio holdings (e.g. loans, in which case the spillover would be less pronounced), or overlapping portfolios that induce indirect linkages. The common exposures that banks share with the different economic sectors were also mapped and are monitored.
The Bank is in the process of developing tools to monitor different types of interlinkages between banks and other financial intermediaries.
Figure 2A Banks’ liabilities to the private financial corporate sector
R billions Per cent
0
1 000
2 000
3 000
4 000
5 000
20142013201220112010200920082007200620052004200320020
5
10
15
20
25
Banks' assets Liabilities to private financial corporate sector Liabilities to private financial corporate sector as percentage of total assets (right-hand scale)
Source: South African Reserve Bank
Financial Stability Review September 2015 23
Figure 1E Real economic growth in China
Per cent
0
3
6
9
12
15
2000 2002 2004 2006 2008 2010 2012 2014
Source: Bloomberg
70
75
80
85
90
95
Figure 1D A multi-year slowdown in China’s industrial production
Per cent Index
-10
-5
0
5
10
15
20
25
1995 1997 1999 2001 2003 2005 2007 2009 2011 2013 2015
China productions price index (year on year) China value added of industry (year on year) Capacity utilisation (right-hand scale)
Source: Bloomberg Figure 1F China’s indebtedness increased as lending rates dropped
Per cent
120
140
160
180
200
220
17
22
27
32
37
2005 2006 2007 2008 2009 2010 20122011 2013 2014 2015
China household and corporate debt servicing as percentage of GDP China household and corporate debt as percentage of GDP (right hand scale)
Source: Bloomberg L.P
Financial Stability Review September 201524
The robustness of the domestic financial infrastructure
This section reviews developments in the domestic and international financial infrastructure and regulatory environment.
A resolution framework for South Africa
The anticipated Twin Peaks31 regulatory framework, which will come into effect once the published Financial Sector Regulation Bill is promulgated, assigns an explicit responsibility to the Bank to monitor and enhance financial stability. As part of this explicit financial stability mandate, the Bank has been assigned responsibility for assisting with the identification, mitigation and prevention of systemic events and, if such an event occurs, to contain the negative consequences thereof. A systemic event could include the failure of financial institutions, which need to be managed in an orderly manner to protect domestic financial stability.
In anticipation of this responsibility and to implement international best practice, in August 2015 NT, the Bank and the FSB published a discussion paper on strengthening South Africa’s resolution framework.32 The paper sets out key proposals for strengthening South Africa’s resolution framework for designated resolution institutions (DRIs) to provide for the management of such a DRI in the case of failure and in a manner that seeks to mitigate any negative impact on South Africa’s financial stability as well as to minimise resultant macroeconomic costs. Once finalised, the paper will form the basis from which a special resolution bill (SRB) will be drafted. The existing resolution provisions presented in other pieces of legislation will also be revised, where necessary, to support the resolution of a DRI in line with the objectives of the SRB.
The paper proposes that a special resolution framework be developed for DRIs, which would include all banks, systemically important insurers, systemically important financial market infrastructures and the groups within which these entities operate. In terms of the paper the Bank, in line with its financial stability responsibilities, will be the designated resolution authority for all DRIs.
In terms of the proposals, the envisaged SRB should provide the Bank with an enhanced set of resolution powers to enable it to deal with the failure of a DRI. These include the powers set out in the Financial Stability Board’s Key attributes of effective resolution regimes for financial institutions, including bail-in within resolution, enhanced powers relating to the transfer of assets and liabilities, and powers to enable the creation and management of a ‘bridge’ institution.33
The envisaged SRB should also provide the Bank with powers to increase the resolvability of DRIs during normal times. The paper sets out a number of pre-resolution powers to enable the Bank to direct regulators and DRIs to take actions in order to improve the DRIs’ resolvability. These actions include the development of recovery and resolution plans.
31 A safer financial sector to serve South Africa better and Implementing a Twin Peaks model of financial regulation in South Africa were published by National Treasury in 2011 and are available online at http://www.treasury.gov.za/twinpeaks/.
32 Strengthening South Africa’s resolution framework for financial institutions was published by National Treasury in August 2015 and is available online at http://www.treasury.gov.za/publications/other/RFFI/.
33 A bridge institution is a temporary entity that is created to take transfer of certain assets and liabilities, normally the good assets and liabilities or critical functions and shared services. The temporary entity is then used to stabilise and continue with these remaining functions of the failed institution.

25Financial Stability Review September 2015
Furthermore, the Bank, in cooperation with NT and with the assistance of consultants, is currently developing detailed proposals on a deposit guarantee scheme (DGS), which will provide deposit insurance for specific pre-identified depositors. The paper provides preliminary views on a suitable DGS for South Africa.
The aim of the proposals is not only to strengthen the resolution framework, but also to provide more clarity regarding the position of investors, depositors, policyholders and other creditors in the event that a DRI should fail as well as to ensure the fair and transparent allocation of losses. To achieve this aim, the paper provides, among other things, proposals on a revised creditor hierarchy in liquidation together with appropriate safeguards, including the ‘no-creditor-worse-off ’ (NCWO) rule.34
NT scheduled workshops (the first of which was held in Cape Town on 15 September 2015) on this topic but the paper also provides for a public consultation period. Comments on the paper were due to NT by the end of September 2015.
Cybersecurity
Over the past few years, cybersecurity has moved swiftly up the list of priority issues in a number of countries. Greater and enhanced interconnectedness between physical infrastructures, telecommunications devices and information technology (IT) systems has underlined the importance of the cyberspace terrain on a number of fronts. Financial systems are no exception as they have become increasingly reliant on, and based in, the cyberspace environment, providing online access to market data, payment channels, and services and transactions at domestic, regional and global levels. As financial systems have expanded the range of their online products and services, potential cyber threats have increased exponentially. Financial systems, institutions and activities are vulnerable to cyber-related threats, which can compromise the confidentiality, availability and integrity of critical financial infrastructures. The need to address such challenges and improve cybersecurity resilience has therefore become imperative.
A number of countries have cybersecurity frameworks in place to deal with cyber threats. However, there is a significant amount of variation and overlap in national frameworks and they often lack the required coordination and cohesion at the regional and international levels. Of particular interest is the financial system component of such national frameworks and its relationship to financial stability. Cyber attacks that cause operational failure or that disrupt the safety and efficiency of critical financial services and transactions have the potential to pose systemic risk. In some countries it is the government, finance/treasury ministries, central banks and/or private-public partnerships that play a leading role in cyber safety in the financial sector. Despite these different arrangements there are some common themes, which include:
• boards of directors and related structures that have oversight of cyber risks;
• structured approaches to assessing the potential cyber threats and evaluating cyber strategies;
34 In terms of the NCWO rule, a creditor may not receive value for its claim that is less than the amount it would have received in liquidation.

Financial Stability Review September 201526
• strong emphasis on the sharing of information and disclosing breaches;• identifying the sources and understanding the channels for the
propagation of cyber risks;• nationally coordinated cyber defence, and responses to cyber threats and
cyber crime;• structured approaches to testing cybersecurity; and • emphasis on building overall cyber resilience.
Given the growing interconnectedness of financial systems and the greater reliance on internet services by financial services providers, there are no iron-clad, totally impregnable defences against cyber threats, but the negative repercussions thereof can be defended against, reduced and mitigated. Cyber threats are therefore a common threat, potentially affecting not only individual role players, but all role players in the financial system. Such a point of view would enable cybersecurity to be viewed as a non-competitive space in which financial services entities, members and supervisors could collaborate to build shared cyber resilience.
As in other jurisdictions, the South African financial authorities are giving greater attention to cyber threats and the building of enhanced cyber resilience. The Bank, which has been assigned with the responsibility for financial stability in South Africa, is also increasingly focusing on the linkage between cyber threats and financial stability, that is, the ability of cyber threats to disrupt critical financial services and transactions that could have systemic implications. In the evolution of the Bank’s approach to cybersecurity, emphasis is being placed on the operational resilience of key domestic financial institutions and systems in the context of unpredictable and rapidly changing cyber threats. Enhanced defensive capabilities and/or rapid recovery capabilities in the face of advanced persistent threats, together with the regular testing of such capabilities, will have to be essential features of cybersecurity programmes to be implemented in the domestic financial system.
Regulatory developments affecting the domestic banking sector
A favourable assessment by the Basel Committee on Banking Supervision Regulatory Consistency Assessment Programme of South Africa
In order to ensure that the Basel III framework is consistently applied, periodic assessment of member countries’ implementation of regulatory standards underpinning the framework is regularly undertaken. In June 2015, the BCBS published the results of the Regulatory Consistency Assessment Programme (RCAP) for South Africa.35 The assessment found that banks36 had implemented the Basel III risk-based capital regulations in accordance with the internationally agreed-upon timeline, and had also applied the transitional arrangements in line with the Basel III requirements. Overall, the BCBS Assessment Team found the South African prudential regulations to be compliant with all 14 components of the capital framework. However, two non-material deviations were identified, which relate to the treatment of minority interest and the risk-weighting of mortgages on residential property. Steps to address these deviations have already been taken.
35 The report can be accessed on the BIS website at http://www.bis.org/bcbs/publ/d322.pdf
36 The Banks Act 94 of 1990 (Banks Act) and the regulations thereto apply uniformly to all banks and banking groups in South Africa.

27Financial Stability Review September 2015
The Assessment Team also released the assessment of the Basel III LCR regulations.37 The scope of the assessment was limited to the consistency and completeness of the domestic regulations with respect to the Basel III framework. Where domestic regulations and provisions were identified to be inconsistent with the Basel III framework, they were evaluated for their current and potential impact on the LCRs for a sample of internationally active banks in South Africa. The Assessment Team did not focus on issues relating to the adequacy of prudential outcomes, liquidity levels of individual banks or the Bank’s supervisory effectiveness.
Legislation enforcing the LCR in South Africa was implemented via the Banks Act 94 of 1990 (Banks Act), the Regulations relating to Banks (Regulations) and Banks Act Directives 6, 7, 8 and 11, all issued in 2014, updating the prior domestic banking legislation on liquidity risk to align it with the finalised BCBS standards for the LCR. While the South African regulation was prepared using the Basel standard as guidance, the Assessment Team identified a limited number of deviations in the South African regulations from the Basel standard, which were discussed extensively. Subsequently, the Bank made appropriate changes to the regulations to fully comply with the Basel requirements or otherwise clarified the rationale behind super-equivalent or non-material differences.
The Financial Intelligence Amendment Bill 2015
On 15 April 2015, NT published the Financial Intelligence Amendment Bill, 2015 (Bill) for public comment. In responding to the global financial crisis, South Africa endorsed the combating of financial crime as one of its key policy objectives in the policy document titled A safer financial sector to serve South Africa better, released by NT in 2011.38 The Bill gives expression to that policy commitment by addressing the gaps identified in reports by the Financial Action Task Force (FATF) and the IMF.39
While a number of initiatives have taken place to address the gaps identified, the Bill includes amendments to address specific deficiencies in the original legislation, namely the Financial Intelligence Centre Act 38 of 2001 (FIC Act). The amendments contained in the Bill include the following:40
• enhancing the customer due diligence requirements;• providing for the adoption of a risk-based approach to customer due
diligence measures;• providing for the implementation of the United Nations Security
Council (UNSC) Resolutions relating to the freezing of assets; • extending the supervisory powers of the Financial Intelligence Centre
(FIC) in relation to suspicious transactions;• introducing and refining concepts of beneficial ownership, ongoing due
diligence, and foreign and domestic prominent influential persons; and• enhancing certain administrative and enforcement mechanisms.
37 The RCAP report on South Africa’s implementation of the LCR is available at http://www.bis.org/bcbs/publ/d323.pdf.
38 Four priority objectives were identified in this policy document: (i) financial stability; (ii) consumer protection; (iii) expanding financial inclusion; and (iv) combating financial crime. The policy document is available on the NT website at http://www.treasury.gov.za.
39 The FATF released its Mutual Evaluation Report on South Africa in 2009 and the IMF released its Financial Sector Assessment Programme Technical Note on AML/CFT for South Africa in December 2014.
40 For further details, see the document titled ‘Memorandum on the objects of the Financial Centre Amendment Bill, 2015’, which is available on the NT website at http://www.treasury.gov.za.

Financial Stability Review September 201528
The Bill also contains measures to establish a stronger domestic anti-money laundering (AML) and combating the financing of terrorism (CFT) regulatory framework. Besides strengthening the domestic AML/CFT regulatory framework, the memorandum accompanying the public release of the Bill also makes reference to the financial stability dimension thereof. It explains that the Bill has been introduced to support the integrity of the domestic financial system and its interactions with counterparts abroad. NT has further stated that the failure “to enforce agreed international standards exposes domestic financial institutions to significant fines and penalties in overseas jurisdictions, which also poses risks to financial stability. At worst, such failure is highly likely to result in country isolation and exclusion from the global financial system.”41
Limitations on fees and interest rates
On 25 June 2015, the Department of Trade and Industry (dti) released for public comment a notice42 titled Draft review of limitations on fees and interest-rates (Notice) that proposes caps or ceilings on fees and interest-rates applicable to credit agreements falling under the National Credit Act 34 of 2005 (NCA). The proposals contained in the Notice (see Box 3 on page 36 for a summary of the proposed changes) affect a broad range of regulated financial institutions, including banks and insurers, which provide credit in the domestic market. Responses to the proposals to date have differed markedly between those supporting greater consumer protection and those involved in the actual provisioning of credit to consumers.
Consumer protection perspectives
From a consumer’s perspective, the current changes by the dti that were done in tandem with the National Credit Regulator (NCR) to constrain some of the practices in the consumer credit market are a continuation of earlier policy actions. The proposals in the Notice follow the tightening of the in duplum rule43 and the issuing of the new affordability assessment rules in 2014 and 2015 respectively, which require lenders to be more rigorous in following up on arrear accounts and in the provisioning of credit. Given the high levels of over-indebtedness of many consumers, there will be some support for these proposals as a means to reduce over-indebtedness of South African consumers and as a contribution to making the provisioning of credit more affordable and sustainable.
Reservations about the proposals
The providers of unsecured credit in the domestic market, as well as the Banking Association of South Africa (BASA), are generally uncomfortable with the above-mentioned proposals and with the possible implications that these could have.44 While BASA supports reducing the over-indebtedness of consumers and has expressed support for some of the caps on interest rates, such as those applicable on mortgage loans and developmental credit
41 See the NT media statement on the release of the Bill, ‘Request for public comments on the draft Financial Intelligence Amendment Bill, 2015’, dated 21 April 2015 and also available on the NT website at http://www.treasury.gov.za.
42 Department of Trade and Industry, General Notice 655, National Credit Act, 2005: Invitation for the public comment on the draft regulations on review of limitations of fees and interest-rates, Government Gazette No. 38911, 25 June 2015.
43 Refer to the September 2014 edition of the Financial Stability Review for a more detailed discussion of the in duplum rule.
44 Details in this subsection are based on BASA’s submission to the dti, dated 5 August 2015.

29Financial Stability Review September 2015
agreements, it has expressed reservations and concerns about many of the other aspects of these proposals. BASA’s concerns are based mostly on the economic impact thereof and the implementation timelines.
BASA further argues that the implementation of the proposals in the Notice should be preceded by greater public engagement by the authorities on a more foward-looking strategy document for the domestic credit industry, and supported by a robust macroeconomic impact assessment. Also, the Affordability Assessment Regulations, promulgated on 13 March 2015, should first be allowed to fully take effect in the credit market, and conducting a more detailed consultation process with the prudential and market conduct regulators. Other reasons provided for disagreement include operational issues and a preference for a phased-in implementation of the proposals to allow for monitoring to determine whether these reductions are beneficial to consumers and the broader economy.
Possible unintended consequences of the limitations on interest-rates and fees
The dti media statement on the release of the Notice refers to the facilitation of “access to credit in a fair and equitable manner” and measures to be put in place to ensure that “credit extended to consumers is affordable and not too expensive” as part of the goals of the NCA legislation.45 It further identifies, among other things, the high level of household over-indebtedness, the high costs of credit (and the costs associated with this credit, such as credit life insurance) and the extension of unsecured lending practices as impediments to achieving the aims of the NCA. The dti explains that the recommendations contained in the Notice follow on from the conclusion by the NCR that “changes must be introduced to limit fees and interest rates.”
While BASA and some analysts in general support fair access to credit and responsible borrowing and lending practices, they have indicated that the package of limitations on interest-rates and fees will have a number of negative consequences. They argue that banks generally have a required return on capital for the total credit they issue. This required return includes a safety buffer to address the changing dynamics of bad debt. If interest-rates chargeable are reduced, this will affect margins and, consequently, the safety buffer. To achieve the given level of safety margin, there may be a reaction that involves negative consequences for credit that could play out in the following ways:46
• The financial re-engineering of unsecured loans, that is, shortened loan duration and increased loan frequency: Faced with a contraction of gross yields on unsecured loans, banks may encourage customers to take shorter-dated loans with their relatively higher interest-rates and initiation fees, thereby achieving higher yields than the longer-dated unsecured loans.
• The use of credit life as a mitigating factor: Currently, the proposed cap on credit life has not been finalised. There may be a spike in the number of banks introducing credit life insurance policies or banks currently making use of credit life may increase this charge to offset the reduction in interest-rates.
45 See the dti media statement titled ‘The invitation for the public to comment on the review of limitations of fees and interest-rates’, dated 3 July 2015, available at https://www.thedti.gov.za/editmedia.jsp?id=3392.
46 According to the Barclays Live article, ‘South African banks and diversified financials’, dated 30 June 2015, available at https://live.barcap.com/PRC/servlets/dv.search?contentPubID=FC2150661&bcllink=decode.

Financial Stability Review September 201530
• The migration of credit to the informal lending sector: If banks cannot price risk appropriately, the rate of rejected credit applications could rise, pushing more consumers to access credit from the informal and less regulated sector which demands higher interest-rates and affords less protection.
Should the banking sector’s behavioural response materialise as outlined above, then it is likely that the lowest income earners (below R5 000 per month) will be most affected in that they will bear the brunt of these changes. In such a scenario, it is likely that credit in the domestic market will be driven more by regulation than by competition, market forces, and product innovation and differentiation.
Concluding remarks on proposed changes
For the banking sector, it is unlikely that the marginal increases in interest-rates and fees in some categories of credit transactions will offset the reduction in maximum interest-rates chargeable on unsecured credit. Should credit be curtailed as suggested by some analysts and responses by banks as outlined earlier, it is unlikely that overall consumer welfare would be improved. The benefits of the proposed reduction in interest-rate ceilings to the consumer and the economy are therefore unclear. At this conjuncture of the South African economy and the evolution of domestic credit markets, it would be prudent to conduct such a detailed macroeconomic impact assessment of the proposed changes contained in the Notice.
Regulatory developments affecting the domestic insurance sector
Draft Insurance Bill of 2015
On 15 April 2015 NT and the FSB published for public comment the draft Insurance Laws Bill of 201547 (Insurance Bill). In line with the international regulatory reforms proposed by international regulatory authorities such as the Group of Twenty Finance Ministers and Central Bank Governors (G-20), the BCBS and the Financial Stability Board, South Africa also embarked on the reform of the regulatory infrastructure in order to enhance consumer protection and maintain financial stability. Under the proposed Financial Sector Resolution Bill (FSRB), the Bank will be responsible for prudential regulation of both banks and insurers. The Insurance Bill is aligned to the draft FSRB in respect of prudential supervision of insurers, which will be the responsibility of the Prudential Authority under the Bank.
The aim of the Insurance Bill is to encourage a fair, safe and stable insurance market that protects policyholders. The proposed legal framework for insurers and insurance groups will:
• facilitate the monitoring of the safety and soundness of insurers; • increase access to insurance for all South Africans; and• contribute to the overall stability of the financial system.
The Insurance Bill will introduce insurance-related legislation, consolidate insurance legislation and close existing regulatory gaps. A brief overview of the major provisions of this Bill is provided below.
47 The Bill and accompanying documents are available on the NT website at www.treasury.gov.za and the FSB website at www.fsb.co.za.
31Financial Stability Review September 2015
In 2009, the FSB embarked on the reform of the insurance prudential standards through the solvency assessment and management (SAM) framework. The SAM framework is derived from the European Union’s Solvency II prudential supervisory framework and has been adapted for use in the South African regulatory environment. SAM introduces a forward-looking risk-based approach to solvency by aligning the capital requirements with the underlying risks of small insurers, large insurers and cross-border insurance groups. The SAM framework will be adopted in January 2016 and is expected to improve the quality of insurers’ capital as the new framework is more appropriate for insurers and will likely reduce systemic risk in the insurance sector.
The Insurance Bill will consolidate extensive parts of the Long-term Insurance Act 52 of 1998 and the Short-term Insurance Act 53 of 1998 relating to prudential supervision as it aims to rectify regulatory gaps identified by the IMF/World Bank’s Financial Sector Assessment Programme (FSAP) evaluation of South Africa. In October 2011, the Insurance Core Principles (ICPs) were revised to take into account recommendations from the G-20 and the Financial Stability Board. The focus of the Insurance Bill is on prudential standards and it aligns the domestic insurance regulatory framework with the International Association of Insurance Supervisors’ (IAIS) ICPs by including principles for group-wide supervision, governance, licensing, risk management and internal controls.
The Insurance Bill will also include a section on micro-insurance which was reported on in the September 2011 Financial Stability Review. The FSB released the micro-insurance policy document in July 2011. This policy document was issued as a follow-up to the micro-insurance discussion document which highlighted the shortcomings of insurance for the lower-income market. One of the aims of the micro-insurance framework is to enhance consumer protection within this market segment through appropriate prudential and business conduct regulation, improved enforcement of regulations as well as consumer education. The Insurance Bill will allow for a lower minimum regulatory capital requirement for micro-insurers and a simpler prudential regulatory model suited to micro-insurers. Firms would first have to obtain a micro-insurance licence in order to benefit from these less onerous prudential requirements.
Finally, the Insurance Bill will provide for group-wide supervision, which was previously not provided for in the insurance legislative framework. Some insurers operate in a group in order to benefit from risk pooling, intragroup financing and integrated governance structures. The group-wide supervision framework that will be introduced in the Insurance Bill takes into account some of the risks that group operations present to the financial system. Comments on the Insurance Bill closed at the end of May 2015 and it is expected that the Bill will be tabled in Parliament by the fourth quarter of this year. Parallel reporting under the SAM framework has already started and it is expected that full SAM implementation will start on 1 January 2016. The Insurance Bill will also become effective on 1 January 2016.
Proposed governance and risk management for insurers
In 2010, the IMF and the World Bank conducted an assessment on the insurance, banking and securities sector of South Africa. In December 2010, a Report on the Observance of Standards and Codes (ROSC) based on the

Financial Stability Review September 201532
assessment was published with a number of findings and recommendations for the affected regulators. The ROSC for insurance found that the insurance sector would benefit from enhanced interpretive guidance by the FSB, particularly on the requirements for insurance company internal controls, governance and risk management.
After the 2010 ROSC, the FSB embarked on an initiative to amend the risk and governance sections of the Long-term Insurance Act 52 of 1998 and the Short-term Insurance Act 53 of 1998. This culminated in a Board Notice for Governance and Risk Management being issued in December 2014. This Board Notice addresses the following issues:
• the overall governance and risk management framework; • governance and structure of boards of directors;• the components of a risk management system; and • the components of an internal control system.
A high-level overview of the sections contained in the Board Notice, which became effective on 1 April 2015, is provided below.
- An insurer is required to adopt, implement and document an effective governance framework that provides for the prudent management and oversight of its insurance business and adequately protects the interests of its policyholders.
- The section on the board of directors spells out the number of non-executive and independent directors that should serve on the Board. This is aimed at promoting objectivity in decision-making by the Board and ensuring that there is an overall adequate spread and level of knowledge, skills and expertise at board level. This section also spells out other committees which should be established by the board. These committees include the Risk and Remuneration Committee.
- Insurers are also required to establish and maintain an effective risk management system with detailed information on strategies, policies and procedures for identifying, assessing, monitoring, managing and reporting all reasonably foreseeable current and emerging material risks to which the insurer may be exposed.
- In terms of internal controls, an insurer must establish, maintain and operate within an adequate and effective internal control system. The internal control system must be appropriate to the nature, scale and complexity of the insurer’s business and risks, and must, at least, provide reasonable assurance over the fairness, accuracy and completeness of the insurer’s financial and non-financial information. The section on internal controls also covers general requirements for control functions, a compliance function, an internal audit function and an actuarial function.
The risk and governance framework for insurers as well as the enhancements and update of the Insurance Bill will also provide for a prudential framework for insurers aimed at strengthening the supervisory framework for financial institutions with the ultimate aim of promoting financial stability.

33Financial Stability Review September 2015
Regulatory developments affecting the domestic financial markets
Progress made in reforming major interest-rate benchmarks
Efforts to reform major interest-rate benchmarks started in July 2014 when the Financial Stability Board published the report titled Reforming major interest-rate benchmarks.48 This report proposes recommendations for enhancing existing benchmarks for key interbank unsecured lending markets and promoting the development and adoption of nearly risk-free benchmark rates (RFRs) where appropriate. This was done in response to cases of attempted manipulation in relation to key interbank interest-rate benchmarks together with the post-crisis decline in liquidity in interbank unsecured funding markets. These recommendations were developed by the Official Sector Steering Group (OSSG), which built on input by market participants as well as the international framework for financial market benchmarks established by the International Organization of Securities Commissions (IOSCO) and endorsed by the Financial Stability Board and the G-20. The report points to developments in South Africa with a focus on the reform of the Johannesburg Interbank Average Rate (Jibar) by implementing a Jibar Code of Conduct in 2012 (revised in 2013).
With regard to developments in RFRs, Financial Stability Board members have made concrete progress in identifying potential RFRs as identified in the Progress Report in Reforming major interest-rate benchmarks published in July 2015.49 In South Africa, research into the creation of an RFR for the South African rand is ongoing. The lack of a liquid secondary market in South African Treasury bills currently limits the available options. It may, however, be possible to use the government bond repurchase (repo) market for this purpose, although the liquidity in this market is concentrated in very short tenors.
Progress made in implementing over-the-counter derivatives market reforms in South Africa
The Financial Stability Board published its ninth progress report on the implementation of over-the-counter (OTC) derivatives market reforms on 24 July 2015.50 The report notes that the implementation of OTC derivatives market reforms is well underway, with legislative foundations having been made in most Financial Stability Board member jurisdictions. Some of these measures include the fact that the implementation of reforms is most advanced for trade reporting and for capital requirements in respect of non-centrally cleared derivatives, and that there has been further incremental progress to promote the central clearing of standardised OTC derivatives. Over the next year, further progress is anticipated in many jurisdictions in, among others, assessing if certain products should be required to be centrally cleared.
In South Africa, NT published for public comment proposed regulations for unlisted OTC derivatives on 4 July 2014. These proposed regulations will ensure that South Africa is able to meet its G-20 obligations in terms of the regulation of the OTC derivatives market. The proposed regulations under the Financial Markets Act of 2012 will bring the South African regulatory
48 The report can be found on the Financial Stability Board’s website at http://www.financialstabilityboard.org/2014/07/r_140722/.
49 The report can be found on the Financial Stability Board’s website at http://www.financialstabilityboard.org/2015/07/progress-in-reforming-major-interest-rate-benchmarks/.
50 The report can be accessed at http://www.financialstabilityboard.org/2015/07/ninth-progress-report-on-implementation-of-otc-derivatives-market-reforms/.

Financial Stability Review September 201534
framework in line with those implemented in other G-20 jurisdictions. The regulations will enhance supervision of the OTC derivatives markets in South Africa by requiring that OTC derivative providers (ODPs) be authorised as a category of regulated persons. In addition, the regulations will ensure the promotion of transparency of the derivatives markets through regulations applicable to the licensing of trade repositories. It is proposed that the FSB will release notices relating to the criteria for authorisation as an ODP as well as an ODP code of conduct and the reporting obligations in terms of derivatives.
The cross-border nature of securities markets requires an appropriate regulatory framework that promotes the efficiency and competitiveness of the South African financial markets without significantly undermining their stability. The proposed regulations therefore also address:
• requirements with which a central securities depository (CSD) must comply for approval as an external CSD as a participant;
• securities services to be provided by an external CSD and external clearing members; and
• functions and duties that may be exercised by an external clearing house, central counterparty or external trade repository (TR).
The central clearing of OTC derivatives is aimed at attaining greater efficiency as well as reducing costs and risks to participants by providing the centralised clearing, settlement and recording of financial transactions. Through the centralisation of specific activities, participants are enabled to manage their risks more effectively and efficiently and, in some instances, eliminate certain risks. Central clearing can also promote increased transparency in particular markets and contribute to overall financial stability.
Capital requirements of the collective investment scheme
In April 2015, the FSB issued a Board Notice 84 of 2015 under the Collective Investment Schemes Control Act of 2002. The board notice51 sets out the capital requirements to be kept by a hedge fund manager. The board notice contains the following provisions:
• Ensure that 13 weeks’ operational capital is available. • Provide seed capital for portfolio expenses.• Ensure sufficient capital for participatory interest trades.
The capital requirements should be calculated in relation to the financial statements of a manager prepared using International Financial Reporting Standards (IFRS). The notice provides the method of calculation which covers eligible capital and adjustments that need to be taken into account when arriving at the final figure. The notice also provides powers to request the manager for revised capital calculations. These calculations need to be submitted within 14 days of the last day of the month. In terms of risk management, the manager is required to evaluate professional liability risk and maintain indemnity insurance cover of no less than R5 million.
In a similar vein FSB issued in July 2015, Board Notice 138 of 2015 for managers of participation bonds. The board notice sets out the same capital
51 The two board notices are available on the FSB website at http://www.fsb.co.za.

35Financial Stability Review September 2015
requirements as those required by hedge fund managers. An additional proviso for the participatory bonds is that managers of these Collective Investment Schemes (CISs) should ensure sufficient liquid capital for tax-free participatory interests.
The board notices issued by the FSB will provide it with better oversight over any systemic issues that may arise from the managers of these funds. The strengthening of the regulation of the hedge fund sector is in line with global reforms which aim to enhance oversight and supervision of financial market participants. Along with the new regulatory regime for hedge funds, the reforms are expected to improve investor protection, reduce the possibility of systemic risk and promote market integrity.

The proposals in the Draft review of limitations on fees and interest-rates (Notice) provide for a general lowering of interest-rate ceilings in most types of consumer loans, an increase in initiation fees and an across-the-board increase in loan-related accounts or management fees of R10. The details of these changes for the different categories of loans are summarised in Table 3A.
The biggest change relates to unsecured credit transactions where the proposed ceiling is set at 24,8 per cent compared to the current 32,7 per cent – a decrease of 7,9 percentage points. Other significant changes in the interest-rate ceilings are in the second or subsequent short-term loans category where the maximum interest-rate has dropped from 5 per cent per month to 3 per cent per month, and credit facilities where the maximum has dropped from 22,65 per cent to 19,78 per cent, that is, a 2,9 percentage points drop. Allowances have been made for a marginal increase of 0,1 per cent in the maximum permissible interest-rate charged on mortgage agreements, developmental credit agreements and other loan agreements.
Reduced interest-rate ceilings are offset to some extent by a proposed increase of 20 per cent in the monthly administration fees from R50 to R60
and an increase in initiation fees of generally 5 per cent from R1 000 to R1 050 per loan. The absolute increase in rand terms is relatively small and there has not been an increase in this kind of fee for a number of years. It is also not certain whether the offset in the fee increases will compensate lenders adequately for the decreasing ceilings in high-margin but fairly risky unsecured loans, or for the increases in the operational costs related to the credit provided.
The total loan yield for unsecured loan sizes (Table 3B) from R5 000 to R50 000 will range from 44,8 per cent to 26,9 per cent respectively. As the loan amount is increased above R50 000, the total loan yield decreases, reflecting the smaller role of loan fees (as a fixed portion of loan revenue) as loan sizes increase. In an increasing loan size scenario, the maximum interest-rate chargeable would thus play a bigger role in total loan revenue and yields. For short-term loans (i.e. six months or less), the maximum loan yields, based on a 5 per cent per month and a 3 per cent per month maximum loan charge, provide total loan yields in excess of 60 per cent and 36 per cent per annum (excluding initiation and administration fees) for the first and subsequent loans respectively during the same year.
Table 3A Proposed changes to interest-rates and fees on most of the key loans
Type of credit
Proposed maximum
interest-rateCurrent maximum
interest-rate
Difference per annum (unless
indicated otherwise)
Proposed initiation fees
Current initiation fees
Difference in monthly fee
Mortgage agreements
RRa + 12 per cent = 17,75per cent
p.a.17,65 per cent
p.a. 0,1 per cent R1 100 to R5 250bR1 100 to R5
000c R60-R50 = R10
Credit facilities
[(RR x 1.7) + 10 per cent] p.a. =19.78
per cent 22,65 per cent p.a -2,9 per cent R165 to R1 050d R165 to R1 000e R60-R50 = R10
Unsecured credit transactions
[(RR x 1.7) + 15] p.a. = 24,78 per
cent 32,65 per cent -7,9 per cent R165 to R1 050fR165 to R1 000g R60-R50 = R10
Short-term loan agreements (within a calendar year)
1st loan: 5 per cent p.m. 5 per cent p.m. 0
R165 to R1 050h R165 to R1 000i R60-R50 = R10Further loans:h 3
per cent p.m. 5 per cent p.m. -2 per cent p.m.
Developmental credit agreements
[(RR x 1.7) + 23 per cent = 32,78 per
cent 32,65 per cent 0,1 per cent R165 to R1 050 R165 to R1 000 R60-R50 = R10
Other credit agreements
RR + 17 per cent = 22,75 per cent 22,65 per cent 0,1 per cent R165 to R1 050 R165 to R1 000 R60-R50 = R10
Notes to the table56
a. The repo rate is at 5,75 per cent. Note that the South African Reserve Bank increased the repo rate by 25 basis points to 6 per cent in July 2015.b. The proposed initiation fee for mortgage loans is R1 100 plus 10 per cent of the amount greater than R10 000 but not exceeding R5 250. c. The current initiation for mortgage loans is R1 100 plus 10 per cent of the amount greater than R10 000 but not exceeding R5 000.d. f and i. [The proposed initiation fee for credit facilities is R165 per credit agreement plus 10 per cent of the amount greater than R1 000 but not exceeding R1 050.
The same calculation applies to unsecured credit transactions, short-term agreements, developmental credit agreements and other credit agreements.] e,g and i. The proposed initiation fee for credit facilities is R165 per credit agreement plus 10 per cent of the amount greater than R1 000 but not exceeding R1 000. The same calculation applies to unsecured credit transactions, short-term agreements, developmental credit agreements and other credit agreements.
Box 3: A summary of the draft review of limitations on fees and interest rates
Financial Stability Review September 201536

Box 3: A summary of the draft review of limitations on fees and interest rates
Box 3: A summary of the draft review of limitations on fees and interest rates
Table 3B Calculations on maximum loan yields per loan size in current versus proposed ceilings
Yield per unsecured loan size
New/old caps New/old caps New/old caps New/old caps
loan size (Rand) 5000 5000 8000 8000 20 000 20 000 50 000 50 000
Loan term assumed (yrs)
2 2 2 2 3 3 3 3
Initiation fee pa 1 239 1 633 1 982 2 612 4 956 6 530 12 390 16 325
Maintenance fee pa
283 275 433 425 350 333 350 333
Total loan revenue
720 600 720 600 720 600 720 600
Loan yield2 242 2 508 3 135 3 637 6 026 7 463 13 460 17 258
44,8 per cent 50,2 per cent 39,2 per cent 45,5 per cent 30,1 per cent 37,3 per cent 26,9 per cent 34,5 per cent
Interest (per cent) Initiation
24,8 per cent 32,7 per cent 24,8 per cent 32,7 per cent 24,8 per cent 32,7 per cent 24,8 per cent 32,7 per cent
Fee (per cent) 5,7 per cent 5,5 per cent 5,4 per cent 5,3 per cent 1,8 per cent 1,7 per cent 0,7 per cent 0,7 per cent
Monthly management fee
14,4 per cent 12,0 per cent 9,0 per cent 7,5 per cent 3,6 per cent 3,0 per cent 1,4 per cent 1,2 per cent
Source: UBS Limited, ‘South African banks: proposed credit pricing caps – another headwind’, 2 July 2015.
37Financial Stability Review September 2015

Financial Stability Review September 201538
Financial stability risks and outlook
Assessing financial stress
The mechanics behind the compilation of the Financial Stress Index (FSI) and its application for South Africa was explained in the March 2015 edition of the Financial Stability Review. The FSI, which increased sharply over the period 2006 to 2009 (Figure 48) and which coincided with the international financial crisis of that period, remained relatively unchanged for some time thereafter. However, the FSI again increased gradually from July 2013 to reach its maximum in February 2015 before easing somewhat. The moderation in the FSI since February could mainly be ascribed to a narrowing of the interbank liquidity spread (one of the components used in the calculation of the FSI). Overall, it would appear that the FSI indicates a slight easing in financial stress.
Assessing financial stability risksThe Bank considers developments and trends in the global and domestic environments on a continual basis in an attempt to pre-emptively detect and mitigate risks to, and weaknesses in, the domestic financial system. A number of key scenarios regarding potential threats to financial stability are identified, explained within the analyses done and discussed in the Financial Stability Review, and rated according to the likelihood of their occurrence as well as the expected impact on the domestic financial system. Risks identified are classified as ‘high’, ‘medium’ or ‘low’.53
Table 12 Risk assessment matrix
Risk and probability Impact
Excessive volatility and risk aversion in global financial markets
High Medium
• Global financial market volatility triggered by the reassessment of risk conditions by market participants
• Changes in risk perceptions may, for example, relate to new information regarding the timing and pace of US monetary policy normalisation as well as growth developments in advanced and emerging economies, including China
• Changing investor sentiment could lead to asset-price adjustments with adverse spillover effects in the domestic financial market
• Sharp reversal of capital flows from emerging-market economies, including South Africa
• The rand depreciates further • Increased cost of borrowing and debt-
servicing costs for domestic corporates and households, culminating in higher impairments and deteriorating asset quality of banks
• Increased risks for corporates with high and unhedged foreign-currency exposure
Protracted period of slow global economic growth
Medium High
• An extended period of slow global growth with risks to growth rotating between advanced and emerging economies
• Lower growth in China negatively impacting on commodity prices and the growth prospects of other economies
• Slow recovery in the euro area resulting in an additional round of quantitative easing
• Japan moves into a recession and is trapped in conditions of low growth and low inflation (possible deflation) for a long time
• Commodity exporters in emerging economies experience weak demand, falling commodity prices and depreciating exchange rates, all of which impact negatively on their corporate sectors
• Extended periods of fiscal and current-account weaknesses, which impact negatively on credit ratings and access to funding
53 ‘High’: almost certain to occur; ‘medium’: possible; ‘low’: unlikely to occur (a tail risk).
Index
0,0
0,1
0,2
0,3
0,4
0,5
0,6
0,7
0,8
0,9
Figure 48 Financial Stress Index for South Africa
2012201020082006 2014
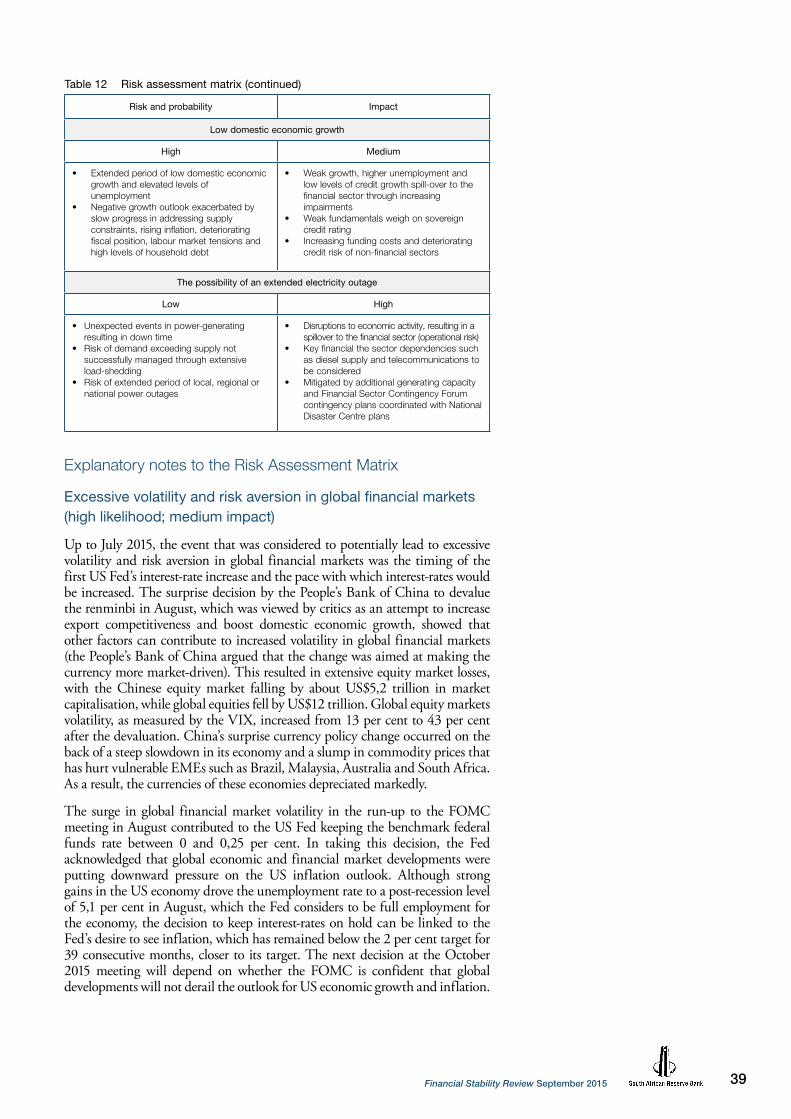
39Financial Stability Review September 2015
Table 12 Risk assessment matrix (continued)
Risk and probability Impact
Low domestic economic growth
High Medium
• Extended period of low domestic economic growth and elevated levels of unemployment
• Negative growth outlook exacerbated by slow progress in addressing supply constraints, rising inflation, deteriorating fiscal position, labour market tensions and high levels of household debt
• Weak growth, higher unemployment and low levels of credit growth spill-over to the financial sector through increasing impairments
• Weak fundamentals weigh on sovereign credit rating
• Increasing funding costs and deteriorating credit risk of non-financial sectors
The possibility of an extended electricity outage
Low High
• Unexpected events in power-generating resulting in down time
• Risk of demand exceeding supply not successfully managed through extensive load-shedding
• Risk of extended period of local, regional or national power outages
• Disruptions to economic activity, resulting in a spillover to the financial sector (operational risk)
• Key financial the sector dependencies such as diesel supply and telecommunications to be considered
• Mitigated by additional generating capacity and Financial Sector Contingency Forum contingency plans coordinated with National Disaster Centre plans
Explanatory notes to the Risk Assessment Matrix
Excessive volatility and risk aversion in global financial markets (high likelihood; medium impact)
Up to July 2015, the event that was considered to potentially lead to excessive volatility and risk aversion in global financial markets was the timing of the first US Fed’s interest-rate increase and the pace with which interest-rates would be increased. The surprise decision by the People’s Bank of China to devalue the renminbi in August, which was viewed by critics as an attempt to increase export competitiveness and boost domestic economic growth, showed that other factors can contribute to increased volatility in global financial markets (the People’s Bank of China argued that the change was aimed at making the currency more market-driven). This resulted in extensive equity market losses, with the Chinese equity market falling by about US$5,2 trillion in market capitalisation, while global equities fell by US$12 trillion. Global equity markets volatility, as measured by the VIX, increased from 13 per cent to 43 per cent after the devaluation. China’s surprise currency policy change occurred on the back of a steep slowdown in its economy and a slump in commodity prices that has hurt vulnerable EMEs such as Brazil, Malaysia, Australia and South Africa. As a result, the currencies of these economies depreciated markedly.
The surge in global financial market volatility in the run-up to the FOMC meeting in August contributed to the US Fed keeping the benchmark federal funds rate between 0 and 0,25 per cent. In taking this decision, the Fed acknowledged that global economic and financial market developments were putting downward pressure on the US inflation outlook. Although strong gains in the US economy drove the unemployment rate to a post-recession level of 5,1 per cent in August, which the Fed considers to be full employment for the economy, the decision to keep interest-rates on hold can be linked to the Fed’s desire to see inflation, which has remained below the 2 per cent target for 39 consecutive months, closer to its target. The next decision at the October 2015 meeting will depend on whether the FOMC is confident that global developments will not derail the outlook for US economic growth and inflation.
Financial Stability Review September 201540
Improved economic and financial fundamentals will further strengthen the US dollar, with a likely negative impact on most currencies, especially in EMEs with a high degree of international financial integration. EMEs, including South Africa, are particularly vulnerable as they could face a reversal of portfolio flows, especially if yields on US securities rise once policy normalisation takes place in the US.
Protracted period of slow global economic growth (medium likelihood; high impact)
Exports from China, the main growth engine of the economy, have fallen throughout 2015 while the housing market experienced steep declines in home prices and sales. The recent stock market crash and generally weak economic fundamentals suggest that South Africa’s economy is headed for a sharp slowdown after a decade of rapid economic growth. Slowing demand from China has led to a slump in global commodity prices, with adverse effects for commodity-exporting countries, the majority of which are EMEs. Moreover, because growth in emerging markets has been a driver of world GDP since the financial crisis, the broad impact of slowing growth in EMEs need not be under-estimated. These weaknesses have raised concerns that the slowdown in China, the world’s second-largest economy, could trigger another global recession.
Economic recovery in the euro area is still not broad-based. Countries that experienced stronger-than-expected growth, such as Italy, Spain and Ireland, were sustained by continued recovery in domestic demand. This was offset by weaker-than-expected economic growth in Germany, the euro area’s largest economy. In Japan, economic growth declined in the second quarter, mainly pulled down by substantial declines in exports, after a strong rebound in the first quarter. The UK economy grew at an annualised rate of 2,25 per cent in the first half of 2015, with unemployment falling to a pre-crisis level of 5,5 per cent. The US economy also experienced strong growth in the second quarter after a weaker-than-expected first-quarter performance.
In Latin America, the downturn in Brazil was much worse than market expectations, with the economy entering a technical recession in the second quarter of 2015. Growth momentum also continued to weaken in other countries of the region due to declining commodity prices. In Russia, GDP contracted by 4,6 per in the second quarter of 2015, following a contraction of 2,2 per cent in the first quarter. As one of several resource-rich countries reliant on oil exports, Russia has had to contend with the price slide attributed to oversupply and reduced worldwide demand. Declining oil prices and difficulty attracting foreign direct investment have contributed to a noticeable slowdown in the GDP growth rate. Growth in sub-Saharan Africa and the Middle East is expected to slow in 2015 on the back of declining oil prices, declines in other commodity prices, and geopolitical and domestic political turmoil in a number of countries.
Overall, global output has been revised downwards to 3,1 per cent in 2015, from 3,4 per cent, in the April 2015 World Economic Outlook.
Low domestic economic growth (high likelihood; medium impact)
The South African economy contracted in the second quarter of 2015. Real GDP fell at an annualised rate of 1,3 per cent, reversing the positive growth of equal magnitude that was recorded in the first quarter of the year. During the second quarter, real output contracted sharply in the agricultural sector, brought about by widespread drought conditions. Real value added also fell back considerably in the mining, manufacturing and electricity sectors of the economy as a combination of disappointing global and domestic demand conditions and supply constraints, including electricity load-shedding, weighed

41Financial Stability Review September 2015
on production. The trade and accommodation sector also registered a marginal contraction, reflecting subdued domestic sales and tourism expenditure. Lacklustre production was reflected in meagre job creation. Over the year to the second quarter of 2015, the bulk of the jobs that were created was in the informal sector rather than in the formal sector of the economy, while roughly one in four workers remained unemployed. Debt levels of households remained high, making it more difficult for households to withstand economic contractions and increases in interest-rates. The composite leading business cycle indicator decreased by 3,6 per cent in the year to July 2015. Only two of the ten component time series that were available for July 2015 increased, while eight decreased. The largest negative contribution to the movement in the composite leading indicator in July came from a decrease in the US dollar-based export commodity price index, followed by a decrease in the number of residential building plans passed.
In June 2015, S&P and Fitch affirmed South Africa’s BBB rating with a stable outlook. S&P based its review on the assumption that the country will experience continued broad political and institutional stability, and maintain fairly strong transparent institutions and deep financial markets as well as policy continuity. However, the agency highlighted some weaknesses that needed attention, which included lacklustre reforms, low GDP growth, financing of the current-account deficit, sizable government debt and potentially volatile external financing flows. While Fitch maintained its BBB rating, the agency issued a warning about the negative outlook. To avoid a downgrade, the agency suggested alleviating economic growth constraints by easing electricity-supply bottlenecks, implementing ambitious structural reforms (e.g. the National Development Plan), and avoiding debilitating labour disputes and policies that impair the business climate.
On 2 September 2105, Moody’s affirmed South Africa’s investment credit rating at Baa2 with a stable outlook, based on the expectation that the fiscal consolidation path outlined in the 2015/16 budget would be maintained. The agency believed that government’s current fiscal prudence, its ability to collect taxes, its adherence to the expenditure ceiling and its strong institutions supported South Africa’s investment credit rating. Moody’s argued that the implementation of key structural reforms outlined in the National Development Plan will be critical in dealing with supply-side constraints and unlocking the country’s growth potential. The agency cautioned that the rating could be downgraded if the commitment to fiscal consolidation and debt stabilisation falters, if the investment climate deteriorates further or if there is a significant rise in contingent liabilities.
The possibility of an extended electricity outage (low likelihood; high impact)
Even though financial institutions and financial infrastructure organisations have contingency plans to continue with operations during periods of extended power outages, their ability to be fully operational depends on, among other things, how extensive the outage is, whether it is regional or national, and the availability of communication networks and fuel supply. To this end, the Financial Sector Contingency Forum (FSCF) has engaged the petroleum industry (to determine its capacity to provide fuel during periods of prolonged power failure) as well as the communication networks, payment systems cash distribution functions and major retailers (to confirm their contingency plans). Given that the availability of fuel is key to ensuring generating capacity during extended power outages, a country-wide contingency plan is being developed, including a preference list of some industries (e.g. banks, telecommunications, emergency services and key retailers), to determine both the quantities of fuel needed by these industries and the location where it has to be delivered.

Financial Stability Review September 201542
Until mid-September 2015, South African consumers had not experienced load-shedding for more than five weeks. Planned maintenance at the Cahora Bassa hydroelectric scheme resulted in a shortage of generating capacity that forced Eskom to implement Stage 1 load-shedding. While the electricity infrastructure programmes have encountered numerous delays, a significant milestone in the quest to resolve the bottlenecks in the economy was reached at the end of August 2015 when full commercial operation of the first generating unit completed at the Medupi power station, Unit 6, commenced, adding almost 800 MW to the capacity of the electricity grid.

43Financial Stability Review September 2015
Macroprudential policy regulation
Assessing the aplication of the countercyclical capital buffer for banks
The countercyclical capital buffer (CCB) was designed to take into account the macrofinancial environment in which banks operate. Specifically, the countercyclical capital buffer framework54 provides supervisors with a tool to change capital requirements in order to protect banks from the boom and bust phases of the financial cycle. The methodology suggests that imposing the CCB should be considered for banks during periods of excessive credit extension or if the private-sector credit-to-GDP ratio is above its long-term trend.55 The private-sector credit-to-GDP gap for South African banks is presented in Figure 49.56
Subsequent to the most recent global financial crisis, the total credit-to-GDP gap for South Africa had been declining. US tapering and even the expectation thereof have seemingly not influenced this indicator significantly. For the period under review, the private-sector credit-to-GDP gap remained negative, indicating that growth in private-sector credit extension remained below its long-term average.
Credit-to-GDP gaps can also be calculated for subcategories of credit. Shown in Figure 50 are the subcategories of total claims on the domestic private sector in June 2015, namely ‘other loans and advances’ (41 per cent of total credit), ‘mortgage advances’ (40 per cent of total credit), ‘instalment sale credit’ (12 per cent of total credit extended) and the remaining categories, including leasing finance making up the rest (7 per cent of total credit extended). Credit extended in the various loan categories continued to exhibit different growth trajectories relative to their respective long-term trends. The credit-to-GDP gap for other loans and advances indicates that credit growth in this subcategory of credit remains above its long-term trend, while the growth rate of mortgage advances relative to GDP remains below its long-term trend.
The credit-to-GDP gap for mortgage advances not only remained well below its long-term trend, but declined even further. The credit-to-GDP gaps of leasing finance etcetera and instalment sales remained relatively constant, growing in line with their respective long-term trends. The main objective of the CCB is to protect banks from the effects of the financial cycle57 or the boom and bust cycles that characterise the financial system. It is therefore important to also take developments in the financial cycle into consideration (see Box 4 on page 45).
54 Basel Committee on Banking Supervision, Guidance for national authorities operating the countercyclical capital buffer, December 2010.
55 The credit-to-GDP gap is calculated as the difference between the credit-to-GDP ratio and its long-term trend. In accordance with recommendations by the Basel Committee on Banking Supervision, the trend is estimated using a one-sided Hodrick–Prescott filter using a recommended smoothing parameter (λ) of 400 000. See Basel Committee on Banking Supervision, Guidance for national authorities operating the countercyclical capital buffer, December 2010.
56 Calculations were done using data from 1965 onwards.
57 Basel Committee on Banking Supervision, Guidance for national authorities operating the countercyclical capital buffer, December 2010.
Per cent
-10
-5
0
5
10
15
Figure 49 Private-sector total credit-to-gross domestic product gap
1998 2002 2006 2010 20141994
Source: South African Reserve Bank
Per cent
-8
-6
-4
-2
0
2
4
6
8
10
Figure 50 Selected private-sector credit-to- gross domestic product gaps according to selected credit categories
1998 2002 2006 2010 20141994
Leasing finance, bills discounted and investments Other loans and advances Mortgage advances Instalment sale credit
Source: South African Reserve Bank

Financial Stability Review September 201544
Consideration for the activation of the countercyclical capital buffer for banks
According to the phase-in arrangements for the minimum requirements of Basel III, the CCB could be applied by banks in South Africa from 2016 if required.58 However, the credit-to-GDP gap remains well below any likely calibration of the lower threshold of the countercyclical buffer add-on for South African banks.59 Therefore, there is currently no need from a macroprudential regulatory perspective to consider a CCB add-on for South African banks. The Bank has not yet contemplated applying the CCB add-on on individual loan categories.
58 South African Reserve Bank Guidance Note D5/2013.
59 Note that instruments for macroprudential policy should not be applied mechanistically, but should be subject to judgement.

60
Prior to the most recent global financial crisis, several countries experienced credit and housing booms as the best performance of the global economy of the past four decades was observed. South Africa also experienced strong growth rates in both credit and house prices prior to the recent global financial crisis (Figure 4A). However, globally, these credit and housing booms ended in credit crunches and asset price busts in addition to other financial disruptions, and resulted in the most severe financial crisis since the Great Depression.
Against this background, financial cycles became a central topic of research, especially after the crisis, when it became evident that a pure business cycle view was not sufficient to understand the evolution of the global economy.64
What are financial cycles?
Despite the surge in interest and research covering various aspects of financial market developments, financial cycles are still not well understood, and there is still no formal agreed-upon definition. One popular version focuses on the self-reinforcing interaction of perceptions of value and risk, risk appetite and financing constraints, which can amplify economic fluctuations and result in financial stress (Borio, 2013).
How are financial cycles measured?
Financial cycles are generally measured by the co-movement of a broad set of financial variables.65 Given that risk perceptions are not easily measurable, it is unclear which set of financial variables or specific financial indicators would be most reflective of the financial cycle. Indicators that have been found to give the most parsimonious description of the financial cycle include credit and property prices (Drehman et al., 2012 and Borio, 2012).66 Credit aggregates (which can be used as a proxy for leverage) and property prices (a measure of collateral available) play a particularly important role in the financial cycle because swift increases in credit extended, specifically mortgage credit, result in higher property prices. Higher house prices boost collateral values and hence the amount of credit the private sector can obtain. These mutually reinforcing interactions are viewed as having historically caused the most serious macroeconomic dislocations.67 In addition to credit and housing market developments, equity prices (see, for example, Claessens et al., 2011) and bond prices (European Central Bank, 2015) can also be used to estimate the financial cycle.
A set of financial price and quantity variables could also be combined statistically so as to extract their common components. Variables used in this set could include interest-rates, measures of volatility, risk premiums, default rates, non-performing loans, or risk appetite (Hatzius et al., 2011; BIS Annual Report, 2014).
An estimate of the South African financial cycle
Figure 4B depicts the financial cycle in South Africa, estimated using total credit, residential property prices and equity prices as indicators. Following Drehmann, Borio and Tsatsaronis (2012), the band-pass filter suggested by Christiano and Fitzgerald (2003) was used to isolate the component of each series that corresponds to the chosen frequency interval, that is, with a duration between 8 and 30 years (or 32 and 120 quarters). All data series were deflated by the consumer price index and in logs, and expressed as four-quarter changes. Furthermore, all series were normalised by their respective value in the first quarter of 1985 to ensure comparability of the units.
In line with other studies (e.g. Drehmann et al., 2011, 2012; Borio, 2012; Claessens et al., 2011), it can be seen in Figure 4C that the financial cycle has a much lower frequency than the traditional business cycle (calculated here using the Christiano–Fitzgerald filter with a duration between 5 and 32 quarters). Furthermore, the peaks of the financial cycle are closely associated with financial stress. For example, the financial cycle peaked prior to the onset of the most recent global financial crisis and also in the early 1980s as the gold price booms of 1979–80 and 1982–83 collapsed and the rand depreciated strongly before to the debt crisis in 1985.
References:
Aikman, D, Haldane, A and Nelson, B. 2010. ‘Curbing the credit cycle’. Paper presented at the Columbia University Center on Capitalism and Society Annual Conference, New York, November.Borio, C. 2014. ‘The financial cycle and macroeconomics: what have we learnt?’ Journal of Banking and Finance 45(395): 182–198.Drehmann, M, Borio, C and Tsatsaronis, T. 2012. ‘Characterising the financial cycle: don’t lose sight of the medium term!’ BIS Working Papers No. 380. Basel: Bank for International Settlements.Christiano, L and Fitzerald, T. 2003. ‘The band-pass filter’. International Economic Review 44(2): 435–65.Hatzius, J, P Hooper, F Mishkin, K Schoenholtz, M Watson. 2010. ‘Financial conditions indexes: a fresh look after the financial crisis’. NBER Working Papers No.16150.Fell, J. 2015. ‘Financial cycles in the euro area: where do we stand?’ Presentation at the Analytical Group on Vulnerabilities, 8–9 July 2015.
64 See the section ‘Debt and the financial cycle: domestic and global’ in the BIS 84th Annual Report, 29 June 2014.
65 See the BIS 85th Annual Report, 28 June 2015, available at www.bis.org/publ/arpdf/ar2015e.htm.
66 Several studies only include credit and estimate a credit cycle, for example Aikman et al. (2010.
67 See the BIS 84th Annual Report, 29 June 2014, available at www.bis.org/publ/arpdf/ar2014e.htm.
Box 4: Financial cycles
Figure 4A Annual growth rates of house prices and credit extended
Annual growth rate
-10
-5
0
5
10
15
20
25
30
35
40
Global financial crisis House prices Credit extendedSources: South African Reserve Bank and Absa Bank Limited
1990 1992 1994 1996 1998 2000 2002 2004 2006 2008 2010 2012 2014
45Financial Stability Review September 2015

Box 4: Financial cycles
Figure 4B The financial cycle
Per cent, 4-quarter changes
-1,5
-1,0
-0,5
0,0
0,5
1,0
1,5
Credit House prices
Sources: South African Reserve Bank and author’s calculations
Equity Financial cycle
1966 1970 1975 1980 1985 1990 1995 2000 2005 2010 2015
Figure 4C Comparison of the business cycle and financial cycle
Amplitude
-0,8
-0,6
-0,4
-0,2
0,0
0,2
0,4
0,6
0,8
1,0
Downward phases of the business cycle Financial cycle Business cycle
Sources: South African Reserve Bank and author’s calculations
1966 1970 1975 1980 1985 1990 1995 2000 2005 2010 2015
Financial Stability Review September 201546

47Financial Stability Review September 2015
Abbreviations
AGR augmented Guidotti ratioAML anti-money launderingBanks Act Banks Act 94 of 1990BASA Banking Association of South AfricaBCBS Basel Committee on Banking SupervisionBDI business debt indexBER Bureau for Economic ResearchBETI BankservAfrica Economic Transaction IndexBIS Bank for International SettlementsBMR Bureau of Market ResearchBoard Board of DirectorsBRICS Brazil, Russia, India, China and South AfricaCAR capital-adequacy ratioCBOE Chicago Board Options ExchangeCCB countercyclical capital bufferCCI consumer confidence indexCDS credit default swapCFT combating the financing of terrorismCFTC Commodities Futures Trading CommisionCFVI Consumer Financial Vulnerability IndexCSD central securities depositoryDGS deposit guarantee schemeDRI designated resolution institutiondti Department of Trade and IndustryEDF expected default frequencyEME emerging-market economyEMEA Europe, the Middle East and AfricaFIC Financial Intelligence CentreFIC Act Financial Intelligence Centre Act 38 of 2001FNB First National BankFOMC Federal Open Market CommitteeFSAP Financial Sector Assessment ProgrammeFSB Financial Services BoardFSC Financial Stability CommitteeFSCF Financial Sector Contingency ForumFSI Financial Stress IndexG-20 Group of Twenty Finance Ministers and Central
Bank GovernorsGDP gross domestic productGR Guidotti ratioH-index Herfindahl–Hirschman IndexHQLA high-quality liquid assets IAIS International Association of Insurance SupervisorsICR interest coverage ratioIEMP Index at exchange market pressureIFRS International Financial Reporting StandardsIIF Institute of International FinanceIMF International Monetary FundIOSCO International Organization of Securities CommissionsJibar Johannesburg Interbank Average RateLCR liquidity coverage ratioMMF money-market fundMSCI Morgan Stanley Capital InternationalNBFI Non-bank financial institutionsNCA National Credit Act 34 of 2005NCR National Credit RegulatorNCWO no creditor worse off
Box 4: Financial cycles

Financial Stability Review September 201548
NSII network systemic indexNT National TreasuryODP over-the-counter derivative providerOFI other financial intermediaryOPEC Organization of the Petroleum Exporting CountriesOTC over the counterPMI Purchasing Managers’ IndexRCAP Regulatory Consistency Assessment Programmerepo repurchase RFR risk-free benchmark rateROE return on equityROSC Report on the Observance of Standards and CodesS&P Standard & Poor’sSAM solvency assessment and managementSAMOS South African Multiple Option SettlementSOE state-owned enterprisesSIFI systemically important financial institutionTR trade repositorythe Bank South African Reserve Bankthe Bill Financial Intelligence Amendment Bill, 2015the Fed United States Federal Reservethe Insurance Bill [draft] Insurance Laws Bill, 2015the Notice draft review of limitations on fees and interest-ratesthe Regulations Regulations relating to BanksUK United KingdomUS United StatesVIX Chicago Board Options Exchange Volatility Index