Financial Stability Review (FSR) - Bank · PDF fileThe preparation of the Financial Stability...
130
-
Upload
nguyennguyet -
Category
Documents
-
view
215 -
download
0
Transcript of Financial Stability Review (FSR) - Bank · PDF fileThe preparation of the Financial Stability...
The preparation of the Financial Stability Review (FSR) is one of the avenues
through which Bank Indonesia achieves its mission “to safeguard the stability of the Indonesian
Rupiah by maintaining monetary and financial system stability for sustainable national
economic development”.
Publisher :
Bank Indonesia
Jl. MH Thamrin No.2, Jakarta
Indonesia
Information and Orders:
This edition is published in March 2011 and is based on data and information available as of December 2010, unless stated
otherwise.
The PDF format is downloadable from: http://www.bi.go.id
For inquiries, comments and feedback please contact:
Bank Indonesia
Directorate of Banking Research and Regulation
Financial System Stability Bureau
Jl.MH Thamrin No.2, Jakarta, Indonesia
Phone : (+62-21) 381 8902, 381 8075
Fax : (+62-21) 351 8629
Email : [email protected]
FSR is published biannually with the objectives:
To improve public insight in terms of understanding financial system stability.
To evaluate potential risks to financial system stability.
To analyze the developments of and issues within the financial system.
To offer policy recommendations to promote and maintain financial system stability.

Financial Stability Review
( No. 16, March 2011)
Bolstering Financial System Stability amid a deluge of Foreign Capital Inflows
Theme:
Directorate of Banking Research and Regulation
Financial System Stability Bureau

ii
iii
Foreword .............. .................................................................................................................................................. vi
Overview ......... ........................................................................................................................................................ 1
Chapter 1. Risk from the Global Environment ............................................................................................................ 5
1.1. Sources of Vulnerability ........................................................................................................................... 8
1.2. Strengthening Risk in Indonesia............................................................................................................... 12
Chapter 2. Financial System Resilience ....................................................................................................................... 21
2.1. Financial System Structure and Resilience ................................................................................................. 23
2.2. Banking System Risk................................................................................................................................. 24
2.3. Potential Financial Market Risk and Financing........................................................................................... 36
Boks 2.1. Bank Liquidity Resilience ................................................................................................................. 46
Boks 2.2. Undisbursed Loans.......................................................................................................................... 49
Boks 2.3. Impact of Credit on Inflation ........................................................................................................... 52
Boks 2.4. Prime Lending Rate Policy Transparency .......................................................................................... 54
Boks 2.5. Sources of Bank Profitability ............................................................................................................ 56
Chapter 3. Strengthening Financial Infrastructure....................................................................................................... 59
3.1. Payment System Efficiency ....................................................................................................................... 61
3.2. Payment System Performance and Risk Mitigation.................................................................................... 65
Chapter 4. Special Topic ............................................................................................................................................ 67
4.1. Financial Sector Reform ........................................................................................................................... 69
4.2. Financial System Safety Net: Cooperation To Create And Maintain Financial System Stability.................... 76
4.3. Crisis Management Protocol (CMP) .......................................................................................................... 77
Boks 4.1 Financial Inclusion ............................................................................................................................. 79
Boks 4.2 Green Banking.................................................................................................................................. 82
Chapter 5. Financial System Stability Challenges and Prospects .................................................................................. 85
5.1. Future External and Internal Economic Conditions .................................................................................... 87
5.2. Financial System Stability Challenges ........................................................................................................ 88
5.3. Financial System Stability Outlook ............................................................................................................ 90
Article........................................................................................................................................................................ 91
Article 1 Risk Behaviour in the Monetary Policy Transmission Mechanism in Indonesia .................................. ... 93
Article 2 Towards Stronger ASEAN financial System : A Proposal for Regional Financial Stability Framework .... 107
Table of Contents
iv
List of Tables and Figures
Tables Figures
1.1 Breakdown of Global Economic Growth......... 81.2 State Budget Realisation for Semester I & II, 2010 151.3 Household Expenses and Income.................... 171.4 Effect of Rupiah Depreciation on
Conglomerate Equity ..................................... 19
2.1 Number of Financial Institutions ..................... 232.2 Deposit Withdrawals Simulation..................... 262.3 Profit/Loss ...................................................... 342.4 VaR SUN ........................................................ 382.5 SBN Ownership .............................................. 382.6 Indices of several Global Stock Markets .......... 402.7 Share Price Indices by Sector .......................... 402.8 Jakarta Composite Index (Commodities) ..... 402.9 Financial Ratios of Finance Companies ........ 442.10 NPL of Finance Companies.......................... 442.11 NPL performance of Finance Companies ..... 45
3.1 BI-SSSS Transactions ................................... 63
4.1 Salient Regulations and ImplementationSchedule of Basel III .................................... 72
4.2 Recapitulation of Capital Ratio andLeverage Ratio............................................ 73
5.1 Projections of GDP and Inflation ................. 875.2 Economic Growth in Indonesia according
to Type....................................................... 88
Tables Box
2.1.1 LCR by Bank Group .................................... 472.1.2 NSFR by Bank Group................................... 47
1.1 Global Stock Market Indices (2000=100)........ 91.2 CDS in GIIPS countries and Germany.............. 91.3 CDS in leading Eurozone countries and
Switzerland .................................................... 91.4 CDS in several Asian Countries....................... 101.5 Stock Market Indices in several Countries
in 2010.......................................................... 101.6 Private Capital Flows – FDI and Portfolio to
EM in Asia, Europe and Latin America ............ 101.7 Private Capital Flows to Emerging Markets ..... 111.8 Global Price Indices ........................................ 111.9 Price Indices of several International
Commodities ................................................. 111.10 UBS CMCI Composite Price Index by Sector.... 121.11 Indonesian Development of Non-Oil Export
Import............................................................ 121.12 Indonesia Development of Total Exports and
Imports .......................................................... 121.13 Rupiah Exchange Rate.................................... 131.14 Rupiah Exchange Rate Volatility...................... 131.15 Composition of Direct and Portfolio Investment
to Indonesia ................................................... 131.16 Inflation in Indonesia (Core and Headline) ...... 141.17 Price Indices of Foodstuffs and Oil in Indonesia,
2006 = 100.................................................... 141.18 Inflation in several Advanced Countries .......... 141.19 Inflation in several ASEAN Countries .............. 141.20 Real Interest Rates.......................................... 151.21 Consumer Confidence Index .......................... 161.22 Composition of Household Expenditure
2009-2010..................................................... 161.23 Price Expectation Index for 3 & 6 Months ....... 171.24 Credit and NPL in the Household Sector ......... 171.25 ROA& ROE of Non-financial Public Listed
Companies..................................................... 181.26 DER and TL/TAof Non-financial
Public Listed Companies................................. 181.27 Key Financial Indicators for the Corporate
Sector ............................................................ 181.28 Ratio of Net Foreign Liabilities to Equity.......... 19
v
Figures Box
2.1 Asset Compositions of Financial Institutions ... 232.2 Financial Stability Index, 1996-2010 ............... 242.3 Share of Bank Funding and Financing............. 242.4 Deposit Growths by Semester ........................ 242.5 Deposit Growth based on Ownership............. 252.6 Liquid Assets by Component .......................... 252.7 Share of Placements held at Bank Indonesia ... 252.8 Credit Growth by Type................................... 272.9 Property Credit Growth.................................. 272.10 Credit Growth by Currency ............................ 272.11 Loan to Deposit Ratio by Currency ................. 272.12 MSM Credit Growth (yoy) .............................. 282.13 MSM Lending Rates (%)................................. 282.14 Share of MSM Credit ..................................... 292.15 Loans to Deposits Ratio (LDR) ......................... 292.16 Non-Performing Loans (NPL)........................... 292.17 NPL Ratio by Loan Type .................................. 302.18 NPL Ratio by Currency.................................... 302.19 NPL Ratio by Economic Sector ........................ 312.20 NPL Ratio of Property Loans ........................... 312.21 Gross NPL Ratio of MSM and Non-MSM Loans 312.22 Results of Stress Testing Credit Risk................ 322.23 Rupiah Maturity Profile................................... 322.24 USD Maturity Profile....................................... 322.25 Results of Stress Testing Interest Rate Increases 332.26 Net Open Position (NOP) ................................ 332.27 Results of Stress Testing Rupiah Depreciation . 332.28 Results of Stress Testing a decline in SUN Price 332.29 Rupiah interest Rate Spread ........................... 342.30 Composition of Operational Profit/Loss .......... 342.31 Net Interest Income (monthly) ........................ 352.32 Share of Bank Interest Income........................ 352.33 Capital ........................................................... 352.34 Risk-Weighted Assets .................................... 352.35 Tier 1 and Tier 2............................................. 362.36 Foreign Investments (SBI, SUN and Stock) ....... 362.37 Foreign Portfolio of Rupiah Financial Assets
(SBI, SUN and Stock) ...................................... 372.38 Foreign Capital Inflows and the Exchange Rate,
IDMA Index and JSX....................................... 372.39 SUN Price of Benchmark FR Series .................. 372.40 Average Monthly SUN Price............................ 372.41 VaR SUN ........................................................ 382.42 Maturity Profile SUN ...................................... 382.43 Corporate Bond and SUN Yield (December 2009) 392.44 Corporate Bond and SUN Yield (December 2010) 392.45 Bond Yields in ASEAN (December 2009)......... 392.46 Bond Yields in ASEAN (December 2010)......... 392.47 JSX Composite as well as Global & Regional
Indices (Indexed against the position on31st December 2005)..................................... 39
2.48 Correlation between Commodities andShare Index .................................................... 41
2.49 Volatility of several Asian Bourse Indices......... 412.50 Bank Share Prices ........................................... 412.51 Changes in Bank Share Prices......................... 412.52 Performance of Mutual Funds ........................ 422.53 Net Asset Value by Type of Fund
(in trillions of rupiah) ...................................... 422.54 Capitalization Value and Value of Issuances ... 422.55 Issuances and Position of Corporate Bonds..... 422.56 Business Activity of Finance Companies.......... 432.57 Financing Growth by Finance Companies ....... 432.58 Finance Companies’ Sources of Funds ............ 43
3.1 Nominal Transactions (billions of rupiah) ........ 613.2 Transaction Volume (in thousands)................. 623.3 BI-RTGS System Transactions.......................... 623.4 BI-SSSS Transactions....................................... 633.5 National Clearing System Transactions ........... 643.6 ATM/Debit Card Transactions......................... 643.7 Credit Card Transactions ................................ 643.8 E-money Transactions .................................... 65
4.1 Institutional Cooperative Links........................ 77
5.1 Flow of Direct Investment............................... 885.2 Growth Projections for several Countries........ 88
2.1.1 LCR by Bank Group........................................ 462.1.2 NSFR by Bank Group...................................... 482.2.1 Undisbursed Loans and Liquid Funds .............. 502.2.2 Share of Undisbursed Loans by Bank Group ... 502.2.3 Share of Undisbursed Loans by Type .............. 502.2.4 Share of Undisbursed Loans by Economic Sector 512.3.1 Factors that Influence Inflation.......................... 522.5.1 Share of main sources of Income to
Operational Income (%) ................................. 562.5.2 Share of Fee Based Income to
Operational Income (%) ................................. 562.5.3 Bank Foreign Currency/Derivative Transactions
(trillions of rupiah).......................................... 57
4.1.1 Five Pillars of Financial Inclusion...................... 80

vi
Foreword
A core purpose of Bank Indonesia is to maintain financial system stability in Indonesia. This is accomplished through
macroprudential monitoring and research to comprehensively understand risks in the financial system and factors that
can trigger a crisis. The outcome of surveillance activities, which represents a form of accountability, is published in a
review, the current being the Financial Stability Review (FSR) No. 16. The printing of FSR is considered important because
through this publication the performance and future prospects of financial system stability can be communicated in detail.
In the current edition, Bank Indonesia directly appeals to market participants to take a number of measures to mitigate
potential risk in the financial sector.
An evaluation of financial system conditions revealed that financial system stability was well preserved during the
reporting period. The banking industry and financial market demonstrated impressive performance in the second half of
2010. The total assets of commercial banks swelled to Rp3,008.8 trillion, which is equivalent to 18.73% growth, buoyed by
22.8% (yoy) credit growth. Furthermore, expansion of the intermediation function was accompanied by an improvement
in banks’prudence, as evidenced by a 2.6% decline in the gross NPL ratio (as of December 2010), which took NPL to
its lowest level since the year 2000. In terms of profitability, positive bank performance throughout 2010 was coupled
with improved net profits, achieving Rp57.31 trillion; up 26.74% on the previous year. Congruent with developments
in the banking sector, business activities on the non-bank financial market escalated in the second semester of 2010.
Accordingly, the assets of financing companies expanded by 32% on the back of a 30.74% increase in financing activity.
Meanwhile, the increase in assets of pension funds was inseparable from a 46.13% rally on the Jakarta Composite Index
(JCI), considering that the composition of investment on the capital market accounted for 68.99% of total pension fund
investment.
In general, this increase in business activity by financial institutions coexisted with increasingly resolute financial
sector stability, which was reflected by a decline in the Financial Stability Index (FSI) from 1.87 in June 2010 to 1.75 in
December of the same year. Greater stability in the financial system was linked to improved macroeconomic stability and
a favourable domestic economic outlook as well as an easing of risk in the banking sector, lower bond yield spread and
less volatility on the stock market.
Notwithstanding, vigilance and caution remained necessary when addressing financial sector development. Amid
future macroeconomic conditions that are expected to continue improving, the inundation of foreign capital flows is
expected to persist, thereby, amplifying the already excessive liquidity situation. Excess liquidity must be well managed
in order to avoid the emergence of financial system instability. In addition, the possibility of a sudden reversal of short-
term foreign capital must be continuously monitored, as it would place additional pressures on the rupiah and foreign
exchange reserves.

vii
In closing, we hope that FSR will fulfil its mission as an effective media to communicate to all relevant stakeholders
the results of surveillance activities conducted by Bank Indonesia in the context of financial system stability. Moreover,
as the saying goes, there is no ivory that is not cracked, therefore, we sincerely hope to receive any comments and
suggestions to ensure future editions of FSR live up to all of our expectations.
Jakarta, April 2011
DEPUTY GOVERNOR OF BANK INDONESIA
Muliaman D. Hadad

This page intentionally blank

Overview
1
Overview

2
Overview
This page intentionally blank
Overview
3
1. MACROECONOMY
The economic recovery proceeded rapidly in
emerging and developing economies, including Indonesia,
while, conversely the recovery was languid in more
advanced countries, therefore, emerging markets (EM)
remained an attractive investment destination. Abundant
liquidity on global markets encouraged foreign capital
to flow into emerging markets. In the case of Indonesia,
foreign capital inflows have raised assets prices and drove
rupiah appreciation.
The excess of liquidity increased the supply of short
term deposits which was mainly utilized as portfolio
investments. Nonetheless, excess liquidity necessitated
competent management in order to avoid the emergence
of additional risks that could undermine financial system
stability if utilised to finance imported goods that were
cheaper as a result of rupiah appreciation. Consequently,
the resultant pressures on the rupiah and foreign exchange
reserves would be compounded in the event of capital
outflows.
Potential inflationary pressures stemmed from
spiralling food and commodities prices, as well as
interregional distribution constraints. Under such
circumstances, the financial burden on households and
the corporate sector became more onerous. Furthermore,
the food and commodities price hikes weakened
corporate sector performance. Therefore, high inflation
had the potential to undermine the purchasing power
of households and the corporate sector, which would
ultimately raise credit risk in the financial system.
Bank Indonesia’s message to the banks and financial
market participants is as follows:
globally that could trigger the selling of securities
and, thereby, intensify volatility on the stock and SUN
markets. Such conditions could result from a sudden
and severe foreign capital reversal and would spur
financial system instability.
Bab 1 Overview
Financial system continues to be resilience in Indonesia during the second
semester of 2010. Amid a torrent of foreign capital inflows to Indonesia
and mounting inflationary pressures, the banking industry remained solid
by controlling the risks faced, which consequently tended to ease. Looking
ahead macroeconomic conditions are projected to improve, therefore, the
influx of foreign capital flows is expected to persist and, hence, exacerbate
excess liquidity conditions, which is one of the challenges confronting the
financial system in Indonesia. Additionally, the possibility of a sudden reversal
of short-term foreign capital requires vigilance.

4
Overview
2. INDONESIAN FINANCIAL SYSTEM
2.1. Profitability, Balance Sheets and Capital
2.2. Bank Liquidity and Funding
2.3. Risk transfer betwen Banks, Insurance
companies and Pension funds
5
Chapter 1. Risk from the Global Environment:Global Imbalances, a Torrent of Foreign Capital Inflows and rising Inflation
Chapter 1Risk from the Global Environment:Global Imbalances, a Torrent of ForeignCapital Inflows and rising Inflation

6
Chapter 1. Risk from the Global Environment:Global Imbalances, a Torrent of Foreign Capital Inflows and rising Inflation
This page intentionally blank

7
Chapter 1. Risk from the Global Environment:Global Imbalances, a Torrent of Foreign Capital Inflows and rising Inflation
Chapter 1 Risk from the Global Environment:
Global Imbalances, a Torrent of Foreign Capital
Inflows and rising Inflation
Global imbalances remained a key contributing factor to the deluge of foreign
capital inflows to emerging market countries, including Indonesia, during
semester-II 2010. In addition, improved economic performance in Indonesia,
strong domestic demand as well as a sound and stable banking sector were
also salient determinants of the inrush of foreign capital flows. Nevertheless,
mounting inflationary pressures spurred by spiralling food (volatile foods)
and commodity prices on the international market overshadowed robust
economic performance.
The escalation of inflationary pressures did not have any significant impact on
the purchasing power of the household sector during the reporting period. In
fact, the household sector maintained adequate financial resilience, which was
reflected by the relatively small ratio of total household debt to total assets.
Notwithstanding, if inflationary pressures continue to persist the financial
burden on households will become more onerous and while income is not
experiencing a corresponding increase the level of welfare will decline. Such
conditions ultimately have the potential to undermine household purchasing
power, thereby, exacerbating credit risk in the financial system.
Soaring inflation in the second half of 2010, stemming from rising food prices,
impinged upon corporate sector performance in the third quarter of 2010,
reflected by the weaker financial performance of non-financial public listed
companies on the Indonesian Bourse, which was evidenced by a decline in
ROA and ROE.

8
Chapter 1. Risk from the Global Environment:Global Imbalances, a Torrent of Foreign Capital Inflows and rising Inflation
1.1. SOURCES OF VULNERABILITY
1.1.1.The Global Economy and Financial Markets
The global economic recovery endured throughout
the second semester of 2010 unevenly across regions
and with a decreasing intensity. The global recovery
was signalled by an increase in global economic activity.
Manufacturing activities, exports as well as retail and
automotive sales drove economic activity in the US.
Meanwhile, manufacturing activities in Germany and
France shored up the economic recovery in Europe.
A number of risk factors slowed economic growth in
advanced countries, including high unemployment (9.4%
in December 2010) and lower property prices in the US as
well as concerns in Europe that the fiscal crises affecting
a handful of countries could spread.
Based on IMF estimates (Table 1.1), the economies of
advanced countries grew by 3.0% in quarter-IV 2010 (yoy),
much lower than that posted in emerging markets, namely
7.1%. Robust growth in emerging market countries was
attributable to strong domestic consumption in each
respective country, improved external performance in line
with the continuing global economic recovery, and soaring
commodity prices on the international market. Holistically,
global economic growth in 2010 achieved 5%.
Although the global economic landscape was mired
by uncertainty concerning the recovery in established
countries, international financial market conditions
continued to improve during the second semester of 2010
(Figure 1.1). A number of financial markets in advanced
countries, which had experienced pressures when the
crisis peaked in 2008, began to indicate much better
performance due to several factors. The economic recovery
in advanced countries, among others the United States,
United Kingdom and Japan, garnered positive sentiment
on global financial markets and gained global economic
recovery momentum. The US financial system began to
improve and annual economic growth returned to positive
subsequent to the expansionary policy of quantitative
easing1 instituted by the Federal Reserve, consisting
of additional liquidity to the tune of USD600 billion in
November 2010. Moreover, economic growth in Japan
also experienced a significant rebound, in fact posting
stronger growth than pre-crisis levels.
Problems in the financial system emerged in the
Eurozone2 as a follow-through effect from fiscal difficulties
Source: World Economic Outlook Update, January 2011. Data for Indonesia is from BPS-Statistics Indonesiaand the projections for 2010 are calculated by Bank Indonesia
2009(%)
2010(%)
Projection2010 (%)
Table 1.1Breakdown of Global Economic Growth
World Output -0.6 5.0 4.4
Advanced Economies -3.4 3.0 2.5
United States of America -2.6 2.8 2.7
Euro Area -4.1 1.8 1.7
German -4.7 3.6 2.0
France -2.5 1.6 1.8
Italy -5.0 1.0 1.0
Spain -3.7 -0.2 0.6
Japan -6.3 4.3 1.6
United Kingdom -4.9 1.7 2.0
Canada -2.5 2.9 2.3
Others -1.2 5.6 3.8
Newly Industrialized
Asian Economies -0.9 8.2 4.7
European Union -4.1 1.8 1.7
Emerging & Developing
Economies 2.6 7.1 6.5
Developing Asia 7.0 9.3 8.4
China 9.2 10.3 9.5
India 5.7 9.7 8.0
ASEAN-5 1.7 6.7 5.7
Indonesia 4.6 6.1 6.3
Latin America and
Caribbean Islands -1.8 5.9 4.3
Brazil -0.6 7.5 4.5
Mexico -6.1 5.2 4.2
1 Quantitative easing is a non-conventional policy response introduced by the central bank, which injects liquidity into the economy in order to provide economic stimuli amid disruptions stemming from a crisis.
2 EThe Eurozone incorporates those countries in the European Union that have adopted the euro as their common currency and sole legal tender.

9
Chapter 1. Risk from the Global Environment:Global Imbalances, a Torrent of Foreign Capital Inflows and rising Inflation
Leading countries in the Eurozone, particularly
Germany, have already demonstrated a significant rebound
in economic growth, however, the periphery countries
continued to attract negative sentiment to the European
financial markets. Issues in other GIIPS countries will
continue to be monitored by the global market, hence,
handling the vulnerabilities exposed in the Eurozone
will determine the success of economic recovery in the
region.
The fiscal difficulties that have beset the Eurozone
are an invaluable lesson for the international community,
especially in terms of crisis resolution. Financial crises
require a quick and accurate resolution. A lack of fiscal
policy discipline in a number of countries resulted in a
difference of opinion in terms of resolving the crisis in the
euro area, which prolonged crisis resolution. Independent
fiscal policy among countries in the Eurozone and the
drawn out resolution of fiscal problems in one country
led to negative sentiment on financial markets in the
euro area and exacerbated the impact of the global crisis
in Europe.
This clearly provides a valuable lesson for ASEAN
member countries that have agreed to officially inaugurate
the ASEAN Economic Community in 2013. Despite strong
economic integration in the euro area, no adequate crisis
resolution mechanism was set in place that could be
executed immediately in order to dampen the crisis before
conditions on the financial markets became more severe.
Accordingly, fiscal problems triggered systemic risk on the
regional financial market. The European Central Bank (ECB)
as lender of last resort in the Eurozone was also unable to
act as the sole source of funds to resolve the fiscal crisis.
Fiscal crises in Greece (loan of £110 billion) and Ireland
(loan of £22.5 billion) were resolved through cooperation
among the European Commission, ECB and International
Monetary Fund (IMF).
3 GIIPS: Greece, Ireland, Italy, Portugal and Spain.
0
1.000
2.000
3.000
4.000
5.000
6.000
7.000
8.000
0
5.000
10.000
15.000
20.000
25.000
30.000
35.000
Jan
- 07
Apr -
07
Jul -
07
Oct
- 07
Jan
- 08
Apr -
08
Jul -
08
Oct
- 08
Jan
- 09
Apr -
09
Jul -
09
Oct
- 09
Jan
- 10
Apr -
10
Jul -
10
Oct
- 10
Hongkong (left scale) Dow Jones (left scale)Singapore (right scale) Inggris (right scale)
in GIIPS3 countries. Fiscal problems that peaked in Ireland
broadened CDS spread in GIIPS countries, which signaled
the existence of fiscal troubles, including in countries where
the fiscal problems were not as pronounced (Figure 1.2
and 1.3).
0
200
400
600
800
000
200
Jan
- 09
Mar
- 09
May
- 09
Jul -
09
Sep
- 09
Nov -
09
Jan
- 10
Mar
- 10
May
- 10
Jul -
10
Sep
- 10
Nov -
10
Greece
Ireland
Italy
Portugal
Spain
Germany
Source: Bloomberg (CDS USD Senior 5Y)
Source: Bloomberg (CDS USD Senior 5Y)
Source: Bloomberg
Figure 1.3CDS in leading Eurozone countries and Switzerland
Figure 1.1Global Stock Market Indices (2000=100)
Figure 1.2CDS in GIIPS countries and Germany
0
50
100
150
200
250
300
350
400
Germany
Perancis
Italy
Spain
Netherlands
Belgium
Austria
Switzerland
Jan
- 09
Mar
- 09
May
- 09
Jul -
09
Sep
- 09
Nov
- 09
Jan
- 10
Mar
- 10
May
- 10
Jul -
10
Sep
- 10
Nov
- 10
10
Chapter 1. Risk from the Global Environment:Global Imbalances, a Torrent of Foreign Capital Inflows and rising Inflation
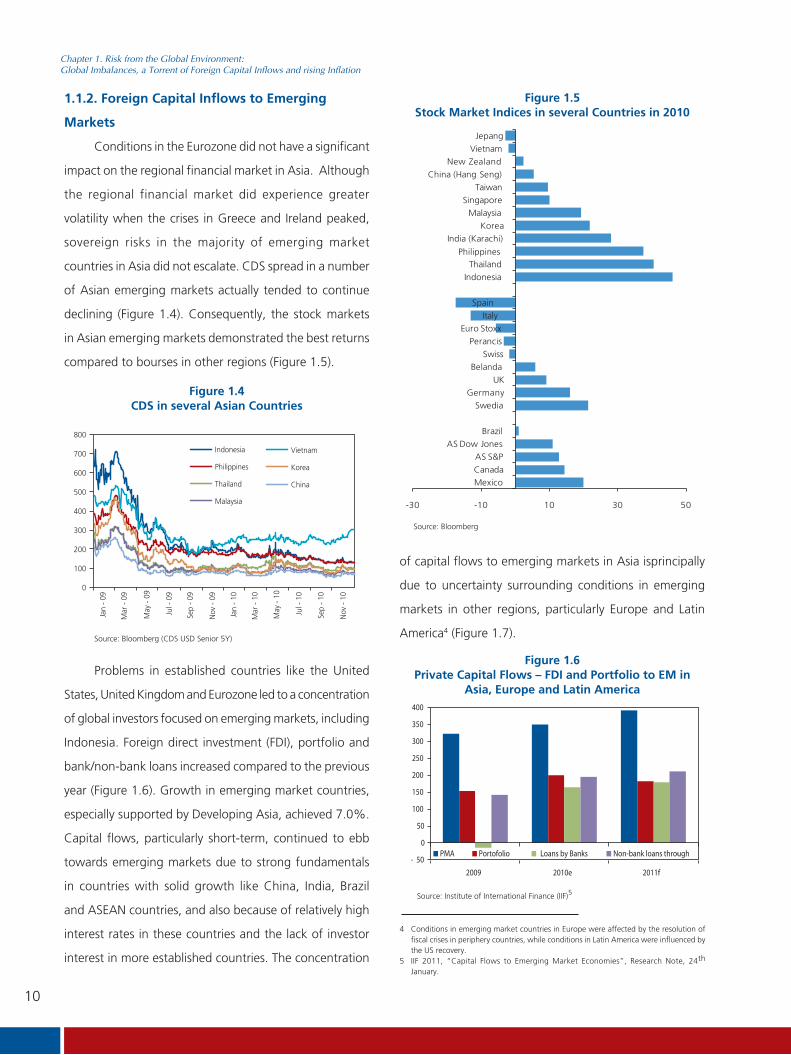
1.1.2. Foreign Capital Inflows to Emerging
Markets
Conditions in the Eurozone did not have a significant
impact on the regional financial market in Asia. Although
the regional financial market did experience greater
volatility when the crises in Greece and Ireland peaked,
sovereign risks in the majority of emerging market
countries in Asia did not escalate. CDS spread in a number
of Asian emerging markets actually tended to continue
declining (Figure 1.4). Consequently, the stock markets
in Asian emerging markets demonstrated the best returns
compared to bourses in other regions (Figure 1.5).
4 Conditions in emerging market countries in Europe were affected by the resolution of fiscal crises in periphery countries, while conditions in Latin America were influenced by the US recovery.
5 IIF 2011, “Capital Flows to Emerging Market Economies”, Research Note, 24th
January.
Figure 1.4CDS in several Asian Countries
0
100
200
300
400
500
600
700
800
Indonesia
Philippines
Thailand
Malaysia
Vietnam
Korea
China
Jan
- 09
Mar
- 09
May
- 09
Jul -
09
Sep
- 09
Nov
- 09
Jan
- 10
Mar
- 10
May
- 10
Jul -
10
Sep
- 10
Nov
- 10
Source: Bloomberg (CDS USD Senior 5Y)
Figure 1.5Stock Market Indices in several Countries in 2010
Source: Bloomberg
-30 -10 10 30 50
Mexico
Canada
AS S&P
AS Dow Jones
Brazil
Swedia
Germany
UK
Belanda
Swiss
Perancis
Euro Stoxx
Italy
Spain
Indonesia
Thailand
India (Karachi)
Philippines
Korea
Malaysia
Singapore
Taiwan
China (Hang Seng)
New Zealand
Vietnam
Jepang
of capital flows to emerging markets in Asia isprincipally
due to uncertainty surrounding conditions in emerging
markets in other regions, particularly Europe and Latin
America4 (Figure 1.7).
Figure 1.6Private Capital Flows – FDI and Portfolio to EM in
Asia, Europe and Latin America
Source: Institute of International Finance (IIF)5
- 50
0
50
100
150
200
250
300
350
400
2009 2010e 2011f
PMA Portofolio Loans by Banks Non-bank loans through-
Problems in established countries like the United
States, United Kingdom and Eurozone led to a concentration
of global investors focused on emerging markets, including
Indonesia. Foreign direct investment (FDI), portfolio and
bank/non-bank loans increased compared to the previous
year (Figure 1.6). Growth in emerging market countries,
especially supported by Developing Asia, achieved 7.0%.
Capital flows, particularly short-term, continued to ebb
towards emerging markets due to strong fundamentals
in countries with solid growth like China, India, Brazil
and ASEAN countries, and also because of relatively high
interest rates in these countries and the lack of investor
interest in more established countries. The concentration

11
Chapter 1. Risk from the Global Environment:Global Imbalances, a Torrent of Foreign Capital Inflows and rising Inflation
Note: According to IIF emerging markets are grouped
into the following brackets: 1) Emerging Europe: Bulgaria,
Czech Republic, Hungary, Poland, Rumania, Russia, Turkey
and Ukraine; 2) Emerging Asia: China, India, Indonesia,
Malaysia, the Philippines, Korea and Thailand; 3) Emerging
Latin America: Argentina, Brazil, Chili, Colombia, Ecuador,
México, Peru and Venezuela; and 4) Emerging Africa/
Middle East: Egypt, Lebanon, Morocco, Nigeria, Saudi
Arabia, South Africa andUnited Arab Emirates.
The liquidity injected into the US financial market
as a part of quantitative easing by the Federal Reserve
also increased potential capital flows to emerging market
countries. From a macroprudential standpoint, the deluge
of foreign capital flows could have created an asset price
bubble and the risk of sudden reversal in emerging market
countries. Furthermore, capital inflows led to currency
appreciation in emerging market countries, which on one
hand benefitted the advanced countries to provide stimuli
for their exports. However, on the other hand a number
of emerging market countries depended on income from
their own exports that became less competitive on the
international market6. Therefore, several emerging markets
began to apply policy to reduce the unrelenting deluge
of capital inflows. Brazil, for instance, levied a tax on
capital flowing into the country. Additionally, a number of
countries like Brazil, México, Korea, Taiwan, South Africa,
Thailand, Indonesia and China used active intervention on
the forex markets to curb exchange rate appreciation.
1.1.3. Soaring International Commodity Prices
Rising commodity prices compounded the problems
experienced by the global economy. The global commodity
price index posted a significant spike (Figure 1.8). The price
of crude oil on the West Texas Intermediate(WTI) spot
market reached USD90 per barrel in December 2010. A
similar trend was also noted for commodities like gold,
copper and rubber (Figure 1.9). Referring to the UBS CMCI
composite price index, all sectors experienced price hikes,
especially the agricultural sector (Figure 1.10).
Figure 1.7Private Capital Flows to Emerging Markets
0
50
100
150
200
250
300
2009 2010e 2011f
Asia
Eropa
Amerika Latin
Source: Institute of International Finance (IIF)
6 A currency war began to emerge in October 2010. Quantitative easing, as implemented by established countries to overcome the impacts of the global crisis in 2007-2008, was one way to devalue their domestic currency.
Figure 1.8Global Price Indices
Figure 1.9Price Indices of several International Commodities
Source: Bloomberg
Source: Bloomberg
0
200
400
600
800
1000
1200
1400
1600
1800
Jan-
04
Jan-
05
Jan-
06
Jan-
07
Jan-
08
Jan-
09
Jan-
10
Jan-
11
JPMorganAggregatePrice Index
S&P GSCI Index
UBS CMCI Price Index
0
100
200
300
400
500
600
Jan
- 07
May
- 07
Sep
- 07
Jan
- 08
May
- 08
Sep
- 08
Jan
- 09
May
- 09
Sep
- 09
Jan
- 10
May
- 10
Sep
- 10
Oil Copper Gold Rubber

12
Chapter 1. Risk from the Global Environment:Global Imbalances, a Torrent of Foreign Capital Inflows and rising Inflation
Despite assisting economic recoveries in commodity-
producing countries, soaring commodity prices also raised
global inflation. Central banks in several countries were
confronted by a dilemma of whether to raise interest rates
in order to control inflation or let interest rates remain low
to buttress the economic recovery. Raising interest rates
in emerging market countries would broaden the spread
with advanced countries, hence encouraging a further
inundation of capital flows.
1.2. STRENGTHENING RISK IN INDONESIA
1.2.1. Impact on Indonesia’s Macroeconomy
The ongoing global economic recovery coupled with
solid public purchasing power bolstered domestic economic
performance. Similar to the case in other emerging market
countries, economic performance in Indonesia during
semester-II 2010 showed adequate resilience, which in fact
tended to strengthen. Economic growth in Indonesia has
been maintained at a relatively robust level since the crisis
in 2008 up to the fourth quarter of 2010. Consequently,
the economy of Indonesia expanded by 6.14% in 2010,
which far exceeds growth posted in 2009 at 4.51%.
Domestic export performance, particularly non-oil/
gas exports based on natural resources, was buoyed by
increased global economic activityin line with high prices on
international markets. At the end of the second semester
of 2010 the value of non-oil/gas exports from Indonesia
totalled USD13.6 million; up 29.24% on the previous year.
In comparison, the value of Indonesian imports at the end
of semester-II 2010 was USD10.8 million, which represents
just 18.40% growth over the position at the end of
semester-I 2010. The higher value of exports compared to
imports led to a current account surplus of USD1.3 million
in December 2010 (end of quarter-IV 2010), which was
larger than that recorded in June 2010 (end of quarter-II
2010) of USD1.2 million (Figure 1.11 and 1.12).
Source: SEKI
Sourcer: SEKI
Sourcer: Bloomberg
Figure 1.10UBS CMCI Composite Price Index by Sector
0
500
1000
1500
2000
2500
Jan
- 04
Jul -
04
Jan
- 05
Jul -
05
Jan
- 06
Jul -
06
Jan
- 07
Jul -
07
Jan
- 08
Jul -
08
Jan
- 09
Jul -
09
Jan
- 10
Jul -
10
Jan
- 11
Agriculture Energy IndustrialPrecious Metal Livestock
Figure 1.11Indonesian Development of Non-Oil Export Import
0
2.000
4.000
6.000
8.000
10.000
12.000
14.000
16.000
18.000
Thousand USD
Non Oil Export Non Oil Import
Jan
- 07
Apr -
07
Jul -
07
Oct
- 07
Jan
- 08
Apr -
08
Jul -
08
Oct
- 08
Jan
- 09
Apr -
09
Jul -
09
Oct
- 09
Jan
- 10
Apr -
10
Jul -
10
Oct
- 10
Figure 1.12Indonesia Development of Total Exports and Imports
0
2.000
4.000
6.000
8.000
10.000
12.000
14.000
16.000
18.000
Thousand USD
Total Exports Total Imports
Jan
- 07
Apr -
07
Jul -
07
Oct
- 07
Jan
- 08
Apr -
08
Jul -
08
Oct
- 08
Jan
- 09
Apr -
09
Jul -
09
Oct
- 09
Jan
- 10
Apr -
10
Jul -
10
Oct
- 10
13
Chapter 1. Risk from the Global Environment:Global Imbalances, a Torrent of Foreign Capital Inflows and rising Inflation
Impressive export/import performance in Indonesia
helped solidify the performance of the balance of payments
(BOP). The balance of payments registered a surplus of
USD11.3 billion at the end of semester-II 2010, which
was an increase of 109% compared to the position at
the end of the first semester totalling USD5.4 billion. In
congruence, foreign exchange reserves at the end of
semester-II 2010 increased to USD96.2 billion; equivalent
to seven months of imports and servicing foreign debt.
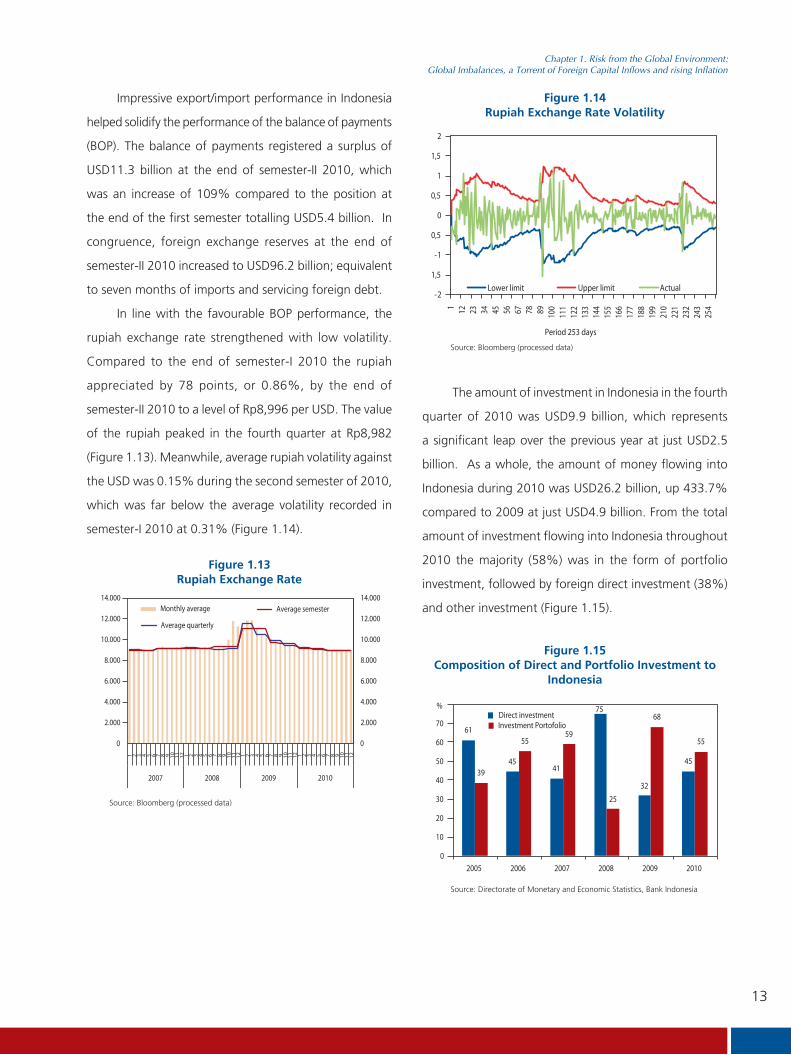
In line with the favourable BOP performance, the
rupiah exchange rate strengthened with low volatility.
Compared to the end of semester-I 2010 the rupiah
appreciated by 78 points, or 0.86%, by the end of
semester-II 2010 to a level of Rp8,996 per USD. The value
of the rupiah peaked in the fourth quarter at Rp8,982
(Figure 1.13). Meanwhile, average rupiah volatility against
the USD was 0.15% during the second semester of 2010,
which was far below the average volatility recorded in
semester-I 2010 at 0.31% (Figure 1.14).
The amount of investment in Indonesia in the fourth
quarter of 2010 was USD9.9 billion, which represents
a significant leap over the previous year at just USD2.5
billion. As a whole, the amount of money flowing into
Indonesia during 2010 was USD26.2 billion, up 433.7%
compared to 2009 at just USD4.9 billion. From the total
amount of investment flowing into Indonesia throughout
2010 the majority (58%) was in the form of portfolio
investment, followed by foreign direct investment (38%)
and other investment (Figure 1.15).
Source: Bloomberg (processed data)
Figure 1.13Rupiah Exchange Rate
0
2.000
4.000
6.000
8.000
10.000
12.000
14.000
0
2.000
4.000
6.000
8.000
10.000
12.000
14.000
1 2 3 4 5 6 7 8 9 10 11 12 1 2 3 4 5 6 7 8 9 10 11 12 1 2 3 4 5 6 7 8 9 10 11 12 1 2 3 4 5 6 7 8 9 10 11 12
2007 2008 2009 2010
Monthly average
Average quarterly
Average semester
Figure 1.14Rupiah Exchange Rate Volatility
-2
1,5
-1
0,5
0
0,5
1
1,5
2
1 12 23 34 45 56 67 78 89 100
111
122
133
144
155
166
177
188
199
210
221
232
243
254
Lower limit Upper limit Actual
Period 253 days
Source: Bloomberg (processed data)
Figure 1.15Composition of Direct and Portfolio Investment to
Indonesia
61
4541
75
32
4539
5559
25
68
55
0
10
20
30
40
50
60
70
2005 2006 2007 2008 2009 2010
%Direct investmentInvestment Portofolio
Source: Directorate of Monetary and Economic Statistics, Bank Indonesia

14
Chapter 1. Risk from the Global Environment:Global Imbalances, a Torrent of Foreign Capital Inflows and rising Inflation
The upward inflation trend not only affected
Indonesia but also nearly all countries, including established
and emerging market countries alike (Figure 1.18 and
1.19). Although the level of inflation was highest in
Indonesiacompared to other countries in ASEAN+5,
the investment climate in Indonesia remained attractive
considering the relatively high interest rates compared
to other ASEAN countries and advanced countries. As a
result, despite the gap narrowing between the interest rate
and inflation rate, in real terms interest rates in Indonesia
exceeded real interest rates in several other ASEAN
countries as well as in the United State and European
Union (Figure 1.20).
1.2.2. Mounting Inflationary Pressures
Inflation tended to escalate in semester-II 2010,
with headline inflation reaching 6.96% (yoy)at the end
of semester-II 2010 (Figure 1.16), in excess of its target
for 2010 at 5%±1%. The rise in headline inflation was
driven by non-fundamental factors, especially inflation of
volatile foods, which was 5.79% (ytd) in June 2010 and
peaked at 15.64% in December 2010 (ytd) (Figure 1.17).
This was primarily attributable to a lack of supply compared
to demand for staple foods. Supply was constrained by
harvest disruptions and damaged crops due to seasonal
anomalies, extreme weather and natural disasters. In
addition, high rainfall and a lack of infrastructure increased
the cost of distribution and, hence, inflated prices.
Figure 1.16Inflation in Indonesia (Core and Headline)
0,00
2,00
4,00
6,00
8,00
10,00
12,00
14,00
Core Inflation(yoy)
Inflation IHK (yoy)
Jan
- 07
Apr -
07
Jul -
07
Oct
- 07
Jan
- 08
Apr -
08
Jul -
08
Oct
- 08
Jan
- 09
Apr -
09
Jul -
09
Oct
- 09
Jan
- 10
Apr -
10
Jul -
10
Oct
- 10
Figure 1.17Price Indices of Foodstuffs and Oil in Indonesia,
2006 = 100
0
50
100
150
200
250
300
Dec -
200
6
Mar
- 07
Jun
- 07
Sep
- 07
Dec -
200
7
Mar
- 08
Jun
- 08
Sep
- 08
Dec -
200
8
Mar
- 09
Jun
- 09
Sep
- 09
Dec -
200
9
Mar
- 10
Jun
- 10
Sep
- 10
Dec -
201
0
Rice Cayenne
Petroleum Cooking Oil
Figure 1.18Inflation in several Advanced Countries
(5)
(2)
1
4
7
Jan-
07
Apr-0
7
Jul-0
7
Oct
-07
Jan-
08
Apr-0
8
Jul-0
8
Oct
-08
Jan-
09
Apr-0
9
Jul-0
9
Oct
-09
Jan-
10
Apr-1
0
Jul-1
0
Oct
-10
y.o.y %
Japan US Uni Eropa Singapore
Figure 1.19Inflation in several ASEAN Countries
(6)
(2)
2
6
10
y.o.y %
Philippines ThailandMalaysia Indonesia
Jan
- 07
Apr -
07
Jul -
07
Oct
- 07
Jan
- 08
Apr -
08
Jul -
08
Oct
- 08
Jan
- 09
Apr -
09
Jul -
09
Oct
- 09
Jan
- 10
Apr -
10
Jul -
10
Oct
- 10
Source: Directorate of Monetary and Economic Statistics, Bank Indonesia
Source: Latest indicators from the Directorate of Monetary and Economic Statistics
Source: CEIC
Source: CEIC
15
Chapter 1. Risk from the Global Environment:Global Imbalances, a Torrent of Foreign Capital Inflows and rising Inflation
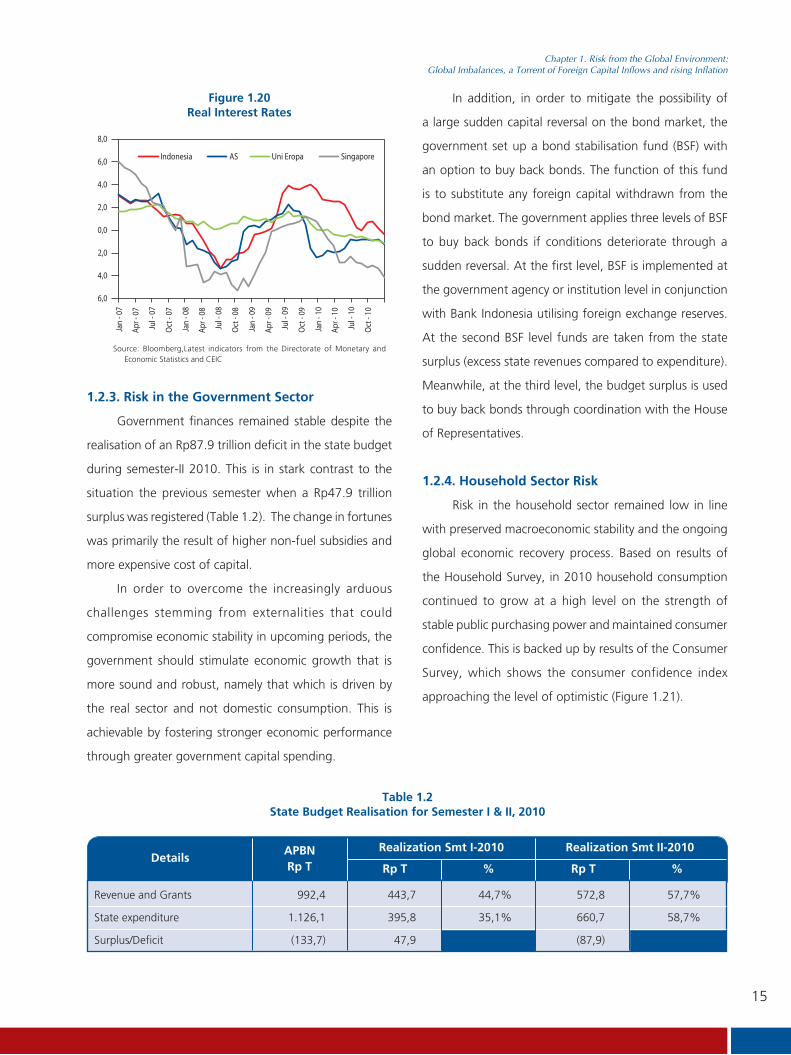
1.2.3. Risk in the Government Sector
Government finances remained stable despite the
realisation of an Rp87.9 trillion deficit in the state budget
during semester-II 2010. This is in stark contrast to the
situation the previous semester when a Rp47.9 trillion
surplus was registered (Table 1.2). The change in fortunes
was primarily the result of higher non-fuel subsidies and
more expensive cost of capital.
In order to overcome the increasingly arduous
challenges stemming from externalities that could
compromise economic stability in upcoming periods, the
government should stimulate economic growth that is
more sound and robust, namely that which is driven by
the real sector and not domestic consumption. This is
achievable by fostering stronger economic performance
through greater government capital spending.
Figure 1.20Real Interest Rates
6,0
4,0
2,0
0,0
2,0
4,0
6,0
8,0
Indonesia AS Uni Eropa Singapore
Jan
- 07
Apr -
07
Jul -
07
Oct
- 07
Jan
- 08
Apr -
08
Jul -
08
Oct
- 08
Jan
- 09
Apr -
09
Jul -
09
Oct
- 09
Jan
- 10
Apr -
10
Jul -
10
Oct
- 10
In addition, in order to mitigate the possibility of
a large sudden capital reversal on the bond market, the
government set up a bond stabilisation fund (BSF) with
an option to buy back bonds. The function of this fund
is to substitute any foreign capital withdrawn from the
bond market. The government applies three levels of BSF
to buy back bonds if conditions deteriorate through a
sudden reversal. At the first level, BSF is implemented at
the government agency or institution level in conjunction
with Bank Indonesia utilising foreign exchange reserves.
At the second BSF level funds are taken from the state
surplus (excess state revenues compared to expenditure).
Meanwhile, at the third level, the budget surplus is used
to buy back bonds through coordination with the House
of Representatives.
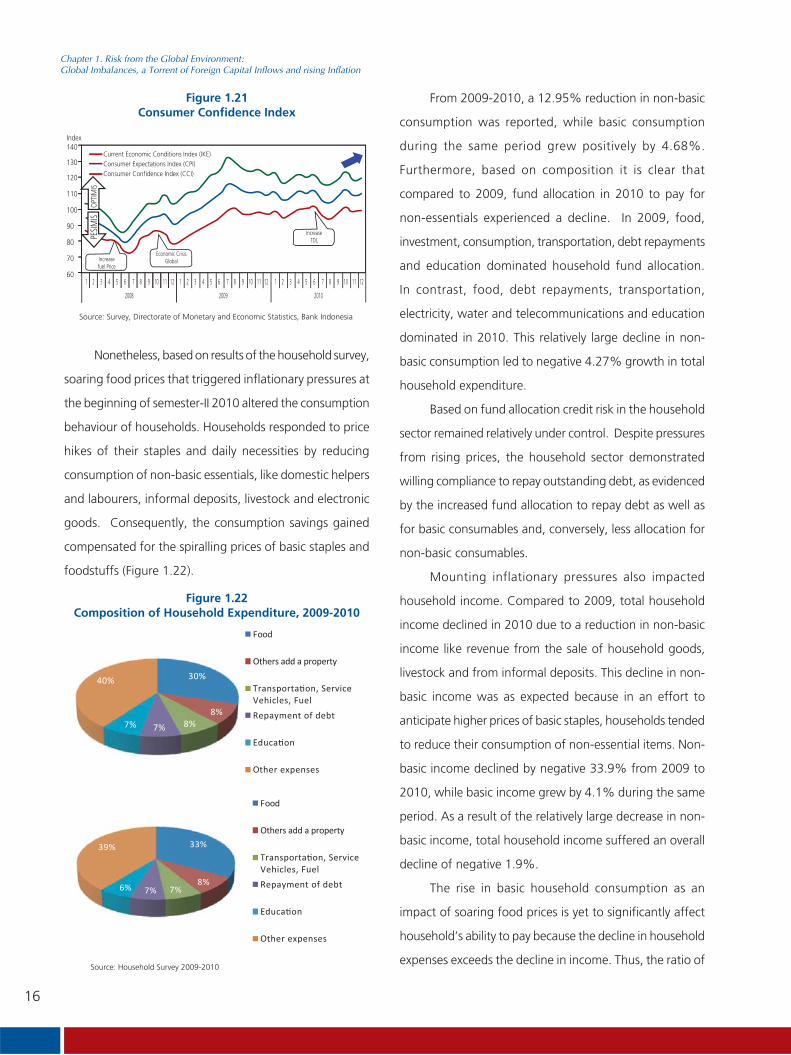
1.2.4. Household Sector Risk
Risk in the household sector remained low in line
with preserved macroeconomic stability and the ongoing
global economic recovery process. Based on results of
the Household Survey, in 2010 household consumption
continued to grow at a high level on the strength of
stable public purchasing power and maintained consumer
confidence. This is backed up by results of the Consumer
Survey, which shows the consumer confidence index
approaching the level of optimistic (Figure 1.21).
Source: Bloomberg,Latest indicators from the Directorate of Monetary and Economic Statistics and CEIC
APBNRp T
DetailsRp T
Realization Smt I-2010 Realization Smt II-2010
Rp T% %
Revenue and Grants 992,4 443,7 44,7% 572,8 57,7%
State expenditure 1.126,1 395,8 35,1% 660,7 58,7%
Surplus/Deficit (133,7) 47,9 (87,9)
Table 1.2State Budget Realisation for Semester I & II, 2010
16
Chapter 1. Risk from the Global Environment:Global Imbalances, a Torrent of Foreign Capital Inflows and rising Inflation
Nonetheless, based on results of the household survey,
soaring food prices that triggered inflationary pressures at
the beginning of semester-II 2010 altered the consumption
behaviour of households. Households responded to price
hikes of their staples and daily necessities by reducing
consumption of non-basic essentials, like domestic helpers
and labourers, informal deposits, livestock and electronic
goods. Consequently, the consumption savings gained
compensated for the spiralling prices of basic staples and
foodstuffs (Figure 1.22).
From 2009-2010, a 12.95% reduction in non-basic
consumption was reported, while basic consumption
during the same period grew positively by 4.68%.
Furthermore, based on composition it is clear that
compared to 2009, fund allocation in 2010 to pay for
non-essentials experienced a decline. In 2009, food,
investment, consumption, transportation, debt repayments
and education dominated household fund allocation.
In contrast, food, debt repayments, transportation,
electricity, water and telecommunications and education
dominated in 2010. This relatively large decline in non-
basic consumption led to negative 4.27% growth in total
household expenditure.
Based on fund allocation credit risk in the household
sector remained relatively under control. Despite pressures
from rising prices, the household sector demonstrated
willing compliance to repay outstanding debt, as evidenced
by the increased fund allocation to repay debt as well as
for basic consumables and, conversely, less allocation for
non-basic consumables.
Mounting inflationary pressures also impacted
household income. Compared to 2009, total household
income declined in 2010 due to a reduction in non-basic
income like revenue from the sale of household goods,
livestock and from informal deposits. This decline in non-
basic income was as expected because in an effort to
anticipate higher prices of basic staples, households tended
to reduce their consumption of non-essential items. Non-
basic income declined by negative 33.9% from 2009 to
2010, while basic income grew by 4.1% during the same
period. As a result of the relatively large decrease in non-
basic income, total household income suffered an overall
decline of negative 1.9%.
The rise in basic household consumption as an
impact of soaring food prices is yet to significantly affect
household’s ability to pay because the decline in household
expenses exceeds the decline in income. Thus, the ratio of
Figure 1.21Consumer Confidence Index
Current Economic Conditions Index (IKE)Consumer Expectations Index (CPI)Consumer Confidence Index (CCI)
Index140
130
120
110
100
90
80
70
60 1 2 3 4 5 6 7 8 9 10 11 12
2008
1 2 3 4 5 6 7 8 9 10 11 12
2009
1 2 3 4 5 6 7 8 9 10 11 12
2010
Increasefuel Price
Economic CrisisGlobal
IncreaseTDL
Figure 1.22Composition of Household Expenditure, 2009-2010
30%
8%8%7%7%
40%
Food
Others add a property
Repayment of debt
E
Other expenses
Food
Others add a property
Repayment of debt
E
Other expenses
33%
8%7%7%6%
39%
Source: Household Survey 2009-2010
Source: Survey, Directorate of Monetary and Economic Statistics, Bank Indonesia
17
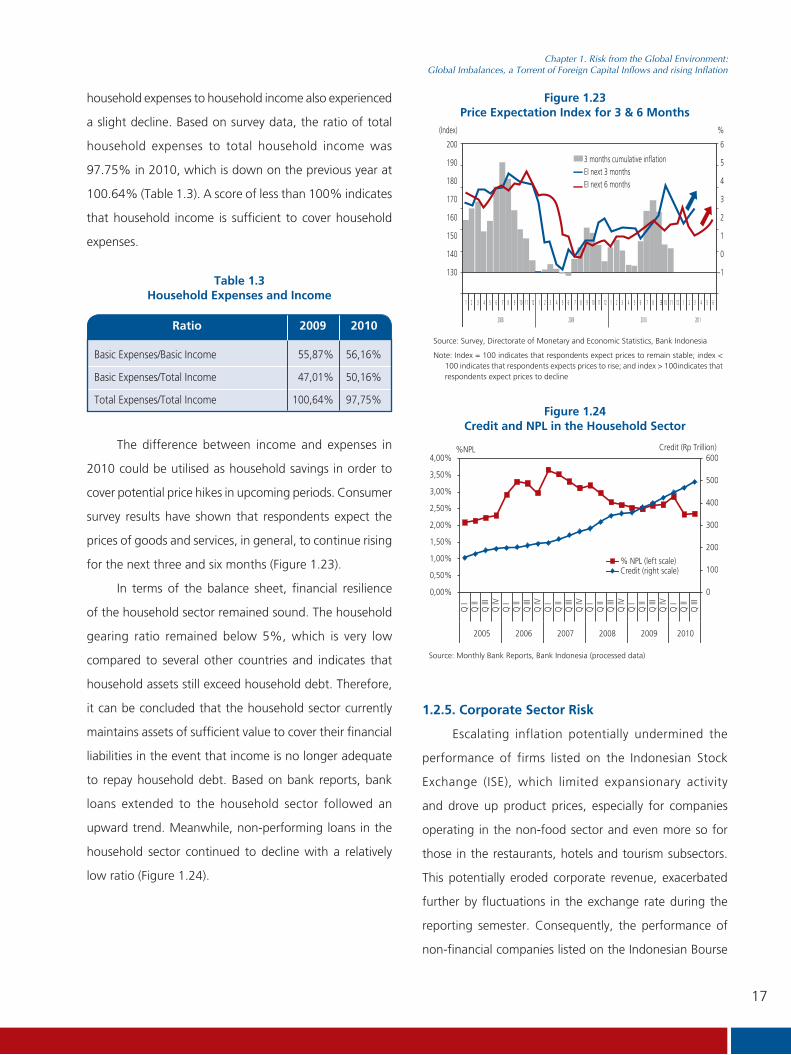
Chapter 1. Risk from the Global Environment:Global Imbalances, a Torrent of Foreign Capital Inflows and rising Inflation
household expenses to household income also experienced
a slight decline. Based on survey data, the ratio of total
household expenses to total household income was
97.75% in 2010, which is down on the previous year at
100.64% (Table 1.3). A score of less than 100% indicates
that household income is sufficient to cover household
expenses.
1.2.5. Corporate Sector Risk
Escalating inflation potentially undermined the
performance of firms listed on the Indonesian Stock
Exchange (ISE), which limited expansionary activity
and drove up product prices, especially for companies
operating in the non-food sector and even more so for
those in the restaurants, hotels and tourism subsectors.
This potentially eroded corporate revenue, exacerbated
further by fluctuations in the exchange rate during the
reporting semester. Consequently, the performance of
non-financial companies listed on the Indonesian Bourse
The difference between income and expenses in
2010 could be utilised as household savings in order to
cover potential price hikes in upcoming periods. Consumer
survey results have shown that respondents expect the
prices of goods and services, in general, to continue rising
for the next three and six months (Figure 1.23).
In terms of the balance sheet, financial resilience
of the household sector remained sound. The household
gearing ratio remained below 5%, which is very low
compared to several other countries and indicates that
household assets still exceed household debt. Therefore,
it can be concluded that the household sector currently
maintains assets of sufficient value to cover their financial
liabilities in the event that income is no longer adequate
to repay household debt. Based on bank reports, bank
loans extended to the household sector followed an
upward trend. Meanwhile, non-performing loans in the
household sector continued to decline with a relatively
low ratio (Figure 1.24).
Ratio 2009 2010
Basic Expenses/Basic Income 55,87% 56,16%
Basic Expenses/Total Income 47,01% 50,16%
Total Expenses/Total Income 100,64% 97,75%
Table 1.3Household Expenses and Income
Figure 1.23Price Expectation Index for 3 & 6 Months
1 2
2008 2009 2010 2011
3 4 5 6 7 8 9 10 11 12 1 2 3 4 5 6 7 8 9 10 11 12 1 2 3 4 5 6 7 8 10 11 12 1 2 3 4 5 63
(Index)
200
190
180
170
160
150
140
130
%
6
5
4
3
2
1
0
-1
3 months cumulative inflationEI next 3 months EI next 6 months
Note: Index = 100 indicates that respondents expect prices to remain stable; index < 100 indicates that respondents expects prices to rise; and index > 100indicates that respondents expect prices to decline
Source: Survey, Directorate of Monetary and Economic Statistics, Bank Indonesia
0
100
200
300
400
500
600
0,00%
0,50%
1,00%
1,50%
2,00%
2,50%
3,00%
3,50%
4,00%Q
IQ
IIQ
III
Q IV
Q I
Q II
Q II
IQ
IVQ
IQ
IIQ
III
Q IV
Q I
Q II
Q II
IQ
IVQ
IQ
IIQ
III
Q IV
Q I
Q II
Q II
I
2005 2006 2007 2008 2009 2010
Credit (Rp Trillion)%NPL
% NPL (left scale)Credit (right scale)
Figure 1.24Credit and NPL in the Household Sector
Source: Monthly Bank Reports, Bank Indonesia (processed data)
18
Chapter 1. Risk from the Global Environment:Global Imbalances, a Torrent of Foreign Capital Inflows and rising Inflation
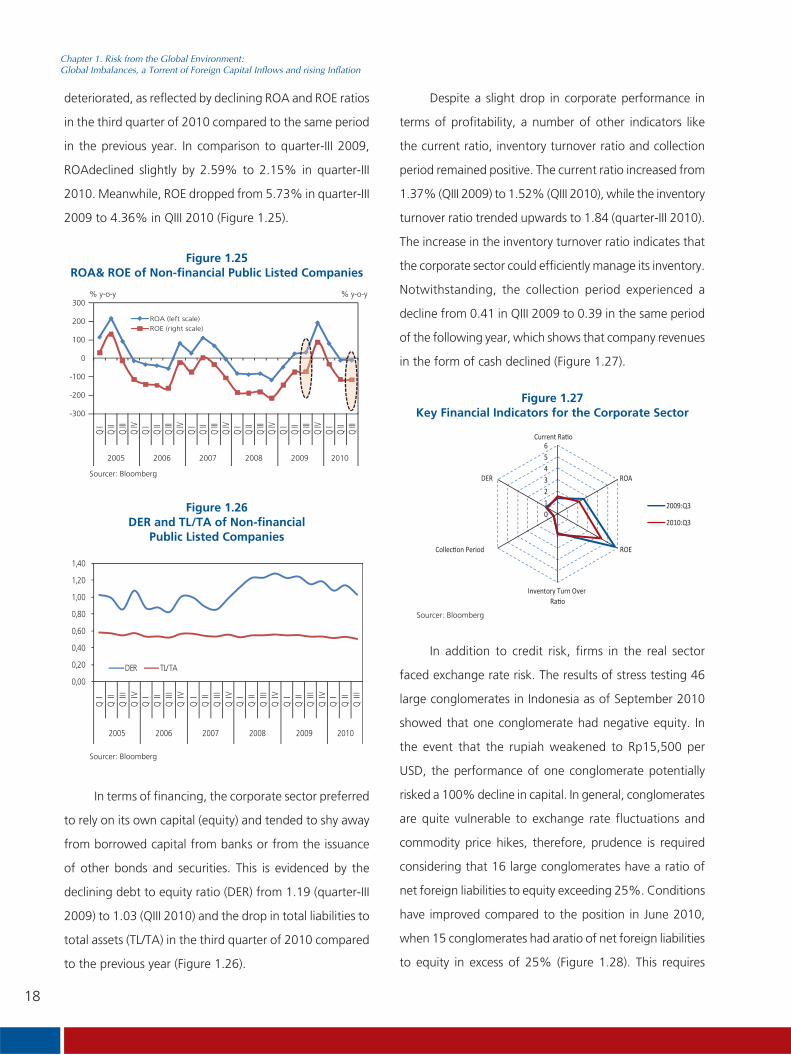
deteriorated, as reflected by declining ROA and ROE ratios
in the third quarter of 2010 compared to the same period
in the previous year. In comparison to quarter-III 2009,
ROAdeclined slightly by 2.59% to 2.15% in quarter-III
2010. Meanwhile, ROE dropped from 5.73% in quarter-III
2009 to 4.36% in QIII 2010 (Figure 1.25).
In terms of financing, the corporate sector preferred
to rely on its own capital (equity) and tended to shy away
from borrowed capital from banks or from the issuance
of other bonds and securities. This is evidenced by the
declining debt to equity ratio (DER) from 1.19 (quarter-III
2009) to 1.03 (QIII 2010) and the drop in total liabilities to
total assets (TL/TA) in the third quarter of 2010 compared
to the previous year (Figure 1.26).
Despite a slight drop in corporate performance in
terms of profitability, a number of other indicators like
the current ratio, inventory turnover ratio and collection
period remained positive. The current ratio increased from
1.37% (QIII 2009) to 1.52% (QIII 2010), while the inventory
turnover ratio trended upwards to 1.84 (quarter-III 2010).
The increase in the inventory turnover ratio indicates that
the corporate sector could efficiently manage its inventory.
Notwithstanding, the collection period experienced a
decline from 0.41 in QIII 2009 to 0.39 in the same period
of the following year, which shows that company revenues
in the form of cash declined (Figure 1.27).
Figure 1.25ROA& ROE of Non-financial Public Listed Companies
Figure 1.26DER and TL/TA of Non-financial
Public Listed Companies
-300
-200
-100
0
100
200
300
Q I
Q II
Q III
Q IV
Q I
Q II
Q III
Q IV
Q I
Q II
Q III
Q IV
Q I
Q II
Q III
Q IV
Q I
Q II
Q III
Q IV
Q I
Q II
Q III
2005 2006 2007 2008 2009 2010
% y-o-y % y-o-y
ROA (left scale)
ROE (right scale)
0,00
0,20
0,40
0,60
0,80
1,00
1,20
1,40
QI
QII
QIII
QIV
QI
QII
QIII
QIV
QI
QII
QIII
QIV
QI
QII
QIII
QIV
QI
QII
QIII
QIV
QI
QII
QIII
2005 2006 2007 2008 2009 2010
DER TL/TA
Figure 1.27Key Financial Indicators for the Corporate Sector
0123456
ROA
ROE
DER
2009:Q3
2010:Q3
In addition to credit risk, firms in the real sector
faced exchange rate risk. The results of stress testing 46
large conglomerates in Indonesia as of September 2010
showed that one conglomerate had negative equity. In
the event that the rupiah weakened to Rp15,500 per
USD, the performance of one conglomerate potentially
risked a 100% decline in capital. In general, conglomerates
are quite vulnerable to exchange rate fluctuations and
commodity price hikes, therefore, prudence is required
considering that 16 large conglomerates have a ratio of
net foreign liabilities to equity exceeding 25%. Conditions
have improved compared to the position in June 2010,
when 15 conglomerates had aratio of net foreign liabilities
to equity in excess of 25% (Figure 1.28). This requires
Sourcer: Bloomberg
Sourcer: Bloomberg
Sourcer: Bloomberg

19
Chapter 1. Risk from the Global Environment:Global Imbalances, a Torrent of Foreign Capital Inflows and rising Inflation
anticipatory measures by conglomerates to mitigate the
risks (Table 1.4).
Figure 1.28Ratio of Net Foreign Liabilities to Equity
(200)
(150)
(100)
(50)
0
50
100
150
200
R P S AK T AD A O AN N AI AC Y V M I AF Q AJ AS U W K
%
Ratio of net liabilitiescurrency against the equity> 25%
Source: Indonesian Stock Exchange (processed data)
Percentage ofequity decrease
IDR / USD
10.5009.500 11.00010.000 11.500 12.000 12.500 13.000 13.500 14.000 14.500 15.000 15.500 16.000
10% 3 5 10 10 10 8 6 6 6 6 4 4 420% 1 2 2 2 5 9 8 5 4 2 3 330% 1 2 2 1 2 5 4 8 5 540% 1 2 1 2 2 5 350% 1 1 1 2 1 260% 1 1 2 170% 1 1 280% 1 90% 1 1100% 1 1
Number of corporateswith impacted equity 0 3 6 13 13 15 16 19 19 19 19 19 20 20
Table 1.4Effect of Rupiah Depreciation on Conglomerate Equity
Source: Indonesian Stock Exchange (processed data)

This page intentionally blank

21
Chapter 2. Financial System Resilience
Chapter 2Financial System Resilience

22
Chapter 2. Financial System Resilience
This page intentionally blank

23
Chapter 2. Financial System Resilience
Chapter 2 Financial System Resilience
Favourable economic conditions during the second semester of 2010
contributed to the preservation of financial system stability in Indonesia. Amid
an influx of foreign capital flows the banks performed amicably, coupled with
solid credit growth. Similar conditions were reported on the stock and SUN
markets, while a steady interest rate was underpinned by financing through
the capital market.
2.1. FINANCIAL SYSTEM STRUCTURE AND
RESILIENCE
The structure of the Indonesian financial system did
not experience any dramatic changes during the reporting
period. Commercial banks and rural banks continued to
dominate banking industry assets, accounting for 82.9% of
total assets in the financial sector (Figure 2.1). Meanwhile,
the total assets of the insurance and securities industry
experienced a comparatively smaller increase and, as such,
the corresponding share decreased slightly compared to
other industries like pension funds, finance companies
and pawnbrokers.The total assets of commercial banks grew by
Rp474.4 trillion (18.73%) to reach Rp3,008.8 trillion by
December 2010 on the back of 22.8% (yoy) credit growth.
Business activity on the non-bank financial market also
performed impressively during semester-II 2010. The
assets of finance companies expanded by 32% buoyed
by 30.74% growth in financing activity. Concurrently, the
increase in the assets of pension funds was linked to the
46.13% gain in the Jakarta Composite (JSX) considering
that the composition of investment on the capital market
is dominated (68.99%) by pension funds.
Greater business activity by financial institutions
was accompanied by improved financial sector stability.
Institutions Numbers
Table 2.1Number of Financial Institutions
Commercial Bank 122
Rural Bank 1,706
Finance Company 191
Insurance Company 142
Pawnbroker 1
Securities Company 119
Pension Funds 272
1.2%6.2%
5.8%0.5% 1.1% 3.3%
Banks
Rural Banks
Financing Company
Insurance Company
Pawnshop
Pension fund
81.7%
Source: various sources (processed data)
Figure 2.1Asset Compositions of Financial Institutions
24
Chapter 2. Financial System Resilience
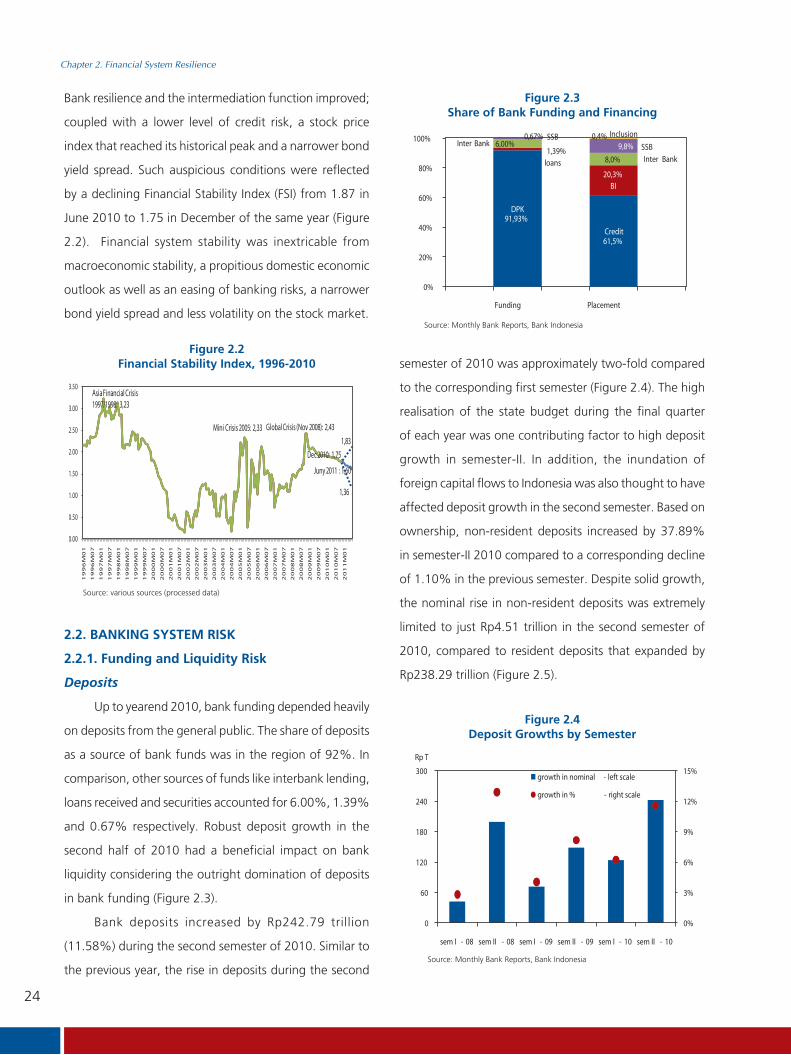
Bank resilience and the intermediation function improved;
coupled with a lower level of credit risk, a stock price
index that reached its historical peak and a narrower bond
yield spread. Such auspicious conditions were reflected
by a declining Financial Stability Index (FSI) from 1.87 in
June 2010 to 1.75 in December of the same year (Figure
2.2). Financial system stability was inextricable from
macroeconomic stability, a propitious domestic economic
outlook as well as an easing of banking risks, a narrower
bond yield spread and less volatility on the stock market.
91,93%
61,5%
1,39%
20,3%
6,00%
8,0%
0,67%9,8%
0,4%
0%
20%
40%
60%
80%
100%
Funding Placement
Credit
DPK
Inclusion
loans
BI
Inter Bank
Inter BankSSB
SSB
2.2. BANKING SYSTEM RISK
2.2.1. Funding and Liquidity Risk
Deposits
Up to yearend 2010, bank funding depended heavily
on deposits from the general public. The share of deposits
as a source of bank funds was in the region of 92%. In
comparison, other sources of funds like interbank lending,
loans received and securities accounted for 6.00%, 1.39%
and 0.67% respectively. Robust deposit growth in the
second half of 2010 had a beneficial impact on bank
liquidity considering the outright domination of deposits
in bank funding (Figure 2.3).
Bank deposits increased by Rp242.79 trillion
(11.58%) during the second semester of 2010. Similar to
the previous year, the rise in deposits during the second
semester of 2010 was approximately two-fold compared
to the corresponding first semester (Figure 2.4). The high
realisation of the state budget during the final quarter
of each year was one contributing factor to high deposit
growth in semester-II. In addition, the inundation of
foreign capital flows to Indonesia was also thought to have
affected deposit growth in the second semester. Based on
ownership, non-resident deposits increased by 37.89%
in semester-II 2010 compared to a corresponding decline
of 1.10% in the previous semester. Despite solid growth,
the nominal rise in non-resident deposits was extremely
limited to just Rp4.51 trillion in the second semester of
2010, compared to resident deposits that expanded by
Rp238.29 trillion (Figure 2.5).
0%
3%
6%
9%
12%
15%
0
60
120
180
240
300
sem I - 08 sem II - 08 sem I - 09 sem II - 09 sem I - 10 sem II - 10
Rp T
growth in nominal - left scale
growth in % - right scale
0.00
0.50
1.00
1.50
2.00
2.50
3.00
3.50
19
96
M0
1
19
96
M0
7
19
97
M0
1
19
97
M0
7
19
98
M0
1
19
98
M0
7
19
99
M0
1
19
99
M0
7
20
00
M0
1
20
00
M0
7
20
01
M0
1
20
01
M0
7
20
02
M0
1
20
02
M0
7
20
03
M0
1
20
03
M0
7
20
04
M0
1
20
04
M0
7
20
05
M0
1
20
05
M0
7
20
06
M0
1
20
06
M0
7
20
07
M0
1
20
07
M0
7
20
08
M0
1
20
08
M0
7
20
09
M0
1
20
09
M0
7
20
10
M0
1
20
10
M0
7
20
11
M0
1
Global Crisis (Nov 2008): 2,43
1,83
1,36
AsiaFinancial Crisis1997/1998: 3,23
Mini Crisis 2005: 2,33
Dec2010: 1,75
Juny 2011 : 1,60
Source: various sources (processed data)
Source: Monthly Bank Reports, Bank Indonesia
Source: Monthly Bank Reports, Bank Indonesia
Figure 2.2Financial Stability Index, 1996-2010
Figure 2.3Share of Bank Funding and Financing
Figure 2.4Deposit Growths by Semester
25
Chapter 2. Financial System Resilience
of statutory reserves based on the loan to deposit ratio
and the increase in the statutory reserve requirement for
foreign exchange.
7 Primary reserves include bank cask and checking accounts held at Bank Indonesia; secondary reserves include Bank Indonesia Certificates (SBI), other placements at Bank Indonesia and SUN (trading and available for sale); and tertiary reserves include SUN HTM.
(100)
0
100
200
CentralGovernment
LocalGovernment
PrivateIndividuals
Privatefinancial
institutions
PrivateCompany
OtherPrivate
Non Resident
Rp T
semester I 2010 semester II 2010
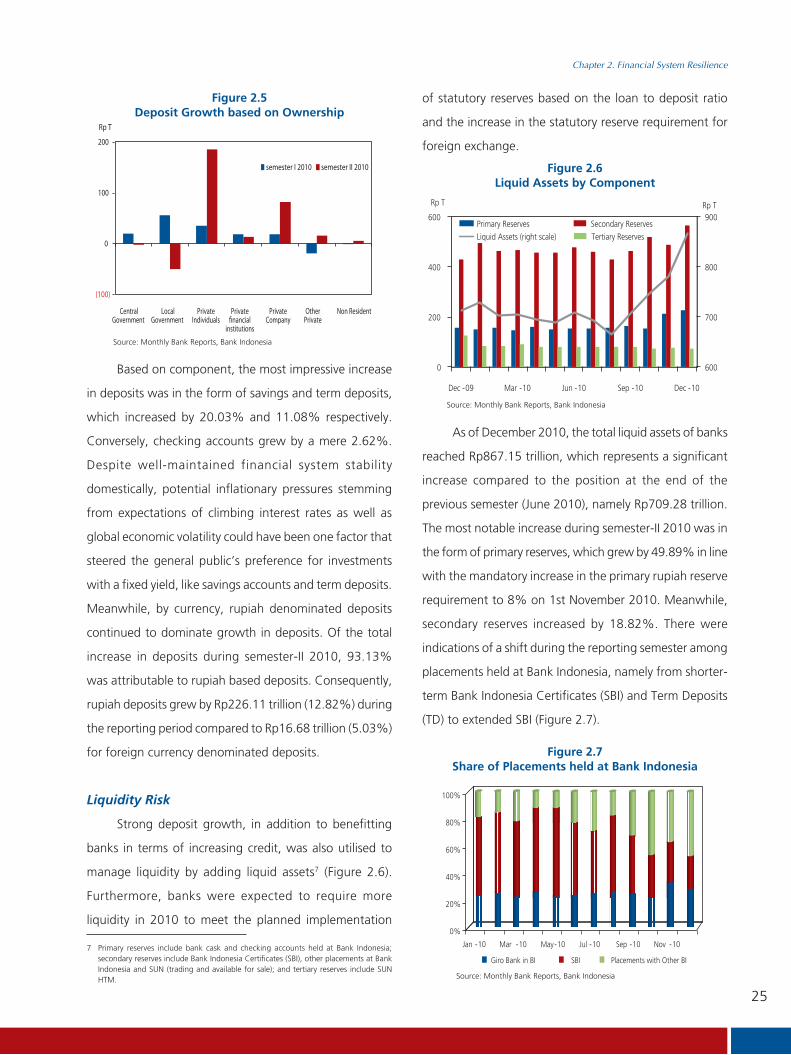
Based on component, the most impressive increase
in deposits was in the form of savings and term deposits,
which increased by 20.03% and 11.08% respectively.
Conversely, checking accounts grew by a mere 2.62%.
Despite well-maintained financial system stability
domestically, potential inflationary pressures stemming
from expectations of climbing interest rates as well as
global economic volatility could have been one factor that
steered the general public’s preference for investments
with a fixed yield, like savings accounts and term deposits.
Meanwhile, by currency, rupiah denominated deposits
continued to dominate growth in deposits. Of the total
increase in deposits during semester-II 2010, 93.13%
was attributable to rupiah based deposits. Consequently,
rupiah deposits grew by Rp226.11 trillion (12.82%) during
the reporting period compared to Rp16.68 trillion (5.03%)
for foreign currency denominated deposits.
Liquidity Risk
Strong deposit growth, in addition to benefitting
banks in terms of increasing credit, was also utilised to
manage liquidity by adding liquid assets7 (Figure 2.6).
Furthermore, banks were expected to require more
liquidity in 2010 to meet the planned implementation
600
700
800
900
0
200
400
600
Dec -09 Mar -10 Jun -10 Sep -10 Dec -10
Rp TRp T
Primary Reserves Secondary Reserves
Tertiary ReservesLiquid Assets (right scale)
As of December 2010, the total liquid assets of banks
reached Rp867.15 trillion, which represents a significant
increase compared to the position at the end of the
previous semester (June 2010), namely Rp709.28 trillion.
The most notable increase during semester-II 2010 was in
the form of primary reserves, which grew by 49.89% in line
with the mandatory increase in the primary rupiah reserve
requirement to 8% on 1st November 2010. Meanwhile,
secondary reserves increased by 18.82%. There were
indications of a shift during the reporting semester among
placements held at Bank Indonesia, namely from shorter-
term Bank Indonesia Certificates (SBI) and Term Deposits
(TD) to extended SBI (Figure 2.7).
Source: Monthly Bank Reports, Bank Indonesia
Source: Monthly Bank Reports, Bank Indonesia
Figure 2.5Deposit Growth based on Ownership
Figure 2.6Liquid Assets by Component
0%
20%
40%
60%
80%
100%
Jan -10 Mar -10 May-10 Jul -10 Sep -10 Nov -10
Giro Bank in BI SBI Placements with Other BI
Figure 2.7Share of Placements held at Bank Indonesia
Source: Monthly Bank Reports, Bank Indonesia
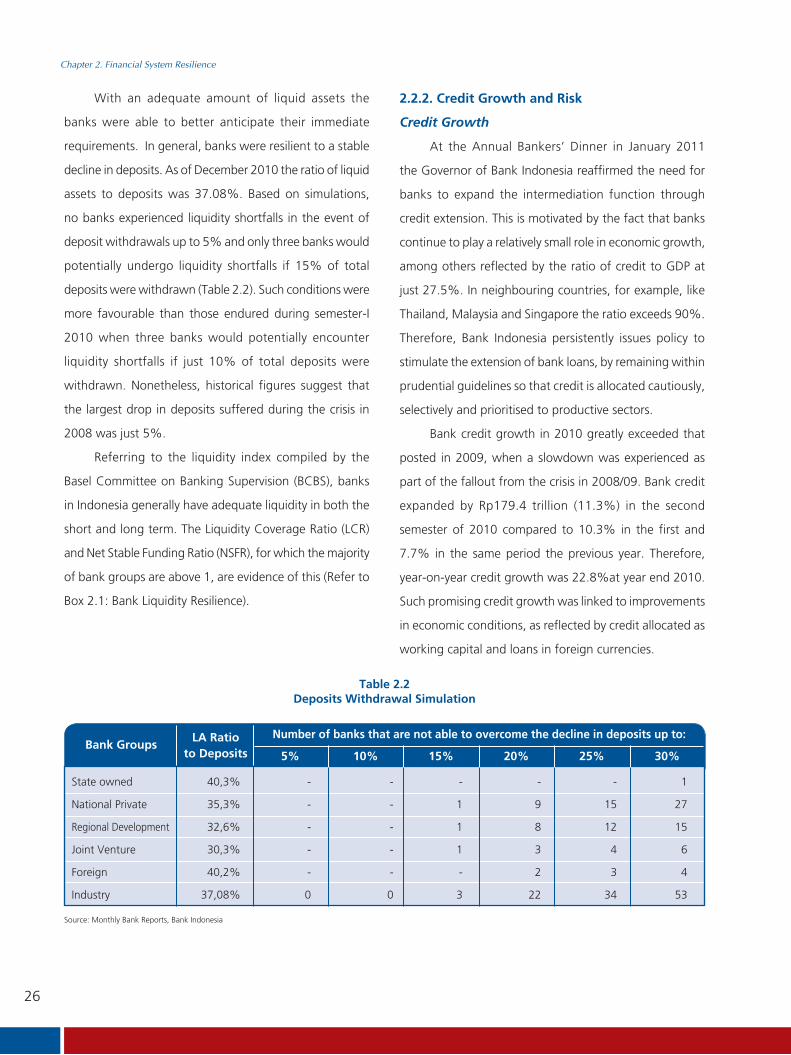
26
Chapter 2. Financial System Resilience
With an adequate amount of liquid assets the
banks were able to better anticipate their immediate
requirements. In general, banks were resilient to a stable
decline in deposits. As of December 2010 the ratio of liquid
assets to deposits was 37.08%. Based on simulations,
no banks experienced liquidity shortfalls in the event of
deposit withdrawals up to 5% and only three banks would
potentially undergo liquidity shortfalls if 15% of total
deposits were withdrawn (Table 2.2). Such conditions were
more favourable than those endured during semester-I
2010 when three banks would potentially encounter
liquidity shortfalls if just 10% of total deposits were
withdrawn. Nonetheless, historical figures suggest that
the largest drop in deposits suffered during the crisis in
2008 was just 5%.
Referring to the liquidity index compiled by the
Basel Committee on Banking Supervision (BCBS), banks
in Indonesia generally have adequate liquidity in both the
short and long term. The Liquidity Coverage Ratio (LCR)
and Net Stable Funding Ratio (NSFR), for which the majority
of bank groups are above 1, are evidence of this (Refer to
Box 2.1: Bank Liquidity Resilience).
2.2.2. Credit Growth and Risk
Credit Growth
At the Annual Bankers’ Dinner in January 2011
the Governor of Bank Indonesia reaffirmed the need for
banks to expand the intermediation function through
credit extension. This is motivated by the fact that banks
continue to play a relatively small role in economic growth,
among others reflected by the ratio of credit to GDP at
just 27.5%. In neighbouring countries, for example, like
Thailand, Malaysia and Singapore the ratio exceeds 90%.
Therefore, Bank Indonesia persistently issues policy to
stimulate the extension of bank loans, by remaining within
prudential guidelines so that credit is allocated cautiously,
selectively and prioritised to productive sectors.
Bank credit growth in 2010 greatly exceeded that
posted in 2009, when a slowdown was experienced as
part of the fallout from the crisis in 2008/09. Bank credit
expanded by Rp179.4 trillion (11.3%) in the second
semester of 2010 compared to 10.3% in the first and
7.7% in the same period the previous year. Therefore,
year-on-year credit growth was 22.8%at year end 2010.
Such promising credit growth was linked to improvements
in economic conditions, as reflected by credit allocated as
working capital and loans in foreign currencies.
LA Ratioto Deposits
Bank Groups5% 10% 15% 20% 25% 30%
Number of banks that are not able to overcome the decline in deposits up to:
State owned 40,3% - - - - - 1
National Private 35,3% - - 1 9 15 27
Regional Development 32,6% - - 1 8 12 15
Joint Venture 30,3% - - 1 3 4 6
Foreign 40,2% - - - 2 3 4
Industry 37,08% 0 0 3 22 34 53
Table 2.2Deposits Withdrawal Simulation
Source: Monthly Bank Reports, Bank Indonesia
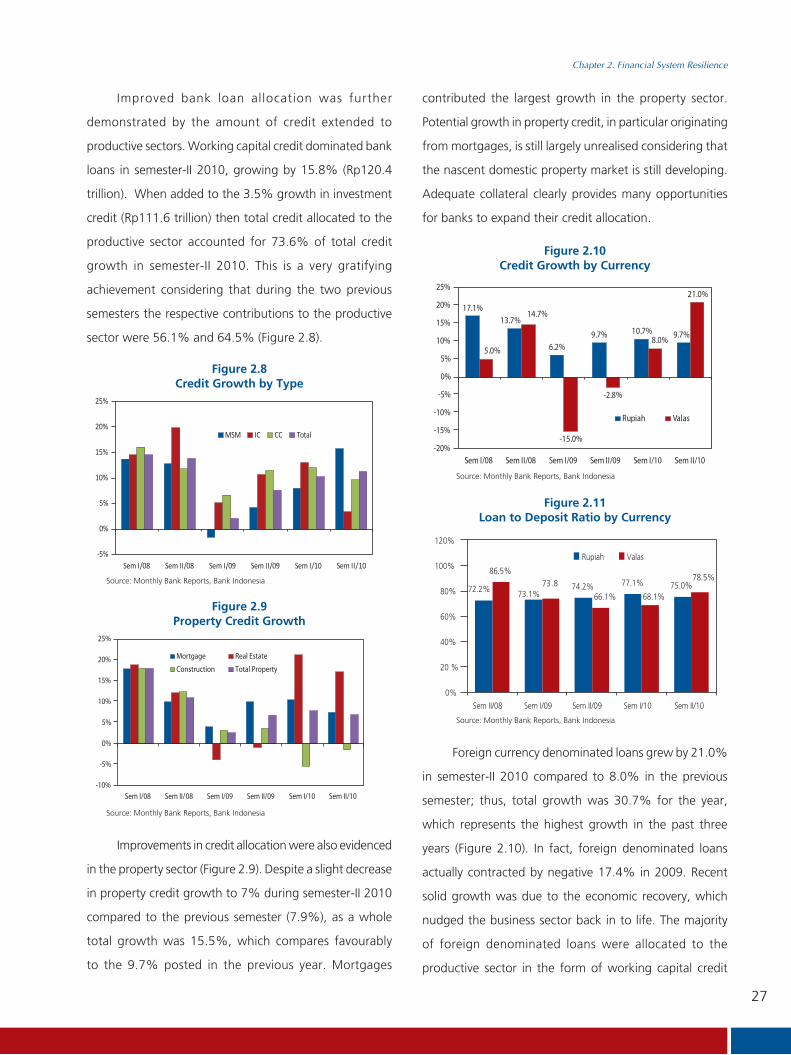
27
Chapter 2. Financial System Resilience
Improved bank loan allocation was further
demonstrated by the amount of credit extended to
productive sectors. Working capital credit dominated bank
loans in semester-II 2010, growing by 15.8% (Rp120.4
trillion). When added to the 3.5% growth in investment
credit (Rp111.6 trillion) then total credit allocated to the
productive sector accounted for 73.6% of total credit
growth in semester-II 2010. This is a very gratifying
achievement considering that during the two previous
semesters the respective contributions to the productive
sector were 56.1% and 64.5% (Figure 2.8).
-5%
0%
5%
10%
15%
20%
25%
Sem I/08 Sem II/08 Sem I/09 Sem II/09 Sem I/10 Sem II/10
MSM IC CC Total
-10%
-5%
0%
5%
10%
15%
20%
25%
Sem I/08 Sem II/08 Sem I/09 Sem II/09 Sem I/10 Sem II/10
Mortgage Real Estate
Construction Total Property
contributed the largest growth in the property sector.
Potential growth in property credit, in particular originating
from mortgages, is still largely unrealised considering that
the nascent domestic property market is still developing.
Adequate collateral clearly provides many opportunities
for banks to expand their credit allocation.
Figure 2.9Property Credit Growth
Figure 2.8Credit Growth by Type
Source: Monthly Bank Reports, Bank Indonesia
Source: Monthly Bank Reports, Bank Indonesia
Improvements in credit allocation were also evidenced
in the property sector (Figure 2.9). Despite a slight decrease
in property credit growth to 7% during semester-II 2010
compared to the previous semester (7.9%), as a whole
total growth was 15.5%, which compares favourably
to the 9.7% posted in the previous year. Mortgages
Figure 2.10Credit Growth by Currency
17.1%13.7%
6.2%9.7% 10.7% 9.7%
5.0%
14.7%
-15.0%
-2.8%
8.0%
21.0%
-20%
-15%
-10%
-5%
0%
5%
10%
15%
20%
25%
Sem I/08 Sem II/08 Sem I/09 Sem II/09 Sem I/10 Sem II/10
Rupiah Valas
72.2% 73.1%74.2% 77.1% 75.0%
86.5%73.8
66.1% 68.1%
78.5%
0%
20 %
40%
60%
80%
100%
120%
Sem II/08 Sem I/09 Sem II/09 Sem I/10 Sem II/10
Rupiah Valas
Source: Monthly Bank Reports, Bank Indonesia
Source: Monthly Bank Reports, Bank Indonesia
Figure 2.11Loan to Deposit Ratio by Currency
Foreign currency denominated loans grew by 21.0%
in semester-II 2010 compared to 8.0% in the previous
semester; thus, total growth was 30.7% for the year,
which represents the highest growth in the past three
years (Figure 2.10). In fact, foreign denominated loans
actually contracted by negative 17.4% in 2009. Recent
solid growth was due to the economic recovery, which
nudged the business sector back in to life. The majority
of foreign denominated loans were allocated to the
productive sector in the form of working capital credit

28
Chapter 2. Financial System Resilience
and investment credit, with a share of 98.4% of the total.
Better export performance in 2010 also stimulated the
extension of foreign denominated loans. The share of such
loans accounted for 15.5% of total bank loans nationally.
Consequently, the LDR for foreign currencies exceeded
that for the rupiah (Figure 2.11).
The rapidity of growth in foreign currency
denominated loans is a positive sign because of its
contribution to economic growth and, subsequently,
exports. However, on the other hand banks must remain
extra vigilant when extending foreign denominated loans
due to risks stemming from fluctuations in the exchange
rate. Rupiah deprecation will increase the burden on
debtors, which could exacerbate the risks associated with
non-performing loans.
Against this conducive backdrop, the opportunity for
banks to continue expanding their credit allocation is wide
open. Of course banks will have to remain observant of
funding sources external to the banks themselves, which
are becoming more competitive, especially through the
capital and bond markets. Financing through the stock and
bond markets reached Rp280.6 trillion in 2010, which is
equivalent to 4.4% of GDP. Such conditions should drive
banks towards greater efficiency gains, thus boosting
competitiveness. The micro, small and medium (MSM)
sector provides a vast opportunity to catalyse growth in
bank loans.
MSM loans totalled Rp926.78 trillion in December
2010, growing by 10.89% in the second semester of
2010, while growth in semester-I 2010 was higher at
13.34%. According to Figure 2.12, year-on-year MSM
credit growth in December 2010 was 25.68%, which
exceeded non-MSM loans (19.77%) and even total bank
loans (22.80%). Such robust credit growth reflected strong
public demand accompanied by widespread supply from
the banks. MSM credit growth was also associated with a
lower interest rate, which in June 2010 averaged 14.49%
and subsequently declined to 14.06% in December of
the same year (Figure 2.13). The drop in the interest
rate demonstrated the banks’ commitment to stimulate
economic activity because lower interest rates prompt
demand and also alleviate the debtors’ burden.
Robust growth ensured that MSM credit dominated
total credit with a share of 52.48% in December 2010,
which is slightly smaller than the share in June 2010 at
52.68%. The share of MSM credit often fluctuates but
averaged 52.40% in 2010, which again demonstrates the
banks’ commitment to galvanise the MSME sector through
greater MSM credit allocation (Figure 2.14).
Figure 2.12MSM Credit Growth (yoy)
MSM
Non MSM
Credit
(10)
-
10
20
30
40
50
2004 2005 2006 2007 2008 2009 2010
%
12
13
14
15
16
17
18
19
2004 2005 2006 2007 2008 2009 2010
Micro Small Medium MSM
Source: Monthly Bank Reports, Bank Indonesia
Source: Monthly Bank Reports, Bank Indonesia
Figure 2.13MSM Lending Rates (%)
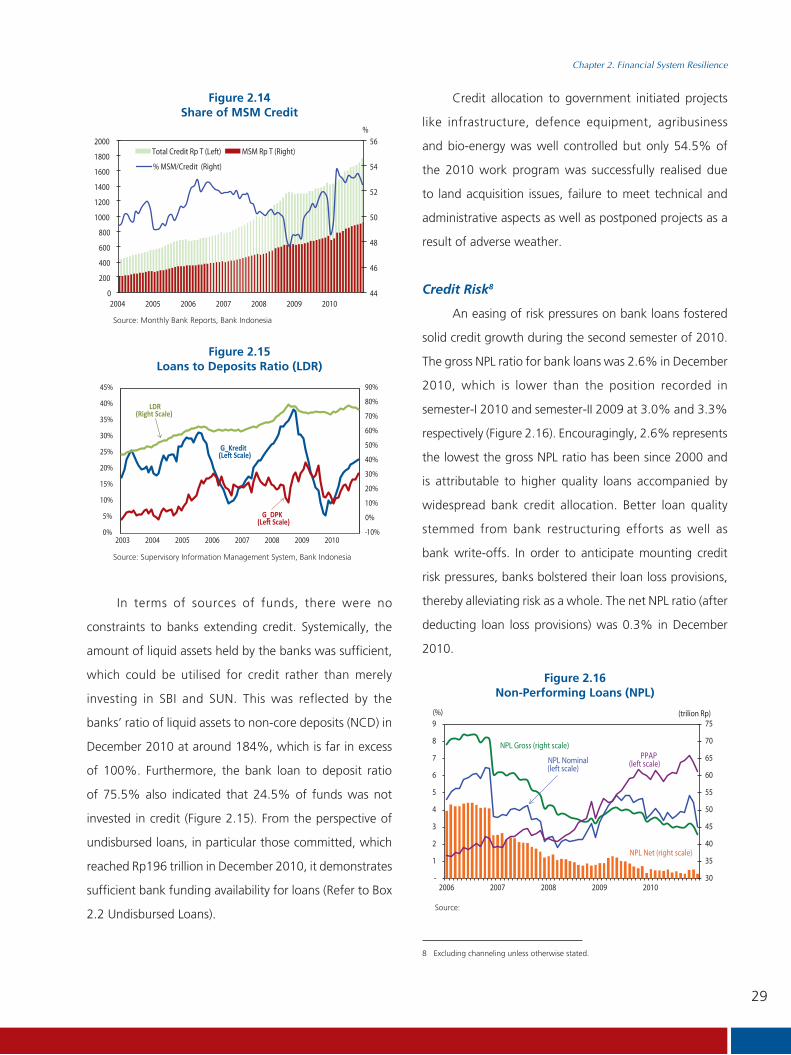
29
Chapter 2. Financial System Resilience
In terms of sources of funds, there were no
constraints to banks extending credit. Systemically, the
amount of liquid assets held by the banks was sufficient,
which could be utilised for credit rather than merely
investing in SBI and SUN. This was reflected by the
banks’ ratio of liquid assets to non-core deposits (NCD) in
December 2010 at around 184%, which is far in excess
of 100%. Furthermore, the bank loan to deposit ratio
of 75.5% also indicated that 24.5% of funds was not
invested in credit (Figure 2.15). From the perspective of
undisbursed loans, in particular those committed, which
reached Rp196 trillion in December 2010, it demonstrates
sufficient bank funding availability for loans (Refer to Box
2.2 Undisbursed Loans).
Figure 2.14Share of MSM Credit
44
46
48
50
52
54
56%
0
200
400
600
800
1000
1200
1400
1600
1800
2000
2004 2005 2006 2007 2008 2009 2010
Total Credit Rp T (Left) MSM Rp T (Right)
% MSM/Credit (Right)
-10%
0%
10%
20%
30%
40%
50%
60%
70%
80%
90%
0%
5%
10%
15%
20%
25%
30%
35%
40%
45%
2003 2004 2005 2006 2007 2008 2009 2010
G_Kredit
Credit allocation to government initiated projects
like infrastructure, defence equipment, agribusiness
and bio-energy was well controlled but only 54.5% of
the 2010 work program was successfully realised due
to land acquisition issues, failure to meet technical and
administrative aspects as well as postponed projects as a
result of adverse weather.
Credit Risk8
An easing of risk pressures on bank loans fostered
solid credit growth during the second semester of 2010.
The gross NPL ratio for bank loans was 2.6% in December
2010, which is lower than the position recorded in
semester-I 2010 and semester-II 2009 at 3.0% and 3.3%
respectively (Figure 2.16). Encouragingly, 2.6% represents
the lowest the gross NPL ratio has been since 2000 and
is attributable to higher quality loans accompanied by
widespread bank credit allocation. Better loan quality
stemmed from bank restructuring efforts as well as
bank write-offs. In order to anticipate mounting credit
risk pressures, banks bolstered their loan loss provisions,
thereby alleviating risk as a whole. The net NPL ratio (after
deducting loan loss provisions) was 0.3% in December
2010.
Source: Monthly Bank Reports, Bank Indonesia
Source: Supervisory Information Management System, Bank Indonesia
Source:
Figure 2.15Loans to Deposits Ratio (LDR)
Figure 2.16Non-Performing Loans (NPL)
PPAP(left scale)NPL Nominal
(left scale)
30
35
40
45
50
55
60
65
70
75
-
1
2
3
4
5
6
7
8
9
2006 2007 2008 2009 2010
(trilion Rp)(%)
NPL Gross (right scale)
NPL Net (right scale)
8 Excluding channeling unless otherwise stated.
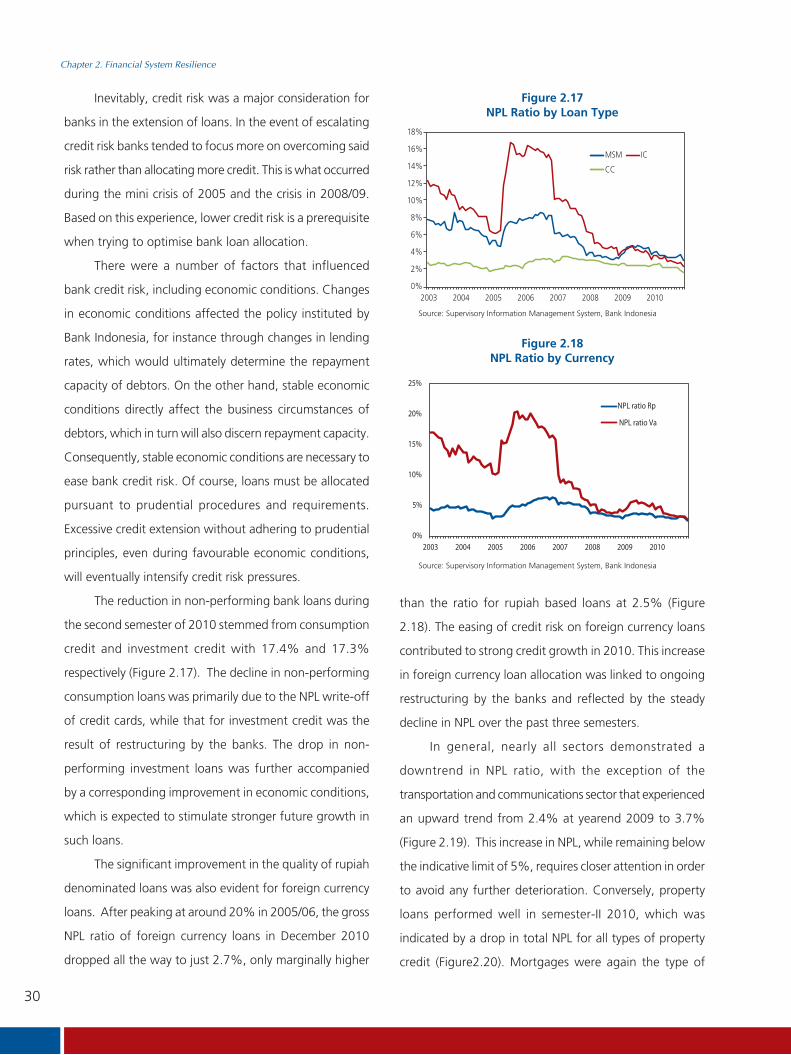
30
Chapter 2. Financial System Resilience
Inevitably, credit risk was a major consideration for
banks in the extension of loans. In the event of escalating
credit risk banks tended to focus more on overcoming said
risk rather than allocating more credit. This is what occurred
during the mini crisis of 2005 and the crisis in 2008/09.
Based on this experience, lower credit risk is a prerequisite
when trying to optimise bank loan allocation.
There were a number of factors that influenced
bank credit risk, including economic conditions. Changes
in economic conditions affected the policy instituted by
Bank Indonesia, for instance through changes in lending
rates, which would ultimately determine the repayment
capacity of debtors. On the other hand, stable economic
conditions directly affect the business circumstances of
debtors, which in turn will also discern repayment capacity.
Consequently, stable economic conditions are necessary to
ease bank credit risk. Of course, loans must be allocated
pursuant to prudential procedures and requirements.
Excessive credit extension without adhering to prudential
principles, even during favourable economic conditions,
will eventually intensify credit risk pressures.
The reduction in non-performing bank loans during
the second semester of 2010 stemmed from consumption
credit and investment credit with 17.4% and 17.3%
respectively (Figure 2.17). The decline in non-performing
consumption loans was primarily due to the NPL write-off
of credit cards, while that for investment credit was the
result of restructuring by the banks. The drop in non-
performing investment loans was further accompanied
by a corresponding improvement in economic conditions,
which is expected to stimulate stronger future growth in
such loans.
The significant improvement in the quality of rupiah
denominated loans was also evident for foreign currency
loans. After peaking at around 20% in 2005/06, the gross
NPL ratio of foreign currency loans in December 2010
dropped all the way to just 2.7%, only marginally higher
than the ratio for rupiah based loans at 2.5% (Figure
2.18). The easing of credit risk on foreign currency loans
contributed to strong credit growth in 2010. This increase
in foreign currency loan allocation was linked to ongoing
restructuring by the banks and reflected by the steady
decline in NPL over the past three semesters.
In general, nearly all sectors demonstrated a
downtrend in NPL ratio, with the exception of the
transportation and communications sector that experienced
an upward trend from 2.4% at yearend 2009 to 3.7%
(Figure 2.19). This increase in NPL, while remaining below
the indicative limit of 5%, requires closer attention in order
to avoid any further deterioration. Conversely, property
loans performed well in semester-II 2010, which was
indicated by a drop in total NPL for all types of property
credit (Figure2.20). Mortgages were again the type of
Figure 2.17NPL Ratio by Loan Type
0%
2%
4%
6%
8%
10%
12%
14%
16%
18%
2003 2004 2005 2006 2007 2008 2009 2010
MSM IC
CC
0%
5%
10%
15%
20%
25%
2003 2004 2005 2006 2007 2008 2009 2010
NPL ratio Rp
NPL ratio Va
Source: Supervisory Information Management System, Bank Indonesia
Source: Supervisory Information Management System, Bank Indonesia
Figure 2.18NPL Ratio by Currency
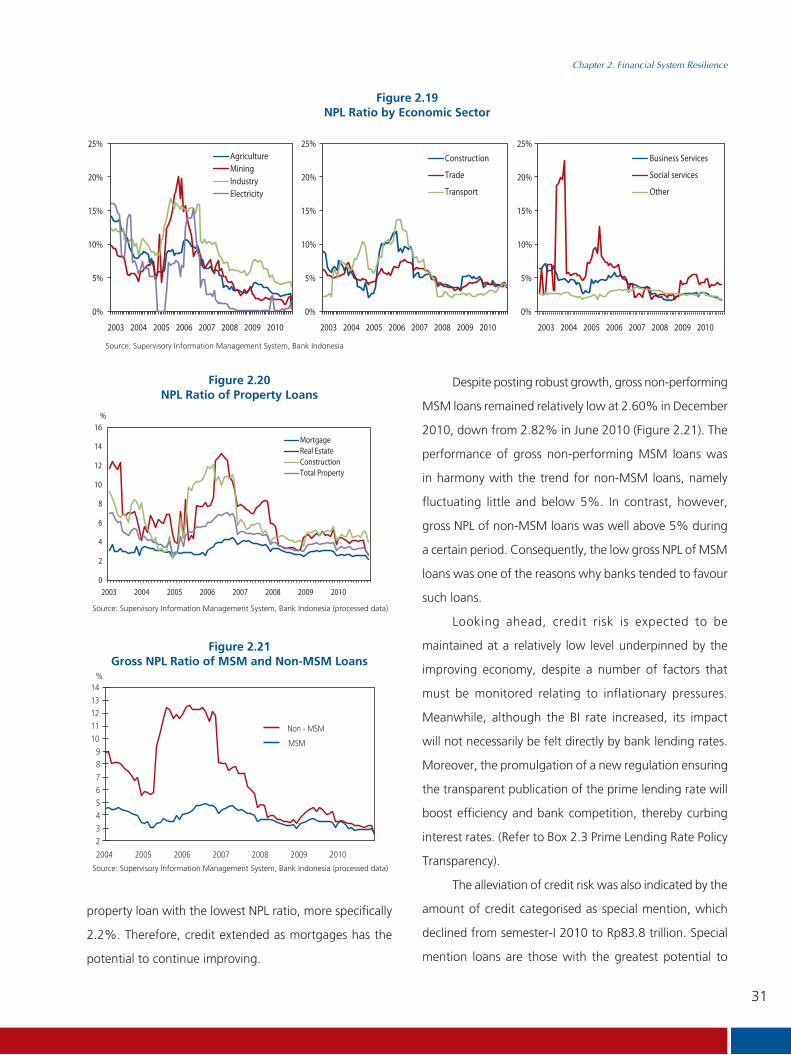
31
Chapter 2. Financial System Resilience
Despite posting robust growth, gross non-performing
MSM loans remained relatively low at 2.60% in December
2010, down from 2.82% in June 2010 (Figure 2.21). The
performance of gross non-performing MSM loans was
in harmony with the trend for non-MSM loans, namely
fluctuating little and below 5%. In contrast, however,
gross NPL of non-MSM loans was well above 5% during
a certain period. Consequently, the low gross NPL of MSM
loans was one of the reasons why banks tended to favour
such loans.
Looking ahead, credit risk is expected to be
maintained at a relatively low level underpinned by the
improving economy, despite a number of factors that
must be monitored relating to inflationary pressures.
Meanwhile, although the BI rate increased, its impact
will not necessarily be felt directly by bank lending rates.
Moreover, the promulgation of a new regulation ensuring
the transparent publication of the prime lending rate will
boost efficiency and bank competition, thereby curbing
interest rates. (Refer to Box 2.3 Prime Lending Rate Policy
Transparency).
The alleviation of credit risk was also indicated by the
amount of credit categorised as special mention, which
declined from semester-I 2010 to Rp83.8 trillion. Special
mention loans are those with the greatest potential to
Figure 2.19NPL Ratio by Economic Sector
0%
5%
10%
15%
20%
25%
2003 2004 2005 2006 2007 2008 2009 2010 2003 2004 2005 2006 2007 2008 2009 2010 2003 2004 2005 2006 2007 2008 2009 2010
AgricultureMiningIndustryElectricity
0%
5%
10%
15%
20%
25%
Construction
Trade
Transport
0%
5%
10%
15%
20%
25%
Business Services
Social services
Other-
Source: Supervisory Information Management System, Bank Indonesia
Figure 2.20NPL Ratio of Property Loans
Figure 2.21Gross NPL Ratio of MSM and Non-MSM Loans
0
2
4
6
8
10
12
14
16
2003 2004 2005 2006 2007 2008 2009 2010
MortgageReal EstateConstructionTotal Property
%
2
3
4
5
6
7
8
9
10
11
12
13
14%
2004 2005 2006 2007 2008 2009 2010
Non - MSM
MSM
Source: Supervisory Information Management System, Bank Indonesia (processed data)
Source: Supervisory Information Management System, Bank Indonesia (processed data)
property loan with the lowest NPL ratio, more specifically
2.2%. Therefore, credit extended as mortgages has the
potential to continue improving.

32
Chapter 2. Financial System Resilience
become a loss. Stress tests of credit risk under a scenario
of a 2.5-fold increase in NPL (assuming 0% GDP growth)
stemming from Standard and Special Mention loans that
subsequently deteriorated to Doubtful, revealed a potential
340bps drop in CAR (Figure 2.22).
hikes (Figure 2.23 and 2.24). According to the results of
stress tests regarding changes in the interest rate, banking
industry CAR could drop by as much as 68bps in the event
of a 500bps hike in interest rates (Figure 2.25). This indicates
an improvement in bank vulnerability in comparison to
semester-I 2010 (CAR down by 105bps). Meanwhile,
more intense inflationary pressures approaching yearend
tended to encourage banks to reposition their assets in
anticipation of future interest rate risk hikes. The industry
as a whole is expected to satisfactorily manage future
increases in the interest rate.
Relatively low bank exposure to foreign currencies led
to low exchange rate risk for the banks. Bank exposure to
foreign currencies, as indicated by the net open position,
which was just 3.7% a yearend 2010, was much lower
compared to the end of 2009 (Figure 2.26). The risk of
Market Risk
Market risk was well managed during the second
semester of 2010, which contributed to the preservation
of financial system stability. Stronger concerns regarding
the debt crisis in Europe and its affect on global economic
conditions led to negative sentiment on global markets,
which overshadowed domestic economic prospects
during semester-II 2010. Nevertheless, the problems in
Europe did not significantly influence bank exposure on
and off the balance sheet. Consequently, contagion risk
from counterparty default did not affect bank capital.
Meanwhile, escalating inflationary pressures in the fourth
quarter of 2010 were felt on the domestic debt market.
Mounting inflationary pressures drove expectations
of a climbing interest rate, which had the potential to
undermine capital, particularly at banks with a short-term
funding structure (under three months).
With a bank maturity profile structure that tended
towards short in the short term and long in the long
term, banks were vulnerable to potential interest rate
Figure 2.22Results of Stress Testing Credit Risk
0.00
2.00
4.00
6.00
8.00
10.00
12.00
14.00
16.00
18.00
Initial CAR NPL 5% NPL 7.5% NPL 10% NPL 12.5% NPL 15%
CAR (%)
-340 bps
Figure 2.23Rupiah Maturity Profile
Figure 2.24USD Maturity Profile
-800
-600
-400
-200
0
200
400
600
up to 1 month 1-3 month 3-6 month 6-12 month >12 month
Jun-09 Dec -09 Jun-10 Dec -10
Rp T
-20
-15
-10
-5
0
5
10
15
up to 1 month 1-3 month 3-6 month 6-12 month >12 month
Jun-09 Dec-09 Jun-10 Dec-10
Billion USD
Source: Supervisory Information Management System, Bank Indonesia (processed data)

33
Chapter 2. Financial System Resilience
The SUN price increased by just 180bps during
semester-II 2010, subsequent to a significant 988bps
jump in semester-I, due to price corrections in November
(down 160bps) and December (down 96bps) followed by
rising inflationary pressures and excessively high prices.
The banks’ SUN portfolio experienced a downward
trend in the second semester of 2010, declining 5.22%
to Rp223.54 trillion (December 2010). In terms of the
composition, banks tended to decrease their available-
for-sale (AFS) and hold-to-maturity (HTM) SUN in favour
of trading SUN in line with the auspicious domestic
economic outlook. Notwithstanding, bank risk increased,
however, the majority of SUN held by banks was available
for sale (60.18%), while trading and hold-to-maturity SUN
amounted to 6.71% and 33.10% respectively.
The relatively small share of trading SUN, which was
exposed to mark to market, had a minimal impact on the
risk of lower SUN prices on bank capital. This was backed
up by stress tests that proved no bank’s CAR would drop
below the 8% limit, with CAR for the industry as a whole
only declining by 70bps in the event of a 25% dip in SUN
process. Nonetheless, when AFS SUN were included in
the simulations, the impact was more pronounced, with
CAR potential falling by 107bps (Figure 2.28). Therefore,
the 2.36% decline in SUN prices during November and
Figure 2.25Results of Stress Testing Interest Rate Increases
Figure 2.26Net Open Position (NOP)
15.80%
16.00%
16.20%
16.40%
16.60%
16.80%
17.00%
17.20%
Initial CAR Int. rate rise 1%
Int. rate rise 2%
Int. rate rise 3%
Int. rate rise 4%
Int. rate rise 5%
CAR
- 66 bps
9.75
%
3.56
%
3.15
%
6.39
%
5.87
%
2.00
%
4.5%
3.7%
2.4%
4.1% 4.
8%
4.1%
2.8%
3.9%
3.0%
4.5%
2.8%
3.1%2.
8%
2.5%
3.8%
3.8%
8.6%
3.7%
0%
4%
8%
12%
NationalPrivate
JointVenture
RegionalDevelopment
State Owned Foreign All Bank
June 2009 December 2009
June 2010 December 2010
Net Open Position
16.94%
16.95%
16.95%
16.96%
16.96%
16.97%
16.97%
16.98%
Initial CAR Depreciation Rp Depreciation Rp Depreciation Rp Depreciation Rp Depreciation Rp 10% 20% 30% 40% 50%
CAR
-2 bps
Figure 2.27Results of Stress Testing Rupiah Depreciation
Source: Monthly Bank Reports, Bank Indonesia (processed data)
exchange rate depreciation did not affect bank capital
as demonstrated by stress testing the exchange rate.
Assuming 50% rupiah depreciation, banking industry CAR
only declined by 2bps (Figure 2.27).
Figure 2.28Results of Stress Testing a decline in SUN Price
-
15.20%
15.40%
15.60%
15.80%
16.00%
16.20%
16.40%
16.60%
16.80%
17.00%
17.20%
Initial CAR Prices ofgovernmentbonds 5%
Prices ofgovernmentbonds -10%
Prices ofgovernmentbonds -15%
Prices ofgovernmentbonds -20%
Prices ofgovernmentbonds -25%
-
CAR
107 bps
Source: Monthly Bank Reports, Bank Indonesia (processed data)

34
Chapter 2. Financial System Resilience
December 2010 (far below 25%) did not have any
significant impact on bank capital.
2.2.3. Profitability and Capital
Profitability
Positive bank performance throughout 2010 was
accompanied by increased profitability. Banks posted net
profits of Rp27.98 trillion in the second semester of 2010,
which exceed that recorded in the same period of the
previous year, namely Rp21.89 trillion. Accordingly, for
2010 as a whole, banks netted Rp57.31 trillion in profits;
up 26.74% compared to the previous year (Table 2.3).
Strong credit growth broadened interest rate spread
in 2010 and helped raise bank profitability (Figure 2.29), as
reflected by the persistently dominant share of operational
profit in total bank profit (Refer to Box 2.5 Analysis of
the main Sources of Bank Profitability). In December
2010, 65.54% of bank profit (before tax) originated
from operational profit, in particular interest income.
Conversely, the profits gleaned from foreign currency
transactions contributed a smaller amount than the
previous semester despite greater control over exchange
rate volatility in semester-II 2010 (Figure 2.29).
The domination of interest income in terms of total
bank profit was further confirmed by Net Interest Income
(NII), which averaged Rp12.48 trillion per month in 2010
compared to just Rp10.77 trillion per month in 2009
(Figure 2.31). Among the various component sources of
bank interest income, interest income from loans remained
Figure 2.30Composition of Operational Profit/Loss
(15)
(5)
5
15
Jan-10 Feb-10 Mar-10 Apr-10 May-10 Jun-10 Jul-10 Aug-10 Sep-10 Oct-10 Nov-10 Dec-10
Rp T
P/L Interest P/L Forex Transaction Other P/L Total Operational P/L
Figure 2.29Rupiah interest Rate Spread
4
8
12
16
20
Jan -07 Oct July -08 Apr -09 Jan -10 Oct -10
%
Dep 1 month MSM IC CC
Source: Monthly Bank Reports, Bank Indonesia
Source: Monthly Bank Reports, Bank Indonesia
sem I 09 sem I 10sem II 09 sem II 10Current P/Lup to Dec-09
Current P/Lup to Dec-10
Operational L/R 18,79 21,08 39,87 23,19 25,14 48,33
Non Operational L/R 12,69 9,22 21,91 16,12 11,61 27,73
Pre Tax L/R 31,48 30,30 61,78 39,31 36,75 76,06
After Tax L/R 23,33 21,89 45,22 29,33 27,98 57,31
Table 2.3Profit/Loss
Sumber: Laporan Bulanan Bank Umum (LBU), Bank Indonesia
dominant with an 81.1% share in December 2010.
Comparatively, interest income derived from placements
at Bank Indonesia and ownership of securities respectively
contributed shares of 6.75% and 8.88%. This structure
changed little from that in the previous semester (Figure
2.32).

35
Chapter 2. Financial System Resilience
Despite the increase in bank profits, the ROA ratio
declined marginally compared to the position in June 2010
(2.89%) to 2.74% in December 20101 due to solid credit
growth in the final semester. However, enhanced business
efficiency was denoted by a decline in the BOPO efficiency
ratio from 84.81% to 79.96% in the same period.
Capital
Bank capital remained relatively stable during
semester-II 2010 at around 16-17%. At the end of
semester-II 2010 bank CAR was 16.97%; down from
17.4% at the end of semester-I 2010 (Figure 2.33). The
decline in CAR was primarily due to an increase in average
risk-weighted assets that exceeded the average rise in
capital. Average capital at the end of semester-II 2010 had
risen by just 5.66%, while average risk-weighted assets
had risen by 18.29%. Total bank capital in December 2010
reached Rp330 trillion, while risk-weighted assets totaled
Rp1,944.30 trillion (Figure 2.34).
Figure 2.31Net Interest Income (monthly)
10
11
12
13
14
0
5
10
15
20
25
Jan -10 Mar -10 May -10 Jul -10 Sep -10 Nov -10
Rp TRp T
Interest Income Interest Expense NII (left scale)
Figure 2.32Share of Bank Interest Income
Credit90%
80,55% 81,11% 81,10%81,20%
6,22% 6,40%8,75% 5,45%
6,40%5,22%
6,75%8,88%
Q I 2010 Q II 2010 Q III 2010 Q IV 2010
60%
30%
0%
Placement at BI Inter Bank OthersKSB
Source: Monthly Bank Reports, Bank Indonesia
Source: Monthly Bank Reports, Bank Indonesia
Figure 2.34Risk-Weighted Assets
0%
5%
10%
15%
20%
25%
0
500
1,000
1,500
2,000
2,500
Dec -06 Jun -07 Dec -07 Jun -08 Dec -08 Jun -09 Dec -09 Jun -10 Dec -10
CAPITAL RWA CAR (letf scale)
Rp T
0
500
1000
1500
2000
2500
Total RWA RWA Credit RWA Market RWA Operational
Jun-09 Dec-09 Jun-10 Dec-10
Rp T
12.26%14.92%
Figure 2.33Capital
Source: Supervisory Information Management System, Bank Indonesia
Source: Supervisory Information Management System, Bank Indonesia
The increase in risk-weighted assets (ATMR)
principally stemmed from nominal credit ATMR amounting
to Rp194.21 trillion or 12.26% in semester-II 2010 (an
increase of just Rp7.31 trillion was reported in semester-I),
congruent to the surge in credit in the second semester.
The determinant factors (alpha) in the calculation of
operational risk were based on the Basic Indicator
Approach (BIA), which rose to 10% in July 2010, thereby
raising liabilities in the form of operational risk capital
reserves. Operational risk-weighted assets increased by
Rp48.79 trillion or 55.30% in semester-II 2010. In addition
to the increase in risk-weighted assets for operational and
credit risk, market risk weighted assets also followed an

36
Chapter 2. Financial System Resilience
upward trend, increasing by Rp9.39 trillion or 46.97% in
the second half of 2010.
The composition of bank capital in December
2010 was still dominated by Tier 1 capital (89%). The
increase in bank capital experienced in semester-II 2010
principally emanated from Tier 1 capital, which expanded
by Rp28.36 trillion or 10.69% to Rp293.68 trillion, and
Tier 2 capital that grew by Rp7.02 trillion or 24.01% to
Rp36.27 trillion. The ratio of Tier 1 capital to risk-weighted
assets in December 2010 was 15.10% (Figure 2.35). With
a relatively high composition of Tier 1 capital, banks are
expected to successfully anticipate the stricter definition
of capital under Basel III, where the components of bank
capital requirements have to be tighter, more permanent
and able to absorb losses. The results of studies, after Tier
1 capital was redefined, including regulatory adjustments
(like goodwill, intangible, deferred tax assets, cash flow
hedge reserve, investment, etc.), show a decline in Tier
1 capital of about 1.62%. Notwithstanding, the ratio
of bank Tier 1 was still adequate to meet the minimum
requirements under Basel III, namely common equity of
4.5% and tier 1 of 6%. The ratio of paid-up capital to
total capital was 57.75% in December 2010.
2.3. POTENTIAL FINANCIAL MARKET RISK AND
FINANCING
2.3.1. Potential Financial Market Risk
Foreign Portfolio: SBI, SUN and Stock
Short-term foreign capital inflows continued in
semester-II 2010, through foreign investments in rupiah
financial assets (SBI, SUN and stock) totaling Rp60.09
trillion, which brought the total for 2010 to around
Rp119.48 trillion (Figure 2.36). Nevertheless, as 2010 drew
to a close (November) significant capital outflows appeared
(Rp18.14 trillion) chiefly due to portfolio repositioning by
investors as the end of the year approached triggered by
negative international sentiment. The influx of foreign
capital flows precipitated a respective Rp13.27 trillion and
Rp33.70 trillion increase in SBI and SUN investment (Figure
2.37). Meanwhile, foreign capital also flowed on to the
stock market, indicated by net foreign stock purchases
of Rp13.27 trillion (Figure 2.38). Therefore, the share
of foreign SBI ownership at yearend 2010 was 27.45%
(15.50% in June 2010) and the share of foreign SUN
ownership was 29.93%; up from 25.76% in June 2010.
Furthermore, the portion of foreign shares increased to
32.29% from 31.36% at the end of June.
Figure 2.35Tier 1 and Tier 2
Figure 2.36Foreign Investments (SBI, SUN and Stock)
0%
5%
10%
15%
20%
25%
0
50
100
150
200
250
300
350
Dec -06 Jun-07 Dec -07 Jun-08 Dec -08 Jun-09 Dec -09 Jun-10 Dec -10
TIER 1 TIER 2 CAR (left scale)
Rp T
SBI
Q1 Q2 Q3 Q4 Q1 Q2
20102009
Q3 Q4
Rp T
22,00
18,00
14,00
10,00
6,00
2,00
-2,00
-6,00
-10,00
-14,00
-18,00
SOVERMENTS BONDS STOCK
Source: Supervisory Information Management System, Bank IndonesiaSource: Directorate of Monetary Management, Bank Indonesia
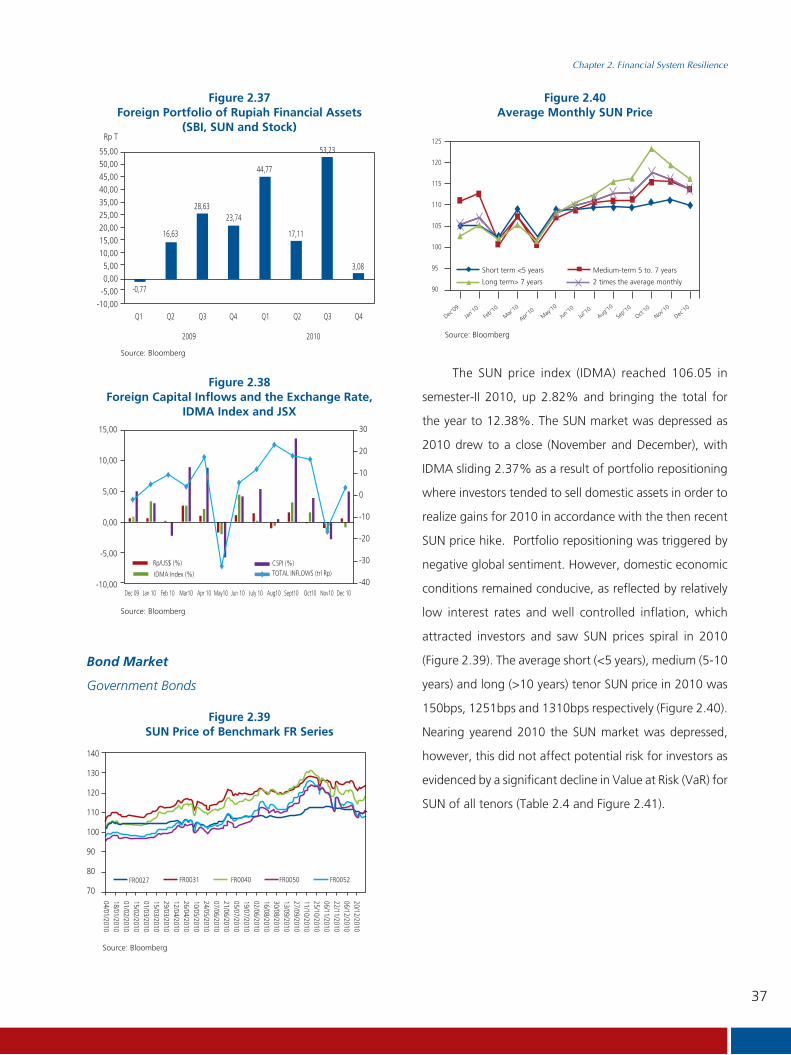
37
Chapter 2. Financial System Resilience
Bond Market
Government Bonds
The SUN price index (IDMA) reached 106.05 in
semester-II 2010, up 2.82% and bringing the total for
the year to 12.38%. The SUN market was depressed as
2010 drew to a close (November and December), with
IDMA sliding 2.37% as a result of portfolio repositioning
where investors tended to sell domestic assets in order to
realize gains for 2010 in accordance with the then recent
SUN price hike. Portfolio repositioning was triggered by
negative global sentiment. However, domestic economic
conditions remained conducive, as reflected by relatively
low interest rates and well controlled inflation, which
attracted investors and saw SUN prices spiral in 2010
(Figure 2.39). The average short (<5 years), medium (5-10
years) and long (>10 years) tenor SUN price in 2010 was
150bps, 1251bps and 1310bps respectively (Figure 2.40).
Nearing yearend 2010 the SUN market was depressed,
however, this did not affect potential risk for investors as
evidenced by a significant decline in Value at Risk (VaR) for
SUN of all tenors (Table 2.4 and Figure 2.41).
Figure 2.37Foreign Portfolio of Rupiah Financial Assets
(SBI, SUN and Stock)Rp T
55,0050,0045,0040,0035,0025,0020,0015,0010,00
5,000,00
-5,00-10,00
-0,77
Q1 Q2 Q3
2009 2010
Q4 Q1 Q2 Q3 Q4
16,63
28,6323,74
44,77
17,11
53,23
3,08
Figure 2.38Foreign Capital Inflows and the Exchange Rate,
IDMA Index and JSX
Figure 2.39SUN Price of Benchmark FR Series
15,00
10,00
5,00
0,00
-5,00
-10,00
30
20
10
0
-10
-20
-30
-40Dec 09 Jan 10 Feb 10 Mar10 May10 Sept10 Nov10Apr 10 Jun 10 July 10 Aug10 Oct10 Dec 10
TOTAL INFLOWS (trl Rp)IDMA Index (%)
CSPI (%)Rp/US$ (%)
Source: Bloomberg
Source: Bloomberg
140
130
120
110
100
90
80
70
20/12/201006/12/201022/11/201006/11/201025/10/201011/10/201027/09/201013/09/201030/08/201016/08/201002/06/201019/07/201005/07/201021/06/201007/06/201024/05/201010/05/201026/04/201012/04/201029/03/201015/03/201001/03/201015/02/201001/02/201018/01/201004/01/2010
FR0027 FR0031 FR0040 FR0050 FR0052
Source: Bloomberg
Figure 2.40Average Monthly SUN Price
125
120
115
110
105
100
95
90
Short term <5 years
Long term> 7 years
Medium-term 5 to. 7 years
2 times the average monthly
Dec’09
Jan’10
Feb’10
Mar’10
Apr’10
May’10
Jun’10
Jul’10
Aug’10
Sep’10
Oct’10
Nov’10
Dec’10
Source: Bloomberg

38
Chapter 2. Financial System Resilience
Corporate Bonds
Market perception of the risk profile of corporate
bonds remained relatively high, on average 397bps above
the SUN yield, compared to 195bps above the SUN yield
in 2009 (Figure 2.43 and 2.44). The wider yield spread
between SUN and corporate bonds was due to Moody’s,
Fitch and the Japan Credit Rating Agency all upgrading
their rating of government bonds.
Government issuances of SUN increased by 3.22%
to Rp641.21 trillion in 2010 with a declining share of
bank ownership to 34.23% (37.45% in 2009), while the
share of foreign SUN ownership expanded (Table 2.5).
From a liquidity standpoint, the government was able to
exploit the steady interest rate and strengthen SUN market
liquidity through the issuance of longer-tenor SUN (Figure
2.42). Consequently, SUN market liquidity became more
concentrated on long-tenor SUN. At the end of 2010 the
share of short-tenor SUN was 7.37% (7.83% in 2009),
medium-tenor SUN was 5.10% (8.03% in 2009) and
long-tenor SUN was 86.53% (85.06% in 2009).
Table 2.4VaR SUN
TenorShortTerm
MiddleTerm
LongTerm
Dec 09 0.757 1,293 1,560
Jan 10 0,625 1,201 1,412
Feb 10 0,514 1,028 1,229
Mar 10 0,399 0,846 0,908
Apr 10 0,384 0,835 0,919
May 10 0,384 0,899 1,001
June 10 0,361 0,808 0,930
July 10 0,354 0,792 0,913
Aug 10 0,304 0,724 0,883
Sept 10 0,315 0,704 0,882
Oct 10 0,309 0,685 0,962
Nov 10 0,323 0,702 1,137
Dec 10 0,338 0,720 1,191
Figure 2.41VaR SUN
Figure 2.42Maturity Profile SUN
1,800
1,600
1,400
1,200
1,000
0,800
0,600
0,400
0,2000,000
Dec 09 Jan 10
Short Term Long Term Long Term
Feb 10 Mar 10 Apr 10 May 10 Jun 10 Jul 10 Aug 10 Sept 10 Oct 10 Nov 10 Dec 10
60
50
2011
2012
2013
2014
2015
2016
2017
2018
2019
2020
2021
2022
2023
2024
2025
2026
2027
2028
2030
2031
2037
2038
40
30
20
10
Variable Rate
Rp T
Fixed Rate
Source: Bloomberg (processed data)
Source: Bloomberg (processed data)
Source: Bloomberg
Tabel 2.5SBN Ownership
Ownership
Rp T
Jun’10 Des’10 Change
SBN Ownership (Nominal)
Banking 232,67 219,52 -13,15
BI 19,12 15,62 -3,5
Mutual Fund 48,84 51,16 2,32
Insurance 77,44 79,3 1,86
Foreign 162,05 195,3 33,25
Pension Fund 36,48 36,75 0,27
Securities 0,13 0,13 0
Others 44,49 43,43 -1,06
Total 621,22 641,21 19,99
Source: Bloomberg (processed data)

39
Chapter 2. Financial System Resilience
In the ASEAN region, Indonesia government bonds
were hit hard and experienced significant declines across
all tenors, with 10-year-tenor SUN affected most harshly,
namely a drop of 260bps (Figure 2.45 and 2.46). Despite
the setback, the yield of government bonds in Indonesia
remained the highest in the region and, thus, attractive
to investors in the short term.
Stock Market
The JSX Composite continued to strengthen in
semester-II 2010 to a level of 3,703.51 (up 27.11%),
bringing the total increase for the year of 2010 to 46.13%
(Table 2.6 and Figure 2.47). On 11th September 2010
foreign capital flowed out of Indonesia triggered by
negative sentiment that spurred inflationary pressures,
hence the index sunk to its nadir of 3,531.21. Global
bourses in 2010 strengthened due to positive sentiment
surrounding government stimuli and low interest rates
maintained by the Federal Reserve, European Central Bank
and Bank of Japan. Meanwhile, concerns over the debt crisis
in Europe eased after the ECB agreed a bailout package for
the countries involved and reiterated its commitment to
buy government bonds from the European Union, which
led to positive sentiment on global bourses.
Figure 2.43Corporate Bond and SUN Yield (December 2009)
Figure 2.44Corporate Bond and SUN Yield (December 2010)
Figure 2.45Bond Yields in ASEAN (December 2009)
Corporation SUN
14
12
10
8
6
4
2
01 2 3 4 5 6 7 8 9 10 11
Corporation SUN
14
12
10
8
6
4
2
01 2 3 4 5 6 7 8 9 10 11
12
10
8
6
4
2
01
Indonesia Malaysia
Philippines Singapore
2 3 4 5 6 7 8 9 10 15 20 25 30
Source: Bloomberg
Source: Bloomberg
Source: Bloomberg
Figure 2.46Bond Yields in ASEAN (December 2010)
12
10
8
6
4
2
01
Indonesia Malaysia Philiphina Singapore
2 3 4 5 6 7 8 9 10 15 20 25 30
Sumber: Bloomberg
Figure 2.47JSX Composite as well as Global & Regional Indices
(Indexed against the position on 31st December 2005)
Des 09
Jan 10
Feb 10
Mar 10
Apr 10
Mey 10
Jun 10
Jul 10
Agt 10
Sep 10
Oct 10
Nov 10
Dec 10
3.20
2.70
2.20
1.70
1.20
0.70
IHSGPCOMP
FTSE
FSSTINKYNYA
SETHang Seng
KLCIKOSPI
DJIA
Source: Bloomberg
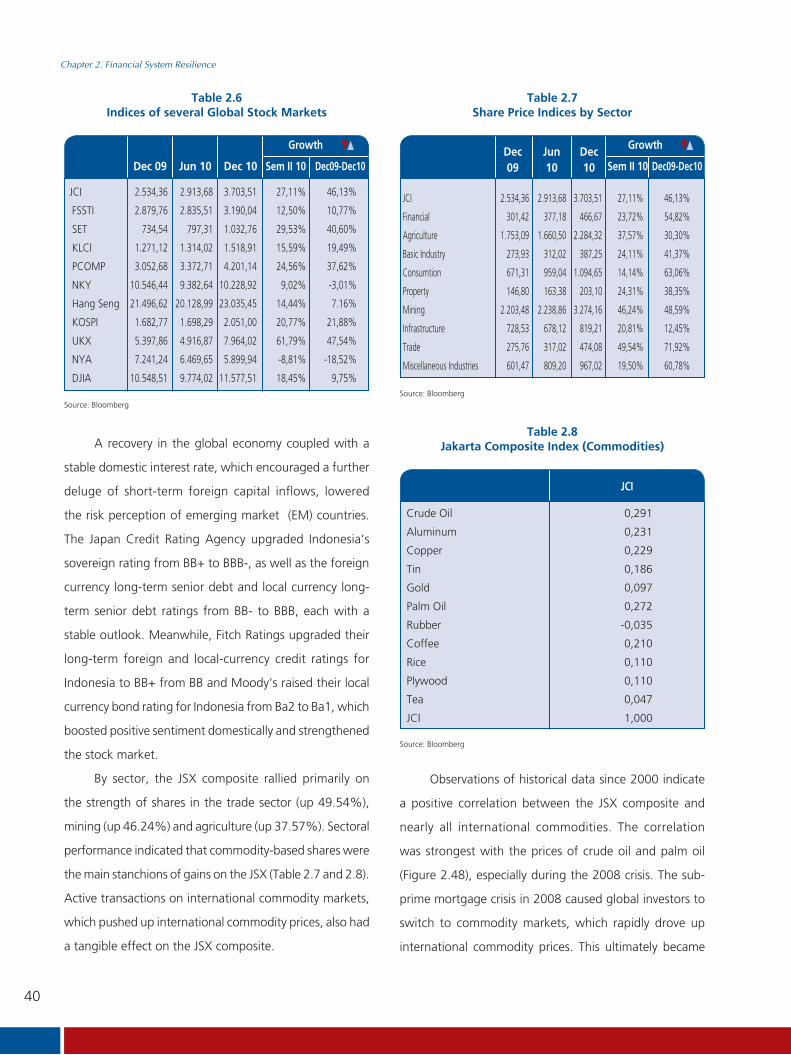
40
Chapter 2. Financial System Resilience
A recovery in the global economy coupled with a
stable domestic interest rate, which encouraged a further
deluge of short-term foreign capital inflows, lowered
the risk perception of emerging market (EM) countries.
The Japan Credit Rating Agency upgraded Indonesia’s
sovereign rating from BB+ to BBB-, as well as the foreign
currency long-term senior debt and local currency long-
term senior debt ratings from BB- to BBB, each with a
stable outlook. Meanwhile, Fitch Ratings upgraded their
long-term foreign and local-currency credit ratings for
Indonesia to BB+ from BB and Moody’s raised their local
currency bond rating for Indonesia from Ba2 to Ba1, which
boosted positive sentiment domestically and strengthened
the stock market.
By sector, the JSX composite rallied primarily on
the strength of shares in the trade sector (up 49.54%),
mining (up 46.24%) and agriculture (up 37.57%). Sectoral
performance indicated that commodity-based shares were
the main stanchions of gains on the JSX (Table 2.7 and 2.8).
Active transactions on international commodity markets,
which pushed up international commodity prices, also had
a tangible effect on the JSX composite.
Observations of historical data since 2000 indicate
a positive correlation between the JSX composite and
nearly all international commodities. The correlation
was strongest with the prices of crude oil and palm oil
(Figure 2.48), especially during the 2008 crisis. The sub-
prime mortgage crisis in 2008 caused global investors to
switch to commodity markets, which rapidly drove up
international commodity prices. This ultimately became
Table 2.6Indices of several Global Stock Markets
Dec 09 Jun 10 Dec 10 Sem II 10
Growth
Dec09-Dec10
JCI 2.534,36 2.913,68 3.703,51 27,11% 46,13%
FSSTI 2.879,76 2.835,51 3.190,04 12,50% 10,77%
SET 734,54 797,31 1.032,76 29,53% 40,60%
KLCI 1.271,12 1.314,02 1.518,91 15,59% 19,49%
PCOMP 3.052,68 3.372,71 4.201,14 24,56% 37,62%
NKY 10.546,44 9.382,64 10.228,92 9,02% -3,01%
Hang Seng 21.496,62 20.128,99 23.035,45 14,44% 7.16%
KOSPI 1.682,77 1.698,29 2.051,00 20,77% 21,88%
UKX 5.397,86 4.916,87 7.964,02 61,79% 47,54%
NYA 7.241,24 6.469,65 5.899,94 -8,81% -18,52%
DJIA 10.548,51 9.774,02 11.577,51 18,45% 9,75%
Table 2.8Jakarta Composite Index (Commodities)
JCI
Crude Oil 0,291
Aluminum 0,231
Copper 0,229
Tin 0,186
Gold 0,097
Palm Oil 0,272
Rubber -0,035
Coffee 0,210
Rice 0,110
Plywood 0,110
Tea 0,047
JCI 1,000
Table 2.7Share Price Indices by Sector
Dec09
Jun10
Dec10 Sem II 10
Growth
Dec09-Dec10
JCI 2.534,36 2.913,68 3.703,51 27,11% 46,13%
Financial 301,42 377,18 466,67 23,72% 54,82%
Agriculture 1.753,09 1.660,50 2.284,32 37,57% 30,30%
Basic Industry 273,93 312,02 387,25 24,11% 41,37%
Consumtion 671,31 959,04 1.094,65 14,14% 63,06%
Property 146,80 163,38 203,10 24,31% 38,35%
Mining 2.203,48 2.238,86 3.274,16 46,24% 48,59%
Infrastructure 728,53 678,12 819,21 20,81% 12,45%
Trade 275,76 317,02 474,08 49,54% 71,92%
Miscellaneous Industries 601,47 809,20 967,02 19,50% 60,78%
Source: BloombergSource: Bloomberg
Source: Bloomberg

41
Chapter 2. Financial System Resilience
positive sentiment that precipitated a corresponding rally
on the JSX composite during the same period.
Mutual Funds
The amount of mutual funds declined in semester-II
2010 from 598 in June 2010 to 558 in December (Figure
2.52), however, performance improved as demonstrated
by a 21.61% jump in net asset value (NAV) compared
to just 8.52% in semester-I. Consequently, the net asset
value of mutual funds in 2010 increased by 31.97% with
a corresponding 16.88% rise in the number of investment
units. The NAV of mutual funds rose principally due to
discretionary funds and equity funds, which increased
respectively by 60.62% and 25.09% to Rp21.99 trillion
and Rp46.67 trillion. In addition, the net asset value of
Indonesia
Japan
Thailand
Malaysia
Singapore
Hongkong
%45
40
35
30
25
20
15
10
5
0
Dec-09Jan-10
Feb-10Mar-10
Apr-10May-10
Jun-10Jul-10
Aug-10Sep-10
Oct-10Nov-10
Dec-10
Figure 2.48Correlation between Commodities and Share Index
Figure 2.49Volatility of several Asian Bourse Indices
0.1
0.2
0.3
0.4
0.5
0.6
0.7
Crude Oil
2000 2001 2002 2003 2004 2005 2006 2007 2008 2009 2010
Palm Oil
Source: Bloomberg (processed data)
Source: Bloomberg (processed data)
Volatility on the domestic bourse in semester-II 2010
eased from 32.88 (June 2010) to 23.82 (December 2010)
principally because of price corrections, in particular as
yearend approached (Figure 2.49). Compared to several
Asian bourses, the highest volatility index affected shares in
the mining sector, which signaled the impact of speculative
behavior and short-term profit taking by investors.
Shares in the financial sector, particularly the
banking sector, rallied due to widespread investor interest
during 2010 (Figure 2.50 and 2.51). The following banks’
share prices posted gains during the second semester of
2010: BCA (up 31.96%), Mega (up 38.04%), Niaga (up
169.01%), Permata (up 123.75%), Panin (up 50.00%),
3000
2500
2000
1500
1000
500
Niaga (LHS)
Bukopin (LHS)
BRI (RHS)
Permata (LHS)
BCA (RHS)
Danamon (RHS)
Panin (LHS)
Mega (RHS)
BNI (RHS)
BII (LHS)
Mandiri (RHS)
NISP (LHS)
0
14000
12000
10000
8000
6000
4000
2000
0
08/07/
2010
18/07/
2010
28/07/
2010
07/08/
2010
17/08/
2010
27/08/
2010
06/09/
2010
16/09/
2010
26/09/
2010
06/10/
2010
16/10/
2010
26/10/
2010
05/11/
2010
15/11/
2010
25/11/
2010
05/12/
2010
15/12/
2010
25/12/
2010
Figure 2.51Changes in Bank Share Prices
Figure 2.50Bank Share Prices
Sem II’10
80.00%
70.00%
60.00%
50.00%
40.00%
30.00%
20.00%
10.00%
0.00%
-10.00%
-20.00%BCA Mega Niaga Permata Panin BII Mandiri Bukopin BRI BNI NISPDanamon
Sem I’10
Source: Bloomberg
Source: Bloomberg
BII (up 136.36%), Mandiri (up 38.30%), Bukopin (up
73.33%), BRI (up 37.25%), Danamon (up 25.27%), BNI
(up 95.71%) and NISP (up 70.00%).

42
Chapter 2. Financial System Resilience
Equity
Fixed Income
ETF-Equity
Capital Market
Protected
ETF-Fixed Income
Discretionary
Indexed
Islamic
50.00
40.00
30.00
20.00
10.00
0.00
Jun 10 Jul 10 Aug 10 Sep 10 Oct10 Nov 10 Dec 10
160.00
Jun 10
NAV, trl Rp No. of Matual FundsNo. of Stocks/Unit-Billion
Jul 10 Aug 10 Sep10 Oct10 Nov10 Dec10
140.00
120.00
100.00
80.00
60.00
40.00
20.00
0.00
610
600
590
580
570
560
550
540
530
fixed-income funds and protected funds grew specifically
by 48.95% and 21.34% to Rp27.27 trillion and Rp42.01
trillion (Figure 2.53). Accordingly, the largest NAV share
remained dominated by equity funds.
growth was reported (Figure 2.54). An additional 24
companies began issuing shares bringing the total to 521.
Meanwhile, corporate financing through the issuance
of corporate bonds also expanded, although not quite
of the same magnitude as share issuances. The value of
corporate bonds issued in semester-II 2010 surged 14.81%
to Rp187.38 billion (up just 7.84% in semester-I). The total
number of companies issuing corporate bonds grew in
2010 from 183 (December 2009) to 189 (Figure 2.55). Ten
firms issued corporate bonds during semester-II 2010 with
a value of Rp15.40 trillion. As a result, 26 companies issued
corporate bonds in 2010 to the tune of Rp36.60 trillion.
Some issuers, particularly finance companies, issued
through refinancing. A total of seven finance companies
issued bonds in 2010 with a value of Rp8.6 trillion.
2.3.2. Financing through the Capital Market and
Finance Companies
Issuers of Shares and Corporate Bonds
Corporate financing through the issuance of shares
continued to rise in semester-II 2010 with a 13.12%
increase in value amounting to Rp495.4 trillion. Therefore,
in 2010 as a whole the value of share issuances increased
by 18% compared to the previous year when just 6%
Figure 2.52Performance of Mutual Funds
Figure 2.53Net Asset Value by Type of Fund
(in trillions of rupiah)
Figure 2.54Capitalization Value and Value of Issuances
3,500.0
3,000.0
2,500.0
2,000.0
1,500.0
1000.0
(in
trl
Rp
)
500.0
000.0
4,000.0
3,500.0
3,000.0
2,500.0
2,000.0
1,500.0
1,000.0
500.0
0.0Dec09
Jan10
Feb10
Mar10
Apr10
May10
Jun10
Jul10
Aug10
Sep10
Oct10
Nov10
Dec10
N Cap (BEI) N Emission
CSPI (RHS)
Source: Capital Market Statistics, the Capital Market and Financial Institution Supervisory Agency
Source: Capital Market Statistics, the Capital Market and Financial Institution Supervisory Agency
Source: Capital Market Statistics, the Capital Market and Financial Institution Supervisory Agency
Source: Capital Market Statistics, the Capital Market and Financial Institution Supervisory Agency
Figure 2.55Issuances and Position of Corporate Bonds
Dec09
190
189
188
187
186
185
184
183
182
181
180
200
250
Rp T
150
100
50
0Jan10
Feb10
Mar10
Apr10
May10
Jun10
Jul10
Aug10
Sep10
Oct10
Nov10
Dec10
Emission (LHS) Emission (RHS)

43
Chapter 2. Financial System Resilience
Finance Companies
In addition to banks and the capital market, a source
of pressure that can disrupt financial system stability is from
non-bank financial institutions like finance companies.
Finance companies are one type of non-bank financial
institution that provides various forms of financing, for
example leasing, factoring, consumer finance and credit
cards. The down trending domestic interest rate since 2009
and its relatively stability in 2010 has expanded the role
of non-bank financing, among others, through finance
companies.
The business activity of finance companies increased
in semester-II 2010 (Figure 2.56). Total assets were
up 14.25% to Rp230.3 trillion, but growth was lower
than that posted in the previous semester totaling
14.50%. Increased funding and capital to the amount
of 23.03% and 7.02% respectively during the reporting
semester underpinned the expansion of business activity.
Concentration risk remained high at finance companies
because of the four types of financing offered, most activity
concentrated on consumer financing, for which the share
increased from 68.19% in June 2010 to 69.77% of total
financing in December (Figure 2.57). This hadthe potential
to aggravate credit risk because the primary funding source
of finance companies was bank loans.
Funding sources of finance companies continued to
rely on domestic bank loans during the reporting semester,
with a 51.97% share equivalent to Rp85.05 trillion. While
the share remained lower than domestic bank loans, funds
sourced from foreign bank loans and bond issuances were
increasingly in demand, growing by 24.36% and 15.15%
respectively (Figure 2.58). Seven finance companies issued
bonds during semester-II 2010 with a total value of
Rp8.6 trillion, namely BFI Finance Indonesia, Astra Sedaya
Finance, BCA Finance, Federal International Finance, Oto
Multiartha, Adira Dinamika Multifinance, and Summit Oto
Multifinance. The majority of funds from bonds (90%)
were allocated to consumer financing, particularly to
finance new and secondhand automobiles.
Figure 2.56Business Activity of Finance Companies
0.00
50.00
100.00
150.00
200.00
250.00
Asset Financing Funding Capital
December 2009 June 2010 December 201014,25%
14,19%
23,03%
7,02%
Source: Data from the Directorate of Economic and Monetary Statistics, Bank Indonesia
Figure 2.57Financing Growth by Finance Companies
Leasing Factoring Credit Card CostumerFinancing
TotalFinancing
Dec'09 46,528 2,027 930 93,054 142,539Jun'10 48,985 2,084 854 111,279 163,201Dec'10 53,167 2,295 876 130,016 186,354
0
20,000
40,000
60,000
80,000
100,000
120,000
140,000
160,000
180,000 up 14,19%
8,54%
10,15% 2,57%
16,84%
Source: Data from the Directorate of Economic and Monetary Statistics, Bank Indonesia
Figure 2.58Finance Companies’ Sources of Funds
0
20,000
40,000
60,000
80,000
100,000
120,000
140,000
160,000
180,000
DomesticBank Loans
ForeignBank Loans
SecuritiesIssued
Total Sourceof Found*
Dec'09
Jun'10
Dec'10
23,93%
24,36%
15,15%
23,03%
In Billion Rp
Source: Data from the Directorate of Economic and Monetary Statistics, Bank Indonesia

44
Chapter 2. Financial System Resilience
The performance of finance companies improved in
semester-II 2010 reflected by a 5.02% increase in ROA
compared to 2.91% in June 2010 and a 24.17 increase
in ROE compared to 13.53% in June 2010. Despite an
improvement in performance, finance companies were
yet to enhance their business efficiency as indicated by an
increase in the BOPO efficiency ratio from 71.44% in June
2010 to 73.94% in December 2010 (Table 2.9).
Encouragingly, the credit risk of finance companies
eased, as demonstrated by declines in nominal NPL and
the NPL ratio from Rp2.9 trillion or 1.72% in June 2010
to Rp2.6 trillion or 1.37% in December 2010 respectively
(Table 2.10). This decline was primarily spurred by a
reduction in the nominal NPL and NPL ratio of leasing and
factoring. Stronger economic growth was one driver of
debtor repayment capacity, thereby reducing the nominal
non-performing loans of finance companies. Conversely,
rapid consumer financing growth was followed by a
corresponding increase in nominal NPL despite a drop in
the NPL ratio from 1.76% (June 2010) to 1.63% (December
2010). This was caused by consumer financing growth
outpacing the increase in nominal NPL. The aggregate
growth in automotive sales reached 60% compared to
2009, which also catalyzed consumer-financing activity
by finance companies.
The number of finance companies affiliated with
banks declined from 25 in June 2010 to 23 in December
2010. The remaining finance companies continued to focus
their activities on consumer financing. Of the 23 finance
companies, seven experienced an increase in their NPL ratio
and six experienced a decline (Table 2.11).
December
2009
June
2010
December
2010
December
2009
June
2010
December
2010
Asset 174,442 201,570 230,301
Debt 115,555 133,057 163,701
Obligation 134,354 158,180 182,470
Equity 40,088 43,390 47,831
Profit Before Tax 10,421 5,869 11,563
Profit After Tax 7,827 4,637 8,929
ROA (%) 5,97 2,91 5,02
ROE (%) 25,99 13,53 24,17
BOPO (%) 73,81 71,44 73,94
Debt/Equity 2,88 3,07 3,42
Obligations/Equity 3,35 3,65 3,81
Table 2.9Financial Ratios of Finance Companies
Table 2.10NPL of Finance Companies
Leasing 730,03 714,49 350,91
Factoring 126,34 123,01 73,16
Credit Cards 40,84 47,01 44,05
Consumer Financing 1.932,14 2.016,96 2.189,40
Total Financing 2,829,34 2.901,47 2.657,51
% NPL Dec 2009 June 2010 Dec 2010
Leasing 1,50% 1,39% 0,63%
Factoring 5,93% 5,60% 3,07%
Credit Cards 3,93% 5,00% 4,62%
Consumer Financing 2,01% 1,76% 1,63%
Total Financing 1,91% 1,72% 1,37%
Source: Data from the Directorate of Economic and Monetary Statistics, Bank Indonesia
Source: Data from the Directorate of Economic and Monetary Statistics, Bank Indonesia
Billion Rp
Billion Rp

45
Chapter 2. Financial System Resilience
Table 2.11NPL Performance of Finance Companies
NPL
Jun 10 Dec 10 Sem II 10 Leasing FinanceCompanies
Growth ofFinanceActivity
Factoring Crit Carded
Change of NPL Nominal (in Thousand Rp)
1 16,22% 4,14% (342,318) - - - -5,79%2 0,40% 0,31% - - - 6,019 78,76%3 0,00% 0,00% - - - - - 75,12%4 0,00% 0,00% - - - - - 88,05%5 0,25% 2,45% 210 2,191 - 827 -5,09%6 0,83% 0,85% 7,792 - - (557) 39,20%7 6,08% 0,57% - - - (2,534) 22,21%8 0,08% 0,00% - - - (516) 25,23%9 0,03% 0,06% - - - 712 27,16%
10 1,32% 1,42% - - - 13,546 31,63%11 0,00% 0,00% - - - - - -22,51%12 0,00% 0,00% - - - - - 15,78%13 0,00% 0,00% - - - - - 54,89%14 0,00% 0,00% - - - - - 12,65%15 0,51% 0,50% (50) - - - 1,19%16 0,24% 0,48% - - - 1,919 63,38%17 0,00% 0,00% - - - - - 7,86%18 0,07% 0,06% 88 - - 6 55,67%19 0,03% 0,10% - - - 2,488 14,4%20 0,00% 0,00% - - - - - 7,52%21 0,00% 0,00% - - - - - -21,88%22 22,27% 23,68% (54) - - 307 -6,55%23 0,00% 0,00% - - - - - 19,35%
Source: Data from the Directorate of Economic and Monetary Statistics, Bank Indonesia

46
Chapter 2. Financial System Resilience
Box 2.1 Bank Liquidity Resilience
Referring to liquidity indicators compiled by The
Basel Committee on Banking Supervision (BCBS), in
general banks in Indonesia have an adequate level of
liquidity resilience in both the long and short term. The
Liquidity Coverage Ratio (LCR) and Net Stable Funding
Ratio (NSFR) demonstrate this, which are both above 1
for the majority of bank groups with the exception of
NSFR for foreign banks. This illustrates that the majority
of banks are able to meet the expected requirements
should LCR and NSFR be applied to banks in Indonesia.
Nevertheless, bearing in mind the amount of detailed
data required to calculate LCR and NSFR, adequate
preparations are required in terms of risk management
and information technology.
Background
The global financial crisis in 2007/08 placed
liquidity risk under a whole new perspective, indeed
playing a pivotal role in financial system stability. In
order to enhance liquidity risk management and control
liquidity risk exposure, the Basel Committee on Banking
Supervision (BCBS) released Basel III: International
Framework for Liquidity Risk Measurement, Standards
and Monitoring in December 2010, which proposes the
use of two ratios to monitor liquidity conditions.
The ratios proposed are the Liquidity Coverage
Ratio (LCR) and the Net Stable Funding Ratio (NSFR).
LCR indicates short-term liquidity resilience by
addressing the sufficiency of high-quality liquid assets
to cover net cash outflows for a 30-day period under a
stress scenario. This metric aims to encourage banks to
enhance short-term liquidity resilience by ensuring an
adequate level of unencumbered, high-quality assets.
Meanwhile, NSFR is the ratio of long-term funding
sources (< 1 year), known as stable funding, owned by
the bank compared to sources of stable funding that
must be maintained to support investment in liquid
assets, credit and off balance sheet exposure. NSFR
seeks to enhance long-term bank funding resilience
by encouraging banks to broaden their sources of
long-term funding.
Long-Term Liquidity Resilience (LCR)
In general, short-term bank liquidity resilience
in Indonesia is sufficient, with an average liquidity
coverage ratio in excess of 1.
Source: Monthly Bank Reports, Bank Indonesia (processed data)
Figure Box 2.1.1LCR by Bank Group
3,00
2,50
2,00
1,50
1,00
0,50
Jan-10
State owned National Private Regional Development Joint Venture Foreign
Feb-10 Mar-10 Apr-10 May-10 Jun-10 Jul-10 Aug-10 Sep-10 Oct-10 Nov-10 Dec-10
-

47
Chapter 2. Financial System Resilience
The liquidity coverage ratio of banks during
2010 was, on average above 1, within the range of
1.26 to 1.97. This illustrates that banks in Indonesia
have sufficient liquid assets to cover any possible fund
withdrawals for the upcoming 30 days under stress
conditions. More specifically, the relatively large amount
of high-quality liquid assets maintained by private banks
ensured that this group of banks had the highest LCR,
namely 2.12. Conversely, foreign banks proved to have
the lowest LCR at 1.26.
Average LCR for regional development banks
exceeded that for state-owned banks with 1.81 and
1.65 respectively. In contrast, average LDR for regional
development banks was lower than that for state-
owned banks totalling 74.24 and 83.43 respectively.
Such conditions indicate that compared to state-owned
banks, regional development banks tend to invest more
funds in low-risk liquid assets.
Long-Term Liquidity Resilience (NSFR)
The long-term liquidity resilience of banks is
indicated by an average net stable funding ratio of
above 1. With the highest net stable funding ratio of
any bank group coupled with a ratio of liquid assets
to credit totalling 61.53%, private banks have the best
potential to enhance their intermediation function.
The average net stable funding ratio surpassed 1
for all bank groups except foreign banks, which implies
that, in general, long-term bank funding sources can
cover bank investments in liquid and non-liquid assets.
Private banks had the highest average net stable
funding ratio, namely 2.04, with an average ratio of
liquid assets (placements at Bank Indonesia and SUN)
to credit totalling 61.53%. This denotes the proclivity
of private banks towards long-term investment in low-
risk assets. Meanwhile, foreign banks had the lowest
Table Box 2.1.1LCR by Bank Group
LCR Jan-10 Feb-10 Mar-10 Apr-10 May-10 Jun-10 Jul-10 Aug-10 Sep-10 Oct-10 Nov-10 Dec-10
State Owned Banks 1,96 1,78 1,65 1,60 1,51 1,62 1,48 1,44 1,53 1,64 1,63 1,97
Commercial Banks 2,77 2,53 2,39 2,25 1,96 1,89 1,91 1,82 1,92 1,99 2,04 1,95
Regional Development 1,80 1,79 2,93 1,83 1,77 1,99 2,00 1,83 1,92 1,89 1,75 1,24
Joint Venture Banks 1,31 1,26 1,35 1,07 1,22 1,11 1,34 1,37 1,14 1,45 1,44 1,26
Foreign Owned Banks 1,31 1,16 1,31 1,09 1,34 1,28 1,32 1,23 1,16 1,21 1,44 1,26
Table Box 2.1.2NSFR by Bank Group
NSFR Jan-10 Feb-10 Mar-10 Apr-10 May-10 Jun-10 Jul-10 Aug-10 Sep-10 Oct-10 Nov-10 Dec-10
State Owned Banks 1,60 1,52 1,31 1,50 1,46 1,49 1,50 1,49 1,50 1,52 1,48 1,60
Commercial Banks 2,62 2,16 1,40 1,99 1,95 2,19 1,96 1,97 2,03 2,06 2,05 2,11
Regional Development 1,76 1,81 1,61 1,87 1,80 1,88 1,88 1,79 1,85 1,81 1,76 1,62
Joint Venture Banks 1,43 1,44 0,91 1,41 1,35 1,44 1,67 1,71 1,76 1,62 1,42 1,72
Foreign Owned Banks 1,15 1,08 0,66 1,05 0,98 0,88 0,87 0,92 0,79 0,84 0,77 0,74
Source: Monthly Bank Reports, Bank Indonesia (processed data)
Source: Monthly Bank Reports, Bank Indonesia (processed data)
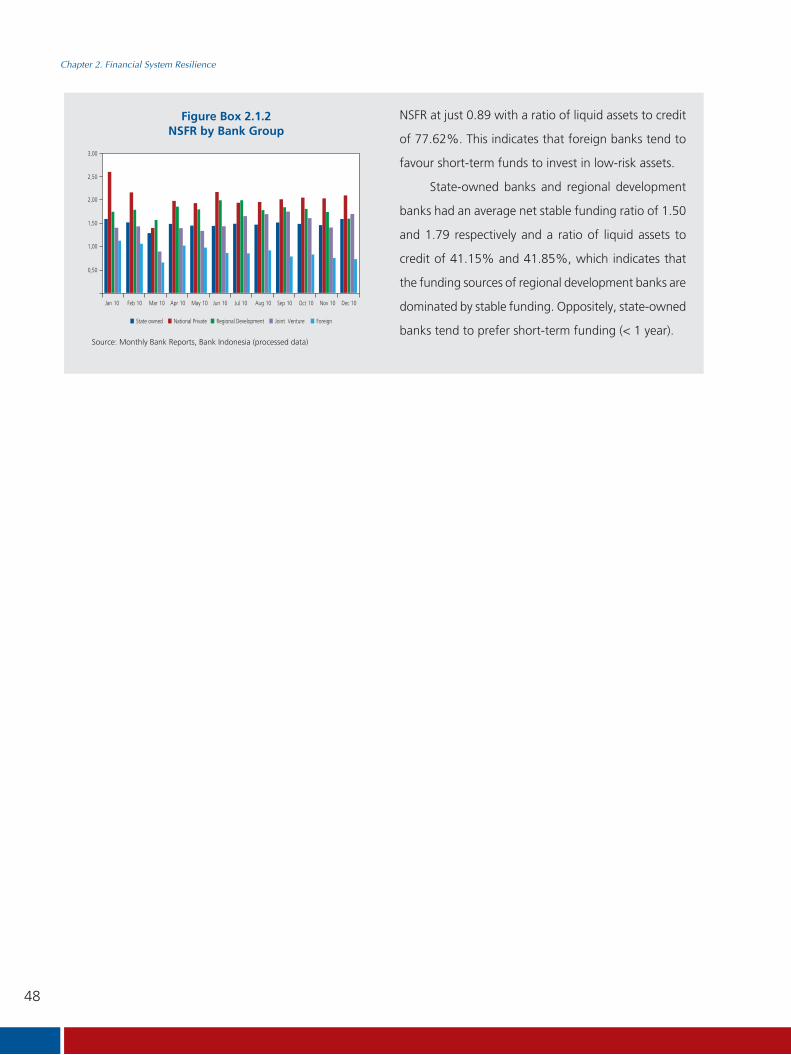
48
Chapter 2. Financial System Resilience
Figure Box 2.1.2NSFR by Bank Group
NSFR at just 0.89 with a ratio of liquid assets to credit
of 77.62%. This indicates that foreign banks tend to
favour short-term funds to invest in low-risk assets.
State-owned banks and regional development
banks had an average net stable funding ratio of 1.50
and 1.79 respectively and a ratio of liquid assets to
credit of 41.15% and 41.85%, which indicates that
the funding sources of regional development banks are
dominated by stable funding. Oppositely, state-owned
banks tend to prefer short-term funding (< 1 year).Source: Monthly Bank Reports, Bank Indonesia (processed data)
49
Chapter 2. Financial System Resilience
Box 2.2 Undisbursed Loans
Solid credit performance was achieved in 2010,
accompanied by an increase in undisbursed loans (UL).
During the second semester of 2010 undisbursed loans
increased by 15.5%, hence the share of UL in total
bank credit was 31.8%.
Undisbursed loans are a credit facility agreed
by the bank and offered to a debtor, however, the
debtor does not immediately use the facility offered
due to gradual withdrawal of because of other
reasons. Increases in undisbursed loans cannot be
avoided because they correlate closely with credit
commitments, particularly credit that can be withdrawn
in stages.
Limited bank understanding of a debtor’s
business activity due to asymmetric information
prevents banks from calculating the real requirements
of a debtor. Consequently, the credit facility agreed is
often excessive compared to the actual requirement.
From the debtor’s standpoint, a request for credit
that exceeds the actual requirement is intended as a
reserve. The opportunity to expand undisbursed loans
increases if the atmosphere of uncertainty thickens
and, consequently, the debtor envisages future
business disruptions, hence, demanding greater credit
commitment but without any actual increase in real
funding needs.
A change to the way undisbursed loans
are reported by banks occurred in January 2010.
Accordingly, banks now have to report both
committed and uncommitted undisbursed loans,
the aim of which is to ensure that banks are more
transparent when reporting their undisbursed
loans and, hence, can better analyse their risks. For
committed undisbursed loans, banks must specify
their quality, which entails additional provisions for
earning asset losses in accordance with the quality
specified. However, this policy does not apply to
uncommitted undisbursed loans. As a result of
the change in reporting, total undisbursed bank
loans skyrocketed in comparison to yearend 2009.
In December 2010, total undisbursed bank loans
reached Rp561.2 trillion or 31.8% of total bank
credit. However, of this total only Rp196 trillion was
committed, equivalent to 11.1% of total credit.
Undisbursed loans increased by 15.5% during
the reporting semester. Despite a lower total than
uncommitted UL, committed undisbursed loans grew
more rapidly at 40.9%, compared to just 5.3% for
uncommitted UL, to Rp365.2 trillion. Nevertheless,
uncommitted UL continued to dominate total
undisbursed bank loans with a 65.1% share. The
meteoric rise of undisbursed loans was also in line
with relatively robust credit growth in 2010, reaching
22.8%.
There are also causal relationships between
excess bank liquidity and undisbursed loans. This is
a part of rational business because banks have to
anticipate the withdrawal of committed credit. In
general, banks provide adequate liquidity through Bank
Indonesia Certificates and government bonds (SUN) to
anticipate any withdrawals of committed credit. The
magnitude of this liquidity encourages banks to seek
short-term, low-risk profits, hence the propensity for
short-term investments.
On the other hand, the funds thus available
cannot actually be absorbed by the real sector. Figure

50
Chapter 2. Financial System Resilience
2.2.1 shows the trend of total liquid funds9, which
mirror undisbursed bank loans.
private banks, each with a large share of committed
undisbursed loans, are obliged to provide sufficient
liquid funds to cover the possibility of loan withdrawals
by the debtors. This obligation is much less severe for
state-owned banks and joint-venture banks.
Working capital credit dominated undisbursed
bank loans with a 70% share of the total. Furthermore,
uncommitted UL dominated all types of bank loan
(Figure 2.2.3). However, the share of uncommitted
UL for consumption credit exceeded that of all other
types. This is due, among others, to the magnitude
of undisbursed loans for credit cards. Conversely,
uncommitted UL were lowest for investment credit.
Based on economic sector, most undisbursed loans
were for the manufacturing sector, others sector and
trade sector with respective shares of 27.2%, 21% and
20.5%. This is congruous with the credit allocated to
these three sectors, which also dominated. Meanwhile,
all sectors had uncommitted UL in excess of 50%,
while the largest share of committed undisbursed loans
belonged to the trade sector and international business
services (Figure 2.2.4).
1 Liquid funds include Bank Indonesia Certificates, other Bank Indonesia placements, SUN and AFS SUN.
100
150
200
250
300
350
400
450
500
550
600
Jan Feb Mar Apr May Jun Jul Aug Sep Oct Nov Dec
UL Liquid Funds
Committed Uncommitted
11.9%
49.7%66.9%
10.8%
51.0%34.9%
88.1%
50.3%33.1%
89.2%
49.0%65.1%
0%
20%
40%
60%
80%
100%
StateOwned
NationalPrivate
RegionalDevelopment
JointVenture
Foreign Total
committed uncommitted
Based on bank group, uncommitted UL dominated
the undisbursed loans of state-owned banks and
joint-venture banks (Figure 2.2.2). Meanwhile, the
undisbursed loans of regional development banks and
foreign banks were more dominated by committed UL.
Finally, the share of undisbursed loans for private banks
was relatively balanced. Considering that committed UL
cannot be cancelled by the banks and that banks are
committed to liquidating the facility to its customers,
then regional development banks, foreign banks and
34.9%43.8%
30.3%
65.1%56.2%
69.7%
0 %
20%
40%
60%
80%
100%
MSM IC CC
Committed Uncommitted
Source: Monthly Bank Reports, Bank Indonesia
Source: Monthly Bank Reports, Bank Indonesia
Source: Monthly Bank Reports, Bank Indonesia
Figure Box 2.2.1Undisbursed Loans and Liquid Funds
Figure Box 2.2.2Share of Undisbursed Loans by Bank Group
Figure Box 2.2.3Share of Undisbursed Loans by Type

51
Chapter 2. Financial System Resilience
Looking ahead, undisbursed loans are predicted
to continue increasing in relation to higher inflation
triggered by higher interest rates, weaker public
purchasing power and higher operational costs.
Businesses will become more selective in their use of
credit facilities.0%
25%
50%
75%
100%
Agr
icul
ture
Min
ing
Indu
stry
Elec
tric
ity
Con
stru
ctio
n
Trad
e
Tran
spor
tatio
n
Busin
ess
Serv
ice
Soci
alSe
rvic
e
Oth
ers
Committed Uncommitted
Source: Monthly Bank Reports, Bank Indonesia
Figure Box 2.2.4Share of Undisbursed Loans by Economic Sector
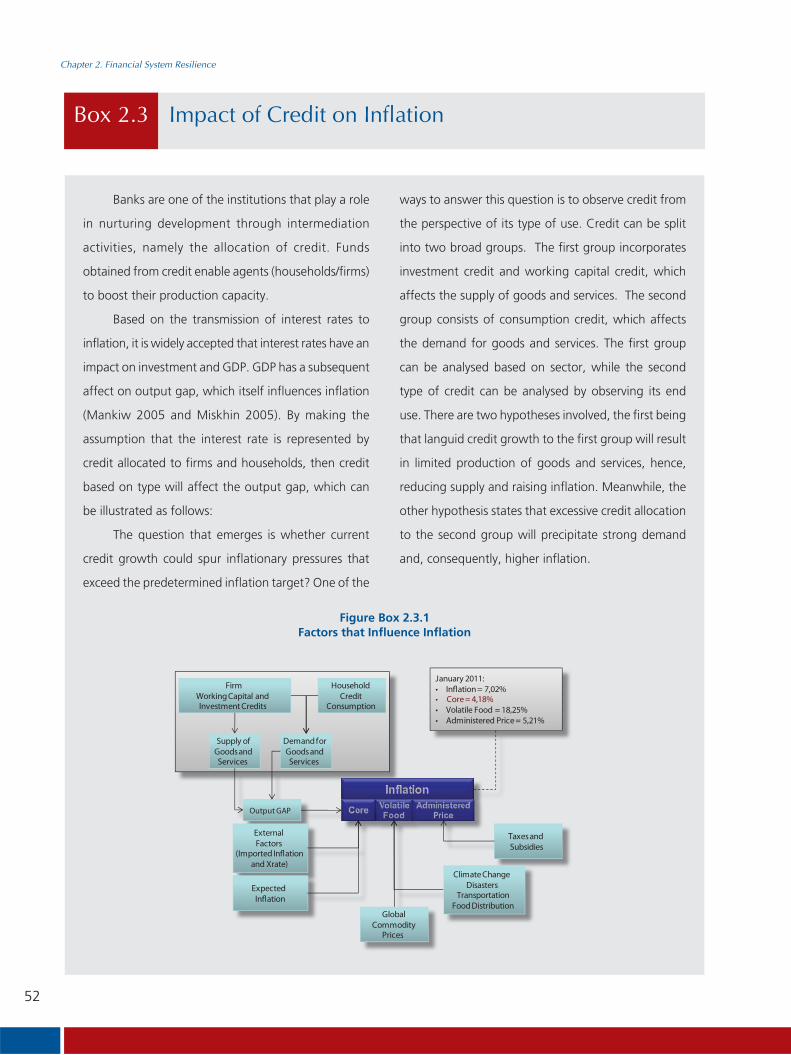
52
Chapter 2. Financial System Resilience
Box 2.3 Impact of Credit on Inflation
Banks are one of the institutions that play a role
in nurturing development through intermediation
activities, namely the allocation of credit. Funds
obtained from credit enable agents (households/firms)
to boost their production capacity.
Based on the transmission of interest rates to
inflation, it is widely accepted that interest rates have an
impact on investment and GDP. GDP has a subsequent
affect on output gap, which itself influences inflation
(Mankiw 2005 and Miskhin 2005). By making the
assumption that the interest rate is represented by
credit allocated to firms and households, then credit
based on type will affect the output gap, which can
be illustrated as follows:
The question that emerges is whether current
credit growth could spur inflationary pressures that
exceed the predetermined inflation target? One of the
ways to answer this question is to observe credit from
the perspective of its type of use. Credit can be split
into two broad groups. The first group incorporates
investment credit and working capital credit, which
affects the supply of goods and services. The second
group consists of consumption credit, which affects
the demand for goods and services. The first group
can be analysed based on sector, while the second
type of credit can be analysed by observing its end
use. There are two hypotheses involved, the first being
that languid credit growth to the first group will result
in limited production of goods and services, hence,
reducing supply and raising inflation. Meanwhile, the
other hypothesis states that excessive credit allocation
to the second group will precipitate strong demand
and, consequently, higher inflation.
Figure Box 2.3.1Factors that Influence Inflation
Core=4,18%

53
Chapter 2. Financial System Resilience
Accordingly, we can analyse whether credit
growth to the first group is insufficient and whether
credit growth to the second group is too high, thus
driving inflation beyond its predetermined target
corridor. Two approaches can be used to answer
these questions, namely by observing long-term
correlations as well as optimal output growth. The
second approach is the non-accelerating inflation rate
of credit growth.
Research shows that investment credit growth
remains below the optimal rate, while working capital
credit is slightly above its optimal rate but still within
the bounds of optimal. It can, therefore, be concluded
that credit growth to the first group remains within
safe limits. Notwithstanding, research has also shown
that consumption credit growth is above the optimal
desirable range.
Consequently, rapid consumption credit growth
requires closer attention and has the potential to
exacerbate inflation. From the respective composition
of each type of credit against total bank credit,
aggregate credit growth remains within safe limits.
This implies that current credit growth is conducive
to inflation remaining within its predetermined target
corridor.

54
Chapter 2. Financial System Resilience
Box 2.4 Prime Lending Rate Policy Transparency
Publications regarding the prime lending rate
have been written by numerous authors. In these
publications, another term for the base lending rate
is the prime rate. Suanders (2003) explained that the
prime rate is the interest rate offered to the lowest
risk customers, while according to Glodberg (1981)
the prime rate is a key indicator used to observe
credit market conditions. Meanwhile, Naber, Park
and Suanders (1993) postulated that the prime rate
can no longer be seen as the lending rate offered to
creditworthy customers but it has developed to become
a key indicator in the calculation structure of lending
rates offered by a particular bank. Based on these
publications, several countries already apply a prime
rate policy, including Malaysia and India.
Referring to existing publications and the
application of prime rate policy in a number of
countries, as well as based on the results of reviews
and discussions with third parties, Bank Indonesia
promulgated a new regulation regarding the transparent
publication of the prime lending rate, effective from
31st March 2011. The regulation is only applicable to
conventional commercial banks. The regulation refers
to Bank Indonesia Regulation (PBI) No. 7/6/PBI/2005
concerning Transparent Banking Product Information
and Personal Customer Data, as well as PBI No. 3/22//
PBI/2001 on Transparent Bank Financial Conditions,
amended by PBI No. 7/50/PBI/2005.
The objective of the new regulation is to: i)
enhance transparency regarding the characteristics
of banking products, including the benefits, costs
and risks in order to provide an explanation to the
customer; and ii) bolster good governance and promote
healthy competition in the banking industry through
the creation of better market discipline.
Basically, the prime lending rate is the lowest
interest rate used by banks to determine the lending
rates offered to the customer. The prime rate is
calculated for the rupiah and three types of loan,
namely corporate credit, retail credit and consumption
credit (mortgages and non-mortgages). Funding from
credit cards and uncollateralised loans is not included
in non-mortgage consumption credit. Classification
of credit type is based on criteria set internally by the
banks.
The prime lending rate is the result of calculating
three components, namely the cost of funds, overhead
costs and profit margin. A risk-premium is then
added for each individual customer depending on
the bank’s evaluation of debtor risk. Consequently,
the lending rate offered to the customer is rarely
the same as the prime rate. In addition, the prime
lending rate is calculated per annum and expressed
as a percentage.
At the preliminary stage, banks that have total
assets in excess of Rp10 trillion on and/or after 28th
February 2011, based on the monthly bank report,
are required to publish their prime lending rate.
Such banks are obligated to publish their prime rates
simultaneously through: i) notice boards in each bank
branch; ii) the main page of the bank’s website, if
the bank maintains a website; and iii) newspapers in
conjunction with the Quarterly Financial Statements
for March, June, September and December. In the
55
Chapter 2. Financial System Resilience
event that a bank does not maintain a website, the
prime lending rate need only be published at each
bank branch and in the newspaper along with the
quarterly financial statement. In the case of a bank’s
total assets dropping to below Rp10 trillion, it is still
mandatory for the bank in question to publish its prime
lending rate.
Regarding the reports that must be submitted
to Bank Indonesia, all conventional commercial banks
are obliged to compile a prime rate calculation report
pursuant to prevailing regulations. This report must be
submitted to Bank Indonesia on a quarterly basis along
with the quarterly financial statement.
The imposition of sanctions pertaining to the
publication of prime lending rates refer to PBI No.
7/6/PBI/2005concerning Transparent Banking Product
Information and Personal Customer Data, amended
by PBI No. 7/50/PBI/2005, namely administrative
sanctions consisting of written warnings and financial
penalties.
The regulation for the publication of prime
lending rates is expected in the long term to create
healthy competition among banks and, hence, bring
down lending rates. Ultimately, lower lending rates
will boost public/corporate demand for credit and
catalyse the real sector, thus propping up the national
economy.

56
Chapter 2. Financial System Resilience
Box 2.5 Sources of Bank Profitability
Up until December 2010, banks continued to rely
on interest income as their main source of income with
a 71.70% share of operational income in December
2010 (Figure 2.4.1). Nevertheless, the share of interest
income has followed a declining trend since December
2006. The main components of interest income are
credit totalling Rp204.0 trillion and placements in
securities (SSB) amounting to Rp22.53 trillion with
respective shares of 81.10% and 8.88% in December
2010. When compared to operational income, the
share of credit expands to 58.36% and the share of
SSB declines to 6.65%. from SSB was lower in the second semester of 2010
compared to the first at 47.60% of total SSB income.
Therefore, the banks sought alternative sources of
income in order to compensate for the decline in SSB
income, namely fee based income. The share of fee
based income to total operational income increased,
albeit relatively slowly, from 3.77% in December 2000,
equivalent to Rp4.91 trillion, to 9.09% in December
2010 or Rp31.91% (Figure 2.4.2). For 2010, fee based
income in semester-II 20010 exceeded that received
in semester-I, more specifically reaching 54.84%
(Rp17.50 trillion). This is a noteworthy achievement
considering that it reflects banks diversifying their
sources of income. If such conditions persist, interest
from bank credit is expected to decline further as banks
move away from their reliance on income from the
allocation of credit.
By bank group, in December 2010 fee based
income to operational income for foreign banks was
the highest at 12.91% (Rp4.80 trillion) but lower than
the position in December 2009 at 13.56% (Rp4.27
Figure Box 2.5.1Share of main sources of Income to
Operational Income (%)
0
10
20
30
40
50
60
70
80
90
Dec 00 Dec-01 Dec-02 Dec-03 Dec-04 Dec-05 Dec-06 Dec-07 Dec-08 Dec-09 Dec-10
Interest Income ( ) Credit ( ) SSB ( ) Fee Based (right)
Figure Box 2.5.2Share of Fee Based Income to
Operational Income (%)
0123456789
1011121314
Dec 00 Dec-01 Dec-02 Dec-03 Dec-04 Dec-05 Dec-06 Dec-07 Dec-08 Dec-09 Dec-10StateOwned Private
Source: Monthly Bank Reports, Bank Indonesia
Source: Monthly Bank Reports, Bank Indonesia
Income from the extension of credit has trended
upwards since December 2000, which reflects the
reliance of banks on credit as a main source of interest
income. In 2010, more than half of the total Rp204.0
trillion of credit interest received was during the second
semester (51.71%). Meanwhile, the share of income
from SSB to operational income declined from 33.93%
(December 2001) to 6.65% (December 2010). Income
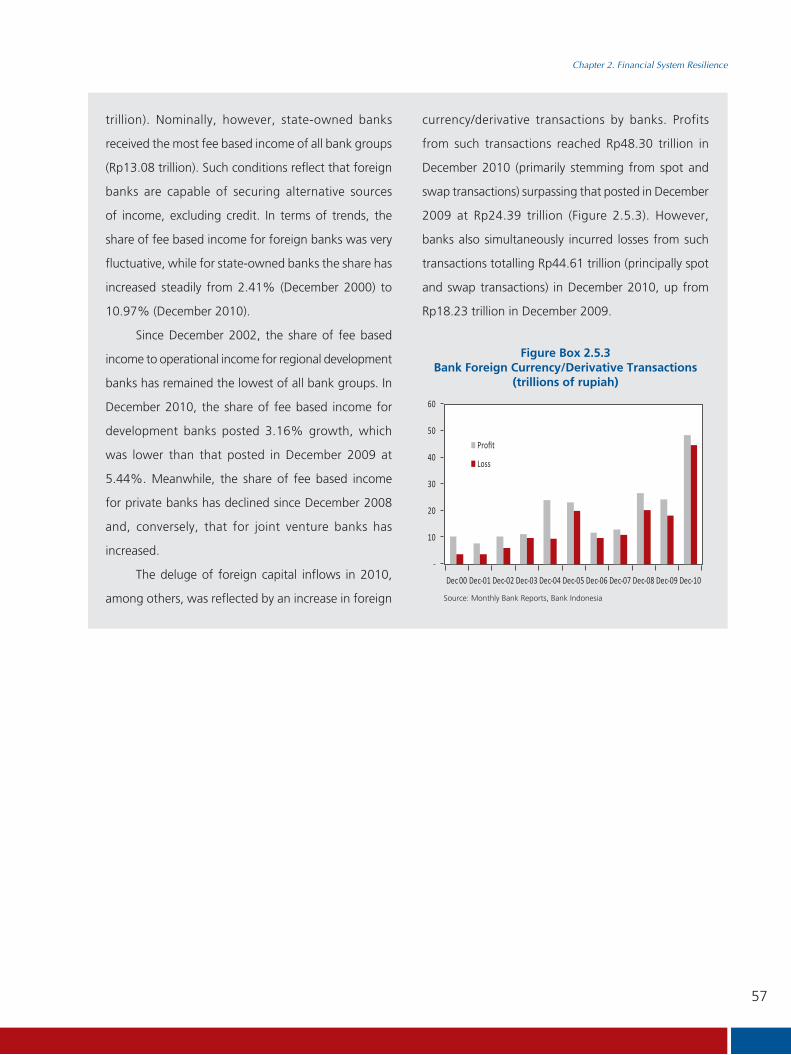
57
Chapter 2. Financial System Resilience
trillion). Nominally, however, state-owned banks
received the most fee based income of all bank groups
(Rp13.08 trillion). Such conditions reflect that foreign
banks are capable of securing alternative sources
of income, excluding credit. In terms of trends, the
share of fee based income for foreign banks was very
fluctuative, while for state-owned banks the share has
increased steadily from 2.41% (December 2000) to
10.97% (December 2010).
Since December 2002, the share of fee based
income to operational income for regional development
banks has remained the lowest of all bank groups. In
December 2010, the share of fee based income for
development banks posted 3.16% growth, which
was lower than that posted in December 2009 at
5.44%. Meanwhile, the share of fee based income
for private banks has declined since December 2008
and, conversely, that for joint venture banks has
increased.
The deluge of foreign capital inflows in 2010,
among others, was reflected by an increase in foreign
currency/derivative transactions by banks. Profits
from such transactions reached Rp48.30 trillion in
December 2010 (primarily stemming from spot and
swap transactions) surpassing that posted in December
2009 at Rp24.39 trillion (Figure 2.5.3). However,
banks also simultaneously incurred losses from such
transactions totalling Rp44.61 trillion (principally spot
and swap transactions) in December 2010, up from
Rp18.23 trillion in December 2009.
-
10
20
30
40
50
60
Dec 00 Dec-01 Dec-02 Dec-03 Dec-04 Dec-05 Dec-06 Dec-07 Dec-08 Dec-09 Dec-10
Loss
Source: Monthly Bank Reports, Bank Indonesia
Figure Box 2.5.3Bank Foreign Currency/Derivative Transactions
(trillions of rupiah)

This page intentionally blank
59
Chapter 3. Strengthening Financial Infrastructure
Chapter 3Strengthening FinancialInfrastructure

60
Chapter 3. Strengthening Financial Infrastructure
This page intentionally blank

61
Chapter 3. Strengthening Financial Infrastructure
Chapter 3 Strengthening Financial Infrastructure
The payment system was free from disruptions and remained secure during the
reporting period. A number of measures were taken by Bank Indonesia during
semester-II as part of the strategy to bolster monetary management as well as
preserve financial system stability, and also in response to the deluge of foreign
capital inflows amid a shallow domestic money market and limited economic
absorption capacity. Against this backdrop, financial sector liberalisation in
the ASEAN region and global financial reforms became the principal agenda
of international fora, which were expected to provide huge benefits to the
national economy. In this context, closer coordination among the financial
authorities, including Bank Indonesia, the Ministry of Finance and the Deposit
Insurance Corporation is required to reinforce financial system stability.
3.1. PAYMENT SYSTEM EFFICIENCY
3.1.1. Payment System Performance
Nominally, BI-RTGS (Real-Time Gross Settlement)
transactions dominated non-cash payment system
transactions with a 93.1% share. In terms of transaction
volume (frequency),card-based payment instruments
consisting of credit cards, ATM cards and ATM/credit cards
provided the largest contribution with a 95% share of all
transaction volume in the non-cash payment system.
Figure 3.1Nominal Transactions (billions of rupiah)
86
88
90
92
94
96
98
100
Jan
09Fe
b 09
Mar
09
Apr
09
May
09
Jun
09Ju
l 09
Aug
09
Sept
09
Oct
09
Nov
09
Dec
09
Jan
10Fe
b 10
Mar
10
Apr
10
May
10
Jun
10Ju
l 10
Aug
10
Sept
10
Oct
10
Nov
10
Dec
10
%
RTGS NCS CBP
- RTGS : Real-Time Gross Settlement - NCS : National Clearing System - CBP : Card Based Payment
Source: Enterprise Data Warehouse, Bank Indonesia
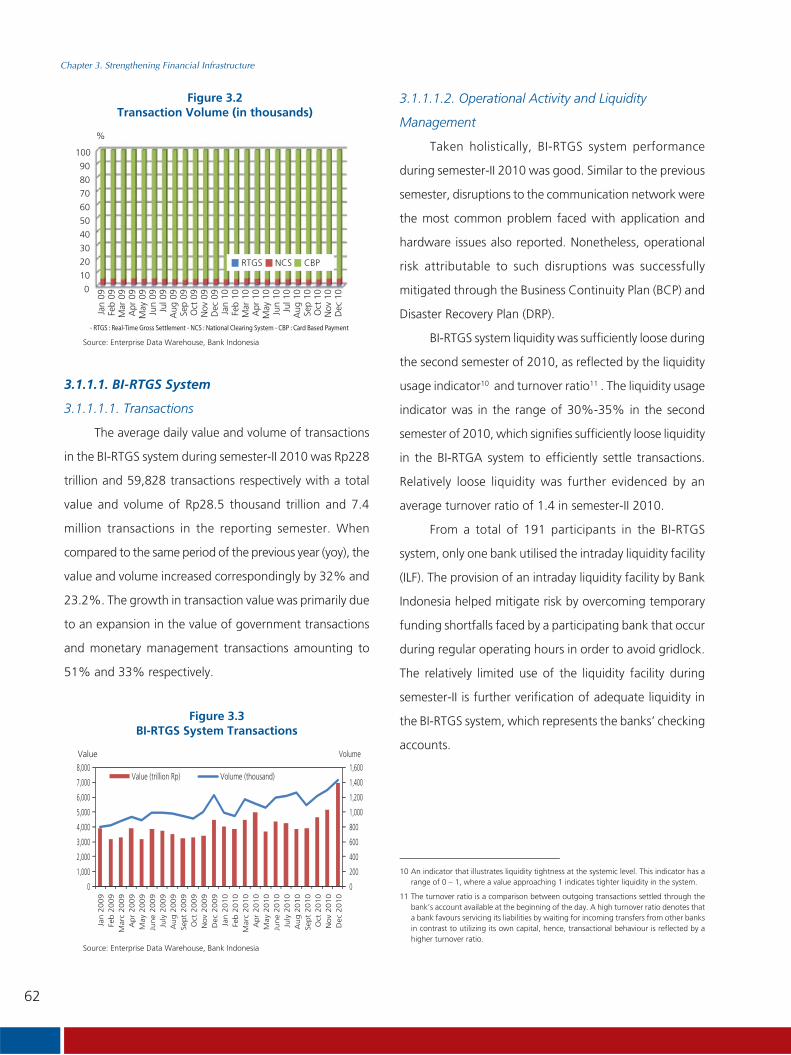
62
Chapter 3. Strengthening Financial Infrastructure
3.1.1.1. BI-RTGS System
3.1.1.1.1. Transactions
The average daily value and volume of transactions
in the BI-RTGS system during semester-II 2010 was Rp228
trillion and 59,828 transactions respectively with a total
value and volume of Rp28.5 thousand trillion and 7.4
million transactions in the reporting semester. When
compared to the same period of the previous year (yoy), the
value and volume increased correspondingly by 32% and
23.2%. The growth in transaction value was primarily due
to an expansion in the value of government transactions
and monetary management transactions amounting to
51% and 33% respectively.
10 An indicator that illustrates liquidity tightness at the systemic level. This indicator has a range of 0 – 1, where a value approaching 1 indicates tighter liquidity in the system.
11 The turnover ratio is a comparison between outgoing transactions settled through the bank’s account available at the beginning of the day. A high turnover ratio denotes that a bank favours servicing its liabilities by waiting for incoming transfers from other banks in contrast to utilizing its own capital, hence, transactional behaviour is reflected by a higher turnover ratio.
Figure 3.2Transaction Volume (in thousands)
0
10
20
30
40
50
60
70
80
90
100
Jan
09Fe
b 09
Mar
09
Apr
09
May
09
Jun
09Ju
l 09
Aug
09
Sep
09O
ct 0
9N
ov 0
9D
ec 0
9Ja
n 10
Feb
10M
ar 1
0A
pr 1
0M
ay 1
0Ju
n 10
Jul 1
0A
ug 1
0Se
p 10
Oct
10
Nov
10
Dec
10
RTGS NCS CBP
%
- RTGS : Real-Time Gross Settlement - NCS : National Clearing System - CBP : Card Based Payment
Figure 3.3BI-RTGS System Transactions
3.1.1.1.2. Operational Activity and Liquidity
Management
Taken holistically, BI-RTGS system performance
during semester-II 2010 was good. Similar to the previous
semester, disruptions to the communication network were
the most common problem faced with application and
hardware issues also reported. Nonetheless, operational
risk attributable to such disruptions was successfully
mitigated through the Business Continuity Plan (BCP) and
Disaster Recovery Plan (DRP).
BI-RTGS system liquidity was sufficiently loose during
the second semester of 2010, as reflected by the liquidity
usage indicator10 and turnover ratio11 . The liquidity usage
indicator was in the range of 30%-35% in the second
semester of 2010, which signifies sufficiently loose liquidity
in the BI-RTGA system to efficiently settle transactions.
Relatively loose liquidity was further evidenced by an
average turnover ratio of 1.4 in semester-II 2010.
From a total of 191 participants in the BI-RTGS
system, only one bank utilised the intraday liquidity facility
(ILF). The provision of an intraday liquidity facility by Bank
Indonesia helped mitigate risk by overcoming temporary
funding shortfalls faced by a participating bank that occur
during regular operating hours in order to avoid gridlock.
The relatively limited use of the liquidity facility during
semester-II is further verification of adequate liquidity in
the BI-RTGS system, which represents the banks’ checking
accounts.
0
200
400
600
800
1,000
1,200
1,400
1,600
0
1,000
2,000
3,000
4,000
5,000
6,000
7,000
8,000
Jan 2
009
Feb 2
009
Mar
c 2009
Apr
2009
May
2009
June
2009
July
2009
Aug 2
009
Sept
2009
Oct
2009
Nov
2009
Dec
2009
Jan 2
010
Feb 2
010
Mar
c 2010
Apr
2010
May
2010
June
2010
July
2010
Aug 2
010
Sept
2010
Oct
2010
Nov
2010
Dec
2010
VolumeValue
Value (trillion Rp) Volume (thousand)
Source: Enterprise Data Warehouse, Bank Indonesia
Source: Enterprise Data Warehouse, Bank Indonesia

63
Chapter 3. Strengthening Financial Infrastructure
3.1.1.2. Bank Indonesia Scripless Securities
Settlement System (BI-SSSS)
3.1.1.2.1. Transactions
The average daily value and volume of BI-SSSS
transactions in semester-II 2010 was Rp58.5 trillion and
435 transactions respectively, bringing the total for the
semester to Rp7.2 trillion and 53.9 thousand transactions.
Compared to the same period in the previous year (yoy)
transaction value and volume experienced respective
growth of 35.5% and 0.7%.
Figure 3.4BI-SSSS Transactions
3.1.1.2.2. Administration of Securities
The average daily total and value of securities
processed through the Bank Indonesia-scripless securities
settlement system up to the end of semester-II 2010 was
154 securities with a total value of Rp1,022 trillion, which
can be broken down as follows:
A significant increase was reported for the total and
value of term deposits in semester-II 2010, attributable
to Bank Indonesia’s policy of issuing term deposits with a
minimum 3-month tenor to prevent the sudden withdrawal
of capital inflows, particularly foreign capital. Meanwhile,
the decline in total and value of Bank Indonesia Certificates
(SBI) and Bank Indonesia Sharia Certificates was due to
the policy of Bank Indonesia to hold SBI auctions every six
months instead of every three months.
3.1.1.3. National Clearing System
3.1.1.3.1. Transactions
The average daily value and volume of transactions
in the national clearing system was Rp7.3 trillion and
381 thousand transactions respectively in the second
semester of 2010, making the total for the semester
Rp917 trillion and 47.7 million transactions. Compared
Type of SecurityTotal Total TotalValue Value Value
Semester I 2010 Semester II 2010
Deposit Facility 2 23,455,260,162,602 2 31,453,320,000,000 0% 34%
Sharia Deposit Facility 2 3,057,960,975,610 2 4,747,485,600,000 0% 55%
Term Deposit 10 31,432,677,731,707 46 99,439,784,672,000 339% 216%
Ijarah 12 25,603,734,390,244 14 36,452,693,920,000 19% 42%
Treasury Bonds 63 555,245,955,479,675 62 583,967,729,216,000 0% 5%
Bank Indonesia Certificates 40 298,659,633,886,179 16 235,548,512,208,000 -60% -21%
Bank Indonesia Sharia Certificates 4 2,789,800,000,000 2 1,436,296,000,000 -40% -49%
Treasury Bills 9 24,120,406,504,065 9 29,622,200,000,000 3% 23%
142 964,365,429,130,081 154 1,022,668,021,616,000 9% 6%
Table 3.1BI-SSSS Transactions
Source: Enterprise Data Warehouse, Bank Indonesia
Source: Bank Indonesia Scripless Securities Settlement System
0
2,000
4,000
6,000
8,000
10,000
12,000
14,000
-
500
1,000
1,500
2,000
2,500
Jan
2009
Feb
2009
Mar
2009
Apr2
009
May
2009
Jun
2009
Jul2
009
Aug
2009
Sep
2009
Oct
2009
Nov2
009
Dec
2009
Jan
2010
Feb
2010
Mar
2010
Apr2
010
May
2010
Jun
2010
Jul2
010
Aug
2010
Sept
2010
Oct
2010
Nov2
010
Dec
2010
Value Volume
Value (Trillion Rp) Volume

64
Chapter 3. Strengthening Financial Infrastructure
to the same period in the previous year (yoy) transaction
value and volume experienced respective growth of 13%
and 12.7%.
3.1.1.5 Credit Card Industry
The value and volume of transactions initiated by
credit cards was Rp86 trillion and 103 million transactions
in semester-II 2010. The value and volume increased by
17.6% and 8.6% respectively when compared to the
same period in the previous year (yoy). Positive credit card
transaction growth in semester-II 2010 was primarily due
to aggressive promotion by card issuers, which ultimately
boosted seasonal transactions at the end of the year.
Figure 3.5National Clearing System Transactions
Figure 3.6ATM/Debit Card Transactions
Figure 3.7Credit Card Transactions
3.1.1.3.2. Operational Activities and Liquidity
Management
Similar to BI-RTGS, the national clearing system, in
general, performed well in the second semester of 2010,
which was a continuation of the sound performance
reported in the previous semester and confirmed adequate
liquidity in the system. This was further corroborated by
the availability of a prefund (cash and collateral) provided
by participating banks as a daily prerequisite to clearing
participation.
3.1.1.4. ATM and ATM/Debit Card Industry
The value and volume of transactions initiated by
ATM cards as well as ATM/debit cards reached Rp1,061
trillion and 932 million transactions in semester-II 2010.
When compared to the same period in the previous year
(yoy), the value and volume increased by 17.3% and
13.1% respectively.
0
1,0002,000
3,0004,000
5,0006,000
7,000
8,0009,00010,000
0
20
40
60
80
100
120
140
160
180
Jan
2009
Feb
2009
Mar
2009
Apr2
009
May
2009
Jun
2009
Jul2
009
Aug
2009
Sept
2009
Oct
2009
Nov
2009
Dec
2009
Jan
2010
Feb
2010
Mar
2010
Apr2
010
May
2010
Jun
2010
Jul2
010
Aug
2010
Sept
2010
Oct
2010
Nov
2010
Dec
2010
VolumeValue
Value (BillionRp) Volume (Thousand)
Source: Enterprise Data Warehouse, Bank Indonesia
Source: Enterprise Data Warehouse, Bank Indonesia
Source: Enterprise Data Warehouse, Bank Indonesia
-
20
40
6080100
120
140
160
180
-
204060
80100120
140160180
200
Jan
2009
Feb
2009
Mar
2009
Apr
2009
May
2009
Jun
2009
Jul2
009
Aug
2009
Sep
2009
Oct
2009
Nov
2009
Dec
2009
Jan
2010
Feb
2010
Mar
2010
Apr
2010
May
2010
Jun
2010
Jul2
010
Aug
2010
Sep
2010
Oct
2010
Nov
2010
Dec
2010
VolumeValue
Value (Trillion Rp) Volume (Million Rp)
-2468
1012141618
20
-
2
4
6
8
10
12
14
16
18
Jan
2009
Feb
2009
Mar
2009
Apr
2009
May
2009
Jun
2009
Jul2
009
Aug
2009
Sep
2009
Oct
2009
Nov
2009
Dec
2009
Jan
2010
Feb
2010
Mar
2010
Apr
2010
May
2010
Jun
2010
Jul2
010
Aug
2010
Sep
2010
Oct
2010
Nov
2010
Dec
2010
VolumeValue
Value (Trillion Rp) Volume (Million Rp)
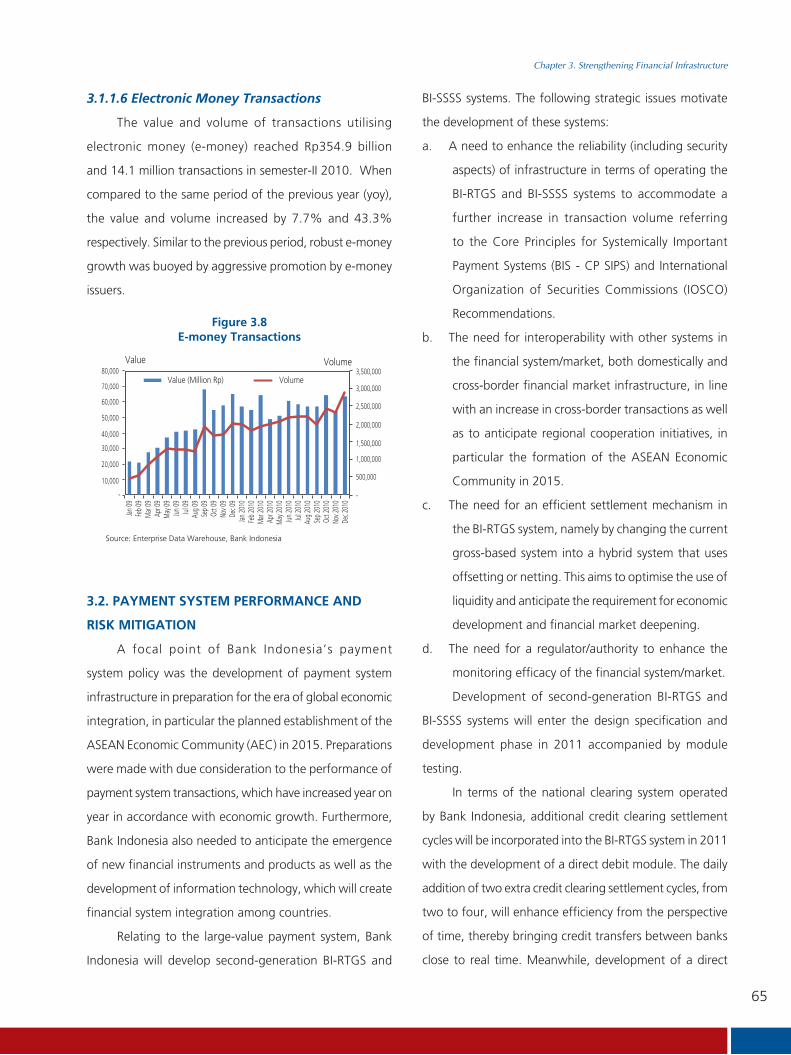
65
Chapter 3. Strengthening Financial Infrastructure
3.1.1.6 Electronic Money Transactions
The value and volume of transactions utilising
electronic money (e-money) reached Rp354.9 billion
and 14.1 million transactions in semester-II 2010. When
compared to the same period of the previous year (yoy),
the value and volume increased by 7.7% and 43.3%
respectively. Similar to the previous period, robust e-money
growth was buoyed by aggressive promotion by e-money
issuers.
BI-SSSS systems. The following strategic issues motivate
the development of these systems:
a. A need to enhance the reliability (including security
aspects) of infrastructure in terms of operating the
BI-RTGS and BI-SSSS systems to accommodate a
further increase in transaction volume referring
to the Core Principles for Systemically Important
Payment Systems (BIS - CP SIPS) and International
Organization of Securities Commissions (IOSCO)
Recommendations.
b. The need for interoperability with other systems in
the financial system/market, both domestically and
cross-border financial market infrastructure, in line
with an increase in cross-border transactions as well
as to anticipate regional cooperation initiatives, in
particular the formation of the ASEAN Economic
Community in 2015.
c. The need for an efficient settlement mechanism in
the BI-RTGS system, namely by changing the current
gross-based system into a hybrid system that uses
offsetting or netting. This aims to optimise the use of
liquidity and anticipate the requirement for economic
development and financial market deepening.
d. The need for a regulator/authority to enhance the
monitoring efficacy of the financial system/market.
Development of second-generation BI-RTGS and
BI-SSSS systems will enter the design specification and
development phase in 2011 accompanied by module
testing.
In terms of the national clearing system operated
by Bank Indonesia, additional credit clearing settlement
cycles will be incorporated into the BI-RTGS system in 2011
with the development of a direct debit module. The daily
addition of two extra credit clearing settlement cycles, from
two to four, will enhance efficiency from the perspective
of time, thereby bringing credit transfers between banks
close to real time. Meanwhile, development of a direct
Figure 3.8E-money Transactions
3.2. PAYMENT SYSTEM PERFORMANCE AND
RISK MITIGATION
A focal point of Bank Indonesia’s payment
system policy was the development of payment system
infrastructure in preparation for the era of global economic
integration, in particular the planned establishment of the
ASEAN Economic Community (AEC) in 2015. Preparations
were made with due consideration to the performance of
payment system transactions, which have increased year on
year in accordance with economic growth. Furthermore,
Bank Indonesia also needed to anticipate the emergence
of new financial instruments and products as well as the
development of information technology, which will create
financial system integration among countries.
Relating to the large-value payment system, Bank
Indonesia will develop second-generation BI-RTGS and
Source: Enterprise Data Warehouse, Bank Indonesia
500,000
1,000,000
1,500,000
2,000,000
2,500,000
3,000,000
3,500,000
- -
10,000
20,000
30,000
40,000
50,000
60,000
70,000
80,000
Jan 09
Feb 0
9M
ar 09
Apr 0
9M
ay 09
Jun 0
9Ju
l 09
Aug 0
9Se
p 09
Oct 0
9No
v 09
Dec 0
9Jan
2010
Feb 2
010
Mar
2010
Apr 2
010
May
2010
Jun 2
010
Jul 2
010
Aug 2
010
Sep 2
010
Oct 2
010
Nov 2
010
Dec 2
010
VolumeValue
Value (Million Rp) Volume

66
Chapter 3. Strengthening Financial Infrastructure
debit module will ameliorate routine payment efficiency
between banks initiated by customers, for instance the
payment of utility bills (electricity, telephone, water, etc).
Policy concerning financial system instruments will
continue to focus on the implementation of standardised
chip technology on ATM/debit cards, development of
standardised electronic money, and initiation of the
National Payment Gateway (NPG).
The roll out of credit cards based on chip technology
began in January 2010 and has successfully mitigated credit
card fraud. Therefore, the expeditious implementation of
chip technology for ATM/debit cards is desirable. Chip
technology implementation in 2011 will focus on the
establishment of a Key Management Institution and
Certification Body. The formation of these two agencies
is a prerequisite to the introduction of chip-based ATM/
debit cards.
To promote the use of electronic money (e-money),
issuers should be encouraged to ensure interoperability
among the systems they develop. A precondition of
interoperability is standardised e-money accepted industry
wide. Bank Indonesia will redouble efforts to develop a
standard form of e-money by facilitating the industry
through a Task Force.
In addition to policies concerning instruments,
Bank Indonesia is also concerned with the infrastructural
efficiency of the retail payment system currently in place
through the development of a National Payment Gateway
(NPG), which is expected to become a single hub for retail
transactions between banks by incorporating a variety of
front-end delivery channels.
Excluding the dimension of payment system policy
already mentioned, Bank Indonesia also strives to expand
the active role played by the payment system industry in
jointly creating with Bank Indonesia a secure and efficient
payment system. In terms of institutionally reinforcing the
payment system industry, Bank Indonesia has facilitated all
components of the payment system industry to form the
Payment System Association of Indonesia (ASPI) to function
as a Self-Regulatory Organisation for micro and technical
issues. ASPI was officially inaugurated on 11th November
2010. Looking ahead, ASPI is expected to become a
strategic partner of Bank Indonesia to foster the creation
and maintenance of a more efficient and reliable payment
system that adheres to consumer protection principles.

67
Chapter 4. Special Topic
Chapter 4Special Topic

68
Chapter 4. Special Topic
This page intentionally blank

69
Chapter 4. Special Topic
Chapter 4 Special Topic
Bank Indonesia undertook a number of endeavours during the reporting period
as part of its strategy to reinforce financial system stability management, and
also in response to the influx of foreign capital flows amid a shallow domestic
money market as well as limited economic absorption capacity. Accordingly,
financial sector liberalisation in the ASEAN region and global financial reforms
were the main agenda items at international fora, which is expected to
provide huge benefits to the national economy. Closer coordination among
the financial authorities like Bank Indonesia, the Ministry of Finance and the
Deposit Insurance Corporation is required in order to bolster financial system
stability.
4.1. FINANCIAL SECTOR REFORM
The recent crisis spawned the birth of a global
financial sector reform agenda supported by members
of G-20. The reforms promote the creation of global
financial system stability, among others, by enhancing the
bank liquidity and capital regime, strengthening systemic
financial institutions, regulating the OTC derivative
markets, regulating shadow banking and improving
macroprudential policy. Such a comprehensive agenda
is expected to ensure the global financial system is more
resilient and catalyse growth in the real sector.
The global financial crisis in 2008 exposed the need
to reform all lines in the financial sector in terms of both
regulation and supervision. The current banking regulation
regime is considered to have a number of weaknesses as
follows:
economic cycle. Capital and provisioning tend
to remain relatively low while the economy is
stable. Conversely, both are mandatorily raised
(through regulations) when economic conditions
deteriorate.
procyclicality. Oppositely, excessive credit growth
often accompanies robust economic expansion.
II regulatory framework, including that to mitigate
counterparty credit risk and liquidity.
rating agencies. It is clear that credit rating agencies
suffer from conflicts of interest.
On the other hand, bank leverage is too high,
the quality and quantity of capital is inadequate and
an insufficient liquidity buffer was seen as the primary
contributing factor of the recent global financial crisis.
These weaknesses are exacerbated by the problems

70
Chapter 4. Special Topic
of procyclicality and also the interconnectedness of
system institutions. Weak risk management, corporate
governance, transparency and supervision were also
highlighted as factors that helped trigger the global
financial crisis.
Consequently, at the G-20 leaders summit in
November 2010, G-20 leaders endorsed a variety of
proposals as part of a financial sector reform package.
At the summit, leaders also voiced their commitment to
adopt an array of financial sector reform packages within
the agreed upon timeframe. It was further agreed that the
financial sector reform packages would spearhead a new
financial sector supervisory and regulatory regime, expected
to be more prudent as well as capable of overcoming
the weaknesses exposed in the previous regime that
contributed to the adverse impacts of the global financial
crisis. Not only were microprudential aspects targeted,
the reforms also touch upon macroprudential elements.
The recent global financial crisis provided a number of
important lessons regarding the importance of adequate
power and tools as well as jurisdiction to overcome
systemic or system-wide risk.
In broad terms the global financial sector reform
agenda covers the following scope:
1. Strengthening the global capital regime and bank
liquidity standards as well as mitigating prevalent
procyclicality, known as Basel III (building high quality
capital and liquidity standards).
2. Regulating systemically important financial
institutions (Addressing systemically important
financial institutions and cross-border resolutions).
3. Reforming the compensation scheme for executives
at financial institutions (reforming compensation
practices).
4. Strengthening OTC derivative market regulations
(improving over-the-counter derivative markets).
5. Strengthening adherence to international
standards.
6. Strengthening accounting standards.
7. Developing macroprudential policy frameworks and
tools.
8. Harmonising market and financial institution
regulations (differentiated nature and scope of
regulation).
9. Hedge fund regulations.
10. Regulating credit rating agencies.
11. Establishing supervisory colleges.
12. Reactivating securitisation based on a strong
prudential foundation (re-launching securitisation
on a sound basis).
4.1.1. Basel III
Of all the agenda items mentioned, Basel III is the
primary focus considering that it covers a range of macro
and microprudential regulatory aspects. This is reasonable
bearing in mind that the majority of the economy is bank
based. One of the most important components of Basel
III is the capital requirement, more specifically minimum
common equity of 4.5% of risk-weighted assets (ATMR)
as well as raising the capital adequacy ratio from 8.0% to
10.5% after calculating the conversion buffer of 2.5%.
In addition, two new bank liquidity regulations have been
determined, namely the liquidity coverage ratio (LCR) and
the net stable funding ratio (NSFR).
The birth of Basel III is inextricable from the desire
to create a more resilient banking sector with enhanced
absorption capacity. This is viewed as critical momentum
for the emergence of a new capital and liquidity regime that
is more prudent and synergises not only microprudential
aspects and macroprudential aspects too. The recent
global financial crisis proved that the resilience of individual
institutions was not enough to minimise the impact of the
crisis because the interconnectedness between financial
institutions was not merely at the domestic level but also
71
Chapter 4. Special Topic
globally, therefore, compounding the possibility of systemic
risk in the event of one financial institution failing.
Microprudentially, the Basel III framework attempts
to overcome the panoply of weaknesses identified in the
previous capital framework, numerator and dominator,
concerning the calculation of capital adequacy required
by a bank. Basel III defines a higher level and quality of
capital with a focus on common equity. Furthermore,
Basel III also increases the scope of risk, particularly that
linked to activities on the capital market like trading book,
securitisation, as well as counterparty credit risk on OTC
derivatives and repos, namely by not only applying a higher
risk weighting but also by applying a higher capital charge
on certain activities.
In addition, Basel III strives to focus on the importance
of providing an adequate capital buffer by individual
financial institutions, namely by requiring a conservation
buffer. The concept of a conservation buffer is expected
to precipitate a change in the distribution policy paradigm
(and incentive policy) in order to ensure banks maintain
sufficient sources of conservation capital and avoid undue
distribution (pay dividends, bonuses, etc).
Meanwhile, other elements of Basel III, for instance
the concepts of leverage ratio, countercyclical capital buffer
and capital surcharge for systemically important financial
institutions, are aimed at improving macroprudential
aspects. Macroprudential is an issue that is still being
discussed at international fora. Macroprudential policy is
considered complementary to microprudential policy and
also interactive with other policies that impact on financial
stability. While this is not a new issue, it does however
attract a variety of definitions by different authorities in
different jurisdictions because although a wide range of
polices actually affect financial stability and systemic risk,
not all of them are considered macroprudential.
The salient features of Basel III are as follows and
subsequently presented in Table 4.1:
1. Enhance the quality of Tier 1 capital. One way is
through the requirement for predominant common
equity on Tier 1 capital, simplification of Tier 2
capital as well as abolishing Tier 3 capital and Tier 1
innovative capital.
2. Mitigate procyclicality through the countercyclical
capital framework that proposes the application of
forward-looking provisioning, a capital conservation
buffer and a countercyclical capital buffer.
3. Apply a leverage ratio as a measure to limit leverage
in the banking sector.
4. Improve the capital requirements for exposure to
counterparty credit risk (CCR).
5. Apply global liquidity standards that legislate the
application of two new liquidity standards, namely
the liquidity coverage ratio (to monitor short-term
liquidity resilience) and the net stable funding ratio
(to monitor long-term liquidity resilience) as well as
propose the application of four liquidity monitoring
tools.
in particular tighter requirements for capital and
risk weighting on trading book, derivative and
securitisation transactions.
The Basel III framework, which synergises micro
and macroprudential aspects, will help bolster banking
industry resilience in Indonesia due to stronger motivation
to monitor macroprudential aspects in order to more
accurately identify potential systemic risk stemming from
a specific activity or bank exposure as well as market
infrastructure. In addition, coupled with an effective
resolution regime framework, which is the objective of
regime reform, it is expected to nurture a prudent and
responsible banking industry in terms of risk management,
as well as create an independent banking sector that can
resolve its own problems without relying on injections from
the public sector to ensure business continuity.

72
Chapter 4. Special Topic
Leaders Summit in Seoul in November 2010, commitment
to the application of the reform agenda for the financial
sector has been forthcoming, including Basel III with an
agreed timeframe by all member states. In general, the
phase-in arrangement for full Basel III implementation
leads up to yearend 2018, with fully effective application
commencing on 1st January 2019.
The transition period for the application of the
leverage ratio begins on 1st January 2011, during which
time BCBS will assist semi-annually in order to evaluate
whether the application of 3% minimum leverage Tier
1 is sufficient for all credit cycles and business models,
the scope of exposure used in the ratio is adequate, and
to ensure the accountancy standards in effect in each
respective jurisdiction do not impact the leverage ratio.
To determine the impact of Basel III implementation
on bank capital, Bank Indonesia organised a quantitative
impact study (QIS) together with 14 large banks based on
December 2009 data. In general, the results demonstrated
that the application of Basel III will not have a significant
impact on bank capital in Indonesia considering that
the majority of bank capital is common equity, the
leverage ratio is above the minimum requirement and
Table 4.1Salient Regulations and Implementation Schedule of Basel III
No Agreement Ratio Implementation
1. Common equity. 4.5% Gradual, commencing in 2013 at 3.5% with full implementation of 4.5% in 2015.
2. Tier 1. 6%. Transition begins in 2013 at 4.5% with full implementation of 6% in 2015.
3. Total capital excluding conservation buffer. 8%.
4. Conservation buffer 2.5%. Transition begins in 2016 at 0.625% with (comprised of common equity). full implementation of 2.5% commencing 1st January 2019.
5. Countercyclical capital buffer (no further 0-2.5%. Applied in the event of excessive credit guidelines, comprised of common equity). growth in a jurisdiction.
6. Minimum total capital plus conservation buffer. 10.5%. Commencing in 2013 at 8% with full implementation of 10.5% effective from 1st January 2019.
7. Leverage ratio (capital exposure/exposure 3%. Supervisory monitoring (2011-2012), measure). parallel run of 3% (1 Jan 2013 – 1 Jan 2014), disclosure begins 1st January 2015, final adjustment to H1-2017, migration to
8. Liquidity coverage ratio (stock of high-quality Min 100%. Observation 2011-2014, regulatory liquid assets/total net cash outflows). reporting commencing in 2012, application of minimum standard (currently under revision) on 1st January 2015.
9. Net stable funding ratio (available stable Min 100%. Observation commencing in 2012-2017, funding/required stable funding). regulatory reporting begins 1st January 2012, application of minimum standard (currently under revision) on 1st January 2018.
on 1st January 2019 (100%).
qualify as non-core Tier 1 and Tier 2.

73
Chapter 4. Special Topic
the conservation buffer is adequate. Average bank
capital adequacy ratio (CAR) is currently 13.84%, which
is well above the minimum requirement stipulated in
Basel III at 8% or 10.5% if the conservation buffer is
included. Therefore, bank capital would only experience
a slight decline (1.49%), namely from 15.33% before the
application of Basel III to 13.84%.
Under a framework of monitoring the level of bank
capital during the transition period commencing in 2011,
Bank Indonesia calculates the level of bank capital in
line with the concepts of Basel III using a banking data
approach contained in the commercial bank reports based
on data from December 2010. In general, the average
capital adequacy ratio for banks was 14.82%, which
exceeds that recorded in QIS 2009. The levels of common
equity and Tier 1 were 14.03% and 14.97% respectively,
which meets the BCBS requirements of 4.5% and 6%. The
average capital of respondents was in excess of 8% and
even surpassed 10.5%, which includes the capital buffer.
The results of monitoring the leverage ratio indicate that
banks in Indonesia are not overleveraged with an average
leverage ratio of 8.08%, which is well in excess of the BCBS
minimum requirement of 3% (full results are presented
in Table 4.2).
Table 4.2Recapitulation of Capital Ratio and Leverage Ratio
QIS (Dec 2009) Monitoring *) (Dec 2010)
Value ValueGroup 1**) Group 2)
Respondent
Ratio
Respondent
Ratio
BCBS
Requirements
QIS BIS Result Dec’09
After Basel III
Total Capital 157.469.108 15,33% 207.450.027 15,43% Tier 1 net 134.777.598 13,12% 179.334.640 13,34% 10,50% 9,80%
Tier 2 28.137.416 2,74% 28.115.388 2,09% Risk-Weighted Assets 1.026.926.623 1.344.105.374
Before Basel III
Total Capital 142.164.099 13,84% 199.262.626 14,82% 8,00% Tier 1 net 118.177.024 11,51% 188.519.981 14,03% 6,00% 6,30% 8,10%
Common Equity Tier 1 92.767.269 9,03% 201.202.291 14,97% 4,50% 11.1% 10,70% Additional Tier 1 9.590.209 0,93% - Tier 2 23.987.075 2,34% 10.742.645 0,80%
Changes to Tier 1 (16.600.573) -1,62% 9.185.341 0,68% Changes to Tier 2 (4.150.341) -0,40% (17.372.742) -1,29%
Capital Changes (15.305.009) -1,49% (8.187.401) -0,61% Leverage Ratio 8,21% 8,08% 3,00% 2,80% 3,80% Capital Exposure 118.177.024 188.519.981 Exposure Measure 1.438.594.061 2.331.927.324
Conservation Buffer 82,15% 2,50% 76,00%
Note: *) Source: Monthly Commercial Bank Report **) Banks with total assets of $3 billion, internationally active bank, diversified bank

74
Chapter 4. Special Topic
4.1.2. Macro-Microprudential Policy and the
Financial Institution Resolution Regime
Consensus has been reached among all other macro
and microprudential policies. In terms of microprudential
policies, supervision and the resolution mechanism of
systemically important financial institutions (SIFI) will
be ameliorated. In addition, the macroprudential policy
framework will be strengthened in order to mitigate
system-wide risk. Subsequently, a number of fundamental
policies concerning the international agenda have been
accomplished.
FSB, BIS and the IMF were mandated by the G-20
to compile a macroprudential policy framework, including
tools, and define macroprudential policy as a policy that
utilises prudential tools designed to limit systemic risk or
system-wide financial risk, thereby, limiting disruptions to
key financial services that can undermine the real economy.
In other words, there are three aspects in the definition
of macroprudential policy, namely that which is based
on objective aspects, the scope of analysis as well as the
instruments and governance of the policy.
Based on the results of stock-taking macroprudential
policy as well as case studies conducted by the Committee
on the Global Financial System (CGFS), CGFS compiled seven
general macroprudential policy principles that include: i)
integrating various information to diagnose systemic risk;
ii) monitoring and understanding interlinkage between
financial institutions and the market, including cross-border
and hedging market exposure; iii) preparing instruments
and financial infrastructure policy according to specific
risks or diagnoses of imbalances; iv) sharing information at
the international level as an incentive; v) macroprudential
policy is the responsibility of an independent central agency
or formal committee arrangement; vi) explanation of the
mandate, objectives, authority and accountability of the
macroprudential authority; and vii) the communication
strategy for macroprudential policy.
Connected to the macroprudential policy framework,
non-prudential instruments can be considered as
macroprudential policy tools as long as they are targeted
explicitly and specifically to mitigate systemic risk and are
supported by an appropriate governance arrangement.
For example, there is the practice in a number of countries
to view the application of monetary policy as a tool to
limit credit expansion, representing a macroprudential
instrument. Meanwhile, at the implementation level to
enhance system-wide oversight, several jurisdictions have
introduced legislative reforms. The Financial Stability
Oversight Council (FSOC) was established in the United
States, while in Europe the European Systemic Risk Board
(ESRB) was set up. The reforms aimed to focus regulations
on macroprudential policy,
Another issue that is currently the focus of discussion
at international fora and which strives to overcome
systemic risk is a cross-border resolution regime. In this
context, draft key attributes are being drawn up, which
will be adopted by the national resolution regime. The key
attributes of an effective resolution regime are expected to
provide a comprehensive framework (including for NFBI)
to be used by jurisdictions to build, reform and realise
a consistent resolution regime across jurisdictions and
allow the implementation of an effective cross-border SIFI
resolution. The resolve of financial institutions during the
crisis and the power of authorities to introduce structured
resolutions to systemic situations were invaluable lessons
that nurtured the idea of reforming the cross-border
resolution regime to be more effective and ensure that
taxpayers do not bear the losses incurred by a crisis.
One resolution proposed in discussions regarding
resolution regimes was bail-in, seen as having the potential
to be sensitive for financial stability because it requires
a change to the legal framework. Despite its positive
objective, namely to avoid taxpayer exposure to losses
incurred by the failure of a financial institution, bail-in is

75
Chapter 4. Special Topic
sensitive for investors in capital instruments. Furthermore,
the bail-in framework that incorporates statutory bail-in
requirements, which demands cross-border resolution
regime harmonisation, will face difficulties in a number
of jurisdictions due to the required change in the legal
framework. The proposed resolution regime is also linked
to the Basel III capital framework, for instance between
the resolution order in the regime framework and the
requirement for a point of non-viability as well as the
surcharge on SIFIs. The finalisation of the resolution regime
framework will determine the overall capital framework,
like the treatment of contingent capital to meet the
systemic surcharge and the possibility of using it to meet
the buffer requirement.
4.1.3. Consumer protection
The financial sector reform agenda does not
stop with improvements from an industry perspective,
consumer protection and the concerns of emerging market
countries are also issues that require the attention of
G-20 leaders in 2011. FSB in conjunction with OECD and
other international organisations were requested by G-20
to explore other options to enhance consumer finance
protection. In addition, FSB along with the IMF and World
Bank were called upon to review the issues of financial
stability that are a concern for emerging market countries
as well as developing countries, and subsequently submit
policy recommendations, for example related to exchange
rate risk management by financial institutions, firms and
households; the regulatory and supervisory capacity of
emerging market and developing countries; issues with
foreign banks and deposit guarantees, financial inclusion,
information sharing among host and home countries, and
trade finance.
4.1.4. Indonesia’s Position on Global Financial
Sector Reform
Excluding the agenda for financial sector reform
agreed by G-20 leaders in November 2010, a critical point
is currently to ensure the implementation of financial sector
reform at the national level, which is consistently globally,
in order to avoid regulatory arbitrage through inconsistent
implementation and shadow banking. The long phase-in
arrangement is thought to provide the relevant authorities
with enough time to meet the requirements of the new
regulatory and supervisory framework.
From Indonesia’s standpoint as an emerging market
country and a member of the G-20, implementation of
financial sector reforms domestically will substantiate
Indonesia’s commitment to international fora. Ideally, the
adoption of a capital framework by enhancing the quality
and level of bank capital will have a positive impact on the
risk absorption capacity of the banking industry in Indonesia.
The inability to accurately predict the contributing factors
of future crises necessitates the banking industry to be
more prepared and, hence, maintain an adequate buffer
to confront the possibility of stress in the future.Similarly,
the liquidity buffer requirements demanded by Basel III
are expected to bolster liquidity resilience in the banking
industry in Indonesia, particularly during a crisis episode.
Furthermore, despite a moderate bank leverage level in
Indonesia, the business model of domestic banks remains
traditional, therefore, the application of the leverage ratio
will help limit the possibility of a high leverage level (as
a backstop) as the business model in Indonesia develops.

76
Chapter 4. Special Topic
4.2. FINANCIAL SYSTEM SAFETY NET:
COOPERATION TO CREATE AND MAINTAIN
FINANCIAL SYSTEM STABILITY
A financial system safety net is a vital part of
infrastructure in the financial system. Due to its critical
role, the safety net mechanism is an inseparable part of the
financial system in many countries. The crisis experience
provided an important lesson that safety nets, incorporating
liquidity assistance to financial institutions that experience
liquidity shortfalls and cooperation between authorities/
institutions in the financial sector, contribute greatly to
shielding the economy from the most severe crisis impacts.
Accordingly, the safety net mechanism, which consists of
preventing and resolving crises in the financial sector, must
be well formulated and strengthened.
Underpinning a financial system safety net is
supported through coordination among the authorities/
institutions that play a role in creating and maintaining a
stable financial system. In this context, cooperation and
coordination between Bank Indonesia, the Ministry of
decisive. Realising the importance of such cooperation
and coordination, Bank Indonesia, the Ministry of Finance
and the Deposit Insurance Corporation have signed a
number of agreements in the financial sector as evidence
of commitment and active involvement in efforts to create
and maintain financial system stability including, among
others, an agreement to bridge the implementation of a
financial system safety net mechanism.
is implemented through joint decrees, namely SKB No.
in October 2009. At their core these joint decrees control
the coordination and exchange of data and information
under a framework of supporting the effective task
These joint decrees were enacted in order to enhance and
refine existing coordination between the two organisations.
Coordination and cooperation that is prioritised to refine
and improve, covers: i) coordination in the implementation
of deposit guarantees; ii) the handling of problem banks;
iii) resolution and settlement of failed banks; iv) follow-up
measures for a bank that has had its license revoked; v)
determination of the normal rate when settling guarantee
claims; and vi) coordination for other task implementation,
including confidential information and data. The joint
decree was subsequently translated into implementation
guidelines.
In the middle of 2010, Bank Indonesia, the Ministry
of Finance and the Deposit Insurance Corporation signed
a memorandum of understanding regarding coordination
under a framework of creating and maintaining financial
system stability. The memorandum of understanding was
signed to support policy synchronisation and harmonisation
as well as effective, transparent and accountable
joint actions in the financial sector. Notwithstanding,
implementation coordination and synchronisation
between the three related institutions pays due regard
to the individual tasks and authority of each respective
institution.
The memorandum of understanding between
Bank Indonesia, the Ministry of Finance and the Deposit
Insurance Corporation signed on 30th July 2010 is
part of the financial system safety net, which contains
coordination to prevent and resolve disruptions to financial
system stability. The memorandum of understanding is
important because it coordinates the actions that must
be taken by each respective institution in the event of
a crisis. This is critical because the draft financial system
safety net bill has not yet been adopted by parliament;
thus, the MoU is temporarily functioning as the de facto
guidelines for coordination and cooperation between
the authorities/institutions responsible for implementing
the financial system safety net as well as creating and
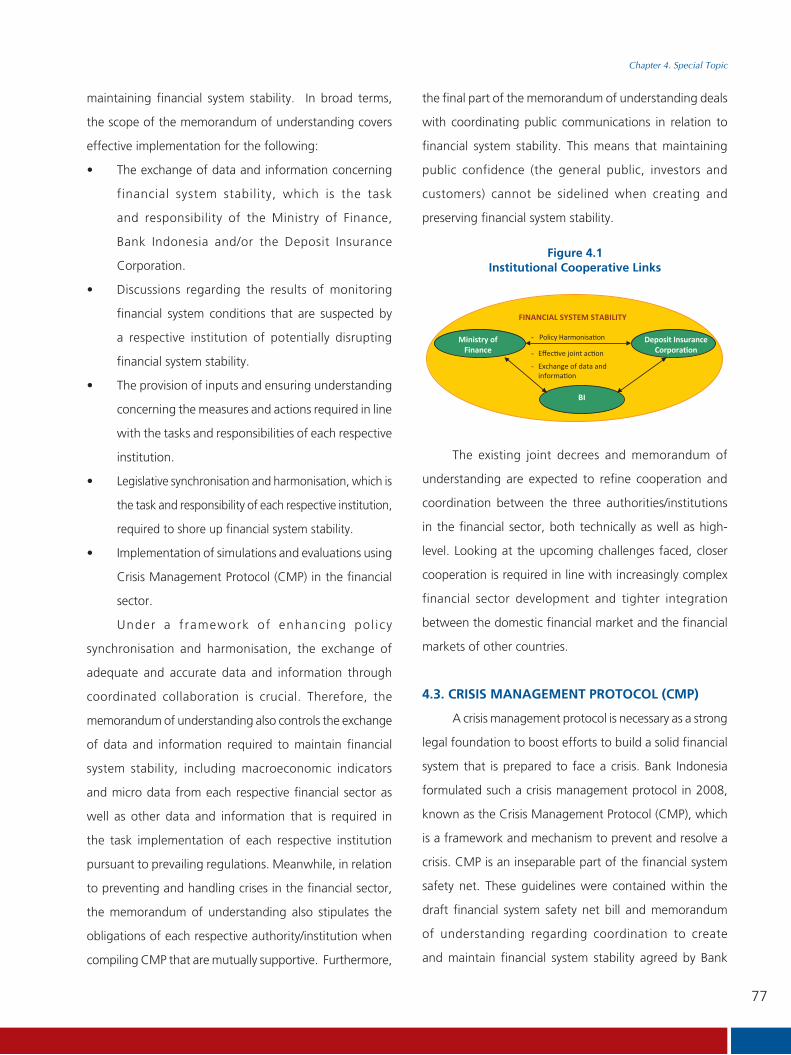
77
Chapter 4. Special Topic
maintaining financial system stability. In broad terms,
the scope of the memorandum of understanding covers
effective implementation for the following:
financial system stability, which is the task
and responsibility of the Ministry of Finance,
Bank Indonesia and/or the Deposit Insurance
Corporation.
financial system conditions that are suspected by
a respective institution of potentially disrupting
financial system stability.
concerning the measures and actions required in line
with the tasks and responsibilities of each respective
institution.
egislative synchronisation and harmonisation, which is
the task and responsibility of each respective institution,
required to shore up financial system stability.
sector.
Under a f ramework of enhancing pol icy
synchronisation and harmonisation, the exchange of
adequate and accurate data and information through
coordinated collaboration is crucial. Therefore, the
memorandum of understanding also controls the exchange
of data and information required to maintain financial
system stability, including macroeconomic indicators
and micro data from each respective financial sector as
well as other data and information that is required in
the task implementation of each respective institution
pursuant to prevailing regulations. Meanwhile, in relation
to preventing and handling crises in the financial sector,
the memorandum of understanding also stipulates the
obligations of each respective authority/institution when
the final part of the memorandum of understanding deals
with coordinating public communications in relation to
financial system stability. This means that maintaining
public confidence (the general public, investors and
customers) cannot be sidelined when creating and
preserving financial system stability.
Figure 4.1Institutional Cooperative Links
-
--
Ministry ofFinance
Deposit Insurance
BI
FINANCIAL SYSTEM STABILITY
The existing joint decrees and memorandum of
understanding are expected to refine cooperation and
coordination between the three authorities/institutions
in the financial sector, both technically as well as high-
level. Looking at the upcoming challenges faced, closer
cooperation is required in line with increasingly complex
financial sector development and tighter integration
between the domestic financial market and the financial
markets of other countries.
4.3. CRISIS MANAGEMENT PROTOCOL (CMP)
A crisis management protocol is necessary as a strong
legal foundation to boost efforts to build a solid financial
system that is prepared to face a crisis. Bank Indonesia
formulated such a crisis management protocol in 2008,
is a framework and mechanism to prevent and resolve a
safety net. These guidelines were contained within the
draft financial system safety net bill and memorandum
of understanding regarding coordination to create
and maintain financial system stability agreed by Bank
78
Chapter 4. Special Topic
Indonesia, the Ministry of Finance and the Deposit
Insurance Corporation. With the draft bill still pending,
the memorandum of understanding has become the
guidelines and critical legal foundation because it sets forth
inter-authority/institution coordination in the financial
to synergise perceptions and understanding in the face
of a crisis. The availability of a clear protocol leads to
effective coordination between authorities/institutions and
expeditious crisis resolution is made possible.
In general, the scope of crisis management protocol
incorporates: i) banking sector crisis prevention; ii) crisis
resolution; and iii) coordinated monitoring and crisis
and parameters that are sources of vulnerability in the
financial sector, which can signal a forthcoming crisis in
the banking sector. Sources of vulnerability can stem
from four triggers: financial institution disruptions; market
disruptions; financial infrastructure disruptions; and
large-scale operational disruptions, for instance natural
disasters or political upheaval. Shocks that befall a financial
institution and the market are quantitative because the
indicator can be measured. Conversely, shocks to financial
infrastructure and operational disruptions are qualitative.
The decision-making process during a crisis is based on
analyses of the combination of shocks that occur. Internally,
Bank Indonesia has a legal framework, however, a sound
legal framework is required as a foundation to legitimise
the decision-making process between institutions in the
implementation of their respective policy response.
Observing developments that have taken place in the
financial sector, in particular experience gleaned from the
A number of amendments were made including the
use of macroprudential indicators as early warning
indicators. The global crisis taught us that the indicators
used for macroprudential policy are important analysis
tools, especially in terms of avoiding systemic impact
in the financial system. Additionally, macroprudential
indicators can also be used to limit the rapidity and depth
of downswings during recession conditions. Currently,
the use of macroprudential indicators in a number of
emerging countries, including Indonesia, remains in
the developmental phase. Looking ahead, updating
crisis detection indicators will continue in line with the
development of diverse parameters that can trigger a
financial crisis.

79
Chapter 4. Special Topic
Box 4.1 Financial Inclusion
INTRODUCTION
the past two decades has, in fact, left large swathes
of the general public behind who do not even have
access to the most basic financial services. Based on a
World Bank publication from 2008, less than half of the
citizens in many developing countries own an account
at a financial institution. In the majority of African
nations this figure is less than one-fifth of households.
Notwithstanding, access to financial services is a critical
aspect of alleviating poverty.
PROBLEM FOCUS
The issues that limit public access to financial
services can be divided into two broad categories,
namely supply-side and demand-side. From the supply
side, geographical conditions, the design and pattern of
service as well as the information gap are the primary
factors to low public access to financial institutions.
Conversely, on the demand side, relatively poor
education and knowledge of financial aspects as well
as limited bank engagement with its customers, which
is generally controlled by strict legal requirements
(like business licenses, certified collateral, etc.) leave
the general public in the dark regarding financial
services. Circumstances are compounded further by
self-exclusion or reluctance to seek financial services
because it is believed that conventional bank lending
rates are usury.
ACCESS TO WHAT?
Citing a 1995 World Bank report, at least
four types of financial services are required by the
community in order to have a more prosperous life,
namely deposits, credit services, a payment system
and pension funds. These four aspects are basic
requirements for all human beings.
Although various models of informal microfinance
and spontaneous institutions exist to serve society,
principally in developing countries, as an alternative
financial institution informal microfinance can only
fulfil a small portion of the public’s needs. In this
context, close cooperation between formal financial
institutions, like banks, and microfinance institutions
is key to realising inclusive financial institutions for all
strata of society.
NATIONAL FINANCIAL INCLUSION
Broadening public access to financial institutions
is a complex issue that requires cross-sectoral
coordination involving banking authorities, non-bank
financial services and other departments involved with
“Financial inclusion will link the previously excluded group with the formal economy and they
will eventually contribute to country’s economic growth” and it “...cannot stop at just opening a
saving account and obtaining micro-credit.” President RI Susilo Bambang Yudhoyono
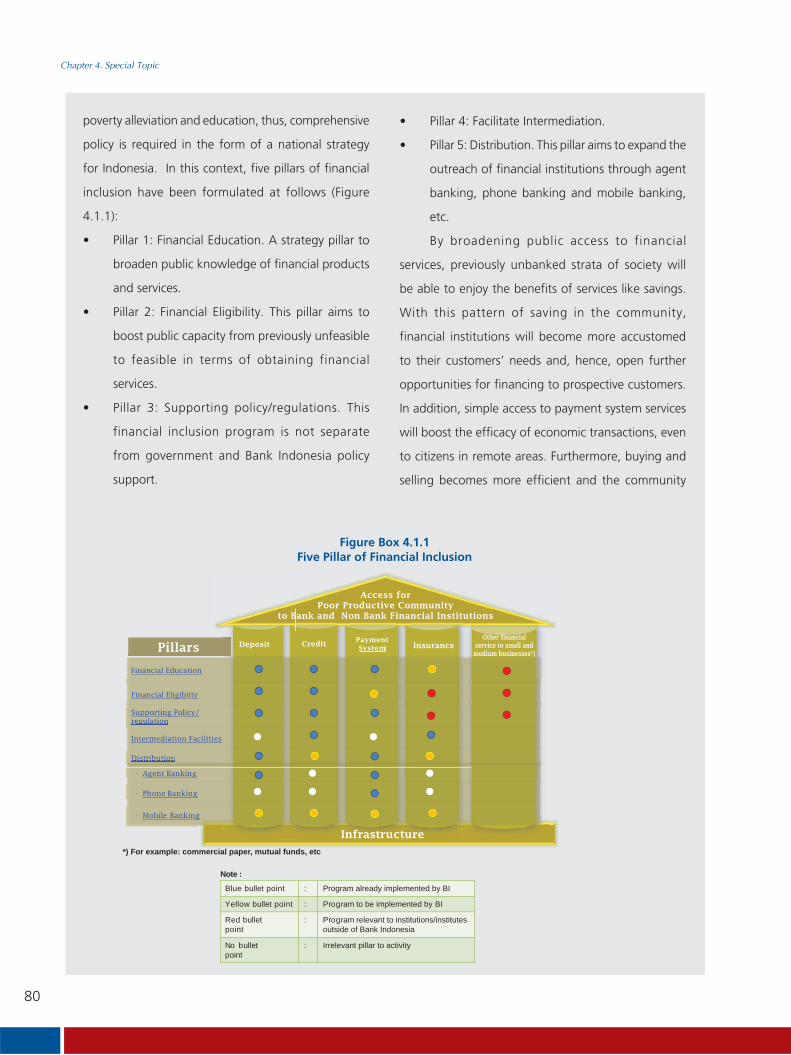
80
Chapter 4. Special Topic
poverty alleviation and education, thus, comprehensive
policy is required in the form of a national strategy
for Indonesia. In this context, five pillars of financial
inclusion have been formulated at follows (Figure
4.1.1):
broaden public knowledge of financial products
and services.
boost public capacity from previously unfeasible
to feasible in terms of obtaining financial
services.
financial inclusion program is not separate
from government and Bank Indonesia policy
support.
Figure Box 4.1.1Five Pillar of Financial Inclusion
outreach of financial institutions through agent
banking, phone banking and mobile banking,
etc.
By broadening public access to financial
services, previously unbanked strata of society will
be able to enjoy the benefits of services like savings.
With this pattern of saving in the community,
financial institutions will become more accustomed
to their customers’ needs and, hence, open further
opportunities for financing to prospective customers.
In addition, simple access to payment system services
will boost the efficacy of economic transactions, even
to citizens in remote areas. Furthermore, buying and
selling becomes more efficient and the community
Deposit CreditPaymentSystem Insurance
Access forPoor Productive Community
to Bank and Non Bank Financial Institutions
Financial Education
Financial Eligibiity
Supporting Policy/regulation
Intermediation Facilities
Distribution
- Agent Banking
- Phone Banking
Pillars
- Mobile Banking
*) For example: commercial paper, mutual funds, etc
Blue bullet point : Program already implemented by BI
Yellow bullet point : Program to be implemented by BI
Red bulletpoint
: Program relevant to institutions/institutesoutside of Bank Indonesia
No bulletpoint
: Irrelevant pillar to activity
Note :
Infrastructure
Other financialservice to small and medium businesses*)
81
Chapter 4. Special Topic
can benefit from technological advances like cellular
telephones to purchase raw materials from farmers in
remote regions, for example. Farmers will no longer
be forced to sell their produce at low prices as the
result of traders only brining limited cash; they will be
able to use e-money. This is an example of how these
kinds of ventures can stimulate economic activity and
raise living standards. Likewise, insurance services. The
availability of micro-insurance will help members of
the community in the event of a problem that can be
resolved with insurance. Holistically, this is expected
to ameliorate public welfare through participation in
sustainable economic activities.
82
Chapter 4. Special Topic
Box 4.2 Green Banking
GREEN BANKING POLICY
Rising temperatures on earth as a result of
industrial activity that releases CO2 gas into the
atmosphere has impacted the issues of climate change
and global warming. Greater public awareness,
including entrepreneurs and the banking industry,
as managers of development financing, is a positive
response to the changes afoot. The fallout from
climate change can significantly impact environmental
conditions and can spread unnoticed to industrial and
economic activity.
The banking industry, in its role to support
national development, embraces a strategic function
because economic growth and the application of
sustainable development principles12 relate to the
allocation of credit. In their position as fund providers
to finance projects, banks are often faced with a
number of policy constraints linked to social issues
and the environment. As providers of funds, banks
also possess a great opportunity to foster compliance
to project management principles in accordance with
social norms and the environment. Bank Indonesia,
in order to maintain financial system stability, drives
banking system development based on Indonesian
Banking Architecture (IBA). In IBA, a national banking
system that is sound, robust and efficient is supported
by six pillars; the second being ‘an effective regulatory
system’ and the fourth ‘a robust banking industry’,
which are particularly relevant to green banking.
and management is also connected to maintaining
financial system integrity. Financial integrity is one
part of the financial trinity (financial stability, financial
integrity and financial inclusion), which covers the
scope of bank efforts to avoid money laundering and
financing terrorism. As an industry without any direct
impact on the environment, avoiding involvement
in environmental pollution and destruction is what
the banking sector can achieve to maintain financial
integrity. In addition, allocation of bank credit to
environmental projects like recycling, hydroelectric
power, reforestation and natural conservation needs to
be increased. This further supports financial inclusion.
Therefore, banks need to support environmental
protection and management as one principle (planet)
of sustainable development.
A number of foreign banks that operate in
Indonesia as well as domestic banks have already
introduced green banking on a voluntary basis through
13 Foreign
banks tend to follow these principles based on the
requirements of their head office in order to meet green
banking standards in their home country. Despite a
significant differences between the green banking
standards practiced at foreign banks compared to
12 Sustainable development is development that respects the interests of the economic,
evaluating and managing social and environmental risk in financing. This standard,
not extend financing to debtors that do not or can not comply with social and
revised in 2006.
83
Chapter 4. Special Topic
national banks, which remain defensive (only reacting in
the event of an environmental problem).14 The largest
contribution that can be offered by banks in terms of
environmental protection and management is through
financing practices. The agricultural sector, mining,
manufacturing industry, utilities, and construction are
all economic sectors that have or potentially have an
impact on the environment. Environmental impacts
stemming from businesses financed by banks can
intensify credit risk and tarnish the reputation of the
banks in question. Therefore, active participation is
required from the banks to restrict the environmental
impact of its financing, particularly in relation to bank
risk management.
Bank Indonesia encourages banks to adhere
to environmental aspects through Bank Indonesia
Circular No. 212/9/UKU, dated 25th March 1989
regarding investment credit and capital investment
at commercial banks where banks are obliged to
assess prospective debtors with reference to efforts
to maintain the environment. The new green banking
policy was designed to fit the latest requirements
pursuant to new laws, namely Act No. 32, 2009,
as well as to ensure banks actively contribute to
sustainable development. In its preparation, Bank
Indonesia collaborated with the Ministry of the
Environment to ensure that all infrastructure required
to uphold supporting regulations for green banking can
be applied. Such cooperation is basically the renewal
of existing coordination through a memorandum of
understanding between the Minister of the Environment
and Governor of Bank Indonesia regarding Expanding
the role of the Banking Sector to support Environmental
Management (No. B-07/MENLH/09/2004; No. 6/66/
Regulations on green banking guarantee a level
playing field in the allocation of credit by banks. The
standards set in green banking will later guarantee
that a business failing to meet the environmental
requirements will not receive any support from the
national banking industry across the board prior to
risk mitigation of potential environmental impacts.
In this context, the determination of potential
environmental impacts refers to the requirements
and methods stipulated in the regulations pertaining
to environmental protection and management, the
expertise for which is found at the Ministry of the
Environment.
One principle that will be incorporated into
green banking is bank efforts to manage risk that
could emerge indirectly from credit allocation to
businesses with a potential impact on the environment.
This will be seen as a cost that should be passed on
to the debtor. For the debtor, this cost is an effort
to internaliseenvironmental aspects in economic
development. Given the demands on banks to assess
potential environmental risks from the businesses they
finance, boosting bank capacity and offering assistance
from environmental consultants is necessary in the
implementation of green banking. Efforts to enhance
bank capacity as well as preparing a directory of
environmental consultants is part of the work program
set forth in the memorandum of understanding
between KLH and Bank Indonesia. Holistically, the
scope of the work program covers aspects of legal
instruments, the provision of information, education
and socialisation activities, as well as joint research. 14 The implementation of green banking is phased according to the actions taken by
the bank in question: i) defensive banking; ii) preventative banking; iii) offensive banking; and iv) sustainable banking (Bouma et al 2001).

84
Chapter 4. Special Topic
REFERENCES
Bank Indonesia, Indonesian Banking Architecture,
2004
Bouma, JJ., Marcel Jeucken and Leon Klinkers
(2001),“Sustainable Banking - The Greening of
industrybenchmark for determining, assessing
project financing”, July, http://www.equator-
principles.com

85
Chapter 5. Financial System Stability Challenges and Prospects
Chapter 5Financial System StabilityChallenges and Prospects

86
Chapter 5. Financial System Stability Challenges and Prospects
This page intentionally blank
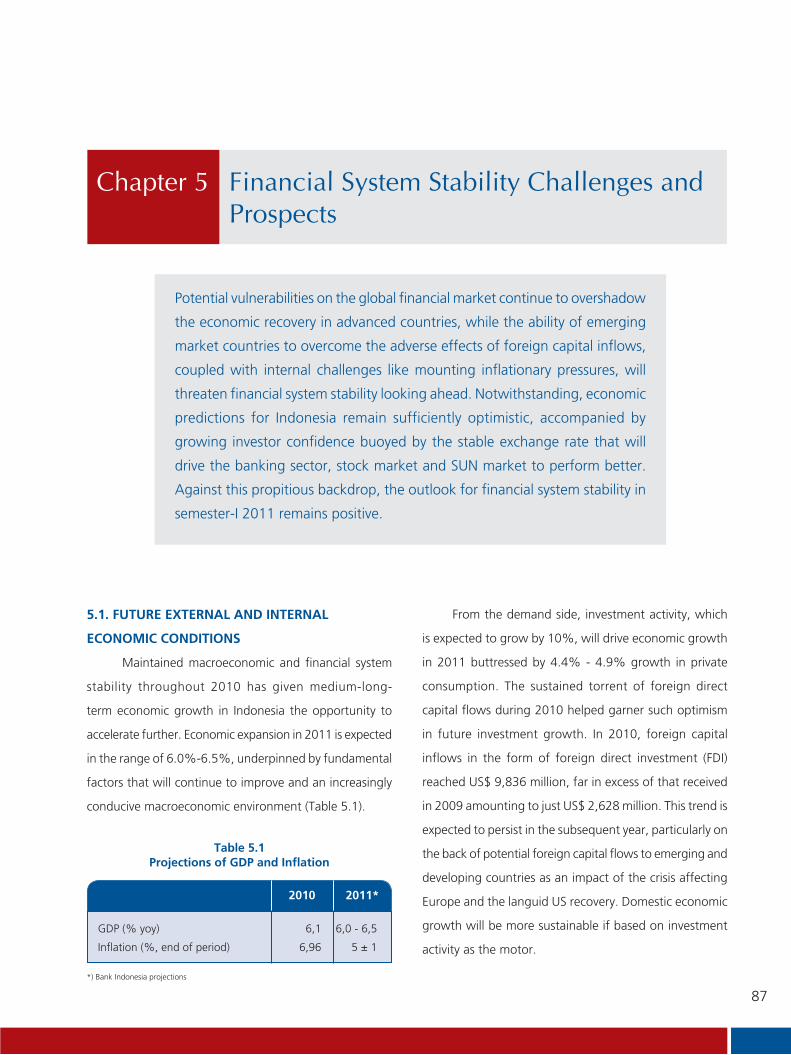
87
Chapter 5. Financial System Stability Challenges and Prospects
Chapter 5 Financial System Stability Challenges and
Prospects
Potential vulnerabilities on the global financial market continue to overshadow
the economic recovery in advanced countries, while the ability of emerging
market countries to overcome the adverse effects of foreign capital inflows,
coupled with internal challenges like mounting inflationary pressures, will
threaten financial system stability looking ahead. Notwithstanding, economic
predictions for Indonesia remain sufficiently optimistic, accompanied by
growing investor confidence buoyed by the stable exchange rate that will
drive the banking sector, stock market and SUN market to perform better.
Against this propitious backdrop, the outlook for financial system stability in
semester-I 2011 remains positive.
5.1. FUTURE EXTERNAL AND INTERNAL
ECONOMIC CONDITIONS
Maintained macroeconomic and financial system
stability throughout 2010 has given medium-long-
term economic growth in Indonesia the opportunity to
accelerate further. Economic expansion in 2011 is expected
in the range of 6.0%-6.5%, underpinned by fundamental
factors that will continue to improve and an increasingly
conducive macroeconomic environment (Table 5.1).
From the demand side, investment activity, which
is expected to grow by 10%, will drive economic growth
in 2011 buttressed by 4.4% - 4.9% growth in private
consumption. The sustained torrent of foreign direct
capital flows during 2010 helped garner such optimism
in future investment growth. In 2010, foreign capital
inflows in the form of foreign direct investment (FDI)
reached US$ 9,836 million, far in excess of that received
in 2009 amounting to just US$ 2,628 million. This trend is
expected to persist in the subsequent year, particularly on
the back of potential foreign capital flows to emerging and
developing countries as an impact of the crisis affecting
Europe and the languid US recovery. Domestic economic
growth will be more sustainable if based on investment
activity as the motor.
2011*2010
GDP (% yoy) 6,1 6,0 - 6,5
Inflation (%, end of period) 6,96 5 ± 1
Table 5.1Projections of GDP and Inflation
*) Bank Indonesia projections

88
Chapter 5. Financial System Stability Challenges and Prospects
have the potential to affect demand for production goods
in Indonesia. Consequently, export growth in 2011 is
predicted to be lower than that in 2010.
Internally, inflationary pressures will continue to
blight the economic landscape of Indonesia in the year
ahead. Inflationary pressures will primarily originate
from volatile foods due to limited supply as a result of
weather anomalies; the plan to set a minimum rice price;
planned price hikes for the most expensive fertilisers; the
soaring trend of global food prices due to strong demand
stemming from the global economic recovery; as well as
limited food exports from key exporters like Thailand.
Additionally, potential inflationary pressures from rising
non-subsidised fuel prices and restrictions on their use
require continuous monitoring.
The uptrend in commodity prices will require
additional attention in order to maintain financial system
stability. Currently, the effects of soaring food prices are
the focus of central banks around the world in relation
to controlling inflation. Monetary authorities worldwide
are predicted to introduce a number of follow-up policy
measures that impact the domestic financial market and
potentially affect the balance of global financial markets.
In addition, a concentration of funds is expected on
commodity markets as long as expectations persist of
soaring commodity prices. Furthermore, financial market
conditions in established countries will continue to be
marred by uncertainty surrounding crisis resolution in
Europe, which is predicted to intensify price volatility on
global financial markets and be exacerbated by the global
flow of funds that always seeks safe investments with the
highest returns.
5.2. FINANCIAL SYSTEM STABILITY CHALLENGES
Looking ahead, potential vulnerabilities on global
financial markets will continue to face uncertainty
regarding the economic recovery in advanced countries,
2011*2010
Private consumption 4,6 4,4 - 4,9
Government consumption 0,3 9,7 - 10,2
Gross fixed capital formation 8,5 9,6 - 10,1
Exports of goods and service 14,9 8,5 - 9,0
Imports of goods and services 17,3 9,8 - 10,3
Table 5.2Economic Growth in Indonesia according to Type
*) Bank Indonesia projections
Source: World Economic Outlook, IMF, January 2011
Figure 5.1.Flow of Direct Investment
Million USD
Direct Investment Portfolio Investment Financial Transaction
8.000
6.000
2004
Q1
2005
Q1 Q3
2006
Q1 Q3
2007
Q1 Q3
2008
Q1 Q3
2009
Q1 Q3
2010
Q1 Q3
4.000
2.000
-2.000
-4.000
-6.000
-8.000
-
Figure 5.2Growth Projections for several Countries
0
2
4
6
8
GlobalGrowth
AdvancedEconomies
Emerging and DevelopingEconomies
ASEAN+5
2010 2011 2012
Looking ahead, however, the Indonesian economy
will be beset by a number of risks. Externally, risks will stem
from the lacklustre economic recovery process with fears of
a further slowdown. Global economic growth is projected
at around 4.5% in 2011, which is down compared to
that posted in 2010 at 5.0% (Figure 5.2). Such conditions
89
Chapter 5. Financial System Stability Challenges and Prospects
as well as the ability of emerging market countries to
mitigate the adverse effects of foreign capital inflows. A
number of austerity programs in countries affected by fiscal
difficulties, particularly advanced countries, will encourage
weak global demand. Ultimately, this will not only affect
export-oriented economies but all economies across the
globe. Improvements rely heavily upon government
strategy to drive domestic demand as well as steer foreign
trade towards countries that have already recovered. In this
context conditions in ASEAN+3 are sufficiently conducive,
with interregional trade between member countries
performing well.
Improved economic conditions in a number of
advanced countries will slightly ease the influx of foreign
capital flows to emerging market countries. This will
intensify asset price volatility on global financial markets
and precipitate a new equilibrium. However, the interest
rate differential between established countries and
emerging market countries will remain the principal reason
why global investors favour emerging markets. Therefore,
global investors are expected to become more cautious and
selective and choose countries with solid fundamentals,
particularly when there is the threat of risk from an asset
price bubble. Clearly, this represents an opportunity for
emerging market countries to enhance their economic
fundamentals. Eventually, investors will prefer longer-term
investments, hence, reducing the risk of sudden reversal.
Domestic economic fundamentals are stable and
growing, while the economies of advance countries are
tending to slow due to the pass-through effect of the
sovereign debt crisis in Europe as well as Quantitative
Easing II introduced by the Federal Reserve and the fiscal
stimuli in Japan, therefore, foreign capital inflows are
expected to persist in 2011. The continuation of foreign
capital inflows to Indonesia will spur further rupiah
appreciation in 2011. Rupiah appreciation reduces the
cost of imported goods and services, which will ease
inflationary pressures on the import side. This will also
reduce the costs of production for companies that utilise
imported raw materials and increase the opportunity for
such firms to boost production, consequently, improving
their financial performance and debt repayment ability,
which lowers corporate non-performing loans. In addition,
the persistence of foreign capital inflows will contribute
to increased liquidity in the economy and larger foreign
exchange reserves in 2011. Taking the factors mentioned
into consideration, coupled with fiscal sustainability and
a relatively stable political situation, sovereign risk in
Indonesia is expected to ease, thus, achieving investment
grade in 2011.
However, a number of issues require close monitoring.
The prevalence of short-term foreign capital inflows could
raise the JSX composite and other financial assets like
government bonds. Rapid capital market growth as a
result of the inundation of short-term foreign capital flows
could distort fundamental prices and real prices, thereby
creating a stock market bubble, which would increase
potential pressures on inflation from the perspective of
asset prices. Moreover, short-term foreign capital inflows
are vulnerable to a sudden reversal, which has the potential
to compound liquidity risk and undermine the exchange
rate, in turn increasing potential sources of financial system
instability.
Inflationary pressures stemming from future non-
subsidised fuel price hikes and restrictions on their use
could potentially raise bank lending rates, which will
ultimately amplify bank credit risk through an increase in
non-performing loans.
Furthermore, higher lending rates will stifle credit
growth and encourage bank disintermediation. A
subsequent potential decline in credit allocation,
particularly to the agricultural and plantation sectors due
to unpredictable climate conditions, would also heighten
credit risk and, eventually, banks would tend to avoid these

90
Chapter 5. Financial System Stability Challenges and Prospects
sectors. However, government policy as stipulated in Act
No. 41/2001 regarding farmland protection represents an
opportunity for banks to finance the agricultural sector.
This law ensures synergy between the central and local
governments when implementing regulations linked
to farmland protection, for which the government has
allocated Rp3.4 trillion.
5.3 FINANCIAL SYSTEM STABILITY OUTLOOK
Considering the factors elaborated upon in this
chapter, the outlook for the financial system in 2011 is
expected to remain positive. Impressive bank performance
during 2010 in terms of resilience and financing will be
bolstered in 2011 by increasingly conducive macroeconomic
prospects, which will expand the intermediation function
in the following year. Improved macro conditions and
better risk management will raise asset quality, particularly
credit, as indicated by a downward NPL trend. The positive
economic outlook is also expected to contribute to less
stock market volatility and a lower bond yield, thereby
underpinning financial system stability with a financial
stability index projected in the range of 1.36-1.83 at the
end of semester-I 2011 and a baseline of 1.60 (Figure
5.2).

91
Article 1. Risk Behaviour in the Monetary Policy TransmissionMechanism in Indonesia
Article

92
Article 1. Risk Behaviour in the Monetary Policy TransmissionMechanism in Indonesia
This page intentionally blank

93
Article 1. Risk Behaviour in the Monetary Policy TransmissionMechanism in Indonesia
Risk Behaviour in the Monetary Policy TransmissionMechanism in Indonesia
Article 1
Doni Satria*, Solikin M. Juhro**
This study explores interconnections between risk behaviour in the financial sector, particularly the banking
sector, with monetary policy stance. Referring to the modified model developed by Bernanke and Blinder (1988)
for analysing bank lending behaviour, we develop an empirical model to test the role of risk behaviour in the
monetary policy transmission mechanism. Vector Error Correction Model is applied to test the significance of
interaction between risk variables and monetary policy stance in the short-run dynamics of credit behaviour
around its long-run cointegration with real GDP. Some empirical results emerge from this preliminary study.
First, there are early indications that the risk-taking channel in the monetary policy transmission mechanism
exists in Indonesia during the analysis period. Second, risk variables and credit tend to move procyclically
while monetary policy stance is more a-cyclical. Third, the procyclical behaviour of credit and risk variables
reverses the effect of loose monetary policy stance, and there is an indication of asymmetric effect between
tight monetary policy and loose monetary policy in the Indonesian economy. These empirical findings bring
about policy recommendations for better understanding of risk behaviour in the banking sector, as well as
integration between monetary and financial sector policies.
JEL Code : E52, E58, Key word: Monetary Policy Transmission Mechanism, Monetary Policy Stance, Banking
Risk Behaviour, Risk Perception.
I. BACKGROUND
The effect of risk behaviour on the dynamics of the
financial sector is a common research topic raised these
days, particularly that relating to the efficacy of policy
response taken in the face of the global financial crisis
which struck in the middle of 2007. Several arguments
have emerged to observe basic contributing factors
behind the financial crisis, which became known as an
unprecedented crisis in terms of its depth and duration.
Taylor (2009) found that the crisis was caused by central
bank policy that tended to maintain excessively low interest
rates in response to prolonged low inflation prior to the
crisis. Taylor postulated that central banks in advanced
countries failed to calculate risk in the banking sector
as a reaction function to monetary policy, thus resulting
in an inappropriate nominal interest rate (too low). The
implications of this analysis indicate interaction between
monetary policy stance taken by the central bank and risk
in the financial sector, particularly the banking sector.
Meanwhile, Mishkin (2009) found that monetary policy
is potentially more effective during a crisis compared
* Teaching staff at the Faculty of Economics, Padang University.** Economic researcher at Bank Indonesia and postgraduate teaching staff at the Faculty of
Economics, University of Indonesia. The opinions expressed in this paper are those of the authors and do not represent the views of the institutions where they work
94
Article 1. Risk Behaviour in the Monetary Policy TransmissionMechanism in Indonesia
to normal conditions, hence providing a foundation for
macroeconomic risk management to confront the problem
of economic contraction during the crisis period.
These facts evidence a correlation between monetary
stability and financial sector stability. How monetary
authorities should respond and act in their monetary policy
can generally be understood, however, there is relatively
little debate among economists. Notwithstanding, how
monetary authorities should respond to problems that
emerge in the financial sector remains a hot topic of debate
among economists (Goodhart and Tsomocos, 2007). The
target of monetary policy for the monetary authority is
easy to accomplish if financial sector stability is maintained.
Conversely unstable macroeconomic fundamentals will
trigger shocks in the financial sector. The relationship
between monetary stability and financial sector stability
is ultimately a central issue in terms of observing
correlation between the policy taken, risk behaviour and
the duration of a financial crisis. Nier and Zicchino (2008)
found that bank credit supply is influenced by monetary
policy stance, which interacts with balance sheet stress,
transmitted through bank losses. The research concluded
that interaction between monetary policy stance and bank
losses is stronger during a crisis, with the assumption that
the magnitude of risk increases during an economic crisis.
This implies that risk in the financial sector interacts with
monetary policy stance. In the case of Canada, Li ad St-
Amant (2010) found that tight monetary policy (contractive)
has a stronger effect on output compared to expansive
monetary policy. Conversely, expansive monetary policy
has a stronger effect than contractive when escalating
financial pressures (risk) beset an economy.
Borio (2008) discovered the importance of analysing
the risk-taking channel in the monetary policy transmission
mechanism. This differs from the bank-lending channel
revealed by Bernanke and Blinder (1998) as well as
Bernanke and Gertler (1995) who found that monetary
policy works through bank reserves and, subsequently,
influences the supply of credit in an economy. The risk-
taking channel affects bank credit supply through the
banks’ decision to extend credit based on changes in bank
behaviour to confront credit risk. Adrian and Shin (2009)
found that the risk-taking channel also differs from the
financial accelerator concept posited by Bernanke and
Gertler (1999). In this context, the results of empirical
research provide evidence for the existence of the risk-
taking channel in monetary policy transmission1.
In the context of the Indonesian economy, in-depth
observations of the role played by risk factors in the
financial sector on the transmission mechanism have not
been undertaken. Goeltom et al. (2009) concluded that
based on empirical analysis, risk perception plays a role in
transmitting monetary policy in Indonesia. Based on the
conditions and complexities faced by Bank Indonesia in
terms of instituting monetary policy, this research identifies
the asymmetric effects of monetary policy. Asymmetry is
affected by financial sector behaviour that has a propensity
to be procyclical as well as the presence of the risk-taking
channel as proposed by Borio and Zhu (2008).
The explanation provided in this section does not
directly indicate interaction between monetary policy and
risk in the banking sector, which is transmitted to the real
economy though the supply of bank credit2. Indonesia, as
a country with a financial sector that has not developed as
rapidly as that found in more established countries, does
not have many alternative forms of investment financing
and, therefore, the role of the banking sector remains
dominant in the financial sector. Accordingly, a study
1 Refer to Gambacorta, 2009 and the References contained within.2 Bernanke and Blinder (1988) were the first to develop the credit channel in the monetary
policy transmission mechanism. Analyses of how bank credit supply is influenced by monetary policy have unearthed a variety of channels over the past two decades, which are regularly analysed by economists and represent an active research topic in the field of economics. Channels of monetary policy transmission through bank credit have been identified asthe liquidity channel (Diamond and Rajan, 2006), Bank Capital Channel (Van der Hauvel, 2007) and the Risk-taking channel (Borio, 2008 and Adrian and Shin, 2009). The three channels identified affect the real economy through changes in credit supply from the banking sector, which subsequently influences real expenditure, investment and consumption.

95
Article 1. Risk Behaviour in the Monetary Policy TransmissionMechanism in Indonesia
in to how bank risk impacts the Indonesian economy is,
therefore, pertinent and timely in the context of preserving
financial sector stability3.
This research strives to observe the relationship
between financial sector risk, particularly banking, and
monetary policy as well as the implications on the monetary
policy transmission mechanism to the real sector. Hitherto,
the majority of analyses on financial sector stability focuses
on identifying factors that determine financial sector risk
and institutional factors that determine risk profile in the
financial sector. Meanwhile, feedback from changes in risk
in the financial sector on the real economy has not been
thoroughly modelled (Tieman and Maechler, 2009). By
understanding the magnitude of influence of risk changes
in the financial sector, especially the banking sector and
the interaction between monetary policy and bank credit
supply, this research will provide an illustration about
the real effect of changes in risk and risk perception in
the banking sector as well as monetary policy (which is a
reflection of risk-taking behaviour by economic players)
on the economy.
An empirical specification model is built in this
research using the modification model developed by
Tieman and Maechler (2009). In general, the empirical
model will test the impact of risk behaviour, reflected by
risk perception (risk aversion) of economic players and the
level of risk in the banking industry, which interacts with
monetary policy stance and bank credit supply. The most
salient conclusions drawn from this research are that risk
perception and the level of risk in the banking sector play
a significant role in transmitting monetary policy through
the credit channel in Indonesia. In this context, as risk
perception and the level of risk in the banking sector
interacts with monetary policy stance they trigger a reversal
in the impact of loose monetary policy. Oppositely, a tight
monetary policy stance taken to contract the economy
through the bank-lending channel becomes less effective
as it interacts with the variables of risk perception and level
of risk in the financial sector.
This paper is divided into five sections. After the
Background, the second section briefly presents the
theory associated with credit market equilibrium and
the role of risk variables as push and pull factors of bank
credit expansion. The third section explains the research
methodology; in particular in terms of developing the
empirical model estimated using the vector error correction
model (ECM). The subsequent section presents the results
of the estimations and analyses on the impact of risk and
monetary policy stance on the dynamics of bank-lending
performance. The final section includes several conclusions
and policy implications.
II. THEORY
Most economists believe that banks or financial
intermediaries play a significant role in the economy
through the transmission of monetary policy. However,
consensus has not been reached on the way in which banks
transmit monetary policy to the real economy. Therefore,
this remains a crucial research topic in the field of monetary
economics. The preliminary approach in explaining the role
of banks in transmitting monetary policy is believed to be
through the money channel or liabilities of the banking
sector on the economy (money view). Subsequently, ideas
developed further that banks influence the economy
through the credit channel (Bernanke and Blinder 1988). It
is speculated that monetary policy can affect the economy,
in terms of the credit channel, through credit supply
from the banking sector or the bank lending channel,
and through the balance sheet where monetary policy
influences the ability of firms to obtain external sources of
financing, otherwise knows as the balance sheet channel
(Bernanke and Gertler 1995).3 Existing literature indicates a tendency to analyse factors that affect bank risk, disregarding
how bank risk influences the real economy in terms of transmission through the supply of bank credit.
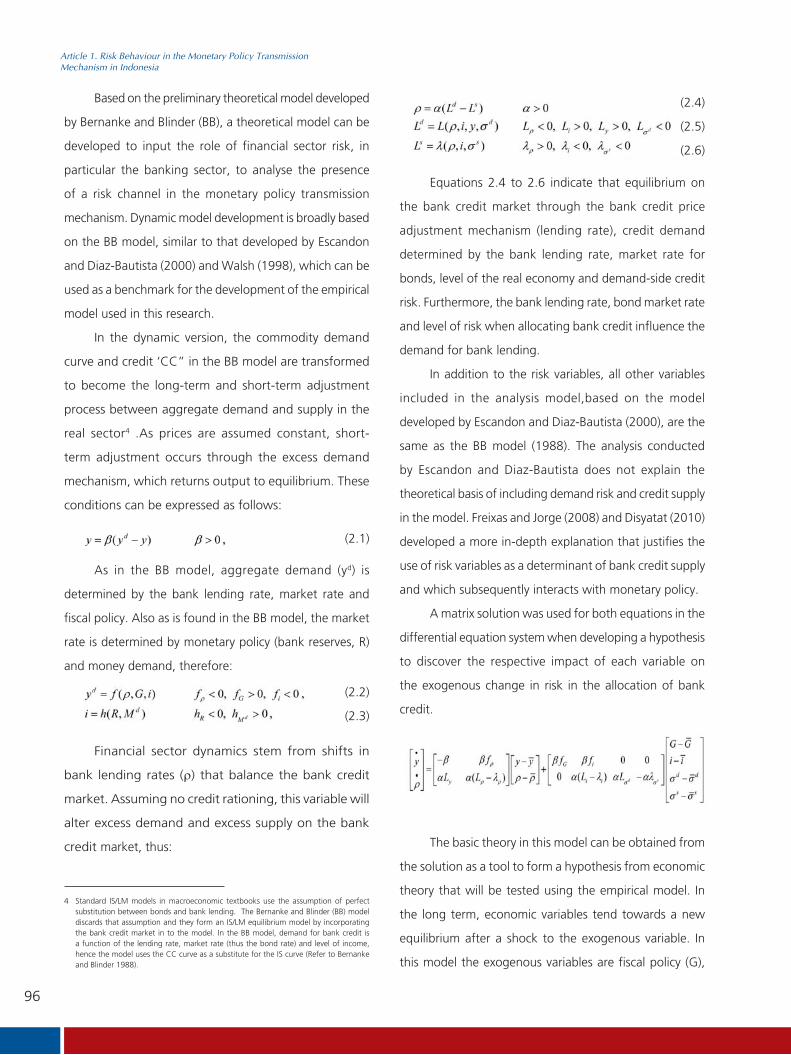
96
Article 1. Risk Behaviour in the Monetary Policy TransmissionMechanism in Indonesia
Based on the preliminary theoretical model developed
by Bernanke and Blinder (BB), a theoretical model can be
developed to input the role of financial sector risk, in
particular the banking sector, to analyse the presence
of a risk channel in the monetary policy transmission
mechanism. Dynamic model development is broadly based
on the BB model, similar to that developed by Escandon
and Diaz-Bautista (2000) and Walsh (1998), which can be
used as a benchmark for the development of the empirical
model used in this research.
In the dynamic version, the commodity demand
curve and credit ‘CC” in the BB model are transformed
to become the long-term and short-term adjustment
process between aggregate demand and supply in the
real sector4 .As prices are assumed constant, short-
term adjustment occurs through the excess demand
mechanism, which returns output to equilibrium. These
conditions can be expressed as follows:
4 Standard IS/LM models in macroeconomic textbooks use the assumption of perfect substitution between bonds and bank lending. The Bernanke and Blinder (BB) model discards that assumption and they form an IS/LM equilibrium model by incorporating the bank credit market in to the model. In the BB model, demand for bank credit is a function of the lending rate, market rate (thus the bond rate) and level of income, hence the model uses the CC curve as a substitute for the IS curve (Refer to Bernanke and Blinder 1988).
As in the BB model, aggregate demand (yd) is
determined by the bank lending rate, market rate and
fiscal policy. Also as is found in the BB model, the market
rate is determined by monetary policy (bank reserves, R)
and money demand, therefore:
(2.1)
(2.2)
(2.3)
Equations 2.4 to 2.6 indicate that equilibrium on
the bank credit market through the bank credit price
adjustment mechanism (lending rate), credit demand
determined by the bank lending rate, market rate for
bonds, level of the real economy and demand-side credit
risk. Furthermore, the bank lending rate, bond market rate
and level of risk when allocating bank credit influence the
demand for bank lending.
In addition to the risk variables, all other variables
included in the analysis model,based on the model
developed by Escandon and Diaz-Bautista (2000), are the
same as the BB model (1988). The analysis conducted
by Escandon and Diaz-Bautista does not explain the
theoretical basis of including demand risk and credit supply
in the model. Freixas and Jorge (2008) and Disyatat (2010)
developed a more in-depth explanation that justifies the
use of risk variables as a determinant of bank credit supply
and which subsequently interacts with monetary policy.
A matrix solution was used for both equations in the
differential equation system when developing a hypothesis
to discover the respective impact of each variable on
the exogenous change in risk in the allocation of bank
credit.
(2.4)
(2.5)
(2.6)
The basic theory in this model can be obtained from
the solution as a tool to form a hypothesis from economic
theory that will be tested using the empirical model. In
the long term, economic variables tend towards a new
equilibrium after a shock to the exogenous variable. In
this model the exogenous variables are fiscal policy (G),
Financial sector dynamics stem from shifts in
bank lending rates ( ) that balance the bank credit
market. Assuming no credit rationing, this variable will
alter excess demand and excess supply on the bank
credit market, thus:
97
Article 1. Risk Behaviour in the Monetary Policy TransmissionMechanism in Indonesia
monetary policy (P) and risk ( ). The partial impact of risk
can be written as follows:
conclusion drawn by these two models differs from the
preliminary conclusion found by Bernanke and Blinder
(1988). In the BB model, monetary policy determines the
amount of credit extended by banks through a decline
in deposits (and bank reserves) that can be accumulated
by the bank in order to allocate as credit to the business
community. Meanwhile, empirical facts in the economy
demonstrate that banks can use other sources of funds than
deposits (for instance through interbank loans), therefore,
the working mechanism in the two models in terms of
monetary policy to determine bank loans is through changes
in risk faced by the bank in terms of obtaining funds from
the interbank money market. Meanwhile, the inclusion of
deposits in the model developed by Disyatat (2010) was
attributable to inside money. The conclusion from this model
indicates that the role of bank lending in the transmission
of monetary policy is important in the economy despite
the expanding role of the non-bank financial sector as an
alternative source of investment funds.
III. METHODOLOGY
3.1. Real Impact of Bank Risk and Monetary
Policy on the Economy
Theoretical studies demonstrate that monetary policy
has a real impact on the economy through bank lending.
Furthermore, literature regarding the monetary policy
transmission mechanism indicates that the financial sector
affects the economy through the credit channel allocated
to the real sector. The results of theoretical studies evidence
a long-term relationship between bank lending and
the economy, which empirically indicates cointegration
between total real credit extended by the banking sector
and real economic production.
The implications of this theoretical model reveal that
there are short-term dynamics in risk change behaviour in
the supply of bank lending that interacts with monetary
policy. Such conditions determine shifts in bank lending,
Exogenous shocks stemming from changes in risk
from the supply and demand of bank credit are transmitted
through a shift in equilibrium on the bank credit market.
This has an important implication for the economy, namely
that if the risk faced by banks escalates, then supply-side
credit risk also increases, which raises the cost of bank
lending and lowers the level of economic production
(GDP or output) in the long term. Freixas and Jorge (2008)
developed a theoretical model of the monetary policy
transmission mechanism through risk using a partial
equilibrium approach on the interbank money market.
In general, the model explained that the monetary policy
instituted by a central bank determines the availability of
liquidity on the interbank money market, which forces
banks with liquidity shortfalls to ration credit offered
to their customers (credit rationing), thereby spurring
a production increase or decrease in the real sector.
Imperfect information on the interbank money market is a
source of risk and causes monetary policy to have a larger
impact compared to when perfect information is available.
This theoretical model provides justification for monetary
transmission through the bank-lending channel without
having to assume an absence of credit rationing on the
bank credit market. Therefore, the hypothesis obtained
based on the solution in the previous dynamic version of
the BB model is still valid in this research.
The risk model for the credit channel in the monetary
policy mechanism developed by Disyatat (2010) also drew
a relatively similar conclusion to that of Freixas and Jorge
(2008). In this model it was found that the risk mechanism
is a push and pull factor of bank lending expansion. The
(2.8)

98
Article 1. Risk Behaviour in the Monetary Policy TransmissionMechanism in Indonesia
thus, risk change behaviour on the supply side, at least in
the long term, has an impact on the economy through
changes in real credit allocated by the banking sector.
The empirical analysis conducted in this research uses two
indicators of risk behaviour in the banking sector. The
first provides a measurement for the level of risk aversion
of banking sector players in terms of asset management
with the assumption that they optimally allocate their
assets. The second indicator shows the level of risk in the
banking industry.
Accordingly, an econometric specification model can
be used to specify the error correction model as follows:
with the indicator of monetary policy stance. With the
theoretical assumption that long-run cointegration exists
between credit and GDP then Equation 3.1 is estimated
using VECM, as developed by Johansen5. The advantage
of using VECM is the possibility of observing the error
correction term in short-term dynamics of the two-way
interaction between credit and GDP in one model system.
Therefore, it is possible to reveal which credit variable is
weakly exogenous to GDP. If the estimation results show
that credit is weakly exogenous in the short-term dynamics
of GDP of the VECM mechanism used, then no feedback
is occurring from changes in credit to GDP.
To run estimations using Equation 3.1, variables
of bank risk and monetary policy stance are required. In
this research two risk indicators are used as independent
variables in Equation 3.1. The risk indicators used are bank
risk and risk perception by economic players in the banking
sector. Meanwhile, for the indicator of monetary policy
stance, the difference between the optimal interest rate
(in line with empirical calculations for Indonesia) and the
actual interest rate is used. If monetary policy stance is too
tight, then the actual interest rate will be higher than the
optimal rate and vice versa. If the actual rate is the same as
the optimal rate then monetary policy is neutral. Estimations
for the monetary policy rate utilise Taylor Monetary Policy
Rules, where the model and its variance are both used by
Bank Indonesia to analyse monetary policy in Indonesia.
3.2. Indicators of Risk Behaviour in the Banking
Sector
This research utilises two indicators of risk behaviour
in the banking sector. The first measures the risk aversion of
players in the banking sector in terms of asset management
assuming that their assets are optimally allocated. The
second indicator shows the level of risk in the banking
industry as a whole.
5 Refer to Enders, 2004, pages 362-366
i = 1, 2, 3 (investment credit, working capital
credit and consumption credit)
ii = 1, 2 (tight or loose monetary policy stance)
where:
Cred = real credit extended by banks at a rate equal
to the market rate (investment credit,working
capital credit and consumption credit)
GDP = real GDP
RisktA = Risk perception index of players in
thebanking sector
RisktDD = Level of risk in the banking sector
(distance to default)
StanceK = Monetary policy stance (tight or loose)
Equation 3.1 indicates that changes in bank lending
are determined in the long run by two stationer variables in
first difference, l(1), real bank credit with the real economy,
where the long-term speed (coefficient) of adjustment is
. In the short run, changes in credit are determined by
economic growth in the previous year, risk indicators in the
banking sector, and risk perception in the banking sector,
as well as interaction between bank risk and risk perception
(3.1)

99
Article 1. Risk Behaviour in the Monetary Policy TransmissionMechanism in Indonesia
3.2.1. Risk Perception in the Banking Sector
The indicator of risk perception in the banking
sector explains bank behaviour in terms of evaluating
risk based on asset allocation theory to minimise risk
with the assumption that banks are risk averse. With the
assumption that banks allocate portfolio in the form of
risk-free assets amounting to 1-y, then the return on total
portfolio is as follows (Bodie et al):
DD shows the amount of standard deviation from the
average value required by the ratio of asset market value
to liabilities for a firm to experience default (Vassalou and
Xing, 2004). Banks are a type of firm that adhere to strict
regulations and have an assets and liabilities structure
that differs from regular firms. A bank will generally have
much larger liabilities than any other firm because they
manage funds from the general public. Consequently,
the calculations used to find DDof a bank also have to be
adjusted. The method developed by Vassalou and Xing
(2004) was used for firms in general and not for banks
in particular, therefore, the formula utilised to calculate
DD was modified in the same way as that developed by
(Chan-Lau and Sy, 2007) as follows:
Therefore, the coefficient of bank behaviour in
determining risk aversion is as follows:
(3.2)
Where, A = coefficient of bank risk aversion, E(rp)-rf
= risk premium (difference between expected return on
risk portfolio and return on risk-free assets), y* = total
bank assets exposed to risk (excluding SBI and SUN), 2p
= variance of return on assets.
3.2.2. Risk in the Banking Sector
In addition to using risk perception indicators, other
risk indicators are also incorporated in this research, namely
an indicator of risk in the banking sector. If the market
value of a company is lower than the value of its liabilities
then it is declared bankrupt/default. By using this concept
the risk of a firm (including banks) can be known by
measuring the difference between the ratio of asset market
value to liabilities compared to default conditions.
(3.3)
(3.4)
PCAR = Minimum CAR (capital adequacy ratio)
pursuant to banking regulations
(3.5)
Where:
DDt = distance to capital
(3.6)
Where, rc = return on total portfolio, rp = return on
risk portfolio, rf = return on risk-free portfolio, thus the
solution to optimal asset allocation for the bank is:
Figure 3.1Indicators of Banking Sector Behaviour
(percentage, normalised)

100
Article 1. Risk Behaviour in the Monetary Policy TransmissionMechanism in Indonesia
Figure 3.1 shows the calculation results of risk
behaviour. It can be seen that the risk behaviour of
economic players (indicator of risk aversion) and level of
risk in the banking sector (distance to default – inverse)
tends to be low when the risk premium, estimated using
the difference between the lending rate and policy rate
(1-month SBI), is high and vice verse. This indicates that
economic players in the banking sector will respond to
monetary policy tightening by allocating funds to relatively
low-risk portfolio. Meanwhile, when the monetary policy
rate is low, a high risk premium can alleviate the effects
of their high risk perception on their fund allocation
behaviour.
3.3. Monetary Policy Stance
An indicator of monetary policy stance is required in
order to solve equation 3.1. Monetary policy stance, used
as an explanatory variable for the dynamics of short-run
bank lending in this research, is the difference between the
actual policy rate (SBI rate) and estimations using monetary
policy rules. Following Juhro (2009), this research uses data
for monetary policy stance obtained based on estimation
results against empirical equations (Taylor Rules). The
results are modified using classic Taylor Rules, otherwise
known as interest smoothing rules as follows (Clarida,
Galli, Gertler (1997) in Juhro (2009):
This research uses a dummy variable as a reflection of tight
or loose monetary policy stance. In this context, a +/-25
bps difference in the actual rate indicates normal monetary
policy stance, anything outside of this range will indicate
a tight/loose stance.
IV.ANALYSIS
Prior to estimating the empirical model and testing
the hypothesis, data feasibility is tested in the specified
model in order to test the presence and impact of risk
in the monetary policy transmission mechanism through
the bank-lending channel in Indonesia. The tests used
include unit root tests and co-integration tests to discover
long-run equilibrium/correlation between credit and GDP.
Data stationary and co-integration tests found that credit
and GDP are co-integrated, hence analysis using the error
correction model (ECM) is used. The co-integration tests
showed that all three types of credit (consumption, working
capital and investment) have a long-run correlation with
the economy. Therefore, there is a long-term relationship
between bank lending and economic performance.
Analysis results also justify the impact of bank lending on
the economy.
The next phase included an analysis of the relationship
between risk and the short-term dynamics of bank lending.
Then, the presence of a risk channel in the monetary
policy transmission mechanism in Indonesia is analysed
based on the interaction between monetary policy stance
and risk. Results of the Vector Error Correction model
(VECM) indicated that credit is not a weakly exogenous
variable to GDP, thus producing feedback from changes
in credit on GDP dynamics. Congruent with the focus of
this research, empirical findings of endogeneity were only
found on credit, which is examined in greater depth and
presented in Table 4.1.
(3.7)
Where, it is the optimal monetary policy rate, t is
actual inflation, t* is the inflation target, yt is actual GDP
and yt* is potential GDP calculated using the Hodrick-
Prescot Filter.
The recommended interest rate by the Taylor rule
can subsequently be calculated based on the estimation
results. Several economists use a different form as a
measure of policy stance also based on the Taylor rules.

101
Article 1. Risk Behaviour in the Monetary Policy TransmissionMechanism in Indonesia
IndependentVariable
Investment Credit[Dlog(CR_INV)]
Working Capital Credit[Dlog(CR_MK)]
Consumption Credit[Dlog(CR_KON)]
ECT ( ) -0.082055 -0.293294 -0.091933 [-3.91674]*** [-5.08903]*** [-2.94792]***
Stance+ -0.002575 -0.013970 0.012844 [-0.21983] [-1.20977] [ 1.02093]
Stance- 0.028623 0.030163 0.023414 [ 1.99965]** [ 2.43362]*** [ 1.75151]*
DD -0.001531 -0.002443 -0.000502 [-1.16145] [-1.96550]* [-0.38484]
A 0.002996 0.024078 0.025623 [ 0.24890] [ 1.89834]* [ 2.08346]**
Stance+ *A -0.006795 -0.023959 -0.030875 [-0.52006] [-1.76619]* [-2.39797]***
Stance- *A -0.032355 -0.043594 -0.050885 [-1.91202]* [-2.45359] *** [-3.18399]***
Stance+ *DD 0.001991 0.004052 0.000966 [ 1.25322] [ 2.57037]*** [ 0.58502]
Stance- *DD -0.003427 -0.003327 -0.001984 [-1.86661]* [-2.03648]** [-1.09173]
R2 0.406906 0.523314 0.339990F-test 3.185347*** 5.097017*** 2.391671***
Table 4.1Estimation Results for the Three Types of Credit Extended by Banks
Source: results of processed data
Note: Values in parenthesis are t-value, *** significant at 1%, ** significant at 5%, *significant at 10%, Stance+=Tight monetary policy, Stance-=Loose
monetary policy
From Table 4.1 it can be observed that all short-term
adjustment coefficients are negative and head towards
long-term equilibrium (ECT/Error Correction Term) in
the three credit models, which are significant at a 99%
confidence level. These results show that the model
used was adequately stable and in accordance with the
theoretical foundations. Furthermore, the ECT coefficient
for short-term log GDP was positive and significant.
Meanwhile, in terms of goodness of fit of the models,
the determination coefficients returned values of between
0.33 and 0.52, which is sufficient for a model using first
difference data. The results of testing the F-statistics also
demonstrated that all equations were significant at the
99% confidence level.
4.1. Impact of Risk Behaviour on the Short-Run
Dynamics of Credit
Results of the partial impact analysis of risk behaviour
on the short-term dynamics of credit are presented in Table
4.2. The results indicate that loose monetary policy leads
to significant impacts from risk perception in the banking
sector (A) and risk in the banking sector (DD) on short-
term the dynamics of banking loans (excluding variable
A on working capital credit). Tight monetary policy only
significantly determines the variable of risk in the banking
sector on working capital credit. These results confirm that
in the short term the variables of risk perception and risk
in the banking sector significantly determine the dynamics
of bank lending in Indonesia.

102
Article 1. Risk Behaviour in the Monetary Policy TransmissionMechanism in Indonesia
The level of risk in the banking sector (which
interacts with loose monetary policy stance) is negative
and significant, denoting that expansive monetary policy
coupled with less risk in the banking sector (DD increases)
will reduce the percentage of bank credit growth for
all three types of loan, ceteris paribus. The implication
of this empirical findings conflicts with the theoretical
analysis conducted in this research. This phenomenon
requires additional testing for a satisfactory explanation.
A temporary explanation is that the interaction of risk in
the banking sector, which is procyclical (+), with monetary
policy that is countercyclical (-) reverses the positive impact
of lower risk in the banking sector on credit growth.
The preliminary argument for such conditions is as
follows. First is an anomaly in the Indonesian banking
industry where although national banks tend to be
inefficient and suffer high risk they continue to enjoy high
margin. Second is the issue of persistent excess liquidity
and the procyclical nature of credit allocated by the
banking sector (Bank Indonesia, 2010). A loose monetary
policy stance (forward-looking) is a signal for banks of a
sluggish economy. Therefore, economic players in the
banking sector tend away from expansion loans but retain
liquidity in the form of risk-free portfolio. Third are the
empirical findings of competitive behaviour in the banking
industry in Indonesia (Ariefianto, 2010). This research
found that banks with a high non-performing loans (NPL)
ratio tend to expand their credit when DD is low (risk is
high) in order to bring down their NPL ratio.
With the exception of working capital credit, the
level of risk in the banking sector was not significant
on the dynamics of short-term bank lending when
monetary policy is tight. The explanation for this is that
countercyclical monetary policy indicates a boom economy
when policy stance is tight, while risk perception and the
level of risk in the banking sector tend to be low when
an economy is booming. Consequently, a higher risk
Tight MonetaryPolicy Stance
Errorstandard
t-count
Tight MonetaryPolicy Stance
Errorstandard
t-count
The coefficient of risk perception in the banking
sector is negative and significant for two types of
credit (investment and consumption). Economically,
when interacting with loose monetary policy stance, an
increasing perception of risk in the banking sector reduces
the percentage of credit allocated ceteris paribus. This
implies that it is necessary for policymakers to understand
the direction of risk perception in the banking sector
when implementing expansive monetary policy because
an increase in risk perception will negate or reverse the
effect of the policy taken through a decline in credit
expansion.
Table 4.2Impact of Risk Behaviour on the Short-Term
Dynamics of Credit
Source: results of processed data
Note: *** significant at 1%, ** significant at 5%, *significant at 10%
-0.003799 0.00526 -0.72224
0.000119 0.00568 0.0205951
-0.005252 0.00504 -1.04026
0.00046 0.00098 0.469388
-0.00243 0.00105 -2.32667**
0.000464 0.0093 0.498925
-0.029359 0.01212 -2.42236***
-0.019516 0.01322 -1.47625
-0.025262 0.0119 -2.12286**
-0.00496 0.00118 -4.20169***
-0.005770 0.0012 -4.80833***
-0.00249 0.00098 -2.53673***

103
Article 1. Risk Behaviour in the Monetary Policy TransmissionMechanism in Indonesia
perception of economic players and a mounting level of
risk in the banking sector do not determine the short-run
dynamics of bank lending under favourable economic
conditions. This implies that the affect of risk behaviour
is non-linear when monetary policy is tight or that risk
behaviour will only determine the short-term dynamics of
bank lending when exceeding a specific threshold (Li and
St-Amant, 2010). Further research is required to explain
this phenomenon.
Regarding the dynamics of working capital credit,
the impact of risk in the banking sector is significant,
however, risk perception is not influential when monetary
policy stance is loose or tight. This is possible because
working capital credit represents a long-term relationship
between the bank and its customers. Therefore, there is a
banking relationship in the case of working capital credit
that causes the banks’ perception of risk concerning their
customers to not greatly determine the allocation of bank
lending. Conversely, the level of risk in the banking sector
does determine the short-term dynamics of working capital
credit. This shows that the supply of credit declines when
an economy is languid (loose monetary policy), while
higher bank lending rates will reduce demand for working
capital credit when monetary policy is tight.
Holistically, based on the findings and empirical
analyses, the level of risk in the banking sector (which
interacts with monetary policy stance) has a significant
impact on the short-term dynamics of bank lending when
monetary policy is loose. Conversely, when monetary
policy is tight the level of risk in the banking sector is only
significant for working capital credit. The risk perception
of players in the banking sector is not significant for all
types of credit when policy stance is tight, but becomes
significant for investment credit and consumption credit
when policy stance is tight.
4.2. Impact of Monetary Policy Stance on the
Short-Run Dynamics of Credit
Based on the results presented in Table 4.1, the
impact of monetary policy stance on risk behaviour is as
follows:
InvestmentCredit
CapitalCredit
ConsumptionCredit
0.004322 -0.00789 -0.00548(0.00824) (0.00879) (0.00816)
-0.01786 -0.02453 -0.02876(0.00945)* (0.00993)*** (0.00929)***
The results presented in Table 4.1 show that only a
loose monetary policy stance has a significant impact on
the short-term dynamics of bank lending. Based on the
sign of coefficient, the impact of loose monetary stance on
bank lending is lower compared to when monetary policy
is not loose. Investment credit growth when monetary
policy is loose is 0.01786 (1.786%) lower than average
growth when the stance is not loose. This denotes that
if average credit growth is 10% when monetary policy
is not loose, then average investment credit growth will
be 8.214% when loose monetary policy is instituted.
Furthermore, average working capital credit growth is
2.453% lower when monetary policy stance is loose.
Finally, average consumption credit growth is 2.876%
lower when monetary policy stance is loose.
The implication of these empirical findings for
the impact of tight monetary policy is that monetary
contraction upon interaction with the two variables of risk
Source:
results of processed data. *** significant at 1%, ** significant at 5%,
*significant at 10%
Note:
Values in parenthesis are the standard error for the impact of monetary policy
stance (using the average value of the sample period for each risk variable).
Table 4.1Impact of Monetary Policy Stance
on the Short-Term Dynamics of Credit

104
Article 1. Risk Behaviour in the Monetary Policy TransmissionMechanism in Indonesia
behaviour does not determine the short-term dynamics
of bank lending for the three types of bank loans tested.
These empirical findings are not congruent with the
theory that the impact of monetary policy interacting
with risk behaviour will significantly determine the short-
run dynamics of bank lending. The findings indicate that
risk eliminates the role of monetary policy in economic
contraction. Contractive monetary policy is introduced
when an economy is booming, while risk perception
and risk in the banking sector are concomitantly easing.
Consequently, tighter monetary policy, which should
restrict economic growth through the credit channel,
becomes ineffective. These findings indicate that although
a central bank will institute tight monetary policy, it is
not tight enough to contract the economy through a
slowdown in bank lending.
Furthermore, when loose monetary policy interacts
with risk behaviour it has a negative and significant
impact on all three types of bank loan. These empirical
findings are in harmony with the theory that evidences a
significant impact from loose monetary policy interacting
with risk behaviour, the coefficient of which is negative.
This indicates that expansive monetary policy can catalyse
bank lending. During expansive monetary policy (designed
to stimulate a sluggish economy), risk perception and
risk in the banking sector tend to be high (on average
for the analysis period). Consequently, looser monetary
policy does not stimulate economic growth through
increased bank lending, in fact the opposite is true and
bank lending tends to diminish, which leads to economic
contraction. These findings show that when a central bank
takes loose monetary policy in an attempt to drive the
economy, risk perception actual increases in the banking
sector. Therefore, banks set a high risk premium. In other
words, lending rate rigidity occurs when an expansionary
monetary policy stance is taken. Another explanation is the
propensity of players in the banking sector to see loose
monetary policy as an indication of sluggish economic
growth. Consequently, banks become more selective in
their allocation of assets to the credit sector.
V. CONCLUSION AND IMPLICATIONS
The most salient conclusion that can be drawn from
this research is that the risk perception of economic players,
along with the level of risk in the banking industry, plays
a significant role in monetary policy transmission through
the credit channel in Indonesia. The variables of risk
perception and level of risk in the banking industry trigger
a reversal in the desired impact of loose monetary policy.
A loose monetary policy stance is a signal to the banking
community of sluggish economic conditions. Conversely,
a tight monetary policy stance, taken to cool down the
economy through the bank-lending channel, is ineffective
upon interaction with the variables of risk perception and
risk level in the banking sector. This is possibly due to risk
behaviour that eliminates the role of monetary policy in
terms of contracting the economy.
Indirectly, this finding also implies that in the case
of Indonesia, a loose monetary policy stance causes
the banking sector to become more risk averse, which
contradicts the findings of Taylor (2009) in the case of
advanced countries, where the banking sectors in such
countries became risk takers when looser monetary policy
was implemented. Analysis also showed indications of
asymmetric effects from loose and tight policy stance
upon interaction with risk variables. When monetary
policy is tight, risk behaviour tends to eliminate its impact
on short-term bank lending. Oppositely, when monetary
policy stance is loose, a decline in the central bank’s policy
rate does not precipitate a corresponding decline in bank
lending rates that would catalyse bank lending growth,
as an effect of risk behaviour that tends to be high when
economic conditions are sluggish.

105
Article 1. Risk Behaviour in the Monetary Policy TransmissionMechanism in Indonesia
A number of basic policy implications can be drawn
from this research that demonstrate a requirement for
integration between monetary and macroprudential policy
in the financial sector, as follows. First, Bank Indonesia
is required, as the monetary and banking authority, to
calculate the role of risk perception in the banking sector
when formulating monetary and financial system policy in
Indonesia. This research can form the basis of calculating
risk behaviour in the financial sector in terms of the
reaction function of monetary policy, which is broadly
expected to overcome economic (pro)cyclicality. Second,
in the context of deepening and expanding the role of the
financial market, Bank Indonesia must conducted more in-
depth studies into the impact of financial sector dynamics
on the efficacy of monetary policy. Third, the relevant
authorities are required to strengthen integrated policy
coordination in terms of instituting monetary policy in line
with close interaction between the dynamics (stability) of
the monetary sector and financial sector.
Finally, it is important to note that this research is
preliminary. Analytically, this research has only uncovered
evidence of the risk channel in the monetary policy
transmission mechanism in Indonesia, at least when
monetary policy is loose. Excluding this fact, black-box
characteristics persist, considering how the process and
channel of monetary policy transmission through the risk
channel can still not be fully explained by these findings.
Therefore, looking ahead more in-depth research is
required to observe the black box phenomenon. In
addition, the methodology could be further refined, in
particular by using alternative indicators of risk behaviour,
disaggregating the assessments of risk behaviour indicators
referring to individual banks and bank groups, as well as
observing the possible presence of feedback mechanisms
between the two variables of risk used. These refinements
are expected to answer a number of outstanding empirical
questions that remain unanswered by this research.
REFERENSI
Adrian, Tobias, and Hyun Song Shin. (2009), Prices and
Quantities in the Monetary Policy Transmission
Mechanism, International Journal of Central Banking,
5(4).
Ariefianto, Doddy M, (2010), Perilaku Persaingan Industri
Perbankan di Indonesia Pasca Krisis (Analisa Dengan
Pendekatan Teori Oligopoli dan Ekonometrika Panel
Data Pada Periode 2002 - 2008), Desertasi Doktor
Bidang Ilmu Ekonomi. Fakultas Ekonomi Universitas
Indonesia.
Bank Indonesia, (2010), Response Kebijakan Moneter
di Tengah Krisis Global, Laporan Perekonomian
Indonesia Tahun 2009, Bank Indonesia.
Bernanke, Ben. S, dan Alan S. Blinder (1988), Credit,
Money and Aggregate Demand, The American
Economic Review, Vol 78, no. 2. American Economic
Association.
Bernanke, Ben. S dan Mark Gertler (1995), Inside the Black
Box: The Credit Channel of Monetary Transmission
Mechanism, Journal of Economic Perspectives, Vol
9 No.4. American Economic Association.
Bernanke, Ben S, Mark Gertler dan Simon Gilchrist (1996),
The Financial Accelerator and Flight to Quality, The
Review of Economics and Statistics, Vol 78.
Bodie, Zvi, Alex Kane dan Alan J. Marcus (2009), Investment
8th Ed. Mc Graw-Hill International, Singapore.
Borio, Claudio dan Haibin Zhu (2008), Capital Regulation,
Risk Taking and Monetary Policy: A Missing Link in
the Transmission Mechanism?, BIS Working Paper
no 268. Bank for International Settlement, Basel –
Switzerland.
Chan-Lau, Jorge A, dan Amadou N.R. Sy (2007), Distance
to Default in Banking: A Bridge too Far?, Journal
of Banking Regulation, Vol 9 No. 1. Palgrave Mc
Milan.

106
Article 1. Risk Behaviour in the Monetary Policy TransmissionMechanism in Indonesia
Diamond, Douglas W, dan Raghuram G. Rajan, (2006),
Money in Theory of Banking, The American
Economic Review, Vol 96 No.1, American Economic
Association.
Diamond, Douglas W, dan Raghuram G. Rajan, (2001),
Liquidity Creation and Financial Fragility: A Theory of
Banking, The Journal of Political Economy, Vol. 109
No. 2. The University of Chicago Press.
Diamond, Douglas W, dan Raghuram G. Rajan, (2000), A
Theory of Bank Capital, The Journal of Finance Vol
55 No. 6, American Finance Association.
Disyatat, Piti (2010), Bank Lending Channel Revisited,
BIS Working Paper No. 297. BIS Monetary Policy
Department, Basel-Switzerland.
Enders, W., (2004), Applied Econometric Time Series, New
York: John Wiley & Sons
Escandon, Julio R, Alejandro Diaz-Bautista, (2000), A
Simple Dynamic Model of Credit and Aggregate
Demand, El Collegio De La Frontera Norte, Working
Paper No.18.
Freixas, Xavier dan Jose Jorge, (2008). The Role of
Interbank Market in Monetary Policy: A Model with
Rationing, The Journal of Money Credit and Banking,
September.
Gambacorta, Leonardo (2009), Monetary Policy and the
Risk Taking Channel, BIS Quarterly Review, Desember
2009. Bank for International Settlement, Basel.
Goeltom, Miranda. S, Solikin M. Juhro dan Firman Mochtar
(2009), Indonesian Monetary Policy Transmission
Mechanisms and the Role of Risk Perception, Research
Notes, Bank Indonesia, March.
Goodhart, C.A.E dan D.P. Tsomocs, (2007), Analisys
of Financial Stability, Bank of Canada Conference
“Developing a Framework to Asses Financial Stability”
Ottawa, Canada, 7-8 November.
Juhro, Solikin M. (2009), Telaah Policy Rules di Indonesia,
Research Notes, Bank Indonesia, Maret.
Mishkin, Frederick S. (2009), Is Monetary Policy Effective
During Financial Crisis?, NBER Working Paper No.
14678.
Merton, Robert C. (1974), On the Pricing of Corporate
Debt: the Risk Structure of Interest Rates, Journal of
Finance Vol. 29.
Nier, Erlend dan Lea Zicchino, (2008), Bank Losses,
Monetary Policy and Financial Stability-Evidence
From Interplay in Panel Data, IMF Working Paper
WP/08/232.
Li, Fuchun dan Pierre St-Amant (2010), Financial Stress,
Monetary Policy and Economic Activty, Bank of
Canada Working Paper 2010-12, May.
Taylor, John B. (2009), The Financial Crisis and Monetary
Response: An Empirical Analysis of What Went
Wrong, NBER Working Paper Series No. 14631.
Tieman, Alexander F, dan Andrea M Maechler, (2009), The
Real Effects of Financial Sector Risk, IMF Working
Paper WP/09/198, IMF Washington.
Van Den Heuvel, Skander J, (2007). The Bank Capital Channel
of Monetary Policy, Bank of Canada Conference
“Developing a Framework to Asses Financial Stability”
Ottawa, Canada, 7-8 November.
Vassalaou, Maria dan Yuhang Xing (2004), Default Risk
in Equity Return, The Journal of Finance, Vol 59 No,
2. April.
Wooldridge, Jeffery M. (2006), Introductory Ecoometrics: A
Modern Approach 3rd Ed. Thompson South-Western
Publishing. USA.
107
Article II. Towards Stronger ASEAN Financial System:A Proposal for Regional Financial Stability Framework
Article 2
Towards Stronger ASEAN Financial System:A Proposal for Regional Financial Stability Framework1
Cicilia A. Harun2, Elis Deriantino3
1. INTRODUCTION

108
Article II. Towards Stronger ASEAN Financial System:A Proposal for Regional Financial Stability Framework
2. EAST ASIAN FINANCIAL STRUCTURE AND
REGULATIONS

109
Article II. Towards Stronger ASEAN Financial System:A Proposal for Regional Financial Stability Framework
3. SOME ISSUES IN SYSTEMIC RISK
SURVEILLANCE: LESSONS FROM THE EURO ZONE
CASE
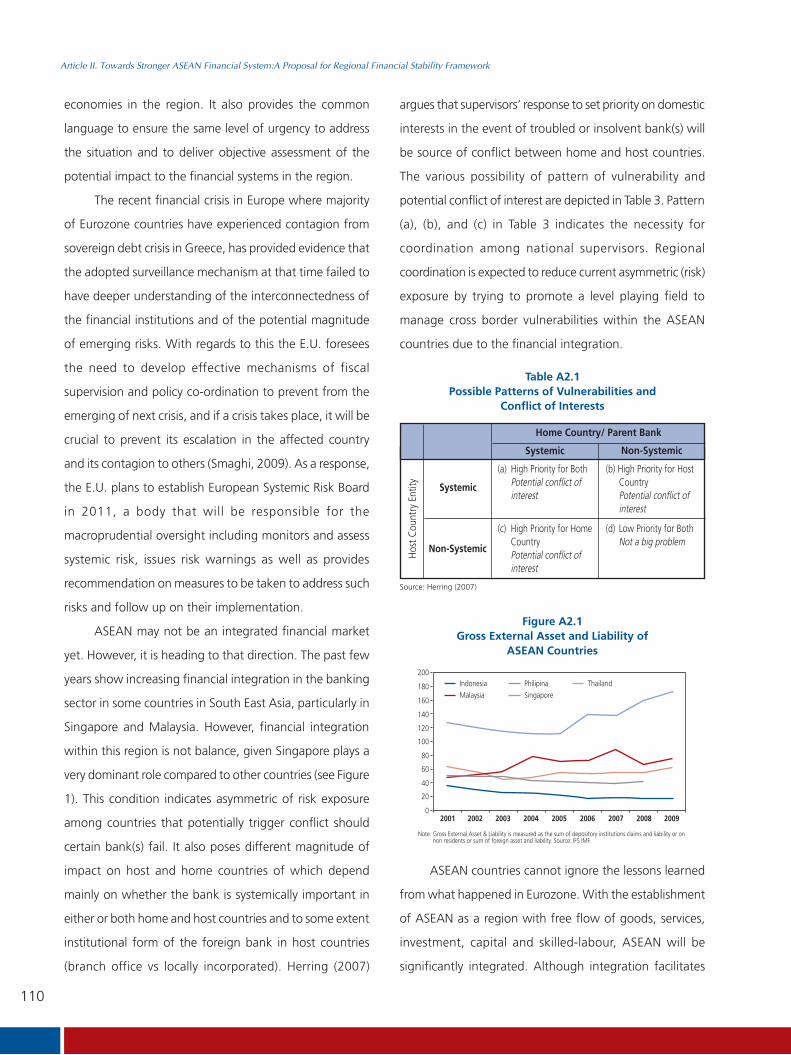
110
Article II. Towards Stronger ASEAN Financial System:A Proposal for Regional Financial Stability Framework
Table A2.1Possible Patterns of Vulnerabilities and
Conflict of Interests
Home Country/ Parent Bank
Systemic
Non-Systemic
Systemic Non-Systemic
Figure A2.1Gross External Asset and Liability of
ASEAN Countries
2001 2002 2003 2004 2005 2006 2007 2008 2009
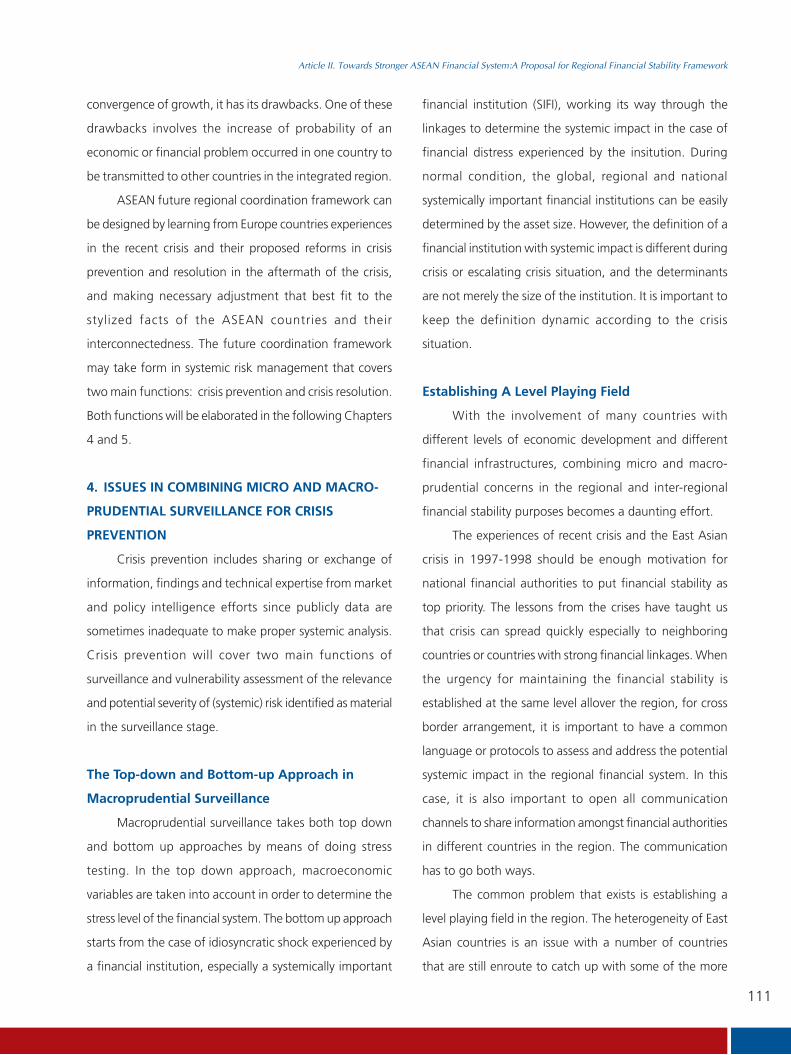
111
Article II. Towards Stronger ASEAN Financial System:A Proposal for Regional Financial Stability Framework
4. ISSUES IN COMBINING MICRO AND MACRO-
PRUDENTIAL SURVEILLANCE FOR CRISIS
PREVENTION
The Top-down and Bottom-up Approach in
Macroprudential Surveillance
Establishing A Level Playing Field

112
Article II. Towards Stronger ASEAN Financial System:A Proposal for Regional Financial Stability Framework
5. THE REGIONAL FINANCIAL SAFETY NET
(CRISIS RESOLUTION FRAMEWORK)

113
Article II. Towards Stronger ASEAN Financial System:A Proposal for Regional Financial Stability Framework
Table A2.2General and Specific Burden Sharing in Cross Border
Crisis Resolution
General Burden Sharing Specific Burden Sharing
6. CONCLUSION: THE PROPOSAL FOR ASEAN
FINANCIAL STABILITY FRAMEWORK

114
Article II. Towards Stronger ASEAN Financial System:A Proposal for Regional Financial Stability Framework
Figure A2.2Proposed ASEAN Financial Stability Framework
Sound and Credible RegionalFinancial System
Strong
National
Financial
Stability
Framework
Inclusive
Periodical
Regional
Financial
Stability
Report
Cooperative
College of
Supervisory
and
Regulatory
Authorities
Reliable
Regional
Financial
Safety Net
Sound and reliable regional network of payment systems and securities exchanges
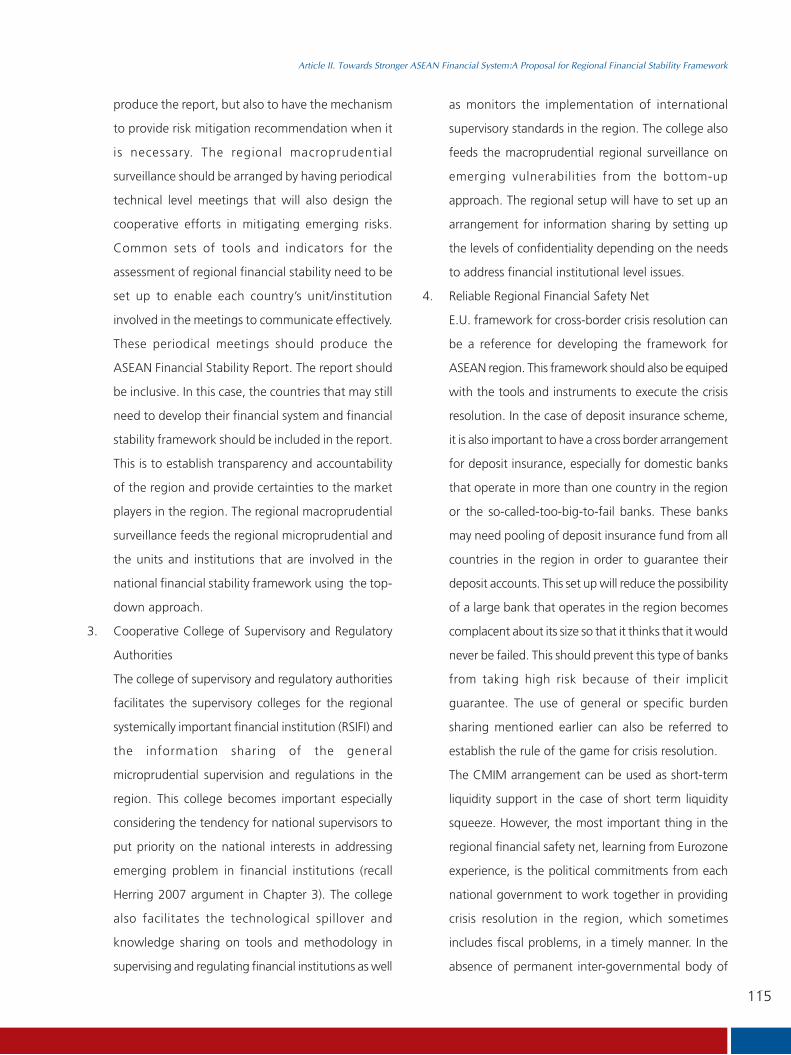
115
Article II. Towards Stronger ASEAN Financial System:A Proposal for Regional Financial Stability Framework

116
Article II. Towards Stronger ASEAN Financial System:A Proposal for Regional Financial Stability Framework
References

117
Article II. Towards Stronger ASEAN Financial System:A Proposal for Regional Financial Stability Framework

This page intentionally blank
DIRECTOR
Wimboh Santoso Suhaedi Linda Maulidina
COORDINATOR & EDITOR
Dwityapoetra S. Besar Iman Gunadi
WRITERS
Agusman, Ardiansyah, Anto Prabowo, Ratih A. Sekaryuni, Pungky Purnomo, Imansyah, Wini
Purwanti, Boyke Wibowo Suadi, Henry R. Hamid, Bambang Arianto, Ita Rulina, Iman
Gunadi, Wahyu Hidayat, Noviati, Januar Hafidz, Cicilia A. Harun, Sagita Rachmanira,
Reska Prasetya, Heny Sulistyaningsih, Mestika Widantri, Elis Deriantino, Hero Wonida,
Primitiva Febriarti, M. Ardian, Herriman Budi Subangun, Khairani Syafitri, Advis Budiman,
Harris DP, Louvti Sidabalok, dan Dyta Tri Utami
COMPILATOR, LAYOUT & PRODUCTION
Dwityapoetra S. Besar Primitiva Febriarti Ratih Maharani
CONTRIBUTOR
Directorate of Banking Supervision 1
Directorate of Banking Supervision 2
Directorate of Banking Supervision 3
Directorate of Sharia Banking
Directorate of Credit, Rural Bank Supervision and SMEs
Directorate of Bank Licensing and Banking Information
Directorate of Accounting and Payment Systems
Directorate of Reserve Management
Directorate of Economic Reseach and Monetary Policy
DATA SUPPORT
Suharso I Made Yogi
Financial Stability Review
No. 16, March 2011