Financial Stability Review - European Central Bank · Financial Stability Review, May 2019 –...
158
Financial Stability Review May 2019
Transcript of Financial Stability Review - European Central Bank · Financial Stability Review, May 2019 –...

Financial Stability Review
May 2019

Financial Stability Review, May 2019 – Contents
1
Contents
Foreword 3
Overview 4
1 Macro-financial and credit environment 17
1.1 Weaker near-term euro area growth outlook coupled with persistent downside risks 17
Box 1 Assessing the risks to the euro area financial sector from a no-deal Brexit – update following the extension of the UK’s membership of the EU 22
1.2 Fragile public debt sustainability 23
Box 2 Policy uncertainty and the risk of market repricing 27
1.3 Euro area households resilient, but some country-level vulnerabilities prevail 30
1.4 Legacy imbalances leave firms vulnerable to weaker growth 34
Box 3 Do corporate fundamentals explain differences in sectoral NPLs? 38
1.5 Sustained momentum in euro area property markets 41
2 Financial markets 45
2.1 Financial markets proved sensitive to concerns about global economic growth 45
2.2 A weaker economic outlook could trigger further corrections in asset prices 50
Box 4 CLOs: a financial stability perspective 54
3 Euro area banking sector 60
3.1 Prospects of banks addressing weak profitability may be diminished by a worsening cyclical outlook 60
Box 5 Recent developments in banks’ price-to-book ratios and their determinants 66
Box 6 Recent developments in and the outlook for global bank ratings 81
Box 7 Gauging systemic risks from hard-to-value assets in euro area banks’ balance sheets 86

Financial Stability Review, May 2019 – Contents
2
3.2 Evaluating the resilience of the euro area banking sector through scenario analysis 91
4 Non-bank financial sector 97
4.1 Non-bank financial institutions continued increasing their financing of the euro area economy 97
Box 8 The Eurosystem’s asset purchase programme, risk-taking and portfolio rebalancing 101
4.2 Increased volatility of fund flows highlights the risks that investment funds could pose to liquidity in financial markets 107
4.3 Insurers’ investment income is expected to deteriorate further in the low-yield and low-growth environment 111
Box 9 Insurers’ investment in alternative assets 116
Special features 120
A Climate change and financial stability 120
B Economic shocks and contagion in the euro area banking sector: a new micro-structural approach 134
C Macroprudential space and current policy trade-offs in the euro area 146

Financial Stability Review, May 2019 – Foreword
3
Foreword
The Financial Stability Review (FSR) assesses developments relevant for financial stability, including identifying and prioritising the main sources of systemic risk and vulnerabilities for the euro area financial system – comprising intermediaries, markets and market infrastructures. It does so to promote awareness of these systemic risks among policymakers, the financial industry and the public at large, with the ultimate goal of promoting financial stability.
Financial stability can be defined as a condition in which the financial system – which comprises financial intermediaries, markets and market infrastructures – is capable of withstanding shocks and the unravelling of financial imbalances. This mitigates the likelihood of disruptions in the financial intermediation process that are systemic, that is, severe enough to trigger a material contraction of real economic activity.
The FSR also plays an important role in relation to the ECB’s microprudential and macroprudential competences. By providing a financial system-wide assessment of risks and vulnerabilities, the Review provides key input to the ECB’s macroprudential policy analysis. Such a euro area system-wide dimension is an important complement to microprudential banking supervision, which is more focused on the soundness of individual institutions. While the ECB’s roles in the macroprudential and microprudential domains have a predominant banking sector focus, the FSR focuses on the risks and vulnerabilities of the financial system at large, including – in addition to banks – activities involving non-bank financial intermediaries, financial markets and market infrastructures.
In addition to its usual overview of current developments relevant for euro area financial stability, this Review includes three special features aimed at deepening the ECB’s financial stability analysis and broadening the basis for macroprudential policymaking. The first special feature examines financial stability risks stemming from climate change, in particular examining the exposure of financial institutions to climate risk-sensitive assets. The second sets out new ways to model the risk of contagion spreading through the euro area banking sector. The third considers how macroprudential policy responses might take account of changes in macroeconomic conditions. The Review has been prepared with the involvement of the ESCB Financial Stability Committee, which assists the decision-making bodies of the ECB in the fulfilment of their tasks.
Luis de Guindos Vice-President of the European Central Bank

Financial Stability Review, May 2019 – Overview
4
Overview
The euro area financial stability environment has become more challenging. Risks to economic growth are tilted to the downside and remain prominent. Volatility in financial markets around the turn of the year illustrated risks that could arise from global and euro area growth surprises. Persistent downside risks to growth reinforce the need to strengthen the balance sheets of highly indebted firms and governments, as well as a euro area banking sector beset by weak profitability.
The financial stability environment has become more challenging over the last six months
Resilienceof the euro area financial system
Improved capital adequacy of banks
14.3%Aggregate CET1 ratio doubled over the last decade
Adequate capital positionsunder an adverse scenario
3.4 p.p.Capital depletion under a scenario of
higher credit and funding risk
Looking ahead, risks remain:
Disorderlyincrease
in risk premia
Global corporate bond spreads at pre-crisis
lows and high US equity valuations
Debtsustainability
concerns
High sovereign indebtedness, alongside
a doubling of lower-rated corporate debt
over the past five years
Hampered bank intermediation
capacity
A crowded euro area banking sector
confronted with high operating costs
Increased risk-taking in the
non-bank financial sector
Search for yield, liquidity risk and leverage could
amplify the wider financial cycle
Prominent downside risks to euro area economic
growth
Return of search for yield after the December 2018
market correction
Euro area banks struggling with low return on equity
around 6% last year
Financial Stability Review, May 2019 – Overview
5
Risks to economic growth remain tilted to the downside
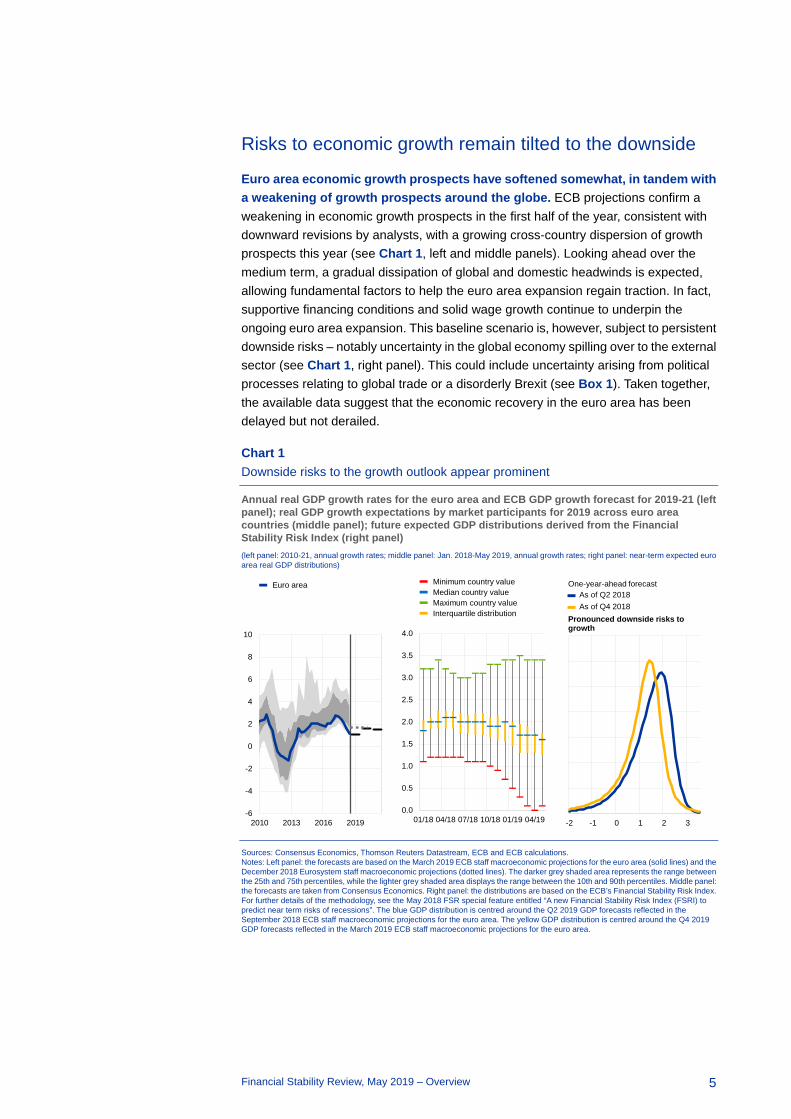
Euro area economic growth prospects have softened somewhat, in tandem with a weakening of growth prospects around the globe. ECB projections confirm a weakening in economic growth prospects in the first half of the year, consistent with downward revisions by analysts, with a growing cross-country dispersion of growth prospects this year (see Chart 1, left and middle panels). Looking ahead over the medium term, a gradual dissipation of global and domestic headwinds is expected, allowing fundamental factors to help the euro area expansion regain traction. In fact, supportive financing conditions and solid wage growth continue to underpin the ongoing euro area expansion. This baseline scenario is, however, subject to persistent downside risks – notably uncertainty in the global economy spilling over to the external sector (see Chart 1, right panel). This could include uncertainty arising from political processes relating to global trade or a disorderly Brexit (see Box 1). Taken together, the available data suggest that the economic recovery in the euro area has been delayed but not derailed.
Chart 1 Downside risks to the growth outlook appear prominent
Annual real GDP growth rates for the euro area and ECB GDP growth forecast for 2019-21 (left panel); real GDP growth expectations by market participants for 2019 across euro area countries (middle panel); future expected GDP distributions derived from the Financial Stability Risk Index (right panel) (left panel: 2010-21, annual growth rates; middle panel: Jan. 2018-May 2019, annual growth rates; right panel: near-term expected euro area real GDP distributions)
Sources: Consensus Economics, Thomson Reuters Datastream, ECB and ECB calculations. Notes: Left panel: the forecasts are based on the March 2019 ECB staff macroeconomic projections for the euro area (solid lines) and the December 2018 Eurosystem staff macroeconomic projections (dotted lines). The darker grey shaded area represents the range between the 25th and 75th percentiles, while the lighter grey shaded area displays the range between the 10th and 90th percentiles. Middle panel: the forecasts are taken from Consensus Economics. Right panel: the distributions are based on the ECB’s Financial Stability Risk Index. For further details of the methodology, see the May 2018 FSR special feature entitled “A new Financial Stability Risk Index (FSRI) to predict near term risks of recessions”. The blue GDP distribution is centred around the Q2 2019 GDP forecasts reflected in the September 2018 ECB staff macroeconomic projections for the euro area. The yellow GDP distribution is centred around the Q4 2019 GDP forecasts reflected in the March 2019 ECB staff macroeconomic projections for the euro area.
-6
-4
-2
0
2
4
6
8
10
2010 2013 2016 2019
Euro area
-2 -1 0 1 2 3
One-year-ahead forecastAs of Q2 2018As of Q4 2018
Pronounced downside risks to growth
0.0
0.5
1.0
1.5
2.0
2.5
3.0
3.5
4.0
01/18 04/18 07/18 10/18 01/19 04/19
Minimum country valueMedian country valueMaximum country valueInterquartile distribution

Financial Stability Review, May 2019 – Overview
6
A materialisation of downside risks to the growth outlook would intensify public debt sustainability challenges
A prolonged period of low growth may unearth debt sustainability concerns. Although the aggregate stock of public debt in the euro area has fallen somewhat since the peak of 2014 (standing at around 87% of GDP in 2018), the stock has continued to increase in some of the highly indebted countries. Should downside risks to growth materialise, financing costs for vulnerable sovereigns are likely to increase and may unearth debt sustainability concerns. In addition to the high level of debt and large fiscal deficits, some countries could face rollover risks if market participants reassess sovereign risk (see Chart 2, right panel). A sound medium-term approach to public finances, as expected under the Stability and Growth Pact, is key to containing public financing costs, which would support debt sustainability.
Chart 2 Country-specific debt sustainability concerns remain present
Composite indicator of systemic stress in sovereign bond markets (left panel); average interest rate-growth differential for 2019-20 versus total debt servicing needs over the next two years (right panel) (left panel: Jan. 2007-Apr. 2019; right panel: percentage of GDP, the size of the bubbles represents the degree of political instability based on the World Bank’s Worldwide Governance Indicators)
Sources: European Commission (AMECO database), ECB (Government Finance Statistics), World Bank and ECB calculations. Notes: Left panel: the SovCISS shown is available for the euro area as a whole and for 11 euro area countries. The methodology of the SovCISS is described in Garcia-de-Andoain, C. and Kremer, M., “Beyond spreads: measuring sovereign market stress in the euro area”, Working Paper Series, No 2185, ECB, October 2018. Right panel: data on government debt service over the next two years only reflect existing maturing securities (principal and interest). The snowball effect refers to the difference between sovereign funding costs and expected GDP.
Recently, stress in euro area sovereign bond markets has been limited and country-specific. Most sovereign bond spreads relative to risk-free rates have been broadly stable since November 2018. Upward pressure on sovereign spreads stemming from the weakening growth outlook has been counterbalanced by the continued accommodative monetary policy of the ECB. The composite indicator of systemic stress in euro area sovereign bond markets (SovCISS) suggests that financial markets see no imminent debt sustainability concerns for the euro area as a whole (see Chart 2, left panel). However, country dispersion remains high.
0.0
0.2
0.4
0.6
0.8
1.0
2007 2009 2011 2013 2015 2017 2019
Publication of previous FSR
Euro area medianMinimum-maximum country rangeInterquartile range across euro area countries
AT
BECYDE
ES
EE
FI
FR
GR
IE
IT
LU
LT
LV
MT
NL
PT
SK
SI
EA
-5
0
5
10
15
20
25
30
35
40
-3 -2.5 -2 -1.5 -1 -0.5 0 0.5 1 1.5 2 2.5Tota
l deb
t ser
vici
ng n
eeds
ove
r the
nex
t tw
o ye
ars
Expected average snowball effect for 2019-20

Financial Stability Review, May 2019 – Overview
7
Renewed market concerns in sovereign bond markets could potentially have repercussions for the financial system and broader economy. A sharp increase in sovereign bond spreads could have an adverse impact on banks, insurance companies and other financial institutions with elevated levels of sovereign bond exposure (through the mark-to-market impact on banks’ capital and income statements and higher market-based funding costs) (see Chart 3, left panel). While banks with larger domestic sovereign exposures do not seem to face closer credit default swap (CDS) spread correlations with their sovereign than their peers with smaller exposures (see Chart 3, right panel), it is likely that all domestic exposures would be affected by the deterioration in macroeconomic conditions triggered by sovereign stress. To alleviate some of these vulnerabilities, banks and other financial firms with high domestic exposures are encouraged to increase the geographical diversification of their assets.
Chart 3 Some euro area banks might benefit from diversifying beyond domestic markets
Euro area banks’ exposure to the domestic sovereign (left panel); correlations between bank and sovereign CDS spreads for banks with low and high sovereign bond holdings (right panel) (left panel: Q4 2018, percentages; right panel: Jan. 2008-Mar. 2019, mean, 10th and 90th percentiles and interquartile ranges)
Sources: ECB supervisory data, ECB balance sheet item data and ECB calculations. Notes: Left panel: sample consists of euro area significant institutions at the highest level of consolidation. The exposures cover sovereign bonds and loans to sovereigns fulfilling the requirement of the counterparty being part of the general government sector, i.e. central governments, state or regional governments, and local governments, including administrative bodies and non-commercial undertakings, but excluding public companies and private companies held by these administrations that have a commercial activity; social security funds; and international organisations, such as institutions of the European Union, the International Monetary Fund and the Bank for International Settlements (Articles 112 and 147 of the Capital Requirements Regulation). Deposits with central banks are excluded. Right panel: sample consists of euro area monetary financial institutions (unconsolidated data). The low/high holdings refer to below and above-median holdings in the sample.
Signs of vulnerability in corporate credit markets
The low interest rate environment of recent years has contributed to a build-up of vulnerabilities in some segments of the euro area corporate sector. Generally, low corporate interest payment burdens, high liquidity buffers and a relatively diversified financing structure alleviate near-term financial stability risks for the euro area corporate sector. But the favourable financing conditions in most advanced economies have also allowed firms with weaker balance sheets to increase their leverage. For example, the share of issuance by firms rated one notch above
0
2
4
6
8
10
12
LU SK EE LT FI LV AT IE ES NL
DE FR BE MT IT GR SI PT CY
Domestic sovereign exposure (% of total assets)Median across countries
0
0.1
0.2
0.3
0.4
0.5
0.6
0.7
High holdings Low holdings
Mean

Financial Stability Review, May 2019 – Overview
8
non-investment-grade has increased rapidly across the globe and the euro area BBB markets have doubled in size over the past five years (see Chart 4, left and middle panels). This trend partly reflects a diversification of firms’ financing sources. In fact, market-based funding sources have gained in importance in recent years, thereby improving the resilience of corporate financing to shocks stemming from the banking sector. Expected default rates have increased slightly in recent quarters, but remain low overall (see Chart 4, right panel). A sharp deterioration of the growth outlook could lead to a turn in the global credit cycle. There is a particular risk that companies on the edge of the investment-grade spectrum may face refinancing challenges if they were to be downgraded to the high-yield segment.
Chart 4 The size of the lower-rated non-financial corporate bond market has increased, as expected default rates remain low
Size of the euro area and the US non-financial corporate bond markets (left panel); euro area and US non-financial BBB-rated corporate debt (middle panel); expected default rates for European and US non-financial corporates (right panel) (left panel: April 2019, € trillions; middle panel: Jan. 2007-Apr. 2019, € trillions; right panel: Jan. 1992-Apr. 2019, annual percentages)
Sources: Bloomberg, Barclays Live, Moody’s KMV and ECB calculations. Notes: IG refers to investment-grade bonds and HY to high-yield bonds. The outstanding amounts in the left and middle panels refer to bonds denominated in euro for the euro area and US dollars for the United States.
Risk-taking is particularly pronounced in higher risk segments, such as the leveraged loan markets. Weak underwriting standards have become commonplace in the US and European leveraged loan markets (see Chapter 2). This trend entails two broad risks. First, it may keep very weak firms alive for longer. Second, deteriorating underwriting standards may also generate lower future recoveries (compared with the past) in the event of defaults. That said, in the euro area, the share of leveraged debt issued by firms (the sum of leveraged loans and high-yield bonds) is around 8% (net of inter-company loans and trade credit), which is not particularly high.
0.0
0.5
1.0
1.5
2.0
2.5
3.0
3.5
4.0
IG BBB HY IG BBB HY
Euro area United States
US corporate bond markets three times larger than in the euro area
0.0
0.2
0.4
0.6
0.8
1.0
1.2
1.4
1.6
1.8
2.0
2007 2010 2013 2016 2019
Euro areaUnited States
Triple-B debt building up ...
0
1
2
3
4
5
6
1992 1997 2002 2007 2012 2017
Euro areaUnited States
... but expected default rates are still relatively low

Financial Stability Review, May 2019 – Overview
9
Search for yield, liquidity risk and leverage in the non-bank financial sector could amplify the wider financial cycle
Investment funds appear to be the sector most directly exposed to corporate risk. In search of higher yields, euro area funds and insurers have increased their exposures to BBB-rated and high-yield bonds over the last five years (see Chapter 4). Accordingly, BBB bonds now represent a large and increasing part of non-banks’ holdings of non-financial corporate bonds, i.e. 40% for insurance corporations and pension funds and 35% for investment funds as at end-2018, compared with 33% and 31% as at end-2013, respectively. Furthermore, euro area asset managers and investment funds are among the main holders of low-rated collateralised loan obligations (see Box 4). In the event of an economic downturn or a sudden correction in risk premia, these often highly leveraged companies could face difficulties in servicing their debt, with possible downgrades to high-yield bonds. This may, in turn, amplify the effects of the downturn through higher borrowing costs and default rates.
A growing role for euro area non-banks in real economy financing went hand in hand with an increase in risk exposure and a growing financial market footprint of these firms. A shift of real economy financing away from banks towards market-based funding has continued. While this helps diversify the funding sources for the real economy, two risks result. First, much of the implied financing activity has been concentrated in the lower part of the credit quality spectrum, amid high indebtedness in some segments of the corporate and government sectors. Second, non-banks may amplify the cyclical underpricing of risk as they search for yield, potentially also taking on more leverage and liquidity transformation. Should these risks unwind in a disorderly manner, this could lead to a drying-up of funding flows and affect the funding conditions of the real economy more broadly.
Potential for asset price corrections and an unwinding of the considerable investment fund inflows over the last decade
Greater economic and policy uncertainty has contributed to bouts of high volatility in financial markets. In December last year, global stock markets and the riskier parts of the corporate bond markets sold off sharply after a prolonged period of rising asset prices. Concerns about the economic cycle and – in some cases – high valuations triggered the corrections. While the December turmoil was orderly and without immediate widespread consequences, the episode illustrated that investor sentiment can prove unpredictable. In the first four months of 2019 market sentiment improved and the financial assets affected by the turmoil recovered most or all of the earlier losses. The greater risk appetite in financial markets was partly attributed to central bank communication assuring market participants of a continued accommodative stance. More recently, concerns about escalating trade sanctions between the United States and China once again prompted declines in equity and corporate bond prices, as risk premia increased.

Financial Stability Review, May 2019 – Overview
10
Chart 5 Compressed corporate bond spreads amid fragile liquidity conditions and volatile investment flows
US and euro area BBB spread (left panel); bid-ask spreads of euro area investment-grade and high-yield non-financial corporate bonds (middle panel); net flows into equity and sovereign bond funds as a percentage of assets under management (right panel) (left panel: Jan. 2017-May 2019, basis points; middle panel: Jan. 2018-May 2019, percentage of mid-price; right panel: Jan. 2018-May 2019, percentages, historical distributions since 2008)
Sources: Bloomberg, Bank of America Merrill Lynch, iBoxx, Thomson Reuters Datastream, EPFR and ECB calculations. Note: Left panel: the dashed lines show the long-term averages since January 2002.
High valuations in some asset classes may trigger future market corrections. The favourable market sentiment in early 2019 highlighted an increasing divergence between financial markets and the deteriorating economic growth prospects. For some asset classes, prices seem detached from their underlying fundamentals. For example, based on the cyclically adjusted price/earnings ratio, US equity prices look stretched and may be subject to further adjustment. Furthermore, compressed corporate bond spreads in some advanced economies leave room for rapid corrections (see Chart 5, left panel).
Low market liquidity and unpredictable investor behaviour could amplify any further volatility in markets. The December turmoil showed that market liquidity can dry up quickly in periods of stress. In the euro area corporate bond markets, liquidity conditions remain fragile despite the recovery in bond prices in 2019 (see Chart 5, middle panel). Furthermore, rapid portfolio reallocations could augment future asset price corrections. During the December turmoil, portfolio shifts from equity funds and riskier corporate bond funds to government bond funds were unusually large compared with similar episodes in the past (see Chart 5, right panel).
A sudden and abrupt repricing of financial assets could trigger fund outflows, possibly resulting in forced asset sales amplifying stress in less liquid markets. Overall, the investment fund sector seems to have coped well with outflows during the high volatility episode in December 2018. At the same time, liquidity and credit risks are still high in some parts of the sector and pockets of high leverage may build up in the alternative investment fund sector (see Chapter 4). A sudden and abrupt repricing
-1.0
-0.5
0.0
0.5
1.0
1.5
2.0
01/18 07/18 01/19
Global equity fundsGlobal sovereign bond fundsHistorical distribution since 2008Historical distribution since 2008
0
50
100
150
200
250
300
01/17 07/17 01/18 07/18 01/19
United StatesEuro areaAverage United StatesAverage euro area
0.2
0.4
0.6
0.8
1.0
1.2
01/18 05/18 09/18 01/19 05/19
Investment-gradeHigh-yield

Financial Stability Review, May 2019 – Overview
11
of risk could lead to forced asset sales. Such sales have the potential to amplify the original shock to asset prices in less liquid markets.
Property prices could correct if downside risks to growth were to materialise
Real estate prices in the euro area have continued to rise despite the more challenging macroeconomic outlook. House prices in the euro area grew by 4.2% in 2018, contributing to signs of mild overvaluation for the euro area as a whole. Moreover, the post-crisis decline in household indebtedness appears to have slowed down significantly.
In commercial real estate markets, price and transaction volume trends also remain strong, with signs of stretched valuations in particular in prime segments. However, the price and transaction volume dynamics decelerated somewhat in recent quarters compared with the peak levels observed in 2016 and 2017. The high share of non-euro area transaction inflows contributes to the vulnerability of commercial real estate markets. A potential change in global financial conditions resulting in a relative shift of returns in euro area and non-euro area markets might result in outflows from commercial real estate by international investors, which have played a crucial role in driving market activity in recent years.
Structural profitability challenges for the euro area banking sector
The prospect of weaker economic growth has weighed further on structurally weak profitability expectations for euro area banks. The return on equity for euro area banks stood at around 6% in 2018, broadly unchanged from a year earlier (see Chart 6, left panel). Profitability continues to fall short of the returns required by investors for the majority of euro area banks. The cost of equity for most of the largest listed European banks is estimated to lie in the range 8-10%.1 Consistent with a situation in which the cost of equity is higher than the return on equity, most euro area banks are trading at price-to-book ratios that are lower than those of their international peers. The low growth and interest rate environment could further dent profitability stemming from the maturity transformation business – not least as retail household deposit interest rates tend to be bound at zero.2 That said, subdued bank profitability mainly stems from structural challenges in the form of low cost-efficiency, limited revenue diversification and high stocks of legacy assets in some jurisdictions. Near-term profitability forecasts provided by market analysts have been revised down in recent quarters, which can probably be attributed to the slowdown in economic growth (see Chapter 3). Furthermore, a comparison with other major economies reveals that euro area banks’ creditworthiness lags behind that of their main global competitors (see Chart 6, right panel).
1 See the European Banking Authority’s December 2018 Risk Assessment Questionnaire. 2 See also the 27 March speech by Luis de Guindos, Vice-President of the ECB, entitled “International
spillovers of monetary policy and financial stability concerns”.

Financial Stability Review, May 2019 – Overview
12
Chart 6 Subdued profitability outlook and creditworthiness of euro area banks persistently below that of their international peers
Euro area banks’ actual (2015-18) and expected (2019-21) return on equity (left panel); median ratings for large global listed banks (right panel) (left panel: 2015-21, annual percentages, median and interquartile range; right panel: Jan. 1995-Mar. 2019)
Sources: ECB, Standard & Poor's, Moody's, Fitch Group, Centre for Economic Policy Research (CEPR) and ECB calculations. Notes: Left panel: the sample consists of euro area significant institutions. Right panel: the grey shaded areas represent periods of euro area recessions as defined by the CEPR.
The lower profitability of euro area banks compared with their global peers partly stems from the weak growth environment and high non-performing loans (NPLs). GDP growth in the euro area has been lagging behind that in other major economies in recent years (see Chart 7).3 As a result, euro area banks have had to manage a large stock of NPLs. Over the past two years, however, euro area significant institutions’ aggregate NPL ratio has fallen by around 2 percentage points, to around 4% in late 2018. That said, the level of NPL ratios remains high in some countries and further efforts are needed to bring them down. Apart from stepping up loan loss provisions, a more active secondary market – including NPL transaction platforms – for impaired assets could support the process.
In order to return to sustainable profitability, euro area banks need to tackle a number of structural challenges (see Chart 7). Persistent low bank profitability is a concern from a financial stability perspective as it makes capital raising difficult in case of need and constrains internal capital generation, thus limiting the build-up of buffers against unexpected shocks. A significant part of the profitability gap vis-à-vis international peers is explained by lower cost-efficiency as measured by cost-to-income ratios. On the cost side, euro area banks compare unfavourably with many banks in other advanced economies on metrics such as the number of inhabitants per branch and staff costs. While there is no one-size-fits-all strategy for business model adjustment, one way for banks to improve cost-efficiency would be to speed up the digital transformation and shift away from physical branch networks. Governments may facilitate such a transformation by enhancing internet usage among the general public. On the revenue side, a further shift towards fee and 3 That said, euro area banks operating globally benefit from activities in other faster-growing economies.
1995 2000 2005 2010 2015
AAA
AA+
AA
AA-
A+
A
A-
BBB+
BBB
All banksEuro area banksUS banksJapanese, Scandinavian, Swiss and UK banks
0
2
4
6
8
10
2015 2016 2017 2018 2019 2020 2021
Forecasts 2019-21

Financial Stability Review, May 2019 – Overview
13
commission-based activities could pave the way to higher profitability. Such a shift may be particularly important for banks that rely heavily on net interest income which may come under further pressure if interest rates were to stay low for longer. In fact, there is evidence that banks which have performed better in recent years (in terms of profitability and cost-efficiency) have been able to diversify their income towards fee-based sources.
Chart 7 Structural challenges at the core of weak euro area banking sector profitability
Macro environment and NPLs (left panel); cost-to-income ratio and inhabitants per branch (middle panel); revenue diversification and internet usage (right panel) (left panel: average annual GDP growth in 2011-18 and NPL ratio as a percentage of total loans in 2018; middle panel: average cost-to-income ratio in 2014-18 and inhabitants per branch (right-hand scale); right panel: net fee and commission growth in 2009-18, internet usage as a percentage of the population, low and high usage across euro area countries (right-hand scale))
Sources: Standard & Poor’s, Bloomberg, IMF Financial Stability Indicators, IMF World Economic Outlook, Federal Deposit Insurance Corporation, national central banks, Eurostat, ECB and ECB calculations. Notes: Peers are a weighted average of large banks in Denmark, Norway, Sweden, the United Kingdom and the United States. Net fee and commission income for best-performing banks (Best) covers 13 significant institutions. For more details, see the November 2018 FSR special feature entitled “How can euro area banks reach sustainable profitability in the future?” Low internet usage countries: Cyprus, Greece, Italy, Portugal and Spain; high internet usage countries: Austria, Belgium, Estonia, Finland, France, Germany, Ireland, Latvia, Lithuania, Luxembourg, Malta and the Netherlands.
Some banks could face funding cost pressure if economic growth surprises on the downside. Market-based funding costs for euro area banks have remained volatile over the past six months. Spreads widened in the latter part of 2018, but tightened by similar magnitudes in the first months of 2019. Going forward, funding conditions may come under further pressure as a result of a sharper than expected cyclical downturn or a re-emergence of sovereign stress in countries that face debt sustainability challenges. Furthermore, rating downgrades are relatively likely for some banks which might also put further pressure on banks’ funding costs. The issuance of new bail-inable debt might also prove challenging for some banks, in particular for those with lower ratings. In addition, while the launch of the new series of targeted longer-term refinancing operations (TLTRO-III) should help banks refinance maturing TLTRO-II funds, some banks with weaker funding profiles need to develop plans for eventually replacing central bank funding with longer-term market funding, which could add to funding cost pressures for these banks in the medium term.
Regulatory capital ratios of euro area banks appear resilient to an adverse macroeconomic scenario. Euro area significant institutions’ aggregate Common
-10
10
30
50
70
90
110
EA Best Low High
Net fee andcommission
income
Internet usage
... and low revenue diversification. Digitalisation less advanced in some countries.
0
500
1,000
1,500
2,000
2,500
3,000
3,500
4,000
4,500
5,000
0
10
20
30
40
50
60
70
80
90
100
EA Peers EA Peers
Cost-to-income ratio
Inhabitantsper branch
... amid low cost-efficiency, partly attributed to overcapacity ...
0
1
2
3
4
5
6
7
8
EA Peers EA Peers
Annual GDPgrowth
NPL ratio
Euro area bank profitability dampened by low growth and high NPLs ...

Financial Stability Review, May 2019 – Overview
14
Equity Tier 1 (CET1) ratio remained broadly stable in the last three quarters of 2018 at around 14%. Over the last four years the aggregate CET1 ratio for euro area banks has increased by around 3 percentage points, driven by both an increase in CET1 capital and a reduction in risk-weighted assets. The results of a stress test based on a scenario with a prolonged period of low economic growth showed that despite the 340 basis point depletion of the CET1 capital ratio, banks still had 10.5% CET1 at the end of 2021. This suggests that the euro area banking sector as a whole should be resilient to a range of downside risks.
Policy responses to ensure resilience
Macroprudential policy action
A number of jurisdictions have activated or increased the countercyclical capital buffer. Over the last year a number of euro area countries have implemented macroprudential policy measures to address the build-up of systemic risk. In particular, the countercyclical capital buffer was activated or increased in France, Ireland, Lithuania, Luxembourg and Slovakia. Despite the economic headwinds, further increasing macroprudential policy space in some countries appears desirable to build bank resilience and insure against the materialisation of tail events. Nevertheless, macroprudential policy should take into account the risk of inducing procyclical effects, which is most relevant in countries where macroeconomic conditions are relatively weak and downside risks to the economic outlook are more prominent. Model-based analysis for the euro area as a whole suggests that procyclical effects from tighter macroprudential policy would be contained if the baseline macroeconomic projections were to materialise (see Special Feature C). However, procyclical effects could emerge in a scenario in which macroeconomic conditions deteriorate strongly and financial conditions tighten substantially.
A number of euro area countries have activated macroprudential instruments over the past years to address residential real estate-related vulnerabilities. Twelve countries (i.e. Austria, Cyprus, Estonia, Finland, Greece, Ireland, Latvia, Lithuania, the Netherlands, Portugal, Slovakia and Slovenia) have activated borrower-based instruments, such as loan-to-value (LTV), debt service-to-income (DSTI), loan-to-income (LTI), debt-to-income (DTI) and maturity limits, usually with the aims of strengthening household and bank resilience, as well as ensuring that lending standards remain appropriate. In addition, five countries (i.e. Belgium, Finland, Ireland, Luxembourg and Malta) have capital measures in place, such as risk weight floors or add-ons on mortgage loans, with the primary objective to increase banks’ resilience to shocks in the housing market. Since mid-November 2018 two countries have notified macroprudential policy changes to address residential real estate risks. Malta announced the introduction of binding limits on LTV and DSTI ratios and on maturity at loan origination (which will become effective in July 2019), while Slovenia extended the existing recommendation on LTV and DSTI limits on mortgage loans to

Financial Stability Review, May 2019 – Overview
15
consumer loans and complemented these limits with maturity requirements on consumer loans.
While macroprudential policies targeting residential real estate appear sufficient in most of the euro area countries, in some, the policy stance may need to be adjusted and further policy actions should be considered by national authorities. In particular, at the current stage of the cycle, it is important to monitor the quality of lending standards in order to ensure that new mortgage borrowers are resilient to income and interest rate shocks, and that banks are resilient to accumulated vulnerabilities in some of the euro area countries. To ensure the resilience of borrowers going forward, national authorities should require banks to test the debt servicing capacity of borrowers at loan origination against plausible income and interest rate scenarios. More generally, national authorities should provide (or enhance) public guidance to banks on prudent lending standards and consider, at least, indicative quantitative limits on key ratios (e.g. LTV, DTI and DSTI) if this is deemed necessary in order to address the identified risks.
Strengthening the regulatory framework
Regulatory initiatives at the international and EU levels are vital in establishing a sound and robust framework for financial institutions, markets and infrastructures. A key achievement in this regard was the political agreement reached on the EU banking reform package in February 2019. The package includes the revision of the Capital Requirements Regulation and Directive (CRR/CRD IV), which will implement the Basel capital and liquidity standards (Basel III) in EU law, including the leverage ratio, the net stable funding ratio and the revised market risk capital framework. The CRR/CRD IV review also introduces major changes in the macroprudential regulatory and policy framework by: (i) clearly delineating the responsibilities of micro- and macroprudential authorities; (ii) enhancing the flexibility of the toolkit; and (iii) streamlining the activation and coordination mechanisms. These changes will allow macroprudential authorities to address systemic risks in a more effective and targeted manner in the future. Furthermore, political agreement has also been reached on the revision of the ESRB Regulation, which will improve the transparency and functioning of the European Systemic Risk Board, while maintaining its proximity to the ECB.
Removing the remaining barriers to the banking union and making further progress towards a genuine capital markets union are key to facilitate a more complete pan-European market. In this regard, further steps need to be taken to foster a higher level of financial integration and to assess its potential impacts on financial stability. The development of a common institutional framework – including the establishment of a European deposit insurance scheme as the third pillar of the banking union – and reducing remaining obstacles to cross-border banking activities can help improve operating cost efficiency and revenue diversification of European banks.

Financial Stability Review, May 2019 – Overview
16
Strengthening the regulatory framework for non-bank financial intermediation is crucial in order to limit regulatory arbitrage and enhance the resilience of the broader financial system. Non-bank financial intermediation has been growing in the euro area, which has potential implications for financial stability and the financing of the real economy more broadly. The increasing size of non-banks has been accompanied by rising liquidity and credit risks in their investment portfolios. While existing rules in the EU provide a robust framework to address investor protection and entity-specific vulnerabilities, there are growing concerns over cyclical risks associated with increased liquidity transformation, risk-taking and leverage affecting the sector more broadly. Against this background, it is necessary to broaden the macroprudential toolkit and operationalise existing tools4 for non-bank financial intermediation – and for investment funds in particular – to address new and emerging risks from non-bank financial intermediation. At a global level, it is important to develop a consistent reporting framework for leverage in investment funds, with a view to gaining a system-wide perspective on evolving risks, in line with the recommendations of the Financial Stability Board (FSB) to the International Organization of Securities Commissions.5 Looking ahead, in the context of the FSB’s work on the evaluation of post-crisis reforms, it would be useful to assess the effectiveness and completeness of the regulatory measures taken in relation to the non-bank financial sector.
4 See the Recommendation of the European Systemic Risk Board of 7 December 2017 on liquidity and
leverage risks in investment funds (ESRB/2017/6). 5 See Policy Recommendations to Address Structural Vulnerabilities from Asset Management Activities,
FSB, January 2017.

Financial Stability Review, May 2019 – Macro-financial and credit environment
17
1 Macro-financial and credit environment
1.1 Weaker near-term euro area growth outlook coupled with persistent downside risks
The euro area economy lost some momentum in late 2018. Notwithstanding a rebound of GDP growth at the start of 2019, survey indicators continue to point to a subdued economic expansion in the near term. The slowdown in euro area growth (see Chart 1.1, left panel) can be attributed to weaker impetus from external demand as well as some country and sector-specific factors, such as disruptions in the German car industry and adverse confidence effects of the political and policy uncertainties in Italy. That said, the ECB’s accommodative monetary policy has continued to underpin domestic demand. Ongoing favourable labour and housing market trends have also buttressed private consumption, while benign financing conditions and relatively resilient corporate and household fundamentals underpinned business and residential investment.
The euro area economy lost momentum over the course of 2018. Notwithstanding a rebound of GDP growth in early 2019, survey indicators continue to point to a subdued economic expansion in the near term.
Growth is expected to regain traction in the medium term given support from favourablefinancing conditions, rising wages and some fiscal loosening.
There are persistent downside risks to this growth outlook, originating in particular from global factors, notably a disorderly no-deal Brexit, a further escalation of trade disputes as well as potential renewed tensions in emerging market economies.
The materialisation of downside risks may prompt financial market volatility and abrupt asset repricing, threatening debt sustainability and challenging euro area financial stability.
Credit risks in sovereigns, households and firms have risen as a result of the slowdown in economic activity, but financing conditions remain favourable for all sectors.
The sustainability of public finances may be additionally challenged by a slowdown of fiscal and structural reform efforts and a broader widening of risk premia.
At 58% of GDP household debt is not too high at the aggregate euro area level, but pockets of risks prevail at the country level.
Corporate indebtedness remains elevated at some 80% of GDP on a consolidated basis, but low interest payment burdens and high liquidity buffers alleviate debt sustainability concerns.
Residential and commercial property marketsmaintained momentum amid signs of overvaluation in some countries and market segments.
Macroeconomic environment Non-financial sectors

Financial Stability Review, May 2019 – Macro-financial and credit environment
18
Chart 1.1 Moderation in euro area cyclical momentum and lower inflation outturns reflect expected temporary slowdown in nominal growth
Real GDP growth, Economic Sentiment Indicator and composite output PMI for the euro area (left panel), as well as HICP inflation, HICP inflation excluding energy and food and inflation expectations in the euro area (right panel) (left panel: Jan. 2011-Apr. 2019, quarter-on-quarter percentage changes, diffusion index: 50+ = expansion; middle panel: 2013-21, percentage points; right panel: Jan. 2011-Apr. 2019, annual percentage changes, percentages)
Sources: Markit, European Commission, Eurostat, ECB and ECB calculations. Notes: Left panel: the Economic Sentiment Indicator is standardised and rescaled to have the same mean and standard deviation as the Purchasing Managers’ Index (PMI). Right panel: the vertical line indicates the latest data point available at the time of the publication of the previous FSR.
The euro area expansion is expected to regain traction amid supportive fundamentals. Looking ahead, growth of the euro area economy is projected to gradually strengthen, reflecting the favourable impact of very accommodative monetary policy, rising wages, a recovery in foreign demand and some fiscal loosening. The March 2019 ECB staff macroeconomic projections foresee real GDP growth strengthening in the medium term from the moderate rate of 1.1% in 2019 to 1.6% in 2020 and 1.5% in 2021. Weaker economic growth prospects in the near term together with lower HICP inflation outturns since the publication of the previous FSR (see Chart 1.1, right panel) translate into more muted headline HICP inflation forecasts of 1.2% in 2019, followed by 1.5% in 2020 and 1.6% in 2021. This nominal growth path in the euro area contrasts with more favourable economic prospects in the United States, despite a deterioration of the 2019 growth and inflation outlook for both jurisdictions (see Chart 1.2).
-1.0
-0.5
0.0
0.5
1.0
1.5
2.0
2.5
3.0
3.5
2011 2013 2015 2017 2019
HICPHICP excl. energy and foodInflation expectations, 1-year rate 2 years ahead
-0.5
0.0
0.5
1.0
45
50
55
60
2011 2013 2015 2017 2019
Real GDP growth (right-hand scale)Economic Sentiment IndicatorComposite output PMI

Financial Stability Review, May 2019 – Macro-financial and credit environment
19
Chart 1.2 Real GDP growth and inflation have been revised down for both the euro area and the United States amid increasing downside risks
Distribution of the 2019 HICP/CPI and real GDP growth forecasts for the euro area and the United States (probability density)
Sources: Consensus Economics and ECB calculations. Notes: The dashed lines represent the average HICP/CPI and real GDP growth forecast values. HICP stands for Harmonised Index of Consumer Prices and CPI for Consumer Price Index.
Growth of the global economy slowed at the turn of 2018-19, but is set to stabilise in the medium term. The slowdown has been fairly pronounced in the manufacturing sector against the backdrop of the maturing business cycle in key advanced economies, while global trade decelerated sharply (see Chart 1.3, left panel) amid slowing industrial activity and heightened trade tensions. The slowdown in global growth went hand in hand with lower global inflationary pressures and more accommodative monetary policy expectations by market participants in most major advanced and emerging market economies (EMEs) (see Chart 1.3, middle panel). Global growth is expected to stabilise over the medium term as slowing cyclical momentum in advanced economies, as well as a gradual slowdown in China’s GDP growth, are largely offset by the recovery of key EMEs from deep recessions (e.g. Russia, Brazil). The accommodative stance by central banks globally has also eased global financing conditions (see Chart 1.3, right panel), creating a more benign environment for EMEs.
Persistent downside risks cloud the global and euro area growth outlook. Alongside waning fiscal and structural reform efforts in some euro area countries, downside risks to euro area growth mainly relate to global factors. In particular, uncertainties regarding the course of the economy and fiscal policies in the United States, a further rise in (geo)political and policy uncertainty across the globe, including in relation to growing trade protectionism and a disorderly no-deal Brexit, as well as renewed tensions in EMEs, may weigh on the euro area growth momentum.
0.0
0.5
1.0
1.5
2.0
2.5
3.0
3.5
0.5 1.0 1.5 2.0 2.5 3.0 3.5
HICP/CPI
November 2018 forecast for 2019 for the euro areaMay 2019 forecast for 2019 for the euro area
November 2018 forecast for 2019 for the United StatesMay 2019 forecast for 2019 for the United States
0.0
0.5
1.0
1.5
2.0
2.5
3.0
3.5
0.5 1.0 1.5 2.0 2.5 3.0 3.5
GDP growth

Financial Stability Review, May 2019 – Macro-financial and credit environment
20
Chart 1.3 Growth in global activity and trade slowed since mid-2018, while financial conditions eased in early 2019 amid expectations of more accommodative monetary policy
Global trade tracker (left panel), expected policy rates in Q4 2019 based on market expectations in Q1 2018 and Q1 2019 for major advanced economies and the BRIC countries (middle panel), as well as financial conditions across the globe (right panel) (left panel: Jan. 2011-Mar. 2019, quarter-on-quarter percentage changes; middle panel: percentages; right panel: Jan. 2015-Apr. 2019, indices, Jan. 2015 = 100)
Sources: ECB calculations, Markit and Goldman Sachs (via Bloomberg). Notes: Left panel: the tracker is based on a dynamic factor model using 22 monthly trade indicators. The grey shaded area shows the range of the ten highest-loaded indicators. Indicators are standardised and mean/variance-adjusted into world imports excluding the euro area.
A more severe slowdown of the US economy could adversely affect global growth and financial markets. The US economy is currently in its second longest expansion on record, buttressed by fiscal stimuli in the late phase of the business cycle. While near-term recession risks in the United States appear to be limited, the equity market corrections at the turn of the year, the ongoing US-China trade dispute, vulnerabilities associated with elevated corporate leverage (see Chapter 2) and weaker global growth prospects have led to continued market concerns regarding the downside risks to US economic growth. In addition, while the negative impact of the partial federal government shutdown earlier this year is expected to be moderate, the current expansionary fiscal policies may trigger public debt sustainability concerns (see Chart 1.4, left panel) and a repricing in US and global bond markets. Nevertheless, the dominant role of the US dollar as an international reserve currency is expected to continue attracting international investors, thereby mitigating the risk of a near-term repricing of US government debt.
Heightened political and policy uncertainty may weigh on global sentiment. Political and policy uncertainty remained elevated at the turn of 2018-19 across the globe (see Chart 1.4, middle panel). Alongside continued uncertainties surrounding economic and fiscal policies in some major euro area countries, a further escalation of trade tensions between the United States and China could have a significant impact on global trade and growth, especially if direct trade effects were to be compounded by indirect confidence effects stemming from increased uncertainty about future trade policies and trading relations. At the same time, the continued lack of clarity on the future relations between the United Kingdom and the European Union also implies
-1
0
1
2
3
4
5
6
7
8
EA CH UK US CA BR RU IN CN
Q1 2018Q1 2019
98
99
100
101
102
2015 2016 2017 2018 2019
Tigh
terf
inan
cial
co
nditi
ons
Loos
er fi
nanc
ial
cond
ition
s
Advanced economiesEmerging economies (excl. China)
-2
-1
0
1
2
3
2011 2013 2015 2017 2019
World imports tracker (excl. EA)
Dispersion across indicators
World imports post-2011 average (excl. EA)

Financial Stability Review, May 2019 – Macro-financial and credit environment
21
uncertainty surrounding financial market sentiment and the growth implications of the UK leaving the EU (see Box 1).
Chart 1.4 Deteriorating US fiscal fundamentals, heightened economic policy uncertainty and a hard landing of the Chinese economy may weigh on global growth prospects
Fiscal fundamentals in the United States (left panel), news-based measures of economic uncertainty and geopolitical risk (middle panel), as well as estimated real GDP impact of spillovers from a China slowdown (right panel) (left panel: 2003-24, percentage of GDP; middle panel: Jan. 2004-Apr. 2019, index points; right panel: real GDP, percentage deviations from “limited adjustment” scenario after three years)
Sources: IMF (World Economic Outlook database), Caldara and Iacoviello (2017), Baker, Bloom and Davis (2013) and ECB calculations. Notes: Middle panel: for the geopolitical risk index, see Caldara, D. and Iacoviello, M., “Measuring Geopolitical Risk”, working paper, Board of Governors of the Federal Reserve Board, November 2017. Measures of economic policy uncertainty are taken from Baker, S., Bloom, N. and Davis, S., “Measuring Economic Policy Uncertainty”, Chicago Booth Research Paper No 13/02, January 2013. Right panel: the labels refer to the euro area (EA), the United States (US), Japan (JP), the United Kingdom (UK), oil-producing countries (Oil) and the rest of the world (RoW). For more details on the methodology, see Dieppe, A., Gilhooly, R., Han, J., Korhonen, I. and Lodge, D. (eds.), “The transition of China to sustainable growth – implications for the global economy and the euro area”, Occasional Paper Series, No 206, ECB, January 2018.
Vulnerabilities in emerging market economies remain a cause for concern. The most acute tensions observed in a number of EMEs in 2018 have subsided, but pockets of vulnerability remain across EMEs, as illustrated by the renewed heightened volatility in the most vulnerable economies (e.g. Turkey and Argentina). Despite market participants’ more benign view of emerging markets lately, the fragility of macroeconomic fundamentals – in particular high current account deficits and a strong reliance on US dollar funding – together with limited room for policy support leaves some EMEs exposed to changes in investor sentiment and sudden flow reversals. Moreover, financial and real shocks associated with China’s rebalancing process towards a more consumption-driven growth path and/or its trade dispute with the United States may adversely affect other Asian and Latin American economies with close trade and financial links to the Chinese economy. In addition, such shocks could spark broader-based risk aversion vis-à-vis emerging markets at large, with significant implications for global financial markets and economic activity (see Chart 1.4, right panel).
The materialisation of downside risks to growth could challenge euro area financial stability. In particular, it might spark tensions in global financial markets and prompt a disorderly unwinding of global search-for-yield flows. A weaker than
Fore-cast
50
60
70
80
90
100
110
120
0
2
4
6
8
10
12
14
2003 2008 2013 2018 2023
General government deficitGeneral government gross debt
0
50
100
150
200
250
300
350
2004 2007 2010 2013 2016 2019
Global economic policy uncertaintyUS trade policy uncertaintyGeopolitical risk index
-4
-3
-2
-1
0
1
EA US JP UK Oil RoW
Swift rebalancingAbrupt adjustment

Financial Stability Review, May 2019 – Macro-financial and credit environment
22
expected growth environment could also trigger the materialisation of any of the main risks to euro area financial stability and could amplify global risk repricing, further challenge bank profitability or fuel debt sustainability concerns.
Box 1 Assessing the risks to the euro area financial sector from a no-deal Brexit – update following the extension of the UK’s membership of the EU
The extension of the UK’s membership of the EU agreed by the European Council on 10 April avoided a no-deal Brexit scenario over the FSR review period. But the risk of a no-deal scenario occurring at the end of the extension period cannot be excluded. The additional time should be used by both financial and non-financial sectors to continue to prepare for all possible contingencies, including a disorderly Brexit. Furthermore, banks should use the period in which the UK remains in the EU to make progress towards their target operating models within the timelines previously agreed with their supervisors.
A no-deal Brexit poses manageable risks to overall euro area financial stability and authorities have prepared for this scenario.6 Action has been taken where necessary (for example, in the area of market infrastructures), and the private sector has made progress in certain areas to address Brexit-related risks. Nevertheless, there remain tail macro-financial risks whereby a no-deal Brexit interacts with other global shocks, in an environment where risks to the euro area growth outlook are tilted to the downside. If such a scenario occurs, the impact would likely be concentrated on particular countries, such as those with significant ties to the UK. This could be further amplified by any lack of preparedness among clients in the financial sector and certain key sectors of the real economy. It is also important to acknowledge that the extent of non-linear effects which might occur in such a scenario cannot be fully predicted.
The materialisation of a no-deal scenario may entail substantial financial market volatility and an increase in risk premia. Market intelligence suggests that financial market prices reflect only a low probability of a no-deal scenario, although uncertainty among market participants remains elevated in light of on-going political developments. So a no-deal outcome could lead to substantial market turbulence. On 5 March, the Bank of England and the ECB announced the activation of the currency swap arrangement for the possible provision of euro to UK banks. As part of the same agreement, the Eurosystem would also stand ready to lend pounds sterling to euro area banks. The activation marks a prudent and precautionary step by authorities to provide additional flexibility in their provision of liquidity insurance, supporting the functioning of markets that serve households and businesses.
Combined with an impact via trade channels, potential financial market shocks related to a no-deal scenario pose a material downside risk to euro area GDP growth. Beyond having an impact on euro area growth, a no-deal Brexit is also likely to precipitate an even more significant macroeconomic shock in the UK.7 In terms of the implications of this potential macroeconomic shock for the euro area banking system, it should be noted that direct exposures to the UK only accounted for about 7% of SSM significant institutions’ assets at the end of 2018. Of this, loans represent less
6 For a wider discussion of some of the financial stability risks of a no-deal scenario, especially in relation to
derivatives markets, see the box entitled “Assessing the risks to the euro area financial sector from a disruptive hard Brexit”, Financial Stability Review, ECB, November 2018.
7 See “EU withdrawal scenarios and monetary and financial stability”, Bank of England, November 2018.

Financial Stability Review, May 2019 – Macro-financial and credit environment
23
than 5% of total assets, with much of the remainder made up of derivatives contracts held with UK counterparties. At the same time, these macro-financial tail risks would likely have concentrated effects on particular countries and banks.
In relation to derivatives markets, cliff-edge risks in the area of cross-border centrally cleared derivatives have been addressed through the temporary equivalence decision of the European Commission for UK central counterparties until 30 March 2020. Issues related to uncleared derivatives are also unlikely to pose a systemic risk. In a no-deal scenario, euro area institutions will continue to be able to hedge risks through uncleared derivatives markets using non-UK counterparties – indeed, business with UK counterparties comprises less than a third of outstanding contracts held by euro area institutions. The private sector has also made some progress in addressing risks associated with the existing stock of contracts. Should market participants wish to adjust the remaining stock of contracts, there are a range of options available to them to do so. The private sector should make use of the risk mitigants available to them over the coming months to ensure that they are fully prepared for a no-deal scenario.
Financial stability risks are not expected in the area of cross-border insurance contracts. In particular, UK insurance companies servicing EEA30 policyholders have several options to mitigate any disruption and these options are being actively used by firms. As a result, the vast majority of outstanding cross-border insurance contracts are covered by credible contingency plans, with the residual contracts primarily pertaining to non-life insurers.8
In terms of relocation planning, the majority of authorisation procedures related to the establishment of new banks or the expansion of existing banks in the euro area have been completed. The remaining ongoing authorisation procedures are expected to be finalised before the end of October 2019. So no major disruptions in the servicing of EU clients are expected. Banks are now in the process of implementing their Brexit plans, including the transfer of capital, assets and client activities. Going forward, the ECB expects banks to build up their capabilities in the EU27 and to reach the agreed target operating models within the previously agreed timelines.
Overall, the risk that the euro area real economy would be deprived of access to financial services following the UK’s departure from the EU appears limited. But macro-financial tail risks may have implications for parts of the euro area financial system. The extension period should be used by both financial and non-financial sectors to continue to prepare for all possible contingencies, including a disorderly Brexit.
1.2 Fragile public debt sustainability
Stress remained subdued in euro area sovereign debt markets, but uncertainties at the country level prevail. Despite the signs of slower economic growth, the composite indicator of systemic stress in euro area sovereign bond markets (SovCISS) has declined somewhat since the turn of 2018-19. This largely reflects the subsiding of acute stress in Italian government bond markets and the continuing positive news flow (e.g. sovereign rating upgrades) on some euro area 8 See “EIOPA calls for immediate action to ensure service continuity in cross-border insurance”, EIOPA,
5 November 2018.

Financial Stability Review, May 2019 – Macro-financial and credit environment
24
countries that were more affected by the crisis (e.g. Greece, Portugal). Cross-country dispersion still remains though (see Overview), as markets continue to discriminate between sovereign vulnerabilities at the country level. In terms of the drivers, somewhat lower correlations among input variables exerted downward pressure on the indicator (see Chart 1.5, left panel).
Chart 1.5 Stress in euro area sovereign bond markets has remained contained at the aggregate euro area level amid rising risks of deteriorating fiscal fundamentals
Composite indicator of systemic stress in euro area sovereign bond markets and underlying driving factors (left panel), as well as the headline euro area general government balance and contributing factors (right panel) (left panel: Jan. 2012-Apr. 2019; right panel: 2016-20, percentage of GDP and percentage point contributions)
Sources: ECB, European Commission’s spring 2019 economic forecast and ECB calculations. Notes: Left panel: the SovCISS is available for the euro area as a whole and for 11 euro area countries. The methodology of the SovCISS is described in Garcia-de-Andoain, C. and Kremer, M., “Beyond spreads: measuring sovereign market stress in the euro area”, Working Paper Series, No 2185, ECB, October 2018. Right panel: the cyclical component is calculated as the difference between the general government budget balance and the cyclically adjusted general government budget balance which takes the effects of the economic cycle into account. One-off measures capture for example one-off banking support measures or one-off state guarantees to sub-national governments and public and private corporations.
Slower than expected growth and a looser fiscal stance could put pressure on fiscal fundamentals. The aggregate euro area fiscal deficit declined from 1.0% of GDP in 2017 to 0.5% of GDP in 2018 (see Chart 1.5, right panel). This improvement was chiefly driven by favourable cyclical conditions and lower interest payments. However, the aggregate deficit is projected to increase this year for the first time since 2009 on account of lower cyclical support and more expansionary policies than previously expected in several of the largest euro area countries. The projected deterioration of structural balances in 2019 may further challenge the compliance with the medium-term budgetary objectives of a number of highly indebted countries, where fiscal space for countercyclical action is more limited. At the same time, for all euro area countries, shifting expenditure to the most growth-enhancing categories (e.g. investment, education or health) or the tax burden to the less distortive tax bases
-0.4
-0.2
0.0
0.2
0.4
0.6
0.8
2012 2013 2014 2015 2016 2017 2018 2019
SpreadVolatilityBid-ask spreadCorrelationsSovCISS
-1.6
-1.4
-1.2
-1.0
-0.8
-0.6
-0.4
-0.2
0.0
2016 2017 2018 2019 2020
General government balanceChange due to one-off measuresChange in interest expenditureChange in the cyclical componentChange in the primary structural balance

Financial Stability Review, May 2019 – Macro-financial and credit environment
25
of consumption and property can positively affect output growth and reduce inequalities.9
Chart 1.6 Deteriorating growth prospects suggest the importance of more fiscal discipline in those countries with the least fiscal space
Average interest rate-growth differentials and structural balances for 2019-20 across the euro area (left panel), as well as general government debt-to-GDP ratios in Q4 2018 and average real GDP growth forecasts for 2019-20 (right panel) (left panel: 2019-20, percentage of GDP; right panel: Q4 2018, 2019-20, percentage of GDP, percentages)
Sources: European Commission’s spring 2019 economic forecast, ECB (Government Finance Statistics) and ECB calculations.
Heightened political and policy uncertainty could also add to public debt sustainability concerns. Supported by favourable macro conditions, the euro area aggregate government debt-to-GDP ratio has been on a decreasing path since the peak in 2014, reaching 87.1% in 2018. Looking ahead, beyond slower growth, several other factors may challenge the sustainability of public finances. First, a further rise in political and policy uncertainty at both the country (e.g. elections, economic policies) and EU (e.g. Brexit, upcoming EU elections) levels may cause shifts in market sentiment and trigger a repricing of sovereign risk (see Box 2). In particular, a lack of fiscal discipline, the delay of fiscal and structural reforms, or even the reversal of past reforms, may reignite pressures on more vulnerable sovereigns (see Chart 1.6, left panel). In fact, if weaker economic growth prospects were to be coupled with an interest rate shock stemming from a sovereign risk repricing, that would increase debt sustainability concerns in highly indebted countries and amplify the adverse feedback loop between debt levels and underlying macroeconomic dynamics (see Chart 1.6, right panel). Second, pockets of risk surrounding the sovereign-bank nexus may represent a challenge to public finances in some countries. In the medium-to-long run, these challenges are compounded by vulnerabilities related to the potential rise in interest rates/yields, lower potential GDP growth and ageing-related costs.10
9 For further details, see “The composition of public finances in the euro area”, Economic Bulletin, Issue 5,
ECB, 2017, pp. 44-62; “Report on Public Finances in EMU”, Institutional Papers, No 95, European Commission, January 2019; and “Public Finance Structure and Inclusive Growth”, OECD Economic Policy Papers, No 25, 2018.
10 “The 2018 Ageing Report: Economic and Budgetary Projections for the EU Member States (2016-2070)”, Institutional Papers, No 79, European Commission, May 2018.
AT
BE
CY DE
ES
EE
FI
FR
GR
IE
IT
LU
LT
LV
MTNL
PT
SK
SI
EA
-3.5
-3.0
-2.5
-2.0
-1.5
-1.0
-0.5
0.0
0.5
1.0
1.5
-3 -2 -1 0 1 2 3
Ave
rage
str
uctu
ral b
alan
ce fo
r 201
9-20
Average interest rate-growth differentialfor 2019-20
BEDE
EE
IE
GRES
FR
IT
CYLV
LTLU
MT
NL AT
PT
SI
SK
FI EA
0.0
1.0
2.0
3.0
4.0
5.0
6.0
0 25 50 75 100 125 150 175 200
Ave
rage
real
GD
P gr
owth
fore
cast
for
2019
-20
General government debt-to-GDP ratio(Q4 2018)

Financial Stability Review, May 2019 – Macro-financial and credit environment
26
Chart 1.7 The shift towards longer maturity debt has continued, but rollover risks remain elevated in euro area countries with higher debt servicing needs and financing costs
Outstanding amount of government debt securities in the euro area as at year-end 2018 and the change in residual maturity since March 2016 (left panel), as well as sovereign credit ratings and total debt servicing needs over the next two years across the euro area (right panel) (left panel: Mar. 2019, Mar. 2019 vs. Mar. 2016, percentage of GDP, years; right panel: Mar. 2019, percentage of GDP)
Sources: ECB and ECB calculations. Notes: Left panel: the reference period March 2016 refers to the last interest rate move of the Eurosystem, i.e. the cut of the deposit facility rate by 10 basis points to -40 basis points, while March 2019 refers to the latest available observation. Right panel: the size of the bubble is proportional to the long-term interest rate for convergence purposes (secondary market yields of government bonds with maturities of ten, or close to ten, years). Data on government debt service over the next two years only reflect existing maturing securities (principal and interest). The scheduled (future) redemptions are calculated based on the maturity date for each debt security. The amounts do not include government loans or redemptions of debt securities covering future budget deficits or redemptions of debt securities that will be issued in the future. The rating score represents the average rating by the three major rating agencies, Moody’s, Standard & Poor’s and Fitch.
Sovereign financing conditions have remained favourable in terms of both pricing and duration. Despite higher sovereign bond yields in some countries, pricing conditions remained relatively benign for euro area sovereigns amid ongoing Eurosystem reinvestment of principal payments from maturing securities purchased under the asset purchase programme. At the same time, benign conditions have also allowed sovereigns to issue at favourable terms. In particular, the trend towards longer durations has continued, with strong issuance activity beyond the 15-year horizon. Countries with high levels of outstanding government debt securities have engaged more in maturity prolongation than those with lower levels (see Chart 1.7, left panel), but not all highly indebted countries have taken advantage of the current favourable financing conditions to the same extent. In terms of the underlying interest rate structure, a reduction in zero-coupon and floating rate debt and the concurrent increase in fixed rate debt allow governments to lock in long-term financing at low costs and to capitalise on historically low interest rates.
A sovereign risk repricing may trigger rollover risks in countries with continued high refinancing needs. The overall shift in net issuance activity towards the long end of the maturity spectrum in recent years has helped to reduce the gross financing needs of euro area governments from over 27% of GDP at the height of the euro area sovereign debt crisis to 21.6% in the first quarter of 2019. However, the euro area
DE
LU
NL
BE
EE
IE
EA
LV
CY
SK
AT
FI
FR ES
LTSI
PT
GR
MT
IT
0
5
10
15
20
25
30
35
40
AAA AA A+ A- BBB BB+ BB- B
Tota
l deb
tser
vici
ng n
eeds
ove
r the
nex
t tw
o ye
ars
Stable1 positive outlook2 positive outlooks2 negative outlooks
Sovereign credit ratings
EA
BE
DE
IE
GR
ES
FRITNL
AT
PT
FI
EE
LU
SI
SK
MT CY
LT
-3
-2
-1
0
1
2
3
4
0 25 50 75 100 125
Cha
nge
in re
sidu
al m
atur
ity (M
ar. 2
019
vs. M
ar.
2016
)
Outstanding government debt securities (Mar. 2019)

Financial Stability Review, May 2019 – Macro-financial and credit environment
27
aggregate conceals a considerable degree of cross-country heterogeneity. Debt servicing needs remain high for several – in particular the most highly indebted – euro area countries. This may suggest possible pockets of rollover risk in terms of both the availability and the cost of funding in the event of a possible sovereign risk repricing (see Chart 1.7, right panel).
In sum, weaker economic growth and a further rise in political uncertainty could intensify sovereign risks. While favourable financing conditions in terms of both pricing and duration continue to mitigate sovereign risks, weaker than expected macroeconomic conditions may bring underlying fiscal vulnerabilities to the fore again. In fact, public finances remain fragile in a number of countries. Looking ahead, waning fiscal consolidation efforts, particularly in combination with higher long-term interest rates as a result of a sudden sovereign risk repricing or deteriorating macroeconomic conditions, may pose a challenge to the sustainability of public finances. The materialisation of any of these risks may reignite concerns regarding public debt sustainability in the more vulnerable euro area countries.
Box 2 Policy uncertainty and the risk of market repricing
Prepared by Magnus Andersson, Martin Bijsterbosch, Sándor Gardó and Maurizio Habib
Policy uncertainty has remained elevated in recent years for the euro area and the broader global economy, at a time when the political landscape has become more fragmented. Political uncertainty has increased considerably since the global financial crisis in advanced economies (see Chart A, left panel). While political uncertainty is hard to capture in any single measure, heightened political fragmentation may complicate decision-making in national parliaments and could in certain instances potentially lead to policy instability. On this basis, a secular increase in the number of political parties during the past decades and a gradual decline in the voting share of the winning party suggests less cohesive political processes across constituencies (see Chart A, middle panel). Independent of the attribution of political uncertainty to an underlying cause, swings in policy uncertainty have grown in recent years, with trade policy uncertainty gaining prominence due to growing trade protectionism (see Chart A, right panel).

Financial Stability Review, May 2019 – Macro-financial and credit environment
28
Chart A Various metrics indicate a high level of uncertainty amid increasing signs of political fragmentation
Political risk rating and geopolitical risk index (left panel), number of political parties per election and voting share of winning party in the European Union (middle panel) and news-based measures of economic policy uncertainty (right panel) (left panel: 2005-18, index points; middle panel: 1950- 2019, five-year moving averages; right panel: Jan. 2004-Apr. 2019, index points, six-month moving averages)
Sources: International Country Risk Group (ICRG), Caldara and Iacoviello (2017), Baker, Bloom and Davis (2013) and ParlGov database. Notes: Left panel: the political risk rating is a synthetic index from ICRG measuring variables such as political unrest and the presence of conflicts, government stability, the investment climate, corruption, the rule of law and the quality of bureaucracy. For ease of exposition, the original index from the ICRG has been inverted so that an increase in the index indicates greater political risk. For the geopolitical risk index, see Caldara, D. and Iacoviello, M., “Measuring Geopolitical Risk”, working paper, Board of Governors of the Federal Reserve Board, November 2017. Middle panel: European and parliamentary elections in the 28 current EU Member States (up until April 2019). Right panel: measures of economic policy uncertainty are taken from Baker, S., Bloom, N. and Davis, S., “Measuring Economic Policy Uncertainty”, Chicago Booth Research Paper No 13/02, January 2013.
Policy uncertainty may lead to market concerns about sovereign debt sustainability amid still fragile fundamentals for many sovereigns. Policy uncertainty can have an impact on economic and financial outcomes (see Chart B). More uncertainty about future policy decisions may affect market perceptions of sovereign risk, with system-wide implications if fiscal or economic vulnerabilities weaken the sustainability of public debt. Financial markets tend to have considerable difficulty in pricing event risk, often leading to spikes in risk pricing when event risk materialises. Such changes in market sentiment can have significant impacts on sovereign debt sustainability. Three elements may explain the extent to which risk repricing in credit insurance against sovereign default may occur. First, fiscal fundamentals are key in determining vulnerability to sovereign debt sustainability concerns – most notably the stock of public debt relative to GDP. In fact, a high level of debt is a necessary condition for debt sustainability concerns to arise. Second, economic risk can govern the extent to which weaker growth can unearth concerns about these underlying fiscal fundamentals, and challenge debt sustainability. Such economic risk can be captured by variables, such as fiscal and current account balances, as well as economic growth and inflation. Third, political uncertainty can further exacerbate debt sustainability concerns, including not only traditional factors such as political unrest and the presence of conflicts, but also government stability, the investment climate, corruption, the rule of law and institutional quality.
0
50
100
150
200
250
15
17
19
21
23
25
2005 2008 2011 2014 2017
Political risk rating - advanced economiesPolitical risk rating - euro area economiesPolitical risk rating - non-euro area advanced economiesGeopolitical risk index
0
50
100
150
200
250
300
350
2004 2007 2010 2013 2016 2019
Global economic policy uncertaintyUS economic policy uncertaintyEuropean economic policy uncertaintyUS trade policy uncertainty
25
30
35
40
45
50
5
6
7
8
9
10
1950 1965 1980 1995 2010
Number of parties with more than 1% of the vote (left-hand scale)Voting share of the winning party (right-hand scale)

Financial Stability Review, May 2019 – Macro-financial and credit environment
29
Chart B Policy uncertainty can trigger sovereign debt sustainability concerns
Interlinkages between policy uncertainty and sovereign debt sustainability concerns
Source: ECB.
A simple analysis of this interaction of fiscal, economic and political uncertainty explains the considerable variation in market perceptions of sovereign creditworthiness. An examination of the price of insurance against sovereign credit risk across 30 advanced economies offers two main takeaways. First, the impact of political risk on credit default swap (CDS) spreads across all advanced economies examined was limited before the global financial crisis, but increased strongly in 2010-12 as market concerns about euro area sovereign indebtedness gained prominence. While lower compared with its peak in 2010-12, the sensitivity of CDS spreads to political uncertainty has remained higher than before the crisis in recent years (see Chart C).11 Second, CDS spreads in euro area economies seem to be more sensitive to political uncertainty than in other advanced economies. This finding may reflect market concerns about the incompleteness of the institutional framework of the monetary union in combination with the sustainability of public debt in some euro area economies. Such concerns were particularly evident at the height of the euro area sovereign debt crisis in 2010-12, when sovereign CDS markets put an additional premium on political uncertainty, as well as public debt, for euro area economies compared with other advanced economies.
11 These results are consistent with earlier findings of the literature. See, for instance, Beirne, J. and
Fratzscher, M., “The pricing of sovereign risk and contagion during the European sovereign debt crisis”, Journal of International Money and Finance, Vol. 34, 2013, pp. 60-82.
Economic and institutional factors (GDP, current account, institutional framework)
Fiscal fundamentals (primary balances, interest rates,
contingent/implicit liabilities)
High level of sovereign indebtedness
Higher policy uncertainty …
… and have system-wide implications
… may trigger sovereign debt sustainability concerns …
Amplification through negative feedback loops
Contagion/spilloversacross sectors or countries
Nec
essa
ry
cond
ition
sA
ggra
vatin
g co
nditi
ons
Economic policy uncertainty index
Political risk rating
Geopolitical risk index
Trade policy uncertainty index
Indicators of political fragmentation

Financial Stability Review, May 2019 – Macro-financial and credit environment
30
Chart C Euro area CDS markets have been sensitive to political uncertainty since the sovereign debt crisis
Impact of political uncertainty on CDS spreads between 2004 and 2018 (left panel: CDS spreads, basis points; right panel: complete regression results)
Sources: Bloomberg, ICRG and ECB calculations. Notes: The chart shows the estimated impact of political uncertainty on CDS spreads for 30 advanced economies between 2004 and 2018. In particular, the chart in the left panel shows the increase in CDS spreads, in basis points, corresponding to a one-unit increase in the political risk index. The model controls for the impact of economic fundamentals and the presence of outliers (right panel). Political risk is a synthetic index from ICRG comprising variables such as political unrest and the presence of conflicts, government stability, the investment climate, corruption, the rule of law and the quality of bureaucracy. Economic risk is a synthetic index from ICRG including the following variables: real GDP growth, inflation, fiscal deficit, current account deficit and GDP per capita. The original ICRG indices have been inverted so that an increase in the index indicates greater political or economic risk.
While political disagreement is a natural part of the democratic process, strong political fragmentation can lead to policy uncertainty. From a financial stability perspective, one potentially destabilising aspect of this uncertainty is the perception of debt sustainability for highly indebted sovereigns. Based on past experience, the sensitivity of sovereign risk premia to fundamentals in euro area economies could potentially increase in the case of a repricing of risk in global bond markets, thereby underscoring the need for consistent, clear and credible policies underpinning public finances.
1.3 Euro area households resilient, but some country-level vulnerabilities prevail
Euro area households’ income position has so far been fairly resilient to the slowdown in economic activity. Households’ real and nominal gross disposable income growth remained above long-term average rates in 2018 (see Chart 1.8, left panel) primarily bolstered by further improvements in labour market conditions and the related robust growth in labour income. Despite slowing towards the end of the year on account of losses on financial assets due to the correction in global stock markets, growth in household net worth remained solid throughout 2018 buttressed by valuation gains on property holdings amid sustained housing market momentum (see Chart 1.8, middle panel, and Section 1.5). Despite some deterioration over the course of 2018, households remain confident about their financial situation and
0
2
4
6
8
10
12
14
16
18
2004-07 2008-09 2010-12 2013-17 2018
Other advanced economiesEuro area
(1) (2) (3) (4) (5)2004-07 2008-09 2010-12 2013-17 2018
Public debt -0.02 -0.33** -0.14 -0.00 -0.01(0.02) (0.15) (0.22) (0.06) (0.05)
Public debt * EA dummy 0.03 0.47 2.65*** 0.18* -0.07(0.04) (0.33) (0.43) (0.09) (0.10)
Economic risk 0.09 1.82*** 3.73*** 0.44 -0.13(0.09) (0.61) (1.17) (0.57) (0.54)
Economic risk * EA dummy 0.25 1.25 -2.04 -1.06 -0.78
(0.22) (1.36) (2.11) (0.86) (0.98)Political risk 0.54*** 3.48*** 5.92*** 2.71*** 2.69***
(0.10) (1.02) (1.66) (0.49) (0.50)Political risk * EA dummy -0.40 -1.83 9.69*** 1.62* 2.35**
(0.30) (2.17) (2.85) (0.87) (0.94)Observations 100 61 92 155 30R-squared 0.45 0.46 0.72 0.51 0.85

Financial Stability Review, May 2019 – Macro-financial and credit environment
31
unemployment prospects, consistent with the relatively robust consumer confidence (see Chart 1.8, right panel).
Chart 1.8 Income risks for euro area households have remained contained so far, while household confidence and sentiment started to recover in early 2019
Gross disposable income growth (left panel), change in the net worth of euro area households (middle panel), as well as consumer confidence and euro area households’ expectations about their financial situation and unemployment prospects (right panel) (left panel: Q1 2010-Q4 2018, annual percentage changes; middle panel: Q1 2010-Q4 2018, four-quarter moving sums, percentage of gross disposable income; right panel: Jan. 2010-Apr. 2019, percentage balances)
Sources: European Commission, ECB and ECB calculations. Notes: Left panel: the dashed horizontal lines represent the long-term averages, covering the period from Q2 2000 to Q4 2018. Middle panel: other flows in non-financial assets mainly include holding gains and losses on real estate (including land). Other flows in financial assets and liabilities mainly include holding gains and losses on shares and other equity, while changes in net worth due to net saving comprise net saving, net capital transfers received and the discrepancy between the non-financial and financial accounts. Right panel: unemployment prospects are presented using an inverted scale, i.e. an increase (decrease) of the indicator corresponds to more (less) optimistic expectations. The dashed horizontal lines represent the long-term averages covering the period from January 1985 to March 2019.
Household indebtedness has stabilised for the euro area as a whole, while remaining a cause for concern in some countries. On aggregate, the indebtedness of euro area households has stabilised at slightly below 58% of GDP in 2018 – a level that was last observed in early 2006 and is slightly below the estimated threshold associated with debt overhang based on the macroeconomic imbalance procedure. This figure is also relatively low by international standards. The euro area aggregate continues to mask a considerable degree of cross-country heterogeneity though, with the household debt-to-GDP ratio ranging from 21% in Latvia to slightly over 100% in the Netherlands. In terms of changes, there has been continued balance sheet repair (in both absolute and relative terms) in some euro area countries that were more affected by the crisis, e.g. Cyprus and Greece. Most other countries saw an increase in the absolute level of household debt over 2018, but only a few countries have seen debt grow faster than nominal GDP (see Chart 1.9, left panel).
-3
-2
-1
0
1
2
3
4
2010 2012 2014 2016 2018
Gross disposable incomeReal gross disposable income
-20
-15
-10
-5
0
5
10
15
20
25
30
35
2010 2012 2014 2016 2018
Change in net worthNet savingFinancial assets and liabilitiesNon-financial assets
-10
0
10
20
30
40
50-25
-20
-15
-10
-5
0
5
2010 2013 2016 2019
Unemployment prospects(right-hand scale)Consumer confidenceFinancial situation

Financial Stability Review, May 2019 – Macro-financial and credit environment
32
Chart 1.9 While the interest payment burden remains low, elevated and rising household debt levels may represent a cause for concern in some euro area countries
Household debt-to-GDP ratios across the euro area (left panel), interest income and expenditure of euro area households (middle panel), as well as the share of new loans to households at a floating rate and with an interest rate fixation period of up to one year in total new loans (right panel) (left panel: Q4 2018, Q4 2018 vs. Q4 2016, percentage of GDP, percentage point change in the debt-to-GDP ratio; middle panel: Q1 2006-Q4 2018, four-quarter moving sums, percentage of gross disposable income; right panel: percentages)
Sources: ECB and ECB calculations. Notes: Left panel: the size of the bubble indicates the country-specific debt service-to-income ratio. The bold vertical line represents the estimated macroeconomic imbalance procedure (MIP) benchmark of 58% of GDP for household debt. The 133% of GDP MIP benchmark for fully consolidated non-financial private sector debt is split between households and firms based on their average past shares in the stock of non-financial private debt. In the case of Ireland, GDP may not be the most representative scaling variable given the activities of foreign-owned multinational enterprises resident in the country. Alternative metrics that are more related to the domestic economy, such as modified gross national income (GNI*) or modified domestic demand, would yield considerably higher levels of household indebtedness. Right panel: loans to households comprise loans for house purchase, consumer lending and other lending. The pre-March 2016 period covers the three years before the last interest rate move by the Eurosystem (i.e. from April 2013 to March 2016), while the post-March 2016 period covers the time frame thereafter (i.e. from April 2016 to March 2019).
Debt sustainability concerns are mitigated by the low level of interest rates. A relatively resilient income position and improved net worth coupled with record low interest burdens bolster euro area households’ debt servicing capacity for the time being (see Chart 1.9, middle panel). The low interest rate environment has encouraged a shift towards longer rate fixation periods across countries. However, in the event of an interest rate shock without a commensurate boost to household income, more vulnerable households might be challenged going forward in countries where loans at floating rates or rates with rather short fixation periods predominate (see Chart 1.9, right panel). Continued balance sheet repair in countries with elevated levels of household debt should help mitigate the risks related to an eventual normalisation of interest rates and the ensuing rise in debt servicing costs, which are relatively high in some countries (see Chart 1.9, left panel).
Lending flows to households stabilised at moderate levels, but underlying dynamics vary across countries and according to the purpose of lending. Overall, lending to euro area households continues to be supported by borrowing costs close to historical lows (see Chart 1.10, left panel), further improvements in labour market conditions and mature housing markets. At the country level, lending growth remained lacklustre in some countries (e.g. Cyprus, Greece and Latvia), while in others, such as Slovakia, Malta and Lithuania, household credit expanded briskly. Looking at the different lending types, consumer credit remains the most dynamic component of loans to households, but its pace of expansion has decelerated as
0
1
2
3
4
5
6
2006 2009 2012 2015 2018
Households' interest expendituresHouseholds' interest income
0
10
20
30
40
50
60
70
80
90
100
FI CY
GR LU AT LV MT LT EE SI IE PT IT ES EA DE NL
BE SK FR
Pre-March 2016Post-March 2016
EAAT
BE
CY
DE
EE
ES
FI
FR
GRIE
ITLT
LU
LV MTNLPT
SI
SK
-25
-20
-15
-10
-5
0
5
20 40 60 80 100
Cha
nge
in h
ouse
hold
deb
t-to-
GD
Pra
tio(Q
4 20
18 v
s. Q
4 20
16)
Household debt-to-GDP ratio (Q4 2018)

Financial Stability Review, May 2019 – Macro-financial and credit environment
33
consumption of (highly cyclical) durables has slowed and supervisory scrutiny has increased. Loans to households for house purchase continued to expand at a moderate pace. Going forward, banks expect weaker demand and tighter supply conditions for loans for house purchase than for consumer credit (see Chart 1.10, right panel).
Chart 1.10 Bank lending to euro area households is supported by lending rates close to historical lows, but demand and supply conditions have tightened more recently
Annual growth in household loans and MFI lending rates on new lending and outstanding loans to euro area households (left panel), as well as credit standards and demand for household loans by type of credit (right panel) (left panel: Jan. 2007-Mar. 2019, annual percentage changes, percentages; right panel: Q1 2010-Q2 2019, weighted net percentages, three-month expectations)
Sources: ECB and ECB calculations. Notes: Left panel: loans are adjusted for loan sales and securitisation. Right panel: credit demand indicates the net percentage of banks reporting a positive contribution to demand, while credit standards refer to the net percentage of banks contributing to a tightening of credit standards. A negative (positive) number for credit standards represents an easing (tightening).
So far, euro area households have been resilient to the slowdown in economic activity, but stock imbalances remain high in some countries. Relatively solid income and net worth growth coupled with continued favourable financing conditions support households’ debt servicing capacity. A more severe and prolonged economic growth slowdown could, however, translate into deteriorating labour market conditions, a moderation in wage growth and/or a possible correction in housing markets in some countries, thereby challenging euro area households’ income and net worth positions and, thus, their capability to repay debt. At the same time, a sudden rise in interest rates may spark debt sustainability concerns in countries with elevated levels of household debt and a predominance of floating rate contracts.12 Finally, while not an immediate source of concern, the continued buoyancy of consumer lending in some euro area countries warrants monitoring.
12 For the euro area aggregate, simulation results suggest that a 100 basis point increase in short and
long-term market rates would have a fairly limited impact on household debt-to-GDP ratios and gross interest payments. For more details, see Financial Stability Review, ECB, November 2018.
1.5
2.0
2.5
3.0
3.5
4.0
4.5
5.0
5.5
6.0
6.5
-1
0
1
2
3
4
5
6
7
8
9
2007 2009 2011 2013 2015 2017 2019
Annual growth of loans to households(left-hand scale)MFI lending rates on loans to households(outstanding loans)MFI lending rates on loans to households(new lending)
-50
-40
-30
-20
-10
0
10
20
30
40
50
2010 2012 2014 2016 2018
Credit standards - consumer creditCredit standards - house purchaseCredit demand - consumer creditCredit demand - house purchase

Financial Stability Review, May 2019 – Macro-financial and credit environment
34
1.4 Legacy imbalances leave firms vulnerable to weaker growth
Cyclical headwinds indicate somewhat higher risks to corporate earnings and credit risks. Mirroring the weaker economic growth prospects, corporate sentiment deteriorated further in the euro area at the turn of 2018-19. While remaining well above long-term averages, corporate order books have become thinner, gradually translating into poorer capacity utilisation in manufacturing and lower corporate profits (see Chart 1.11, left panel). Heterogeneity across sectors of economic activity is considerable though. Some (mainly export-oriented) industries (e.g. the car industry) appear to be more exposed, while others, such as construction, are relatively more shielded from the current slowdown in economic activity and heightened trade-related uncertainty. Alongside higher corporate earnings risks, market price-based measures, such as the expected default frequency and distance to distress, also signal a pick-up in credit risks for the euro area non-financial corporate (NFC) sector, but remain much less pronounced than at the height of the euro area sovereign debt crisis given more resilient corporate balance sheets and continued favourable financing conditions (see Chart 1.11, right panel).
Chart 1.11 The operating environment has become more challenging for euro area NFCs, but market price-based measures continue to signal relatively low credit risk
Industrial confidence and euro area NFCs’ gross operating surplus, order-book levels and capacity utilisation (left panel), as well as distance to distress and expected default frequency for euro area NFCs (right panel) (left panel: Q1 2011-Q1 2019, percentage of gross value added, percentages, percentage balances; right panel: Jan. 2009-Apr. 2019, percentages, median country values)
Sources: European Commission, Moody’s Credit Edge, ECB and ECB calculations. Notes: Left panel: for scaling purposes, the raw time series for capacity utilisation in manufacturing has been divided by two. Right panel: the dashed horizontal lines illustrate the long-term averages covering the period from January 1999 to February 2019. Distance to distress is shown on an inverted scale.
Legacy balance sheet concerns continue to burden the euro area non-financial corporate sector. The consolidated NFC debt-to-GDP ratio stabilised at around 77.5% for the euro area as a whole in 2018. While being roughly on a par with that of international peers (see Chart 1.12, left panel), the indebtedness of the euro area corporate sector remains high by historical standards and is still somewhat above the
-35
-30
-25
-20
-15
-10
-5
0
5
10
15
38
39
40
41
42
43
2011 2013 2015 2017 2019
Capacity utilisation in manufacturingGross operating surplusOrder-book levels (right-hand scale)Industrial confidence (right-hand scale)
2.2
2.4
2.6
2.8
3.0
3.2
3.4
3.60.0
0.2
0.4
0.6
0.8
1.0
1.2
1.4
2009 2011 2013 2015 2017 2019
Expected default frequencyDistance to distress (right-hand scale)

Financial Stability Review, May 2019 – Macro-financial and credit environment
35
estimated benchmark level of 75% of GDP derived from the macroeconomic imbalance procedure threshold for non-financial private sector debt. On a non-consolidated basis (i.e. including inter-company loans), the level of indebtedness was higher at 108.5% of GDP. Heterogeneity at the country level remains considerable in terms of both the level of debt and its underlying dynamics, as renewed debt accumulation in some countries contrasts with continued deleveraging in countries which had built up large amounts of debt in the run-up to the global financial crisis, e.g. Portugal and Spain (see Chart 1.12, middle panel). The same holds true for developments at the sector level, where overindebted sectors, such as construction and real estate services, continue to deleverage more strongly than less-indebted ones such as industry or trade (see Chart 1.12, right panel). In fact, differences in the financial health of firms across sectors of economic activity may have important implications for banks’ asset quality (see Box 3). That said, other leverage measures at market value such as debt-to-total assets and debt-to-equity ratios for euro area NFCs paint a more favourable picture of firms’ balance sheet situation, hovering around levels observed in the early years of EMU given strong equity price increases in recent years.
Chart 1.12 Corporate balance sheets remain vulnerable in some countries and sectors of economic activity
Consolidated NFC debt-to-GDP ratios in the euro area and selected advanced economies (left panel), consolidated NFC debt across the euro area (middle panel), as well as the ratio of MFI loans to gross value added across euro area sectors of economic activity (right panel) (left panel: Q1 2003-Q4 2018, percentage of GDP; middle panel: Q4 2018, percentage of GDP, percentage points of GDP; right panel: Q1 2006-Q4 2018, percentages)
Sources: Eurostat, ECB and ECB calculations. Notes: Left panel: consolidated non-financial corporate debt is defined as the sum of total loans granted to and debt securities issued by non-financial corporations net of inter-company loans. Middle panel: the bold vertical line represents the estimated macroeconomic imbalance procedure (MIP) benchmark of 75% of GDP for consolidated non-financial corporate debt. The 133% of GDP MIP benchmark for fully consolidated non-financial private sector debt is split between households and firms based on their average past shares in the stock of euro area non-financial private debt. The consolidated NFC debt levels for Cyprus include the debt held by special-purpose entities. In the case of Ireland, GDP may not be the most representative scaling variable given the activities of foreign-owned multinational enterprises resident in the country. Alternative metrics that are more related to the domestic economy, such as modified gross national income (GNI*) or modified domestic demand, would yield considerably higher levels of corporate indebtedness. Right panel: sectors are defined according to the NACE Rev.2 classification. The ratios are calculated using outstanding MFI loans and the four-quarter moving sum of the sector-specific gross value added. The levels of the loan ratios should be interpreted with caution as the value added numbers may also include the activities of units classified in the household and government sectors, which are not covered by the loan series for NFCs. In addition, the gross value added figures of real estate services include the value added imputed for owner-occupied dwellings, while the respective loan series are not included in the ratio. This lowers the loan ratio of construction and real estate services.
50
60
70
80
90
100
110
2003 2006 2009 2012 2015 2018
Euro areaUnited StatesJapanUnited Kingdom EA
AT
BEDE
EE
ES
FI
FR
GR
IT
LT
LV
MT
NL
PT
SISK
-5
-4
-3
-2
-1
0
1
2
Chan
ge in
cor
pora
te d
ebt-t
o-G
DPra
tio (Q
4 20
18 v
s. Q
4 20
17)
Consolidated non-financial corporate debt-to-GDP ratio
LU
IE CY
-20
-16
-12
-8
0 50 100 150 200 250100
105
110
115
120
125
130
135
140
145
150
155
15
20
25
30
35
40
45
50
55
60
65
70
2006 2009 2012 2015 2018
All sectorsIndustryConstruction and real estateservices (right-hand scale)Wholesale and retail tradeServices other than real estate

Financial Stability Review, May 2019 – Macro-financial and credit environment
36
Low corporate interest payment burdens, high liquidity buffers and a more diversified financing structure alleviate corporate debt sustainability concerns. Corporate interest payments have touched record lows in both gross and net terms (see Chart 1.13, left panel), thereby bolstering the debt servicing capabilities of euro area NFCs. However, given the relatively high share of variable rate debt in corporate balance sheets, further balance sheet repair would help offset any risks related to a potential repricing of risk and the resulting rise in market interest rates and debt servicing costs.13 Moreover, euro area NFCs have piled up sizeable liquidity buffers in the magnitude of some 30% of GDP in recent years (see Chart 1.13. middle panel), likely driven by precautionary motives (i.e. mitigating the risk of limited access to external financing in the future) and the low opportunity cost of holding liquid assets. Together with a shift towards longer-term debt financing, these ample liquid asset holdings may help mitigate rollover risks should the current economic slowdown prove more prolonged and access to credit be hampered, but could also make an important contribution to reducing leverage. Finally, the financing structure of euro area NFCs has become more diversified since the onset of the global financial crisis (see Chapter 4). This higher recourse to alternative funding sources has improved the resilience of firm financing to shocks stemming from the banking sector (see Chart 1.13, right panel). NFCs now also tend to finance their expansion to a larger extent with internally generated funds than in the past. That said, the greater importance of direct market-based finance may have further increased the interest rate sensitivity of the corporate sector to higher volatility in market rates.
13 Simulation results suggest that a 100 basis point increase in short and long-term market interest rates
would translate into a fairly limited increase of NFC debt and debt servicing burdens. This is because higher interest rates and the resultant lower nominal GDP growth would also restrict nominal debt financing growth. For more details, see Financial Stability Review, ECB, November 2018.

Financial Stability Review, May 2019 – Macro-financial and credit environment
37
Chart 1.13 Corporate debt sustainability concerns are alleviated by low interest payment burdens, high liquid asset holdings and a more diversified funding structure
Interest payment burden of the euro area non-financial corporate sector (left panel), liquid asset holdings of NFCs in the euro area and selected euro area countries (middle panel), as well as the financing structure of euro area NFCs by instrument (right panel) (left panel: Q1 2012-Q4 2018, percentage of gross operating surplus of non-financial corporations, four-quarter moving sums; middle panel: Q1 2012-Q4 2018, percentage of GDP; right panel: percentage of total borrowing)
Sources: ECB and ECB calculations. Notes: Middle panel: liquid assets are defined as the sum of currency and deposits, short-term securities and mutual fund shares. Right panel: MFI stands for monetary financial institution, OFI for other financial institution and ICPF for insurance corporation or pension fund.
Firms’ external financing flows moderated in line with the economic slowdown, but overall financing conditions remain benign for euro area NFCs. Despite some deceleration in recent months on account of a weaker economic momentum (see Chart 1.14, left panel), bank lending flows to euro area NFCs remained solid as they were bolstered by still favourable credit standards and the record low cost of bank borrowing. This aggregate picture continues to mask considerable cross-country heterogeneity though, as buoyant credit growth in some countries (e.g. Belgium, Austria, France and Germany) contrasts with more muted developments in others (e.g. Spain, Italy and Greece). Looking ahead, the resilience of bank lending to NFCs could be challenged by less favourable credit supply conditions and weaker credit demand as a result of cyclically lower corporate financing needs (see Chart 1.14, middle panel). In terms of the external financing flows from non-bank sources, debt and equity issuance by euro area NFCs was dampened by weaker economic growth prospects and increases in the cost of market-based debt and equity at the turn of 2018-19 due to a pick-up in risk premia and lower corporate profits (see Chart 1.14, right panel). The net issuance of debt securities has recovered since the beginning of 2019, but issuance activity has remained concentrated within the investment-grade segment, reflecting continued uncertainties surrounding the short-to-medium-term economic growth path.
0
2
4
6
8
10
12
14
16
0
1
2
3
4
5
6
7
8
2012 2014 2016 2018
Net interest payments(left-hand scale)Gross interest payments
15
20
25
30
35
40
2012 2014 2016 2018
Euro areaGermanySpainFranceItaly
65%
46%
10%
16%
10%
17%
12% 17%
0.5% 0.8%3% 2%
0%
20%
40%
60%
80%
100%
Q4-08 Q4-18
MFI loansDebt securitiesOFI loansLoans from the rest of the worldICPF loansOther loans

Financial Stability Review, May 2019 – Macro-financial and credit environment
38
Chart 1.14 External financing flows to euro area NFCs have moderated somewhat in line with the observed slowdown in economic activity and lower financing needs
Bank lending flows to euro area NFCs and the cost of bank lending (left panel), credit standards and credit demand by firm size (middle panel), as well as debt and equity flows of euro area NFCs and the related costs of market-based debt and equity (right panel) (left panel: Jan. 2011-Mar. 2019, annual percentage changes, diffusion index: 50+ = expansion; middle panel: Q1 2011-Q2 2019, weighted net percentages, three-month expectations; right panel: Jan. 2011-Mar. 2019, € billions, 12-month moving sums, percentages per annum)
Sources: Markit, Institute for Supply Management, Merrill Lynch, Bloomberg, Thomson Reuters, ECB and ECB calculations. Notes: Left panel: loans are adjusted for loan sales and securitisation. Turning points in loans identified with the Bry-Boschan algorithm. Middle panel: credit demand indicates the net percentage of banks reporting a positive contribution to demand, while credit standards refer to the net percentage of banks contributing to a tightening of credit standards. A negative (positive) number for credit standards represents an easing (tightening). SMEs stands for small and medium-sized enterprises. Right panel: the cost of equity estimates are based on a three-stage dividend discount model.
All in all, euro area NFCs face cyclical headwinds, but remain resilient to a short-lived economic slowdown. The operating environment has become more challenging for euro area NFCs, with the slowdown in economic momentum weighing on firms’ profit-generation capacity. At the same time, legacy stock imbalances continue to linger in a number of countries and sectors. Debt sustainability concerns are, however, currently alleviated by low interest payment burdens and high liquidity buffers, while the financing conditions of euro area NFCs remain favourable and supportive of both investment and debt servicing. The euro area corporate sector should be able to withstand the current moderation in growth dynamics, but a more severe and prolonged economic slowdown than currently projected and a major risk repricing in financial markets could challenge corporate fundamentals going forward.
Box 3 Do corporate fundamentals explain differences in sectoral NPLs?
Prepared by Sándor Gardó, Maciej Grodzicki, Benjamin Klaus and Julian Metzler
Weak corporate asset quality is a concern from a financial stability perspective. Distressed corporate debt has been the centrepiece of the high stock of non-performing loans (NPLs) of euro area banks. NPL stocks are a symptom of balance sheet difficulties faced by a large proportion of firms, which in turn may depress investment and employment, deprive banks of profitable lending opportunities, and therefore weigh on economic growth and the health of the banking sector itself.
40
45
50
55
60
65
-4
-2
0
2
4
6
2011 2013 2015 2017 2019
Composite output PMI (shifted 1 year ahead, right-hand scale)Loans to NFCsReal GDP growth(shifted 1 year ahead)Turning points in loans
-30
-20
-10
0
10
20
30
40
50
2011 2013 2015 2017 2019
Credit standards - large firmsCredit standards - SMEsCredit demand - large firmsCredit demand - SMEs
0.0
1.5
3.0
4.5
6.0
7.5
9.0
10.5
12.0
13.5
-20
0
20
40
60
80
100
120
140
160
2011 2015 2019
Net issues of debt securitiesNet issues of listed sharesCost of market-based debt(right-hand scale)Cost of equity(right-hand scale)

Financial Stability Review, May 2019 – Macro-financial and credit environment
39
This box attempts to identify the fundamental drivers of corporate asset quality. The corporate finance literature has long studied predictors of distress of individual firms. Findings indicate that accounting ratios, capturing firms’ leverage, liquidity, profitability, solvency and type of economic activity, can provide early warning signals of corporate failure.14 On the other hand, concerning the drivers of aggregate NPL movements, the literature has tended to focus on macroeconomic and financial variables.15 This analysis combines these two approaches using novel quarterly data on corporate NPL stocks held by euro area significant institutions, broken down in accordance with the NACE industry classification. These data are combined with data from the national accounts, which provide a breakdown of gross value added and corporate profit margins along the industry dimension. As the data cover the period of a continuous decline in euro area NPL stocks between 2015 and 2018, the analysis is extended with less granular NPL data series published by the IMF which start in 2008.
Chart A NPL ratios decreased in the euro area, but are widely dispersed across countries and sectors
NPL ratios by sector of non-financial economic activity and their distribution across euro area countries (Q1 2015, Q4 2018, percentages)
Sources: ECB and ECB calculations. Notes: A – Agriculture, forestry and fishing, B – Mining and quarrying, C – Manufacturing, D – Electricity, gas, steam and air conditioning supply, E – Water supply, F – Construction, G – Wholesale and retail trade, H – Transport and storage, I – Accommodation and food service activities, J – Information and communication, L – Real estate activities, M – Professional, scientific and technical activities, N – Administrative and support service activities, O – Public administration and defence, compulsory social security, P – Education, Q – Human health services and social work activities, R – Arts, entertainment and recreation, S – Other services, T – Total loans.
Asset quality varies substantially across sectors of economic activity. Nearly 15% of euro area corporate and SME loans were non-performing in the first quarter of 2015. The subsequent economic expansion, alongside the increased scrutiny by supervisors and regulators, contributed to the decline in this ratio to about 8% by the end of the final quarter of 2018. The quality of corporate loans varies across countries and economic sectors (see Chart A). On aggregate, the highest NPL ratios were found in the construction, accommodation and food services as well as transport industries, while loans to public utilities and health service companies became distressed the least frequently. Manufacturing and trade sectors also exhibited above-average NPL ratios.
14 Altman, E. I., “Financial Ratios, Discriminant Analysis and the Prediction of Corporate Bankruptcy”,
Journal of Finance, Vol. 23, No 4, September 1968, pp. 589-609. 15 See, for example, Beck, R., Jakubik, P. and Piloiu, A., “Non-performing loans: What matters in addition to
the economic cycle”, Working Paper Series, No 1515, ECB, February 2013.
0
10
20
30
40
50
60
70
80
Q1-
15
Q4-
18
Q1-
15
Q4-
18
Q1-
15
Q4-
18
Q1-
15
Q4-
18
Q1-
15
Q4-
18
Q1-
15
Q4-
18
Q1-
15
Q4-
18
Q1-
15
Q4-
18
Q1-
15
Q4-
18
Q1-
15
Q4-
18
Q1-
15
Q4-
18
Q1-
15
Q4-
18
Q1-
15
Q4-
18
Q1-
15
Q4-
18
Q1-
15
Q4-
18
Q1-
15
Q4-
18
Q1-
15
Q4-
18
Q1-
15
Q4-
18
Q1-
15
Q4-
18
A B C D E F G H I J L M N O P Q R S T
Interquartile range across countries 90th percentile10th percentile Euro area average

Financial Stability Review, May 2019 – Macro-financial and credit environment
40
Corporate NPLs appear to be concentrated within a few sectors of economic activity. In the euro area, the five sectors afflicted by acute asset quality problems account for 41% of the corporate loan stock and 43% of total gross value added (see Chart B, left panel). Banks appear to have reduced credit to the sectors that were subsequently among the most affected by weak asset quality (see Chart B, right panel). On the one hand, this may suggest that solvency problems were detected and banks reduced lending as there were fewer solvent borrowers, but, on the other hand, it could also have amplified corporate financial distress.
Chart B Five sectors in which NPL ratios are above average account for a large part of euro area gross value added and bank loans to non-financial corporations
Breakdown of corporate loans, gross value added and NPLs by NACE category (left panel); average NPL ratios and average credit growth across sectors of economic activity in the euro area (right panel) (left panel: percentages; right panel: credit growth, annual percentage changes; NPL ratio, percentages)
Sources: Eurostat, ECB and ECB calculations. Notes: Left panel: GVA – gross value added. Sectors ordered by decreasing NPL ratio. Aggregation of sectors BDE, GHI, MN, OPQ and RS is necessary owing to unavailability of sufficiently granular data on gross value added. Both panels: for the industry labelling, see the notes to Chart A.
On aggregate, corporate financial health deteriorates about three years ahead of the observed weakening of banks’ asset quality. In a panel model covering twelve euro area countries, which spans a longer time period but does not capture information on the sectors of economic activity, corporate profit margins worsen about 13 quarters ahead of the increase in NPL ratios. Moreover, the effect of margin contraction on NPLs is amplified by high corporate indebtedness: in national corporate sectors characterised by increasing debt-to-income ratios, NPLs respond more strongly to deteriorating margins (see Chart C, left panel).
Industry data reveal marked differences in both the strength and duration of the pass-through from corporate financial health to NPLs. Changes in gross value added and employment provide advance information about prospective changes in NPL ratios at the industry level. The lead time varies across industries, possibly reflecting different sensitivity to the business cycle and different balance sheet structure. As the economic expansion in the euro area took hold after 2012, asset quality improved the fastest in real estate activities. The two sectors where the NPL ratios were the highest also had the longest lag between the improving fundamentals and NPL reductions (see Chart C, right panel). These results should, however, be interpreted with caution, as they are based
7.2
16.3
5.1
21.6
28.1
19.1
14.4
16.7
17.3
25.2
18.4
11.3
9.4
6.8
11.1
0 20 40 60 80 100
Share in totalcorporate loans
Share incorporate NPLs
Share in GVA
FGHICLMN
JARSBDEOPQ
Five sectors with anabove-average NPL ratio
A
B
C
DE
F
GHJ
I
LMN
OPQRS
T
y = -1.5049x + 9.7817R² = 0.6162
0
5
10
15
20
25
30
35
-12 -10 -8 -6 -4 -2 0 2 4
Ave
rage
NPL
ratio
(201
5-18
)
Average credit growth (2012-14)

Financial Stability Review, May 2019 – Macro-financial and credit environment
41
on a period of pronounced reduction in NPLs, in part related also to NPL disposals to non-bank investors.
Chart C NPL ratios increase with a considerable lag after a deterioration in corporate indebtedness, profitability and employment
Response of NPL ratio to changes in profit margins conditional on changes in gross debt-to-income ratio (left panel) as well as correlation between NPL ratio change and change in gross value added and employment index per industry (right panel) (left panel: percentage points; right panel: y-axis: correlation coefficient, 2015-18; x-axis: lag length in quarters; bars: min-max range)
Sources: Eurostat, ECB and ECB calculations. Notes: Left panel: SD – standard deviation. Right panel: the employment index is for the yearly growth rate in total and sector-specific industry employment, as evaluated by the EU Labour Force Survey. Gross value added is a yearly growth rate in total and sector-specific output value less intermediate consumption. Due to data unavailability for other NACE sectors, results are only presented for six sectors.
Looking ahead, NPL ratios may continue to improve in the near term, before the impact of the current economic slowdown becomes evident in bank asset quality and provisioning needs. The emergence of such an impact can be preceded by weakening corporate profit margins, increasing indebtedness and rising redundancies. These indicators, of which only the first has so far showed signs of deterioration, have quite a long lead time, as it takes time for deteriorating fundamentals to hamper companies’ ability to service their debt and ultimately result in higher NPL ratios. Moreover, banks may have used extensive forbearance in the past to defer the recognition of NPLs. The entry into force of the harmonised NPL definition in 2014 and the more forward-looking accounting rules in 2018 may lead to a gradual reduction of this lag.
1.5 Sustained momentum in euro area property markets
Euro area residential property markets maintained strong momentum in 2018. Despite the slowdown in economic activity, euro area house prices continued to rise at a steady, but robust rate of over 4% in nominal terms in 2018 (see Chart 1.15, left panel) and 2% in real terms. Supported by the low interest rate environment, almost all euro area countries have been in an upturn phase of the housing cycle. However, the pace of expansion varies across countries, and country-level developments are
-3.0
-2.0
-1.0
0.0
1.0
2.0
3.0
4.0
-3 -2 -1 0 1 2 3
Cha
nge
in N
PL ra
tio a
fter 3
yea
rs (p
p)
Change in NPL ratio if debt ratio is constantChange in NPL ratio if debt ratio increases by 1 SDChange in NPL ratio if debt ratio decreases by 1 SD
Observed change in profit margin (pp)-0.25
-0.20
-0.15
-0.10
-0.05
0.00
0.05
0.10
0.15
0.20
1 3 5 7 9 11
Gross value added
ABC
FGHIL
-0.25
-0.20
-0.15
-0.10
-0.05
0.00
0.05
0.10
0.15
0.20
1 2 3 4 5 6 7 8 9 101112
Employment index

Financial Stability Review, May 2019 – Macro-financial and credit environment
42
further nuanced by diverging regional price dynamics. Price rises in large and/or capital cities outpace price trends at the national level in several countries amid a stronger apparent link to the economic cycle. While the euro area housing market as a whole is not characterised by exuberant investment activity,16 there are some signs of a slight price overvaluation (see Chart 1.15, middle panel). The extent of estimated over- or undervaluation is also heterogeneous across countries (see Chart 1.15, right panel). Furthermore, residential investment and building permits remain below long-term averages, suggesting scope for a continued recovery in housing activity and a possible mitigating impact on house prices.
Chart 1.15 Expansion in euro area residential property markets has continued amid signs of slight overvaluation and continued heterogeneity at the country level
Euro area real GDP growth and house price changes in euro area capital cities and at the euro area aggregate level (left panel), euro area residential property price deviations from estimated fair value (middle panel), as well as house price growth and valuation estimates of residential property prices across euro area countries (right panel) (left panel: Q1 2006-Q4 2018, annual percentage changes, nominal; middle panel: Q1 2006-Q4 2018, percentages, average valuation estimate, minimum-maximum range across valuation estimates; right panel: annual percentage changes, nominal, percentages)
Sources: ECB and ECB calculations. Notes: Left panel: for the time series on capital cities, the composition of the sample changes over time and includes Germany, France, Italy, Spain, the Netherlands, Belgium, Austria, Ireland (from 2005), Estonia (from 2003), Slovenia (from 2010) and Finland (from 2010). The euro area aggregates are computed using GDP weights. Middle panel: the minimum-maximum range (dashed lines) is based on four different valuation methods: the price-to-rent ratio, the price-to-income ratio, an asset pricing approach and an estimated Bayesian vector autoregression model (BVAR). The average over/undervaluation estimates are based on the simple average of the price-to-income ratio and the BVAR. For details of the methodology, see Box 3 in Financial Stability Review, ECB, June 2011, and Box 3 in Financial Stability Review, ECB, November 2015. Right panel: the over/undervaluation estimates are based on the simple average of the price-to-income ratio and the BVAR. Overall, estimates from the valuation models are subject to considerable uncertainty and should be interpreted with caution. Alternative valuation measures can point to lower/higher estimates of overvaluation. Valuation data for Belgium and Cyprus are for Q3 2018.
Ongoing yield compression in euro area commercial property markets has been driven by price increases. Price dynamics and transaction volumes reflect continued strong activity in euro area commercial property markets. While the increase in commercial property prices is broad-based across countries, there have been significant differences in the pace of price growth. There is also a continued bifurcation between muted developments in the non-prime segment and strong price increases in prime markets (see Chart 1.16, left panel). Against the backdrop of 16 See the article entitled “The state of the housing cycle in the euro area”, Economic Bulletin, Issue 7, ECB,
2018.
-6
-3
0
3
6
9
-8
-4
0
4
8
12
2006 2009 2012 2015 2018
House price growth (total)House price growth(capital cities)Real GDP growth(right-hand scale)
-10
-5
0
5
10
15
20
2006 2009 2012 2015 2018
Average valuation estimateMinimum-maximum range across valuation estimates
EA
AT
BE
CYDE
EE
ES
FI
FR
GR
IEIT LT
LU
LV
MT
NL
PT SI
SK
-20
-15
-10
-5
0
5
10
15
20
25
30
-5 0 5 10 15 20
Ove
r/und
erva
luat
ion
estim
ate
(Q4
2018
)
House price growth (2018)

Financial Stability Review, May 2019 – Macro-financial and credit environment
43
overall robust price growth, yields on prime commercial property have been on a declining trend, reaching a new low in the current cycle. This marked compression of prime commercial property yields across the euro area might be indicative of possible overvaluation in commercial property markets (see Chart 1.16, middle panel). Transaction volumes have remained strong, but decreased from the recent peak in line with a maturing cycle (see Chart 1.16, right panel). While the appetite from US and UK investors has been muted since 2016, euro area commercial property markets have experienced net foreign inflows on the back of strong activity by Asian investors. Non-European investors could be sensitive to global financial conditions and rebalance out of European commercial property markets if relative returns shift, thereby triggering a correction in commercial property prices.
Chart 1.16 Strong price developments, ongoing yield compression and lower transaction volumes indicate a maturing cycle
Commercial property price indices in the euro area (left panel), euro area prime commercial property yields and the ten-year German benchmark government bond yield (middle panel), as well as commercial property investment volumes in the euro area by origin (right panel) (left panel: Q1 2015-Q4 2018, index: Q1 2015 = 100; middle panel:Q1 2003-Q4 2018, percentages per annum; right panel: Q1 2009-Q4 2018, € billions)
Sources: Jones Lang LaSalle, RCA, experimental ECB estimates based on MSCI and national data and ECB calculations. Notes: Left panel: the euro area countries covered are Austria, Belgium, Finland, France, Germany, Greece, Ireland, Italy, Luxembourg, the Netherlands, Portugal and Spain. Data obtained from private providers constitute the best data source currently available, to be replaced in the future by public series developed by Eurostat. Middle panel: the grey area represents the minimum-maximum range across euro area countries. The euro area countries covered are Austria, Belgium, Finland, France, Germany, Ireland, Italy, Luxembourg, the Netherlands, Portugal and Spain. Right panel: domestic investors comprise investors residing in the country of investment, while European investors include investors from other euro area countries and other non-euro area European investors.
All in all, the ongoing momentum of residential and commercial property markets in some countries and market segments warrants monitoring. There are limited signs that the ongoing recovery of euro area residential property markets might translate into broad-based rapid housing loan growth in the euro area. That said, in some countries, the combination of house price rises and strong new lending and/or household indebtedness warrants closer monitoring in the context of the current low-yield environment. Worse than expected macroeconomic outcomes and/or tighter financing conditions in terms of both the availability and cost of funding could adversely affect the debt servicing capacity of households and commercial property
100
110
120
130
140
150
160
2015 2016 2017 2018
Prime commercial propertyCommercial property
-2
0
2
4
6
8
2003 2006 2009 2012 2015 2018
Euro area prime commercial property yieldsHistorical average of prime commercial property yieldsGerman 10-year governmentbond yield
0
20
40
60
80
100
120
140
2009 2012 2015 2018
Rest of the worldUSEuropeDomestic

Financial Stability Review, May 2019 – Macro-financial and credit environment
44
investors. In turn, this may represent a risk for banks in countries with high property-related exposures. However, macroprudential policy actions, such as extra capital buffer requirements or controls on loosening borrower terms, can help mitigate possible risks to financial stability at the country level. A number of countries have already introduced such measures.17 Given its macroprudential mandate, the ECB is monitoring property market developments too and may top up capital-based national macroprudential measures if needed, in accordance with the SSM Regulation.
17 For more details, see “Macroprudential analysis of residential real estate markets”, Macroprudential
Bulletin, Issue 7, ECB, March 2019.

Financial Stability Review, May 2019 – Financial markets
45
2 Financial markets
2.1 Financial markets proved sensitive to concerns about global economic growth
Signs of a deteriorating global economic outlook and related shifts in expectations about monetary policy triggered a period of heightened market volatility. Towards the end of 2018 global equity indices declined, risk premia rose materially and major economy sovereign bonds benefited from flight-to-safety flows (see also Chapter 4). While the correction was largely orderly, the episode illustrated the sensitivity of investor sentiment to monetary policy expectations. Since the start of 2019 the combination of higher equity prices in the United States, lower US bond yields and US dollar depreciation suggests that expectations of a more accommodative US monetary policy stance were a major driver of the rally in asset prices (green bars in Chart 2.1; see also Box 2 in the November 2018 FSR). Global investors’ risk appetite has improved, providing an additional boost to US equity prices (red bars). In the same period corporate bond spreads declined amid a reversal of previous flight-to-safety flows. Overall, the slowdown of the US economy that triggered the market correction and the subsequent pause in monetary policy tightening remained key drivers of asset prices (blue bars).
Developments
Global equity indices dropped in December owing to concerns about global growth and corporate earnings.
Global search for yield continued after a period of heightened market volatility in the fourth quarter of 2018.
Conditions in the corporate bond and leveraged loan markets worsened as tensions in risky asset segments intensified at the end of the year.
Euro area sovereign spreads remained broadly stable.
Financial stability risks
There is still scope for abrupt price corrections particularly if downside risks to growth materialise.
A deteriorating growth outlook, and associated corporate rating downgrades, could eventually hit corporate bond markets.
Leveraged loans and CLOs face the risk of rating downgrades, which could indirectly pose risks to a wide set of financial institutions.

Financial Stability Review, May 2019 – Financial markets
46
Chart 2.1 Federal Reserve policy was the key driver of US market developments
BVAR decomposition of key global financial variables (Nov. 2018-May 2019, cumulative percentage change for US equities (left panel) and US Treasuries (right panel))
Sources: JP Morgan and ECB staff estimates based on the BEAR toolbox of Dieppe et al. (2016). Notes: The decomposition is derived from a structural BVAR (Bayesian vector autoregression) model with sign restrictions. The model decomposes data for the US economy (equity prices and risk-free bond yields (ten-year)) into four structural shocks: (i) demand shocks are identified by a concomitant decline in equity prices, inflation expectations, risk-free and emerging market economy (EME) bond yields, and the US dollar; (ii) supply shocks are identified by a concomitant decline in equity prices and rise in inflation expectations and risk-free and EME bond yields; (iii) risk shocks are identified by a concomitant decline in equity prices, risk-free bond yields and inflation expectations, as well as a simultaneous rise in EME bond yields and the US dollar; and (iv) monetary (tightening) shocks are identified by a concomitant decline in equity prices and inflation expectations, as well as a simultaneous rise in risk-free and EME bond yields and the US dollar. See Dieppe, A., van Roye, B. and Legrand, R., “The BEAR toolbox”, Working Paper Series, No 1934, ECB, July 2016. CAPE stands for cyclically adjusted price/earnings ratio.
Spillovers from global developments were a key factor driving euro area financial markets. The composite indicator of systemic stress in euro area financial markets exhibited a progressive increase in the fourth quarter of 2018 and spiked towards the end of the year, in line with market concerns about euro area medium-term growth prospects. The indicator started to decline in January, when tensions in global financial markets subsided. The breakdown of the composite indicator shows that tensions were mainly confined to equity markets.
Global equity markets exhibited high volatility, mainly reflecting downward revisions to the growth outlook and trade tensions. Global stock prices dropped in December amid rising downside risks to global growth and falling earnings’ expectations. While also significant in Japan and China, the sell-off was most pronounced in the United States (see Chart 2.2, top-left panel). Cautious communication by the Federal Reserve calmed market participants in January and share prices recovered subsequently. Trade tensions between the United States and China returned in May, prompting equity market volatility. The effect was larger for US sectors that are more integrated in global trade (see Chart 2.2, top-right panel). Only in a scenario in which trade tensions broaden to a global scale are risk premia expected to increase in a more pronounced and broad-based manner (see Special Feature B in the November 2018 FSR). In the euro area, the deterioration of the economic growth outlook weighed on valuations of cyclical sectors relative to defensive sectors (see Chart 2.2, bottom-left panel). A model-based decomposition
-14%
-12%
-10%
-8%
-6%
-4%
-2%
0%
2%
4%
6%
11/18 12/18 01/19 02/19 03/19 04/19 05/19
US demand shockUS supply shockGlobal risk shockUS monetary shockUnexplainedCumulative change
US equities (CAPE)
-0.6%
-0.5%
-0.4%
-0.3%
-0.2%
-0.1%
0.0%
0.1%
0.2%
11/18 12/18 01/19 02/19 03/19 04/19 05/19
Treasury yields (10-year)

Financial Stability Review, May 2019 – Financial markets
47
of changes in euro area equity prices suggests that, since the start of the year, worse earnings growth expectations have been more than offset by a fall in both the equity risk premium and risk-free rates. This may explain the rebound in euro area equity prices (see Chart 2.2, bottom-right panel).
Chart 2.2 Stock markets rebounded at the beginning of the year
Various stock indices (top-left panel), S&P sub-sector performance and trade openness (top-right panel), cyclical vs. defensive stock performance (bottom-left panel) and drivers of euro area equity prices (bottom-right panel) (top-left panel: 1 June 2018-21 May 2019; index: 29 Nov. 2018 = 100; top-right panel: y-axis: cumulative percentage return after six tariff announcements; x-axis: sectoral trade openness as a percentage based on gross value added; bottom-left panel: 1 Jan. 2018-21 May 2019, cumulative difference between cyclical and defensive stock performance, percentages; bottom-right panel: 8 June 2018-17 May 2019, percentages, cumulative change)
Sources: MSCI, Bloomberg, Haver Analytics, Thomson Reuters and ECB calculations. Notes: Top-left panel: MSCI indices, rebased to 29 Nov. 2018 = 100. Top-right panel: the chart shows the cumulative reaction of share prices following six major US and China tariff announcements since the beginning of 2018. Sub-industries classified according to the eight-digit Global Industry Classification Standard (GICS) of the S&P 500 sectoral indices were matched to imports/exports and value added data according to the three-digit and four-digit North American Industry Classification System (NAICS). Sectoral trade openness is calculated as the sum of imports and exports divided by gross value added in the respective sub-industry in 2016. The GICS sub-industries shown in the chart constitute 35% of the market capitalisation of the five underlying sectors in the S&P 500 for which trade and value added data were available (Materials, Industrials, Consumer Discretionary, Consumer Staples and Information Technology) and 20% of the total market capitalisation of the S&P 500. The NAICS classifications used constitute 58% of the total US trade in goods in 2016. The latest observation is for 13 May 2019. Bottom-left panel: values show the performance of euro area and US cyclical stocks relative to defensive stocks since 1 January 2018. Latest observation: 21 May 2019. Bottom-right panel: the decomposition is based on a dividend discount model. The model includes share buybacks, discounts future cash flows with interest rates of appropriate maturity, and includes five expected dividend growth horizons. See Economic Bulletin, Issue 4, ECB, 2018 for more details. Contributions from payouts/dividends have been removed from the chart due to little variation. Latest observation: 17 May 2019.
70
80
90
100
110
120
130
06/18 08/18 10/18 12/18 02/19 04/19
USEAJapan
ChinaEMEs
29 Nov. 2018
Commercial Printing
Aerospace & Defense
Automobile Manufacturers
Auto Parts & Equipment
Commodity Chemicals
Construction Materials
Diversified Chemicals
Electronic Components
Electrical Comp. & Equipment
Fertilizers & Agric. Chem.
Household Appliances
Home Furnishings
Household Products
Industrial Machinery
Oil & Gas Refining
Packaged Foods & Meats
Paper Packaging
Personal Products
Pharmaceutical
Soft Drinks
Specialty Chemicals
Steel
Tires & Rubber
Tobacco
-25%
-20%
-15%
-10%
-5%
0%
5%
10%
0% 100% 200% 300% 400%
-16%
-12%
-8%
-4%
0%
4%
8%
12%
01/18 04/18 07/18 10/18 01/19 04/19
Performance of cyclical stocks relative to defensive stocks
USEA
-25
-20
-15
-10
-5
0
5
10
06/18 08/18 09/18 11/18 01/19 03/19 05/19
Equity pricesEarnings growthAggregate risk-free ratesEquity risk premium

Financial Stability Review, May 2019 – Financial markets
48
Euro area corporate bond spreads increased moderately. US corporate bond spreads widened in the last quarter of 2018. In the same period euro area spreads widened by less, possibly because they had increased more gradually throughout 2018. Since January financing conditions for riskier corporate borrowers, as measured by spreads between non-investment-grade and investment-grade corporate bond yields, have improved, although the spreads are still wider than in October last year (see Chart 2.3, left panel). A model-based decomposition of euro area corporate bond spreads confirms the relevance of the role of spillovers from the United States and other global factors (see Chart 2.3, right panel). Over the reference period euro area-specific factors, such as the worsening of the domestic macroeconomic outlook, appear less important.
Chart 2.3 Corporate bond spreads have increased mainly due to external factors
Spreads between non-investment-grade and investment-grade corporate bond yields (left panel) and decomposition of euro area corporate spreads (right panel) (left panel: 2 Oct. 2018-21 May 2019, percentage points; right panel: 1 Jan. 2018-20 May 2019, basis points)
Sources: iBoxx, Bank of America Merrill Lynch, Thomson Reuters and ECB calculations. Notes: Left panel: spreads between the yield to maturity on non-investment-grade corporate bonds and investment-grade corporate bonds. Latest observation: 21 May 2019. Right panel: the structural shocks are identified using sign restrictions on cross-asset price movements in a BVAR model containing euro area risk-free long-term bond yields (10-year), euro area and US stock prices, the USD/EUR exchange rate, the spread between euro area and US long-term risk-free yields (10-year) and euro area investment-grade non-financial corporate (NFC) spreads. The model is estimated using daily data starting in July 2006. Latest observation: 20 May 2019.
Conditions in the leveraged loan market worsened, indicating rising market concern over the potential scale of losses. The spike in leveraged loan and high-yield bond spreads observed in December was larger in the United States than in Europe but, overall, it was modest compared with previous episodes of volatility (see Chart 2.4, left panel). In the US, prices were also affected by outflows from, and associated sales by, mutual funds and exchange-traded funds (see Chapter 4). Since the start of the year spreads for both leveraged loans and high-yield bonds have partially retrenched (see Chart 2.4, middle panel). Spreads on collateralised loan obligations (CLOs), which repackage leveraged loans into debt securities, rose towards levels not seen since 2016, before declining in January (see Chart 2.4, right panel, and Box 4), with CLO equity spreads even exceeding the peaks of three years ago, highlighting increasing market concerns.
2.0
2.5
3.0
3.5
4.0
4.5
5.0
10/18 11/18 12/18 01/19 02/19 03/19 04/19 05/19
USEuro Area
UKEM
-20
-10
0
10
20
30
40
50
60
70
01/18 03/18 05/18 07/18 09/18 11/18 01/19 03/19 05/19
Global riskUS spilloversEA policy
EA macroResidual
EA NFC spreads

Financial Stability Review, May 2019 – Financial markets
49
Chart 2.4 High volatility in the leveraged loan and high-yield bond markets
Spreads on leveraged loans and high-yield bonds (left and middle panels) and CLO spreads (right panel) (left panel: Jan. 2006-May 2019, basis points; middle panel: basis points; right panel: 2 Jan. 2015-21 May 2019, basis points)
Sources: Thomson Reuters, Dealogic and ECB calculations. Notes: The left panel shows discount spreads, i.e. the nominal spread of the leveraged loans/high-yield bonds over the IBOR benchmark plus the primary/secondary market premium/discount. The option-adjusted spread is shown for high-yield bonds. The US high-yield series contains both financials and non-financials. Middle panel: year-to-date (YTD) figures referring to the period 2 Jan. 2019-17 May 2019. Right panel: CLO spreads over EURIBOR/LIBOR. Each rating category reflects the average of US and EUR spreads.
Euro area sovereign spreads remained broadly stable, despite the downward revisions in growth prospects. Indicators of systemic stress in sovereign bond markets remained fairly stable at low levels over the review period (see Chapter 1). Italian sovereign bond yields were more volatile and remained at a higher level than in early 2018, despite declining during the review period. The spread of the German Bund against the overnight index swap (OIS) rate has recently become less negative, probably signalling some unwinding of safe-haven flows, consistent with the improvement in risk appetite.
The functioning of the repo markets in the euro area continued to show signs of improvement. Overall, the spread between repo rates on transactions collateralised with German and Italian sovereign bonds continued to compress over the review period, pointing to a better availability of collateral in the repo market. In particular, the decline in repo rates around balance sheet reporting dates for transactions collateralised with German and French sovereign bonds has become more contained. Meanwhile, rates on equivalent transactions secured with Italian sovereign bonds have exhibited signs of divergence since the second half of 2018, registering increases around such dates.
The benchmark rate reform in the euro area continued. With regard to the ongoing euro area benchmark rate reform, the working group on euro risk-free rates proposed that the ECB’s short-term rate (the €STR) replace EONIA. To facilitate a gradual transition, it also proposed that EONIA be calculated as a fixed spread over the €STR for a limited period of time. Subject to the approval of the Financial Services and Markets Authority in Belgium, the recalibration of EONIA will start as soon as the ECB
-
500
1,000
1,500
2,000
2,500
-
200
400
600
800
1,000
1,200
1,400
2015 2017 2019
EquityAAA-ABBBBB-B
-70
-171
-51
-86
-200 -100 -
Change YTD
135
195
37
137
- 100 200
Change Q4 2018
0
500
1,000
1,500
2,000
2,500
2006 2009 2012 2015 2018
US leveraged loansUS high-yield bondsEuropean NFC high-yield bondsEuropean leveraged loans

Financial Stability Review, May 2019 – Financial markets
50
begins the daily publication of its euro short-term rate on 2 October 2019 (referring to the rate for 1 October 2019).18
2.2 A weaker economic outlook could trigger further corrections in asset prices
Risks of further abrupt price adjustments could arise from lower than expected economic growth or shifts in monetary policy expectations. The most prominent risk to global financial markets is that slower growth could interact with existing vulnerabilities, including high leverage in the corporate sector or sovereign debt sustainability concerns (see Chapter 1). But even with a more positive growth outlook, changes in monetary policy accommodation could trigger large adjustments in financial markets. In particular, market contacts highlight a perception of current heightened sensitivity of asset prices to policy accommodation and central bank communication. Finally, political uncertainty is particularly elevated, in relation, for example, to Brexit or trade tensions, and could pose risks to financial stability.
The inversion of the US Treasury yield curve signals moderate recession risks, although the predictive power of this market indicator may have decreased. Historically, a flat or even negative slope of the term structure of risk-free Treasury yields has often preceded economic downturns (see Chart 2.5). However, the most recent flattening of the term structure for US Treasuries and German Bunds can be almost entirely attributed to a compression of term premia. To a large extent, these have been driven down by structural rather than cyclical factors, including central banks’ purchases of sovereign bonds. Model-based recession forecasts exploiting a larger variety of financial market variables, including corporate bond spreads and equity market volatility, highlight an increasing but still moderate recession risk in the United States and the euro area over a one-year horizon (see Chart 2.5). Moreover, the upside surprise in US GDP growth in the first quarter should have contributed to a decline in the market perception of recession risks.
18 See the ECB press release of 14 March 2019.

Financial Stability Review, May 2019 – Financial markets
51
Chart 2.5 Yield curves are flat by historical standards, but model-based estimates point to moderate recession risks in the euro area and the United States
Slope of the sovereign yield curve (ten-year minus one-year maturity) and model-implied recession probabilities for the euro area (left panel) and the United States (right panel) (Jan. 1976-May 2019; left-hand scale: probability in percentages; right-hand scale: yield spread in percentages, inverted scale)
Sources: ECB calculations, Thomson Reuters, Organisation for Economic Co-operation and Development (OECD), Centre for Economic Policy Research (CEPR) and National Bureau of Economic Research (NBER). Notes: The slope of the yield curve is derived from the term structure of risk-free government bonds (German Bunds in the case of the euro area, US Treasuries in the case of the United States) and is presented on an inverted scale such that an increase represents a flattening of the yield curve. Estimates of recession probability are based on probit regressions linking a monthly business cycle indicator (0 = expansion, 1 = recession, as computed by the CEPR, OECD and NBER) to domestic financial market variables (the slope of the risk-free yield curve, equity prices, equity market volatility and corporate bond spreads) lagged by 12 months or more. The model is chosen from a range of models, which combine selected financial market variables, based on their pseudo-R2, the mean absolute error for the full sample and the mean absolute error in the recession phases. Latest observation: May 2019.
Negative global growth shocks could reinforce debt sustainability concerns for highly leveraged corporates. Lower corporate profitability, higher funding costs and higher default rates could amplify the magnitude of any downturn. Forecasts of earnings growth in 2019 have continuously been revised downwards over the review period, most noticeably for US listed corporates (see Chart 2.6, left panel). Lower corporate profitability and, more generally, lower growth would interact adversely with NFC leverage, which in the United States has reached historically high levels (see Chart 2.6, right panel), and with the associated elevated refinancing needs. Although declining over the last years, the indebtedness of NFCs also remains high in the euro area (see Chapter 1). Corporate leverage also contributed to the higher correlation of corporate bond spreads with equity prices observed in recent months.
-4%
-3%
-2%
-1%
0%
1%
2%
3%
4%0
20
40
60
80
100
1976 1981 1986 1991 1996 2001 2006 2011 2016
Euro area
Model-based recession probabilitySlope of the yield curve (right-hand scale)Recession
-4%
-3%
-2%
-1%
0%
1%
2%
3%
4%0
20
40
60
80
100
1976 1981 1986 1991 1996 2001 2006 2011 2016
United States

Financial Stability Review, May 2019 – Financial markets
52
Chart 2.6 Disappointing global earnings growth could interact adversely with high corporate leverage
Forecast earnings growth for fiscal year 2019 (left panel) and change in S&P 500 earnings per share (EPS), US GDP and US NFC leverage over last three economic cycles (right panel) (left panel: 15 Feb. 2018-21 May 2019, year-on-year growth, percentages; right panel: 1995-2018; left-hand scale: cumulative percentage change (EPS and GDP); right-hand scale: gross debt/EBITDA levels)
Sources: Thomson Reuters I/B/E/S estimates, Bloomberg, US Bureau of Economic Analysis, Capital IQ and ECB calculations. Notes: For all years, the earnings forecasts refer to the year ending in March for Japan and in December for all other markets. EBITDA stands for earnings before interest, taxes, depreciation and amortisation.
A further deceleration in growth could prompt mark-to-market losses for some investors. While the risk of tighter financial conditions has fallen in recent months, rating downgrades typically translate into higher corporate bond spreads (see Chart 2.7, left panel). In the euro area, corporate issuance in the lowest part of the investment-grade spectrum has increased over the last years (see Chart 2.7, right panel). BBB-rated debt could be particularly affected following a downgrade, as the non-investment-grade bond market has a smaller investor base and is associated with lower levels of liquidity (see Chapter 4). Corporate debt affected by issuer downgrades from A to BBB in the United States increased sharply in the fourth quarter of 2018. The impact of downgrades on bondholders could be exacerbated by limits on their rights that allow companies to postpone default for a longer time. In particular, a prolonged downturn scenario could lead to delayed waves of concurrent defaults.
0.0
0.5
1.0
1.5
2.0
2.5
3.0
3.5
4.0
4.5
5.0
-1.0
-0.5
0.0
0.5
1.0
1.5
2.0
1995 1998 2001 2004 2007 2010 2013 2016
S&P 500 EPS cumulative change (left-hand scale)US GDP cumulative growth (left-hand scale)High-yield leverage (right-hand scale) Investment-grade leverage (right-hand scale)
-8
-6
-4
-2
0
2
4
6
8
0
2
4
6
8
10
12
14
02/18 04/18 06/18 08/18 10/18 12/18 02/19 04/19
S&P 500EURO STOXX 50FTSE Japan (right-hand scale)MSCI EME

Financial Stability Review, May 2019 – Financial markets
53
Chart 2.7 Rating downgrades could significantly increase the cost of funding for non-financial corporations
Difference between euro area rating upgrades and downgrades vs. euro area investment-grade NFC spreads (left panel) and issuer credit rating (right panel) (left panel: Q1 2012-Q1 2019; left-hand scale: quarterly difference; right-hand scale: percentage points; right panel: y-axis: ratings; x-axis: year)
Sources: S&P, Moody’s, Thomson Reuters and ECB calculations (adapted from Citi Research). Notes: Left panel: the difference is calculated as the number of downgrades less upgrades within a quarter for euro area issuer investment-grade corporate bonds. The spread benchmark is a composition of OIS rates. Right panel: the chart is adapted from “US IG Credit Strategy – Who has levers to pull?”, Citi, March 2019. The dots represent the issuer-level credit ratings for a given year of S&P-rated EU companies with a market capitalisation higher than €5 million. The blue dots are investment-grade level and the orange dots are high-yield level.
The CLO market is particularly exposed to an increase in corporate default rates (see Box 4). CLO issuance in US dollars and, to a lesser extent, in euro has increased sharply over the past two years (see Chart 2.8, left panel). At the same time, the credit quality of the underlying loans has deteriorated significantly and the leverage of high-yield corporates has increased. In Europe, the share of covenant-lite loans rose to 70% in the course of 2018 (see Chart 2.8, right panel). In an economic downturn, in addition to the potential for large losses by holders of lower-rated and equity CLO tranches, disruptions in this market would also limit the availability of financing for some corporate activities via leveraged loan markets.
0.0
0.5
1.0
1.5
2.0
2.5
-150
-100
-50
0
50
100
150
2012 2013 2014 2015 2016 2017 2018 2019
Downgrades-upgrades (left-hand scale)NFC Spread (right-hand scale)

Financial Stability Review, May 2019 – Financial markets
54
Chart 2.8 Robust issuance and deteriorating credit quality expose CLO markets to an increase in corporate default rates
CLO issuance (left panel) and share of covenant-lite deals in leveraged loan markets (right panel) (left panel: USD billions; right panel: Q1 2002-Q2 2019, percentages)
Sources: AFME and Bloomberg. Notes: Left panel: YTD figures refer to Jan.-May. 2019. Right panel: the series tracks the share of covenant-lite loans issued over the quarter in the US and European leveraged loan markets. Latest observation: Q2 2019.
Box 4 CLOs: a financial stability perspective
Prepared by Claudiu Moldovan
Collateralised loan obligations (CLOs) – structured finance vehicles which repackage the credit risk of assets – hold around a third of the outstanding leveraged loans in Europe and the US (see Chart A, panel 1). In parallel to the growth of leveraged loans, CLOs have almost doubled in size in the last five years (see Chart A, panel 2). Most of the CLO tranches outstanding have been issued since 2016, when the underlying credit quality had already deteriorated through increased leverage and lower investor protection.19 In addition, CLO exposures tend to be relatively more concentrated in lower-rated leveraged loans (see Chart A, panel 3). Amid recent developments in leveraged loan markets, this box focuses on financial stability risks deriving from CLOs.20
19 For example, the share of European leveraged loan issuers rated B- and lower by S&P rose from 20%
before the crisis to around 40% in 2015. 20 For an analysis of the wider leveraged loan market, see the box entitled “Leveraged loans: a fast-growing
high-yield market”, Financial Stability Review, ECB, May 2018, and the case study entitled “Recent developments in leveraged loan markets and the role of non-bank financial intermediaries”, Global Monitoring Report on Non-Bank Financial Intermediation 2018, Financial Stability Board, February 2019.
0%
10%
20%
30%
40%
50%
60%
70%
80%
2002 2004 2006 2008 2010 2012 2014 2016 2018
USEurope
0
50
100
150
200
250
300
35019
9719
9819
9920
0020
0120
0220
0320
0420
0520
0620
0720
0820
0920
1020
1120
1220
1320
1420
1520
1620
1720
1820
19 Y
TD
USDEUR

Financial Stability Review, May 2019 – Financial markets
55
Chart A Currently outstanding CLO amounts are sizeable, reference sub-investment-grade collateral and were issued when the underlying corporate credit quality had already weakened
CLO share of the leveraged loans outstanding (panel 1), CLO outstanding amounts (panel 2), breakdown by rating of the collateral in US CLOs and in global leveraged loan markets (panel 3), and breakdown by rating of global CLO outstanding amounts (panel 4) (panel 1: end-2018; panel 2: 1997-2018; panels 3 and 4: March 2019; percentages and USD billions)
Sources: Bloomberg, Moody’s, SIFMA, AFME, Morgan Stanley and ECB calculations. Notes: Panel 1: ECB estimates. Holdings by syndication banks do not include undrawn facilities. Panel 3: the breakdown uses S&P ratings. Panel 4: composite ratings are computed as the lowest ratings across Moody’s, S&P and Fitch.
While most CLO tranches outstanding have a high credit rating, CLO collateral quality and structural protections have weakened recently. Around 60% of the CLO tranches outstanding are rated AAA, while the riskier tranches, which include both sub-investment-grade and unrated equity tranches, account for around 20%, or USD 140 billion (see Chart A, panel 4). CLO tranches outstanding are generally also better protected than before the crisis: AAA European CLO tranches now have collateral backing of around 40% compared with less than 30% pre-crisis. This partly reflects post-crisis action by credit rating agencies (CRAs), which responded to deficiencies in their rating methodologies by inter alia increasing subordination requirements.21 As such, tranches that pre-crisis would have received an AA, A, BBB or BB rating would now mostly be rated one notch lower (see Chart B, panel 1). But other structural protections introduced by market participants in post-crisis CLOs have deteriorated recently, mirroring the deterioration in the underlying leveraged loan market.22 The quality of the underlying collateral has also weakened for European and US CLOs in recent years (see Chart B, panel 2). Secondary market pricing – with spreads implying a lifetime probability of default (PD) ranging from 60% for BB tranches to 90% for the equity tranche (see Chart B, panel 3) – suggests that the market assigns higher expected losses than the low past CLO losses (see Chart B, panel 4).
21 The increased conservatism in CRAs’ practices post-crisis is also reflected in their practice of not rating
the equity tranches, as opposed to often rating the full capital structure in pre-crisis CLOs. 22 The weakening of CLO structures includes but is not limited to a growing share of transactions where
CLO managers have increased trading flexibility or can make changes to key transaction terms with limited or without investors’ consent. See also “Top 10 credit challenges CLOs face today”, Moody’s, 13 December 2018 for the US market and 1 April 2019 for the European market.
-
100
200
300
400
500
600
700
800
1997 2007 2017
US CLOsEuropean CLOs
0
100
200
300
400
500
600
700
800
riskiesttranches
NRNABBBBBBAAAAAA
0%
20%
40%
60%
80%
100%
US EU/Europe
Syndication banksCLOsPrivate equity loan fundsRetail fundsNon-retail publically reporting fundsOther institutional investors
0%
20%
40%
60%
80%
100%
US CLOCollateral
S&P /LSTA LLI
NRCCC-DB-BB+BBIG

Financial Stability Review, May 2019 – Financial markets
56
Chart B While CLOs have performed well historically and post-crisis CLO structures offer more investor protection than pre-crisis ones, the credit risk of CLO tranches has increased recently
Comparison between European CLO structures post- and pre-crisis (panel 1), median rating of CLO collateral (panel 2), lifetime probabilities of default implied by the spreads of European CLO tranches (panel 3), and global CLO cumulative loss rates by geographical area, original rating and years outstanding (panel 4) (panels 1, 3 and 4: percentages; panel 2: Moody’s rating factor, on a scale of 1 for AAA to 10,000 for Ca and lower ratings)
Sources: JP Morgan, Moody’s, Bloomberg and ECB calculations. Notes: Panel 1: calculations are based on a sample of 30 European CLOs rated by Moody’s, of which half were structured in 2007 and half in 2018-19. Panel 2: values shown are the median weighted-average rating factor for the collateral of CLOs rated by Moody’s. The Moody’s rating factors shown in the chart are 2220 for B1, 2720 for B2 and 3490 for B3 credit rating levels. Panel 3: implied lifetime probabilities are derived applying a CDS pricing model to secondary market spreads over EURIBOR/LIBOR rates. The recovery rate is assumed to be equal to 15% for high-yield and equity tranches, and 40% for BBB tranches. The discount curve is assumed to be flat at 0%. Implied probabilities of default are to some degree overestimated as the spreads used in the estimates include unknown liquidity and call premia. Panel 4: the loss rates shown are Moody’s cumulative loss rates by original rating over the period from 1993 to 2017. Moody’s loss rates refer to realised losses, where losses given default are weighted by the share of defaulted tranches.
Scenario analysis suggests that more junior CLO tranches are most vulnerable to credit losses, while holders of higher-rated tranches are highly exposed to downgrade risk. Analysis using data on current US CLO tranches and available data from selected CRAs suggests that if default rates were to rise from the current levels of around 11%, which represent the cumulative losses over the past five years, to levels closer to but below the peaks seen during the early 2000 and 2008 crises, only the unrated tranches would incur losses and no downgrades would likely occur (see Chart C, CRA base case, panels 1 and 2).23 But loss given default (LGD) ratios are likely to be higher in this credit cycle than in the past, given weaker underlying credit quality and a higher proportion of covenant-lite loans. If cumulative default rates were to rise to 30% and recovery rates were to drop to 66% from historical levels around 80% (Scenario 1), the equity, B and BB tranches would lose all or nearly all of their value, while more senior tranches would be downgraded. Scenarios that assume higher default and lower recovery rates imply more severe downgrades for higher-rated tranches, illustrating the high sensitivity of tranche performance to recovery rates (see Chart C, panels 1 and 2).
23 The CLO CRA base stress and stress-test scenarios, as well as the hypothetical impact on ratings shown
in Chart C, are based on “Leveraged Loan Stress Scenario: Implications for CLOs”, Fitch, 21 May 2018. Other CRAs may have different stress-test assumptions incorporated in their ratings.
Equity EquityBBB
BBBBBBBBA
AAA
AA
AAAAAA
0%
20%
40%
60%
80%
100%
2007 2018
lower credit quality
B1
B2
B3
2,200
2,400
2,600
2,800
3,000
3,200
3,400
01/13 01/15 01/17 01/19
US Europe
0%
1%
2%
3%
4%
5%
1 3 5 7 9
Investment-GradeSpeculative-Grade
US
Years
1 3 5 7 9
Europe
20%
40%
60%
80%
100%
01/14 01/16 01/18
EquityBBBBBB

Financial Stability Review, May 2019 – Financial markets
57
Chart C More severe macroeconomic shocks would lead to tranche downgrades, mark-to-market losses and sharp increases in the capital requirements for more senior CLO tranches held by banks
Hypothetical impact on rating due to stress scenarios on US CLO tranches (panel 1), historical five-year cumulative US leveraged loan default rates compared with CRA base case and stress scenarios (panel 2), buyers of European CLO tranches in the primary market by investor type and rating (panel 3) and bank capital charges under SEC-IRBA by tranche and CRA stress scenario for a €10 million CLO tranche (panel 4) (panels 1,2 and 3: percentages; panel 4: € millions)
Sources: Fitch, Moody’s, Credit Suisse and ECB calculations. Notes: Panel 1: the expected loss rates under the CRA base stress are based on a portfolio PD of 16.8% and an LGD of 22%. Tranches below the expected loss suffer 100% losses. Scenario 1 assumes a PD of 30.7% and an LGD of 34%, Scenario 2 a PD of 36% and an LGD of 55% and Scenario 3 a PD of 36% and an LGD of 67%. For more details, see the report “Leveraged Loan Stress Scenario: Implications for CLOs”, Fitch, 21 May 2018. NR stands for not rated. Panel 2: the historical US leveraged loan default rates shown are cumulative default rates over the previous five years. Panel 4: the values shown are the hypothetical bank capital requirements for a €10 million tranche of a given rating held by a bank, assuming capital requirements of 8% of risk-weighted assets. Bank capital charges are computed assuming banks can use SEC-IRBA according to the Basel III securitisation framework.
Banks appear to be exposed mostly to senior tranches, suggesting that they are more vulnerable to downgrade, capital requirements, and mark-to-market risks than to direct credit losses. Banks typically purchase AAA senior and upper mezzanine tranches, while insurance companies buy upper mezzanine tranches, and hedge funds purchase the riskiest tranches, including equity (see Chart B, panel 3, for the European CLO buyers). While AAA and high-rated upper mezzanine tranches are unlikely to incur losses even in severe stress, they are subject to significant downgrade risks. Moreover, banks holding these tranches and applying SEC-IRBA (internal ratings-based approach) for the computation of capital charges would be exposed to sharp
BBB
BBBA
AA
AAA
0%
20%
40%
60%
80%
100%
CRA base stress
Expected loss
NRC
CCC
0%
20%
40%
60%
80%
100%
Scenario 1
BB-/B+
AA/A-
NRC
CCC
0%
20%
40%
60%
80%
100%
Scenario 2
AA-/A+
BBB-/BB+
NR
C
CCC
0%
20%
40%
60%
80%
100%
Scenario 3
BBB-/BB+
BBB+/BBB
0%
20%
40%
60%
80%
100%
AAA
seni
or
AAA
mez
z
AA -
A
BBB
BB
B
Equi
ty
Asset managersBanksInsurance corporationsPension fundsHedge fundsCLO managers
0%
10%
20%
30%
40%
50%
2001 2008 2015
5-yr US LL default rateCRA base caseScenario 1Scenarios 2 and 3
0
2
4
6
8
10
AAA AA A BBB BB B NR
CurrentCRA base caseScenario 1Scenario 2Scenario 3

Financial Stability Review, May 2019 – Financial markets
58
increases in capital charges, when compared to the current capital charges, should the more severe stress scenarios materialise (see Chart C, panel 4).
The lack of clarity about who holds the risk of many CLO tranches raises a number of financial stability concerns that require further investigation and close monitoring. The ultimate risk holders of CLO tranches remain unknown as asset managers and hedge funds, which purchase the majority of the CLO tranches in the primary market, invest mainly on behalf of third parties. This raises questions about whether the ultimate investors have the capacity to bear potential severe losses, or how losses might be transmitted across the financial system. Moreover, the CLO amounts outstanding are sizeable and risks to CLO performance in the current credit cycle are also high, as the higher tranche collateralisation in post-crisis CLO structures has been offset to an unknown degree by weaker underlying collateral. In addition, the high commonality of CLO holdings means that tranches of similar seniority across different CLOs will suffer similar losses; as such, CLOs propagate losses more widely across the financial system. Finally, the non-linearity of credit risk introduced by the tranching process implies that, in the case of severe stress in more senior tranches, the downgrades and the associated increase in bank capital requirements will accelerate in a non-linear fashion. The issues of risk ownership of leveraged loans and CLOs, behaviour under stress and contagion channels require further analysis.
While an economic contraction remains a key risk for euro area financial markets, volatility can also arise from other sources. Equity markets remain very sensitive to expectations about global growth and the future path of US monetary policy. While average volatility in US equity markets has not increased significantly since 2018, trading sessions with high volatility have become more frequent (see Chart 2.9, left panel). By contrast, in the euro area, average volatility has decreased and, more importantly, days with high volatility have become less common (see Chart 2.9, right panel). Nevertheless, the risk of an abrupt repricing in euro area financial markets is more broadly related to the increasing importance of global factors in driving euro area equity and credit markets (see Chart 2.3 and Chart 2.4).

Financial Stability Review, May 2019 – Financial markets
59
Chart 2.9 Days with high volatility have become less frequent in the euro area
Stock market volatility (percentage of trading days with high volatility)
Sources: Thomson Reuters, Bloomberg and ECB calculations.
Several risks, such as a no-deal Brexit, a breakdown in trade negotiations, a slowdown in China or a resurfacing of sovereign debt sustainability issues, could have financial stability effects. Over the last year a number of policy risks have crystallised, as reflected by the progressive increase of global policy uncertainty indices (see the Overview and Box 2 in Chapter 1). Threats to the multilateral system of global trade still weigh on the global growth outlook and could adversely affect equity and corporate bond markets. Trade negotiations between the US administration and China have continued and risks associated with trade disputes and a resumption of protectionist pressures remain substantial.
0
5
10
15
20
9 14 19 24 29 34 39
Stock marketsell-off
(Dec. 2018)
Inverse volatility funds sell-off (Feb. 2018)
Stock marketsell-off
(Aug. 2015)
2013-172018-19
VIX
0
5
10
15
20
9 14 19 24 29 34 39
Inverse volatilityfunds sell-off(Feb. 2018)
Brexit referendum(June 2016)
Stock marketsell-off(Aug. 2015)
VSTOXX

Financial Stability Review, May 2019 – Euro area banking sector
60
3 Euro area banking sector
3.1 Prospects of banks addressing weak profitability may be diminished by a worsening cyclical outlook
Banks’ profitability in 2018 was supported by lower impairments, but operating performance remains subdued
Euro area banks’ profitability remained low in 2018, as a continued fall in the cost of risk was offset by still subdued operating performance. Euro area significant institutions (SIs) recorded an aggregate return on equity (ROE) of 6%, broadly unchanged from a year earlier (see Chart 3.1, left panel). Amid a maturing business cycle, the cost of risk fell to a new post-crisis low in 2018, suggesting only limited upside deriving from this factor going forward (see Chart 3.1, middle panel). At
Regulatory capital ratios of euro area banks appear resilient to an adverse macroeconomic scenario.
Banks
Bank profitability remained subdued in 2018, with an aggregate return on equity of around 6% for significant institutions, and profitability prospects worsened somewhat amid market concerns of an economic slowdown.
The process of cleaning up balance sheets continued, but further efforts are needed by some banks to bring down NPLs to sustainable levels.
At the same time, progress in tackling some other structural challenges such as low cost-efficiency remains rather slow.
Banks’ solvency positions remain solid, but organic capital generation has slowed in some parts of the banking sector.
While bank funding conditions remain favourable on aggregate, some banks could face increased funding cost pressure owing to the cyclical downturn and further TLAC/MREL-eligible bond issuance needs.
Scenario analysis

Financial Stability Review, May 2019 – Euro area banking sector
61
the same time, banks’ pre-impairment operating profits, at less than 0.75% of total assets, remain well below pre-crisis levels.
Chart 3.1 Bank profitability generally remains subdued, while differences in bank performance persist with little improvement at weaker banks
Changes in ROE and main drivers (left panel), banks’ cost of risk and real GDP growth in the euro area (middle panel) and dispersion of significant institutions’ ROE (right panel) (left panel: 2015-18, percentage of equity; middle panel: 2006-18, GDP growth forecasts for 2019-20, percentages; right panel: median, interquartile range and 10th-90th percentile range, percentages)
Sources: ECB supervisory data, ECB staff macroeconomic projections (March 2019), SNL and ECB calculations. Notes: Based on a balanced sample of 100 SIs. NII stands for net interest income and NFCI for net fee and commission income. Other non-interest income includes, among other items, net trading income, net gains/losses on financial assets/liabilities designated at fair value through profit or loss, net exchange differences and dividend income. Cost of risk is defined as the ratio of impairments to total loans. The green shaded area in the right panel represents an indicative target range of 6-10% ROE based on survey-based evidence on banks’ medium and long-term targets, as well as cost of equity estimates.
The dispersion of bank profitability remains wide, with little improvement at weaker performing banks. In 2018, within a balanced sample of 100 SIs, around half of the banks recorded an ROE below 6% (see Chart 3.1, right panel). In the period between 2015 and 2018 there was a high persistence of weak performances, with many institutions remaining in the below-median ROE group for at least three of the last four years. Moreover, there is a large cohort of very weak performers, with a quarter of banks recording an ROE below 3%, although with some improvement in the tail of the distribution.
Core banking revenues have improved slightly, but this was more than offset by the weakness of trading revenues (see Chart 3.2, left panel). After two years of declines, the contribution of net interest income (NII) growth to overall revenues turned slightly positive in 2018. A decomposition of NII growth in the last few years reveals that the negative impact of narrowing margins has abated since 2016. In fact, in 2018 it was outweighed by the positive impact of a pick-up in loan growth (see Chart 3.2, right panel). In contrast, growth in net fee and commission income (NFCI) slowed in 2018, possibly due to the negative impact of heightened financial market volatility on investment fund flows and securities underwriting activity. Finally, other non-interest
-5
-4
-3
-2
-1
0
1
2
3
40.0
0.2
0.4
0.6
0.8
1.0
1.2
1.4
1.6
2006 2009 2012 2015 2018
Impairments/loans (left-handscale)GDP growth (right-hand scale, inverted scale)
-10
-5
0
5
10
15
2015 2016 2017 2018
0
1
2
3
4
5
6
7
-40
-30
-20
-10
0
10
20
30
40
2015 2016 2017 2018
NIINFCIOther non-int.inc.ImpairmentsOperating costsOther+taxesROE (right-hand scale)

Financial Stability Review, May 2019 – Euro area banking sector
62
income declined for the third consecutive year, weighed down by the weakness of trading income in the last quarter of the year due to a spike in market volatility.
Chart 3.2 Modest core revenue growth was offset by weakness in trading income, while net interest income growth turned slightly positive in 2018 driven by accelerating loan growth
Decomposition of revenue growth (left panel) and NII growth between 2016 and 2018 (right panel) (2016-18; percentage changes and percentage point contributions to revenue growth (left panel) and NII growth (right panel))
Sources: ECB supervisory data and ECB calculations. Notes: Based on a balanced sample of 100 SIs. Other non-interest income includes, among other items, net trading income, net gains/losses on financial assets/liabilities designated at fair value through profit or loss, net exchange differences and dividend income. Net interest margin is calculated as net interest income over average interest-earning assets.
Euro area banks’ cost-efficiency has deteriorated since 2015 and compares unfavourably with that of some of their international peers. Significant banks’ cost-to-income ratio reached nearly 66% in 2018, a 3 percentage point increase over the last three years. As a result, euro area banks continue to lag behind some of their international peers in terms of cost-efficiency, as a significant efficiency gap persists or has developed in recent years vis-à-vis Nordic banks and US banks respectively (see Chart 3.3, left panel). The increase in significant banks’ cost-to-income ratio in the last few years was mainly driven by a drop in revenues, which could not be offset by modest progress in banks’ cost containment (see Chart 3.3, middle panel). At bank level, the best-performing banks – in terms of cost-to-income ratio declines in the last three years – benefited mainly from stronger revenue growth and, to a lesser extent, also from cost-cutting. By contrast, banks with the largest deterioration in cost-efficiency tended to show both weak revenue performance and above-average growth in operating expenses (see Chart 3.3, right panel).
-6
-5
-4
-3
-2
-1
0
1
2
2016 2017 2018
NIINFCI
Other non-int. incomeOperating income
-6
-5
-4
-3
-2
-1
0
1
2
2016 2017 2018
Margin VolumeNII change

Financial Stability Review, May 2019 – Euro area banking sector
63
Chart 3.3 Euro area banks continue to underperform some of their international peers in terms of efficiency, while developments in cost-to-income ratios were rather heterogeneous at the bank level
Cost-to-income ratios in international comparison (left panel), decomposition of the change in euro area significant institutions’ cost-to-income ratio between 2015 and 2018 (middle panel) and median annual cost and income changes by quartile (right panel) (left panel: 2009-18, percentages; middle panel: 2015-18, percentage points; right panel: 2015-18, compound annual growth rates, medians per quartile)
Sources: ECB consolidated banking data, ECB supervisory data, Federal Deposit Insurance Corporation and ECB calculations. Notes: Left panel: for the euro area, Nordic countries and the UK, 2018 data refer to the first three quarters. Middle and right panels: based on a balanced sample of 100 SIs. In the right panel, quartiles are based on the change in cost-to-income (C/I) ratios between 2015 and 2018.
Banks’ profitability prospects and their ability to build up shock-absorption and lending capacity could be dampened by deteriorating growth expectations, adding to structural weaknesses. Persistently low profitability can limit banks’ ability to generate capital, thus restraining the build-up of buffers against unexpected shocks as well as their capacity to fund loan growth. Amid expectations of an economic slowdown, market analysts have revised downwards their profitability forecasts in recent months and project a small deterioration in listed banks’ ROE in 2019 relative to 2018 levels (see Chart 3.4, left and middle panels). Analysts’ downward revisions, which followed a pattern similar to those in the ECB baseline projections for 2019 (see Chart 6 of the Overview), reflected less optimistic revenue expectations, while the aggregate loan loss provision forecasts were revised slightly upwards (see Chart 3.4, right panel). Mirroring weak current and expected profitability, a number of banks continue to display depressed market valuations (see Box 5). Banks with low market valuations could find it very costly, or even prohibitively expensive, to raise capital from market sources should the need arise.
50
55
60
65
70
75
2009 2012 2015 2018
Euro areaUSNordicUK
60
61
62
63
64
65
66
67
68
C/I
ratio
201
5
Ope
ratin
g in
com
e
Staf
f cos
ts
Oth
er a
dmin
. cos
ts
Dep
reci
atio
n
C/I
ratio
201
8
-8%
-6%
-4%
-2%
0%
2%
4%
6%
Quartile1
Quartile2
Quartile3
Quartile4
IncomeCost

Financial Stability Review, May 2019 – Euro area banking sector
64
Chart 3.4 Markets are less optimistic about banks’ profitability prospects, with downward revisions mainly driven by a deteriorating revenue outlook amid concerns about an economic slowdown
Analysts’ forecasts for euro area banks’ ROE in 2019-20 (left panel), evolution of consensus forecasts for euro area GDP growth and analysts’ ROE expectations for euro area banks for 2019 (middle panel) and changes in forecasts for main profit drivers since mid-2018 (right panel) (left panel: 2019-20, percentages; middle panel: Jan. 2018-May 2019, percentages; right panel: percentage changes since mid-2018)
Sources: Consensus Economics, Bloomberg and ECB calculations. Note: Based on a sample of 39 listed banks.
Cost-cutting measures by banks, such as the streamlining of branch networks, as well as consolidation via mergers and acquisitions (M&As) could be possible avenues for reducing overcapacity in the system and enhancing profitability. Notwithstanding a general trend of branch network reductions, a wide dispersion remains across countries in terms of capacity indicators such as the number of branches (see Chart 3.5, left panel) or bank employees expressed in terms of population. Similarly, market concentration varies widely across euro area countries, with operating profitability (as measured by cost-to-income ratios) typically higher in more concentrated banking sectors (see Chart 3.5, right panel). This may suggest that – in particular in more fragmented banking systems – there may be scope for profitability gains through M&As by, for instance, increasing pricing power or, in some cases, improving economies of scale.
0
2
4
6
8
10
12
10/18 05/19 10/18 05/19
ROE 2019E ROE 2020E
MedianInterquartile rangeROE 2018 (median)
1.0
1.2
1.4
1.6
1.8
2.0
6.0
6.5
7.0
7.5
8.0
01/18 07/18 01/19
Bank ROEGDP growth (right-hand scale)
-20%
-15%
-10%
-5%
0%
5%
Net
inco
me
Rev
enue
s
Net
inte
rest
inc.
Non
-inte
rest
inc.
Ope
ratin
g co
sts
Loan
loss
pro
v.
20192020

Financial Stability Review, May 2019 – Euro area banking sector
65
Chart 3.5 Some national banking systems in the euro area remain highly fragmented, with scope for potential profitability and efficiency gains through M&As
Change in the number of branches since 2008 and branches per 100,000 inhabitants in 2017 (left panel); share of five largest banks in total assets versus cost-to-income ratios in euro area countries in 2015-17 (right panel) (left panel: percentage changes and number of branches per 100,000 inhabitants; right panel: x-axis: share of five largest banks in total assets; y-axis: cost-to-income ratio, 2015-17 averages, percentages)
Sources: ECB structural financial indicators, ECB consolidated banking data and Eurostat.
However, bank mergers are not a panacea for profitability problems and obstacles still need to be overcome to facilitate cross-border consolidation in the euro area. First, while there is scope for M&As that can reduce costs through lower administrative expenses or branch rationalisation, empirical evidence on the success of European bank mergers in terms of profitability and efficiency gains is mixed.24 This highlights the importance of a viable and sustainable business model for the merged banks, with a focus on not only potential cost savings but also longer-term revenue-generation capacity. Second, in order to facilitate larger-scale bank M&As within the euro area more progress is needed to complete the banking union, overcoming prevailing obstacles by, for example, harmonising insolvency laws and taxation regimes and removing national options and discretions (e.g. regarding capital and liquidity). Furthermore, from a financial stability perspective, special attention should be paid to the emergence of potential risks of too large and too complex institutions that may result from the M&A process.
Among other structural challenges, banks need to further adapt their business models to cope with the rapid pace of technological innovation in financial services as well as to strengthen their resilience to cyber threats. From a profitability perspective, increased digitalisation may offer significant cost-saving opportunities for banks (e.g. a further shift away from physical branch networks to digital banking), at least in the medium-to-long term. That said, the pace of digital transformation in the banking sector varies widely across countries and banks’ ability to exploit cost-saving potential from increased digitalisation will depend on structural factors, such as labour laws, population density or the overall degree of digitalisation 24 See, for instance, Behr, A. and Heid, F., “The success of bank mergers revisited: An assessment based
on a matching strategy”, Journal of Empirical Finance, Vol. 18, 2011, pp. 117-135.
R² = 0.52
30
35
40
45
50
55
60
65
70
75
80
0 20 40 60 80 100 120
0
10
20
30
40
50
60
70
-70%
-60%
-50%
-40%
-30%
-20%
-10%
0%
10%
Esto
nia
Latv
iaN
ethe
rland
sLi
thua
nia
Cyp
rus
Gre
ece
Finl
and
Spai
nPo
rtuga
lBe
lgiu
mG
erm
any
Italy
Slov
enia
Aust
riaM
alta
Fran
ceLu
xem
bour
gSl
ovak
iaIre
land
Change in number of branches since 2008 (left-hand scale)Branch density in 2017 (right-hand scale)

Financial Stability Review, May 2019 – Euro area banking sector
66
in the society. At the same time, the increased adoption of digital technologies in banking services, together with the higher interconnectedness and complexity of the financial system, makes banks more vulnerable to cyber threats, which are continuously evolving and becoming ever more sophisticated. In this regard, thematic reviews by ECB Banking Supervision found that there is room for improvement at banks regarding cyber governance and highlighted deficiencies in IT security risk management at several banks as well as concentration risks stemming from increased IT outsourcing.25
Box 5 Recent developments in banks’ price-to-book ratios and their determinants
Prepared by Maciej Grodzicki, Costanza Rodriguez d’Acri and Davide Vioto
The market valuations of euro area banks have remained low since the global financial crisis, lagging behind those of many international peers. Price-to-book (P/B) ratios offer a yardstick of bank franchise value, where a P/B ratio greater than one suggests that a bank can generate market value commensurate to the value of its tangible assets. In this way, a P/B ratio lower than unity suggests investor concern about shareholder value, and manifests itself in a higher cost of capital should the bank opt to issue additional equity. This box investigates the determinants of P/B ratios, assessing to what extent bank and country-specific factors have contributed to hampering their recovery.
P/B ratios of euro area banks have remained below one for over eight years now. Prior to the global financial crisis, the long-term weighted average of the P/B ratios of euro area and US banks stood at around 2 and 2.4, respectively. While this ratio decreased strongly after the recession of the early 2000s, its subsequent recovery was quick, taking four and eight quarters in the United States and the euro area, respectively (see Chart A, left panel). During the 2008-09 crisis, however, both US and euro area banks’ P/B ratios fell to much lower levels, although those of US banks dropped below one for a shorter period of time.
25 See Lautenschläger, S., “Towards a more cyber secure financial system: the role of central banks”,
statement at the G7 2019 conference on “Cybersecurity: coordinating efforts to protect the financial sector in the global economy”, Paris, 10 May 2019.

Financial Stability Review, May 2019 – Euro area banking sector
67
Chart A Market valuations of euro area banks have not recovered from the global financial crisis
P/B ratios before and after previous and most recent troughs (left panel); actual and model-implied P/B ratios in the euro area and the United States (right panel) (left panel: Q4 2000-Q4 2005, Q1 2006-Q4 2018; right panel: Q1 2004-Q4 2018)
Sources: Bloomberg and ECB calculations. Notes: 70 globally active banks, equally divided into EA and US institutions. The left panel shows: (i) the recovery of the P/B ratio of EA and US banks after the minimum value reached in Q1 2003 (dashed lines); and (ii) the evolution of the ratio after the trough reached in Q1 2009 (solid lines). The right panel shows market capitalisation-weighted actual and model-implied P/B ratios for EA and US banks.
This box takes a multi-country empirical approach to investigate the path of P/B ratios in the last decade. A fixed effects panel econometric model extends Calomiris and Nissim (2014)26 by introducing a multi-country set-up and includes variables capturing bank-specific characteristics, market sentiment and the macroeconomic environment. The explanatory variables are drawn from the existing literature on the determinants of the P/B ratio. The sample used is composed of 70 globally active banks, equally divided into euro area and US institutions. In particular, the top 35 listed banks by total assets are selected for each geographical area; eight global systemically important banks are included in each group. The analysis relies on quarterly data and spans the period from the first quarter of 2000 to the fourth quarter of 2018. The role played by complex assets is instead discussed in Box 7.
The model results suggest that bank market valuations can be explained by bank profitability developments, the degree of management and operational efficiency, the amount of regulatory capital and the macroeconomic outlook. Stronger expected economic growth and higher profitability ratios are associated with higher P/B ratios, while higher bank capital is associated with lower ratios. In addition, while weaker operational efficiency and management quality, approximated by cost-to-income ratios, reduces bank valuations, its effect appears to be stronger for US than euro area banks. At the same time, high non-performing loan (NPL) ratios depress the P/B ratios of all banks. Most of the signs and magnitudes of the estimated coefficients are in line with the
26 Calomiris, C. W. and Nissim, D., “Crisis-related shifts in the market valuation of banking activities”,
Journal of Financial Intermediation, Vol. 23(3), 2014, pp. 400-435.
0.5
1.0
1.5
2.0
2.5
3.0
3.5
4.0
-10 0 10 20 30 40Quarters to/from trough
(vertical line)
Euro area banks Q1 2009Euro area banks Q1 2003
US banks Q1 2009US banks Q1 2003
0.0
0.5
1.0
1.5
2.0
2.5
3.0
3.5
2004 2006 2008 2010 2012 2014 2016 2018
Euro area actualEuro area implied
US actualUS implied

Financial Stability Review, May 2019 – Euro area banking sector
68
literature27. The model explains nearly 50% of the total variation in P/B ratios. Accordingly, the implied P/B ratios stemming from the model appear to fit the evolution of actual ratios rather well (see Chart A, right panel).
Chart B The contribution of the economic outlook and profitability has turned positive in the past five years, although the weakened economic environment is challenging the recovery in bank valuations
Selected determinants and signs used in the econometric specification (left panel), change of the implied P/B ratio of euro area banks and main contributors (middle panel) and projected ratios (right panel) (middle panel: percentage points; right panel: percentages)
Sources: Bloomberg and ECB calculations.
The post-crisis weakness in euro area banks’ P/B ratios has evolved, initially associated with weak growth and later with faltering bank profitability. In the first phase of the crisis, the fall in market valuations can be explained mainly by macroeconomic conditions (see Chart B, middle panel, light blue bar), with a large unexplained drop that may have corrected the pre-crisis deviation of the ratios from fundamentals. During the sovereign debt crisis, however, weak bank profitability played a more decisive role in depressing P/B ratios (yellow bar). During the more recent period, P/B ratios have increased, albeit to a smaller extent than what the model would have predicted. This recovery can be attributed to the improved macroeconomic outlook, the strengthening of bank profitability and the resolution of NPLs (red bar), marginally offset by continued capital increases (green bar).
The ongoing economic slowdown will however make the recovery in bank valuations more challenging going forward. As the macroeconomic cycle and outlook turn, one of the main factors
27 The literature has already acknowledged the changing role of capital (and thus leverage) in supporting
(depressing) bank valuations. The results presented here however may suggest the existence of an additional explanation: bank market returns have been depressed, on the one hand, by the dilution of insider equity and, on the other, by the reduction in the value of government guarantees. See Aiyar, S., Calomiris, C. W. and Wieladek, T., “Does macro-prudential regulation leak? Evidence from a UK experiment”, Journal of Money, Credit and Banking, Vol. 46, 2014, pp. 181-214; Atkeson, A. G., d’Avernas, A., Eisfeldt, A. L. and Weill, P. O., “Government Guarantees and the Valuation of American Banks”, NBER Working Paper No 24706, 2019; Bogdanova, B., Fender, I. and Takáts, E., “The ABCs of bank PBRs: What drives bank price-to-book ratios?”, BIS Quarterly Review, March 2018; and Changarath, V., Ferguson, M. and Yong, K., “Do Capital Standards Promote Bank Safety? Evidence from Involuntary Recapitalizations”, Banking & Finance Review, Vol. 9(2), 2017, pp. 1-34.
0.0
0.2
0.4
0.6
0.8
1.0
Last obs.(Q4 2018)
2019 2020 2021
DecemberMarch
-1.4
-1.0
-0.6
-0.2
0.2
0.6
Q2 2007-Q2 2010
Q2 2010-Q2 2013
Q2 2013-Q4 2018
Actual P/B ratioImplied P/B ratioProfit ratiosAsset qualityLeverageMacroeconomic outlookVolatility
Selecteddeterminants:
Coefficientsign:
Weaker asset quality -
Weaker management/operationalefficiency
-
Higher stock market volatility
-
Higher profit ratios +
Positive macro outlook +
Loan-to-deposit ratio +

Financial Stability Review, May 2019 – Euro area banking sector
69
supporting the recovery in P/B ratios will wane when banks need it most, adding further market pressure for some banks. According to December 2018 projections, P/B ratios of euro area banks were expected to increase to 0.85 in 2019, largely stabilising thereafter. Downward revisions in GDP between December 2018 and March 2019 implied that P/B ratios would only recover marginally in the next year (see Section 3.2 for a more detailed discussion on the scenarios and bank profitability developments). These conditional forecasts are obtained by projecting forward GDP expectations and bank profitability with scenario inputs and by keeping the other exogenous variables fixed at their last available value (i.e. the fourth quarter of 2018). The limited recovery in market valuations is concerning as it points to continued doubts on the part of analysts about the ability of euro area banks to earn a return on equity corresponding to their cost of equity.
The improvement in asset quality continues, but further efforts are needed to reduce NPLs
Euro area banks’ asset quality continued to improve in 2018, with non-performing loan (NPL) reductions becoming more broad-based. Significant institutions’ aggregate NPL ratio has declined at a steady pace, to below 4% at end-2018 from 6.2% in 2016. Looking at the different sectors, the decline in NPL ratios was mainly driven by business and commercial property loans (see Chart 3.6, left panel). Progress in NPL reduction was broad-based across all high-NPL countries in 2018 (see Chart 3.6, right panel). Notwithstanding these improvements, dispersion remains wide within this group of countries, with significant banks’ NPL ratios ranging from 5.5% to 41%, indicating that further efforts are needed to bring down NPL stocks to manageable levels.
Chart 3.6 Progress in NPL reduction was broad-based in high-NPL countries in 2018
Significant institutions’ aggregate NPL ratio and composition by sector/loan type (left panel) and NPL ratios in high-NPL countries (right panel) (left panel: Q4 2016-Q4 2018, right panel: Q4 2015-Q4 2018; percentage of total loans)
Source: ECB supervisory data. Note: CRE stands for commercial real estate, NFC for non-financial corporation and RRE for residential real estate.
0
5
10
15
20
25
30
35
40
45
50
Q4 2015 Q4 2016 Q4 2017 Q4 2018
GRCYPT
ITSIIE
0
1
2
3
4
5
6
7
Q42016
Q12017
Q22017
Q32017
Q42017
Q12018
Q22018
Q32018
Q42018
NFC (excl. CRE)NFC CRERRE
Other retailOtherNPL ratio

Financial Stability Review, May 2019 – Euro area banking sector
70
But further progress on NPLs could be hampered by weaker economic growth reducing cure rates and creating new loan performance issues, and by signs that the secondary market for NPL sales may have peaked. Over the last two years the decline in NPL ratios has mainly been driven by NPL reduction measures other than sales, such as write-offs, cures and renegotiations with a combined 70% share in gross NPL reduction (see Chart 3.7, left panel). In the last three quarters of 2018 cure rates28 were exceeded by inflows of assets into the Stage 3 (broadly corresponding to non-performing) category (see Chart 3.7, middle panel), pointing to higher write-off rates driving NPL reduction in this period. This suggests that euro area banks may not have taken full advantage of supportive macroeconomic conditions in 2018 and had difficulties in reducing their NPL stocks by curing impaired assets without recognising further losses. Trends in deal size and trade volume suggest that the NPL sales market might have peaked in volume terms, and that the scope for large portfolio sales has shrunk. The number of transactions did increase in 2018 compared with a year earlier, partly driven by a pick-up in sales activity in previously less active NPL markets such as Greece, Cyprus and Portugal. However, the average deal size dropped in 2018, and the gross volume of NPL sales fell by more than 30% (see Chart 3.7, right panel). In addition, ongoing deals to be realised in the future are also shrinking. This is likely to be because the largest and easier-to-execute portfolio transactions have mostly been completed by now.
Chart 3.7 NPL reductions were driven by measures other than sales, while NPL sales volumes may have peaked
Factors contributing to the change in banks’ aggregate NPL ratio (left panel), flows between Stages 1, 2 and 3 (middle panel) and gross book value of euro area traded NPL portfolios (right panel) (left panel: Q4 2016-Q4 2018, percentage points; middle panel: Q2 2018-Q4 2018, percentage of total loans; right panel: Q3 2016-Q2 2019, € billions)
Sources: ECB supervisory statistics, KPMG and ECB calculations. Notes: “New default inflow” accounts for new NPLs originated in euro area countries. “NPL reduction” captures cures, liquidations and write-offs. The table in the middle panel should be read from left to right, e.g. a flow from Stage 1 to Stage 3 can be found in row 1, column 3.
28 Cure rates are proxied by the share of loans migrating from Stage 3 to Stages 1 and 2.
6.2
2.9 -1.7
-3.2
-0.43.8
0
2
4
6
8
10
NPL
ratio
Q4
2016
New
def
ault
inflo
w
NPL
sal
es
NPL
redu
ctio
n
Tota
l loa
ns
NPL
Q4
2018
0
10
20
30
40
50
60
Q3
2016
Q4
2016
Q1
2017
Q2
2017
Q3
2017
Q4
2017
Q1
2018
Q2
2018
Q3
2018
Q4
2018
Q1
2019
Q2
2019
Ong
oing
GreeceItalySpainPortugalCyprusIrelandtotal
Q4 2018
Euro area High-NPL banks
Low-NPL banks
to 1 to 2 to 3 to 1 to 2 to 3 to 1 to 2 to 3
from 1 2.31 0.22 3.59 0.31 2.10 0.21
from 2 1.77 0.30 3.37 0.67 1.51 0.24
from 3 0.06 0.18 0.11 0.56 0.05 0.12
Q3 2018
from 1 1.97 0.16 2.81 0.23 1.86 0.15
from 2 1.80 0.26 2.82 0.34 1.68 0.25
from 3 0.04 0.13 0.07 0.20 0.04 0.12
Q2 2018
from 1 1.68 0.11 2.37 0.18 1.60 0.10
from 2 1.59 0.19 2.24 0.24 1.50 0.18
from 3 0.05 0.13 0.06 0.15 0.05 0.12

Financial Stability Review, May 2019 – Euro area banking sector
71
The provisioning coverage of remaining NPLs also improved year on year, although trends diverged somewhat across countries. Significant banks’ aggregate coverage ratio notably improved in the first quarter of 2018, as a number of banks increased provisions under the transitional arrangements for IFRS 9, but declined thereafter. This suggests that some of the additional provisions that had been made in early 2018 were consumed by NPL reductions during the year. Trends in coverage ratios diverged somewhat across high-NPL countries after the first quarter of 2018, ranging from a significant decline in Ireland to a further increase in Portugal (see Chart 3.8, left panel). Dispersion also remains wide across countries in the coverage of “underperforming” (i.e. Stage 2) assets, with a shift towards slightly lower coverage levels during 2018 (see Chart 3.8, right panel).
From a policy perspective, a further reduction in banks’ NPLs and the prevention of their renewed build-up could be supported by the timely implementation of proposals contained in the European Commission’s package of measures that would help tackle high NPL ratios.29 In this regard, the European Commission’s package includes proposals for: (i) a directive on credit servicers, credit purchasers and the recovery of collateral, which would remove legal impediments to the transfer of NPLs by banks to non-banks, including harmonisation of the licensing requirements for third-party loan servicers; (ii) an amendment of the Capital Requirements Regulation (CRR) to introduce minimum levels of provisioning for future NPLs; and (iii) a blueprint for the setting-up of national asset management companies. From a macroprudential perspective, borrower-based measures, among others, seem well suited to avoiding or mitigating the vulnerabilities in the first stage of the life cycle of potential NPLs.30
29 See Commission measures to address the risks related to NPLs, European Commission, March 2018. 30 See Macroprudential approaches to non-performing loans, European Systemic Risk Board, January
2019.

Financial Stability Review, May 2019 – Euro area banking sector
72
Chart 3.8 NPL coverage ratios diverged somewhat across countries following improvements in the first quarter of 2018, while the coverage of Stage 2 assets dropped in the majority of countries last year
Coverage ratio in high-NPL countries (left panel) and coverage ratios of Stage 2 assets (x-axis) and Stage 3 assets (y-axis) at country level (right panel) (Q4 2015-Q4 2018, Q1-Q4 2018, percentages)
Source: ECB supervisory data.
Improvements in banks’ capital ratios paused in 2018, mainly reflecting the one-off impact of IFRS 9 adoption
Improvements in euro area banks’ regulatory capital ratios paused in 2018, mainly due to the introduction of IFRS 9 at the beginning of the year. Banks’ Common Equity Tier 1 (CET1) ratios experienced a one-off decline in the first quarter of 2018, mainly reflecting the impact of IFRS 9 first-time adoption, but remained broadly stable thereafter (see Chart 3.9, left panel). The negative gap between the capital ratios of countries more affected by the crisis and those of the other countries widened further, reaching more than 2 percentage points at end-2018. Since 2015 changes in the main drivers of capital ratios have markedly differed between the two country groups as deleveraging and de-risking was the main positive driver of capital ratio changes in countries more affected by the crisis, as opposed to increases in CET1 capital in the other countries (see Chart 3.9, middle panel). Bank risk-weighted assets (RWAs) began to increase on aggregate in 2018, on the back of a pick-up in lending growth. Looking at the different risk types, credit RWAs drove the overall growth of risk exposures, with an increase in market RWAs also contributing to a lesser extent (see Chart 3.9, right panel).
0
10
20
30
40
50
60
70
80
Q4 2015 Q4 2016 Q4 2017 Q4 2018
IEITSI
PTCYGR
0
10
20
30
40
50
60
70
0 2 4 6 8 10
Q1 2018Q4 2018

Financial Stability Review, May 2019 – Euro area banking sector
73
Chart 3.9 Improvements in banks’ regulatory capital ratios paused in 2018, while patterns of capital ratio changes markedly differed between country groups
Transitional CET1 ratios (left panel) and a decomposition of CET1 ratio changes since 2015 by country group (middle panel) as well as a decomposition of RWA changes (right panel) (Q4 2015-Q4 2018, left panel: percentages, middle and right panels: percentage points)
Sources: ECB supervisory data and ECB calculations. Notes: Countries more affected by the crisis include Cyprus, Greece, Ireland, Italy, Portugal, Slovenia and Spain. The vertical line in the left panel refers to the introduction of IFRS 9 rules. Decompositions in the middle and right panels are based on weighted averages for the respective country groups. CVA stands for credit valuation adjustment.
Breakdowns of capital requirements and buffers by size also reveal substantial heterogeneity, with buffers generally positively correlated with (past) profitability. An analysis of the different size groups shows that, on average, the largest banks hold the lowest capital buffers relative to minimum requirements (see Chart 3.10, left panel). The observed differences in capital buffers could be due to a number of factors, including more efficient management of capital at larger banks, currently limited access to profitable investment opportunities for smaller banks, as well as differences in the cost of capital.31 In general, buffers are positively correlated with past profitability, as measured by average ROE in 2015-17. In fact, the median buffer for banks with the highest profitability was nearly twice as large as the median for banks in the lowest profitability quartile (see Chart 3.10, right panel).
31 The smallest banks face more stringent capital requirements mainly due to higher O-SII (other
systemically important institution) buffer requirements, reflecting in particular the heterogeneity of O-SII buffer application and phase-in across the banking union. Despite being small, many banks in this size group are deemed systemically important for their domestic economy and the systemic risk buffer (SRB) is also activated in some of their home countries.
8
9
10
11
12
13
14
15
16
Q4
2015
Q1
2016
Q2
2016
Q3
2016
Q4
2016
Q1
2017
Q2
2017
Q3
2017
Q4
2017
Q1
2018
Q2
2018
Q3
2018
Q4
2018
All countriesCountries less affected by the crisisCountries more affected by the crisis
-2.0
-1.5
-1.0
-0.5
0.0
0.5
1.0
1.5
2.0
Euro area Countriesless
affected bythe crisis
Countriesmore
affected bythe crisis
CET1 capitalTotal assetsAverage risk weightCET1 ratio change
-3.5
-3.0
-2.5
-2.0
-1.5
-1.0
-0.5
0.0
0.5
1.0
1.5
2016 2017 2018
All countries
Total RWAsCredit riskMarket riskOperational riskCVA and other

Financial Stability Review, May 2019 – Euro area banking sector
74
Chart 3.10 Buffers over minimum capital requirements differ across banks of different sizes, while they are positively correlated with past ROE
Composition of total capital ratios and buffers over minimum requirements by size group (left panel) and buffers over minimum requirements by ROE quartile (right panel) (Q4 2018, percentages; left panel: quartiles are based on size as measured by total assets in 2018; right panel: quartiles are based on average ROE for 2015-17)
Sources: ECB supervisory data and ECB calculations. Notes: CCyB corresponds to the rate of the home country of the bank. AT1 stands for additional Tier 1, CCoB for capital conservation buffer, CCyB for countercyclical capital buffer, G-SII for global systemically important institution, O-SII for other systemically important institution, P2R for Pillar 2 requirement, SRB for systemic risk buffer and T2 for Tier 2.
Similar to risk-weighted ratios, the improvement in euro area banks’ leverage ratios also paused in 2018. While the median transitional leverage ratio of significant institutions was broadly unchanged from a year earlier, there was a drop in the fully loaded ratio (see Chart 3.11, left panel). Differences between global systemically important banks (G-SIBs) and other banks persisted as the median transitional leverage ratio for euro area G-SIBs stood at 4.8% at end-2018, compared with a median of 6.1% for the whole sample. Furthermore, euro area G-SIBs’ leverage ratios continue to compare unfavourably with the ratios of many of their global peers (see Chart 3.11, right panel).
0% 5% 10% 15% 20%
Biggest banks
3rd quartile
2nd quartile
Smallest banks
Pillar1P2RCCoBG-SII/O-SII/SRBCCyBAT1/T2 shortfallVoluntary buffer
0%
2%
4%
6%
8%
10%
12%
14%
Top quartile 2nd quartile 3rd quartile Bottomquartile
MedianInterquartile range

Financial Stability Review, May 2019 – Euro area banking sector
75
Chart 3.11 The improvement in banks’ leverage ratios also paused in 2018, while euro area G-SIBs continue to lag behind their international peers
Significant institutions’ leverage ratios (left panel) and euro area G-SIBs’ leverage ratios in international comparison (right panel) (left panel: Q4 2014-Q4 2018, percentages; right panel: 2015-18, percentages)
Sources: ECB supervisory data, SNL and ECB calculations.
Looking ahead, the final Basel III revisions will require further adjustments in banks’ capital in the future. The recently published impact assessment by the European Banking Authority (EBA) showed that, based on June 2018 data, the implementation of Basel III would likely increase the minimum required capital for relevant EU banks by nearly 20%, corresponding to a decline of more than 3 percentage points in the aggregate CET1 ratio relative to the fully phased-in CRR/CRD IV ratio.32 According to the EBA’s impact assessment, the output floor and operational risk frameworks are the two main drivers of higher capital requirements under the final Basel III framework, followed by credit risk and credit valuation adjustments (CVAs), with the relative importance of these factors varying across different groups of banks.
Benign cyclical conditions supported banks’ credit quality in 2018, but market-based measures signal increasing credit risk albeit from low levels
Credit risk measures reported by banks remained subdued in a maturing business cycle, but expectations of a slowdown in economic growth point to higher risks in the future. Credit risk measures, such as reported probabilities of default and expected loss ratios, did not signal an increase in the riskiness of banks’ credit portfolios, with the exception of a small uptick in risk measures for small and
32 See the March 2019 EBA report on the Basel III monitoring exercise. Revisions to the standardised
approach for credit risk, the IRB (internal ratings-based) framework, the CVA framework, the operational risk framework and the leverage ratio (revised exposure definition, G-SIB buffer) will be implemented as of 1 January 2022. The output floor will be phased in from 1 January 2022, with full implementation as of 1 January 2027.
0
1
2
3
4
5
6
7
8
Euro area OtherEurope
NorthAmerica
Japan China
20152016
20172018
3
4
5
6
7
8
9
Q4 2014 Q4 2015 Q4 2016 Q4 2017 Q4 2018
Median (transitional)Median (fully loaded)Interquartile range (transitional)

Financial Stability Review, May 2019 – Euro area banking sector
76
medium-sized enterprise (SME) loans in the latter part of 2018 (see Chart 3.12). These trends are consistent with economic growth having remained supportive to low default rates in much of 2018.
Chart 3.12 Credit risk measures reported by banks either continued to improve or were broadly stable in 2018, except for a slight pick-up in risk measures for SME portfolios
Probability of default (left panel) and expected loss ratio by portfolio (right panel) (Q4 2015-Q4 2018, percentages)
Sources: ECB supervisory data and ECB calculations. Note: Based on IRB risk parameters for a balanced sample of 48 SIs.
Market-based measures and loan loss provisioning forecasts point to some worsening in the credit risk outlook for 2019-20. Expected default frequencies for listed euro area companies have signalled a pick-up in credit risk since mid-2018 (see Chart 1.11 in Chapter 1), although they remained below their long-term averages. Similarly, forecasts of loan loss provisioning for 2019-20 have been raised by market analysts and in the ECB baseline projections, pointing to a deterioration in the credit risk outlook in line with expectations of a deceleration in economic growth (see Chart 3.4, right panel, and Chart 3.20 in Section 3.2).
Credit growth remained robust in the banking sector, although showing signs of moderation. The annual growth rate of euro area monetary financial institutions’ adjusted loans in the non-financial corporation (NFC) and household sectors remained in the range of 3-4%, but the pace of NFC loan growth moderated slightly (see Chart 3.13, left panel). Consumer lending continued to be the fastest-growing segment, but growth rates have slowed somewhat since mid-2018, possibly reflecting both demand-side factors and increased supervisory scrutiny (see Section 1.3). Results of recent euro area bank lending surveys suggest that the easing of credit standards may have come to an end in recent quarters, while rejection rates for loans to NFCs and households continued to increase.33
In some segments, banks with stronger lending growth report somewhat higher credit risk measures. Bank-level data (for IRB portfolios) suggest that banks with
33 See the April 2019 euro area bank lending survey.
0.0
0.5
1.0
1.5
2.0
2.5
3.0
Q4 2015 Q4 2016 Q4 2017 Q4 2018
NFC (excl. SME)SME
RREConsumer
0.0
0.1
0.2
0.3
0.4
0.5
0.6
0.7
0.8
0.9
1.0
Q4 2015 Q4 2016 Q4 2017 Q4 2018
NFC (excl. SME)SME
RREConsumer

Financial Stability Review, May 2019 – Euro area banking sector
77
stronger consumer and SME lending growth since end-2015 have tended to take on higher credit risk, as illustrated by higher median expected loss ratios for banks with above-median growth rates (see Chart 3.13, right panel). No such relationship between growth and risk can be seen in large NFC and residential real estate (RRE) portfolios. Overall, this suggests that pockets of risk may have been developing in a benign credit environment, which could be unearthed in the event of a more severe and prolonged economic slowdown than currently anticipated.
Chart 3.13 Credit growth remained robust, with signs of moderation in the NFC sector, while banks with stronger consumer and SME lending growth appear to have higher credit risk in their portfolios
Annual growth rate of MFI loans in the euro area (left panel) and expected loss ratio by portfolio for banks with above and below-median growth rates (right panel) (left panel: Jan. 2010-Apr. 2019, percentages; right panel: Q3 2018, median expected loss ratios)
Sources: ECB balance sheet items data and ECB supervisory data. Note: Based on IRB risk parameters for a balanced sample of 48 SIs.
Funding market conditions improved, but the need to build up bail-inable buffers may pose challenges for some banks
On aggregate, euro area banks’ funding structures and liquidity ratios have remained stable. The funding mix of euro area banks remained broadly unchanged in 2018, while their aggregate liquidity coverage ratio (LCR) slightly increased year-on-year (see Chart 3.14). That said, heightened volatility in government bond markets in the second and third quarters of 2018 had a negative, albeit small, impact on some banks’ LCRs through the revaluation of sovereign bonds held as high-quality liquid assets. Banks’ aggregate net stable funding ratio (NSFR) remained above 100%, but NSFRs continued to vary widely across banks, with some banks still having shortfalls.34 While the NSFR is expected to become a binding requirement only from
34 See the March 2019 EBA report on the Basel III monitoring exercise.
-6
-4
-2
0
2
4
6
8
10
2010 2012 2014 2016 2018
Household loans (adjusted)NFC loans (adjusted)Consumer loansLending for house purchase
0.0
0.2
0.4
0.6
0.8
1.0
1.2
above below above below above below above below
Consumer SME NFC (excl.SME)
RRE
Median

Financial Stability Review, May 2019 – Euro area banking sector
78
2021 under the CRR II/CRD V, it could lead to higher issuance needs for some banks in the future.
Chart 3.14 Euro area banks’ funding structure and liquidity ratios have been stable
Split of bank funding by type and liquidity ratios (Q4 2014-Q4 2018, percentages)
Sources: ECB supervisory data and ECB calculations.
Following a marked deterioration in late 2018, market funding conditions eased in the first half of 2019. Bank bond spreads have tightened since early 2019 across all seniorities and bond types, reversing much of the funding cost increases observed in late 2018 and reducing cross-country differences (see Chart 3.15). These improvements notwithstanding, the cost of issuing bank bonds is still above the lows observed in early 2018 and remains vulnerable to abrupt changes in risk sentiment, including a possible aggravation of sovereign risk concerns.
80
90
100
110
120
130
140
150
0
10
20
30
40
50
60
70
80
90
100
Q42014
Q12015
Q22015
Q32015
Q42015
Q12016
Q22016
Q32016
Q42016
Q12017
Q22017
Q32017
Q42017
Q12018
Q22018
Q32018
Q42018
DepositsDebt securities issuedRepurchase agreementsDerivatives
Short positionsOther financial liabilitiesLCR (right-hand scale)NSFR (right-hand scale)

Financial Stability Review, May 2019 – Euro area banking sector
79
Chart 3.15 Bank bond spreads tightened in the first few months of 2019, which was coupled with reduced fragmentation in the cost of debt funding
Average Z-spreads on different debt instruments (left panel) and spreads of non-preferred senior bonds in selected countries (right panel) (Jan. 2018-May 2019, basis points)
Sources: iBoxx and ECB calculations. Notes: NPS/HoldCo stands for non-preferred senior and holding company debt. Z-spreads are defined as the difference (in basis points) between the yield to maturity of a bank’s bond and the yield of a maturity-matched euro swap.
Benefiting from improved funding conditions, euro area banks stepped up their debt issuance activity in the first few months of 2019. An increase was seen in most instrument classes, from covered bonds through non-preferred senior debt to additional Tier 1 (AT1) instruments (see Chart 3.16, left panel). Looking at country developments, banks in France, Italy and the Netherlands accounted for most of the year-on-year increase in issuance, with Italian banks benefiting from a positive spillover from improved sovereign funding conditions (see Chart 3.16, right panel).
0
100
200
300
400
500
600
700
800
900
01/18 07/18 01/19
AT1CoveredNPS/HoldCo
Senior unsecuredT2
0
50
100
150
200
250
300
350
400
450
500
01/18 07/18 01/19
DEES
FRIT

Financial Stability Review, May 2019 – Euro area banking sector
80
Chart 3.16 Bank bond issuance picked up in early 2019, mainly driven by stronger covered bond issuance activity
Euro area banks’ annual and year-to-date debt issuance by debt type (left and middle panels) and year-to-date debt issuance by country (right panel) (2007-18, 2016-19, € billions)
Sources: Dealogic and ECB calculations. Notes: Issuances in the year-to-date period up to 7 May. ABS stands for asset-backed securities and NPS/HoldCo stands for non-preferred senior and holding company debt.
Notwithstanding these improvements, banks’ need to issue more TLAC/MREL-eligible bonds may pose challenges for some banks over the next years. While the refinancing of maturing bonds over the next three years appears manageable, the issuance of new TLAC (total loss-absorbing capacity)/MREL (minimum requirement for own funds and eligible liabilities)-eligible debt might prove challenging for some banks, in particular smaller banks35 and/or those banks with lower ratings (see also Box 6). A possible increase in funding costs might complicate these banks’ efforts to build up the necessary loss-absorption capacity and could weigh on their profitability. Furthermore, while the launch of the new series of targeted longer-term refinancing operations (TLTRO-III) should help banks to refinance maturing TLTRO-II funds, some banks with weaker funding profiles still need to develop plans for replacing central bank funding with market funding, at least in part, which could add to funding cost pressures for these banks in the medium term.
For some banks, a deterioration in bond funding conditions might also be triggered by possible rating downgrades. While the majority of euro area banks maintain stable credit rating outlooks, negative rating outlooks outweigh positive outlooks in many countries (see Chart 3.17, left panel), suggesting that, over the next 12 months, downgrades are likely to follow. The impact of possible downgrades may be most pronounced for those banks whose ratings may be pushed into non-investment-grade territory. Due to the non-linear relationship between a bank’s
35 See “Bond funding of euro area banks: progress in the issuance of loss-absorbing instruments”, Financial
Stability Review, ECB, November 2018, Box 7.
0
100
200
300
400
500
600
700
800
2007 2009 2011 2013 2015 2017
Annual debt issuance
ABSCoveredSenior unsecuredNPS/HoldCoT2AT1
0
50
100
150
200
2016 2017 2018 2019
Year-to-date debt issuance
0
50
100
150
200
2016 2017 2018 2019
FRDEITESNLOther countries

Financial Stability Review, May 2019 – Euro area banking sector
81
rating and its funding costs, this might lead to substantially higher funding costs (see Chart 3.17, right panel) and lower issuance volumes.
Chart 3.17 Some banks face an increased risk of rating downgrades, which might lead to higher funding costs and weigh on their profitability
Long-term issuer ratings and outlook of euro area banks (left panel) and debt instrument ratings (x-axis) vs. yield to maturity (y-axis) for bonds of euro area banks (right panel) (left panel: rating grades and percentage shares; right panel: percentages)
Sources: DBRS, Fitch, iBoxx, Standard & Poor’s, Moody’s and ECB calculations.
Box 6 Recent developments in and the outlook for global bank ratings
Prepared by Magnus Andersson, Filippo Busetto and Benjamin Klaus
Despite criticism in the aftermath of the global financial crisis, the ratings assigned by the major credit rating agencies continue to play a key role for fixed income investors. Credit ratings can be considered as an overall assessment of the creditworthiness of non-financial and financial corporates. As acquiring information can be costly, they are particularly relevant for the investment decisions of fixed income investors. The classification of issuers and securities into investment grade and high yield strongly affects institutional demand and might amplify the cyclicality of banks’ asset prices and funding costs during a downturn. Against this background, this box examines trends in credit ratings of listed banks across major advanced economies with a special focus on the euro area and discusses potential financial stability implications.
AA
A
BBB
BB
B
CCCNon-investment-grade
0%
50%
100%
DE BE FR AT LU NL MT FI IE ES IT SI PT CY GR
NegativeStablePositive
0
1
2
3
4
5
6
7
8
9
10
AA A BBB BB B CCC
Non-investment-grade
Senior unsecuredSubordinated

Financial Stability Review, May 2019 – Euro area banking sector
82
Chart A Ratings of euro area banks have deteriorated relative to those of their international peers
Median ratings for large global listed banks (left panel), price-to-book ratios (middle panel) and market-implied versus actual ratings (right panel) (left panel: June 1995-Mar. 2019; the grey shaded areas represent the peak-to-trough episodes in the euro area business cycle, as defined by the CEPR; brown squares refer to euro area non-financial corporates; middle panel: price-to-book ratios in Dec. 2018; right panel: actual ratings and market-implied ratings in Dec. 2018)
Sources: Standard & Poor’s, Moody’s, Fitch Group, Centre for Economic Policy Research (CEPR) and ECB calculations. Notes: Left panel: the sample consists of 22 euro area banks, 16 US banks and 16 Japanese, Scandinavian, Swiss and UK banks. The sample is slightly reduced in the early part of the time series. The sample of euro area non-financial corporates includes 156 firms. Each agency’s individual bank ratings were converted into ordinary scales. Then the quarterly averages (across agencies) for each bank were computed. The aggregated economy-wide ratings were computed as the median across the banks. Right panel: the market-implied ratings are obtained by Moody’s with a Merton contingent claims approach, which uses share prices and information on the capital structure of the firms involved. Using the model, it is possible to derive an expected default frequency (EDF) for each firm which is later mapped to Moody’s rating scale. More specifically, single-entity EDFs are mapped into implied ratings by calculating median EDF measures per rating category using a “spot median” methodology. The median for a rating category captures the median of the most recent month’s EDF values for all the entities that are included in this rating category. The EDF range within a grade is computed from the median EDF of two adjacent rating grades using a geometric mean.
Euro area banks’ creditworthiness lags behind that of their main global competitors and euro area non-financial corporates. In order to gauge the secular trends in banks’ credit ratings across major advanced economies, a composite indicator was constructed (see Chart A, left panel).36 Four notable features can be inferred from the chart. First, the ratings of global banks remained broadly stable at favourable levels from the mid-1990s until the outbreak of the financial crisis. Second, during the 2007-08 crisis, bank ratings deteriorated and downgrades were particularly pronounced for US banks. Third, a second wave of negative rating events took place at the peak of the euro area sovereign debt crisis in 2011-12. Given the latter’s origin and severity, there were larger downgrades of euro area-domiciled banks compared with those banks operating in other advanced economies. The negative ratings gap between euro area and other international banks has remained fairly stable after the sovereign debt crisis. Fourth, while euro area banks had a better rating than their non-financial corporate counterparts until the euro area sovereign debt crisis, the situation reversed afterwards.
36 Rating agencies aim to form an opinion about each issuer’s credit risk which entails an assessment of the
ability to meet its financial obligations in full and on time. Each rating agency uses its own methodology. For financial institutions, the agencies form their rating opinions based on an assessment of the issuer’s solvency, profitability and liquidity outlooks.
Market-impliedratings below actual ratings
Lower ratings
Actu
al ra
tings
Market-implied ratings
US banksEuro area banks
Lower ratings
0.0
0.2
0.4
0.6
0.8
1.0
1.2
1.4
1.6
1.8
US banksEuro area banks
1995 2000 2005 2010 2015
AAA
AA+
AA
AA-
A+
A
A-
BBB+
BBB
All banksEuro area banksUS banksJapanese, Scandinavian, Swiss and UK banks

Financial Stability Review, May 2019 – Euro area banking sector
83
Chart B While the number of downgrades of euro area banks is currently small compared with 2011-12, the outlook highlights the potential for downgrades going forward
Number of upgrades/downgrades for large US and euro area banks (left panel) and recent distributions of ratings and outlooks for euro area and US banks (right panel) (left panel: 1995-2018, number of upgrades/downgrades; right panel: March 2019)
Sources: Standard & Poor’s, Moody’s, Fitch Group and ECB calculations. Note: The sample consists of 22 euro area banks and 16 US banks.
Consistent with the rating assessment, most euro area banks are trading at price-to-book (P/B) ratios below those of their international peers. Over the past few years the bulk of euro area banks have traded at P/B ratios below one (see Chart A, middle panel). This contrasts with the valuations of banks in other countries, such as the United States (see also Box 4). P/B ratios below one would indicate that those banks are not earning their corresponding cost of equity. Under certain assumptions, it is possible to derive an implied level of ratings based on market pricing (see Chart A, right panel). Applied to US and euro area banks, such an exercise reveals that, for most banks, the ratings inferred from market pricing are below actual ratings. This feature is particularly pronounced for euro area banks. Thus, markets seem to be somewhat more concerned about bank fundamentals compared with the views expressed by rating agencies.
A larger than expected economic downturn could spark further downgrades of banks’ ratings. Previous recession periods have triggered sharp increases in bank rating downgrades (see Chart B, left panel). A closer inspection of the current situation shows that the distribution of euro area bank ratings is wider than for US banks and, in addition, a large number of euro area banks are rated below A (see Chart B, right panel). Furthermore, rating agencies have assigned a negative outlook to several euro area banks which might push them into the non-investment-grade space, with potential consequences for their funding costs. A negative outlook is not necessarily a precursor of a change in ratings, but still indicates the direction in which a rating is likely to move over a one-to-two-year period.
To conclude, the sensitivity of euro area banks to external ratings points to risks and vulnerabilities for the euro area banking system. This box has highlighted that the creditworthiness of euro area banks lags behind that of their main global competitors. In addition,
0
20
40
60
1995 2000 2005 2010 2015
Euro area rating events
0
10
20
30
40
1995 2000 2005 2010 2015
US rating events
UpgradesDowngrades
0
2
4
6
AAA AA+ AA AA- A+ A A- BBB+ BBB BBB- BB+or
worse
Euro area ratings and outlooks
0
2
4
6
AAA AA+ AA AA- A+ A A- BBB+ BBB BBB- BB+or
worse
US ratings and outlooks
Stable outlookPositive outlookNegative outlook

Financial Stability Review, May 2019 – Euro area banking sector
84
rating agencies have assigned a negative outlook to several lower-rated investment-grade euro area banks. A worsening of the economic outlook could spark a string of downgrades to the non-investment-grade space which could lead to higher funding costs and lower profitability. To safeguard themselves against potential downgrades, euro area banks need to tackle a number of structural challenges that impede their ability to generate capital organically.
Late-cycle market volatility has the potential to negatively affect banks’ capital ratios, in particular through the revaluation of sovereign bond portfolios
Banks’ exposures to domestic sovereign debt were broadly stable on aggregate, but some banks remain vulnerable to a possible aggravation of sovereign risk concerns. Banks’ holdings of domestic sovereign debt remain elevated or have even increased since early 2018 in some euro area countries, including Italy and Portugal (see Chart 3.18, left panel). Despite some moderation in sovereign risk perceptions over the last few months (see Chapter 1), the capital positions of banks with sizeable holdings of fair-valued sovereign bonds remain vulnerable to sudden increases in sovereign risk premia. At the end of 2018 around two-thirds of significant institutions’ total government bond portfolio was subject to mark-to-market valuation, meaning that the possible negative impact of revaluations feeds through directly to equity or to their income statement. Despite some decline in their share during the year, fair-valued government bonds still comprise the biggest part of the total sovereign debt portfolio in many countries, including those with higher sovereign risk perceptions (see Chart 3.18, right panel).

Financial Stability Review, May 2019 – Euro area banking sector
85
Chart 3.18 Banks’ exposures to domestic sovereign debt remain high in some countries, which could increase their capital volatility
Banks’ holdings of domestic sovereign debt in selected euro area countries (left panel) and the composition of significant institutions’ government bond portfolio by accounting classification (right panel) (left panel: Jan. 2011-Apr. 2019, percentage of total assets; right panel: Q1 2018, Q4 2018, percentages)
Sources: ECB balance sheet item and supervisory statistics. Notes: Left panel: based on MFI balance sheet statistics (unconsolidated). Right panel: FVOCI stands for fair value through other comprehensive income.
More broadly, possible increases in financial market volatility have the potential to negatively affect banks’ capital ratios through their impact on risk-weighted assets. Heightened equity and debt market volatility in the fourth quarter of 2018 contributed to an increase in banks’ market risk exposures as measured by value at risk (see Chart 3.19, left and middle panels). In turn, gyrations in financial markets could also have an effect on banks’ capital ratios via their impact on capital requirements for market risk. In fact, historical correlations between volatility measures and banks’ market risk exposures show that an increase in stock market volatility tends to increase market risk-weighted assets for most institutions, while the impact of a widening of credit spreads on capital requirements varies widely across banks (see Chart 3.19, right panel). Finally, heightened volatility may also aggravate lingering market liquidity risks, resulting in migrations of fair value assets to categories characterised by higher uncertainty with regard to liquidity and the observability of valuation inputs (e.g. Level 3 assets) (see Box 7).
0
2
4
6
8
10
12
2011 2012 2013 2014 2015 2016 2017 2018 2019
DEESFR
ITPTEA
0
10
20
30
40
50
60
70
80
90
100
EA Q
1 20
18
EA Q
4 20
18 GR
DE PT IT NL
ES FR SI AT BE CY
Trading/FV through P&LFVOCIAmortised cost

Financial Stability Review, May 2019 – Euro area banking sector
86
Chart 3.19 Heightened equity and debt market volatility in late 2018 contributed to an increase in banks’ market risk exposures, with a negative impact on capital ratios
Implied volatility (left panel), quarterly change in value-at-risk components (middle panel) and correlation of market RWAs with equity market volatility and credit spreads (right panel) (left panel: Jan. 2017-May 2019; middle panel: Q1 2017-Q4 2018, € billions; right panel: Q4 2014-Q4 2018, x-axis: correlation of market RWAs with equity market volatility; y-axis: correlation of RWAs with European corporate credit spreads for a sample of 21 banks)
Sources: Bloomberg, ECB and ECB calculations. Note: Implied volatility: equity – EURO STOXX index, debt – MOVE index (US Treasuries), FX G7 – JP Morgan index of seven major currency pairs.
Box 7 Gauging systemic risks from hard-to-value assets in euro area banks’ balance sheets
Prepared by Michał Adam and Katri Mikkonen
Uncertainty associated with hard-to-value securities on bank balance sheets can affect market perceptions of banks, especially during periods of stress. Fair value assets on bank balance sheets are classified into three categories: (i) those which are easy to value and based on quoted market prices (level 1 (L1) assets); (ii) those that are harder to value and only partially derive from quoted market prices (level 2 (L2) assets); and (iii) those that are particularly complex and the valuation of which is based on models instead of observed prices (level 3 (L3) assets). While the accounting standards provide the principles for the allocation of assets to the L2/L3 categories, they also leave some room for interpretation, which can result in different choices across banks. Valuation uncertainties can be problematic in times of stress should they lead investors to mistrust the value of banks’ assets, and in turn trigger liquidity or deleveraging pressures – not least if valuations behave in a correlated manner across banks or are concentrated in systemic banks. Worsening market liquidity conditions that would possibly also lead to reclassifications of assets into the L3 category could further amplify the effect. Against this background, this box first looks at the magnitude and distribution of L2/L3 assets in euro area banks’ balance sheets, and second at their impact on market perceptions of banks through the lens of price-to-book (P/B) ratios during normal and stressed times.
0
20
40
60
80
100
120
140
160
180
0
5
10
15
20
25
30
35
2017 2018 2019
Debt (right-hand scale)EquityFX G7
-1,000
-800
-600
-400
-200
0
200
400
600
Q1 2017 Q1 2018
DebtEquityForeign exchangeCommodities
-1.0
-0.8
-0.6
-0.4
-0.2
0.0
0.2
0.4
0.6
0.8
1.0
-1 -0.5 0 0.5 1

Financial Stability Review, May 2019 – Euro area banking sector
87
Chart A Level 2 and level 3 assets in the euro area are concentrated in large and complex banks and significantly declined after the financial crisis
Amount and share of L2/L3 fair value assets in bank balance sheets for various business models (left panel) and L2/L3 assets in the balance sheets of euro area G-SIBs (right panel) (left panel: Q4 2018, € trillions and percentages; right panel: 2006-18, percentages)
Sources: ECB supervisory data (left panel), SNL Financial (right panel) and ECB calculations. Notes: Left panel: based on a sample of 106 significant institutions. Right panel: based on a panel of eight euro area G-SIBs (2018 classification). The increase in L2/L3 assets in 2018 was driven by loans and should be viewed in the context of the introduction of IFRS 9 accounting standards, which became effective in that year. See also the November 2018 FSR.
The holdings of L2/L3 assets by euro area banks have significantly decreased since the peak at the outbreak of the financial crisis, and are concentrated in the balance sheets of global systemically important banks (G-SIBs). L2/L3 assets totalled €2.71 trillion and €192 billion, respectively, in the fourth quarter of 2018 (see Chart A). On aggregate, L2 assets constituted 13% and L3 assets 0.9% of total assets. The distribution of L2/L3 assets and the type of assets within categories closely reflect the business models of the banks. L2 assets mostly consist of derivatives and loans. Moreover, disclosures by some of the largest holders of L2 loans reveal that these consist mostly of repurchase agreements, usually backed by high-quality collateral. In contrast, the composition of L3 assets reflects the higher heterogeneity related to these more complex assets (see Chart B, left panel).
0
5
10
15
20
25
30
35
0
1
1
2
2
3
3
4
Corporate/
Wholesalelender
Diversifiedlender
G-SIB Retail lender Universalbank
L2 assetsL3 assetsL1 assetsFair value assets to total assets (right-hand scale)
0.0
0.5
1.0
1.5
2.0
2.5
0
5
10
15
20
25
30
35
2006 2008 2010 2012 2014 2016 2018
Share of L2 assets in total assetsShare of L3 assets in total assets (right-hand scale)

Financial Stability Review, May 2019 – Euro area banking sector
88
Chart B Level 3 assets are a heterogeneous asset category and econometric analysis shows they can have a negative, albeit small, impact on bank valuations
Share of asset types in L2 and L3 assets (left and middle panels); hypothetical increase in price-to-book ratios if L3 assets were set to zero (right panel) (left panel: Q4 2015 and Q4 2018, percentages; right panel: 2007-18; x-axis: price-to-book ratio; y-axis: hypothetical increase in price-to-book ratios; the bubble size is proportionate to the stock of L3 assets; yellow: G-SIBs; blue: non-G-SIBs)
Sources: ECB supervisory data (left and middle panels), SNL Financial (right panel) and ECB calculations. Notes: Left panel: based on a sample of 106 significant institutions. Right panel: based on a linear panel regression on a sample of 56 banks with cross-section and country-time fixed effects. Sample period: 2007-18. Robust standard errors are used. Regression controls include return on equity and an equity market volatility index (VIX). The results are robust to the sample selection, some possible non-linear relationships (using alternatively quarterly and yearly data, full sample and crisis/non-crisis period sub-samples, controlling for high and low levels of market volatility, excluding outliers, excluding banks with very large shares of fair value assets that could indicate very specific business models, and including euro area G-SIBs only), a broader set of controls (Tier 1 capital ratio, total assets, total amount of securities held, market beta, fair value assets and NPLs) and the specification of explanatory variables (shares in total assets and in fair value assets).
Equity markets seem to discount a higher level of hard-to-value assets in bank valuations, although the difference seems to be small. A panel regression on a sample of euro area banks shows a statistically significant negative relationship between L3 assets and a bank’s price-to-book ratio, which is illustrated through a simple counterfactual simulation in Chart B (right panel). At the same time, the economic significance of the result is low: a one percentage point increase in the share of L3 assets in total assets – which corresponds to a 50% increase in the stock of L3 assets – would lower the price-to-book ratio by only 2.6 percentage points on average. Importantly, from a systemic point of view, the impact remains small even for euro area G-SIBs with large L3 asset portfolios. Interacting L3 asset holdings with market volatility shows that the relationship becomes stronger when the VIX increases. This observation is congruent with the fact that the risks related to L2/L3 assets derive from the unobservability of valuation inputs and the underlying liquidity assumptions, rather than from asset quality. Finally, the analysis does not give conclusive evidence of an impact of an increase in L2 assets, supporting the stylised view that the valuation risk related to these assets – many of which are rather simple instruments held for risk management purposes – is not perceived to be as important.37
The weak impact of L3 assets on market valuations of banks should be viewed with caution as valuation uncertainties can disproportionally affect bank stock prices during periods of stress. The regression results show that the relationship between L3 assets and bank valuations has weakened in recent years. A possible interpretation is that the regulatory reforms at the global and European levels and the comprehensive assessment conducted when the Single Supervisory
37 Similar qualitative and quantitative results were also obtained for L2/3 liabilities which can be subject to
the same liquidity and valuation risks.
0%
20%
40%
60%
80%
100%
2015 2018 2015 2018
Level 2 Level 3
DerivativesEquities
DebtLoans
0.00
0.01
0.02
0.03
0.04
0.05
0.06
0.07
0.08
0 0.5 1 1.5 2
Hyp
othe
tical
incr
ease
in P
/B ra
tio
if L3
ass
ets
wer
e se
t to
zero
P/B ratio

Financial Stability Review, May 2019 – Euro area banking sector
89
Mechanism was set up have reduced uncertainty as to valuations of L2/L3 assets. Another, less benign, interpretation is that valuations are procyclical, which implies that the simple simulation above could underestimate the actual impact of L2/L3 assets on price-to-book ratios in the event of a future crisis. The observation that the estimated impact becomes stronger in times of high market volatility lends support to the latter procyclicality hypothesis and justifies close monitoring of these asset holdings.
Recent developments and open issues regarding the review of the European System of Financial Supervision and the EU banking reform package
Revisions to the macroprudential regulatory framework are enhancing the governance and efficiency of macroprudential policy in the European Union. Key developments in this regard include the review of the European System of Financial Supervision (ESFS) and of the Capital Requirements Regulation and Directive (CRR/CRD).
The political agreement reached by the EU co-legislators on the ESFS review in March 2019 is generally welcome. The establishment of both the European Supervisory Authorities and the European Systemic Risk Board (ESRB) was a significant achievement, which improved the coordination of financial regulation and supervision in the European Union. However, the experience gained so far suggests that the institutional framework would benefit from further adjustments, such as the acknowledgement of the establishment of the banking union in the ESFS framework, to ensure effective and consistent micro- and macroprudential supervision across Europe. The review of the ESRB is of particular importance from a macroprudential perspective. The agreed compromise will strengthen the governance of the ESRB by enhancing the role of the First Vice-Chair, providing the representatives of ECB Banking Supervision and the Single Resolution Board with non-voting membership in the ESRB General Board and increasing the transparency of the ESRB’s work. It is welcome that the ESRB’s governance will continue to reflect the importance of central banks’ role in the functioning of the ESRB and the fact that the ESRB relies on expertise, resources and infrastructure of the ECB.
The EU co-legislators also reached a political agreement on the EU banking reform package in February 2019. The finalised revision of the CRR/CRD IV will implement the Basel III framework in EU law, including the leverage ratio requirement, the net stable funding ratio requirement and the revised market risk capital framework. The details of the package were examined in previous issues of the FSR and in a related ECB Opinion.38
Going forward, the EU co-legislators need to aim for a full, consistent and timely implementation of the remaining elements of the Basel III regulatory
38 See Opinion of the European Central Bank of 8 November 2017 on amendments to the Union framework
for capital requirements of credit institutions and investment firms (CON/2017/46).

Financial Stability Review, May 2019 – Euro area banking sector
90
package. Several elements of the Basel III framework, including the fundamental review of the trading book and the “Basel III finalisation package” agreed by the Group of Central Bank Governors and Heads of Supervision in December 2017, still need to be implemented in EU law. These elements will form part of a separate legislative proposal by the European Commission and will include further amendments to the CRR II/CRD V.39 Full, consistent and timely implementation of Basel III, and agreed G20 reforms more broadly, is important to ensure that the G20 framework remains functional and delivers internationally consistent regulatory outcomes. The Basel III finalisation package delivers a better prudential framework overall by improving the balance between model-based elements and standardised elements and enhancing calibration of the standardised approach.
The targeted review of the macroprudential framework in the CRR/CRD IV primarily aims to clearly delineate the responsibilities of micro- and macroprudential authorities and improve the operational efficiency of the framework. Removing the use of the Pillar 2 requirements for macroprudential purposes is a key element of the new framework. Furthermore, in order to ensure that macroprudential authorities have sufficient tools available to effectively address systemic risks, new instruments and mechanisms have been introduced. For example, the capital buffer framework has been revised to allow the sectoral use of the SRB and the calibration range of the O-SII capital buffer has been increased. In addition, activation procedures have been streamlined (e.g. the notification procedures for the CCyB have been simplified), and a general review clause for the macroprudential framework has been introduced (with the review foreseen by 2022). A detailed overview of the ECB’s stance on these changes has been provided in a dedicated article in the ECB’s Macroprudential Bulletin.40
Looking ahead, a comprehensive review of the macroprudential framework is warranted to enhance the effectiveness of macroprudential policy. The targeted changes to the current framework already incorporate some of the lessons learned from experience. However, this should only be the first step towards a more thorough revision of the framework by 2022. A comprehensive review could reduce complexity, further streamline procedures, broaden mandatory reciprocity arrangements, enhance the coherence of the policy framework and extend the framework to include new tools where necessary.
In particular, it should be explored whether the macroprudential policy framework could be made more comprehensive by complementing capital-based instruments with borrower-based instruments in the EU legislation. Such instruments include limits on loan-to-value, loan-to-income or debt service-to-income ratios, which can be used to target vulnerabilities in mortgage markets. Given the synergies and complementarities among instruments, a comprehensive set of these tools should be provided for in the CRR/CRD, while taking
39 In this regard, the European Commission has initiated the legal process by launching a targeted
exploratory public consultation in March 2018 and issuing a call for advice to the EBA in May 2018. 40 See “Targeted review of the macroprudential framework”, Macroprudential Bulletin, Issue 5, ECB,
April 2018.

Financial Stability Review, May 2019 – Euro area banking sector
91
into account the specific characteristics of national real estate markets. This would allow macroprudential authorities to act in an efficient, effective and timely manner.
Moreover, the comprehensive review should also allow the extension of the macroprudential framework to cover non-banks. Here, the framework and the powers of the related authorities at the EU level need to be strengthened to address possible risks emerging in the securities markets and in the insurance and pension sectors. While more work in the area of macroprudential tools for the non-bank sector is needed, such instruments could include margin and haircut requirements for derivatives and securities financing transactions, and leverage and liquidity requirements for investment funds.
3.2 Evaluating the resilience of the euro area banking sector through scenario analysis
This section provides a quantitative assessment of the resilience and profitability of euro area financial institutions under both a baseline and an adverse scenario. The assessment of the impact of macro-financial scenarios on euro area banks is based on a macroprudential simulation exercise involving top-down stress-testing models and using bank-level granular supervisory data.41 The analysis covers about 100 large and medium-sized banking groups directly supervised by the ECB. Owing to methodological, scenario and sample differences, the results presented in this section are not comparable with the results of supervisory stress-test exercises, such as those coordinated by the European Banking Authority (EBA) and ECB Banking Supervision.
Evaluation of banks’ resilience and profitability under the baseline scenario
Real GDP growth in the baseline scenario has been revised down by 0.6 percentage points in 2019 (see Table 3.1). 42 As discussed in Chapter 1, the latest Eurosystem and ECB staff macroeconomic projections, which are based on market expectations, imply significantly weaker growth and also lower short and long-term interest rates. According to the March 2019 ECB staff projections, compared with the December 2018 Eurosystem staff projections, short-term interest rates are projected to be 20-30 basis points lower by 2021, and long-term interest rates about 40 basis points lower over the entire scenario horizon.
41 The methodology broadly follows Dees, S., Henry, J. and Martin, R. (eds.), “STAMP€: Stress-Test
Analytics for Macroprudential Purposes in the euro area”, ECB, February 2017. The calculations broadly follow the EBA methodology for the EU-wide stress tests, but several assumptions have been relaxed to provide more realism and some risk categories (e.g. operational risk and parts of market risk) have not been stressed. Most importantly, the conservative caps and floors on the interest rate pass-through have been relaxed with the aim of deriving a more plausible impact on net interest income.
42 For more details on the baseline projections, see the December 2018 Eurosystem staff macroeconomic projections and the March 2019 ECB staff macroeconomic projections.

Financial Stability Review, May 2019 – Euro area banking sector
92
Table 3.1 Main changes in the macroeconomic projections and related assumptions for the euro area between December 2018 and March 2019
2018 2019 2020 2021
Year-on-year real GDP growth Dec. 2018 1.9 1.7 1.7 1.5
Mar. 2019 1.9 1.1 1.6 1.5
Unemployment rate Dec. 2018 8.2 7.8 7.5 7.1
Mar. 2019 8.2 7.9 7.7 7.5
Three-month interest rate assumptions Dec. 2018 -0.3 -0.3 0.0 0.3
Mar. 2019 -0.3 -0.3 -0.2 0.0
Ten-year government bond yield assumptions Dec. 2018 1.1 1.4 1.7 1.9
Mar. 2019 1.1 1.0 1.3 1.5
Source: ECB. Note: The assumptions for three-month interest rates and ten-year government bond yields are exogenous to the projections, which are based on market expectations.
Weaker growth in the baseline scenario points to a potential decline of 0.7 percentage points in banks’ ROE by 2021. Based on the March 2019 macroeconomic projections, banks’ profitability is projected to slightly decline from 6.2% at end-2018 to 5.5% in 2019 and to then recover somewhat – driven primarily by an increasing slope of the yield curve – to 6.1% in 2021 (see Chart 3.20, left panel). This would nevertheless be some 0.7 percentage points below the level projected based on the December 2018 macroeconomic projections.43 The more subdued projected developments in bank profitability stem mainly from the combination of lower growth and lower short and long-term interest rates, which negatively affects net interest income (see Chart 3.20, right panel). The analysis assumes that some parts of the P&L account, such as administrative expenses and other operating income, stay constant over the projection horizon.44
43 It would also be slightly lower than the ROE projections presented in Special Feature A of the November
2018 Financial Stability Review, which were based on the December 2017 Eurosystem staff macroeconomic projections and a slightly different methodology.
44 This assumption is relaxed under the adverse scenario. Under the adverse scenario, the worst observation over the five years before the cut-off date is assumed to materialise in each year of the scenario horizon.

Financial Stability Review, May 2019 – Euro area banking sector
93
Chart 3.20 The worsening of macroeconomic projections could have an impact on banks’ profitability in the longer term
Distribution of ROE under the baseline scenario (left panel) and drivers contributing to the worsening of ROE between the December 2018 and March 2019 projections (right panel) (percentages, percentage point contributions)
Sources: Individual institutions’ financial reports, EBA, ECB and ECB calculations. Notes: The grey area in the left panel represents the distribution of banks’ observed/projected ROE between the 25th and 75th percentiles. The blue line represents the median observed/projected ROE across banks. The historical median is calculated for the sample of 100 SIs used for the impact assessment and, for this reason, it might differ from the median reported by other sources.
Under the baseline scenario, the solvency position of the sample of euro area significant institutions is projected to improve somewhat, reflecting weak but still positive economic growth forecasts. The aggregate CET1 capital ratio is projected to increase by about 1.8 percentage points to 15.7% by the end of 2021 (see Chart 3.21). This improvement is driven by retained net interest income and an increase in net fee and commission income which would lead to positive growth in pre-provision profits of about 5.5 percentage points, despite the negative impact from administrative and other operating expenses (-12.4 percentage points in total). As mentioned above, the results are not comparable with the EBA/ECB supervisory stress tests. For instance, the pre-provision profits are somewhat higher than what was observed in the 2018 EBA/ECB stress test for euro area banks45, which is mainly due to the fact that in the results reported here profits are supported by the removal of caps and floors on net interest income and that net fee and commission income is allowed to increase. The overall positive contribution of pre-provision profits would still outweigh the negative one of credit losses amounting to 1.8 percentage points.46
45 See, for example, SSM-wide stress test 2018 – Final results, ECB Banking Supervision, February 2019. 46 The projections in this section are done under the assumption of a static balance sheet.
-0.9%
-0.8%
-0.7%
-0.6%
-0.5%
-0.4%
-0.3%
-0.2%
-0.1%
0.0%
0.1%
2019 2020 2021
Credit risk contributionNet interest income contributionOther
2%
3%
4%
5%
6%
7%
8%
9%
2016 2017 2018 2019 2020 2021

Financial Stability Review, May 2019 – Euro area banking sector
94
Chart 3.21 Under the baseline scenario, banks’ solvency position would improve
Drivers of the CET1 ratio change under the baseline scenario (percentages, percentage point contributions)
Sources: Individual institutions’ financial reports, EBA, ECB and ECB calculations. Notes: PPP stands for pre-provision profits and includes net interest income, administrative expenses and net fee and commission income. CR stands for credit risk, MR for market risk and REA for risk exposure amount. Other includes other operating income and tax and dividend effects.
Evaluation of banks’ resilience under the adverse scenario
The adverse scenario assumes a severe deterioration of global macroeconomic conditions in the context of very low interest rates. The adverse scenario is a tail event, designed with the ECB models also used for the EBA stress-test scenarios.47 Events in the scenario reflect the materialisation of the systemic risks presented in the Overview.
The adverse scenario results in a maximum year-on-year decline of euro area real GDP of about 2.7 percentage points (see Table 3.2). Sovereign credit spreads would widen by up to 40 basis points in the majority of euro area countries and widen by about 100 basis points in countries where political uncertainty or debt sustainability concerns are higher (see Table 3.2). Following the drop in demand, residential property prices would decline by about 11% from 2018 levels (see Table 3.2) and stock prices by about 30%.
47 For a more detailed description of the scenario design, see Dees et al. (op. cit.) and Henry, J. and Kok, C.
(eds.), “A macro stress testing framework for assessing systemic risks in the banking sector”, Occasional Paper Series, No 152, ECB, October 2013. Regarding the tool used to calibrate financial shocks, see the technical note on the ESRB’s website.
13.9
15.7
5.5
0.3
1.8
0.3
2.0
12
14
16
18
20
CET1 capitalratio, end-2018
PPP CR MR REA Other CET1 capitalratio, end-2021

Financial Stability Review, May 2019 – Euro area banking sector
95
Table 3.2 Projections for the main macroeconomic and financial variables under the adverse scenario
Year-on-year growth in the worst year of the scenario
Real GDP (% change) Euro area -2.7
United States -2.5
Emerging Asia 2.3
Latin America -2.8
Unemployment rate (p.p. change) Euro area 2.3
United States 3.2
Emerging Asia 0.9
Latin America 3.5
House prices (% change) Euro area -11
Peak-to-trough
EURIBOR 0
Euro area ten-year government bond yield spread, group 1 100 bps
Euro area ten-year government bond yield spread, group 2 40 bps
Corporate bond spreads 200 bps
Euro area stock prices -20%
Source: ECB. Note: Group 1 consists of Cyprus, Greece, Italy, France and Portugal; Group 2 comprises the remaining euro area countries.
On aggregate, the euro area banking sector is assessed to be resilient to the materialisation of the main financial stability risks, but could face losses amounting to 3.4 percentage points of capital.48 The aggregate risk-weighted CET1 ratio falls from 13.9% to 10.5% by 2021 in the adverse scenario. Loan losses and lower net interest income are the main drivers of the CET1 ratio depletion compared with the baseline (see Chart 3.22). Thus, under the adverse scenario, loan losses are 2 percentage points higher in CET1 terms, while pre-provision profits are 4.1 percentage points lower compared with the baseline. The majority of euro area significant institutions would remain above the average CET1 capital demand of 10%49 under the adverse scenario. Only a few small banks would face severe solvency difficulties under the adverse scenario, falling below a 6% CET1 ratio.50
48 These results are not comparable with the EBA 2018 stress-test results due to differences in
methodology, scenarios and starting points, as well as the exclusion of operational risk and parts of market risk from this analysis.
49 This refers to the average total supervisory capital demand, which includes the macroprudential buffers but excludes the non-binding Pillar 2 guidance (i.e. Pillar 1, the Pillar 2 requirement, the capital conservation buffer, the systemic buffers and the countercyclical capital buffer); see the SSM SREP Methodology Booklet, 2018 edition.
50 These results do not take into account that under the adverse scenario macroprudential buffers might be used to cushion incurred losses.

Financial Stability Review, May 2019 – Euro area banking sector
96
Chart 3.22 Banks would be resilient to the materialisation of the main financial stability risks
Drivers of the CET1 ratio change under the adverse scenario (percentages, percentage point contributions)
Source: ECB calculations. Notes: PPP stands for pre-provision profits and includes net interest income, administrative expenses and net fee and commission income. CR stands for credit risk, MR for market risk and REA for risk exposure amount. Other includes other operating income and tax and dividend effects.
13.9
10.5
1.4
0.0
3.8
0.40.6
10
12
14
16
CET1 capitalratio, end-2018
PPP CR MR REA Other CET1 capitalratio, end-2021

Financial Stability Review, May 2019 – Non-bank financial sector
97
4 Non-bank financial sector
4.1 Non-bank financial institutions continued increasing their financing of the euro area economy
Euro area non-bank financial institutions have increased their share of credit provided to the real economy over the last six months. The size of the non-bank financial sector – which includes investment funds (IFs), money market funds (MMFs), financial vehicle corporations, insurance corporations, pension funds and remaining other financial institutions (OFIs) – increased only slightly in 2018, due to low inflows and valuation effects. At the same time, non-banks continued to provide significant financing to households, non-financial corporations (NFCs) and governments in 2018, both within and outside the euro area (see Chart 4.1). Investments in non-euro area
The euro area non-bank financial sector grew at a slower pace in 2018 than seen in recent years. But since the crisis, the role of non-banks in financing the real economy has steadily increased, mainly through the purchase of debt securities.
In light of high indebtedness and deteriorating credit quality, risks for non-banks could increase should corporate or sovereign debt be repriced or downgraded.
Global bond and equity funds experienced significant outflows at the end of last year, but there has been some rebound in bond funds since then with renewed signs of ongoing search-for-yield behaviour.
The share prices of insurers increased by 6% over the last six months, but weak investment income was a drag on their profitability.
Against this background, insurers have increased their exposure to risky assets, including to BBB-rated, high-yield bonds and alternative asset classes.
Non-bank financial sector Non-bank financial sector regulation
The post-crisis reform agenda has addressed some of the risks in the non-bank financial sector, but vigilance is needed about new and emerging risks from the sector.
To the extent that risks evolve at system level, with possible implications for real economy financing, there is a need for addressing these risks from a macroprudential policy perspective.
Against the background of the sector’s interconnectedness and its greater role in real economy financing, the regulatory approach should take into account interdependencies within the financial system, as well as with the broader economy.
Progress on the capital markets union (CMU) project is needed, as a fully fledged CMU has the potential to boost economic growth and enhance the financial sector’s resilience in the event of asymmetric shocks.

Financial Stability Review, May 2019 – Non-bank financial sector
98
debt securities represent a large part of non-bank financing flows. But loans and debt financing flows to most euro area sectors increased over the last year, primarily driven by lending to the corporate sector by funds and other financial institutions. Considering a longer horizon, non-financial corporations in the euro area have steadily increased their use of market-based funding. For example, the share of monetary financial institution (MFI) loans in total euro area NFC financing51 shrank from around 65% to 46% in the last ten years, while the share of debt securities issuance and non-bank loans increased from 24% to 36% (see Chapter 1).
Chart 4.1 The euro area non-bank financial sector continues to grow and provide financing to the real economy
Growth of non-banks’ financial assets (left panel) and financing flows to the real economy (right panel) (Q1 1999-Q4 2018; left panel: € trillions; right panel: average annual flow in € billions)
Sources: ECB (euro area accounts and balance sheet data of individual sectors) and ECB calculations. Notes: In the left panel, the non-bank financial sector includes investment funds, money market funds, financial vehicle corporations, insurance corporations, pension funds and remaining other financial institutions. The total financial sector includes the non-bank financial sector and MFIs (central banks are excluded). In the right panel, average annual flows are computed as the average cumulated quarterly flows of investments by investment funds, insurance corporations, pension funds and remaining other financial institutions.
The expansion of the non-bank financial sector has been accompanied by increased risk-taking. The low interest rate environment has led to low investment returns on relatively safe assets. In this context, there is evidence which points towards broad-based risk-taking by non-banks, especially investment funds, but also private equity and private debt funds globally. In particular, euro area funds and insurers have increased their exposures to BBB-rated and high-yield bonds over the last five years, and they have also extended the residual maturity of their bond portfolios (see Chart 4.2).52 So they are (potentially) more exposed to credit and liquidity risk than in the past, despite some recent de-risking during late 2018, including around the period of heightened market volatility. Recent evidence shows
51 Net of intra-sectoral financing. 52 The shift in portfolio composition was largely driven by an actual reduction in holdings of higher-rated
bonds relative to holdings of lower-rated bonds, rather than a decline in the rating quality of the securities held.
-40
60
160
260
360
460
1999
- 20
07
2008
- 20
13
2014
- 20
17
2018
1999
- 20
07
2008
- 20
13
2014
- 20
17
2018
1999
- 20
07
2008
- 20
13
2014
- 20
17
2018
Debt securities Listed shares Loans
Non-banks to EA NFCsNon-banks to EA FCsNon-banks to EA govtsNon-banks to EA otherNon-banks to EA householdsNon-banks to RoWNon-banks - unclassified
0
10
20
30
40
50
60
70
80
90
1999 2002 2005 2008 2011 2014 2017
BanksNon-banks
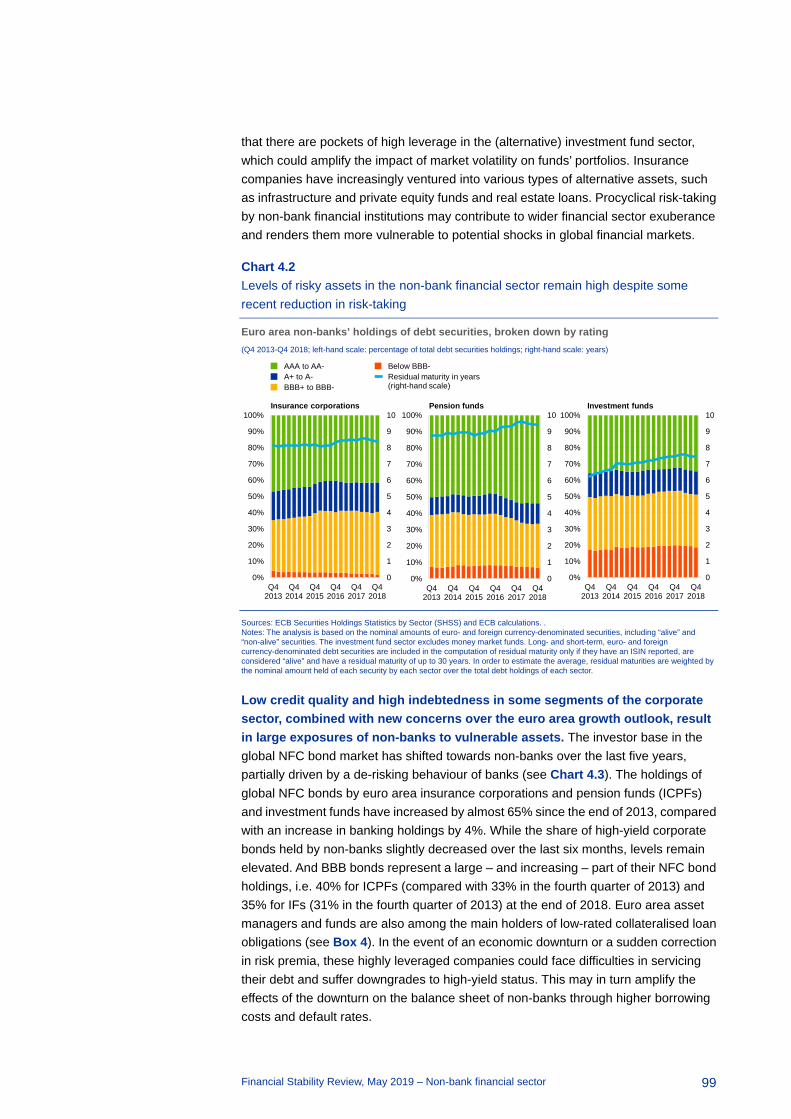
Financial Stability Review, May 2019 – Non-bank financial sector
99
that there are pockets of high leverage in the (alternative) investment fund sector, which could amplify the impact of market volatility on funds’ portfolios. Insurance companies have increasingly ventured into various types of alternative assets, such as infrastructure and private equity funds and real estate loans. Procyclical risk-taking by non-bank financial institutions may contribute to wider financial sector exuberance and renders them more vulnerable to potential shocks in global financial markets.
Chart 4.2 Levels of risky assets in the non-bank financial sector remain high despite some recent reduction in risk-taking
Euro area non-banks’ holdings of debt securities, broken down by rating (Q4 2013-Q4 2018; left-hand scale: percentage of total debt securities holdings; right-hand scale: years)
Sources: ECB Securities Holdings Statistics by Sector (SHSS) and ECB calculations. . Notes: The analysis is based on the nominal amounts of euro- and foreign currency-denominated securities, including “alive” and “non-alive” securities. The investment fund sector excludes money market funds. Long- and short-term, euro- and foreign currency-denominated debt securities are included in the computation of residual maturity only if they have an ISIN reported, are considered “alive” and have a residual maturity of up to 30 years. In order to estimate the average, residual maturities are weighted by the nominal amount held of each security by each sector over the total debt holdings of each sector.
Low credit quality and high indebtedness in some segments of the corporate sector, combined with new concerns over the euro area growth outlook, result in large exposures of non-banks to vulnerable assets. The investor base in the global NFC bond market has shifted towards non-banks over the last five years, partially driven by a de-risking behaviour of banks (see Chart 4.3). The holdings of global NFC bonds by euro area insurance corporations and pension funds (ICPFs) and investment funds have increased by almost 65% since the end of 2013, compared with an increase in banking holdings by 4%. While the share of high-yield corporate bonds held by non-banks slightly decreased over the last six months, levels remain elevated. And BBB bonds represent a large – and increasing – part of their NFC bond holdings, i.e. 40% for ICPFs (compared with 33% in the fourth quarter of 2013) and 35% for IFs (31% in the fourth quarter of 2013) at the end of 2018. Euro area asset managers and funds are also among the main holders of low-rated collateralised loan obligations (see Box 4). In the event of an economic downturn or a sudden correction in risk premia, these highly leveraged companies could face difficulties in servicing their debt and suffer downgrades to high-yield status. This may in turn amplify the effects of the downturn on the balance sheet of non-banks through higher borrowing costs and default rates.
0
1
2
3
4
5
6
7
8
9
10
0%
10%
20%
30%
40%
50%
60%
70%
80%
90%
100%
Q42013
Q42014
Q42015
Q42016
Q42017
Q42018
AAA to AA-A+ to A-BBB+ to BBB-
Below BBB-Residual maturity in years (right-hand scale)
Insurance corporations
0
1
2
3
4
5
6
7
8
9
10
0%
10%
20%
30%
40%
50%
60%
70%
80%
90%
100%
Q42013
Q42014
Q42015
Q42016
Q42017
Q42018
Pension funds
0
1
2
3
4
5
6
7
8
9
10
0%
10%
20%
30%
40%
50%
60%
70%
80%
90%
100%
Q42013
Q42014
Q42015
Q42016
Q42017
Q42018
Investment funds

Financial Stability Review, May 2019 – Non-bank financial sector
100
Chart 4.3 The relative importance of non-banks in debt financing to global NFCs significantly increased
Holdings of investment-grade and high-yield corporate bonds by holder sector (Q4 2013 and Q4 2018; € billions)
Sources: ECB SHSS and ECB calculations. Notes: The size of the rectangles reflects the nominal amount of bond holdings by sector. Securities are mapped into investment-grade (IG) and high-yield (HY) classes according to their credit rating. The share of high-yield bond holdings may not be proportional to the outstanding amount of high-yield bonds. Lighter shaded areas represent holdings of bonds issued by euro area NFCs.
Euro area insurance corporations and pension funds – and to a lesser extent investment funds – play an important role in the financing of euro area sovereigns. Despite decreasing in recent quarters, non-banks’ holdings of euro area government bonds are more than twice as much as banks’ holdings and amounted to 30% of the total outstanding sovereign debt at the end of 2018, i.e. €2.4 trillion (see Chart 4.4, left panel). ICPFs play a particularly important role in providing long-term financing to (higher-rated) euro area sovereigns (see Chart 4.4, middle and right panels). While sovereign bond holdings of investment funds are widely diversified, banks’ and insurance corporations’ holdings are more domestically concentrated.
Concerns about government debt sustainability and political uncertainty in some euro area countries could result in pressure on non-banks to sell if there is an abrupt increase in sovereign bond yields or broad-based rating downgrades. The sensitivity of non-banks’ asset holdings to changes in market yields has increased recently (see Box 8). A large repricing of sovereign bond premia may drive non-banks to rebalance their portfolios towards more highly rated bonds, while selling riskier securities. Similarly, rating downgrades of sovereign bonds from investment grade to high yield could create strong selling pressures on ICPFs and IFs with rating-based investment mandates, as they often set internal limits on the proportion of low-rated bonds that can be held in the portfolio. Any such rebalancing could have significant implications for long-term debt sustainability.
Q4 2018: €1,517 billion
Q4 2013: €964 billion
IG
260
264
73 20
HY
247
43
49
9
474
399
80 43
1647
74
384
BanksInsurance corporationsInvestment fundsPension funds

Financial Stability Review, May 2019 – Non-bank financial sector
101
Chart 4.4 Non-banks provide significant funding to euro area sovereigns, most of which is long term
Holdings of euro area sovereign bonds by holder sector (left panel), bond rating and residual maturity (right panel) (left panel: Q4 2013-Q4 2018, € billions; middle and right panels: Q4 2018; x-axis: maturity buckets in years; y-axis: percentage of total holdings of euro area sectors)
Sources: ECB SHSS and ECB calculations. Notes: Exposures to euro area lower-rated sovereigns refer to holdings of government bonds with a rating below AA-, i.e. bonds issued by Cyprus, Greece, Ireland, Italy, Latvia, Lithuania, Malta, Portugal, Slovakia, Slovenia and Spain. Exposures to euro area higher-rated sovereigns refer to holdings of bonds issued by all other euro area governments. Lighter shaded areas refer to domestic holdings.
Box 8 The Eurosystem’s asset purchase programme, risk-taking and portfolio rebalancing
Prepared by Lena Boneva, Margherita Giuzio, Daniel Kapp and Christoph Kaufmann
The Eurosystem’s asset purchase programme (APP) has contributed to a portfolio rebalancing of securities holdings within the euro area. The ECB’s asset purchases, with their largest component initiated in March 2015, have compressed the yields of securities across a wide range of asset classes.53 In line with the portfolio rebalancing transmission channel of monetary policy, many investors responded to these lower yields by shifting their holdings towards riskier securities with higher expected returns. Non-banks, in particular, have moved increasingly into less-liquid and lower-rated bonds as well as longer-term securities in a search for yield. To the extent that a slowdown in growth or other market or policy developments lead to an increase in term or risk premia, investors may rebalance back towards safer assets.
Empirical analysis suggests that portfolio allocations of private investors have become more sensitive to changes in past yields since the introduction of the APP. To quantify this, individual data on securities holdings of euro area financial sectors (banks, insurance corporations and investment funds) available since 2013 are exploited. Both banks and non-banks have behaved
53 The APP is one tool in a wider package of mutually reinforcing monetary policy measures, including
negative interest rates on the deposit facility, forward guidance and targeted longer-term refinancing operations, which all contributed to a reduction in market yields and refinancing costs. For a recent overview of the effects of the APP, see Hammermann, F., Leonard, K., Nardelli, S. and von Landesberger, J., “Taking stock of the Eurosystem’s asset purchase programme after the end of net asset purchases”, Economic Bulletin, Issue 2, ECB, 2019, pp. 69-92.
0%
10%
20%
30%
40%
50%
60%
70%
80%
90%
100%"Higher-rated" debt
Bank - domesticBank - non-domesticICPF - domesticICPF - non-domestic
IF - domesticIF - non-domesticOther sectors - domesticOther sectors - non-domestic
0-2 2-5 5-10 10 15+ 0-2 2-5 5-10 10 15+ -15 -15
"Lower-rated" debt
0
500
1,000
1,500
2,000
2,500
3,000
3,500
Q4 2013 Q4 2015 Q4 2017
BanksNon-banks

Financial Stability Review, May 2019 – Non-bank financial sector
102
procyclically on average: they bought bonds whose yields decreased and vice versa (see Table A).54 Sensitivity to market movements has also increased for almost all asset classes and financial sectors over the sample period. For example, before the introduction of the APP, banks, on average, reduced their holdings of euro area sovereign bonds issued by countries more affected by the sovereign debt crisis by 0.45% following a 1% increase in yields. This increased to a 2.3% reduction afterwards. So, an equal change in bond yields leads to a stronger portfolio adjustment now than in early 2015. 55 This points towards an asymmetry in investor behaviour between the start of the APP and the time thereafter.56
The investor base in riskier market segments has shifted towards non-banks, which tend to react more procyclically to changes in market yields. While increasing the diversification of funding sources, a relatively higher importance of “flighty investors”, such as investment funds, in riskier asset classes can amplify yield changes in those markets (see Chart 4.2). Together with the higher yield sensitivity of bond holdings, a more flighty investor base could drive a stronger portfolio rebalancing in response to yield changes than occurred at the start of the APP. So any large future rebalancing towards safer and liquid bonds could impair debt sustainability and increase financing costs for risky borrowers.
Table A The sensitivity of asset holdings to yield changes has increased in the last five years
Sensitivity of sectoral bond holdings to changes in lagged market yields by bond type (Q4 2013-Q3 2018, regression coefficient estimates as percentages)
Sources: ECB Securities Holdings Statistics and ECB calculations. Notes: Coefficients are based on security-by-security regressions of the percentage change of holdings on its one-quarter-lagged yield to maturity. All regressions include a constant, and security*holder area and holder area*time fixed effects, where holder area refers to one of the 19 euro area countries. Asterisks indicate significance at 1% (***), 5% (**) and 10% (*). Separate regressions are run by investor type (euro area banks, insurance corporations and investment funds) and asset class for two sub-samples. Asset classes: “EA sovereign more affected by crisis” refers to sovereign bonds issued by countries more heavily affected during the euro area sovereign debt crisis and includes Cyprus, Greece, Italy, Portugal and Spain. “EA sovereign less affected by crisis” refers to sovereign bonds of all other euro area countries. “High-yield corporate” includes all corporate bonds with a rating lower than BBB- as well as all bonds without a rating. “Investment-grade corporate” includes all corporate bonds with a rating of BBB- or better. The “Before APP” sub-sample includes security-by-security holdings between Q4 2013 and Q2 2015, while the “APP” sub-sample includes holdings between Q3 2015 and Q3 2018.
Despite the higher sensitivity of portfolio allocation to changes in yields and a more flighty investor base, model estimates indicate a smooth rebalancing of bond portfolios under a
54 Past yields are naturally not the only determinant of bond holdings, since both yields and holdings are
determined jointly in equilibrium, also accounting for investors’ expectations of future asset returns. Nevertheless, a growing body of literature documents significant “flow-performance” relationships by estimating investors’ reactions to past returns (see Timmer, Y., “Cyclical investment behavior across financial institutions”, Journal of Financial Economics, Vol. 129, 2018, pp. 268-286, and Goldstein, I., Jiang, H. and Ng, D., “Investor flows and fragility in corporate bond funds”, Journal of Financial Economics, Vol. 126, 2017, pp. 592-613).
55 This result applies for the euro area banking sector on average, but may entail some country-specific heterogeneity.
56 The empirical analysis is also performed on granular holdings of 26 euro area banking groups from the ECB’s Securities Holdings Statistics (SHSG) to address possible endogeneity concerns related to reverse causality. All the main results for the banking sector are found to be robust using bank-level data.
Dependent variable: Log-difference in bond holdings
Asset class EA sovereign more affected by crisis
EA sovereign less affected by crisis High-yield corporate
Investment-grade corporate
Period Before APP APP Before APP APP Before APP APP Before APP APP
Banks Yield to maturity -0.45** -2.30*** -0.18 -0.80 -0.33*** -0.53*** 0.12 -1.20***
Insurance corporations Yield to maturity -0.62** -2.70*** -0.63** -0.014 -0.23*** -0.57*** -0.068 -0.15
Investment funds Yield to maturity 0.39 -0.68* 0.16 -0.81 -0.48*** -0.69*** 0.17** -0.40***

Financial Stability Review, May 2019 – Non-bank financial sector
103
baseline projection for term premia. For a gradual increase in term premia of about 30 basis points until the end of 2021, which emerges under a baseline scenario associated with the end of net purchases as announced in December 2018, changes in the risky asset holdings of financial sectors are expected to be small, even when reflecting the recent higher sensitivities after the third quarter of 2015 (see Table A and Chart A). For example, investors would reduce their holdings of high-yield corporate bonds by 1% on average over the next three years, equivalent to a €17 billion reduction of holdings across all sectors (see Chart A, panel a).
Chart A Portfolio rebalancing is limited under the baseline projection, but could be stronger in the event of higher investor sensitivity or risk premium shocks
Simulations of cumulative change in holdings by asset class and investor type until end-2021 for different financial market scenarios (percentage change of bond holdings)
Sources: ECB Securities Holdings Statistics and ECB calculations. Notes: All simulations are based on the regression results of the APP sub-sample in Table A. Simulations in panel a) are based on term premium projections under a baseline scenario associated with the end of net purchases, as announced in December 2018. Simulations in panel b) use the outer bounds of the 95% confidence intervals instead of the coefficient estimates from Table A. In panel c), an additional 100 basis point risk premium shock is assumed on top of the panel a) scenario. The asset classes are the same as those described in the notes to Table A. “EA sovereign crisis” refers to sovereign bonds issued by countries more heavily affected during the euro area sovereign debt crisis and includes Cyprus, Greece, Italy, Portugal and Spain. “EA sovereign non-crisis” refers to sovereign bonds of all other euro area countries.
If investor sensitivity continues to rise, for example due to changes in risk aversion, sell-offs of risky assets could be much larger. When considering a higher sensitivity of sectoral bond holdings – equal to the outer bound of model estimates – larger changes in portfolio allocation occur especially in riskier market segments (see Chart A, panel b). This is particularly relevant for holdings of euro area sovereign bonds issued by countries more affected by the sovereign debt crisis. These are estimated to decline by up to 6% (i.e. €93 billion) over the next three years in this scenario.
Larger price corrections for risky asset classes could also trigger a larger rebalancing of financial sectors’ holdings and have potential implications for financial stability. The model implies that an abrupt increase in risk premia of 100 basis points would result in a significant reduction of bond holdings in riskier asset classes (see Chart A, panel c). Under this scenario, the holdings of riskier euro area sovereign bonds and high-yield corporate bonds are estimated to decrease by €90 billion (or 5.1%) and €29 billion (or 1.6%), respectively, over the next three years. In a combined adverse scenario, where higher investor sensitivity is paired with an increase in risk premia of 100 basis points, holdings of riskier euro area sovereign bonds and high-yield corporate bonds would
-7%
-6%
-5%
-4%
-3%
-2%
-1%
0%
EAsovereign
crisis
EAsovereignnon-crisis
HYcorporate
IGcorporate
c) Risk premium shock
-7%
-6%
-5%
-4%
-3%
-2%
-1%
0%
EAsovereign
crisis
EAsovereignnon-crisis
HYcorporate
IGcorporate
b) Higher investor sensitivity
-7%
-6%
-5%
-4%
-3%
-2%
-1%
0%
EAsovereign
crisis
EAsovereignnon-crisis
HYcorporate
IGcorporate
a) Baseline projection
BanksInsurance corporationsInvestment funds

Financial Stability Review, May 2019 – Non-bank financial sector
104
decrease even further by €155 billion (8.9%) and €33 billion (1.8%), respectively. This could eventually raise debt sustainability concerns and financing costs for the real economy.
Overall, the shift of the investor base towards non-banks and the recent rise in the sensitivity of bond holdings to changes in yields are likely to induce stronger portfolio rebalancing in response to yield changes than occurred at the start of the APP. Simulations of the heterogeneous response of euro area financial sectors to yield changes in different bond market segments do not point towards significant financial stability implications under baseline projections of a smooth transition of market yields. Some risks may, however, emerge in the event of an abrupt repricing of risk premia or a rising sensitivity of bond holdings to market changes.
Non-banks may also contribute to systemic risk through connections with the banking system, including via ownership links. Looking at the corporate structure of euro area financial institutions, banks and insurance corporations tend to be controlled by institutions within the same sector. But they are often the majority investors in the largest investment funds and the owners of asset management companies, which manage a large number of funds (see Chart 4.5).57 Financial conglomerates, which diversify their activity across sectors, are typically led by a bank, although insurance corporations increased their M&A activities involving asset management businesses in the last years. Ownership links may be beneficial for the holder company in periods of market distress and represent a source of income diversification. But they can also result in possible channels of contagion via reputational spillovers and step-in risk if there are credit lines and contingency arrangements between holder and asset management companies, and could have negative repercussions on the holder company.
57 A conglomerate is defined as a group of entities with direct and indirect control relationships. The head of
the group is an organisational unit (OU) neither directly nor indirectly controlled by any other OU in the system. The remaining OUs in the conglomerate are controlled either directly by the head OU or indirectly through its subsidiaries (following the accounting definition of control; Directive 83/349/EEC).

Financial Stability Review, May 2019 – Non-bank financial sector
105
Chart 4.5 Banks play a major role as heads of financial conglomerates
Cross-sectoral ownership links (left panel) and euro area group structures (right panel) by type of entity (Q1 2019; left panel: number of ownership links between sectors)
Sources: RIAD (Register of Institutions and Affiliates Database) and ECB calculations. Notes: Left panel: each block indicates the number of interlinkages within (yellow) and across (blue) sectors, with the owner sector shown in the rows, and the subsidiary sector in the columns. Right panel: network of individual institutions with their ultimate owner. The size of the node indicates the number of subsidiaries. Links are coloured according to the sector of the owner company. The ownership linkages are based on direct and indirect control relationships (following the accounting definition of control; Directive 83/349/EEC) according to three conditions: explicit direct control over the subsidiary, ownership of more than 50% of the subsidiary’s capital, or indirect control over the subsidiary (i.e. two or more controlled subsidiaries own more than 50%).
In addition to ownership interlinkages, banks and non-banks are highly interconnected through other channels. First, euro area MMFs, IFs and OFIs represent an important source of funding for the banking sector – and also for the real economy – notably through debt and equity financing.58 These holdings amount to around 5.5% of their assets (€598 billion as at end-2018). This can drive procyclical risk-taking in the banking sector and contribute to wider financial sector exuberance in some parts of the real economy. Also, it may create credit risks for non-banks related to the low profitability of the banking sector (see Chapter 3). Second, banks are often the only counterparties for ICPFs and IFs in over-the-counter transactions in derivatives and repo markets.59 Third, investment funds tend to have high overlapping exposure with other sectors, in particular the pension fund sector, given the high diversification of their portfolio. By contrast, banks show the lowest degree of overlap with other sectors in their portfolios, mainly due to their tendency to invest in domestic securities.60 Such high interconnectedness can amplify risk transmission during periods of stress and may have significant implications for financial stability through funding and credit risk channels.
Non-bank financial sectors are closely connected with each other via direct balance sheet exposures. In the current low interest rate environment, euro area
58 See EU Shadow Banking Monitor, No 3, European Systemic Risk Board, September 2018, and Financial
Stability Review, ECB, May 2018. 59 See Financial Stability Review, ECB, November 2018, Section 3.2 and Box 8. 60 See Financial Stability Review, ECB, November 2018, and Global Monitoring Report on Non-Bank
Financial Intermediation 2018, Financial Stability Board, February 2019.

Financial Stability Review, May 2019 – Non-bank financial sector
106
insurers have been increasing their holdings of investment fund shares and alternative assets. At the end of 2018 ICPFs’ holdings of investment fund shares amounted to €3.4 trillion, i.e. 34% of ICPFs’ financial assets. Part of these holdings consists of private debt, private equity and infrastructure funds, which increases ICPFs’ exposure to alternative and illiquid assets (see Box 9). Intra-sectoral holdings of funds’ shares slightly decreased in the last six months and now amount to about 18% of investment fund portfolios. But an emerging trend is for investment funds to increasingly use exchange-traded funds (ETFs) to complement their portfolios, mainly for cost and liquidity considerations. ETFs are perceived as highly liquid instruments and may be used by funds as an additional means to manage exposures and portfolio liquidity, notwithstanding the possibility that ETF liquidity may deteriorate in periods of stress.
Overall, the share of non-bank financial intermediation has been growing in the euro area, with potential implications for financial stability and the financing of the real economy more broadly. The growing size of non-banks has increased the diversification of funding sources for the real economy and the whole financial system, which is now less dependent on banks than it used to be before the financial crisis. But it has been accompanied by rising liquidity and credit risk in non-banks’ investment portfolio. Procyclical risk-taking by non-banks may contribute to wider financial sector exuberance and could amplify potential shocks in global financial markets. In addition, if the economy were to slow down, thus impairing debt sustainability in the public and private sectors, interconnectedness and vulnerabilities of non-banks could amplify a possible repricing of risk premia in financial markets.
As the share of non-bank financing is likely to increase further, prudential policies need to ensure that the sector is able to absorb shocks, rather than amplifying exuberance and stress. The capital markets union (CMU) project will be pivotal in promoting a broader and deeper capital market in the European Union, with tangible benefits for the euro area economy as a whole. Specifically, a more integrated and deeper European capital market will help promote a more diversified funding base for real economy borrowers. This will in turn increase the resilience of the euro area to funding stress in the banking sector and asymmetric shocks in single countries or financial sectors. But to reap the full benefits of a deep and integrated capital market in Europe, non-bank financing needs to develop in a sustainable and resilient manner. In particular, solid prudential standards in the non-bank financial sector need to be maintained and these standards should not be weakened in the context of CMU. Moreover, there is a need to develop macroprudential policies to mitigate the build-up of risks at system level, before they materialise. These policies should help ensure that non-bank financing will be able to absorb shocks, rather than amplifying exuberance and stress.

Financial Stability Review, May 2019 – Non-bank financial sector
107
4.2 Increased volatility of fund flows highlights the risks that investment funds could pose to liquidity in financial markets
Significant inflows into the riskier bond funds suggest returning confidence after a period of strong outflows and shifts to safer assets over the last year. Global corporate bond funds – including high-yield and investment-grade funds – experienced significant outflows over the last year, while government bond and money market funds continued receiving large inflows (see Chart 4.6, left panel). In particular, high-yield global bond funds have experienced outflows every month from November 2017 to December 2018, with a cumulated outflow of over USD 130 billion. In addition, global money market funds have received relatively large inflows – almost USD 250 billion from October 2018 to February 2019. Overall, these flight-to-safety portfolio shifts were large compared with similar episodes observed in the past (see Chart 5 in the Overview). Since the beginning of this year, inflows have risen again in both the investment-grade and the high-yield segments, with European funds lagging behind their US peers (see Chart 4.6, right panel).61 Likewise, inflows into emerging market funds rebounded strongly in 2019, while money market funds experienced outflows in March and April.
Chart 4.6 Renewed inflows into investment-grade and high-yield corporate bond funds after significant outflows from the riskier bond funds over the last year
Cumulative net flows to bond funds globally (left panel) and monthly net flows to European and US corporate bond funds as a percentage of assets under management (right panel) (left panel: Dec. 2017-Apr. 2019, USD billions; right panel: Jan. 2018-Apr. 2019, basis points)
Sources: EPFR and ECB calculations.
61 Note that the investment-grade corporate bond fund sectors in the United States and Europe are
comparable in size, while the high-yield sector is three times larger in the US.
-150
-100
-50
0
50
100
150
12/17 03/18 06/18 09/18 12/18 03/19
Corporate, high yieldCorporate, investment gradeMunicipalSovereignMortgage backedBank loanInflation protectedEmerging market
-500
-400
-300
-200
-100
0
100
200
300
400
01/18 04/18 07/18 10/18 01/19 04/19
Europe investment gradeUS investment gradeUS high yieldEurope high yield

Financial Stability Review, May 2019 – Non-bank financial sector
108
Global equity funds continued to experience net outflows throughout most of the reporting period, despite rising stock prices during the first four months of this year. Large outflows were triggered in December last year by a sharp drop in US equity prices, while outflows from euro area equity funds continued their negative trend since mid-2018 (see Chart 4.7). A slowing global economy, unresolved trade issues and political uncertainty are among the factors that have led to sustained outflows from global equity funds since December last year, which did not reverse despite rising stock prices between the end of last year and the beginning of May.
Chart 4.7 Large outflows from global equity funds in December 2018, which continued throughout the reporting period
Cumulative weekly net flows to bond and equity funds globally and in the euro area (left panel) and weekly net flows to equity funds globally as a percentage of assets under management (right panel) (left panel: Jan. 2016-May 2019, USD billions; right panel: Jan. 2018-May 2019, basis points)
Sources: EPFR and ECB calculations.
Asset price declines in 2018 also caused hedge funds to suffer their worst year in terms of performance since the global financial crisis. Around 60% of active hedge funds in a sample based on data provided by Preqin delivered negative net returns last year. This triggered outflows, especially from European-domiciled groups. Estimates of market betas for an indicative sample of hedge funds show that the sector has been increasingly exposed to common risk factors, including correlated exposures and leverage (see Chart 4.8). Overall, the investment fund sector seems to have coped well with outflows during the high volatility episode. At the same time, liquidity and credit risks are still high in some parts of the sector and could act as a shock amplifier if a future repricing were to materialise.
-200
-100
0
100
200
300
01/16 07/16 01/17 07/17 01/18 07/18 01/19
All sovereign bond fundsAll equity fundsEA sovereign bond fundsEA equity funds
-100
-50
0
50
100
01/18 04/18 07/18 10/18 01/19 04/19
Flows relative to AuMHistorical distribution since 2008

Financial Stability Review, May 2019 – Non-bank financial sector
109
Chart 4.8 Hedge funds’ high exposures to common risk factors led to poor performance of significant parts of the sector in 2018
Annual net returns of global active hedge funds (left panel) and market beta coefficients from a panel regression of individual hedge funds’ returns on market returns (right panel) (left panel: 2008-18, percentages; right panel: Jan. 2010-May 2019, coefficient estimates)
Sources: Preqin, Lipper TASS and ECB calculations. Notes: The coefficient estimates shown in the right panel are derived from a panel regression analysing the sensitivity of hedge funds’ returns to a market price index (MSCI World Index). The sample includes monthly hedge funds’ returns from August 2005 to December 2018. The sample size varies between 3,352 and 5,908 hedge funds operating globally.
Recent volatility in fund flows highlights that investment funds can be subject to the procyclical behaviour of investors and asset managers. Net inflows tend to increase when fund returns are high and decrease when they are low. This effect seems to be non-linear and stronger in periods of large price movements. In addition, the sensitivity of fund managers to changes in yields has increased in the low-rate environment (see Box 8). Over the medium term, procyclical behaviour of investors and asset managers may thus contribute to wider market exuberance and risk-taking in a market upswing and amplify any response to a larger financial repricing in a downturn.
A shock to bond prices would precipitate first and second-round losses for bond funds, particularly those invested in less liquid assets. Sector-wide data point to a broad-based decrease in funds’ most liquid positions, including bank deposits and debt securities issued by euro area governments (see Chart 4.9). A sudden and abrupt repricing of financial assets could trigger investor outflows, possibly resulting in forced asset sales, which could amplify stress in less liquid markets, especially if other types of investors were not willing or able to step in immediately. Such sales have the potential to amplify the original shock to asset prices, with wider financial stability implications in the form of impaired market liquidity and possible spillovers to the real economy, e.g. via a sharp increase in the cost of corporate bond issuance.
0%
20%
40%
60%
80%
100%
2008 2010 2012 2014 2016 2018
Less than -5.00%Between -4.99% and -0.01%Between 0.00% and 4.99%5.00% or greater
-20
0
20
40
60
80
100
2010 2012 2014 2016 2018
Coefficient estimate for 12-month roling periodCoefficient estimate for entire period95% confidence interval

Financial Stability Review, May 2019 – Non-bank financial sector
110
Chart 4.9 Investment fund debt portfolios have become less liquid in the past years, while bond funds have reduced the share of deposits and government bonds in their euro area portfolios
Euro area investment funds’ holdings of debt securities, broken down by liquidity (left panel) and euro area bond funds’ holdings of euro area financial assets (right panel) (left panel: Q4 2013-Q4 2018, percentage of total debt securities holdings; right panel: Q4 2009-Q1 2019, percentage of euro area financial assets)
Sources: ECB SHSS, ECB investment fund statistics and ECB calculations. Notes: In the left panel, the sample includes all types of investment funds domiciled in the euro area, except money market funds. Securities are mapped into liquidity classes in accordance with Commission Delegated Regulation (EU) 2015/61, which defines liquidity requirements for banks. Highly liquid assets correspond to Level 1, liquid assets to Levels 2A and 2B and assets with little or no liquidity to non-HQLA (high-quality liquid assets). Securities held include debt and equity securities valued at market prices, which means that shifts in portfolio composition reflect both changes in stocks and valuation effects. Classifications from the banking regulation were used for practical reasons, as the SHS data do not provide any information on the time needed to liquidate holdings.
In the European Union, investment fund activities are regulated and supervised, so there is less concern about the viability of individual investment funds in general. Mutual funds are governed by the UCITS Directive and the Alternative Investment Fund Managers Directive,62 providing EU-wide standards for transparency, concentration risk, leverage and liquidity. The recently introduced Money Market Fund Regulation (MMFR), which came into effect in January 2019, aims to reduce liquidity and other risks in the MMF sector. It introduced three distinct fund categories subject to specific requirements: constant net asset value (CNAV), variable net asset value (VNAV) and low-volatility NAV (LVNAV) funds. In particular, CNAV funds became subject to new requirements regarding redemption gates and fees as well as liquidity requirements. The sector did not show significant shifts between MMF types, or within fund portfolios. This was expected partly because the MMFR did not materially affect the cash-equivalent status of CNAV funds – a feature that investors in those funds value.
Pockets of high investment fund leverage could also amplify the impact of investor outflows or losses on assets, notably in the less strictly regulated alternative investment fund (AIF) sector. The leverage of mutual funds is restricted under the UCITS Directive, but there are no binding constraints on leverage for some
62 A recent statistical report by the European Securities and Markets Authority (ESMA) estimates that
alternative investment funds hold about €4.9 trillion in total assets or nearly one-third of the total EU fund industry. See ESMA Annual Statistical Report on EU Alternative Investment Funds 2019, ESMA, March 2019.
0%
20%
40%
60%
80%
100%
Q4/13 Q4/14 Q4/15 Q4/16 Q4/17 Q4/18
Highly liquid assetsLiquid assetsAssets with little or no liquidity
0%
10%
20%
30%
40%
50%
60%
70%
80%
90%
100%
Q4/09 Q4/11 Q4/13 Q4/15 Q4/17
DepositsEA government bondsOther euro area financial assets

Financial Stability Review, May 2019 – Non-bank financial sector
111
types of AIFs. Leverage in some AIFs can be much higher than the average63 and the providers of this leverage are often unclear, making it difficult to assess how stress in leveraged funds may propagate in the financial system. In principle, authorities in the EU can impose macroprudential leverage limits on AIFs, but these tools need to be operationalised in line with the recommendation of the European Systemic Risk Board (ESRB) earlier last year.64 And there may be significant pockets of leverage in funds domiciled outside the EU, to which the euro area financial system could be exposed.
The development of globally consistent measures of fund leverage is thus important. The International Organization of Securities Commissions (IOSCO) published a consultative report on leverage in November 2018 as part of its operationalisation of the Financial Stability Board (FSB) recommendations.65 IOSCO’s consultation document presents a range of potential consistent leverage metrics and elaborates on their respective pros and cons.66 Such consistent measures should comprise metrics based on a gross and a net notional exposure and should be supplemented by risk measures to capture potential losses stemming from leverage and potential liquidity demands from margin calls. In line with the FSB recommendations to IOSCO, globally consistent measures of leverage still need to be devised with a view to gaining a system-wide perspective on evolving risks.
While existing rules in the EU provide a robust framework to address investor protection and fund-specific vulnerabilities, the macroprudential toolkit for investment funds needs to be further developed. In particular, investment funds may increase the riskiness of their asset portfolios, perform liquidity transformation and take on leverage in a procyclical manner. These vulnerabilities should be monitored and assessed from a holistic perspective, taking into account interdependencies within the financial system and the real economy more broadly. To the extent that risks can evolve at the system level, with possible implications for real economy financing, there is a need to address risks in the investment fund sector also from a macroprudential perspective.
4.3 Insurers’ investment income is expected to deteriorate further in the low-yield and low-growth environment
Although insurers’ equity valuations declined in line with global equity markets at the end of 2018, they gained around 6% over the full review period. The gains were particularly pronounced in the non-life and reinsurance segments (see Chart 4.10, right panel). On 14 December 2018 the European Insurance and Occupational Pensions Authority (EIOPA) also published the results of its insurance stress test. The
63 See ESMA Annual Statistical Report on EU Alternative Investment Funds 2019, ESMA, March 2019,
p. 6. 64 See the Recommendation of the European Systemic Risk Board of 7 December 2017 on liquidity and
leverage risks in investment funds (ESRB/2017/6), published on 14 February 2018. 65 See IOSCO Report: Leverage – Consultation Paper, IOSCO, November 2018. 66 The ESRB has publicly commented on the report, expressing support for IOSCO’s efforts to develop
consistent measures of leverage.

Financial Stability Review, May 2019 – Non-bank financial sector
112
limited impact on insurers’ equity valuations suggests that the results were broadly in line with market expectations (see Chart 4.10, left panel).67
Chart 4.10 Euro area insurers’ share prices co-moved with the general index and developed more favourably than those of their international peers
Stock prices (left panel: 29 Nov. 2018-22 May 2019, daily observations, stock prices indexed to 100 on 29 Nov. 2018; right panel: percentage change in stock prices between 29 Nov. 2018 and 22 May 2019)
Sources: Thomson Reuters Datastream and ECB calculations. Notes: 29 November was the publication date of the November 2018 FSR. The vertical line in the left panel indicates the publication date of the EIOPA stress-test results (14 December 2018).
A positive market outlook for the insurance sector was supported by strong underwriting revenues and stable solvency positions in the second half of 2018 (see Chart 4.11). For large euro area insurers, the median annual growth rate of life premiums exceeded 3% in the second half of 2018, up on recent quarters (see Chart 4.11, left panel), while the growth rate of non-life premiums remained above 4%. Despite strong underwriting revenues, insurers’ median return on equity dropped modestly to below 8% in the last quarter of 2018 (see Chart 4.11, middle panel). This may be attributed to above-average natural catastrophe losses and very weak investment income in that quarter. The profitability drop in the last quarter only had a limited impact on Solvency Capital Requirement (SCR) ratios, which remained stable and well above the regulatory requirement of 100% for all large euro area insurers throughout 2018.
67 Another reason may be that the stress-test results were published only at an aggregate and not an
individual level. While EIOPA does not have the mandate to publish the individual results, insurance groups could have published their results on a voluntary basis on EIOPA’s website, but only four insurance groups (out of the 42 groups in the European Economic Area covered by the stress test) chose to do so. For more details, see 2018 EIOPA Insurance Stress Test report, EIOPA, December 2018.
-3% -1% 2% 4% 6% 8% 10%
Insurance broad index
Life insurance
Non-life insurance
Reinsurance
Euro areaWorld
85
90
95
100
105
110
115
11/18 12/18 01/19 02/19 03/19 04/19
Euro area insurers - stock price indexEuro area banks - stock price indexEuro area broad-based index, EURO STOXXEIOPA stress-test publication (14 December 2018)

Financial Stability Review, May 2019 – Non-bank financial sector
113
Chart 4.11 Despite the high market volatility towards the end of 2018, insurers’ return on equity dropped only modestly, supported by strong underwriting results
Gross premium growth (left panel), return on equity (middle panel) and SCR ratios (right panel) (all panels: 2016-Q4 2018, percentages (median, interquartile range and 10th-90th percentile range))
Sources: SNL data, individual institutions’ financial reports and ECB calculations. Notes: The figures are based on a sample of 22 large euro area insurers. Quarterly data for return on equity and gross premium growth are annualised.
In 2018 large euro area reinsurers withstood the costs of a historically high number of natural catastrophes globally. As highlighted in Special Feature A, the frequency of weather-related catastrophes worldwide has been rising steadily and their number reached almost 800 for the first time in 2018 (see Chart A.2 in Special Feature A). The insured costs from natural disasters around the globe reached USD 80 billion in 2018, above the ten-year average (USD 61 billion) and almost twice as much as the 30-year average (USD 41 billion).68 Wildfires and hurricanes in the United States and typhoons in Asia were the most significant contributors to these costs in 2018. Since large euro area reinsurers operate globally, they bore a portion of these costs. This weighed on their profitability and pushed up their combined ratios to a level close to (but still below) 100% in the last quarter of 2018.69
Consistently weak investment income represents a major challenge for insurers. In 2018 the total return on average investments of large euro area insurers remained at historically low levels (see Chart 4.12, left panel, boxplots). This is because euro area insurers are heavily invested in low-yielding fixed income assets such as government and corporate bonds (see Section 4.1). The ongoing low interest rate environment has contributed to the reduction of the average yield on euro area insurers’ bond portfolios from around 3-4% in 2010-12 to around 1% over the last three years (see Chart 4.12, left panel, blue line).
Going forward, insurers’ investment income may deteriorate further, as (older) high-yielding bonds in portfolios mature and are replaced by (newly issued)
68 For more details, see The natural disasters of 2018 in figures, Munich Re, January 2019. 69 Combined ratios measure incurred losses and expenses as a proportion of premiums earned, so that
values below 100% indicate that insurers manage the balance between the costs and underwriting profits of their ongoing business in a sustainable manner.
-10
-5
0
5
10
15
20
2016 2017 Q118
Q218
Q318
Q418
Return on equity (%)
0
50
100
150
200
250
300
350
400
2016 2017 Q118
Q218
Q318
Q418
SCR ratio (%)
-20
-15
-10
-5
0
5
10
15
20
25
30
2016 2017 Q118
Q218
Q318
Q418
Gross premium growth (%)Life insurance (blue)Non-life insurance (red)

Financial Stability Review, May 2019 – Non-bank financial sector
114
lower-yielding bonds. For the next three years, euro area insurers are still likely to hold almost one-fifth of bonds in their portfolios with a yield to maturity of over 3% at issuance (see Chart 4.12, right panel). But, if the low-yield environment prevails beyond this horizon, the yield to maturity at issuance of almost all bonds in insurers’ portfolios would drop below 3%, further eroding insurers’ investment income.
Chart 4.12 Insurers’ investment income may deteriorate further, if the low-yield environment persists
Total return on investments and average bond yields over time (left panel); maturity structure and bond yields at issuance (right panel) (left panel: 2010-Q4 2018, percentages (median, interquartile range and 10th-90th percentile range for total return on average investments); right panel: end-2018; x-axis: maturity date; y-axis: percentages)
Sources: SNL data, ECB SHSS and ECB calculations. Notes: Left panel: the figures for total return on average investments are based on a sample of 22 large euro area insurers and quarterly data are annualised. The average yield to maturity of bond portfolios is calculated based on euro area insurers’ debt securities holdings in SHSS data (including SHS experimental data collected prior to 2014 that are subject to some data quality limitations). Right panel: the length of the bars indicates the maturity date of bonds in euro area insurers’ portfolios. The width of the bars reflects the size of a given maturity date segment in the bond portfolio. The labels and transparency of the bars indicate the average yield to maturity (in percentages) at issuance of the debt securities in a given maturity date segment. The segment with the longest residual maturity (average maturity date in 2040 and yield to maturity at issuance of 2.4%, accounting for 20% of the bond portfolio) is not shown.
Some insurers are searching for yield, and income, through greater exposure to credit, liquidity and term risks. Over the last five years euro area insurers increased their exposures to BBB-rated and high-yield bonds from around 35% to 41% of their bond portfolios (see Chart 4.13, left panel). They are also venturing into various types of alternative assets such as infrastructure and private equity funds and real estate loans (see Box 9). In addition, they slightly reduced the share of highly liquid securities, from around 34% to 32%, and extended the residual maturity of their bond portfolios from around 8.1 to around 8.4 years. These portfolio adjustments can bring diversification benefits and help close insurers’ negative duration gaps, but they also suggest that insurers tend to reshuffle their portfolios to earn higher credit risk, liquidity and term premia, thereby boosting their yields.70
70 Beyond adjusting their portfolios, insurers have also been adapting their business models to the low-yield
environment. For life insurers, the main trend is to shift away from traditional saving policies with guaranteed rates (non-unit-linked policies) towards unit-linked products, in which investment risk is borne by the policyholder. For more details, see Financial Stability Review, ECB, May 2018, Section 3.2.
0.0
0.5
1.0
1.5
2.0
2.5
3.0
3.5
4.0
4.5
Average yield to maturity of bond portfolios(%, right-hand scale)Total return on average investments (%, left-hand scale)
-3.0
-1.0
1.0
3.0
5.0
7.0
9.0
2010 2012 2014 2016 Q118
Q318
2.9%
3.0%
3.2%
2.6%
2.4%
2.4%2.3%
2.6%
2.1%1.9%
2.2%
2.1%
2018 2020 2022 2024 2026 2028 2030 2032
8%
6%
8%
8%
8%
8%
5%
6%
6%
5%
Bonds maturing in 2025yielded 2.3% at issuance
Bonds maturing in 2020yielded 3% at issuance
3%
9%Shar
e of
a g
iven
mat
urity
seg
men
t in
the
bond
po
rtfo
lio
Maturity date

Financial Stability Review, May 2019 – Non-bank financial sector
115
Chart 4.13 Insurers’ tendency to search for yield in lower-rated bonds correlates with low profitability in the life insurance business
Credit quality, liquidity and maturity of insurers’ portfolios (left panel) and profitability of life business (right panel) (left panel: Q4 2013 and Q4 2018, percentage of total bond holdings and total securities holdings (left-hand scale) and years (right-hand scale); right panel: x-axis: end-2017, average return on investment (ROI) minus average guaranteed rates (proxy for profitability of life insurers); y-axis: percentage point change between Q4 2013 and Q3 2018 in the share of BBB-rated and high-yield bonds)
Sources: ECB SHSS, EIOPA and ECB calculations. Notes: Left panel: the category “BBB-rated and high-yield bonds” refers to bonds with a rating of BBB or lower. The category “highly liquid securities” corresponds to debt securities and listed shares belonging to the Level 1 liquidity class (as defined for banks in Commission Delegated Regulation (EU) 2015/61). For more details, see Charts 3.19 and 3.20 in Financial Stability Review, ECB, November 2018. Right panel: x-axis: the ROI of life insurance companies is computed as the weighted average of the return on investments per asset class using data from Figure 2.8 in Financial Stability Report, EIOPA, December 2018 (to obtain the differences between countries, the aggregate return on sovereign bond holdings is adjusted for domestic sovereign bond yields to account for the tendency of insurers to invest in domestic bonds); average guaranteed rates for selected countries are taken from Figure 2.9 in Financial Stability Report, EIOPA, December 2018.
The recent increase in exposures to BBB-rated and high-yield bonds correlates with life insurers’ profitability challenges. In particular, some life insurers have difficulties in generating investment returns above the average guaranteed rate on existing business, with the latter exceeding the former in several euro area countries at the end of 2017 (see Chart 4.13, right panel).71 In turn, these difficulties correlate with the increase in exposure to BBB-rated and high-yield bonds over the last five years across countries, with the lower profitability being associated with a greater increase in risky exposure. While a causal link is difficult to establish, this descriptive evidence and market analysts’ reports suggest that the need to boost investment income is likely to be one of the factors which pushes insurers to move down the credit quality spectrum. Since the issuers of low-rated bonds could be particularly vulnerable to the recent deterioration in the economic outlook and possibly hit by rating downgrades and/or defaults, the credit risk exposures of euro area insurers require close monitoring. This is particularly important as insurers’ investment behaviour currently tends to contribute to the wider financial sector exuberance and may turn procyclical in distress periods, potentially amplifying price corrections.72
71 The ROI and average guaranteed rate on existing business are not perfectly comparable, owing to
conceptual differences and data quality limitations. Therefore, the difference between the two should be seen only as a tentative proxy for life insurers’ profitability. While this proxy is available only at the end of 2017, it can be considered as representative for several recent years, owing to the slowly changing nature of the average guaranteed rate and the prevailing low-yield environment.
72 See, for instance, Financial Stability Review, ECB, November 2017, Box 5.
20%
25%
30%
35%
40%
45%
BBB-rated andhigh-yield bonds
Highly liquidsecurities
20132018
7.5
8.0
8.5
9.0
9.5
10.0
Residualmaturity (RHS)
AT
BEDE
EE
ES
FI
FRIT
LT
LV
NL
SI
SK
-10
-5
0
5
10
15
20
-1% 0% 1% 2% 3%
2013
-201
8 ch
ange
in th
e sh
are
of B
BB
-rat
ed
and
high
-yie
ld b
onds
(per
cent
age
poin
ts)
ROI minus guaranteed rates (proxy for profitability of life insurers)

Financial Stability Review, May 2019 – Non-bank financial sector
116
While credit risk and market risk are key risks explicitly covered by and monitored under the Solvency II framework, this is less so for liquidity risk. There are, however, several factors suggesting that this type of risk may have increased recently. Beyond the decrease in high-quality liquid assets in insurers’ portfolios, insurers may also face elevated liquidity risks on the liability side. This is because life insurers tend to offer policies with a low investment return to their policyholders in the current low-yield environment, owing to the combination of low guaranteed rates for recently sold products and low discretionary benefits. Should interest rates rise abruptly and strongly, some policyholders could surrender these policies.73 Furthermore, the different liquidity requirements in the banking and insurance sectors leave room for potential regulatory arbitrage. For example, regulatory arbitrage can take place within a group which has both a banking and an insurance entity, whereby the highly liquid assets (e.g. needed by banking entities to meet the liquidity coverage ratio) may be shifted from the insurance to the banking entity.
In light of these developments, the current debate on potential macroprudential measures for insurance considers inter alia macroprudential tools that would help monitor and tackle insurers’ liquidity risks. For instance, a recent EIOPA report highlights the need for additional quantitative reporting under Solvency II as the current reporting does not contain sufficient information to enable the monitoring of liquidity risk at a sectoral level for macroprudential purposes.74 And a recent ESRB report suggests further work on explicit liquidity requirements for insurers, such as a potential liquidity buffer and a discretionary power for authorities to intervene in exceptional circumstances, for instance in the event of mass lapses/surrenders.75 Moreover, the UK’s Prudential Regulation Authority has recently launched a public consultation through which it is seeking views on its expectations for liquidity risk management by insurers, including its expectations regarding the design and conduct of a liquidity stress-testing programme.76 In this context, further efforts to enhance thinking on the macroprudential toolkit for insurers are important.
Box 9 Insurers’ investment in alternative assets
Prepared by Linda Fache Rousová and Margherita Giuzio
In the current low interest rate environment, euro area insurers have been venturing into alternative asset classes such as alternative, infrastructure and private equity funds, loans and real estate holdings.77 This move helps insurers diversify their portfolios. It may also boost their
73 Surrender is the premature termination of an insurance contract by the policyholder. For life insurance
policies, it typically requires an insurance company to pay out a surrender value to the policyholder, which reflects the current value of the life insurance policy minus a surrender penalty.
74 See Other potential macroprudential tools and measures to enhance the current framework, EIOPA, July 2018, Section 6.
75 See Macroprudential provisions, measures and instruments for insurance, ESRB, November 2018. 76 See Liquidity risk management for insurers, Consultation Paper 4/19, Prudential Regulation Authority,
March 2019. 77 To capture most of the non-traditional and illiquid investments of insurers, this box considers a broad set
of alternative assets including real estate holdings, even if they may not be considered as an “alternative” asset class in all euro area countries. For instance, in the Netherlands, insurers and pension funds have traditionally invested in real estate, mainly through the provision of mortgages.

Financial Stability Review, May 2019 – Non-bank financial sector
117
investment returns and limit the duration mismatch in their balance sheets. More broadly, it contributes to the diversification of the financing sources of the real economy (see Chart 4.1). But the portfolio shift towards alternative investments also raises financial stability concerns, which is the focus of this box. In particular, the shift may increase insurers’ credit and liquidity risks and contribute to wider financial sector exuberance in some parts of the real economy as well as amplify market shocks in the event of (abrupt) price corrections.
Chart A Exposures of euro area insurers to alternative assets have increased across all types of business and most euro area countries
Insurers’ exposure to alternative asset classes: by country (left panel) and by type of business (right panel) (Q4 2017-Q4 2018, percentage of total investment)
Sources: European Insurance and Occupational Pensions Authority (EIOPA) and ECB calculations. Notes: Based on aggregate asset exposure statistics published by EIOPA (solo Solvency II reporting; template S.06.02). The “real estate” category includes exposures to residential and commercial properties (excluding the ones for own use), mortgages and equity of real estate-related corporations and real estate funds. “Alternative funds”, “infrastructure funds” and “private equity funds” include exposures to the respective fund category. “Loans” include exposures to collateralised and securitised loans as well as loans without collateral (mortgages are included under “real estate”). “Structured products” include collateralised securities. Euro area countries with exposures below 5% at the end of 2018 (EE, ES, GR, IT, SI, SK) are not shown. Right panel: based on a limited set of 14 euro area countries, for which the split between exposures of life and non-life insurers is available.
On average, insurers’ holdings of alternative assets increased from 8.9% to 9.6% of total investment assets over 2018 and are expected to rise further in the next years (see Chart A).78,79 While the exposures grew across most euro area countries, there is a striking heterogeneity in their overall size (see Chart A, left panel). The largest exposures are currently in the Netherlands (25%), followed by Belgium (14%) and Finland (13%). There are also some differences across business types, with life insurers holding 10.9% of their assets in alternative investments at the end of 2018 (see Chart A, right panel).
While starting from low levels, infrastructure and alternative funds have been the fastest-growing among the alternative asset classes in insurers’ portfolios. Traditional life insurers offering non-unit-linked policies were the most significant contributors to the fast growth in holdings of infrastructure funds, which may offer them a high-yield investment opportunity that matches the long-term duration of their liabilities. By contrast, the increase in exposures to alternative
78 Based on the new quarterly exposure data published by EIOPA, which start only as of the end of 2017. 79 According to the November 2017 EIOPA investment behaviour report and industry reports, although the
level of alternative assets is currently low compared with the overall portfolio size, almost 75% of the European insurers surveyed responded positively about increasing their investments in asset classes such as infrastructure, mortgages, loans and real estate.
NL BE FI AT MT CY EA DE FR LU IE PT LV LT
0%
5%
10%
15%
20%
25%
30%
Real estateAlternative fundsPrivate equity funds
Infrastructure fundsLoansStructured products
Non-life insurance Life insurance Unit-linked lifeinsurance
Non-unit-linked lifeinsurance

Financial Stability Review, May 2019 – Non-bank financial sector
118
funds was mainly driven by unit-linked life insurers, which hold almost half of their alternative assets in such funds. Alternative funds are in turn subject to elevated liquidity risk, owing to the (possible) mismatch between daily or weekly redemption rights and their illiquid investments.80 Moreover, these funds are often highly leveraged and exposed to credit risk, which can amplify the liquidity strains and expose insurers to large losses – even if the impact on the sector may be limited, owing to the design of unit-linked policies.
Chart B Insurers’ exposures to real estate tend to be high in countries with elevated property valuations
Euro area insurers’ exposure to real estate as a percentage of total assets (left panel) and residential real estate prices (right panel) (left panel: Q4 2018, percentage of total assets; right panel: Q4 2018; x-axis: percentage share of residential and unassigned real estate exposure in total assets; y-axis: percentage deviations of residential real estate prices from estimated fair value)
Sources: Solvency II data from EIOPA, ECB and ECB calculations. Notes: Left panel: both direct exposure (through property, mortgages and real estate securities) and indirect exposure (through real estate funds) are included. The category “unassigned” consists of corporate bonds, equity, real estate funds and other real estate investments, for which the breakdown into commercial and residential real estate is not available. Right panel: for each country, the fair value estimations are calculated as an average of estimates obtained by two different methods: the price-to-income ratio and one model-based estimate (Bayesian vector autoregression or BVAR). For details of the methodology, see Box 3 in Financial Stability Review, ECB, June 2011, and Box 3 in Financial Stability Review, ECB, November 2015.
While less dynamic in terms of growth, real estate holdings represent by far the largest exposures to alternative assets in many euro area countries. Such exposures accounted for around 7.7% of insurers’ investment portfolios at the end of 2018 and included exposures to both residential and commercial real estate markets (see Chart B, left panel). The exposures tend to be large in countries with elevated property valuations, which suggests that insurers may have contributed to exuberance in property markets (see Chart B, right panel). Also, potential property price corrections are more likely to occur in overvalued markets and could thus result in significant valuation losses in insurers’ portfolios. In such a scenario, traditional life insurers would be the most exposed to the potential price drops as they hold more than 80% of the sector’s exposures. But the growing investment of traditional life insurers in real estate and particularly in mortgages with long periods of fixed interest rates can also be seen as a positive development for financial stability, as it may help traditional life insurers to close the typically negative duration gaps on their balance sheets, while diversifying the financing sources of the economy.
80 See, for example, Annual Statistical Report on EU Alternative Investment Funds, ESMA, 2019.
NLCY
BE
AT
FI DE
PT
FR
SKSI
GRLV
ES
ITIE
MT
LU
LT
EE
-20
-15
-10
-5
0
5
10
15
20
25
30
0 4 8 12
Dev
iatio
ns o
f res
iden
tial r
eal e
stat
epr
ices
from
est
imat
ed fa
ir va
lue
(%)
Percentage of residential and unassigned real estate exposure (% of total assets)
0%
2%
4%
6%
8%
10%
12%
14%
16%
18%
20%
NL CY BE AT DE FI EA FR PT
CommercialResidentialUnassigned

Financial Stability Review, May 2019 – Non-bank financial sector
119
There are several reasons why investment in alternative assets could also help insurers address the profitability challenges they face in the prevailing low-yield environment. 81 Alternative investments typically offer higher expected returns than bonds and stocks. This spread can be explained by the higher credit risk of the projects that corporations finance through these instruments and/or a higher illiquidity premium relative to publicly listed instruments. In particular, alternative asset classes are often difficult to price and imply high trading costs, owing to informational frictions and a limited set of potential buyers as well as legal impediments to trading. Furthermore, alternative asset classes are typically mildly correlated with traditional markets and result in a more diversified portfolio. All these characteristics make alternative asset classes attractive to institutional investors with a long-term investment horizon that usually “buy and hold”, such as insurance corporations and pension funds.82
At the same time, a growing share of alternative investments in insurers’ portfolios also raises financial stability concerns. First, the low credit quality and high leverage in some segments of the (private) corporate sector result in elevated exposures of insurers to risky assets. The returns on these investments may come under pressure should the weak growth outlook materialise or be worse than expected. Second, although insurers often engage in a “buy and hold” investment strategy, they may want to liquidate some of their alternative assets in a severe stress scenario, which may prove difficult due to their illiquid nature. Third, some of the alternative instruments – such as alternative and private equity funds as well as structured products – are highly complex and opaque, potentially making it difficult for insurers to manage these risks effectively. Finally, the exposure to higher-yielding and illiquid alternative assets is expected to rise over the coming years, which may further contribute to wider financial sector exuberance in some markets such as real estate and exacerbate financial cycles.
81 The data available for a limited set of euro area countries suggests that low profitability of life insurers in
2017 (as measured by return on investment minus average guaranteed rates – see Chart 4.14) correlates with the size of their exposures to alternative assets at the end of 2018 (correlation coefficient of -44%).
82 According to Cummins, Cragg, Zhou and deFonsecka (2018), between 2010 and 2016, the allocation of US life insurers to privately placed bonds increased from 25% to 30% (see Cummins, D., Cragg, M., Zhou, B. and deFonseka, J., “The Social and Economic Contributions of the Life Insurance Industry”, September 2018). At the same time, the share of illiquid asset classes held by pension funds rose globally from 4% in 1997 to 25% in 2017 (Willis Towers Watson’s Global Pension Assets Study, 2018). See, for example, Ivashina, V. and Lerner, J., “Looking for Alternatives: Pension Investments Around the World, 2008 to 2017”, 2018.

Financial Stability Review, May 2019 – Special features
120
Special features
A Climate change and financial stability
Prepared by Margherita Giuzio, Dejan Krusec, Anouk Levels, Ana Sofia Melo, Katri Mikkonen and Petya Radulova83
This special feature discusses the channels through which climate change can affect financial stability and illustrates the exposure of euro area financial institutions to risks from climate change with the help of granular data. Notwithstanding currently limited data availability, the analysis shows that climate change-related risks have the potential to become systemic for the euro area, in particular if markets are not pricing the risks correctly. A deeper understanding of the relevance of climate change-related risks for the euro area financial system at large is therefore needed. Better data availability and comparability and the development of a forward-looking framework for risk assessments are important aspects of this work going forward.
Introduction
With evidence of rising global temperatures, awareness of climate change risks has been growing, leading to enhanced international action. The Intergovernmental Panel on Climate Change (IPCC) has estimated human activities to have led to around 1°C of global warming compared with pre-industrial times.84 In most scenarios previously developed by the IPCC, without additional efforts to reduce carbon emissions, global warming is “more likely than not to exceed 4°C above pre-industrial levels by 2100”, although there is substantial uncertainty about the precise estimates.85 Against this backdrop, the Paris Agreement, signed in December 2015, aims to limit the rise in global average temperatures to well below 2°C above pre-industrial levels and to pursue efforts to limit the rise to 1.5°C.86
Climate change may have significant impacts on the economy, both directly and indirectly through the actions taken to address it. Rising temperatures and changing patterns of precipitation would be expected to have direct impacts on agriculture and fisheries but they may also affect other sectors such as energy, tourism, construction and insurance.87 While significant macroeconomic impacts from climate change may occur in the more distant future, some impacts are already
83 Also based on contributions by Spyridon Alogoskoufis, Nicola Benatti, Linda Faché Rousova, Morgane
Hoffmann, Urszula Kochanska and Gabriele Torri. Comments from Julian Morgan are gratefully acknowledged.
84 With a “likely” range between 0.8°C and 1.2°C. Taken from “Global Warming of 1.5°C”, IPCC, Geneva, Switzerland, p. 6.
85 Climate Change 2014 Synthesis Report – Summary for Policymakers, IPCC, Geneva, Switzerland, pp. 18-19.
86 See the Paris Agreement homepage. 87 See the analysis by the European Commission on this issue.

Financial Stability Review, May 2019 – Special features
121
beginning to be felt.88 Policies implemented to try to prevent or moderate climate change (climate change mitigation) may also have wide-ranging sectoral impacts, potentially affecting the energy, transport, manufacturing and construction sectors in particular.89 On the other hand, if the mitigating action is too timid, this will increase the magnitude and the pace of the necessary adjustment in the future, creating the potential for a sudden and general market correction or even an economic recession.90
While the need for financial sector adjustment as part of the climate challenge is widely acknowledged, key gaps remain in terms of measurement. Within Europe, discussions on the financial aspects of climate change have ranged from ongoing work at the European Commission to devise taxonomies that aim to support transparency and thereby market-based adjustment, to the establishment of a Network for Greening the Financial System (NGFS), where central banks and financial supervisors from five continents have joined forces to support the transition to a low-carbon economy and manage climate change risks. Foremost among the measurement gaps is the understanding of exposures of financial institutions to climate change-related risks. Partly, this relates to a dearth of sufficiently granular public data detailing complex and evolving exposures both within as well as across economic sectors. Notably, while country-level data can be used for tracking the implementation of political commitments, monitoring financial exposures to the global effects of climate change requires reliable and comparable data at the level of economic sectors or individual exposures. Limited empirical measurement has, in turn, constrained both market development and informed policy initiatives.
This special feature discusses general financial stability issues pertaining to climate change, examines potential financial exposures to it, and outlines policy considerations.91 The first section briefly introduces the transmission channels of climate change risk to the financial sector. The second section explores the exposures of euro area financial institutions to climate risk-sensitive assets using sectoral and exposure-level data. The final section gives an overview of the ECB’s involvement in policy initiatives in the field of climate risk and financial stability and outlines priorities for further work.
88 For instance, it is estimated that, ceteris paribus, the 20cm rise in the sea level since the 1950s may have
raised the surge losses associated with Superstorm Sandy by 30% in New York. See Catastrophe Modelling and Climate Change, Lloyds, London, 2014.
89 See, for instance, the “In-depth analysis in support of the Commission communication COM (2018) 773” from the European Commission on this issue.
90 See Lane, P. R., “Climate Change and the Irish Financial System”, Central Bank of Ireland Economic Letters, Vol. 2019, No 1.
91 The focus of the special feature is on the financial stability consequences of climate change. For a discussion on monetary policy, see Cœuré, B., “Monetary policy and climate change”, speech at the conference on “Scaling up Green Finance: The Role of Central Banks”, organised by the Network for Greening the Financial System, the Deutsche Bundesbank and the Council on Economic Policies, Berlin, 8 November 2018.

Financial Stability Review, May 2019 – Special features
122
Physical risks directly impair financial stability, while transition requires adjustment
The transmission channels of climate change risk to the financial sector are by now commonly understood to comprise two main aspects. First, climate change can affect financial stability directly through the impact of more frequent and severe disasters and through gradual developments in the economy, of which financial markets constitute an important part. Second, financial markets can be adversely affected by the uncertainties related to the timing and speed of the process of adjustment towards a low-carbon economy, including the impact of the related policy action and potentially disruptive technological progress on the asset prices of carbon-intensive sectors. In the literature, these risks are typically referred to as physical and transition risks, respectively.92
Physical risks, when they materialise, can significantly erode collateral and asset values and have an impact on insurance liabilities in particular. As climate change advances, the risk of abrupt value losses in climate risk-sensitive geographical areas increases. This can lead to the erosion of collateral and asset values for a large number of financial institutions. Insurance liabilities are particularly exposed to an increased frequency and severity of climate and weather-related events that damage property or disrupt trade. Chart A.1 (left panel) shows that the share of weather-related catastrophe losses has increased steadily to account for over 80% of insured catastrophe losses in 2018. The upward trend is accompanied by a growing frequency of weather-related loss events, the number of which hit a record in 2018 (see Chart A.1, right panel).
92 See, for example, G20 Green Finance Synthesis Report, G20 Green Finance Study Group, September
2016; First Progress Report, NGFS, October 2018; and First comprehensive report, NGFS, April 2019. In addition, some designate (legal) liability risk as a separate category. The risk is likely to have an impact on individual institutions that are active in the liability insurance market rather than the system as a whole (see e.g. Batten, S., Sowerbutts, R. and Tanaka, M., “Let’s talk about the weather: the impact of climate change on central banks”, Staff Working Paper No 603, Bank of England, May 2016).

Financial Stability Review, May 2019 – Special features
123
Chart A.1 Physical risk: weather-related insured losses and the number of natural loss events are increasing
Global insured catastrophe losses (left panel) and number of relevant natural loss events worldwide (right panel) (1985-2018; left panel: left-hand scale: USD billions; right-hand scale: percentages; right panel: left-hand scale: number of events; right-hand scale: percentages)
Sources: Swiss Re Institute, Munich Re NatCatService and ECB calculations.
Adaptation can reduce exposures of insurers to physical risk, but can also increasingly shift them to other economic agents. New models have improved forecasting capabilities and risk management related to insurance coverage and pricing. From a social welfare point of view, there is a risk that certain losses may become uninsurable. For example, properties in areas vulnerable to floods, fires or hurricanes are becoming harder and more expensive to insure. This could increase costs to households and non-financial corporations (NFCs), as well as governments in the cases where they act as ultimate insurers of last resort.
Transition risk materialises when mitigation policies, technological advances or changes in public sentiment lead to value reassessments by financial market participants, possibly in an abrupt manner. Reaching the goals of the Paris Agreement will require policy action that provides incentives to economic agents to reduce emissions.93 An unanticipated introduction of policy measures or a rapid change in consumer preferences could trigger abrupt asset price decreases for the affected firms and sectors. A lack of reliable and comparable information on climate-sensitive exposures of financial institutions could create uncertainty and cause procyclical market dynamics, including fire sales of carbon-intensive assets, and potentially also liquidity problems.94 In addition to market risk, credit risk could also increase if policies, market reactions or the accelerating impact of new technologies on the transition lead to lower profitability and higher default risks for
93 An example of such policy action is the introduction of carbon taxes. 94 See, for example, “Transition in thinking: The impact of climate change on the UK banking sector”, Bank
of England, September 2018; and “Too late, too sudden: Transition to a low-carbon economy and systemic risk”, Reports of the ESRB Advisory Scientific Committee, No 6, February 2016.
85
86
87
88
89
90
91
92
93
94
95
0
100
200
300
400
500
600
700
800
900
1985 1990 1995 2000 2005 2010 2015
Hydrological eventsMeteorological eventsClimatological eventsGeophysical events% of weather-related events - 5-year moving average (right-hand scale)
50
55
60
65
70
75
80
85
90
95
100
0
20
40
60
80
100
120
140
160
1985 1990 1995 2000 2005 2010 2015
Earthquake/tsunamiWeather-related catastrophesMan-made disasters% of weather-related catastrophes losses - 5-year moving average (right-hand scale)

Financial Stability Review, May 2019 – Special features
124
carbon-intensive firms, and ultimately to higher capital charges and risk weights for bank exposures. Furthermore, sovereign risks could increase for countries with carbon-intensive industries.
Market pricing of transition risk is complicated by its long-term nature and the lack of data. Correct pricing of climate risk reduces the risk of a sudden reassessment and thus the costs related to the transition, which in such a case is likely to be more orderly. Evidence in the literature is mixed, suggesting that pricing transition risk is not straightforward.95 A potential underpricing of transition risk could emerge if the strategic horizon of investors is shorter than the horizon over which they expect the transition to occur.96 At the same time, market pricing is hampered by the lack of granular and comparable information on climate change-related risks. For example, although there are some widely accepted market initiatives to certify and register green instruments, no universal classification as to what is to be considered sustainable exists to date.97 Box A discusses the state of play of the European Commission’s initiative to establish an EU classification system, or taxonomy, for sustainable activities.98
The costs associated with physical and transition risks vary depending on the trajectory chosen for reducing carbon emissions. Chart A.2 depicts the relationships between the climate change scenarios and the transmission channels in a stylised manner.99 As the costs related to physical risk increase when emissions accumulate, a delay in action will increase the magnitude of the necessary reaction and adjustment costs in the future.100 In contrast, an orderly transition would allow a gradual repricing of assets, while early action would minimise damage caused by physical risk.101 Stress tests and scenario analyses can be used to gauge the quantitative impacts of the various scenarios. Compared with traditional stress testing, however, the quantification is complicated by the long time horizon of the expected impact, and in particular by the choice of the appropriate discount rate and the timing of policy and technological development-related events.102
95 See, for example, Delis, M. D., de Greiff, K. and Ongena, S., “Being Stranded on the Carbon Bubble?
Climate Policy Risk and the Pricing of Bank Loans”, mimeo, 2018; and Friede, G., Busch, T. and Bassen, A., “ESG and financial performance: aggregated evidence from more than 2000 empirical studies”, Journal of Sustainable Finance & Investment, Vol. 5(4), 2015.
96 See NGFS (2018), op. cit., and Carney, M., “Breaking the tragedy of the horizon – climate change and financial stability”, speech at Lloyd’s of London, 29 September 2015.
97 See, for example, Green Bond Principles, International Capital Market Association (updated as of June 2018). For an overview of the most-used certification mechanisms for green bonds, see Ehlers, T. and Packer, F., “Green bond finance and certification”, BIS Quarterly Review, September 2017.
98 See Action Plan: Financing Sustainable Growth, European Commission, March 2018. 99 In reality, there is a continuum of different outcomes and transition pathways across the two dimensions.
The four high-level scenarios are to be taken as representative for the sake of simplicity. 100 See Carney, M., (2015), op. cit., ESRB Advisory Scientific Committee (2016), op. cit., and Lane, P. R.
(2019), op. cit. 101 It should be noted that the transition paths and the associated costs will vary from country to country and
depend on the different political, technological and socioeconomic conditions and the policy and consumer choices made in the future. See NGFS (2019), op. cit.
102 See NGFS (2018), op. cit.

Financial Stability Review, May 2019 – Special features
125
Chart A.2 Physical versus transition risks: temperature scenarios and the cost of climate change
Source: NGFS (2019), op. cit.
Box A A taxonomy for sustainable financial activities
Prepared by Anouk Levels and Ana Sofia Melo
No universal taxonomy exists for defining which activities or financial instruments could be considered environmentally sustainable (green) or harmful (brown). A universal labelling of green activities would help investors to direct capital towards sustainable investments and provide a basis for the issuance of green instruments, such as bonds or loans. A brown taxonomy would facilitate the assessment of transition risk in the balance sheets of financial institutions.
An effective taxonomy would need to be activity-based and harmonised. A taxonomy at the sectoral or firm level would be too limited. The oil industry, for example, would not be classified as sustainable, even though there may be firms that invest in renewable energy. Not recognising these activities as green may hamper the transition to more sustainable production technologies. Harmonisation is needed to achieve transparency for investors who want to invest in sustainable assets or avoid polluting assets, and to limit firms’ or financial institutions’ incentives to “green-wash” assets in order to benefit from any potential preferential (regulatory) treatment.
Creating a harmonised classification of environmentally sustainable activities is a priority for the European Commission. The Action Plan on Financing Sustainable Growth notes that redirecting capital towards sustainable economic activities has to be based on a common understanding of sustainability.103 Establishing an EU classification system (“taxonomy”) for sustainable activities is therefore a priority. The taxonomy is expected to screen sectors and activities on the basis of criteria, thresholds and metrics and will be crucial for supporting the flow of capital to
103 See European Commission (March 2018), op. cit.
Tran
sitio
n pa
thw
ay Dis
orde
rlyO
rder
ly
Disorderly
Sudden and unanticipated response is disruptive but
sufficient enough to meet climate goals
Orderly
We start reducing emissions now in a measured way to meet
climate goals
Hot house world
We continue to increase emissions, doing very little, if anything, to avert the physical
risks
Too little, too late
We do not do enough to meet climate goals, the presence of
physical risks spurs a disorderly transition
Strength of response(based on whether climate targets are met)
Not metMet
Physical risks
Tran
sitio
n ris
ks

Financial Stability Review, May 2019 – Special features
126
sustainable activities. The taxonomy aims to provide transparency on environmental sustainability to investors and enable informed decision-making with a view to fostering sustainable finance.
Due to the complexity of the task, the implementation of the taxonomy will be gradual. Initially, the taxonomy will be voluntary and it will be integrated into EU legislation in a phased manner at a later stage. In terms of coverage, the first version of the taxonomy is expected to pertain to climate change mitigation and adaptation. In a later stage, the taxonomy is expected to be extended to cover a full set of environmental and social activities.104
The taxonomy will only cover activities that contribute substantially to environmental objectives. Activities that are not classified as green are not automatically brown. They could contribute marginally to environmental objectives, be neutral, or be polluting (brown). From a financial stability and prudential perspective, it would be relevant to develop a brown taxonomy for the purpose of assessing climate risks. Any consideration of climate risk in banks’ capital requirements framework would require evidence of the potential risk differential between green and brown assets.
Euro area financial institutions’ exposures to transition risk
Efforts to gauge financial institutions’ exposures to transition risk have so far mostly concerned investments in certain industrial sectors. Typically, the most climate-sensitive sectors are selected in the NACE classification on the basis of an aggregate environmental metric, such as a measure of carbon emissions for the sector.105 Battiston et al. (2017) remap all the sectors at NACE2 4-digit level into new climate policy-sensitive sectors, combining criteria including carbon emissions, the role of the sector in the supply chain, and the existence of traditional policy institutions for the sectors.106 The left panel of Chart A.3 paints a broad picture of euro area banks’ exposures and the contribution of various sectors to carbon emissions. The right panel of Chart A.3 applies the approach by Battiston et al. (2017) to the ECB’s Securities Holdings Statistics by Sector (SHSS). The evolution of portfolio investments shows that investment and pension funds have reduced their relative exposures to securities issued by climate policy-relevant sectors in recent years.107 By contrast,
104 The Commission is empowered to adopt delegated acts to specify technical screening criteria for what
qualifies as a substantial contribution to a given environmental objective for a given economic activity and what is considered to cause significant harm to other objectives. See the Proposal for a Regulation of the European Parliament and the Council on the establishment of a framework to facilitate sustainable investment, European Commission, May 2018.
105 See, for example, “Evaluating climate change risks in the banking sector – Report required under Article 173 V of the Energy Transition and Green Growth Act No. 2015-992 of 17 August 2015”, DG Trésor, Banque de France and ACPR, 2017; and Vermeulen, R., Schets, E., Lohuis, M., Kölbl, B., Jansen, D.-J. and Heeringa, W., “An energy transition risk stress test for the financial system of the Netherlands”, Occasional Studies, Vol. 16-7, De Nederlandsche Bank (DNB), 2018. For earlier work on exposures to oil, gas and mining firms, see Weyzig, F., Kupper, B., van Gelder, J. W. and van Tilburg, R., “The Price of Doing Too Little Too Late – The impact of the carbon bubble on the EU financial system”, report prepared for the Greens/EFA Group, European Parliament, February 2014. For information on the NACE classification, see the European Commission’s website.
106 See Battiston, S., Mandel, A., Monasterolo, I., Schuetze, F. and Visentin, G., “A climate stress-test of the EU financial system”, Nature Climate Change, Vol. 7, 2017, pp. 283-288.
107 For institutional investors, policy guidelines may have a large impact on their asset allocations. For example, Norway’s government recommended that its USD 1 trillion wealth fund, one of the largest funds globally, divest from upstream oil and gas producers in March 2019.

Financial Stability Review, May 2019 – Special features
127
banks and insurance corporations kept their exposures relatively constant.108 However, the analysis of the banking sector suffers from the fact that loans are not included in the SHSS.109
Chart A.3 Sectoral exposure statistics can provide a first comprehensive approximation of transition risk
Euro area banks’ exposures and sectoral contributions to carbon emissions (left panel); evolution of investment exposures to climate-sensitive sectors (by issuer sector) (right panel) (left panel: percentages; x-axis: sectoral contributions to total carbon emissions; y-axis: bank exposures (as a share of total exposures); right panel: Dec. 2015-Dec. 2018; left-hand scale: € billions; right-hand scale: percentage of total holdings)
Sources: ECB supervisory statistics, European Commission EDGAR dataset, Eurostat, ECB SHSS, ECB CSDB and ECB calculations. Notes: Left panel: the share of carbon emissions is calculated from Eurostat data on air emissions accounts by NACE activity, which cover the EU28, Turkey and Serbia. Electricity and gas supply also includes steam and air conditioning supply. Right panel: the classification of climate-sensitive assets follows the approach of Battiston et al. (2017). Sectoral holdings are classified according to the NACE categorisation in the ECB’s Centralised Securities Database (CSDB).
Sectoral analysis can be useful for a first approximation of exposures of financial institutions to transition risk, but at the same time it abstracts from important differences within sectors. Sectoral classification allows for a more comprehensive aggregate view, as more data are available for sectors than for individual firms. This is important for the feasibility of top-down scenario analyses, for example. Sectoral data, however, abstract from the large differences in production processes and technologies, and consequently from pollution propensities of firms within sectors (see Box A). Furthermore, sectoral classification importantly ignores any dynamics within firms over time. In particular, investments in carbon-intensive firms could in fact be aimed at introducing cleaner technologies, in which case labelling an investment as carbon-intensive would be highly misleading.110
108 For a more comprehensive analysis on climate-related asset exposures of euro area insurers, see
Financial Stability Report, European Insurance and Occupational Pensions Authority, December 2018. 109 The stress test by DNB (2018) op. cit. uses a survey on corporate loans. Combining this information with
the SHSS resulted in 10-13% of the assets of Dutch banks being estimated as climate-sensitive. 110 In fact, green bond issuance is heavily concentrated in carbon-intensive sectors. See De Santis, R. A.,
Hettler, K., Roos, M. and Tamburrini, F., “Purchases of green bonds under the Eurosystem’s asset purchase programme”, Economic Bulletin, Issue 7, ECB, 2018.
0
1
2
3
4
5
6
7
8
9
0
50
100
150
200
250
300
350
400
450
2015
2016
2017
2018
2015
2016
2017
2018
2015
2016
2017
2018
2015
2016
2017
2018
Banks Investmentfunds
Insurancecorporations
Pensionfunds
Energy-intensiveFossil fuelsHousingTransportUtilities% of total holdings (right-hand scale)
Construc-tion
Electricity and gas supply
Manufac-turing
Real estate
activities
Transpor-tation and
storage
Whole-sale and
retail trade
0%
2%
4%
6%
8%
10%
12%
0% 10% 20% 30% 40%

Financial Stability Review, May 2019 – Special features
128
While data availability does not allow for a comprehensive analysis, large exposures of euro area banks can be used to learn more about their exposures to climate-sensitive assets. Looking at individual exposures in particular allows for the use of borrower-specific metrics of carbon intensity. At the same time, caution should be exercised when interpreting the results. By their nature, large exposure data only allow for a partial and potentially biased view into bank portfolios, and the overall exposures in a given market may be affected by the market structure.111 Data cleaning and matching with the available carbon data furthermore reduce the sample to 40% of the reported exposures. The remaining €720 billion constitute 5.6% of the total exposures to NFCs and 3% of the total assets of the banks in the sample. Furthermore, firm-level reporting on carbon emissions is currently voluntary, and therefore may not be fully representative. At the same time, large exposures provide a first illustration of the potentially most important exposures in terms of concentration and potential systemic impact.112
Data show that exposures to transition risk, although quite contained in relative terms, may be significant for some banks in absolute values. Chart A.4 (left panel) divides the exposures according to the reported carbon intensity of the borrower firm. From this perspective, exposures to carbon-intensive firms look relatively contained. Looking at absolute carbon emission amounts – which are obviously larger for big firms and are a relevant perspective from the point of view of political commitments to reduce overall emissions – changes the picture somewhat. Chart A.4 (right panel) lists the firms starting from the highest contributor to the overall emissions in the sample and shows that banks’ exposures to these firms are rather significant. Overall, the exposures to the twenty largest emitters capture 20% of total large exposures, or 1.8% of the total assets of the banks in the sample.113 Chart A.5 provides an illustration of how the top 20 carbon-emitting firms identified in the large exposures dataset map into concentration at the level of both economic sectors and banking systems. This illustration suggests that such exposures could be quite concentrated in a few banking sectors. At the same time, any firm conclusions would need to be tempered given the caveats noted in the preceding paragraph.
111 The Capital Requirements Regulation (CRR) requires that banks report exposures to clients (or groups of
connected clients) totalling at least 10% of the eligible capital of the bank as large exposures. Additionally, exposures larger than or equal to €300 million also need to be reported. The fact that only large exposures are observable may in addition understate the exposures in a fragmented banking system or overstate those in a concentrated system.
112 An earlier contribution has justified a partial approach of looking at syndicated loans to estimate bank exposures to oil, gas and coal mining firms, with the argument that large fossil fuel companies would not typically request bilateral bank loans owing to their much smaller size. See Weyzig et al. (2014), op. cit.
113 Altogether these 20 firms are responsible for more than half of the reported aggregate carbon footprint in large exposures of euro area banks.

Financial Stability Review, May 2019 – Special features
129
Chart A.4 Although the relative carbon intensity of exposures appears moderate for the sample, absolute exposures to large emitters could still be significant
Distribution of large exposures of banks in the sample to firms with different carbon intensities (as a share of total large exposures) (left panel); banks’ exposures to the reporting 40 firms with the highest carbon emissions (right panel) (left panel: median, quartiles and 10th and 90th percentiles; right panel: € billions)
Sources: Thomson Reuters, ECB supervisory statistics (large exposures) and ECB calculations. Notes: Carbon intensity is calculated as the ratio of a firm’s total carbon emissions to its total sales. Altogether, 76% of the firms in the sample belong to the most carbon-efficient group (carbon emissions/sales <5%), 9% to the mid-range, and 15% to the most carbon-intensive group. The carbon emissions refer to Scope 2 emissions (emissions arising from purchased energy, heat or steam consumed by the firm). The carbon accounting standard has been developed and made available by the Greenhouse Gas Protocol and the Carbon Disclosure Project.
While this preliminary assessment suggests that a disorderly transition to a low-carbon economy could be systemically relevant, it also demonstrates the limitations related to the lack of comprehensive and comparable climate risk-related data. A monitoring framework for climate change-related risks in the financial sector would require more comprehensive information on carbon emissions and the exposures of banks and other financial institutions. In addition, scenario analyses and/or stress tests need to be developed to cater for transition risk in a forward-looking manner.
0%
20%
40%
60%
80%
100%
2015 2016 2017 2015 2016 2017 2015 2016 2017
CO2/sales < 5% 5% ≤ CO2/sales < 10%
CO2/sales ≥ 10% 0
5
10
15
20
25
30
0 10 20 30 40
Banks' exposures

Financial Stability Review, May 2019 – Special features
130
Chart A.5 Large exposures to reporting firms with the highest emissions
Euro area banks’ large exposures to reporting firms with the highest carbon emissions (share of total loans)
Sources: Thomson Reuters, ECB supervisory statistics (large exposures) and ECB calculations. Notes: The top 20 carbon-emitting companies reported in the large exposures dataset. The companies are ranked in descending order according to their total carbon emissions over the last four years (middle bar); the height of the NFCs’ rectangles represents total loans extended to the respective company, whereas the width of the rectangles represents the carbon emissions of the company. The NFCs are classified according to the NACE categorisation (left bar). The banking systems column includes 29 banks (right bar).
Policy initiatives related to climate risk and financial stability
Increased awareness of the potential impact of climate risk on the financial sector has brought together central banks and supervisors to share best practices regarding climate risk monitoring and management. In 2017 the Financial Stability Board’s Task Force on Climate-related Financial Disclosures (the FSB TCFD) highlighted the need for comparable and consistent disclosures about the risks and opportunities of climate change, and issued recommendations to this effect.114 In addition, under the auspices of the NGFS, a group of central banks, supervisors and international organisations agreed in October 2018 that it is within the mandates of central banks and supervisors to ensure that the financial system is resilient to climate-related risks.115
The NGFS recently published recommendations on: (i) monitoring climate risks; (ii) developing taxonomies; (iii) promoting disclosures; and (iv) incorporating climate-related risks into prudential frameworks.116 Table A.2 provides an overview of these recommendations and links them to ongoing policy and
114 Recommendations of the Task Force on Climate-related Financial Disclosures, June 2017. 115 NGFS (2018), op. cit. The ECB is a member of the NGFS. To date, the NGFS comprises 36 members.
Other global initiatives include the launch of the Sustainable Insurance Forum (SIF) in 2016 and the activities of the International Association of Insurance Supervisors related to climate risk.
116 The NGFS also published recommendations on integrating sustainability factors into portfolio management and bridging data gaps.

Financial Stability Review, May 2019 – Special features
131
regulatory initiatives at the European level by the European Commission and the European Systemic Risk Board (ESRB).117
Table A.2 Recommendations by the NGFS and European initiatives with a focus on financial stability
2019 NGFS Recommendations 2018 EU Action Plan and regulatory proposals &
ESRB proposals
Monitoring climate-related risks
Central banks and supervisors are encouraged to develop methodologies for measuring climate-related risks, including forward-looking scenario analysis and stress tests
The ESRB has proposed that the European Supervisory Authorities include climate risk scenarios in stress-test exercises, and is conducting analytical work on data and methodologies
Developing taxonomies
Regulators should develop taxonomies that aim to facilitate (i) financial institutions’ climate risk management, (ii) assessment of the potential risk differentials between green and brown assets, and (iii) mobilisation of capital for green investments
The Commission has proposed a regulation for an EU classification system of sustainable economic activity (taxonomy), which aims to help investors redirect capital towards green activities. This feeds into a Green Bond Standard and disclosure requirements, and could potentially be used in the context of low-carbon benchmarks and a “green supporting factor”
Promoting disclosures
Non-financial and financial institutions should adopt the FSB TCFD disclosure recommendations
The Commission has proposed a disclosure regulation and a regulation for a low-carbon benchmark and a positive carbon impact benchmark
Incorporating climate-related risks into prudential frameworks
Central banks and supervisors are encouraged to integrate climate-related risks into supervision, among other things, by (i) raising awareness and promoting climate risk assessment among institutions, (ii) setting supervisory expectations regarding governance and risk management, and (iii) potentially considering integrating climate risk into the prudential framework
In its Action Plan, the Commission states that it will explore the feasibility of the inclusion of climate risks in institutions’ risk management policies and the potential calibration of capital requirements for banks as part of the CRR/CRD.
At the European level, the ESRB is taking important steps towards developing a monitoring framework for climate-related risks. The NGFS encourages monitoring of climate risks by central banks and supervisors. The ESRB’s Advisory Scientific Committee in 2016 highlighted the potential impacts of physical and transition risks on the European financial system and recommended that authorities consider developing climate stress-test methodologies.118 The European Supervisory Authorities could also include climate risks in their regular stress-testing exercises. To facilitate the incorporation of climate risks into stress analysis by authorities, the ESRB is conducting analytical work on data and methodologies.
The European Commission is developing a taxonomy which will feed into several initiatives that aim to help investors direct their capital towards sustainable activities. The legislative proposal for the taxonomy lays down criteria for the identification of activities that actively contribute to sustainability and environmental objectives (see Box A). The taxonomy will facilitate the development of standards and labels for green financial products such as green bonds. Green bonds allow bond issuers – such as companies, banks and governmental organisations – to borrow money from investors in order to finance sustainable investments.119
117 NGFS (2019), op. cit. 118 ESRB Advisory Scientific Committee (2016), op. cit. 119 The European Commission is developing an EU Green Bond Standard, which builds on the proposed EU
taxonomy regulation to clarify green definitions and puts in place a verification and accreditation process to enhance credibility.

Financial Stability Review, May 2019 – Special features
132
The green taxonomy is intended to complement the Commission’s proposals on improved disclosures on sustainable investments and risks and low-carbon and positive carbon impact benchmarks. The proposed disclosure regulation provides guidance to companies on how to provide climate-related information in line with the FSB TCFD recommendations120 and the green taxonomy. The benchmark regulation sets out a harmonised framework for the development of low-carbon and positive carbon impact benchmarks, which aims to improve transparency for investors regarding their impact on climate change and the energy transition.
In its Action Plan, the Commission also proposed to explore the feasibility of the inclusion of climate-related risks in banks’ capital requirements framework. The idea of a “green supporting factor” – a risk-weight reduction in the prudential framework for banks’ exposures to green assets – has been mooted in this context.121 While the Commission recognises that a reflection of climate risks should not jeopardise the credibility and effectiveness of the prudential framework, the proposal to introduce climate-related concerns into the prudential requirements for banks is based on the premise that green assets are less risky than non-green or brown assets. However, at this stage, it is not clear that the former are less risky than the latter. The European Banking Authority (EBA) will carry out further analysis in this regard.122 For the integrity of financial institutions and financial stability, it is important that prudential frameworks remain risk-based.
The ECB is working with the members of the European System of Central Banks and the ESRB to contribute to the analysis and management of climate-related risks at the global and European levels. As a member of the NGFS, the ECB is contributing to the development of an analytical framework for climate risk assessment. In line with the guidance provided by the NGFS, the ECB will continue developing indicators for a climate risk monitoring framework for the European financial sector and methodologies for climate stress tests or sensitivity analyses, and will explore possibilities to fill identified data gaps. The ECB also contributes to the development of the EU green taxonomy through its membership of the European Commission’s Technical Expert Group on Sustainable Finance (see Box A). In doing so, the ECB aims to raise the awareness and understanding of climate-related risks in order to help financial institutions build resilience against potential climate-related risks.
The analysis presented in this special feature has overall shown that climate risk may adversely affect the balance sheets of financial institutions and therefore may be relevant for financial stability, in particular if markets are not pricing the related risks correctly. A deeper understanding and better communication of such risks and their relevance for the euro area financial system at
120 The FSB TCFD recommendations cover: (i) the governance around climate risks and opportunities;
(ii) the potential impact on the strategy and business model; (iii) risk management; and (iv) metrics and targets used to assess climate risks.
121 See Actions 1 and 8 of the Commission’s Action Plan. 122 See Article 501c of the Presidency compromise on the Proposal for a Regulation amending the CRR.
The EBA shall be entrusted with the task of assessing whether a dedicated prudential treatment of exposures related to assets or activities associated substantially with environmental and/or social objectives would be justified to safeguard the coherence and effectiveness of the prudential framework and financial stability.

Financial Stability Review, May 2019 – Special features
133
large are therefore needed. Increased information should feed into a clear framework that helps market participants assess the related financial risks and reorient financial flows in an orderly manner. Macroprudential policies should be considered for any material systemic risks, including climate-related ones. Besides its efforts to increase quantitative information on climate-related risks in European financial markets, the ECB will continue to be actively involved in several global and European fora to support these aims.

Financial Stability Review, May 2019 – Special features
134
B Economic shocks and contagion in the euro area banking sector: a new micro-structural approach
Prepared by Giovanni Covi, Mattia Montagna and Gabriele Torri123
The financial system can become more vulnerable to systemic banking crises as the potential for contagion across financial institutions increases. This contagion risk could arise because of shifts in the interlinkages between financial institutions, including the volume and complexity of contracts between them, and because of shifts in the economic risks to which they are commonly exposed. Analysis of the euro area banking system’s interlinkages, using the newly available large exposure data, suggests that the system could be more vulnerable to financial contagion through long-term interbank exposures than noted in other studies. That said, common exposures to the real economy – a standard contagion channel in the literature – represent a potential source of individual bank distress and non-systemic events. This analysis also provides an insight into the changes in contagion risk in the system over time, helping us to interpret changes in market indicators of systemic risk, such as aggregated credit default swap (CDS) prices.
Introduction
Contagion – or the phenomenon of a negative shock (or bad news) spreading rapidly across the financial system – is a feature of nearly all systemic banking crises. The many interconnections between different financial institutions, households and businesses allow the financial system to work efficiently in good times, but they can also make the system more vulnerable to bad events being transmitted rapidly across institutions and amplified into systemic events. These events generally involve multiple banks failing at the same time.
The financial system can become more vulnerable to systemic banking crises as the potential for contagion increases. Broadly speaking, there are two ways in which contagion risk is thought to arise: interconnections and common exposures. Interconnections are the direct linkages between households, businesses and financial institutions – such as loans, collateral arrangements and derivatives contracts. These linkages allow financial agents to transfer risk among each other, supporting capital allocation in normal conditions. But they can also transmit problems from one institution to others in stressed conditions. Common exposures, for example when many institutions have similar portfolios of securities or loans, will reflect the underlying demand of the economy for financial intermediation. However, if one or more institutions face losses on their portfolios, or start fire-selling assets to manage other problems, then institutions with similar portfolios may also see values deteriorate.124
123 Comments from Marco D’Errico are acknowledged. 124 See, for example, Duarte, F. and Eisenbach, T. M., “Fire-Sale Spillovers and Systemic Risk”, Federal
Reserve Bank of New York Staff Report, 2018; Shleifer, A. and Vishny, R. W., “Fire Sales in Finance and Macroeconomics”, NBER Working Paper No 16642, 2010; Cont, R. and Schaanning, E., “Fire Sales, Indirect Contagion and Systemic Stress Testing”, Norges Bank Working Paper No 2/2017, 2017.

Financial Stability Review, May 2019 – Special features
135
Post-crisis reforms to financial regulation include measures to try to mitigate the risk of contagion. These measures include the introduction of the large exposure regime, which limits the extent to which a bank can be exposed to a single entity, additional capital requirements for systemically important institutions, the new regulatory liquidity ratios and changes to the requirements for margining derivatives contracts. Central bank lending facilities should also support core market functioning in a stress episode, limiting the risk of fire sales.
This special feature uses newly available granular data on euro area banking sector exposures, combined with a micro-structural model, to examine the potential for contagion in the euro area financial system. In recent years, a number of papers have set out models of the behaviour of individual agents reacting to different types of shocks, and the interactions between these agents, aimed at reproducing the complex dynamics of a financial crisis. These models usually rely heavily on very granular data on banks’ exposures, which are difficult to obtain outside the regulatory environment.125 In this special feature, we combine a model of this type with multiple sources of granular information on the exposures of euro area banks. This includes the recently available time series of data captured as part of the regulation to limit banks’ losses in relation to a single entity, or large exposure data. These data are then used to assess the probability of a banking crisis (i.e. multiple banks failing at the same time) as a result of risk propagation either due to systematic risk that stems from common exposures to real sectors vulnerable to similar economic risk or through one of three contagion channels: (i) long-term interbank exposures vulnerable to financial credit risk due to counterparty default; (ii) short-term interbank exposures vulnerable to liquidity shocks; and (iii) common securities holdings vulnerable to market risk in the event of fire sales.
Data on exposures
Analysing how losses could spread through the financial system in a crisis, from a bottom-up or micro-structural perspective, requires detailed information about euro area banks’ exposures to households, businesses, as well as other banks and financial institutions. The large exposure regime, introduced in the EU in 2014, limits the maximum loss a bank could incur in the event of a sudden counterparty failure, and requires banks to report to prudential authorities detailed information about their largest exposures. An exposure to a single client or connected group of clients is considered a large exposure when, before applying credit risk mitigation measures and exemptions, it is 10% or more of an institution’s eligible capital (Article 392 of the Capital Requirements Regulation). Moreover, institutions are also required to report large exposure information for exposures with a value above or equal to €300 million. Therefore, the data reported capture almost €8.2 trillion of gross exposures in the third quarter of 2018 (our reference date), i.e. more than 50% of euro area credit institutions’ exposures. These data can be organised and mapped with statistical techniques to arrive at a unified identifier for each of the parties involved in
125 For a review of the literature, see Glasserman, P. and Young, P., “Contagion in Financial Network”,
Journal of Economic Literature, Vol. 54(3), 2016, pp. 779-831.

Financial Stability Review, May 2019 – Special features
136
almost any exposure. The data processing eventually provides exposure-level information about the euro area banking system’s exposures to entities worldwide, covering all economic sectors: credit institutions, financial corporations, non-financial corporations, general government and households.
Chart B.1 compares the large exposure (LE) coverage of euro area significant institutions (SIs) with total assets by sector. As we can see, large exposures to credit institutions, financial corporations and governments account for 77%, 67% and 98% respectively of euro area SIs’ total assets vis-à-vis these sectors. The coverage of non-financial corporations is lower, at approximately 31% of SIs’ total assets, whereas the household sector is barely covered. In this special feature, we focus primarily on the exposures to other credit institutions, i.e. the interbank network of large exposures. The extensive coverage of this sector in the LE data provides us with confidence that we can reliably model euro area banks’ degree of interconnectedness and their contribution to cross-sectional systemic risk. Where needed, the LE dataset is complemented with LE data reported by euro area less significant institutions (LSIs), and with additional information concerning exposures of euro area SIs to euro area LSIs and of non-euro area banks to euro area SIs and LSIs from COREP template C.67 reporting the ten largest euro area banks’ liabilities.
Chart B.1 The large exposure dataset is significant
Euro area significant institutions’ large exposure coverage across sectors and total assets (€ trillions)
Sources: ECB supervisory data and ECB calculations. Note: CI stands for credit institutions, FC for financial corporations, NFC for non-financial corporations, GOV for general government and HH for households.
Table B.1 sets out what the combined data indicate about interbank exposures in the euro area, while Chart B.2 shows the interlinkages identified between euro area banks. In the third quarter of 2018 more than one thousand banks were covered by these data, with around €2.3 trillion of gross exposures between them, of which roughly 60% has a maturity below 30 days. The interbank network has a density of links just above 0.4%, implying that the level of interconnectedness is relatively low and markets are segmented. Furthermore, the degree distribution of the network is well fitted by a power law with an exponent of 1.35, meaning that there are a few banks playing a central role in the system, while most of the institutions are peripheral. This
0
1
2
3
4
5
CI FC NFC GOV HH
Total assetsLarge exposures

Financial Stability Review, May 2019 – Special features
137
structure mirrors findings already established in the literature about financial networks.126
Table B.1 Interbank network
(amounts in € trillions)
Data sample 2014 2015 2016 2017 2018
Interbank network
Consolidated banking groups 1,149 1,017 1,089 1,088 1,053
Linkages 4,453 4,096 4,914 4,639 4,559
Gross amount 2.04 2.27 2.47 2.24 2.32
Net amount 0.82 0.88 0.90 0.85 0.91
Short-term amount (< 30 days) 0.52 0.52 0.63 0.54 0.60
Density (%) 0.3 0.4 0.4 0.4 0.4
Average path length 3.2 3.2 3.60 3.60 3.76
Diameter 7.0 9.00 9.00 9.00 9.00
Degree power law distribution -1.48 -1.38 -1.35 -1.36 -1.35
Source: ECB supervisory data and ECB calculations. Notes: Consolidated banking groups refer to euro area and non-euro area banks. Net amount is the amount of unsecured exposures, and refers to the gross amount after deducting exemptions and credit risk mitigation.
126 See, for example, Lux, T. and Fricke, D., “Core-periphery structure in the overnight money market:
evidence from the e-MID trading platform”, Computational Economics, Vol. 45(3), 2015, pp. 359-395.

Financial Stability Review, May 2019 – Special features
138
Chart B.2 Interconnectedness is relatively low and markets are segmented in the euro area interbank network
Euro area interbank network of large exposures
Sources: ECB supervisory data and ECB calculations. Notes: The node size captures the weighted in-degree of interconnectedness. The node colour represents the country of origin. The thickness of the links reflects the value of the exposures in € billions. The colour of the links refers to the country of the target, thus also capturing the borrower’s perspective.
Modelling systemic events
This special feature uses simulations to examine how different contagion channels might lead to a systemic crisis, using recent real data. We do this by estimating the range of losses that banks could face on their portfolios, using information on probabilities of default (PDs), loss given default (LGD) and correlation among their portfolios of exposures to the real economy. The losses generated by common real exposures account for only a part of the final correlation in banks’ distress probabilities observed in reality, providing a first contribution to the number of defaults determining a systemic event. On top of that, other financial contagion channels further exacerbate common distress among banks. This special feature aims to disentangle the different contributions to systemic risk.
As shown in Figure B.1, each simulation follows the same chain of events, as follows:
1. Realisation of economic risk. Each individual bank is faced with losses on its loan portfolios in line with the performance of households and non-financial corporations in that simulation. To generate these losses, each real economy

Financial Stability Review, May 2019 – Special features
139
entity is assigned a PD, an exposure-specific LGD, and a correlation structure of PDs retrieved, respectively, from Moody’s, the LE dataset and Datastream.127 This may lead some banks to default.
2. Spread and realisation of interbank financial credit risk. Any defaulted bank then transmits losses to its counterparties through the long-term interbank market. Credit risk can therefore materialise, further eroding banks’ capital and causing other banks to either default or become distressed.
3. Spread and realisation of liquidity risk. Defaulted and distressed banks withdraw liquidity from the interbank market, as precautionary hoarding against future shocks. The short-term interbank market freeze generates liquidity risk, which can translate into capital erosion in the next step.128
4. Spread and realisation of market risk. Illiquid banks may sell securities abruptly. Prices endogenously adjust via a fire-sale mechanism, and banks with mark-to-market exposures may see their capital further eroded. Market risk can therefore materialise.129
The sequence of events 2, 3 and 4 repeats itself until no additional default or distress event is experienced in the system. The simulation is repeated for 50,000 different initial economic losses in order to obtain a distribution of the number of distressed and defaulted banks.
127 Exposures to households are modelled with aggregate data at country level since the LE dataset has
very limited coverage of this sector. In this respect, in order to compute the euro area banks’ losses, we use the average PD and LGD of the sample. The same holds for non-financial corporations, for which no public data about PD and LGD are available. To build the correlation structure necessary to generate the initial economic shock, NFCs’ CDS prices are used over a time horizon of one year before the end of the quarter under study. If any information is missing, the sector-country average is used.
128 See Acharya, V. V. and Merrouche, O., “Precautionary Hoarding of Liquidity and Interbank Markets: Evidence from the Subprime Crisis”, Review of Finance, Vol. 17, 2012, pp. 107-160; Kapadia, S., Drehmann, M., Elliott, J. and Sterne, G., “Liquidity Risk, Cash Flow Constraints, and Systemic Feedbacks”, in Haubrich, J. G. and Lo, A. W. (eds.), Quantifying Systemic Risk, University of Chicago Press, 2013, pp. 29-61.
129 See Cont, R. and Schaanning, E., “Fire Sales, Indirect Contagion and Systemic Stress Testing”, Norges Bank Working Paper No 2/2017, 2017.

Financial Stability Review, May 2019 – Special features
140
Figure B.1 System mechanics
The block scheme summarises how the various risk channels interact within the contagion model, while the chart depicts in a sequential order the trigger event (scenario), the amplification mechanisms, and the final vector of bank defaults
Source: ECB Note: Economic risk captures initial losses derived from the scenario which is a function of entity-specific PDs, an exposure-specific LGD, and a correlation structure of default probabilities 𝜌𝜌.
Identification of systemic events
A systemic banking crisis is characterised by a sharp rise and persistence in the number of distressed and defaulted banks. Chart B.3 shows the pattern of bank distress and default (blue line) in the United States and in the European Union, and the association with severe economic crises (dark grey areas) relative to milder economic downturns (light grey areas). The series suggest that the financial industry might be a two-state system, where either there are no distressed banks at all, or many banks run into trouble at the same time. This stylised fact is consistent with the observation that market-based estimates of bank distress probability are highly correlated. Furthermore, when the number of distressed and defaulted banks in a quarter rises above a certain threshold (x) close to 1.5%, it tends to remain so for many quarters.130
Hence, an increase in the share of banks in distress or default (D) to above 1.5% at a point in time (e.g. a quarter) can be used as a simple yardstick of financial (in)stability.
130 In our framework, we adopt a quantitative measure to assess the probability that a systemic event will
happen. This threshold is included between the 90th and 95th percentiles of the distribution, thereby capturing extreme events. See Box A for a more formal description of this measure.

Financial Stability Review, May 2019 – Special features
141
Chart B.3 Interconnectedness is relatively low and markets are segmented in the euro area interbank network
Fraction of distressed and defaulted banks in the United States (left panel) and in Europe (right panel) (percentages)
Sources: Lang et al. (2018) for the European bank distress time series, and Federal Deposit Insurance Corporation for the US time series. Notes: Bank distress is defined as one of the following events: (i) capital injection; (ii) asset protection scheme; (iii) guarantee loan; (iv) state aid; or (v) bankruptcy. Light grey and dark grey areas represent mild and deep economic recession periods, respectively. Mild economic recessions refer to periods during which real GDP experienced negative growth rates, while deep economic recessions refer to periods during which real GDP experienced growth rates lower than -1%.
Results
The simulation results can be used to estimate the probability that the share of banks in distress could be above this threshold, based on their current balance sheet composition. Table B.2 reports the probability of a systemic event arising in the third quarter of 2018 and the distribution of the number of defaults for each source of risk for the third quarter of 2018, respectively and in combination: (i) economic risk; (ii) economic risk and market risk; (iii) economic risk and liquidity risk; (iv) economic risk and financial credit risk; and (v) when all the channels are simultaneously active, that is total risk.
Long-term credit interlinkages between banks triple the likelihood of a systemic event, while common exposures to the real economy seem to be the second most important determinant of systemic events. The interaction of economic risk from common exposures with the other contagion channels increases the probability of a systemic event non-linearly. For instance, when economic risk interacts with financial credit risk derived from long-term interbank exposures, the probability of experiencing a systemic event triples (to 0.196%), whereas all the channels taken together produce a number of systemic events four times larger than economic risk alone, with an associated probability of 0.224%.
Financial amplification mechanisms appear sizeable in the euro area financial system, and could make a significant contribution to the probability of experiencing a systemic event. Moreover, as shown in Table B.2, a consistent
0%
1%
2%
3%
4%
1999 2004 2009 2014
1999-2018
0%
1%
2%
3%
4%
1934 1944 1954 1964 1974 1984 1994 2004 2014
1934-2018

Financial Stability Review, May 2019 – Special features
142
share of the total number of defaults across all scenarios, almost 11%, is explained by the tail of the distribution, that is, by the realisation of systemic events. Interaction among contagion channels accounts for approximately 1.5% of total defaults in the tail of the distribution. Notably, the average probability of an individual bank default seems to be most affected by economic risk, and the other contagion channels only slightly affect the mean of the distribution.
Table B.2 Summary statistics of the results for the third quarter of 2018
Sources
Probability of systemic
event
Systemic event’s contribution to total
defaults
Expected number of defaults
Maximum number of defaults
Marginal contribution
Economic risk 0.056% 1.94% 0.554 37 0
Economic and market risks 0.060% 2.14% 0.557 39 2
Economic and interbank liquidity risks 0.064% 2.27% 0.558 38 1
Economic and financial credit risks 0.196% 8.90% 0.623 65 28
Interaction among sources 0.016% 1.48% 0.006 2 2
Total 0.224% 10.90% 0.64 70 33
Sources: ECB supervisory data and ECB calculations. Note: The interaction term is approximated by the difference between each contagion channel and economic risk, thereby providing a conservative estimate of amplification effects.
Charts B.4 and B.5 show the evolution since 2015 of the estimated probability of a systemic event, and of the average probability of an individual bank being in distress. Over the whole period, contagion and amplification mechanisms contribute more than economic risk to total systemic risk. In contrast, economic risk is the main driver of the mean of the distribution, i.e. the average probability of a bank default. There is also some indication of a decline in systemic risks coming from interconnectedness over the past four years. The trend of the systemic risk measure proposed in this special feature resembles the bank CDS index over the same time period, suggesting consistency between the estimation of banks’ joint PD and the probability of a systemic event.

Financial Stability Review, May 2019 – Special features
143
Chart B.4 Systemic risk over time
Probability of a systemic event, i.e. having more than 1.5% of banks in distress in the same quarter (percentage probability (left-hand scale); CDS spread in basis points (right-hand scale))
Sources: Thomson Reuters Datastream, ECB supervisory data and ECB calculations. Notes: The total probability of a systemic event is decomposed for each quarter into: (i) economic risk, i.e. the fraction of the total probability that is due to common exposures to the real economy; and (ii) financial risk, i.e. the fraction of the probability that is due to financial contagion, divided into interbank credit risk and liquidity and fire-sale risk. The CDS spread for the euro area banking sector is also plotted as a comparator.
Chart B.5 Average probability of default of a bank over time
Average probability of default of a bank (probability of a single bank failing averaged over the entire sample, per quarter) (percentage probability (left-hand scale); CDS spread in basis points (right-hand scale))
Sources: Thomson Reuters Datastream, ECB supervisory data and ECB calculations. Notes: The average probability of default of a bank is decomposed for each quarter into: (i) economic risk, i.e. the fraction of the total probability that is due to common exposures to the real economy; and (ii) financial risk, i.e. the fraction of the probability that is due to financial contagion, divided into interbank credit risk and liquidity and fire-sale risks. The CDS spread for the euro area banking sector is also plotted as a comparator.
Conclusion
This special feature presents a measure of systemic risk, derived from contagion risk and common exposures in the euro area banking system. The
0
50
100
150
200
0.0%
0.2%
0.4%
0.6%
0.8%
1.0%
Q12015
Q22015
Q32015
Q42015
Q12016
Q22016
Q32016
Q42016
Q12017
Q22017
Q32017
Q42017
Q12018
Q22018
Q32018
Economic riskFinancial credit risk
Liqudity and fire sales risksCDS spread euro area banking sector
0
50
100
150
200
0.0%
0.1%
0.1%
0.2%
0.2%
0.3%
Q12015
Q22015
Q32015
Q42015
Q12016
Q22016
Q32016
Q42016
Q12017
Q22017
Q32017
Q42017
Q12018
Q22018
Q32018
Economic riskFinancial credit risk
Liqudity and fire sales risksCDS spread euro area banking sector

Financial Stability Review, May 2019 – Special features
144
model employed encompasses four contagion channels, and their interaction generates non-linear effects that cannot be captured by studying the single contagion channels in isolation. The results indicate some decline in systemic risks coming from interconnectedness over the past four years. The trend of the systemic risk measure proposed in this special feature resembles the bank CDS index over the same period. This is noteworthy, as the index in this special feature is built using granular data on banks’ exposures to the real economy and to each other.
Combining a micro-structural model with newly available granular data allows us to disentangle the contributions of different factors and institutions to systemic risk. Exposures to the real economy seem to make the most important contribution to average default probabilities in the euro area banking system, while long-term bilateral exposures among banks seem to play the most important role in systemic risk for a given economic shock. Importantly, the trend in systemic risk as measured in this special feature resembles that in market-based indicators. The advantage of micro-structural models lies in the possibility to disentangle the different components contributing to systemic risk, and to identify key players in each market segment. The same models can be used in a wide variety of exercises, and the simulation engine can be easily fine-tuned to track the effects of each institution on systemic risk, or to understand the impact of a particular macroprudential policy on the financial system.
Box A Methodology
The methodology employed is built upon the multilayer framework of Montagna and Kok (2016) and the CoMap methodology developed by Covi et al. (2019).The dynamics of the model work as follows.
The system is composed of N banks, M real economic agents and L securities. Each bank status is related to two main idiosyncratic characteristics relating to its balance sheet, namely its capital 𝑐𝑐𝑖𝑖 and its liquidity 𝑙𝑙𝑖𝑖, where “i” labels the bank. A bank is considered to be in distress if, for any reason during the simulation dynamics, its capital breaches its capital buffer requirements or its liquidity breaches the liquidity coverage ratio. In the same fashion, a bank is considered to have defaulted if its capital goes below its minimum capital requirements or its cash reserves are exhausted. Real economic entities are instead characterised by a probability of default (𝑝𝑝𝑝𝑝𝑗𝑗), a loss given default (𝐿𝐿𝐿𝐿𝐿𝐿𝑗𝑗), and a correlation matrix C, expressing joint default probabilities among non-financial corporations. Finally, each security is characterised by an initial price 𝑝𝑝𝑙𝑙. With the dynamics of the model unfolding, the price of the security “l” is affected by how much of its notional has been sold (𝑄𝑄𝑙𝑙), according to the linear endogenous price function 𝑓𝑓(𝑄𝑄𝑙𝑙).131
𝑃𝑃𝑙𝑙 = 𝑃𝑃𝑙𝑙 ∗ 𝑓𝑓(𝑄𝑄𝑙𝑙)
The simulations start with the generation of the economic shock, i.e. a vector D of Bernoulli variables containing the information on whether corporation j defaulted (𝐿𝐿𝑗𝑗 = 1) and therefore generated losses 𝐿𝐿𝐿𝐿𝐿𝐿𝑗𝑗 for its lenders, or alternatively the corporation performed well (𝐿𝐿𝑗𝑗 = 0). The vector D is drawn according to the 𝑝𝑝𝑝𝑝𝑗𝑗 and C, and the losses generated by this mechanism produce a certain number
131 See Greenwood, R., Landier, A. and Thesmar, D., “Vulnerable Banks”, Journal of Financial Economics,
Vol. 115(3), 2015, pp. 471-485.

Financial Stability Review, May 2019 – Special features
145
of distressed and defaulted banks (𝐿𝐿𝑡𝑡𝑒𝑒). At this point, there is already a certain probability of having a systemic event, that is:
𝑆𝑆𝑆𝑆𝑆𝑆𝑆𝑆𝑆𝑆𝑆𝑆𝑆𝑆𝑐𝑐 𝑅𝑅𝑆𝑆𝑆𝑆𝑅𝑅: Pr �𝐷𝐷𝑡𝑡𝑒𝑒
𝑁𝑁𝑡𝑡> 0.015� ; 𝑆𝑆𝑆𝑆𝑆𝑆𝑆𝑆𝑆𝑆𝑆𝑆𝑆𝑆𝑐𝑐 𝐸𝐸𝐸𝐸𝑆𝑆𝐸𝐸𝑆𝑆: 𝐷𝐷𝑡𝑡
𝑒𝑒
𝑁𝑁𝑡𝑡> 0.015
We will refer to this amount as economic risk. The contagion following this initial economic shock evolves in discrete time steps. Each time step is characterised by the sequence of three main events. First of all, at the beginning of each time step defaulted banks transmit losses to their counterparties in the long-term interbank exposure segments. This capital erosion may increase the number of banks in default or in distress. In a second step, distressed and defaulted banks leave the interbank market. This is done by withdrawing all their short-term liquidity from their borrower banks. At the same time, they are supposed to close the short-term interbank positions and they may do so by using a cash buffer, characteristic of each bank’s balance sheet. If any bank continues to have unfulfilled liquidity, they enter the last time step. Finally, in this stage, banks sell securities according to their liquidity needs in order to pay back creditors, and prices adjust accordingly. Banks with mark-to-market portfolios may see their capital eroded by the reduction in the price of the securities.
At the end of each simulation, we count the total number of defaulted and distressed banks (𝐿𝐿𝑡𝑡). At this point, we are able to compute the total amount of systemic risk in the system, which is:
Pr �𝐿𝐿𝑡𝑡𝑁𝑁𝑡𝑡
> 0.015�

Financial Stability Review, May 2019 – Special features
146
C Macroprudential space and current policy trade-offs in the euro area
Prepared by Matthieu Darracq Pariès, Stephan Fahr and Christoffer Kok
The countercyclical capital buffer (CCyB) is one of the centrepieces of the post-crisis reforms that introduced macroprudential policy instruments. Macroprudential instruments aim to protect the resilience of the financial system throughout the financial cycle. While many measures have been implemented to structurally raise capital in the banking sector, only a few euro area countries have activated the CCyB. This implies that macroprudential authorities currently have limited policy space to release buffer requirements in adverse circumstances. Against this background, this special feature provides some insights into the relevant macroprudential policy response under different macroeconomic conditions. It is argued that, barring a severe economic downturn, even under a scenario of moderate economic growth a gradual build-up of cyclically adjustable buffers could be considered to help create the necessary macroprudential space and to reduce the procyclicality of the financial system in an economic and financial downturn.
Introduction
Macroprudential policy has a preventive purpose. Macroprudential policy actions focus on averting the emergence of financial imbalances and building resilience in the financial system in good times, with the aim of supporting financial intermediation and especially lending to the real economy in bad times.
Following the financial crisis, numerous macroprudential instruments have been implemented and some buffers continue to be phased in. While banks’ capital ratios have increased over the last decade due to regulatory and market pressures, there has been only a very moderate build-up of countercyclical capital buffers in the euro area banking sector. This development reflects both the relatively short period for which these policy instruments have been available and the slow recovery of the financial cycle in the aftermath of the financial and sovereign debt crises. This lack of buffers limits the space for macroprudential policy to release the CCyB and thereby relieve the banking system to support the real economy if the financial system were to be hit by an adverse shock.132
How should macroprudential policy react to an unanticipated economic slowdown? In order to shed light on this question, this special feature first provides an overview of cyclical systemic risks and the prevailing macroprudential space in the euro area. Second, a counterfactual scenario analysis provides insights into the optimal macroprudential policy stance under different economic outcomes, with the
132 While increases of countercyclical buffers have been seen in some countries, the release of an
implemented CCyB has so far not been experienced in the euro area.

Financial Stability Review, May 2019 – Special features
147
aim of analysing the interaction of the macroprudential stance with different configurations of the macroeconomic outlook.133
While noting that macroprudential policy is generally focused on addressing national imbalances, this article evaluates the prevailing overall macroprudential policy trade-off from a more conceptual, and euro area aggregate, perspective. It is important to note that the relative costs and benefits of further building up macroprudential space to safeguard against the materialisation of cyclical systemic risks may vary across euro area countries. Also the macroeconomic implications of capital requirement tightening and release, respectively, may be different at the country level compared with the euro area-wide simulations presented in this special feature.
Cyclical systemic risks at the euro area level
Cyclical systemic risks remain moderate, although they have risen following the trough observed in the aftermath of the financial crisis. At the euro area aggregate level, synthetic measures of cyclical systemic risks have been on an increasing trend since 2014 (see Chart C.1). As the build-up of financial imbalances of a cyclical nature has been only gradual for the euro area as a whole, risks remain contained. Nevertheless, significant cross-country heterogeneity exists and the aggregate figures mask pockets of vulnerability in certain jurisdictions. Beyond the specific dynamics of indicators for credit, asset price and external imbalances, the elevated indebtedness of the non-financial private sector may exacerbate risk measures and loss dynamics should risks materialise.
133 The scenario analysis presented in this special feature is purely hypothetical and illustrative and should
not in any way been seen as expectations about future monetary policy and macroprudential policy decisions.

Financial Stability Review, May 2019 – Special features
148
Chart C.1 Cyclical systemic risk as measured by the domestic systemic risk indicator has increased from the 2014 trough
Euro area d-SRI and decomposition into driving factors (Q1 2008-Q2 2018; deviation from historical median in multiples of standard deviation)
Sources: ECB, Eurostat and ECB calculations. Notes: The coloured bars represent the contributions of different d-SRI sub-indicators to the overall d-SRI value. Positive contributions imply that a given indicator is above the pooled median across countries and over time, while negative contributions imply that a given indicator is below the pooled median. SRI stands for systemic risk indicator and RRE for residential real estate.
Macroprudential authorities in euro area countries have been phasing in capital buffer requirements to structurally strengthen the solvency of the banking sector and to raise resilience to the build-up of systemic risk.134 The average Common Equity Tier 1 (CET1) capital ratio of systemically important euro area banks had increased to 14.4% by the end of 2018 (see Chart C.2). This reflects pressure from markets, microprudential capital demands and macroprudential requirements. Regarding macroprudential instruments, the capital conservation buffer (CCoB) has been introduced in all euro area countries, as have institution-specific buffers for seven global systemically important institutions (G-SIIs) and 106 other systemically important institutions (O-SIIs). In addition, four euro area countries have introduced a systemic risk buffer (SRB) to address specific structural risks and yet others have increased risk weights on sectoral exposures to ensure that capital requirements remain effective.135 Overall, these additional capital requirements have significantly increased the resilience of the euro area banking sector. Indeed, besides the fact that it revealed some pockets of vulnerable banks, the results of a recent stress test point to an overall high level of resilience, with the average CET1 ratio under stress standing at 10.1% for the sample of systemic institutions.136
134 For an overview, see Macroprudential measures in countries subject to ECB Banking Supervision and
notified to the ECB. 135 Moreover, in response to rising risks from real estate imbalances in several jurisdictions, numerous
macroprudential authorities in euro area countries have introduced borrower-based measures such as limits on debt-to-income, debt service-to-income or loan-to-value ratios.
136 See de Guindos, L., “Euro area banking sector – current challenges”, keynote speech at the Annual General Meeting of the Foreign Bankers’ Association, Amsterdam, 15 November 2018.
-0.8
-0.6
-0.4
-0.2
0.0
0.2
0.4
0.6
Q1 2008 Q1 2009 Q1 2010 Q1 2011 Q1 2012 Q1 2013 Q1 2014 Q1 2015 Q1 2016 Q1 2017 Q1 2018
Bank creditTotal creditRRE price-to-income ratioEquity marketDebt service ratio
Current accountSRI benchmarkSRI (excl. equity market)SRI (excl. current account)

Financial Stability Review, May 2019 – Special features
149
Notwithstanding the increase in bank capital ratios, the build-up of countercyclical capital buffers in the euro area as a whole has been moderate and has taken place only recently in a few countries. In particular, the CCyB has not yet been activated in most of the largest euro area countries. In principle, the available capital base, including the part held in excess of requirements, provides banks with substantial buffers which they can draw down in case of need without affecting banks’ ability to continue providing financing to the real economy. However, the main macroprudential instrument meant for countering potential losses from cyclical risks, the CCyB, has only been scarcely implemented. In the first quarter of 2019, CCyB rates were positive for two euro area countries and remained at 0% for all other euro area countries.137 While this mainly reflects the modest build-up of cyclical risks in the aftermath of the financial crisis, it leaves macroprudential authorities with limited space to release buffers if there were to be an unexpectedly severe turn in the financial cycle. This is all the more important as the prolonged recovery and ample liquidity may have led to an underestimation of credit risk by some financial institutions.
Chart C.2 CET1 capital ratios have increased over time, given higher prudential requirements and voluntary buffers
CET1 capital requirements, macroprudential buffers and management capital buffers (percentage points of risk-weighted assets)
Sources: ECB and ECB calculations. Notes: Based on systemic institutions weighted by risk-weighted assets. AT1 stands for additional Tier 1, T2 for Tier 2 and P2R for Pillar 2 requirement. The microprudential Pillar 2 guidance (P2G) is included in the residual capital. CCyB and SRB requirements are not adjusted for exposures, but are considered at the consolidated level. The annual measure presents the value as at the end of the year (Q4).
For macroprudential authorities, it is crucial to ensure enough macroprudential policy space to support the financial system should risks materialise. At the same time, the specific timing and calibration of macroprudential policy measures need to take into account the broader macro-financial environment and outlook. The next section employs a model-based analysis to illustrate how the macroprudential policy stance interacts with the state of the economic cycle.
137 Three additional countries have announced that they would introduce the CCyB in the course of 2019.
0%
5%
10%
15%
2015 2016 2017 2018
CET1 Pillar 1P2RAT1 / T2 shortfall (excess of P2G)CCoB
O-SII, G-SII, SRBCCyBResidual CET1 capital, incl. P2G

Financial Stability Review, May 2019 – Special features
150
State dependency of macroprudential policy: scenario analysis
Model-based scenario analysis illustrates how macroprudential policy implementation interacts with the state of economic and financial conditions. While macroprudential policies aim to address some of the financial sector externalities that might otherwise lead to procyclical behaviour, the implementation of higher capital buffer requirements could have negative real economic implications in the short run.138 The degree to which macroprudential policy measures have an impact on the macro economy crucially hinges on the state of the economy in the first place and on the ability of the banking sector to adjust to changing requirements.139 In order to shed more light on how macroprudential policies interact with changing economic conditions, a model-based general equilibrium analysis is carried out to gauge under what conditions macroprudential authorities could “look through” an unanticipated economic slowdown and when to halt the gradual build-up of or when to release the macroprudential capital buffer.
A protracted slowdown could place strains on the financial sector, with potential amplification effects on the real economy. The financial sector may amplify the deterioration in general economic prospects through various channels, owing to financial frictions affecting both the demand and supply sides of credit intermediation.140 Such a procyclical response of financial intermediaries could significantly amplify the downturn, notably if financial intermediaries become risk averse or capital-constrained.
Evidence from a macro model with a risk-sensitive banking sector can shed some light on the role of adverse financial factors in explaining the growth profile of available Eurosystem economic projections for the next few years. In order to disentangle the quantitative contribution of credit risk and other financial factors to euro area cyclical fluctuations, euro area developments are interpreted through the lens of the dynamic stochastic general equilibrium (DSGE) model of
138 For a recent overview of the macroeconomic impact of macroprudential measures, see Cozzi, G.,
Darracq Pariès, M., Karadi, P., Kok, C., Körner, J., Mazelis, F., Nikolov, K., Rancoita, E., Van der Ghote, A. and Weber, J., “Macroprudential policy measures: Macroeconomic impact and interaction with monetary policy”, ECB technical paper, forthcoming. Covering four ECB macro models, including the one used below, the paper documents that a 1 percentage point (p.p.) increase in capital requirements induces a short-run decline in GDP in the range of 0.15-0.35%.
139 Cozzi et al. (op. cit.) show how different modelling assumptions about banks’ behavioural reactions to capital requirements lead to differences in the macroeconomic propagation. Key assumptions relate to how banks manage their voluntary buffers, how flexible they are in adjusting their lending rates, how their funding costs react to higher capital, and how bank dependent their borrowers are.
140 Generally speaking, real-financial interactions refer to a situation in which the impact of certain shocks is amplified through the interplay of various financial variables (such as asset prices, firms’ net worth and the external finance premium) with real variables (such as investment and economic activity). One type of real-financial interaction is the “financial accelerator” mechanism whereby a negative shock hitting firms’ net worth, via its adverse impact on creditworthiness and a higher external finance premium, constrains firms’ ability to borrow. The consequent adverse impact on investment leads in turn to a further deterioration in firms’ net worth and thus to a more severe impact on economic activity. In addition, the procyclicality of the financial system may also be exacerbated by a second, “bank balance sheet” channel, related to bank-specific vulnerabilities in the form of a weak capital position and funding constraints.

Financial Stability Review, May 2019 – Special features
151
Darracq et al. (2011)141 (DKR).142 The contribution of financial factors to euro area GDP growth was supportive through 2018, peaking at around 0.3 p.p. of annual growth (see Chart C.3). Overall, while they do play a role, financial factors still fall short of explaining the growth slowdown from 2017 to 2019, which is projected to be primarily driven by aggregate demand factors.143
Chart C.3 Financial factors play only a limited role in the recent and forecasted economic slowdown
Historical decomposition of euro area GDP growth between 2017 and 2021: contributions of structural shocks to de-trended real GDP growth (left-hand scale) (annual growth rates, percentages)
Source: DKR model. Note: Historical decomposition of euro area GDP into structural shocks, based on the latest ECB staff macroeconomic projections baseline (see the article entitled “March 2019 ECB staff macroeconomic projections for the euro area”, published on the ECB’s website on 7 March 2019).
Under these economic conditions and accounting for the uncertainty surrounding the projections, the gradual build-up of macroprudential policy space could still be considered. The previous section has explained the rationale for a gradual and limited increase in macroprudential buffers for the euro area banking system. Based on current macroeconomic prospects and broadly favourable financial
141 See Darracq Pariès, M., Kok, C. and Rodriguez-Palenzuela, D., “Macroeconomic propagation under
different regulatory regimes: Evidence from an estimated DSGE model for the euro area”, International Journal of Central Banking, December 2011, pp. 49-113. The model specification with real-financial interactions comprises the two channels discussed above. First, the model includes financial accelerator mechanisms whereby both firms’ and households’ credit contracts factor in external finance premia which depend on borrowers’ net worth. Second, the model formalises a banking sector that faces capital requirements, is subject to capital adjustment costs, and sets lending rates in a staggered fashion (i.e. sluggish retail rate pass-through). The illustrative analysis shown below is of course dependent on the model specification. However, as shown in Cozzi et al. (op. cit.), the macroeconomic propagation in the DKR model is consistent with other recent macro models.
142 The DSGE model, which is estimated on euro area data, enables the decomposition of a number of macroeconomic variables into contributions of various structural shocks, including credit risk and bank-related financial shocks.
143 Over the projection horizon, these financial contributions are attributed to financial accelerator factors (related to borrowers’ probability of default and the associated external finance premium), while bank balance sheet factors (related to bank capital and the cost of bank funding) are neutral. This is corroborated by still scarce evidence of bank borrower riskiness, such as the cyclical risk indicator described above. Also, market-based measures of corporate defaults (e.g. expected default frequencies from Moody’s KMV), corporate credit ratings, corporate earnings as well as bank lending standards suggest broadly neutral credit risk perceptions.
0.0
0.5
1.0
1.5
2.0
2.5
3.0
-1.0
-0.5
0.0
0.5
1.0
1.5
2017 2018 2019 2020 2021
Bank balance sheet factorsFinancial accelerator factorsAggregate demand
Aggregate supply Real GDP (right-hand scale)

Financial Stability Review, May 2019 – Special features
152
conditions and credit intermediation capacity of the banking system, macroprudential policy can further increase the policy space. In this context, a continued further build-up of cyclical buffers could be expected to have relatively subdued macro implications, with limited implications for broad financing conditions. To illustrate this point, we conduct a theoretical experiment and simulate in the DSGE model used previously an arbitrarily chosen 50 basis point (bp) increase in the CCyB rate, phased in from mid-2019 to end-2020.144 Chart C.4 reports the impact on GDP growth, annual inflation and the short-term interest rate (assuming that standard monetary policy does not face any constraints and reacts in line with the estimated interest rate rule of the model). In this scenario, economic growth would be less than 0.1 p.p. slower in cumulated terms over a three-year horizon, while inflation would be less than 5 bps lower on average over the same period.
Chart C.4 A slight tightening of countercyclical buffers at the euro area level would only have limited macroeconomic effects
Macroeconomic impact of tightening the CCyB rate by 0.5 p.p. (annual growth rates, percentage point deviation from baseline)
Source: DKR model.
A further weakening of economic prospects might trigger a broader reappraisal of credit risk for firms and households, leading to tighter conditions for market and bank-based finance. A more protracted slowdown than currently envisaged could change the assessment of the case for a further build-up of cyclical buffers, depending on the scale of negative feedback effects between the real and financial sectors. As an illustrative example of the relevance of real-financial interactions, a simulation exercise is implemented by comparing the macroeconomic impact of demand-driven negative shocks within the DKR model, when allowing and when not allowing for real-financial feedback effects. In the case of no real-financial amplification, a negative demand shock is assumed to bring about a cumulated downward impact on euro area GDP projections of 0.5 p.p. by the end of the simulation horizon (see Chart C.5, yellow bars). Switching on real-financial feedback channels amplifies the modelled demand-driven growth slowdown by around 40% 144 The magnitude of the simulated CCyB rate increase is selected for purely illustrative purposes and
neither represents a recommendation for macroprudential authorities, nor necessarily reflects the views of the ECB.
-0.1
0.0
0.0
0.0
0.0
0.0
2019 2020 2021
Inflation
-0.1
-0.1
-0.1
0.0
0.0
0.0
0.0
0.0
0.0
2019 2020 2021
Real GDP

Financial Stability Review, May 2019 – Special features
153
over the three-year horizon, as external financing conditions would respond to higher credit risk, increasing bank risk aversion, and more binding capital constraints (see Chart C.5).145
Chart C.5 A more severe downturn could entail more sizeable financial amplification effects
Financial amplification of demand-driven negative shocks to GDP and inflation (annual growth rates, percentage point deviation from baseline)
Source: DKR model. Note: The monetary policy rate is maintained at the baseline in the simulation.
This scenario exercise implies that macroprudential policy implementation hinges on the degree of financial stress accompanying the projected slowdown in economic growth. To the extent that procyclicality of the banking system remains contained (in line with the yellow bar scenario of Chart C.5), macroprudential policy might consider looking through the economic slowdown and eventually accelerate the build-up of policy space in order to lean against excessive risk-taking which may arise in a low-yield environment. However, should the adverse economic scenario trigger a reappraisal of risk across financial markets and hamper the credit intermediation capacity of the banking system (as in the financial procyclicality scenarios of Chart C.5), macroprudential policy would tread more cautiously so as to support financial intermediation and lending to the real economy.
Faced with a more protracted economic downturn, macroprudential policy might have to balance deteriorating cyclical conditions with building further policy space and address potential side effects of a pervasive low-yield environment. At the current juncture, an adverse demand shock like the simulations
145 First, financial accelerator mechanisms imply that the decline in economic activity causes a deterioration
in borrowers’ net worth and hence induces higher borrower credit risk and a larger external finance premium. The macroeconomic effects are then significantly larger for both GDP and inflation (see Chart C.5, sum of yellow and green bars). This amplification corresponds to an additional decline of around 0.2 p.p. for GDP growth in 2019 and 0.1 p.p. in 2020. Second, when confronted with higher borrower credit risk, it is assumed that banks increase their capital buffers to account for unexpected losses (calibrated in the model through CRD IV risk-sensitive capital requirements). The banks’ capital constraints amplify further the macroeconomic effects of the initial adverse demand shock (see Chart C.5, dark blue bars).
-0.8
-0.6
-0.4
-0.2
0.0
0.2
0.4
2019 2020 2021
Real GDP
Without financial amplificationWith financial accelerator factorsWith bank balance sheet factorsTotal
-0.8
-0.6
-0.4
-0.2
0.0
0.2
0.4
2019 2020 2021
Inflation

Financial Stability Review, May 2019 – Special features
154
in Chart C.5 might imply a longer duration of exceptionally low interest rates across the maturity spectrum. In such a scenario, a gradual, if moderate, tightening of cyclical macroprudential measures might still be preferable in order to counter banks’ incentives to take on excessive risks and to continue to build up space to safeguard against a stronger downturn down the road.
Chart C.6 Lower long-term interest rates may induce increased bank risk-taking, while macroprudential interventions may contain it
Impact on real GDP and lending due to a 50 basis point decline in long-term interest rates (real GDP and loans in percentages, deviation from baseline; capital demands as a percentage point deviation from regulatory ratio)
Source: Model of Darracq, Körner and Papadopoulou (2019). Note: The monetary policy-induced flattening of the yield curve is akin to a central bank asset purchase programme.
The case for continuing the build-up of cyclical buffers in a protracted low interest rate environment will depend on an assessment of banks’ risk-taking incentives. To illustrate the importance of banks’ risk-taking incentives, the model of Darracq et al. (2019)146 was used to illustrate the case for complementing a monetary policy-induced flattening of the yield curve with tighter macroprudential policy. Chart C.6 presents the macroeconomic impact of a flattening of the yield curve by 50 bps due to lower long-term market interest rates, while the short-term policy rate remains unchanged.
In the absence of macroprudential policy, financial intermediaries would react to the flattening of the yield curve with an increase in risk-taking.147 The yield curve flattening scenario therefore entails a strong credit easing transmission channel, whereby the effect from a decline in long-term yields is amplified by lower lending rates, which promotes a sizeable and protracted credit origination (see blue lines in
146 Darracq Pariès, M., Körner, J. and Papadopoulou, N., “Empowering central bank asset purchases: The
role of financial policies”, Working Paper Series, No 2237, ECB, 2019. 147 As highlighted above, the overall capital position of euro area banks on average is currently fairly robust.
Nevertheless, going forward in an environment of low interest rates, banks may counteract downward pressure on bank profitability and their ability to internally generate capital by increasing risk-taking behaviour. In the model, this effect is captured by the fact that when banks operate under limited liability risk-shifting activities help avoid breaching regulatory requirements.
-0.1
0.0
0.1
0.2
0.3
0.4
0.5
Q1 Q5 Q9 Q13 Q17
Real GDP
Without macroprudential capital buffer requirementWith macroprudential capital buffer requirement
0.0
0.5
1.0
1.5
2.0
2.5
Q1 Q5 Q9 Q13 Q17
Loans
-0.01
0.00
0.01
0.02
0.03
0.04
0.05
0.06
0.07
0.08
0.09
0.10
Q1 Q5 Q9 Q13 Q17
Capital demands

Financial Stability Review, May 2019 – Special features
155
Chart C.6).148 To prevent risk-taking from becoming excessive in this context, a bank capital-based macroprudential rule targeting credit-related imbalances would gradually tighten prudential requirements by around 10%.149 When banks excessively engage in risk-taking150, the effectiveness of macroprudential interventions counters financial stability concerns, while largely preserving the macroeconomic stimulus to economic activity (see yellow lines in Chart C.6).
Chart C.7 A countercyclical macroprudential policy release may alleviate the burden on monetary policy
Release of 1 percentage point of capital demand under constrained monetary policy (annual growth rates, percentage point deviation from baseline)
Source: DKR model. Note: The monetary policy rate is maintained at the baseline in the simulation.
However, should the economy precipitate into a more severe downturn scenario where the financial system would be strongly procyclical, a loosening of macroprudential policy could support lending to the real economy. In a situation where the economy would be hit by a more severe shock, the real-financial amplification effects could become large enough to prompt a release of macroprudential buffers, following the original objective of countercyclical macroprudential policies. The magnitude of such a release might nonetheless be constrained by the buffers that have been built up. For illustrative purposes, we simulate the release of 1 p.p. of prudential capital demand over two years in an environment in which financial conditions are tight and assuming unchanged standard and non-standard monetary policy.151 In this case, Chart C.7 shows that the use of the capital buffer would help ease financial conditions and restore some intermediation capacity in the banking system, with lending rates to non-financial corporations
148 Bank loans increase by 2% after five years, while the expansionary effect of the scenario on GDP peaks
at less than 0.5% after two years. 149 This would correspond to an increase in capital demand by 1 p.p. of risk-weighted assets, for a baseline
regulatory ratio of 10%. The macroprudential rule in the model reacts to changes in the credit-to-GDP ratio and is calibrated to maximise the model-consistent welfare criteria.
150 The determination of when credit origination reflects excessive risk-taking is obviously not straightforward and requires a case-by-case assessment.
151 This mimics conditions in which the key policy interest rates have reached the effective lower bound and no further monetary policy actions are taken. It furthermore provides indications of the contributions by macroprudential policy to supporting lending.
0.00
0.05
0.10
0.15
0.20
0.25
0.30
0.35
2019 2020 2021
Inflation
-0.60
-0.50
-0.40
-0.30
-0.20
-0.10
0.00
2019 2020 2021
Lending rate
0.00
0.05
0.10
0.15
0.20
0.25
0.30
2019 2020 2021
Real GDP

Financial Stability Review, May 2019 – Special features
156
decreasing by 50 bps. This would contribute to an expansionary impact on output and inflation which would also be reinforced through expectation channels, as the perceived constraint on monetary policy would be partly alleviated.
Conclusion
Vulnerabilities in specific jurisdictions or market segments may well warrant macroprudential measures to counter financial imbalances.152 Nevertheless, countercyclical capital buffers in most euro area countries have not yet been activated, and for those countries which have activated the CCyB, the calibration is limited, leaving little scope for release. This limited macroprudential policy space could be a cause for concern and suggests that barring a material downward revision in the growth outlook a gradual build-up of countercyclical capital buffers remains warranted. However, it should be noted that national specificities have to be taken into account and that this article evaluates the prevailing overall macroprudential trade-off from a more conceptual perspective. This special feature has illustrated that the economic consequences of activating the CCyB in the current environment are expected to be limited, while also highlighting the beneficial effects of creating sufficient macroprudential policy space to allow a meaningful CCyB release to support economic activity through strengthened lending if a severe downturn were to materialise. Finally, while the simulations presented in this special feature are mainly illustrative, it is important to note that the magnitudes are relevant and the policy trade-off warrants a careful evaluation on a case-by-case basis.
152 See also Constâncio, V., “Financial stability risks and macroprudential policy in the euro area”, speech at
“The ECB and Its Watchers XIX” conference, 14 March 2018.

© European Central Bank, 2019
Postal address 60640 Frankfurt am Main, Germany Telephone +49 69 1344 0 Website www.ecb.europa.eu
All rights reserved. Reproduction for educational and non-commercial purposes is permitted provided that the source is acknowledged.
For specific terminology please refer to the ECB glossary.
PDF ISSN 1830-2025, QB-XU-19-001-EN-N HTML ISSN 1830-2025, QB-XU-19-001-EN-Q