Financial Stability Report - Bank of Mauritius | · 2016-03-01 · commercial purpose whatsoever...
54
BANK OF MAURITIUS August 2015 Financial Stability Report
Transcript of Financial Stability Report - Bank of Mauritius | · 2016-03-01 · commercial purpose whatsoever...

BANK OF MAURITIUS
August 2015
Financial StabilityReport

August 2015
B A N K O F M AU R I T I U SFINANCIAL STABILITY REPORT

All rights reserved. Reproduction for educational and non-commercial purposes is permitted subject to acknowledgement. The Bank of Mauritius would appreciate receiving a copy of any publication that uses this Report as a source. No use may be made of this Report for resale or for any other commercial purpose whatsoever without prior permission in writing from the Bank of Mauritius.
The Report is available in PDF format on the Bank’s website at https://www.bom.mu under the menu item Research and Publications. The Bank of Mauritius welcomes any comments or suggestions on this publication, which may be sent to [email protected].
Disclaimer
The Bank of Mauritius publishes this Report for general information only, and not to serve as financial or other advice. Whilst we take every precaution to ensure the information in the Report is accurate, the Bank of Mauritius shall not be liable to any person where the information in the Report is incomplete, subject to interpretation or not correct, nor for any assessments or opinions contained in this Report.
Financial Stability Report August 2015
© Bank of Mauritius 2015
ISSN: 1694-2353

FINANCIAL STABILITY REPORT | AUGUST 2011 SECTION
Preface 1
1. Executive Summary 3
2. Macroeconomic Environment 7
2.1 Global Economy 7
2.2 Global Equity Markets 8
2.3 Domestic Economy 9
2.4 Regional Interconnectedness 15
3. Debt Indicators of Households and Corporates 17
3.1 Households 17
3.2 Corporates 19
4. Banking Sector 234.1 Overview 23
4.2 Financial Soundness Indicators 31
5. Non-Bank Financial Intermediaries 375.1 Non-Bank Deposit-Taking Sector 37
5.2 Insurance Sector 38
6. Payment Systems Infrastructure 416.1 Payment Systems 41
7. Risk Analysis 43
List of Charts 46
List of Tables 46
List of Boxes 46
Acronyms 47
Glossary 48
FINANCIAL STABILITY REPORT | AUGUST 2015 TABLE OF CONTENTS
Table of Contents


1
PREFACEFINANCIAL STABILITY REPORT | AUGUST 2015
Financial stability is the resilience of the financial system to respond to adverse shocks, while continuing to function smoothly and supporting the ability of households and firms to use their financial assets with confidence. A stable financial system contributes towards broader economic growth and rising living standards of all people. The Bank of Mauritius has the mandate to promote the stability and soundness of the financial system of the country. It achieves this objective by delivering on its core functions, notably:
• conducting effective supervision and regulation of banks;
• ensuring the orderly functioning of money and foreign exchange markets; and
• fostering the development of reliable clearing, payment and settlement facilities.
The Bank collaborates with several domestic, regional and international bodies to promote financial stability.
The Bank publishes the Financial Stability Report twice a year, as required by the Bank of Mauritius Act 2004. The Bank releases the Report in February and August. The Report reviews international and domestic macro-financial developments and examines potential risks to the stability of the domestic financial system. It provides a focus on banking sector developments and vulnerabilities that may affect its overall soundness. It also highlights measures taken by the Bank and other regulatory authorities to mitigate financial risks. Through this Report, the Bank seeks to enhance awareness of the soundness of the Mauritian financial system.
Preface


3
FINANCIAL STABILITY REPORT | AUGUST 2015 EXECUTIVE SUMMARY
The August 2015 issue of the Financial Stability Report provides a review of the core indicators of financial stability in the Mauritian economy, and makes an assessment of the resilience of the domestic financial system with respect to financial data ended March 2015. The current Report draws attention to sectors exhibiting signs of vulnerability that raise concern for the stability and soundness of the financial system.
Since the publication of the Financial Stability Report of February 2015, global economic recovery has remained modest and uneven across advanced and emerging market economies. While growth in the Eurozone continued to be moderate, temporary setbacks halted growth momentum in the US and UK. In Japan, recovery remained gradual. Economic activity lost further steam in the BRICS countries, as the economic outlook deteriorated markedly in Brazil and Russia, while growth is projected to slow further in China amid a rapid build-up of household and corporate indebtedness, the recent stock market outbursts, and slowdown in the housing sector. In contrast, India is forecast to become the fastest growing major economy in the world for 2015. In its July 2015 World Economic Outlook Update, the IMF estimated that the global economy would grow by 3.3 per cent and 3.8 per cent in 2015 and 2016, respectively, compared to 3.4 per cent in 2014.
The domestic economy continued to expand during 2015, although Statistics Mauritius has revised downward its estimate of real GDP growth from 4.1 per cent to 3.8 per cent in 2015. Nonetheless, growth is expected to gain support from implementation of measures announced in Budget 2015/16. Public investment is also projected to increase further in 2015, given the Government’s willingness to revisit and unlock several projects that had not materialised. Amid low energy and food prices, y-o-y inflation dropped from 3.3 per cent in June 2014 to a low of 0.4 per cent in June 2015. Reflecting the evolution of major currencies in international markets and domestic demand and supply conditions, the rupee depreciated significantly against the US dollar and Pound sterling during the first quarter of 2015 but stabilised thereafter. The revision in balance of payment data revealed lower current account deficit at 6.3 per cent in 2013 compared to an earlier estimate of 9.9 per cent. However, external vulnerabilities remain persistent as foreign investors continue to reallocate their portfolios and effect significant sales on the domestic stock exchange market since 2014Q2.
For the first time since the global financial crisis 2008, household indebtedness fell in the first quarter of 2015. Credit extended by banks to households continued to decelerate and reflected the sharp decline in consumption credit and some stabilisation in credit extended for housing purposes. Given the background of high credit growth in a low interest rate environment, the Bank remains concerned over the level of household indebtedness. Prudence should therefore be exercised in the wake of persistent excess liquidity prevailing in the domestic market. The household debt service ratio has remained on a rising trend in spite of lower interest rates. Total corporate debt as a share of GDP maintained its downtrend in 2015Q1 and compares well with regional and selected countries. Amid significant credit accumulation over the past years, corporate credit to GDP gap maintained an upward trend till 2013 but has subsequently declined, with the corporate sector still maintaining high leverage ratios. Vigilance and close monitoring are required, specifically in sectors with high levels of NPL.
During the period under review, the banking sector was resilient. Banks were financially sound and adequately capitalised although they posted marginally lower profits over the year ended March 2015. Banking sector assets grew at a rapid pace mainly due to further expansion of the foreign asset portfolio held by both domestic-owned banks and subsidiaries of foreign-owned banks. The minimum capital adequacy
1. Executive Summary

FINANCIAL STABILITY REPORT | AUGUST 2015EXECUTIVE SUMMARY
requirement of 10 per cent was largely observed, as banks’ overall capital adequacy ratio was computed at 16.6 per cent as at end-March 2015. In addition, the risk of loss from adverse movements in foreign exchange rates have been assessed to be relatively low for banks as their individual balance sheet exhibit fairly low currency mismatches and net exposure to foreign exchange risk. The rise in NPL mainly in the tourism and traders sectors reflect a deterioration of asset quality in domestic credit. However, specific provision against expected losses fell, thereby causing a significant decline in the coverage ratio. The erosion of banks’ buffers against potential credit losses is viewed as a concern for financial stability.
Non-bank deposit-taking institutions remained sound, stable and relatively liquid during the period under review. These institutions were well-capitalized and their activities continued to grow steadily. According to the Financial Services Commission (FSC), the insurance sector registered a sound performance in 2014, with total assets rising by 8.3 per cent. However, given that insurance companies hold deposits and equity in local banks, it is important to gauge and monitor the inter-linkages between banks and insurance companies.
On 02 April 2015, the Bank revoked the banking licence of Bramer Banking Corporation Ltd (BBCL), under section 17 of the Banking Act 2004. The revocation was necessary in view of the fact that the capital of BBCL was seriously impaired and the bank had failed to demonstrate its ability to address capital and liquidity issues to the satisfaction of the Bank. In April 2015, the insurance sector was marked by the placing into conservatorship of the BAI Co (Mtius) Ltd, a lead company providing life insurance cover.
On 25 March 2015, the IT system of the Bank collapsed and resulted in a half-day unavailability of all major payment system infrastructure, specifically the MACSS and PLACH. Prompt remedial action was taken to shift all payment system infrastructure on the latest platform operating with real time replication to the Bank’s Disaster Recovery Site. This major incident was effectively managed and all transactions settled without considerable delay and loss. Except for this outage, the payment system infrastructures operated smoothly during the period under review. The Bank maintains a rigorous oversight of the operational infrastructure and holds the view that on an overall basis, the payment systems remain robust enough to cater for the needs of the banking sector in Mauritius. The financial sector also faces operational risk stemming from cyber attacks at individual institution level.
4

5
EXECUTIVE SUMMARYFINANCIAL STABILITY REPORT | AUGUST 2015
Financial Stability Map
Between 2014Q3 and 2015Q1, risks to financial stability have declined, except for those emanating from the banking sector. Improvement in global economy reflects mainly continued decline in international oil and food prices, while volatility has remained relatively low. Major advanced economies continued to recover. On the domestic economy front, risks declined marginally amidst falling inflation and, to a lesser extent, economic growth. Risks to financial stability emanating from household indebtedness remain high by historical standards, despite the marginal decline recorded in 2015Q1 compared to 2014Q3. Lower indebtedness ratios and debt service costs contributed to the decline in household debt risks. Risks stemming from the banking sector are assessed to have increased with deteriorating asset quality relating to exposures both in and outside Mauritius and lower profitability. Risks from corporate indebtedness are assessed to be significant with high leverage ratios and modest improvements in return on equity in leading enterprises of the economy.
Note 1: Lower vulnerability closer to the center.Note 2: For information on the methodology used in the financial stability map, see Financial Stability Report February 2014.
2015Q1 2014Q3
Note: Lower vulnerability closer to the center
Global economy risks
Domestic economy risks
Household debt risks
Corporate debt risks
Banking sector risks


7
MACROECONOMIC ENVIRONMENTFINANCIAL STABILITY REPORT | AUGUST 2015
2.1 Global Economy
Global economic growth remains modest, with weaknesses persisting across several advanced and emerging market economies. While growth in the Eurozone continued to be moderate, temporary factors have held back activity in the US. Regarding BRICS countries, both Brazil and Russia recorded negative growth. China’s economy has slowed as it adjusts to past excesses. By contrast, India remains the best performing economy of the group, partly due to policy reforms. Growth elsewhere in Emerging Asia has been weak, despite the boost from lower oil and commodity prices. A general move toward greater monetary easing outside the US led to a decrease in global bond yields while equity markets improved.
The IMF marked down output growth for this year, reflecting a weak first-quarter performance in several economies with weak signs of household spending and business investment. The net benefits associated with sharply lower crude oil prices have not yet been felt. An improving global growth profile is likely to emerge through the end of 2015 into 2016. However, risks remain tilted to the downside as an upward shift in the US Federeal funds rate may adversely affect some emerging economies, especially those without fully credible policy frameworks. In addition, risks from Greece, Ukraine and other areas with geopolitical tensions are still looming. According to the IMF July 2015 World Economic Outlook Update, the world economy is projected to grow by 3.3 per cent and 3.8 per cent in 2015 and 2016, respectively, compared with 3.4 per cent in 2014.
At the same time, risks to financial stability are rising and migrating from banks to non-banks, from solvency to market liquidity and from advanced to emerging economies1. The eventual rise in interest rates in the US may increase the vulnerability of the financial system in some emerging market economies. In several of these
countries, businesses find themselves squeezed between a strong US dollar, lower commodity prices, and higher borrowing rates. Liquidity risk may be under-priced by markets and this may conceal the potential for becoming more systemic upon unwinding of policies.
US growth improved in 2015Q2 as the transitory factors2 which weighed on growth in the first quarter faded. GDP grew by an annual rate of 2.3 per cent in 2015Q2 compared to 0.6 per cent in the previous quarter. Much of the improvement in the economy came from a better trade balance, especially in terms of exports. Consumption also improved although households have been cautious in increasing their spending despite the savings from cheaper fuel. Still, low borrowing costs and improving job markets underpin a stronger performance of the economy. Data on US consumer sentiment is brighter when compared to previous months and should help retail sales growth. Despite the US dollar’s strength affecting export activity, solid domestic sales would support the manufacturing sector.
The Eurozone’s recovery has continued to show a gradual firming and is becoming increasingly broad-based across the region, with leading countries being France and Spain. The decline in oil prices has supported private consumption and investment, leading to stronger growth. The ECB’s policy measures have also resulted in a considerable easing of financial conditions which has made credit more accessible to both small and large firms. The labour market continues to improve and should have a positive impact on consumer spending. Looking ahead, growth in the Eurozone is expected to broaden further, spurred by growing consumption and higher business investment. Nevertheless, deleveraging in both public and private sectors as well as structural reforms still have to run its course – a factor likely to restrain growth in the economy.
2. Macroeconomic Environment
1 IMF Global Financial Stability Report, April 2015.
2 Adverse weather conditions and port disruptions.

8
FINANCIAL STABILITY REPORT | AUGUST 2015MACROECONOMIC ENVIRONMENT
Economic growth in the UK is likely to bounce back in the remaining part of 2015, reflecting lower commodity prices and better prospects for the Eurozone. Low inflation and accelerating wage growth are also expected to boost household disposable income, positively impacting on private consumption.
Activity in Japan has recovered sharply in 2015Q1. Although substantial challenges remain, growth is expected to strengthen slowly as households benefit from the increase in real income resulting from lower oil prices, and exports gain arising from the past depreciation of the Japanese yen.
Leading emerging markets, particularly the BRICS, continue to face diverse economic trends and prospects:
• In China, growth decelerated in 2015Q1 on account of a slowdown in the housing sector and lower production in some key industries. While the monetary easing bias will continue to support domestic economic activity, growth is likely to fall short of the 7.0 per cent target due to financial fragilities and macroeconomic imbalances.
• India has overtaken China as the fastest growing major economy in the world. The macroeconomic environment is expected to improve in 2015-16, with fiscal policy geared to an investment-led growth strategy and accommodative monetary policy. However, the economic outlook remains subject to both external and domestic risks. A rapid increase in oil prices is a key risk and global growth remains constrained, particularly in several of India’s trading partners. Tightening of US monetary policy can also have a disruptive impact on India’s exchange rate and financial markets.
• In Brazil, growth outlook has deteriorated markedly. The economy is severely strained by supply-side bottlenecks, high consumer prices, domestic imbalances and tightening financing conditions.
• In South Africa, conditions remain challenging as the economy continues to struggle with rolling power shortages and high unemployment. Low and declining levels of business and consumer confidence are also affecting growth. Going forward, economic conditions should gradually recover in line with lower commodity and energy prices.
2.2 Global Equity Markets
Global equity indices have risen since the start of the year, though volatility increased recently. The adoption of exceptionally accommodative monetary policy programs, specifically from the ECB and the BoJ, helped equity markets to improve in 2015Q1. However, the VIX index - a measure of stock market volatility - increased in latter part of 2015Q2. Both the MSCI world index and the MSCI emerging market index tumbled as from May 2015 against a backdrop of intensified risk aversion following mounting uncertainties over the future of Greece in Eurozone and debt repayment issues, in addition to the Chinese stock market outbursts (Chart 2.1).
The Chinese stock market which followed an extraordinary bull period in the first five months of 20153, suffered an outburst in June 2015. The boom was fueled by a myriad of factors, including among others, new investors – especially youngsters4, a shift from investing in property markets to equities, expectations of continuing monetary easing, financial sector reforms and capital account liberalization. The sell-off in China’s stock market rattled equities mainly in emerging markets.
Looking ahead, although volatility remains on a declining trend, it is expected to persist in the near future as investors perceive the lack of grip of the global recovery. Investors also remain wary about the timing of the US Fed’s hike of interest rates.
3 The Shanghai Composite Index rose by nearly 150 per cent in 2015H1.
4 According to the Financial Times, more than 12 million new accounts were opened on the stock exchange in May 2015 alone. Two thirds of households who opened accounts in 2015Q1 did not even finish high school and 31 per cent of the country’s college students have invested in a stock.

9
MACROECONOMIC ENVIRONMENTFINANCIAL STABILITY REPORT | AUGUST 2015
2.3 Domestic Economy
Activity in the domestic economy is expected to improve moderately in 2015 compared to 2014. Real GDP growth is projected to gain support from implementation of measures announced in the Budget 2015/16. Nevertheless, the domestic economy continues to operate below capacity while inflation remains low by historical standards. In addition, the openness of the Mauritian economy and its over-reliability on exports to traditional markets point to some downside risks, the more so as growth remain tepid in these economies.
Output and Inflation
The latest national accounts estimates have revised downwards the growth rate of the Mauritian economy to 3.8 per cent in 2015, from the earlier forecast of 4.1 per cent. The main contributors to GDP growth in 2015 would be “financial and insurance activities” (0.5 percentage point); “manufacturing” and “wholesale & retail trade” (0.4 percentage point each); and “accommodation and food service activities”, “information and communication” and “professional, scientific and technical activities” (0.3 percentage point each). After four consecutive years of contraction, the construction sector is expected to register positive growth of 1.4 per cent in 2015. However, growth is still below the potential level. When value added in the construction sector is deflated by the Construction
Price Index, the expected value added in 2015 is still lower than that of 2008. The forecast value added in the construction sector in 2015 is lagging behind by some seven years. Moreover, depending on the pace of implementation of on-going and the newly announced projects, the construction sector may contract again in 2015; a pick-up is likely to materialise only in 2016. With several real estate developers still being highly indebted, the capacity to invest in new projects is limited.
On the demand side, all the components namely, final consumption expenditure, gross domestic fixed capital formation (GDFCF) and net external demand, are projected to expand in 2015. Private consumption is expected to gain from the awarded wage compensation and increased pension benefits that has resulted in higher real disposable income. The depreciation of the rupee vis-à-vis the US dollar and euro should benefit the export sectors of the economy.
Y-o-y overall inflation fell from 3.4 per cent in May 2014 to 0.5 per cent in May 2015, amid a decline in food and energy inflation. CORE2 inflation, which excludes food, beverages, tobacco, mortgage interest payments, energy prices and administered prices, went down from 3.4 per cent to 1.9 per cent over the same period. Headline inflation (12-month moving average of overall inflation) also decreased from 4.0 per cent to 2.0 per cent over this period. With moderate global and domestic growth and mild commodity prices, inflation is not expected to pick up in the short-term.
Savings and Investment
After adjusting for changes in inventories, investment as a share of GDP is projected to decline in 2015 (Table 2.1 and Chart 2.2). The negative growth registered in investment to GDP ratio since 2011 mainly reflects the trend decline in private investment rate registered since 2008. Public investment, which has stagnated at around 5 per cent of GDP, is expected to pick up slightly in 2015. In fact, the government is willing to revisit and unlock several investment projects that have remained in the pipeline for too long. The Incremental Capital Output Ratio (ICOR) - which assesses the marginal
Source: Thomson Reuters.
Chart 2.1: Volatility Index
10
12
14
16
18
Jan-
12Fe
b-12
Mar
-12
Apr
-12
May
-12
Jun-
12Ju
l-12
Aug
-12
Sep-
12O
ct-1
2N
ov-1
2D
ec-1
2Ja
n-13
Feb-
13M
ar-1
3A
pr-1
3M
ay-1
3Ju
n-13
Jul-1
3A
ug-1
3Se
p-13
Oct
-13
Nov
-13
Dec
-13
Jan-
14Fe
b-14
Mar
-14
Apr
-14
May
-14
Jun-
14Ju
l-14
Aug
-14
Sep-
14O
ct-1
4N
ov-1
4D
ec-1
4Ja
n-15
Feb-
15M
ar-1
5A
pr-1
5M
ay-1
5Ju
n-15
VIX (S&P 500) Trend
20
22
24
26
28
30
Index

10
MACROECONOMIC ENVIRONMENT FINANCIAL STABILITY REPORT | AUGUST 2015
amount of investment capital necessary to generate an additional unit of production, and measured as the ratio of GDFCF to GDP divided by the GDP growth rate - has increased since 2009. For 2009-2015, an estimated median ICOR of 6.3 is higher than the historical median of 5.5. Overall, a higher ICOR value is not preferred because it indicates that production is inefficient.
For 2015, domestic private savings as a share of GDP is projected to decrease to an estimated 16.3 per cent and shall remain the main funding source for domestic investment.
The Bank of Mauritius has revised its balance of payments data for the year 2013. These revisions were set against a background of various initiatives taken in recent years to improve external sector statistics. Following these revisions, the current account deficit as a percentage of GDP stood at 6.3 per cent in 2013 compared to the earlier estimate of 9.9 per cent. In 2014, the lower oil and food prices have impacted positively on the trade deficit, resulting in a lower current account deficit, estimated at 5.5 per cent of GDP. However, the external current account deficit for 2015 is projected to increase to 6 per cent of GDP. The current account deficit in 2015 will continue to be financed by net
foreign direct investment and portfolio investment. The gross foreign exchange reserves of the Bank rose from Rs124,344 million as at end-December 2014 to Rs139,915 million as at the end-June 2015. Based on the value of imports of goods (f.o.b.) and non-factor services for the year 2014, the end-June 2015 level of gross official international reserves of the country represented 7.0 months of imports, up from 6.1 in December 2014.
Chart 2.2: Mauritius: Gross Fixed Capital Formation,Investment, and ICOR
Per cent Per cent
0.0
2.0
4.0
6.0
8.0
10.0
12.0
14.0
16.0
0
5
10
15
20
25
30
35
1994
1995
1996
1997
1998
1999
2000
2001
2002
2003
2004
2005
2006
2007
2008
2009
2010
2011
2012
2013
2014
2015
ICOR GFCF (RHS) GFCF Investment
Sources: Statistics Mauritius and Bank of Mauritius staff calculations.
* Estimates.
Sources: Statistics Mauritius and Bank of Mauritius staff estimates.
Table 2.1: Saving-Investment Balance
2011 2012 2013 2014 2015*
(In per cent of GDP)Investment 26.0 24.8 25.1 22.9 21.7 Private (gross fixed capital formation) 18.5 17.5 16.2 14.3 13.7 Public 5.5 5.5 5.0 4.9 5.7 Change in inventories 2.0 1.7 3.9 3.7 2.3
Savings 26.0 24.8 25.1 22.9 21.7 External (- CA deficit) 13.8 7.3 6.3 5.5 6.0 Domestic 12.2 17.5 18.8 17.4 15.7 Private 13.4 17.1 19.7 18.0 16.3 Public -1.3 0.3 -0.9 -0.6 -0.6
Memo item: CY GDP (millions of Rs) 323,011 343,813 366,195 386,059 411,963

11
MACROECONOMIC ENVIRONMENTFINANCIAL STABILITY REPORT | AUGUST 2015
Box I: Channels through which Monetary Policy can affect Financial Stability
The nexus between monetary policy and financial stability remains an enigma for policy-makers. As monetary policy shocks are increasingly being perceived to impact on financial intermediaries and financial markets – a fact not captured by traditional Dynamic Stochastic General Equilibrium (DSGE) macroeconomic models – the roles of micro- and of macro-prudential regulation have emerged as critical in driving financial stability policies in many central banks. Part A of this box reviews the various channels through which monetary shocks can be transmitted to the financial system. Part B attempts to zero-in the specific effects of these impulses on the financial performance of selected institutional players.
A. A Smorgasbord of Theoretical Channels
Balance Sheet Channel – A hike in interest rates - as a result of monetary tightening - will compress the incomes of leveraged households and corporations who have taken adjustable-rate loans or mortgages, by increasing debt service payments. At the same time, there will be ‘negative collateralization’ as the compression of asset prices following an interest rate hike, undermines collateral values. The end result
Fiscal Policy
The budget deficit for 2014 represented 3.2 per cent of GDP, with total revenue and grants amounting Rs79.7 billion and total expenditure standing at Rs92.2 billion. Recurrent revenue as a share of GDP remained more or less stable, hovering at around 20.5 per cent over the period 2010-14. Value added tax represented the largest source of income, representing some 58 per cent of Government revenue. On the expenditure side, recurrent expenditure represented around 20.9 per cent of GDP and was much higher than previous years, mainly due to the 2013 salary review in the public sector. For the first semester of 2015, the government was expected to register a higher budget deficit than the corresponding period of the previous year. This was mainly associated with an increase in social benefits, following the decision of the government to double the old age pension benefits. The primary deficit, which excludes interest payments from the overall fiscal deficit, is also expected to increase during the first semester of 2015. The budget deficit in 2015H1 would be financed by both domestic and foreign sources.
Monetary Policy
During the first semester of 2015, the Monetary Policy Committee kept the Key Repo Rate unchanged at 4.65 per cent. While the domestic economy continues to expand at a moderate pace, growth remains fragile in advanced economies - particularly in the Eurozone, Japan, and in several emerging market economies. More importantly, global economic expansion is unbalanced, punctuated by financial risks, high debts and low productivity. Global inflation has remained low for an exceptionally long period and several economies are even faced with deflationary pressures. The persistent excess liquidity in the banking system during the period under review continued to impinge on the money market interest rates. Furthermore, excess liquidity was exerting downward pressure on yields on Government securities, hence causing a distortion in the interest rate structure. Despite the KRR remaining unchanged, some banks brought down deposit and lending rates, thus causing a distortion in the transmission mechanism of monetary policy. Channels through which monetary policy may affect financial stability are presented in Box I.

12
FINANCIAL STABILITY REPORT | AUGUST 2015MACROECONOMIC ENVIRONMENT
is a tightening borrowing constraint, an increase in the ‘external financing premium’1 , and an increase in default rates among borrowers. This may represent material risk to balance sheets of lenders. In contrast, a decline in interest rates may ease credit conditions by relaxing collateral constraints, and enhance borrowers’ net worth. However, with the advent of new financial instruments like Asset-Backed Securities such as Mortgage-Backed Securities and collateralized-debt obligations (CDOs), the impact of monetary policy on credit extension by banks, has become blurred.
Risk-Taking Channel – With asymmetric information, an increase in interest rates enhances the importance of ‘adverse selection’ and of ‘moral hazard’ in credit markets, by affecting the incentives of intermediaries and borrowers in taking risks. With higher rates, average credit quality of borrowers may deteriorate as only ‘bad’ borrowers are willing to borrow (adverse selection). Due to limited liability constraints, borrowers are more apt to indulge in risky projects. In the case of an imperfect screening mechanism, this constitutes significant risks to lenders (moral hazard).
Risk-Shifting Channel – Increases in policy rates can affect intermediation margins and incentivize lenders to seek more risks. For highly leveraged institutions such as banks which are funded short-term at variable rates and which lend long term at less variable rates, an increase in policy rates negatively affects the margins of these banks by impacting on the term structure. In turn, the banks are encouraged to gamble for resurrection by taking on more risks on the asset side of their balance sheet. This channel is strongest in the run-up to a financial crisis, when intermediary leverage is high and when competition limits the pass-through of policy rates to lending rates. Risk-shifting behaviour was observed in the US just ahead of the subprime crisis of 2007-2008.
Asset Price Channel – As documented in previous channels, lenders’ asset values and borrowers’ net worth are both affected by monetary policy rate changes. When rates are reduced, asset prices such as stock market and real estate prices, being the discounted value of future income streams, may increase due to the twinned effects of higher future net worth and lower discount factors, thereby triggering a ‘financial accelerator’ effect.
Exchange Rate Channel – Policy rate changes ultimately affect exchange rates and may therefore affect the balance sheets of financial institutions that hold sizeable proportion of liabilities in foreign currencies. This is the so-called ‘fear of floating’ argument which engulfed the Argentinean mindset, following the country’s exit from its currency board in 2000s as a significant proportion of liabilities of its banks and of government were denominated in dollars. As globalisation gives rise to cross-border movements of capital, monetary policy changes may spark off the ‘search for yield’ craze, as foreign investors rush to monetary jurisdictions offering the highest yields. Highly leveraged ‘carry-trade’ strategies are also enacted with the same mindset. For economies that are recipients of capital inflows being intermediated through their banking system, significant risks to the financial sector emerge: increase in credit to non-tradable sectors in the absence of appropriate safeguards, overvaluation of exchange rate and overheating of the economy. These succession of events may then spark off the ubiquitous debate about the stance of monetary policy in the face of significant capital inflows.
1 The external finance premium is cornerstone of the ‘Credit Channel of Monetary Policy’ doctrine which purports that monetary policy shocks will endogenously amplify external finance premium, through its impact on borrowers’ net worth. As the wedge between the cost of capital to firms when raised externally through debt and equity markets, and that raised internally, the external finance premium is positive due to under-collateralization, imperfect information and costly-contract enforcement. Monetary tightening will increase the premium, reduce net worth of borrowers and, reduce the availability of credit in the economy.

13
MACROECONOMIC ENVIRONMENTFINANCIAL STABILITY REPORT | AUGUST 2015
B. Monetary Policy and Institutional Investors: Uncovering Financial Stability Risks
Changes in monetary policy rates, if protracted, may directly affect the financial performance of pension funds and insurance companies. The extent to which the balance sheets of these institutional investors are affected by monetary impulses, depend on the interplay of three main factors (1) the presence of negative duration gap as a result of asset-liability maturity mismatches; (2) changes in the slope of the yield curve (i.e., term structure of interest rates), and (3) structure of their portfolio composition on the asset side.
Low interest rates affect pension funds and insurance companies on both the asset and liability sides of their balance sheets. A protracted period of low interest rates, as pursued in many developed economies in the aftermath of the 2008 financial crisis, will increase the fixed commitment liabilities of insurance companies and pension funds by raising the present discounted value of liabilities. This is especially so when longer-term liabilities are discounted by lower discount rates. The impact on present value of liabilities will depend on whether (1) future cash flows are fixed, and (2) to what extent benefits to be paid in the future are being adjusted to reflect the new environment. On the assets side, value of portfolio investments will decrease as reinvestment risks emerge and coupons are rolled into lower-yielding securities. For institutional investors having liabilities with longer maturities than assets, a period of prolonged low interest rates may seriously impinge on their balance sheets given the higher sensitivity of their liabilities to interest rate risks than their assets. This situation may compromise their financial sustainability.
The impact of monetary impulses on pension funds and insurance companies depends on their underlying structure. The negative duration gap is likely to be higher for life insurance companies than for non-life insurance companies because of the longer term commitment of their payment obligations which are, in turn, affected by longevity risks. Similarly, Defined Benefit (DB) pension funds have more fixed contractual payments and/or guaranteed payments than Defined Contribution (DC) pension funds. For DB pension funds which do not offer guarantees of fixed payments/returns - whose promised cash flows are dependent on future inflation outlook, wages and long-term bond-yields - the impact of protracted low interest rates on the value of their liabilities is more mitigated.
As a response to emerging risks following monetary signals, many institutional investors engage in complex hedging techniques such as interest rate swaps or interest rate options to shield themselves from risks following negative duration gaps. Others indulge in closer asset-liability maturity matching so as to preserve the financial integrity of their balance sheets as they choose to invest in longer term assets. For instance, non-life insurance companies are less affected by longevity risks than life insurance companies. As a result, they have shorter duration gap i.e., the maturity of their assets are more or less aligned to the maturity of their liabilities. Non-life insurance companies therefore choose to invest in fixed income securities that closely match the risk profile of their liabilities.
The need to find adequate income returns to match fixed or guaranteed returns in the future, has given rise to the ‘risk-taking’ channel described above in part A. A prolonged period of low interest rate prompts those institutional investors that are particularly affected by maturity mismatches, to reprogram their investment strategy by re-engineering the riskiness profile of their portfolio. The resulting ‘search for yield’ mindset will encourage DC and some life insurance companies to ‘gamble for redemption’, i.e., invest their proceeds in high-yield, high-risk assets. From a prudential and financial stability perspective, these activities from DC pension funds and life insurance companies may intensify asset price bubbles and cause material dislocations in asset prices.

14
Domestic Stock Market
During the first semester of 2015, the SEMDEX and SEM-10 maintained a downward trend (Chart 2.3). During the period under review, SEMDEX and SEM-10 decreased by 4.7 per cent and 2.3 per cent, respectively, compared to a fall of 0.5 per cent and 4.2 per cent in 2014H2. The retreat in foreign investments also weighed on the local stock market indices. Net foreign investment on the domestic stock market was negative during 2015H1 (Chart 2.4), with net outflows of around Rs3,453 million recorded mainly in banking stocks.
Exchange Rate
The rupee exchange rate reflected the evolution of major currencies on international markets as well as domestic demand and supply conditions. Based on the average dealt selling rate on transactions equivalent to US$30,000 or above, the rupee depreciated by 9.4 per cent, 9.8 per cent and 2.1 per cent against the US dollar, Pound sterling and euro, respectively, over 2015H1 (Chart 2.5). The currency-weighted nominal exchange rate indices, as measured by MERI1 and MERI2, depreciated by 7.4 per cent and 7.2 per cent, respectively,
MACROECONOMIC ENVIRONMENT FINANCIAL STABILITY REPORT | AUGUST 2015
Overall, a number of reform options may be considered to safeguard financial stability by pre-empting the likelihood of severe build-up of these risks. Initiatives designed to restore financial solvency of pension funds and insurance companies include: implementing parametric changes in their balance sheets by (1) actuarially matching the duration of their assets and liabilities and (2) by re-engineering their asset portfolios so as to eliminate funding gap issues. Contractual commitments may be revised as well. For instance, benefit rates applicable to fixed/guaranteed payments can be revised downward, the contribution rates and/or insurance premium may be increased, and above all, the existing contracts renegotiated. Above all, a number of regulatory initiatives and enhanced supervisory scrutiny measures are needed so as to police any risky investment that could have wider externalities to the system. Such monitoring should include stress tests that can proactively test the resilience of these institutions to monetary shocks. References:
Bernanke, Ben S., and A. S. Blinder (1988), “Credit, Money and Aggregate Demand”, American Economic Review, Vol. 78. Bernanke, Ben S., and M. Gertler (1995), “Inside the Black Box: The Credit Channel to Monetary Policy Transmission”, Journal of Economic Perspectives, Vol. 9, pp. 27-48. Kiyotaki, Nobuhiro, and J. H. Moore (1997), “Credit Cycles”, Journal of Political Economy, Vol. 105 (2), pp. 211-248.3
Chart 2.3: SEMDEX and SEM-10 Indices
1,700
1,750
1,800
1,850
1,900
1,950
2,000
2,050
2,100
2,150
2,200
350
360
370
380
390
400
410
420
Jan-
13Fe
b-13
Mar
-13
Apr
-13
May
-13
Jun-
13Ju
l-13
Aug
-13
Sep-
13O
ct-1
3N
ov-1
3D
ec-1
3Ja
n-14
Feb-
14M
ar-1
4A
pr-1
4M
ay-1
4Ju
n-14
Jul-1
4A
ug-1
4Se
p-14
Oct
-14
Nov
-14
Dec
-14
Jan-
15Fe
b-15
Mar
-15
Apr
-15
May
-15
Jun-
15
SEM-10
SEMDEXSEM-10
SEMDEX
320
330
340
Source: Stock Exchange of Mauritius.
Chart 2.4: Foreign Investment on the SEM
-2,500
-2,000
-1,500
-1,000
-500
0
500
1,000
1,500
2,000
2,500
2012
Q1
2012
Q2
2012
Q3
2012
Q4
2013
Q1
2013
Q2
2013
Q3
2013
Q4
2014
Q1
2014
Q2
2014
Q3
2014
Q4
2015
Q1
2015
Q2
Purchases Sales Net Purchases (+)/ Net Sales (-)
Rs million
Source: Stock Exchange of Mauritius.
15
during 2015H1, in response to the strength of the US dollar in international markets.
2.4 Regional Interconnectedness
Regional interconnectedness, which represents claims of banks on non-resident economic units, remains important for financial stability. These claims could be measured using data from banks’ balance sheets and/or foreign direct investment flows.
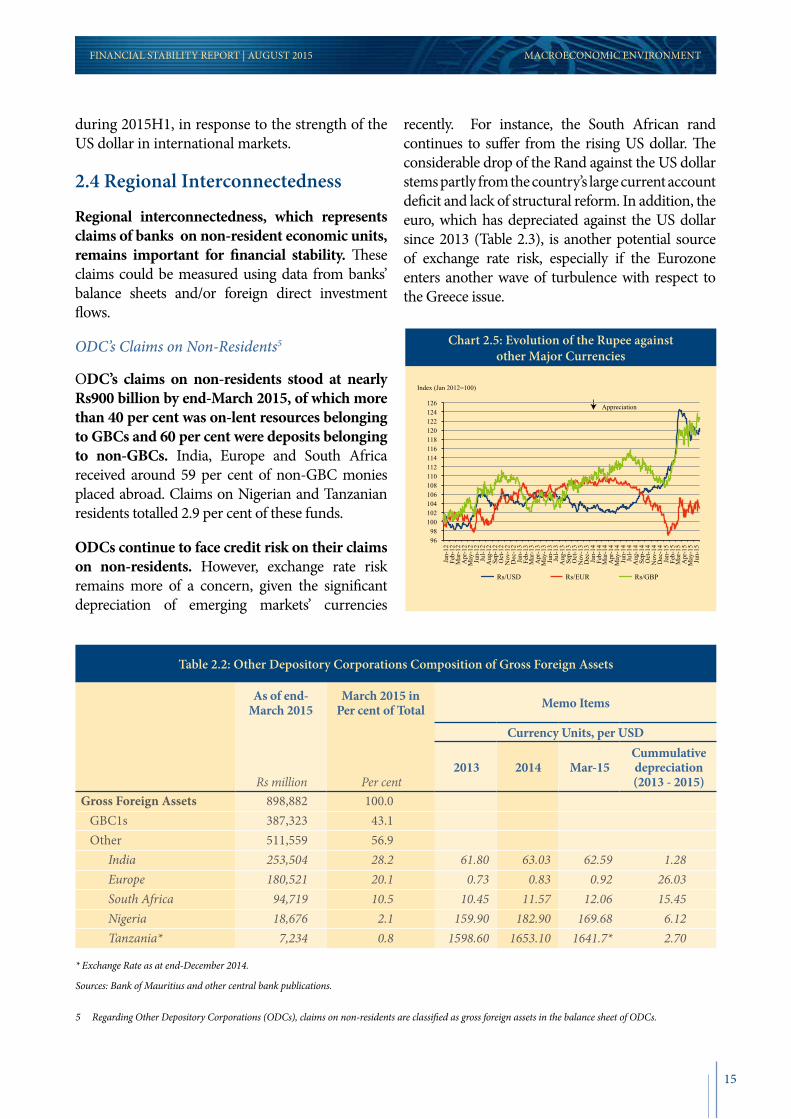
ODC’s Claims on Non-Residents5
ODC’s claims on non-residents stood at nearly Rs900 billion by end-March 2015, of which more than 40 per cent was on-lent resources belonging to GBCs and 60 per cent were deposits belonging to non-GBCs. India, Europe and South Africa received around 59 per cent of non-GBC monies placed abroad. Claims on Nigerian and Tanzanian residents totalled 2.9 per cent of these funds.
ODCs continue to face credit risk on their claims on non-residents. However, exchange rate risk remains more of a concern, given the significant depreciation of emerging markets’ currencies
recently. For instance, the South African rand continues to suffer from the rising US dollar. The considerable drop of the Rand against the US dollar stems partly from the country’s large current account deficit and lack of structural reform. In addition, the euro, which has depreciated against the US dollar since 2013 (Table 2.3), is another potential source of exchange rate risk, especially if the Eurozone enters another wave of turbulence with respect to the Greece issue.
Chart 2.5: Evolution of the Rupee againstother Major Currencies
Appreciation
112114116118120122124126
Jan-
12Fe
b-12
Mar
-12
Apr
-12
May
-12
Jun-
12Ju
l-12
Aug
-12
Sep-
12O
ct-1
2N
ov-1
2D
ec-1
2Ja
n-13
Feb-
13M
ar-1
3A
pr-1
3M
ay-1
3Ju
n-13
Jul-1
3A
ug-1
3Se
p-13
Oct
-13
Nov
-13
Dec
-13
Jan-
14Fe
b-14
Mar
-14
Apr
-14
May
-14
Jun-
14Ju
l-14
Aug
-14
Sep-
14O
ct-1
4N
ov-1
4D
ec-1
4Ja
n-15
Feb-
15M
ar-1
5A
pr-1
5M
ay-1
5Ju
n-15
Rs/USD Rs/EUR Rs/GBP
Index (Jan 2012=100)
9698
100102104106108110
5 Regarding Other Depository Corporations (ODCs), claims on non-residents are classified as gross foreign assets in the balance sheet of ODCs.
Table 2.2: Other Depository Corporations Composition of Gross Foreign Assets
As of end-March 2015
March 2015 in Per cent of Total Memo Items
Currency Units, per USD
Rs million Per cent2013 2014 Mar-15
Cummulative depreciation (2013 - 2015)
Gross Foreign Assets 898,882 100.0 GBC1s 387,323 43.1 Other 511,559 56.9 India 253,504 28.2 61.80 63.03 62.59 1.28 Europe 180,521 20.1 0.73 0.83 0.92 26.03 South Africa 94,719 10.5 10.45 11.57 12.06 15.45 Nigeria 18,676 2.1 159.90 182.90 169.68 6.12 Tanzania* 7,234 0.8 1598.60 1653.10 1641.7* 2.70
* Exchange Rate as at end-December 2014.
Sources: Bank of Mauritius and other central bank publications.
MACROECONOMIC ENVIRONMENTFINANCIAL STABILITY REPORT | AUGUST 2015


17
DEBT INDICATORS OF HOUSEHOLDS AND CORPORATESFINANCIAL STABILITY REPORT | AUGUST 2015
3.1 Households
The deceleration in the growth of credit extended by banks to households has continued during the period under review. Since publication of the last FSR, growth of bank credit to households has dropped from 10 per cent to around 5 per cent as at end-March 2015, bringing an end to several years of double digit growth (Chart 3.1). The sharp decline in consumption credit contributed significantly to the fall in household credit amid some stabilisation recorded in credit extended for housing purposes. The trend in credit granted to households was reflected in its share in total private sector credit, which has stalled after peaking at an all-time high of 30 per cent in August 2014 (Chart 3.2). Housing credit now accounts for around 62 per cent of total bank credit to households while consumption credit represents the remaining 38 per cent.
Indebtedness of households stayed almost flat in 2014 but fell for the first time in 2015Q1 since the global financial crisis (Chart 3.3). The ratio of household debt (from banks only) to household disposable income6 dropped to 51.4 per cent as at end-March 2015, from 53.7 per cent, a year earlier. The decline was consistent with the reported slowdown in credit extended by banks to households while disposable income is estimated to have recorded higher growth.
The broader definition of household indebtedness, that includes debt from banks, non-bank deposit-taking institutions and insurance companies showed a similar trend compared with the narrow definition7. Household borrowings from banks, non-bank deposit-taking institutions and insurance companies accounted for some 67 per cent, 28 per cent and 5 per cent, respectively, of total household debt. The broader measure of household indebtedness fell to 76.8 per cent as at end-March 2015 compared to 78.0 per cent in the corresponding period of 2014 (Chart 3.4).
Notwithstanding the recent decline in household indebtedness ratios, prudence should be exercised, taking into account past high credit expansion in a low interest rate environment. Risks of households to be further leveraged are:
(i) the persistent excess liquidity situation: competition on the supply side has led some banks to resort to aggressive lending campaigns; and
3. Debt Indicators of Households and Corporates
Chart 3.1: Y-o-y Growth of Credit to Households
-5.0
0.0
5.0
10.0
15.0
20.0
25.0
30.0
35.0
40.0
Mar
-04
Sep-
04
Mar
-05
Sep-
05
Mar
-06
Sep-
06
Mar
-07
Sep-
07
Mar
-08
Sep-
08
Mar
-09
Sep-
09
Mar
-10
Sep-
10
Mar
-11
Sep-
11
Mar
-12
Mar
-13
Sep-
13
Mar
-14
Sep-
14
Mar
-15
Housing credit Consumption credit Total household credit
Per cent
Sep-
12
18.0
20.3
22.7
25.0
27.3
29.7
32.0
68
69
70
71
72
73
74
Sep-
05
Dec
-05
Mar
-06
Jun-
06
Sep-
06
Dec
-06
Mar
-07
Jun-
07
Sep-
07
Dec
-07
Mar
-08
Jun-
08
Sep-
08
Dec
-08
Mar
-09
Jun-
09
Sep-
09
Dec
-09
Mar
-10
Jun-
10
Sep-
10
Dec
-10
Mar
-11
Jun-
11
Sep-
11
Dec
-11
Mar
-12
Jun-
12
Sep-
12
Dec
-12
Mar
-13
Jun-
13
Sep-
13
Dec
-13
Mar
-14
Jun-
14
Sep-
14
Dec
-14
Mar
-15
Corporates Households (RHS)
Per cent Per cent
All-time high
Chart 3.2: Share of Credit Extended by Banks to Households and Corporates
6 Household disposable income has been estimated from the National Accounts Estimates, Statement of Budgetary Central Government Operations and the Balance of Payments using the following equation: Household disposable income = compensation of employees + budget transfers + inward remittances – personal income tax. See Financial Stability Report February 2015, Annex: Estimation of Household Disposable Income for further information.
7 The narrow definition of household indebtedness comprises credit extended by banks only.
18
FINANCIAL STABILITY REPORT | AUGUST 2015
(ii) the decline in interest rates applicable to hire purchase credit, as announced in Budget 2015/16. While helping to reduce the debt burden of households, these developments may encourage households to avail more of such facilities. Surveillance is therefore warranted for timely identification of emerging pockets of vulnerabilities in the household sector.
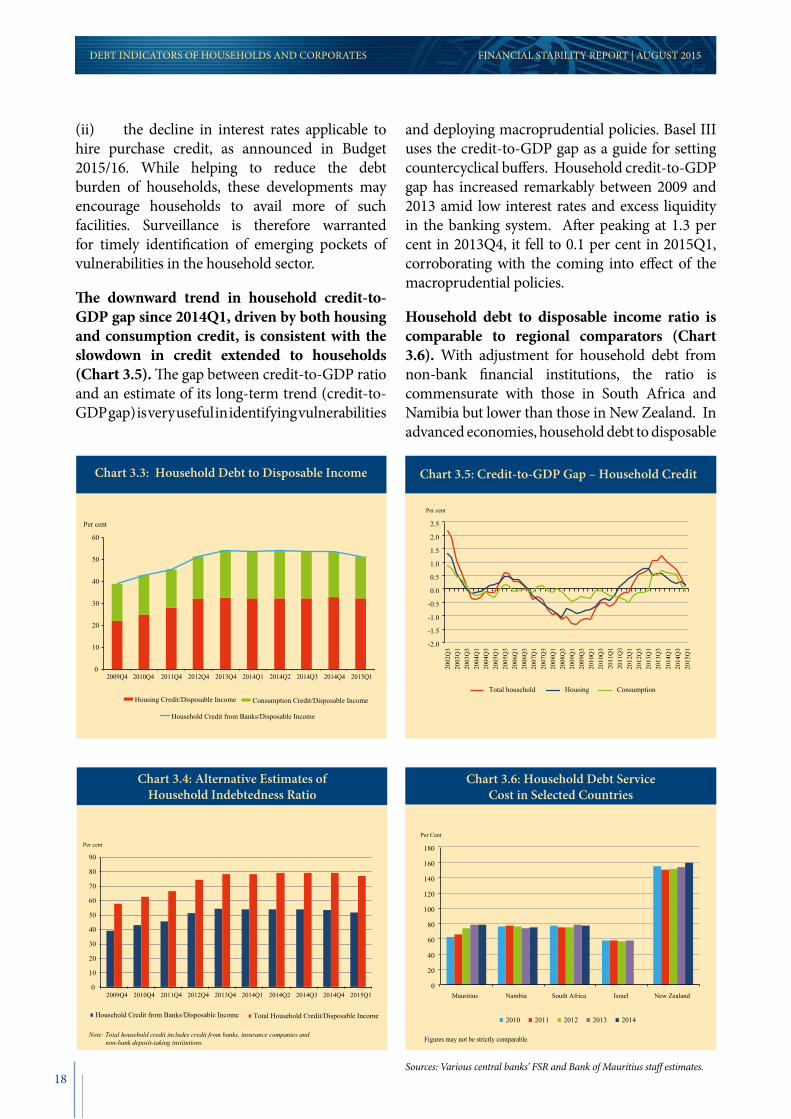
The downward trend in household credit-to-GDP gap since 2014Q1, driven by both housing and consumption credit, is consistent with the slowdown in credit extended to households (Chart 3.5). The gap between credit-to-GDP ratio and an estimate of its long-term trend (credit-to-GDP gap) is very useful in identifying vulnerabilities
and deploying macroprudential policies. Basel III uses the credit-to-GDP gap as a guide for setting countercyclical buffers. Household credit-to-GDP gap has increased remarkably between 2009 and 2013 amid low interest rates and excess liquidity in the banking system. After peaking at 1.3 per cent in 2013Q4, it fell to 0.1 per cent in 2015Q1, corroborating with the coming into effect of the macroprudential policies.
Household debt to disposable income ratio is comparable to regional comparators (Chart 3.6). With adjustment for household debt from non-bank financial institutions, the ratio is commensurate with those in South Africa and Namibia but lower than those in New Zealand. In advanced economies, household debt to disposable
DEBT INDICATORS OF HOUSEHOLDS AND CORPORATES
Chart 3.4: Alternative Estimates ofHousehold Indebtedness Ratio
0
10
20
30
40
50
60
70
80
90
2009Q4 2010Q4 2011Q4 2012Q4 2013Q4 2014Q1 2014Q2 2014Q3 2014Q4 2015Q1
Household Credit from Banks/Disposable Income Total Household Credit/Disposable Income
Per cent
Note: Total household credit includes credit from banks, insurance companies and non-bank deposit-taking institutions.
-2.0
-1.5
-1.0
-0.5
0.0
0.5
1.0
1.5
2.0
2.5
2002
Q3
2003
Q1
2003
Q3
2004
Q1
2004
Q3
2005
Q1
2005
Q3
2006
Q1
2006
Q3
2007
Q1
2007
Q3
2008
Q1
2008
Q3
2009
Q1
2009
Q3
2010
Q1
2010
Q3
2011
Q1
2011
Q3
2012
Q1
2012
Q3
2013
Q1
2013
Q3
2014
Q1
2014
Q3
2015
Q1
Total household Housing Consumption
Per cent
Chart 3.5: Credit-to-GDP Gap – Household Credit
Chart 3.6: Household Debt ServiceCost in Selected Countries
Figures may not be strictly comparable.
0
20
40
60
80
100
120
140
160
180
Mauritius Nambia South Africa Israel New Zealand
2010 2011 2012 2013 2014
Per Cent
Sources: Various central banks’ FSR and Bank of Mauritius staff estimates.
Chart 3.3: Household Debt to Disposable Income
0
10
20
30
40
50
60
2009Q4 2010Q4 2011Q4 2012Q4 2013Q4 2014Q1 2014Q2 2014Q3 2014Q4 2015Q1
Housing Credit/Disposable Income Consumption Credit/Disposable Income
Household Credit from Banks/Disposable Income
Per cent

19
income have either remained flat or declined. The US, UK and Germany have indebtedness ratios higher than 100 per cent (Chart 3.7). The indebtedness ratio in Mauritius is therefore lower compared to advanced economies. It is nevertheless important to note that international comparisons are not straightforward due to potential differences on funding information of households.
Household Debt Service Ratio
The household debt service ratio, adjusted for for servicing of debt contracted with non-bank financial institutions, has been on a rising trend since 2009Q2, despite declining interest rates (Chart 3.8). The debt service cost of households as a ratio to disposable income increased from around 13 per cent in 2009 to around 17 per cent in 2014. Accumulation of debt at a diminishing rate caused a slight decline in household debt service ratio in 2015Q1 though interest rates remained almost unchanged. At the regional level, the adjusted debt service cost of households is relatively higher than in comparator countries (Chart 3.9). The combination of relatively lower household debt to income ratio and higher debt service ratio in Mauritius compared to other countries may be the consequence of higher interest rate differentials.
3.2 Corporates
Total corporate debt, as a percentage of GDP, continued its downtrend in 2015Q1, driven by both external and domestic debt. Corporate debt peaked at 59.6 per cent of GDP in 2012. This figure has gradually fallen to 56.9 per cent and 54.3 per cent in 2013 and 2014, respectively. Domestic debt of corporates, which account for around 90 per cent of total corporate debt, fell to 49.4 per cent of GDP in 2015Q1 compared to 51.0 per cent in the corresponding quarter of 2014. External debt dropped to 4.6 per cent of GDP. Risks from corporate debt are considered as moderate amid high credit accumulation over the past years.
FINANCIAL STABILITY REPORT | AUGUST 2015
Chart 3.7: Advanced Economies:Corporate Debt to GDP Ratio
CanadaUKUS Euro area
120
110
100
90
80
70
60
2006 2007 2008 2013 2012 2011 2010 2009
Per cent
DEBT INDICATORS OF HOUSEHOLDS AND CORPORATES
Source: Various central banks’ websites.
Figures may not be strictly comparable.
0
2
4
6
8
10
12
14
16
18
20
2011 2012 2013 2014
Mauritius Namibia South Africa New Zealand US
Per cent
Chart 3.9: Household Debt Service Cost in Selected Countries
Sources: Various central banks’ FSR and Bank of Mauritius staff estimates.
3 Amortization and interest payments due.
5.0
6.5
8.0
9.5
11.0
12.5
14.0
15.5
17.0
18.5
20.0
5 000
7 500
10 000
12 500
15 000
17 500
20 000
22 500
25 000
27 500
30 000
2009
Q2
2009
Q3
2009
Q4
2010
Q1
2010
Q2
2010
Q3
2010
Q4
2011
Q1
2011
Q2
2011
Q3
2011
Q4
2012
Q1
2012
Q2
2012
Q3
2012
Q4
2013
Q1
2013
Q2
2013
Q3
2013
Q4
2014
Q1
2014
Q2
2014
Q3
2014
Q4
2015
Q1
Total outstanding credit (LHS) Debt Servicing to Disposable Income
Average Interest Rates on Housing Credit Average Interest Rates on Consumption Credit
Rs million Per cent
Chart 3.8: Household Debt Service Cost and Interest Rates

20
FINANCIAL STABILITY REPORT | AUGUST 2015
The level of corporate debt in Mauritius compares relatively well on a selective cross-country basis (Chart 3.10). Corporate debt to GDP ratio has been increasing at regional level in Namibia and South Africa as against the declining trend in Mauritius. In New Zealand and Israel, the level of corporate debt to GDP (relatively higher than in Mauritius) has fallen or remained rather stable.
Corporate domestic debt to GDP ratio has fallen in 2015Q1 on a y-o-y basis. Among key sectors of the economy, the manufacturing and construction (excluding housing) sectors registered y-o-y increases in their respective credit-to-GDP ratios, while tourism, financial services and agriculture & fishing registered contractions. The improvement
DEBT INDICATORS OF HOUSEHOLDS AND CORPORATES
Table 3.1: Domestic and External Debt Indicators
2011 2012 20132014 2015
1st Quarter
2nd Quarter
3rd Quarter
4th Quarter
1st Quarter*
Rs millionTotal Corporate Debt 187,640 204,863 208,477 207,768 205,238 202,806 209,600 212,045 Corporate External Debt 21,929 21,680 19,367 18,871 19,475 19,983 19,939 18,870 Short Term1 3,086 3,534 4,051 4,080 4,117 4,149 4,167 4,184 Long Term2 18,843 18,146 15,315 14,791 15,358 15,834 15,772 14,686 Corporate Domestic Debt 165,711 183,183 189,110 188,897 185,763 182,823 189,661 193,175
Per cent of total corporate debtTotal Corporate Debt 100 100 100 100 100 100 100 100Corporate External Debt 11.7 10.6 9.3 9.1 9.5 9.9 9.5 8.9Short Term1 1.6 1.7 1.9 2.0 2.0 2.0 2.0 2.0Long Term2 10.0 8.9 7.3 7.1 7.5 7.8 7.5 6.9Corporate Domestic Debt 88.3 89.4 90.7 90.9 90.5 90.1 90.5 91.1
Per cent of GDPTotal Corporate Debt 58.1 59.6 56.9 56.0 54.4 53.2 54.3 54.2Corporate External Debt 6.8 6.3 5.3 5.1 5.2 5.2 5.2 4.8Short Term1 1.0 1.0 1.1 1.1 1.1 1.1 1.1 1.1Long Term2 5.8 5.3 4.2 4.0 4.1 4.2 4.1 3.8Corporate Domestic Debt 51.3 53.3 51.6 51.0 49.3 48.0 49.1 49.4Memo item: GDP (Rs million) 323,010 343,833 366,208 370,702 376,939 380,905 386,068 391,140
* Provisional.1. Refers mainly to trade credit as recorded in BoP statistics.2. Excluding loans of Global Business Companies.Sources: Mauritius SDDS country page and Bank of Mauritius.
0
20
40
60
80
100
120
140
Mauritius South Africa Namibia New Zealand Israel
2011 2012 2013 2014
Per cent of GDP
1. Data for Mauritius includes credit extended by banks to corporates and corporates' external debt 2. Data for Israel refers to total private credit to GDP and has been updated to September 2014 3. Figures may not be strictly comparable
Chart 3.10: Corporate Debt to GDP Ratio in Selected Countries
Sources: Various central banks’ FSR and Bank of Mauritius staff estimates.

21
FINANCIAL STABILITY REPORT | AUGUST 2015 DEBT INDICATORS OF HOUSEHOLDS AND CORPORATES
in the credit-to-GDP ratio since the issue of the February 2015 FSR was driven by most key sectors of the economy suggesting some improvement in activity. Notwithstanding improved activity, the relatively leveraged tourism sector registered lower credit-to-GDP ratio.
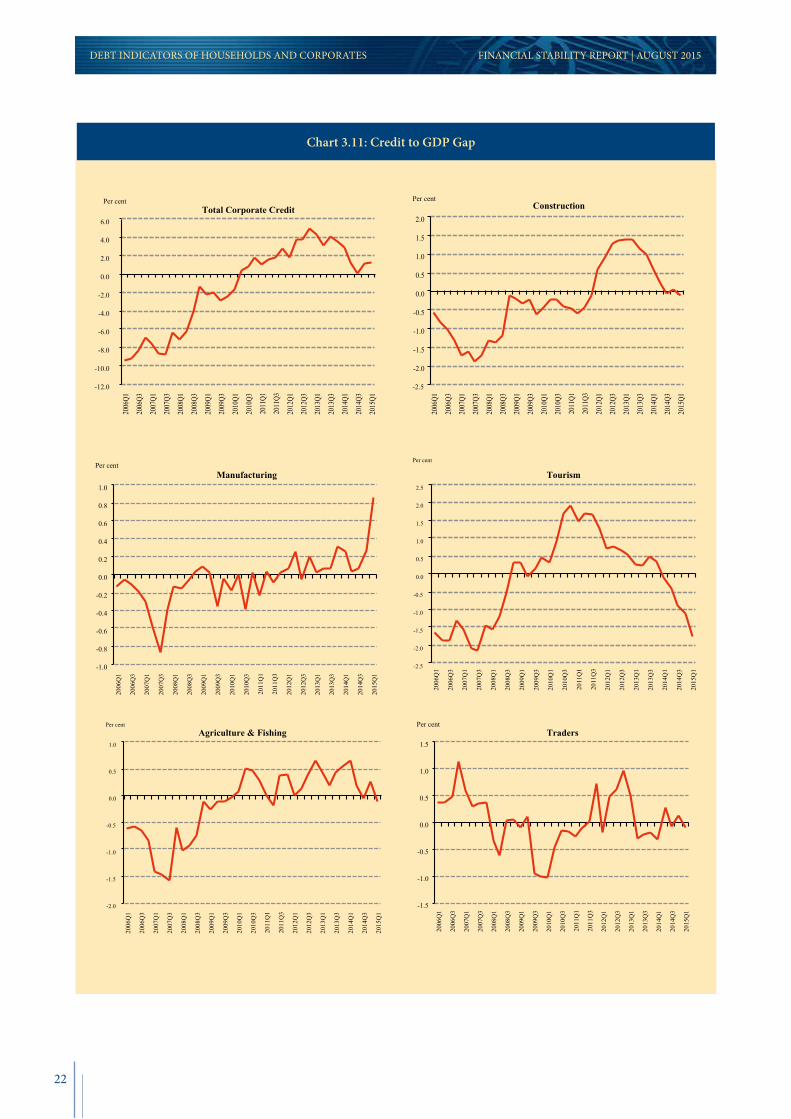
With the rapid growth of credit, corporate credit-to-GDP gap maintained an upward trend till 2013 but has systematically declined in 2014 (Chart 3.11). The decline in corporate credit-to-GDP gap, accounted principally by tourism and construction, appears to corroborate with the introduction of the macroprudential policies that became effective as from 01 January 2014. Construction credit-to-GDP gap hovered around the zero line while in the tourism sector, credit-to-GDP gap has plunged in negative territory since
2014Q1. Reflecting some improvement in activity, manufacturing credit-to-GDP gap has increased in recent quarters.
Credit expansion is indicative of growth-enhancing investment opportunities though high credit jumps to the private sector may also be harmful. The trade-off between maintaining prudential ratios and the benefits of credit growth to the economy necessitates the right balance to ensure stability of the financial system, sustainable high growth and job creation. Though public sector investment is expected to increase with some leading projects, avoiding the middle income trap will require a boost to private investment to accelerate future growth without undermining stability.
Table 3.2: Distribution of Credit to the Private Sector
2006-2012 2013 2014 2015Q1Per cent of GDP
Total credit to private sector 66.6 74.1 71.1 71.1Corporates 47.9 51.6 49.1 49.4 Agriculture & Fishing 4.5 5.2 4.9 4.6 Manufacturing 6.2 5.3 4.9 5.4 Tourism 11.4 13.3 12.3 11.9 Construction (ex housing) 5.4 8.1 7.9 8.1 Traders 8.6 7.9 8.2 7.9 Financial & Business Services 7.3 7.3 6.5 7.0Households 15.4 20.7 20.9 20.8 Housing 8.9 12.4 12.8 13.0 Consumption Credit 6.5 8.3 8.0 7.8
(Average annual growth rates; in per cent)Total credit to private sector 12.1 5.9 1.3 2.6Corporates 12.5 3.2 0.3 2.3 Agriculture & Fishing 12.7 5.0 0.7 -8.7 Manufacturing 3.7 2.2 -2.2 11.6 Tourism 16.3 8.8 -2.4 -3.5 Construction (ex housing) 27.7 10.9 3.4 6.7 Traders 9.4 -7.6 9.0 8.4 Financial & Business Services 13.1 5.4 -7.0 -0.5Households 15.1 15.0 6.2 5.8 Housing 17.7 11.1 8.9 9.9 Consumption Credit 11.8 21.3 2.1 -0.2
22
FINANCIAL STABILITY REPORT | AUGUST 2015DEBT INDICATORS OF HOUSEHOLDS AND CORPORATES
-12.0
-10.0
-8.0
-6.0
-4.0
-2.0
0.0
2.0
4.0
6.0
Per cent Total Corporate Credit
-2.5
-2.0
-1.5
-1.0
-0.5
0.0
0.5
1.0
1.5
2.0
2006
Q1
2006
Q3
2007
Q1
2007
Q3
2008
Q1
2008
Q3
2009
Q1
2009
Q3
2010
Q1
2010
Q3
2011
Q1
2011
Q3
2012
Q1
2012
Q3
2013
Q1
2013
Q3
2014
Q1
2014
Q3
2015
Q1
2006
Q1
2006
Q3
2007
Q1
2007
Q3
2008
Q1
2008
Q3
2009
Q1
2009
Q3
2010
Q1
2010
Q3
2011
Q1
2011
Q3
2012
Q1
2012
Q3
2013
Q1
2013
Q3
2014
Q1
2014
Q3
2015
Q1
Per cent Construction
-1.0
-0.8
-0.6
-0.4
-0.2
0.0
0.2
0.4
0.6
0.8
1.0
2006
Q1
2006
Q3
2007
Q1
2007
Q3
2008
Q1
2008
Q3
2009
Q1
2009
Q3
2010
Q1
2010
Q3
2011
Q1
2011
Q3
2012
Q1
2012
Q3
2013
Q1
2013
Q3
2014
Q1
2014
Q3
2015
Q1
Per cent Manufacturing
-2.5
-2.0
-1.5
-1.0
-0.5
0.0
0.5
1.0
1.5
2.0
2.5
2006
Q1
2006
Q3
2007
Q1
2007
Q3
2008
Q1
2008
Q3
2009
Q1
2009
Q3
2010
Q1
2010
Q3
2011
Q1
2011
Q3
2012
Q1
2012
Q3
2013
Q1
2013
Q3
2014
Q1
2014
Q3
2015
Q1
Per cent
Tourism
-2.0
-1.5
-1.0
-0.5
0.0
0.5
1.0
2006
Q1
2006
Q3
2007
Q1
2007
Q3
2008
Q1
2008
Q3
2009
Q1
2009
Q3
2010
Q1
2010
Q3
2011
Q1
2011
Q3
2012
Q1
2012
Q3
2013
Q1
2013
Q3
2014
Q1
2014
Q3
2015
Q1
Per cent Agriculture & Fishing
-1.5
-1.0
-0.5
0.0
0.5
1.0
1.5
2006
Q1
2006
Q3
2007
Q1
2007
Q3
2008
Q1
2008
Q3
2009
Q1
2009
Q3
2010
Q1
2010
Q3
2011
Q1
2011
Q3
2012
Q1
2012
Q3
2013
Q1
2013
Q3
2014
Q1
2014
Q3
2015
Q1
Per cent Traders
Chart 3.11: Credit to GDP Gap

23
BANKING SECTORFINANCIAL STABILITY REPORT | AUGUST 2015
4.1 Overview
Over the year ended March 2015, total assets of the banking sector grew at a rapid pace, with banks’ foreign assets increasing much faster than domestic assets (Table 4.1 and Chart 4.1). Total assets of the banking sector rose by 21.8 per cent at end-March 2015 compared to a moderate growth of 5.8 per cent a year earlier, reflecting further expansion of foreign assets held by both domestic-owned banks and subsidiaries of foreign-owned banks. The upward trend in banks’ foreign assets is partly explained by the advances and placements
of local banks in frontier markets in Africa as well as in India. As at end-March 2015, subsidiaries of foreign-owned banks held almost 55 per cent of total assets compared to a lower market share of 40.8 per cent held by domestic-owned banks. The balance sheet of branches of foreign-owned banks retrenched further by almost 18 per cent and represented 4.5 per cent of total banking sector assets. Banking sector assets represented around 285 per cent of nominal GDP at market prices as at end-March 2015.
4. Banking Sector
Table 4.1: Banks’ Assets by Type of Bank and Asset, 2012-2015
Assets (growth rates; in per cent) Assets (contribution to asset growth; in per cent)
I. Period: March 2014 to March 2015
Domestic Foreign banks Domestic Foreign banks
banks Subsidiary Branch Total banks Subsidiary Branch Total
Foreign assets 49.5 34.5 -36.4 32.3 4.6 14.2 -1.3 17.5
Domestic assets 9.5 10.4 5.3 9.4 3.1 1.1 0.2 4.3
Total assets 18.4 29.8 -17.8 21.8 7.7 15.3 -1.2 21.8
II. Period: March 2013 to March 2014
Domestic Foreign banks Domestic Foreign banks
banks Subsidiary Branch Total banks Subsidiary Branch Total
Foreign assets 13.5 16.6 -57.9 3.7 1.2 6.2 -5.4 2.0
Domestic assets 11.6 22.4 -36.9 8.4 3.6 2.0 -1.8 3.7
Total assets 12.1 17.7 -50.6 5.8 4.8 8.2 -7.2 5.8
III. Period: March 2012 to March 2013
Domestic Foreign banks Domestic Foreign banks
banks Subsidiary Branch Total banks Subsidiary Branch Total
Foreign assets 35.1 -5.1 15.7 2.8 2.4 -2.2 1.3 1.6
Domestic assets 13.7 74.3 -31.5 13.1 4.0 4.0 -2.4 5.5
Total assets 17.8 3.8 -6.7 7.1 6.4 1.8 -1.1 7.1
Source: Bank of Mauritius staff estimates.

24
FINANCIAL STABILITY REPORT | AUGUST 2015BANKING SECTOR
Growth in banks’ claims on the private sector - comprising mainly households and corporations - remained negative as at end-December 2014 but recent trends in 2015 indicate a recovery in bank credit extended to households and corporates (Table 4.2). Net foreign assets held mainly by subsidiaries of foreign-owned banks and domestic-owned positions remained sizeable, while banks’ claims on the government and the central bank have generally registered positive growth in recent years. Gross foreign asset positions averaged US$25 billion during 2010-2014, with a net value of about US$10 billion. Banks’ claims on government refer mainly to holdings of government securities, while banks’ claims on the central bank are holdings of BoM securities.
Chart 4.1: Banking Sector Assets
700
750
800
850
900
950
1,000
1,050
1,100
1,150
1,200
1,250
1,300
0
100
200
300
400
500
600
700
Mar-12 Mar-13 Mar-14 Mar-15
Domestic-owned banks Subsidiaries of foreign-owned banksBranches of foreign-owned banks Total banking sector (RHS)
Rs billion Rs billion
Table 4.2: ODCs’ Balance Sheet, 2011-2015
2011 2012 2013 2014 2015March June
Rs millionNet foreign assets 290,654.2 309,761.1 292,802.0 335,087.7 418,918.1 381,222.8 Claims on non-residents 783,159.2 802,935.7 772,471.3 782,494.5 898,881.9 789,125.9 Liabilities to non-residents -492,505.0 -493,174.6 -479,669.3 -447,406.8 -479,963.8 -407,903.2
Claims on Central Bank (net) 32,226.0 32,315.3 47,005.5 56,013.4 62,560.2 70,324.8 o/w Bank reserve deposits 23,667.5 25,339.9 32,104.8 35,352.2 47,797.5 48,706.5 BoM securities held by
ODCs 1 5,539.8 3,916.3 10,796.4 17,351.4 14,541.5 24,624.0
Domestic Claims 234,148.5 250,348.4 273,493.1 292,486.3 289,659.3 290,971.3Net Claims on Central Government 38,010.7 38,215.2 45,691.7 65,514.9 64,686.3 68,182.7Claims on Other Sectors 310,940.9 364,089.2 413,242.8 401,882.4 420,706.4 410,792.8Other items net -114,803.2 -151,956.0 -185,441.5 -174,911.0 -195,733.4 -188,004.1
Broad Money Liabilities 298,110.2 322,440.7 340,145.8 370,054.6 383,814.3 392,184.1 Transferable Deposits 69,409.1 74,618.5 80,380.3 92,691.4 100,564.3 102,248.2 Savings Deposits 114,277.7 123,940.2 137,028.6 151,721.3 157,723.5 162,367.6 Time Deposits 113,435.5 122,767.9 121,486.6 124,261.8 124,112.7 126,129.2 Securities other than Shares 987.9 1,114.0 1,250.3 1,380.1 1,413.7 1,439.1
GBC deposits 258,918.4 269,984.2 273,154.7 313,532.9 387,323.3 350,334.8 (Annual growth rates; in per cent)
Net Foreign Assets 6.6 -5.5 14.4 60.3 45.2
Claims on Central Bank (net) 0.3 45.5 19.2 21.1 27.8 o/w Bank reserve deposits 7.1 26.7 10.1 35.2 37.0 BoM securities held by ODCs1 -29.3 175.7 60.7 -4.2 43.4

25
BANKING SECTORFINANCIAL STABILITY REPORT | AUGUST 2015
Table 4.2: ODCs’ Balance Sheet, 2011-2015 (Continued)
2012 2013 2014 2015March June
(Annual growth rates; in per cent) Domestic Claims 6.9 9.2 6.9 7.0 7.9Net Claims on Central Government 0.5 19.6 43.4 31.4 27.6Claims on Other Sectors 17.1 13.5 -2.7 4.4 4.8Other items net 32.4 22.0 -5.7 7.9 7.0
Broad Money Liabilities 8.2 5.5 8.8 10.3 10.6 Transferable Deposits 7.5 7.7 15.3 24.6 20.3 Savings Deposits 8.5 10.6 10.7 10.0 11.8 Time Deposits 8.2 -1.0 2.3 1.3 2.5 Securities other than Shares 12.8 12.2 10.4 9.9 8.9
GBC deposits 4.3 1.2 14.8 64.4 50.61 As reported in the Bank of Mauritius balance sheet.
Box II: Exclusive Interview by the Governor
The Governor of the Bank of Mauritius, Rameswurlall Basant Roi, GCSK, gave an exclusive interview to a local daily newspaper on 11 May 2015 on the sequence of events that led to the revocation of the licence of the Bramer Banking Corporation Ltd.
Governor, what’s your general view about the recent debacle in the financial sector?
The ground shakes when a big tree falls. The BAI Group had grown into a huge undertaking by local standard. Mr. Dawood Rawat, the man behind this huge enterprise, appears to have had a great vision in the years before the suspension of the Exchange Control Act in 1994. The Group seemed to have known the road, but lost its way somewhere in its evolutionary path since. In my opinion, the ills of the Group were largely self-inflicted. You don’t burn the furniture in your house to keep yourself warm; it feels good for a moment. But the sense of well-being is short-lived. There are hard-to-hear useful truths that will perhaps never be told and there are also dishonest spins cut out from the same old cloth that will be recycled again and again.
Time and again, seemingly strong balance sheets of banks and non-bank financial institutions have often turned out to mask unsuspected vulnerabilities. There was a compelling case for the revocation of the banking licence of the defunct Bramer Bank on April 2, 2015. It was our Lehman moment, certainly not a happy moment for the BoM. The liquidity tide had gone down; defunct Bramer Bank was found swimming naked. In the best interests of financial stability and of our economy, the decision to revoke the licence had become unquestionable; it was indisputably warranted. The future will outlast all of us, but I believe that all of us will live on in the future we make. The best interests of our society had to prevail over all other considerations.
On 02 April 2015, the Bank revoked the banking licence of Bramer Banking Corporation Ltd (BBCL), under section 17 of the Banking Act 2004. The revocation was necessary in view of the fact that the capital of BBCL was seriously impaired and the bank had failed to demonstrate its ability to address capital and liquidity issues to the satisfaction of the Bank. The Governor gave a press interview on the revocation of the banking licence of BBCL, which is reproduced in Box II.

26
FINANCIAL STABILITY REPORT | AUGUST 2015BANKING SECTOR
Both the BoM and the FSC are said to have failed in their regulatory and supervisory responsibilities. How do you react to this allegation?
The BoM and the FSC had been sitting on a hemorrhoid donut for years. I am not in as privileged a position to speak about the FSC as I am about the BoM. With regard to the FSC, I can only surmise that the concern about ‘too big to fail’ haunted the regulator. Perhaps there might have been other forces that undermined the independence of FSC. As far as the BoM is concerned, there have been serious acts of vandalism, albeit localized, in the regulatory and supervisory area. They are best left unsaid.
Is there anything wrong about our regulatory framework?
The intellectual backbone of our regulatory framework is indeed strong. The BoM’s regulatory framework is comparable to those of advanced jurisdictions. Our supervisory framework is far from the box-ticking kind of exercises carried out in many other jurisdictions. On-site examination of deposit- taking institutions is legally binding on the BoM. Off-site surveillance is a well-established function at the BoM. The dynamism of our banking industry has kept the BoM active with regard to changes in banking legislation and in regulatory guidelines since the beginning of the new millennium. There is, however, one strand of view that it is inadequate. It’s a view that has more to do with the FSC and co-operation between the FSC and the BoM. It’s a lesson learned already.
If there is nothing wrong with the regulatory framework for banks, how come the Bramer Bank dropped dead?
Does it always mean that the rules of the road are necessarily inadequate whenever a fatal accident happens? The revocation of the banking licence of the defunct Bramer Bank gave rise to a saloon-bar-like brawl. We have had a sudden onslaught of loud and vociferous opinions – an emulsion of revulsion – that were at times delightfully provocative. Some went ballistic. Fanciful conspiracy theories ran galore. The colourful narratives about the financial strains and stresses of the BAI Group were, however, known for many years to most watchful observers in the country. They were read with lying eyes. The ingredients of a Greek tragedy were clear and present. The predictable downfall was uttered in hushed up voices. An epidemic of political correctness had broken out. Our regulatory authorities had kept the bar open; no one had dared to disrupt the party.
As I said earlier, our regulatory framework, though not perfect, is qualitatively great. The credentials of the persons at the helm of regulatory authorities are as important as the character of our regulatory framework. A mix of sly intelligence and unbruised suavity constitutes an essential quality of a regulator. A regulator who cannot play fairly and prudently on both sides of the fence must never sit on the fence and let the rot worsen. When I say ‘play fairly and prudently on both sides of the fence’ I mean a display of desired flexibility in the implementation of the regulatory rules on the one hand and discipline and rigour on the other. My reading of a few remaining files at the BoM gives the clear impression that excessive regulatory forbearance was the name of the game in certain cases.
What do you mean by “credentials of the persons at the helm of regulatory authorities”?
Do you believe that it’s appropriate to appoint any person who has a history of loan defaults in the books of banks as Governor of the BoM which is the regulatory authority of banks and other deposit-taking institutions in the country? Is it acceptable to have a Chairman of the FSC who has conflicts of interest that are detrimental to the system as a whole? As long as the individuals at the helm of the regulatory authorities are lacking in terms of the essentials that go into the making of an effective regulator of financial institutions, even the best regulatory framework can’t be foolproof. Our decision makers must bear in mind that regulation and supervision of financial institutions are not taught at

27
BANKING SECTORFINANCIAL STABILITY REPORT | AUGUST 2015
Universities; it’s not a specialized field of study. Proficiency in the area of regulation and supervision of financial institutions is acquired on the job over a number of years. One does not become a regulator overnight – by the simple stroke of a pen.
Do you mean that anyone else from outside the regulatory bodies would necessarily fail to deliver the goods?
Well, the guy would be much less reliable than fortune tellers and marriage counselors in the initial years of his tenure of office. By the time he masters all the tricks of the trade, his tenure of office is over.
Let me put a straight question to you. Did you personally issue a banking licence to the Bramer Bank?
Let me put things in their proper perspective. There were two applications for banking licences sometime before December 2006, the very month when I was on my way out of the BoM. One was from the CIEL Investment Ltd and the other from Group Mon Loisir. In December 2006, the British American Investment (BAI) had submitted an application for a banking licence. They were all given approval subject to a number of conditions being fulfilled prior to the grant of a banking licence. The applicants were all also informed that the BoM reserved the right to withdraw the approval should they fail to comply with the conditions normally imposed on applicants of a banking licence.
The BAI had, however, abandoned its project to open a new bank. Instead, the BAI had decided to take over the South East Asian Bank and a banking licence was issued to the Bramer Banking Corporation on August 27, 2008, eighteen months after I had stepped out of the BoM. Lately, there has been an attempt to suggest that I had issued a banking licence to Mr Dawood Rawat way back in 2006. So what? Why so much of fuss about it? Let’s be fair. I find no reason why Mr Dawood Rawat should have been denied a banking licence if he had satisfied the terms and conditions for the issue of a licence.
Why the defunct Bramer Bank suffered a liquidity crisis in 2015 and not before?
A study of the monthly balance sheets of the defunct Bramer Bank reveals that it did occasionally suffer from serious liquidity problems before 2015. For instance, in the years before 2015, the BoM granted lines of credit to the defunct bank on such terms and conditions that no other central bank would have done so under normal central banking practices. Defunct Bramer Bank is the only bank to have benefitted from the exceptional generosity of the BoM on a few occasions.
The size of public sector deposits of over Rs 4.0 billion with defunct Bramer Bank begs some probing questions. Government is owner of two banks. Why would public sector bodies favour a private bank with so much of deposits? Did defunct Bramer Bank face liquidity problems in the past? Does it not suggest that defunct Bramer Bank had a serious balance sheet problem already? Did Government try to bail out the Bramer Bank from time to time in the past by other means, i.e. by placing additional public sector deposits? If yes, the repeated bailouts did not help at all. Why did defunct Bramer Bank borrow so much from the BoM that it no longer had any eligible collateral left for further borrowings? Why did the BoM lend US dollar to defunct Bramer Bank against rupee collateral? These are questions suggesting that defunct Bramer Bank badly needed a balance sheet repair since long before 2015.
Government withdrew its deposits from the Bramer bank, which explains why the bank found itself in a liquidity problem. Do you agree with this view?
Public sector bodies held deposits exceeding Rs 4.0 billion with the defunct Bramer Bank. This represented as much as over 33 per cent of its deposit base. Any banker with the slightest common sense knows that having such a high level of concentration of deposits from a single source, i.e. the public sector, is very risky. It’s a very elementary principle in banking not to have such a high proportion

28
of deposits from a single source. I am given to understand that the Banking Supervision Department had cautioned defunct Bramer Bank about the need to diversify its deposit base on a few occasions. Defunct Bramer Bank did not heed the caution.
Besides, there is a moral hazard issue for Government. The more a bank succeeds in mobilizing public sector deposits, the more it is likely to be reckless in its lending operations. The reason is that the larger the size of public sector deposits with a bank, the more compelled would be the Government to bail out that bank should it fail for some reason.
There seems to have been an effortful attempt to divert attention from issues of material importance to non-issues. That some public sector bodies withdrew deposits from the defunct Bramer Bank is a non-issue. After all, at the time of the revocation of the banking licence public sector bodies had deposits amounting to over Rs 2.0 billion. Defunct Bramer Bank should have resolved the deposit concentration problem rather than relying on it for its survival. Without being uselessly argumentative, commentators should ask the honest question as to why, for instance, did the BoM approve the purchase of Rs 1.7 billion hire purchase debts of Courts? Why did defunct Bramer Bank not disclose pertinent information regarding transactions with its related parties? Why did the defunct Bramer Bank grant loans to its related parties that were recycled as capital into the bank?
The BoM issued a letter on February 27, 2015, to Bramer Bank requesting for an injection of Rs 3.5 billion by the end of December 2015. Were these related party lending that had gone bad?
Several large transactions of the defunct bank with its related parties and with other non related parties had impaired its capital and financial soundness and hence the request for the injection of capital amounting to Rs3.5 billion.
Were these related party lending known and closely monitored by the BoM before December 2014 and was there any ‘work out’ program being followed?
Yes, the BoM knew them. Let alone ‘work out’ program, before holding trilateral meetings with the defunct Bramer Bank and its external auditors, BoM officers used to be warned that they should not set ‘embarrassing questions’ to the representatives of the defunct bank!!!
Could you please outline the sequence of events that led to the revocation of the banking licence of the Bramer Bank on April 2, 2015?
With pleasure. On February 27, 2015, the BoM requested defunct Bramer Bank to inject Rs 3.5 billion by the end of December 2015. The BoM played a fair game. With all the best intentions, the BoM decided that the defunct bank needed to be given breathing space and time to repair its balance sheet. That is why the BoM asked for the injection of capital in a phased manner.
On March 24, 2015, the defunct bank requested for a special line of credit of up to Rs 1.0 billion. Its borrowings from the BoM already stood at about Rs 800 million at the time of the request. The bank had no more eligible securities left for further borrowing from the BoM.
On March 25, 2015 the BoM replied to the defunct bank stating that its request could not be entertained on the grounds that the bank did no longer have any unencumbered eligible security to pledge for the requested credit facility. On the same day, the defunct bank reiterated its request for the Rs 1.0 billion loan on the strength of security to be created on immovable property. When a gambler at the racecourse finally gambles his house, the desperation is perceptible. But when an ailing bank, overwhelmingly owned by a single person, does it, the right message has to be registered by any responsible regulatory authority. Remember Walter Bagehot’s (author of Lombard Street, a definitive book on money market
FINANCIAL STABILITY REPORT | AUGUST 2015BANKING SECTOR

29
operations) famous line: in a liquidity crisis central banks should provide plenty of liquidity at a high cost against good security. On March 26, 2015, the BoM turned down the request.
Meanwhile, we noted that the liquidity position of the defunct Bramer Bank that was deteriorating for weeks had aggravated further. The bank could not obtain overnight funds on the inter-bank money market. The BoM however allowed the bank to kind of rollover its overnight facility. Withdrawal of deposits by its customers intensified as a result of which the liquidity problem of the bank kept aggravating. By way of a letter, the bank admitted that its liquidity position was seriously affected. Our constant monitoring of the bank’s liquidity position had revealed that even its own director, employees, BAI’s pension funds, etc. were drawing down their deposits.
On March 31, 2015, the deadline for the injection of Rs 350 million as capital was not met. On the same day, the defunct bank informed the BoM that it was prepared to inject the required amount of capital provided that it obtained the necessary approvals from the relevant authority and of BAI shareholders.
In the morning of April 2, 2015, the BoM exceptionally informed the bank that it was willing to make a special accommodation for the bank to avail itself of an overnight facility up to April 30, 2015, on the understanding that it would take necessary steps to inject capital in the meantime. But in the afternoon of April 2, 2015, the BoM became aware that the capital would not be forthcoming.
On the one hand, the bank was facing a serious liquidity crisis and on the other, it could not bring in the required capital for injection into the bank. On the basis of information available to the BoM, the run on the bank had gathered momentum. Some banks had consequential exposure to the BAI Group. In particular, some small banks had exposure to the defunct Bramer Bank. A collapse of the Bramer Bank could have triggered a contagion effect on other banks. The systemic risk had heightened. There was no silver bullet left to save the bank. The BoM had no other alternative than to revoke the banking licence of defunct Bramer Bank.
The timing of the revocation of the banking licence was unusual. Why the rush? And is it normal to revoke a banking licence around midnight?
The logistics required to close a bank and its branches during business hours are highly demanding. For instance, in the case of defunct Bramer Bank, the BoM would have needed not less than 63 officers with the support of police forces at the main office and its 20 branches to close down their operations. Once the initial step of pulling down the shutters was over, the BoM officers would have been required to take stock of cash holdings, books and records and carry out reconciliation in each branch and taking custody of the vaults in each branch. In addition to the 63 officers, at least 22 IT technicians would have been needed to shut down the IT system in each of the branches and the main office. The IT system of the defunct Bramer Bank had links with the IT system of BAI. Shutting down the connections with respect to Credit Cards and the S.W.I.F.T system by BoM staff had to be performed without any kind of disruption for businesses of third parties. These are very tedious operations; they are painful, too, in the sense that the BoM officers have to witness employees of the de-licenced bank going through the trauma of humiliation for no financial crime committed by them at their levels. Moreover, there would also have been a question of security risk for BoM staff.
Revocation of the banking licence after a bank has completely settled its business for the day obviates the need for such cumbersome logistics; it’s simply an efficient process when it’s carried out in late evening. There is no such thing as voodooism in the timing.
BANKING SECTORFINANCIAL STABILITY REPORT | AUGUST 2015

30
What about the reputational damage caused to our jurisdiction?
Many jurisdictions around the world had their breed of financial scandals. The UK had the BCCI and the Robert Maxwell cases. The Americans had the Madoff case. The Singaporeans had the Barings episode. The Caribbeans had CLICO. We are having the BAI case. As long as financial crimes, scandals etc. are uncovered and remedial actions are taken to preserve and protect the integrity of any jurisdiction, I do not believe reputation of the jurisdiction concerned should suffer consequential damage. I have been receiving foreign investors and Ambassadors lately; the feedbacks have been encouraging. Overall, we are being seen as a jurisdiction decidedly undergoing a cleansing process. It’s the way forward.
Given the size and the force of personalities behind the BAI Group, did you at any time capitulate while taking the decision to revoke the licence of the bank?
The reasons leading to the revocation of the banking licence were crystal clear; they were incontrovertible. Capitulate or not? A Governor often has to make a decisive choice in the execution of his responsibilities: to be unpopular doing the right thing or to be popular doing the wrong thing. The choice essentially boils down to what kind of a timber he is made of.
Market Concentration
Over the five-year ended March 2015, market concentration has fairly improved in the domestic banking sector, as the Herfindahl-Hirschman Index (HHI) for total assets and total deposits trended downward within the moderate band to reach 1021 and 1051 respectively. Correspondingly, the share of total assets held by the four largest banks dropped from 59.4 per cent to 52.9 per cent. In spite of an increasing number of banks in operation, the Lorenz Curve indicates that inequality in the distribution of assets
continues to permeate in the banking industry (Chart 4.2). As at end-March 2015, advances extended by four banks in the upper quartile represented a market share of 63.7 per cent of the loan portfolio, compared to 65.5 per cent recorded five years ago. The degree of market concentration is expected to gradually dilute further, with increased competition from smaller banks as well as new entrants in the banking sector. Initiatives by the Bank remain ongoing for enhancing and strengthening the regulatory framework applicable to institutions holding a banking licence (Box III).
Chart 4.2: Distribution of Banks’ Assets and Advances
0
10
20
30
40
50
60
70
80
90
100
0 10 20 30 40 50 60 70 80 90 100 Cumulative percentage of total assets
Mar-10 Mar-15
Cumulative percentage of total number of banks
Line of perfect equality
0
10
20
30
40
50
60
70
80
90
100
0 10 20 30 40 50 60 70 80 90 100 Cumulative percentage of advances
Mar-10 Mar-15
Cumulative percentage of total number of banks
Line of perfect e
quality
FINANCIAL STABILITY REPORT | AUGUST 2015BANKING SECTOR

31
Table 4.3: Financial Stability Indicators1 of Other Depository Corporations (Banks and NBDTIs2)
Core Set of Financial Soundness Indicators Mar-14 Jun-14 Sep-14 Dec-14 Mar-15Capital-basedRegulatory capital to risk-weighted assets 17.9% 17.8% 17.5% 17.1% 17.7%Regulatory Tier 1 capital to risk-weighted assets 15.5% 15.3% 15.1% 15.1% 15.4%Non-performing loans net of provisions to capital 12.7% 12.5% 12.2% 16.4% 16.4%
Asset QualityNon-performing loans to total gross loans3 4.4% 4.5% 4.5% 4.9% 5.1%Sectoral distribution of loans to total loans3
Interbank loans 0.1% 0.2% 0.5% 0.3% 0.4% Other financial corporations 1.3% 1.2% 1.6% 1.5% 1.5% Non-financial corporations 34.9% 35.3% 34.2% 33.6% 33.6% Other domestic sectors 22.0% 20.0% 19.9% 19.2% 18.6% Non-residents 41.7% 43.2% 43.7% 45.4% 45.9%
Box III: Regulatory Initiatives
Lessons learnt from the global financial crisis have demonstrated that jurisdictions should adopt a macro-prudential approach to the regulation and supervision of financial institutions, given the fact that systemic risks may pose a threat to financial stability. Against this backdrop, international standard setters are recommending the implementation of a Bank Resolution and Crisis Management Framework to deal with systemically important banks. Another key recommendation is the establishment of a deposit insurance scheme for the protection of depositors.
The Bank is currently reviewing its deposit insurance legislation in light of the Revised Core Principles on Effective Deposit Insurance Systems and developments in the Mauritian banking sector.
Notwithstanding the fact that a Bank Resolution and Crisis Management Framework is a national endeavour requiring coordinated actions among different Authorities/stakeholders, the Bank is currently considering revisiting banking legislations to address the issue.
4.2 Financial Soundness Indicators
Profitability
Over the year ended March 2015, profitability of the banking sector recorded a marginal decline mainly on the basis of downward trend of average ROA and ROE of domestic-owned banks but was partly offset by improvements in the ROA and ROE of subsidiaries of foreign-owned banks (Table 4.3, Chart 4.3 and Chart 4.4). Decreases in net interest income as well as impairment loss contributed to the decline in profitability posted by banks over the year
ended March 2015. Movements in ROA were uneven across the banking sector but remained unchanged at the aggregate level at 1.2 per cent as at end-March 2015. The significant write-off of impaired investment and loan incurred by one bank contributed to the decline in ROA of domestic-owned banks from 2.0 per cent to 1.6 per cent. During the period under review, banks’ average ROE followed almost a similar pattern to ROA. Average ROE ratios of subsidiaries of foreign banks improved, while those of domestic-owned banks and the branches of foreign bank recorded significant declines over their previous levels.
BANKING SECTORFINANCIAL STABILITY REPORT | AUGUST 2015

32
Table 4.3: Financial Stability Indicators1 of Other Depository Corporations (Banks and NBDTIs2) (Continued)
Encouraged Set of Financial Soundness Indicators Mar-14 Jun-14 Sep-14 Dec-14 Mar-15Earnings and ProfitabilityReturn on assets 1.3% 1.5% 1.5% 1.4% 1.3%Return on equity 14.6% 16.0% 16.3% 15.2% 13.7%Interest margin to gross income 72.0% 64.5% 68.2% 49.0% 64.9%Non-interest expenses to gross income 42.2% 38.1% 42.7% 36.9% 43.6%
LiquidityLiquid assets to total assets 22.6% 19.5% 22.7% 24.1% 26.0%Liquid assets to short-term liabilities 30.7% 26.3% 29.1% 30.2% 33.0%
Sensitivity to Market Risk Net open position in foreign exchange to capital 3.1% 3.8% 3.0% 2.4% 2.7%
Capital to assets 9.3% 9.8% 9.3% 9.3% 9.2%Value of large exposures to capital 193.9% 197.3% 195.5% 201.9% 190.9%Customer deposits to total (non-interbank) loans 134.3% 123.6% 131.5% 133.2% 141.5%Residential real estate loans to total loans3 8.9% 8.6% 6.2% 6.2% 6.0%Commercial real estate loans to total loans3 7.2% 6.6% 5.1% 5.0% 4.9%Trading income to total income 8.1% 10.1% 8.8% 35.4% 13.1%Personnel expenses to non-interest expenses 52.5% 52.7% 48.9% 40.8% 47.6%
Macroeconomic Indicators Mar-14 Jun-14 Sep-14 Dec-14 Mar-15Headline inflation4 4.0% 4.0% 3.9% 3.2% 2.4%Year-on-year inflation4 4.5% 3.3% 2.9% 0.2% 2.2%Key Repo Rate (end of period) 4.65% 4.65% 4.65% 4.65% 4.65%Total Public Sector Debt/GDP (end of period) 60.5% 60.7% 60.6% 61.5% 63.0%Total Public Sector External Debt/GDP (end of period) 16.1% 16.6% 16.4% 16.3% 17.5%Import coverage of Gross International Reserves (months of goods & services) 5.6 6.1 6.1 6.2 7.0Deposits/Broad Money Liabilities5 93.3% 93.4% 93.4% 92.8% 93.1%Household Debt/GDP (end of period)6 20.7% 20.8% 20.9% 20.9% 20.8%Corporate Debt/GDP (end of period)6 51.0% 49.3% 48.0% 49.1% 49.4%
2014Q1 2014Q2 2014Q3 2014Q4 2015Q1Real GDP growth4 2.4% 4.1% 3.6% 3.7% 3.7%Unemployment rate 8.0% 7.8% 7.6% 7.5% 8.7%Current account deficit/GDP 7.6% 3.6% 8.5% 2.9% 6.3%
1 FSIs are calculated on a domestic consolidation basis using the Financial Soundness Indicators Compilation Guide of the International Monetary Fund. Figures may be slightly different from other parts of this Report.
2 NBDTIs refer to Non-Bank Deposit-Taking Institutions. 3 Total loans include advances to non-residents.4 Percentage change over corresponding period of previous year.5 Rupee and foreign currency deposits from domestic banks.6 Debts contracted with banks only. Note: Figures may not add up due to rounding.Sources: Ministry of Finance and Economic Development, Statistics Mauritius and Bank of Mauritius.
FINANCIAL STABILITY REPORT | AUGUST 2015BANKING SECTOR

33
Regulatory Capital
The banking sector maintained adequate capital levels during the period under review, although differences remained between types of banks in terms of their individual capital and asset holdings (Chart 4.5). The capital adequacy ratio (CAR) for the banking sector stood at 16.6 per cent as at end-March 2015, lower than 17.0 per cent registered as at end-September 2014. In line with regulatory requirements, banks are gradually phasing-in the Basel III capital framework. The capital base of the banking sector amounted to Rs120.7 billion at the end of March 2015, with the ratio of Common Equity Tier 1(CET1) capital to total risk weighted assets being computed at 13.8 per cent. From the ownership perspective, branches of foreign-owned banks maintained the highest Tier 1 capital ratio with an average of 23.9 per cent, followed by the subsidiaries of foreign banks by 16.7 per cent, while domestic-owned banks continued to post lower Tier 1 capital ratio at 13.7 per cent.
Asset Quality
Over the year ended March 2015, non-performing loans cumulated in the banking sector and reached almost Rs32 billion, indicating a marked deterioration in the asset quality in some key sectors and pointing to rising credit and market risks. While recovery of bank credit over the past two quarters was primarily attributed to cross-border advances, the rise in NPL, however, pertained to credit extended in the domestic
market. The ratio of NPL to total credit trended up over the year and reached 4.1 per cent as at end-March 2015, reflecting a marked increase in impairment in the portfolio of credit to the private sector from 5.8 per cent to 7.1 per cent. At the sectoral level, conditions remained subdued for the tourism sector which recorded the highest rise in NPL ratio from 7.0 per cent as at end-March 2014 to 13.8 per cent as at end March 2015. This impairment was mainly attributable proactive classification of loan facilities granted to two major hotels during 2014Q4. Growth of impaired credit in the construction sector continued to decelerate over the period under review, although the corresponding NPL ratio remained at the highest level at 30.1 per cent as at end-March 2015. Following a peak of 4.1 per cent recorded as
Chart 4.3: Return on Assets of the Banking Sector
0.0
0.5
1.0
1.5
2.0
2.5
3.0
3.5
4.0
4.5
Domestic-owned banks
Subsidiaries of foreign-owned banks
Branches of foreign-owned banks
Total banking Sector
Per cent
Mar-12 Mar-13 Mar-14 Mar-15
Chart 4.5: Tier 1 Capital Ratio
13.0
13.4
13.8
14.2
14.6
15.0
15.4
0
5
10
15
20
25
30
Mar-11 Mar-12 Mar-13 Mar-14 Mar-15
Per cent Per cent
Domestic-owned banks Subsidiaries of foreign-owned banks Branches of foreign-owned banks Total banking sector (RHS)
Chart 4.4: Return on Equity of the Banking Sector
Domestic-owned banks
Subsidiaries of foreign- owned banks
Branches of foreign-owned banks
Total banking Sector
0
5
10
15
20
25
30
35
40
Per cent
Mar-12 Mar-13 Mar-14 Mar-15
BANKING SECTORFINANCIAL STABILITY REPORT | AUGUST 2015
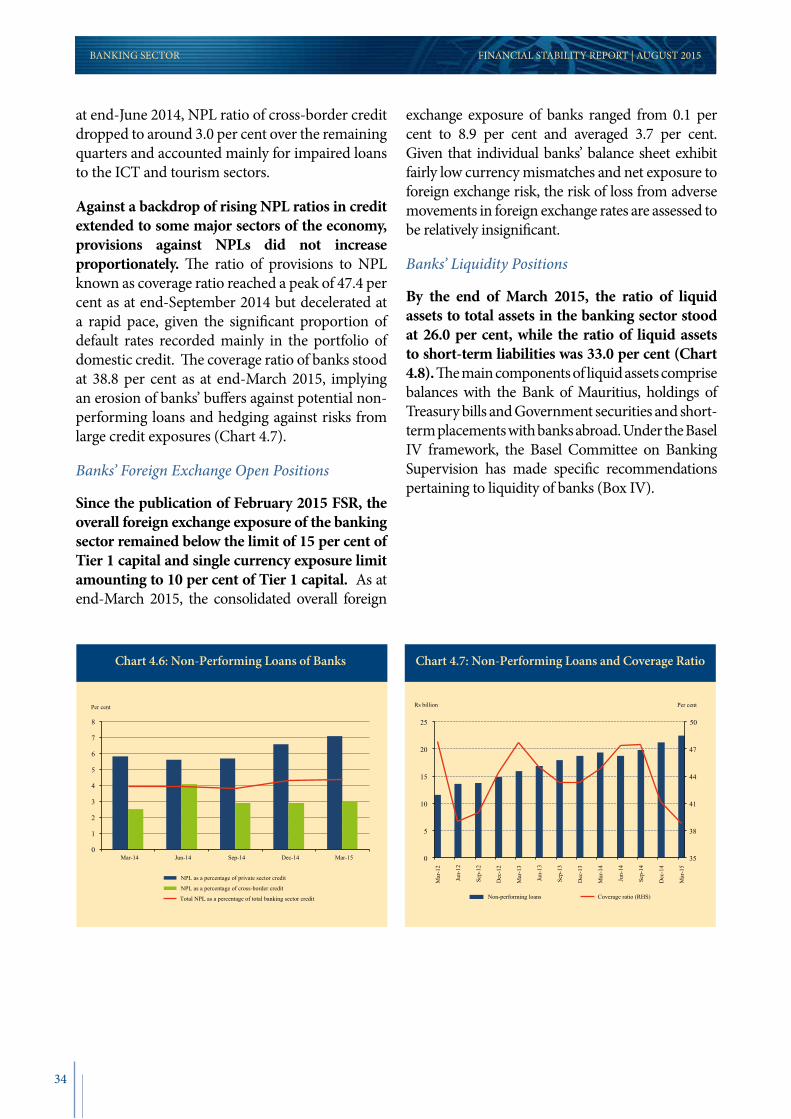
34
at end-June 2014, NPL ratio of cross-border credit dropped to around 3.0 per cent over the remaining quarters and accounted mainly for impaired loans to the ICT and tourism sectors.
Against a backdrop of rising NPL ratios in credit extended to some major sectors of the economy, provisions against NPLs did not increase proportionately. The ratio of provisions to NPL known as coverage ratio reached a peak of 47.4 per cent as at end-September 2014 but decelerated at a rapid pace, given the significant proportion of default rates recorded mainly in the portfolio of domestic credit. The coverage ratio of banks stood at 38.8 per cent as at end-March 2015, implying an erosion of banks’ buffers against potential non-performing loans and hedging against risks from large credit exposures (Chart 4.7).
Banks’ Foreign Exchange Open Positions
Since the publication of February 2015 FSR, the overall foreign exchange exposure of the banking sector remained below the limit of 15 per cent of Tier 1 capital and single currency exposure limit amounting to 10 per cent of Tier 1 capital. As at end-March 2015, the consolidated overall foreign
exchange exposure of banks ranged from 0.1 per cent to 8.9 per cent and averaged 3.7 per cent. Given that individual banks’ balance sheet exhibit fairly low currency mismatches and net exposure to foreign exchange risk, the risk of loss from adverse movements in foreign exchange rates are assessed to be relatively insignificant.
Banks’ Liquidity Positions
By the end of March 2015, the ratio of liquid assets to total assets in the banking sector stood at 26.0 per cent, while the ratio of liquid assets to short-term liabilities was 33.0 per cent (Chart 4.8). The main components of liquid assets comprise balances with the Bank of Mauritius, holdings of Treasury bills and Government securities and short-term placements with banks abroad. Under the Basel IV framework, the Basel Committee on Banking Supervision has made specific recommendations pertaining to liquidity of banks (Box IV).
FINANCIAL STABILITY REPORT | AUGUST 2015BANKING SECTOR
Chart 4.6: Non-Performing Loans of Banks
NPL as a percentage of private sector credit
NPL as a percentage of cross-border credit
Total NPL as a percentage of total banking sector credit
0
1
2
3
4
5
6
7
8
Mar-14 Jun-14 Sep-14 Dec-14 Mar-15
Per cent
Chart 4.7: Non-Performing Loans and Coverage Ratio
Non-performing loans Coverage ratio (RHS)
35
38
41
44
47
50
0
5
10
15
20
25
Mar
-12
Jun-
12
Sep-
12
Dec
-12
Mar
-13
Jun-
13
Sep-
13
Dec
-13
Mar
-14
Jun-
14
Sep-
14
Dec
-14
Mar
-15
Per centRs billion

35
BANKING SECTORFINANCIAL STABILITY REPORT | AUGUST 2015
Box IV: Liquidity Risk
Strong capital requirement is a necessary condition for banking sector stability, but by itself it is not sufficient. A strong liquidity is of equal importance. Liquidity is the ability of a bank to fund increases in assets and meet obligations as they become due, without incurring unacceptable losses. The fundamental role of banks in the maturity transformation of short-term deposits into long-term loans makes banks inherently vulnerable to liquidity risk, both as an institution as well as the system as a whole. Virtually every financial transaction or commitment has implications for a bank’s liquidity. Effective liquidity risk management helps ensure a bank’s ability to meet cash flow obligations, which are uncertain as they are affected by external events and other agents’ behaviour. Liquidity risk management is of paramount importance because a liquidity shortfall at a single institution can have system-wide repercussions.
The global financial crisis drove home the importance of liquidity in the proper functioning of financial markets and the banking sector. Prior to the turmoil, asset markets were buoyant and funding was readily available at a low cost. The reversal in market conditions illustrated how quickly liquidity can evaporate and that illiquidity can last for an extended period of time. The banking system came under severe stress, which necessitated central bank action to support both the functioning of money markets and, in a few cases, individual institutions.
The difficulties experienced by some banks were due to lapses in basic principles of liquidity risk management. In response thereto, the Basel Committee on Banking Supervision (BCBS) developed two minimum standards for funding liquidity. These standards have been developed to achieve two separate but complementary objectives.
The first objective is to promote short-term resilience of a bank’s liquidity risk profile by ensuring that it has sufficient high quality liquid resources to survive an acute stress scenario lasting up to one month. The BCBS developed the Liquidity Coverage Ratio (LCR) to achieve this objective. The LCR will help ensure that banks have sufficient unencumbered, high quality liquid assets to offset the net cash outflows it could encounter under an acute short term stress scenario. The specified scenario is built upon circumstances experienced in the global financial crisis that began in 2007 and entails both institution-specific and systemic shocks. The scenario entails a significant stress, albeit not a worst-case scenario, and assumes the following: a significant downgrade of the institution’s public credit rating; a partial loss of deposits; a loss of unsecured wholesale funding; a significant increase in secured funding haircuts; and increases in derivative collateral calls and substantial calls on contractual and non-contractual off-balance sheet exposures, including committed credit and liquidity facilities.
The second objective is to promote resilience over a longer time horizon by creating additional incentives for a bank to fund its activities with more stable sources of funding on an ongoing structural basis. The Net Stable Funding Ratio (NSFR) has been developed for this purpose. It requires a minimum amount of stable sources of funding at a bank relative to the liquidity profiles of the assets, as well as the potential for contingent liquidity needs arising from off-balance sheet commitments, over a one-year horizon. The NSFR aims to limit over-reliance on short-term wholesale funding during times of buoyant market liquidity and encourage better assessment of liquidity risk across all on- and off-balance sheet items.Source: Basel Committee on Banking Supervision.
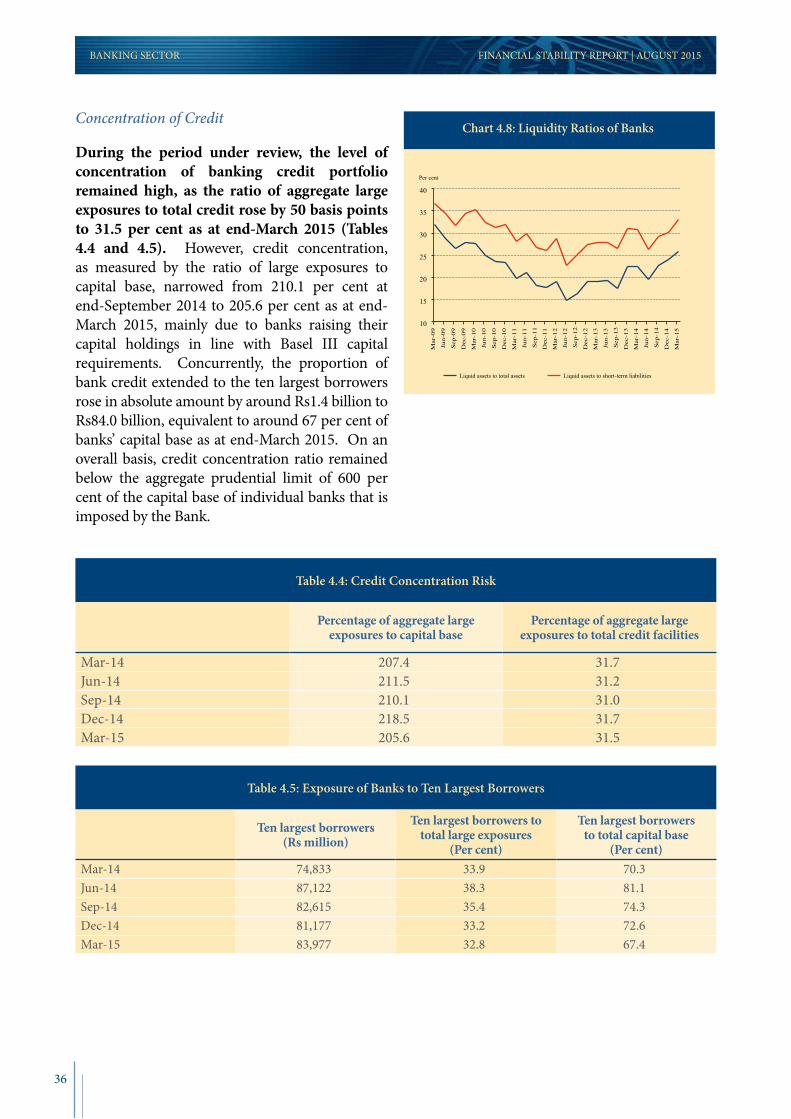
36
FINANCIAL STABILITY REPORT | AUGUST 2015BANKING SECTOR
Concentration of Credit
During the period under review, the level of concentration of banking credit portfolio remained high, as the ratio of aggregate large exposures to total credit rose by 50 basis points to 31.5 per cent as at end-March 2015 (Tables 4.4 and 4.5). However, credit concentration, as measured by the ratio of large exposures to capital base, narrowed from 210.1 per cent at end-September 2014 to 205.6 per cent as at end-March 2015, mainly due to banks raising their capital holdings in line with Basel III capital requirements. Concurrently, the proportion of bank credit extended to the ten largest borrowers rose in absolute amount by around Rs1.4 billion to Rs84.0 billion, equivalent to around 67 per cent of banks’ capital base as at end-March 2015. On an overall basis, credit concentration ratio remained below the aggregate prudential limit of 600 per cent of the capital base of individual banks that is imposed by the Bank.
Chart 4.8: Liquidity Ratios of Banks
10
15
20
25
30
35
40
Mar
-09
Jun-
09
Sep
-09
Dec
-09
Mar
-10
Jun-
10
Sep
-10
Dec
-10
Mar
-11
Jun-
11
Sep
-11
Dec
-11
Mar
-12
Jun-
12
Sep
-12
Dec
-12
Mar
-13
Jun-
13
Sep
-13
Dec
-13
Mar
-14
Jun-
14
Sep
-14
Dec
-14
Mar
-15
Liquid assets to total assets Liquid assets to short-term liabilities
Per cent
Table 4.4: Credit Concentration Risk
Percentage of aggregate large exposures to capital base
Percentage of aggregate large exposures to total credit facilities
Mar-14 207.4 31.7Jun-14 211.5 31.2Sep-14 210.1 31.0Dec-14 218.5 31.7Mar-15 205.6 31.5
Table 4.5: Exposure of Banks to Ten Largest Borrowers
Ten largest borrowers (Rs million)
Ten largest borrowers to total large exposures
(Per cent)
Ten largest borrowers to total capital base
(Per cent)Mar-14 74,833 33.9 70.3Jun-14 87,122 38.3 81.1Sep-14 82,615 35.4 74.3Dec-14 81,177 33.2 72.6Mar-15 83,977 32.8 67.4

37
SECTIONNON-BANK FINANCIAL INTERMEDIARIESFINANCIAL STABILITY REPORT | AUGUST 2015
Non-bank financial intermediaries in Mauritius comprise the non-bank deposit-taking sector and the insurance sector. A brief analysis of key financial indicators of these intermediaries is presented below.
5.1 Non-Bank Deposit-Taking Sector
Non-Bank Deposit-Taking Institutions’ (NBDTIs’) main activity relates to the mobilisation of deposits and the granting of leasing and loan facilities to individuals and corporates. There were eight NBDTIs in operation as at end-March 2015. The sector maintained its soundness and stable since the February 2015 issue of the FSR and business operations continued to increase steadily during the period under review. Total assets of NBDTIs represented 5.2 per cent of total banking assets as at end-March 2015, down from 5.7 per cent in the corresponding period of 2014. As a share of GDP, assets of NBDTIs stood at 16.8 per cent, higher than 16.0 per cent as at end-March 2014.
Balance Sheet Structure
Total assets of NBDTIs grew by 11.1 per cent in the year to end-March 2015 compared to 10.0 per cent in the corresponding period of 2014. In contrast, both loan and leasing facilities registered lower expansion than in the previous period under review. Except for ‘manufacturing’, growth in credit extended to the main sectors slowed down as at end-March 2015. Loan and leasing facilities accounted for 74.0 per cent of total assets of NBDTIs.
On the liabilities side, deposits comprised 59.6 per cent of the total and recorded a higher expansion of 8.0 per cent as at end-March 2015 compared with 5.1 per cent in the corresponding period in 2014 (Chart 5.1). The higher pace of deposit growth resulted from funds mobilised mainly by six institutions in the sector.
Liquidity
With liquidity ratios above the statutory minimum of 10 per cent over the year to end-March 2015, NBDTIs remained relatively liquid. The liquid assets to total assets ratio increased from 11.9 per cent a year ago to 12.8 per cent as at end-March 2015. The liquid assets to total deposits ratio also rose from 19.3 per cent as at end-March 2014 to 21.5 per cent, partly as a result of NBDTIs accumulating liquid assets over the year specifically in the form of balances held with commercial banks (Chart 5.2).
5. Non-Bank Financial Intermediaries
Chart 5.2: Liquidity Indicators of NBDTIs
11.0
11.5
12.0
12.5
13.0
13.5
14.0
14.5
15.0
17
18
19
20
21
22
23
24
25
Mar
-12
Jun-
12
Sep-
12
Dec
-12
Mar
-13
Jun-
13
Sep-
13
Dec
-13
Mar
-14
Jun-
14
Sep-
14
Dec
-14
Mar
-15
Liquid assets/deposits Liquid assets/total assets (RHS)
Per cent Per cent
Chart 5.1: Y-o-y Growth ofTotal Assets and Deposits
-2
0
2
4
6
8
10
12
14
16
Mar
-12
Jun-
12
Sep-
12
Dec
-12
Mar
-13
Jun-
13
Sep-
13
Dec
-13
Mar
-14
Jun-
14
Sep-
14
Dec
-14
Mar
-15
Total assets Total deposits
Per cent

38
Capital Adequacy
The NBDT sector is assessed as sound and adequately capitalized having reported an aggregate CAR of 25.9 per cent as at end-March 2015 compared to 25.2 per cent a year ago. With the current level of capitalisation, NBDTIs remain in a position to face shocks to their balance sheets and absorb losses. Assets of NBDTIs remained concentrated in the 50 per cent and 100 per cent risk-weight buckets, which accounted for 47.7 per cent and 21.7 per cent, respectively, of total NBDTIs’ assets as at end-March 2015 (Chart 5.3).
Sectoral Credit and NPL
Credit extended by NBDTIs represented a proportion of 17.5 per cent of the total private sector credit extended by banks as at end-March 2015. Credit granted by NBDTIs was mainly directed to the personal and construction sectors, with shares of 67.9 per cent and 15.3 per cent, respectively. Credit to the traders, manufacturing, tourism and financial and business services sectors accounted for 2.9 per cent, 2.8 per cent, 1.8 per cent and 1.4 per cent, respectively, of the total credit by NBDTIs. Credit extended by NBDTIs went up by 10.0 per cent as at end-March 2015, from 15.2 per cent in the corresponding period of 2014.
Asset quality of NBDTIs deteriorated significantly, with the ratio of NPL to total credit rising to 6.2 per cent as at end-March 2015, from 5.0 per cent in the corresponding period of 2014. Among the main sectors, the construction and tourism sector registered
declines in their NPL ratios compared to a year earlier. Despite a marginal decline in the construction sector, the NPL ratio stood at 20.9 per cent, the highest among all sectors. The personal sector, to which the largest share of NBDTIs’ credit is directed, had the lowest NPL ratio, at 2.3 per cent, same as the tourism sector (Chart 5.4). The manufacturing sector recorded the highest increase in NPL over the year, at 11.0 per cent as at end-March 2015. The buffers kept by NBDTIs to absorb losses were eroded as their coverage ratio dropped from 40.6 per cent to 37.8 per cent as at end-March 2015.
5.2 Insurance Sector
The insurance sector registered a sound performance in 2014 and accounted for 33.7 per cent of GDP. Total assets of the sector increased by 8.3 per cent in 2014 to Rs130.3 billion and gross premium increased by 12.5 per cent to Rs24.8 billion. This represented a penetration rate of around 6.0 per cent. Total loans to households by insurance companies increased by 7.6 per cent, while housing loans went up by 6.8 per cent in 2014. Total NPLs arising from these loans increased by 10.5 per cent in 2014.
The life segment is the main component in the insurance sector. Total assets for the life insurance industry grew by 8.3 per cent in 2014 to Rs115.0 billion and total net premium grew by 10 per cent to reach Rs15.9 billion. Investment in equities and debt securities represented 20 per cent and 12 per
FINANCIAL STABILITY REPORT | AUGUST 2015NON-BANK FINANCIAL INTERMEDIARIES
0
4
8
12
16
20
24
28
32
0% 20% 35% 50% 75% 100%
Mar-14 Jun-14 Sep-14 Dec-14 Mar-15
Rs billion
Chart 5.4: NPL as a ratio of Sectoral Creditin Key Sectors
0
5
10
15
20
25
Personal Construction Traders Manufacturing Tourism
Mar-12 Mar-13 Mar-14 Sep-14 Mar-15
Per cent

39
cent of total assets, respectively. ROA and ROE dropped to 8 per cent and 82 per cent, respectively, attributed mainly to a fall of 22 per cent of net income (Chart 5.5).
By contrast, total assets in the general insurance sector rose by 8.5 per cent to Rs15.1 billion in 2014. Total net premiums in the general insurance sector reached Rs4.4 billion. Profitability improved, with increases in ROA and ROE to 8 per cent and 18 per cent, respectively. The claims and expense ratios increased to 81 per cent and 90 per cent, respectively, as a result of increased benefits and expenses (Chart 5.6).
The combined ratio measures claims losses and operating expenses against premiums earned for
general insurance. The combined ratio dropped by 4 percentage points to 83 per cent in 2014, explained by an increase of 3 per cent in net earned premium and a decline of 1 per cent in total expenses. A combined ratio of over 100 per cent indicates that insurers need to increase reliance on investment income to cover underwriting losses.
In the long term insurance segment, three largest companies having gross premiums exceeding Rs1 billion represented a market share of 89 per cent in terms of Life Fund in 2014. Their average gross premiums amounted to Rs5.1 million, at an average solvency margin of 295 per cent. Comparatively, the three largest companies in the general insurance business held a market share of 67 per cent in terms of gross premiums and their average gross
SECTIONNON-BANK FINANCIAL INTERMEDIARIESFINANCIAL STABILITY REPORT | AUGUST 2015
Per cent Per cent Per cent Per cent
5
6
7
8
9
10
11
12
13
14
60
80
100
120
140
160
180
200
220
240
2009 2010 2011 2012 2013 2014
Life Insurance
Return on Equity Return on Assets
14
15
16
17
18
19
20
21
22
23
24
6
7
8
9
10
11
2009 2010 2011 2012 2013 2014
General Insurance
Return on Assets Return on Equity
Chart 5.5: ROE and ROA
Per cent Per cent
50
60
70
80
90
100
2004 2005 2006 2007 2008 2009 2010 2011 2012 2013 2014
Life Insurance
Claims Ratio Combined Ratio Expense Ratio
80
85
90
95
100
105
110
115
120
2004 2005 2006 2007 2008 2009 2010 2011 2012 2013 2014
General Insurance
Chart 5.6: Claims and Expense Ratios
Source: Financial Services Commission.
Source: Financial Services Commission.

40
premiums amount to Rs1.6 million, at an average solvency margin in 236 per cent. The Herfindahl- Hirschman Index for gross premiums stood at 3,403 and 1,685 for long term insurance and general insurance, respectively, in 2014, indicating a decrease in competition and an increase of market power in the insurance sector.
Several developments have taken place in the insurance sector since publication of the February 2015 issue of the FSR. In April 2015, the insurance sector was marked by the placing into conservatorship of the BAI Co (Mtius) Ltd8, a lead company providing life insurance cover and having a significant market share in Accident and Health covers. In the wake of the financial scam, the Insurance Act 2005 was amended to bring urgent remedial actions for immediate protection of insurance policyholders.
Insurance companies held Rs12.1 billion in terms of cash and deposits at banks in as at end-December 2014 and invested Rs5.7 billion in the equity of local banks. Their overdraft facilities from banks stood at Rs239.9 million. Although assets of insurance companies held with banks are not considered substantial, it is important to gauge the interlinkages between banks and insurance companies. It is essential to assess whether there is any potential for systemic risk to emerge in the insurance sector, given that it is interconnected with other financial intermediaries. At the same time, solvency problems in the banking sector could spill over to insurance companies.
FINANCIAL STABILITY REPORT | AUGUST 2015NON-BANK FINANCIAL INTERMEDIARIES
8 An insurer licensed under the Insurance Act 2005 to carry on Long Term Insurance Business and authorised under Section 8 of Insurance Act 2005 to carry on Accident and Health insurance business on an incidental basis.
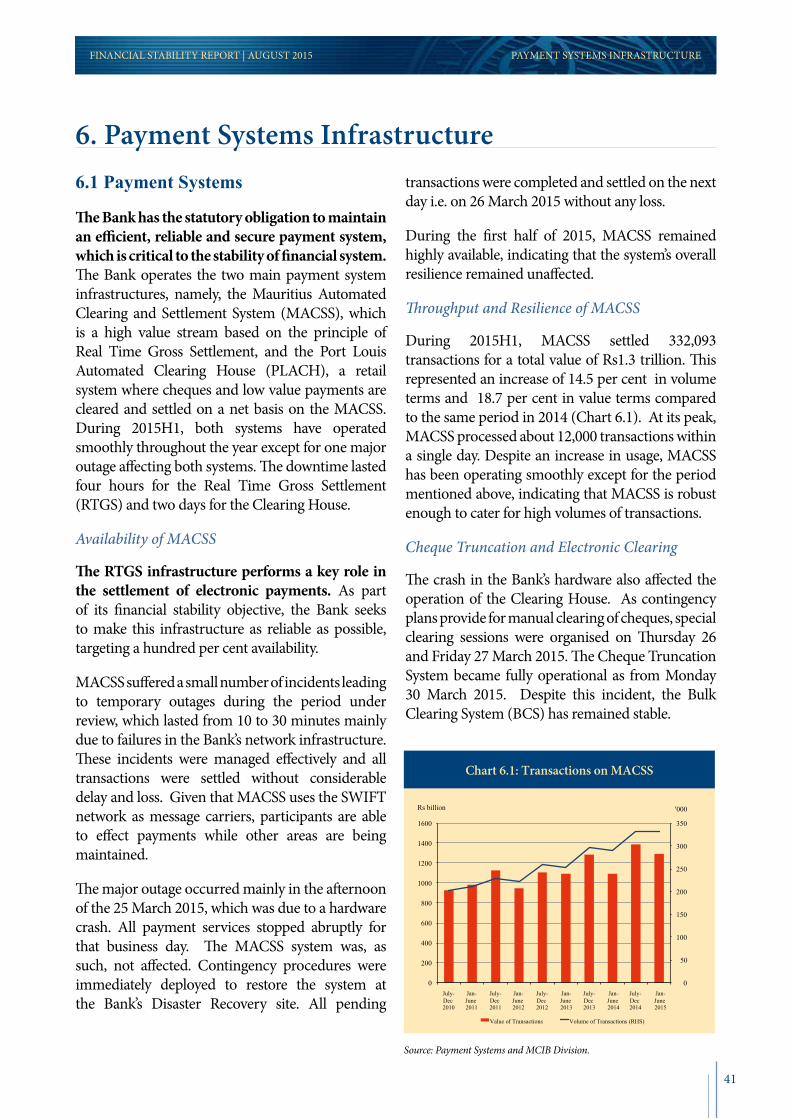
41
SECTIONPAYMENT SYSTEMS INFRASTRUCTUREFINANCIAL STABILITY REPORT | AUGUST 2015
6.1 Payment Systems
The Bank has the statutory obligation to maintain an efficient, reliable and secure payment system, which is critical to the stability of financial system. The Bank operates the two main payment system infrastructures, namely, the Mauritius Automated Clearing and Settlement System (MACSS), which is a high value stream based on the principle of Real Time Gross Settlement, and the Port Louis Automated Clearing House (PLACH), a retail system where cheques and low value payments are cleared and settled on a net basis on the MACSS. During 2015H1, both systems have operated smoothly throughout the year except for one major outage affecting both systems. The downtime lasted four hours for the Real Time Gross Settlement (RTGS) and two days for the Clearing House.
Availability of MACSS
The RTGS infrastructure performs a key role in the settlement of electronic payments. As part of its financial stability objective, the Bank seeks to make this infrastructure as reliable as possible, targeting a hundred per cent availability.
MACSS suffered a small number of incidents leading to temporary outages during the period under review, which lasted from 10 to 30 minutes mainly due to failures in the Bank’s network infrastructure. These incidents were managed effectively and all transactions were settled without considerable delay and loss. Given that MACSS uses the SWIFT network as message carriers, participants are able to effect payments while other areas are being maintained.
The major outage occurred mainly in the afternoon of the 25 March 2015, which was due to a hardware crash. All payment services stopped abruptly for that business day. The MACSS system was, as such, not affected. Contingency procedures were immediately deployed to restore the system at the Bank’s Disaster Recovery site. All pending
transactions were completed and settled on the next day i.e. on 26 March 2015 without any loss.
During the first half of 2015, MACSS remained highly available, indicating that the system’s overall resilience remained unaffected.
Throughput and Resilience of MACSS
During 2015H1, MACSS settled 332,093 transactions for a total value of Rs1.3 trillion. This represented an increase of 14.5 per cent in volume terms and 18.7 per cent in value terms compared to the same period in 2014 (Chart 6.1). At its peak, MACSS processed about 12,000 transactions within a single day. Despite an increase in usage, MACSS has been operating smoothly except for the period mentioned above, indicating that MACSS is robust enough to cater for high volumes of transactions.
Cheque Truncation and Electronic Clearing
The crash in the Bank’s hardware also affected the operation of the Clearing House. As contingency plans provide for manual clearing of cheques, special clearing sessions were organised on Thursday 26 and Friday 27 March 2015. The Cheque Truncation System became fully operational as from Monday 30 March 2015. Despite this incident, the Bulk Clearing System (BCS) has remained stable.
6. Payment Systems Infrastructure
Chart 6.1: Transactions on MACSS
0
50
100
150
200
250
300
350
0
200
400
600
800
1000
1200
1400
1600
July-Dec 2010
Jan-June 2011
July-Dec 2011
Jan-June 2012
July-Dec 2012
Jan-June 2013
July-Dec 2013
Jan-June 2014
July-Dec 2014
Jan-June 2015
'000Rs billion
Value of Transactions Volume of Transactions (RHS)
Source: Payment Systems and MCIB Division.

42
Throughput on Bulk Clearing System
During the first six months of 2015, a volume of 2,175,161 cheques were cleared compared to 2,402,487 cheques during the same period in 2014, representing a fall of 10.5 per cent. Consequently, the total value of cheques cleared, which stood at Rs126.1 billion in 2014H1 also dropped by 8.7 per cent to reach a total value of Rs115.1 billion in 2015H1(Chart 6.2).
The BCS cleared 1.5 million EFT for a total value of Rs44.8 billion, which represented 38.9 per cent of the value of cheques cleared. The volume and value of this instrument cleared during the first semester of 2015 increased by 0.6 per cent and 17.8 per cent, respectively, compared with the same period of 2014. This clearly indicates an increasing use of this mode of payment.
The network infrastructure supporting cheque and EFT clearing was robust enough to handle the volume of cheques and their data contents and the system performed very well even during peak periods. Moreover, a fall in the number and value of cheques cleared has a positive impact on the financial stability of the system, given the risks associated with cheques.
MACSS and PLACH Business Continuity Procedures
The Bank’s major payment system infrastructures were not available for a half day following the crash on its IT system. In this regard, the Bank had to come up with immediate actions as a number of technological risks associated with the system were left unattended. The critical applications of the Bank, mainly the payment systems applications are now running on latest platforms with real time replication to the Bank’s Disaster Recovery (DR) site. In case of disaster at the main site, operations are shifted almost instantaneously to the DR site. Fall-back procedures have been defined and communicated to banks. Regular fall-back tests will
be carried out with participant banks, every quarter, during the months of August, November, February and May.
A MACSS fall-back connectivity test was carried out on 13 May 2015 and a half-day switch-over on 14 May 2015 with the objective of testing operational procedures as well as the system’s capability to switch to and run from another environment. The operations, which were carried out from the Bank’s Disaster Recovery site, were successful. Neither slowness nor disruption were noticed. On the day following the fall-back test, operations resumed smoothly at the main site without any data loss.
The Bank also held a full day operation of PLACH from its Disaster Recovery site on Tuesday 19 May 2015. The operations were successfully carried out with no slowness or disruptions. On 20 May 2015, operations of PLACH resumed smoothly at the main site without any data loss.
Overall, the payment system infrastructure in Mauritius remains robust enough to cater for the needs of the banking sector. The Bank maintains a rigorous oversight of the infrastructure and keeps up with latest technological advances to ensure that no major disruption to operations weaken the payment system infrastructure.
FINANCIAL STABILITY REPORT | AUGUST 2015PAYMENT SYSTEMS INFRASTRUCTURE
Chart 6.2: Volume of Cheques and EFT on BCS
0
500
1,000
1,500
2,000
2,500
3,000
Jan-June 2012
July-Dec 2012
Jan-June 2013
July-Dec 2013
Jan-June 2014
July-Dec 2014
Jan-June 2015
Rs'000
Number of Cheques Number of EFTs
Source: Payment Systems and MCIB Division.
43
SECTIONRISK ANALYSISFINANCIAL STABILITY REPORT | AUGUST 2015
This section analyses the main risks to stability of the domestic financial system stemming from global economic environment, domestic macroeconomic performance, trends in the level of household and corporate indebtedness, financial soundness indicators pertaining to domestic banks’ and non-
banks, and issues relating to the performance of the payments system. A summary of the risks - as identified as at end-June 2015 - is provided in the graphical presentation below, while focusing on the likelihood of the impact of these factors on financial system stability.
7. Risk Analysis
Table 7.1: Risks to Financial Stability for the Upcoming Six Months
RiskProbability
ChangeProbability1
Global EconomyGlobal economic slowdown Down êOil price Unchanged èFood prices Unchanged èVolatility (ViX) Up é
Domestic EconomyEconomic growth Down êInflation Unchanged èDomestic savings Unchanged è
Household Debt RisksHousehold debt-to-disposable income Unchanged èHousehold debt service-to-disposable income Unchanged è
Corporate Debt RisksCorporate debt-to-GDP Unchanged èReturn on equity Unchanged èLeverage Unchanged è
BankingLarge exposures Down êReturn on equity Up éAsset quality (domestic market) Unchanged èCross-border exposures Unchanged è
Risk analysis keyHigh Medium Low
6 5 4 3 2 1
1 Change between June 2015 and December 2015.Source: Bank of Mauritius staff estimates.

44
Being a small open economy, Mauritius remains highly exposed to changes and volatility in global trade and finance. Although low commodity and energy prices have supported private consumption to some extent, the sustained decline in the investment rate reflects lower growth in private investment which points to a lack of viable projects apt to promote economic prosperity. With the Government inclined to revisit projects that did not materialise, the proposed schemes might be insufficient to accelerate future growth and promote stability of the financial system. Further, the morose outlook continue to permeate in the global economy - including the enduring financial weaknesses in the euro area - and is likely to impact negatively on income earnings from exports and the tourism sector. Close monitoring is also warranted with respect to international flows pertaining to Global Business Companies in the form of net FDI or portfolio investments.
Household indebtedness as measured as a share of disposable income is comparable with regional and some selected countries. The Bank, however, remains concerned amid significant credit accumulation in a low interest rate environment and it is imperative that caution be exercised in credit appraisals. Resulting NPLs from household credit will have to be closely monitored to assess repayment capacity and case-by-case monitoring of problem loans are warranted with a view to detecting emerging pockets of vulnerabilities and early signs of defaults.
The level of corporate indebtedness, as a share of GDP, has remained almost flat, given the recent deceleration of credit to the private sector. Nevertheless, leverage ratios in major sectors namely tourism, construction and real estate, traders and financial services are higher than in comparator countries. While several corporates are undertaking to reschedule their debt portfolios held with banks, recurrent cash flow problems faced by these entities call for deleveraging and a restructuring framework incorporating injection of capital and shareholders’ funds.
Banks continue to operate with strong capital adequacy ratios. Despite a significant increase in total assets, driven mainly by foreign assets of domestic-owned banks and subsidiaries of foreign-owned banks, profitability recorded a marginal decline over the year ended March 2015.
Effective January 2014, credit limits have been set in terms of loan-to-value (LTV) ratios and debt-to-income (DTI) ratios with a view to containing risks that were perceived to emerge in bank credit extended to the construction sector. Nonetheless, the impact of the macroprudential measures has yet to be assessed to evaluate whether there has been prevention of excessive leverage in the sector. Concurrently, the banking system remains highly exposed to credit concentration risk, given the underlying risk of failure of large borrowers or groups of connected borrowers who are unable to service their bank debt. This situation might be reflected in the rising trend in NPL recorded over the past six months for the tourism sector. Given the significant decline in the coverage ratio reported at end-March 2015, banks might be advised to raise their specific provisions in view of consolidating their buffers against potential future losses.
The financial system also faces operational risk stemming from cyber attacks that are committed at individual institution level. Despite the view that IT security breach is presently at a moderate level, efforts must be deployed to combat cybercrime and build resilience against threats of disruption of the operational capacity of the financial system.
The insurance sector remains fairly small (relative to banks in the financial sector), with insurance claims’ on the domestic banking sector being around Rs15 billion compared to total bank deposits of about Rs365 billion. The recent financial scandal that rocked the BAI group clearly points to dangers of inter-linkages between institutions within a financial conglomerate - specifically between a bank and its sister companies engaged in investment and insurance business. It is imperative that coordination between the Bank and the FSC be enhanced with a
FINANCIAL STABILITY REPORT | AUGUST 2015RISK ANALYSIS

45
view to improving the exchange of information as well as consolidating the regulatory and supervisory framework applicable to the financial sector.
The major outage in the MACSS and PLACH systems that occurred in March 2015 points to operational risks that remain inherent in technological infrastructure, despite the engagement taken to insulate the system against all disruptions. Remedial action was taken
immediately and the payment systems applications are now running on latest platforms with real time replication to the Bank’s Disaster Recovery site. The Bank remains committed to the endorsement of a strategy aimed to fully secure real time settlement interbank transactions along with implementation of cost effective clearing systems for small value transactions.
SECTIONRISK ANALYSISFINANCIAL STABILITY REPORT | AUGUST 2015

46
SECTION
2.1 Volatility Index
2.2 Mauritius: Gross Fixed Capital Formation, Investment, and ICOR
2.3 SEMDEX and SEM-10 Indices
2.4 Foreign Investment on the SEM
2.5 Evolution of the Rupee against other Major Currencies
3.1 Y-o-y Growth of Credit to Households
3.2 Share of Credit Extended by Banks to Households and Corporates
3.3 Household Debt to Disposable Income
3.4 Alternative Estimates of Household Indebtedness Ratio
3.5 Credit-to-GDP Gap – Household Credit
3.6 Household Debt Service Cost in Selected Countries
3.7 Advanced Economies: Corporate Debt to GDP Ratio
3.8 Household Debt Service Cost and Interest Rates
3.9 Household Debt Service Cost in Selected Countries
3.10 Corporate Debt to GDP Ratio in Selected Countries
3.11 Credit to GDP Gap
4.1 Banking Sector Assets
4.2 Distribution of Banks’ Assets and Advances
4.3 Return on Assets of the Banking Sector
4.4 Return onv Equity of the Banking Sector
4.5 Tier 1 Capital Ratio
4.6 Non-Performing Loans of Banks
4.7 Non-Performing Loans and Coverage Ratio
4.8 Liquidity Ratios of Banks
5.1 Y-o-y Growth of Total Assets and Deposits
5.2 Liquidity Indicators of NBDTIs
5.3 Risk Diversification Matrix of NBDTIs
5.4 NPL as a ratio of Sectoral Credit in Key Sectors
5.5 ROE and ROA
5.6 Claims and Expense Ratios
6.1 Transactions on MACSS
6.2 Volume of Cheques and EFT on BCS
List of Charts
FINANCIAL STABILITY REPORT | AUGUST 2015LIST OF CHARTS, TABLES, AND BOXES
2.1 Saving-Investment Balance
2.2 Other Depository Corporations Composition of Gross Foreign Assets
3.1 Domestic and External Debt Indicators
3.2 Distribution of Credit to the Private Sector
4.1 Banks’ Assets by Type of Bank and Asset, 2012- 2014
4.2 ODCs’ Balance Sheet, 2011-2015
4.3 Financial Stability Indicators of Other Depository Corporations (Banks and NBDTIs)
4.4 Credit Concentration Risk
4.5 Exposure of Banks to Ten Largest Borrowers
7.1 Risks to Financial Stability for the Upcoming Six Months
Box I Channels through Which Monetary Policy Can Affect Financial Stability
Box II Exclusive Interview by the Governor
Box III Regulatory Initiatives
Box IV Liquidity Risk
List of Tables
List of Boxes

47
ACRONYMSFINANCIAL STABILITY REPORT | AUGUST 2015
BCBS Basel Committee on Banking
Supervision
BoJ Bank of Japan
BoP Balance of Payments
BRICS Brazil, Russia, India, China and South Africa
CAR Capital Adequacy Ratio
CDOs Collateralized-debt obligations
CET Common Equity Tier
DSGE Dynamic Stochastic General Equilibruim
DTI Debt-to-Income
ECB European Central Bank
EFT Electronic Fund Transfers
FDI Foreign Direct Investment
US Fed Federal Reserve
FSC Financial Services Commission
FSR Financial Stability Report
GBCs Global Business Companies
GDFCF Gross Domestic Fixed Capital Formation
GDP Gross Domestic Product
GFCF Gross Fixed Capital Formation
ICOR Incremental Capital Output Ratio
IMF International Monetary Fund
KRR Key Repo Rate
LCR Liquidity Coverage Ratio
LTV Loan-to-Value
MACSS Mauritius Automated Clearing and Settlement System
MERI Mauritius Exchange Rate Index
NBDTIs Non-Bank Deposit-Taking Institutions
NPL Non-Performing Loans
ODC Other Depository Corporations
PLACH Port Louis Automated Clearing House
ROA Return on Assets
ROE Return on Equity
RTGS Real Time Gross Settlement
SEM Stock Exchange of Mauritius
WEO World Economic Outlook
Y-o-y Year-on-year
Acronyms

48
Basis point is a unit equal to one hundredth of a percentage point.
Cross-border exposures refer to exposures of banks outside Mauritius.
GBC1s are resident corporations which conduct business outside Mauritius. The law has recently been amended to allow them to transact with residents provided that their activities in Mauritius are ancillary to their core business with non-residents.
The Herfindahl–Hirschman Index is a measure of the size of firms in relation to the industry and an indicator of the amount of competition among them. It is a commonly accepted measure of market concentration.
MERI1 is the Mauritius Exchange Rate Index, a nominal effective exchange rate introduced in July 2008, based on the currency distribution of merchandise trade.
MERI2 is the Mauritius Exchange Rate Index, a nominal effective exchange rate introduced in July 2008, based on the currency distribution of merchandise trade and tourist earnings.
ROA is the annualised pre-tax return on assets and is measured by the ratio of pre-tax profit to average assets.
ROE is the annualised pre-tax return on equity and is measured by the ratio of pre-tax profit to average equity.
SEMDEX is an index of prices of all listed shares on the Stock Exchange of Mauritius and each stock is weighted according to its share in the total market capitalisation.
SEM-10 is an index launched by the Stock Exchange of Mauritius on 02 October 2014. It is designed to meet international standards and provide a larger and more attractive investible benchmark for both domestic and foreign market participants and comprises the ten largest eligible shares of the Official Market, measured in terms of average market capitalization, liquidity and investibility criteria.
Tier 1 capital is a term used to qualify eligible capital of a bank and constitute the component having the highest loss-absorbing capacity.
Y-o-y change compares the value of a variable at one period in time compared with the same period the previous year.
Glossary
Printed by Précigraph Limited
FINANCIAL STABILITY REPORT | AUGUST 2015GLOSSARY

BANK OF MAURITIUS
Address Sir William Newton Street Port Louis Mauritius
Website https://www.bom.mu ISSN: 1694-2353