Financial Solutions - MENU · Financial Solutions are reinsurance solutions designed primarily to...
31
Financial Solutions Contingent Finance for Life Insurance Companies Chantal Cardinez, FIA Chief Business Development Officer Hannover Life Reassurance Bermuda Limited IAA Colloquium 2015, Oslo, Norway 7th to 10th June 2015
Transcript of Financial Solutions - MENU · Financial Solutions are reinsurance solutions designed primarily to...

Financial SolutionsContingent Finance for Life Insurance Companies
Chantal Cardinez, FIAChief Business Development OfficerHannover Life Reassurance Bermuda Limited
IAA Colloquium 2015, Oslo, Norway7th to 10th June 2015

Today’s Presentation
Brief Introduction to Financial Solutions Life Office Model under Solvency II Straightforward Financial Solutions Contingent Financial Solutions Discussions
2
Brief Introduction to Financial Solutions

What are Financial Solutions?
Financial Solutions are reinsurance solutions designed primarily to meet a specific financial objective for the cedant.
It is different from traditional reinsurance solutions which are primarily aimed at transferring and managing biometric risks for the cedant.
Asset Liability
Management
Corporate Activity
Tax Optimisation
Redundant Reserves
Relief
Performance Management
Behavioral Capital Relief
4

Financial Solutions
Capital Structure OptimisationBeating the Risk Reward Trade-off
Price Inexpensiveness
Rep
aym
ent F
lexi
bilit
y
Equity
Debt
LessExpensive
Price leverages off Hannover Re’s market position, financial strength ratings, efficient capital structure
and sound risk management
Repayment contingent upon future cash flows which are specifically
and consultatively determined
MoreFlexible
WACCROE
Gearing
5
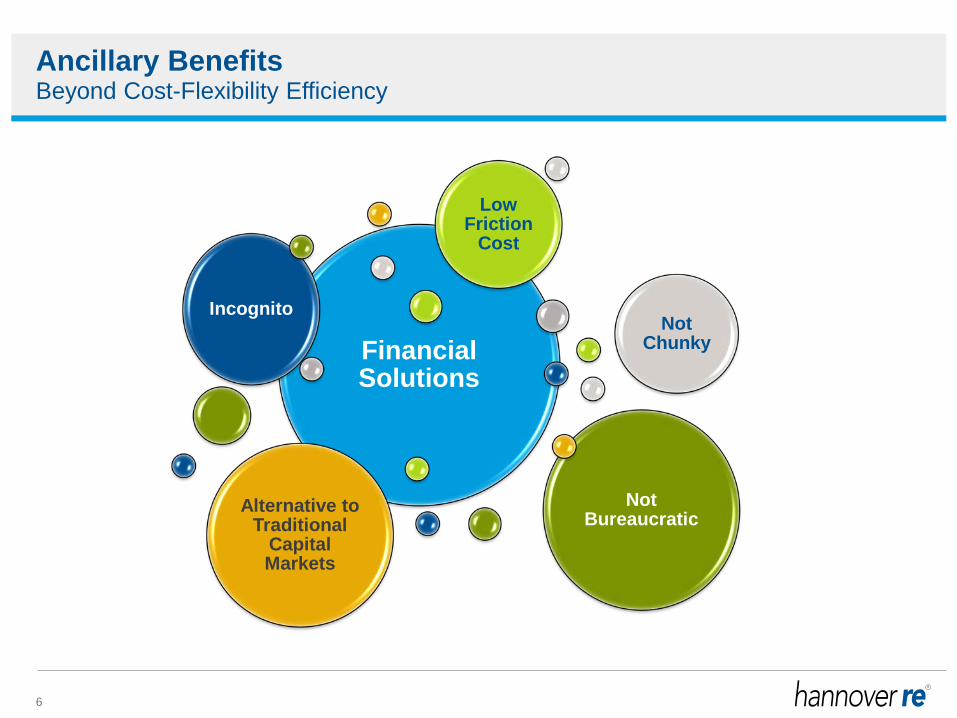
Ancillary Benefits
Financial Solutions
IncognitoNot
Chunky
Not Bureaucratic
Alternative to Traditional
Capital Markets
Low Friction
Cost
Beyond Cost-Flexibility Efficiency
6

Life Office Model under Solvency II

Cash Flows Without Reinsurance
Year Premium Expense Claims ΔTP Interest RI Profits BEL RM SCR1 306 (31) (278) (19) 5 - 22 28 149 415 2 291 (29) (265) (18) 4 - 20 26 131 386 3 277 (28) (251) (17) 4 - 18 24 115 357 4 263 (26) (239) (15) 3 - 16 22 101 330 5 250 (25) (227) (14) 3 - 15 20 87 303 6 237 (24) (216) (13) 3 - 13 19 75 278 … … … … … … … … … … …
In-force block of plain vanilla term assurance business
8

Solvency Position Without Reinsurance
Assets700
Financial resources(best estimate)
Equity523
BEL 28
Available resources
RM 149
Risk Margin
Best estimate liability
“Technical provisions”
Contains “traditional” reserves and future profits
= PV(claims) +PV(expenses)
–PV(premiums)…on BE assumptions
approximated with duration approach
9

Solvency Position Without Reinsurance
Assets700
Financial resources(best estimate)
Equity523
Technical provisions
177
Required resources
Assets700
Financial resources (after mort stress)
Equity108
Technical provisions
592
+15% mortality
SCR 415
Capital Available 523Capital Required 415Solvency Ratio 126%
10

Only mortality SCR is modelled, under the context of Solvency II standard model.• Deterministic model is used.
Whilst reinsurance counterparty SCR should be a key feature of the model, it is omitted as the results were immaterial.
MCR requirements are ignored.
Solvency Position Without ReinsuranceSome Simplifications
11

Straightforward Financial Solutions
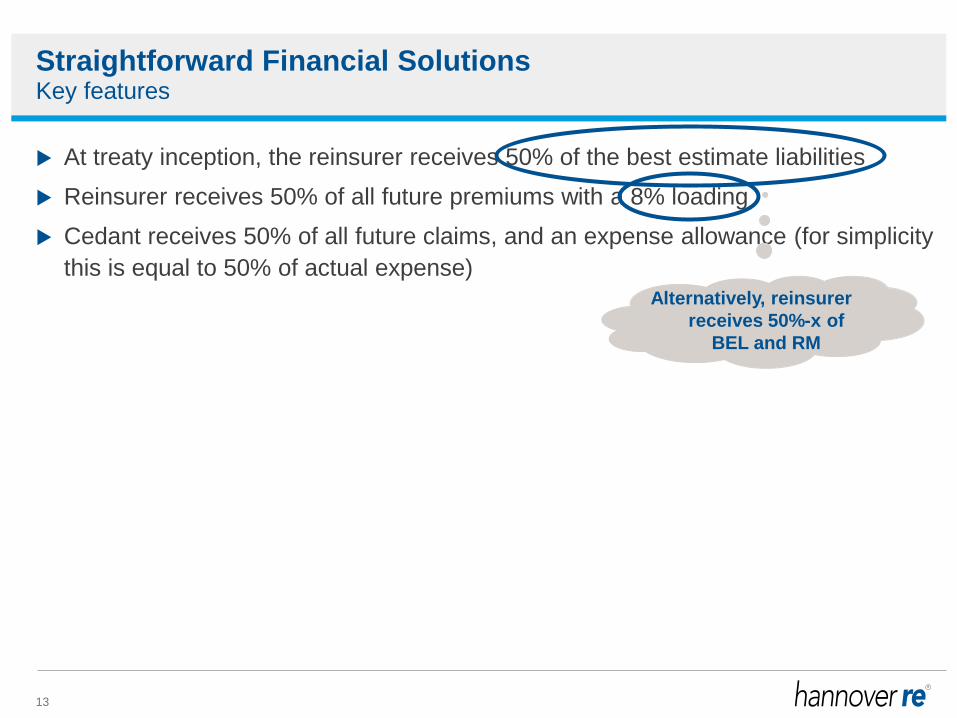
Straightforward Financial Solutions
At treaty inception, the reinsurer receives 50% of the best estimate liabilities Reinsurer receives 50% of all future premiums with a 8% loading Cedant receives 50% of all future claims, and an expense allowance (for simplicity
this is equal to 50% of actual expense)
Key features
Alternatively, reinsurer receives 50%-x of
BEL and RM
13
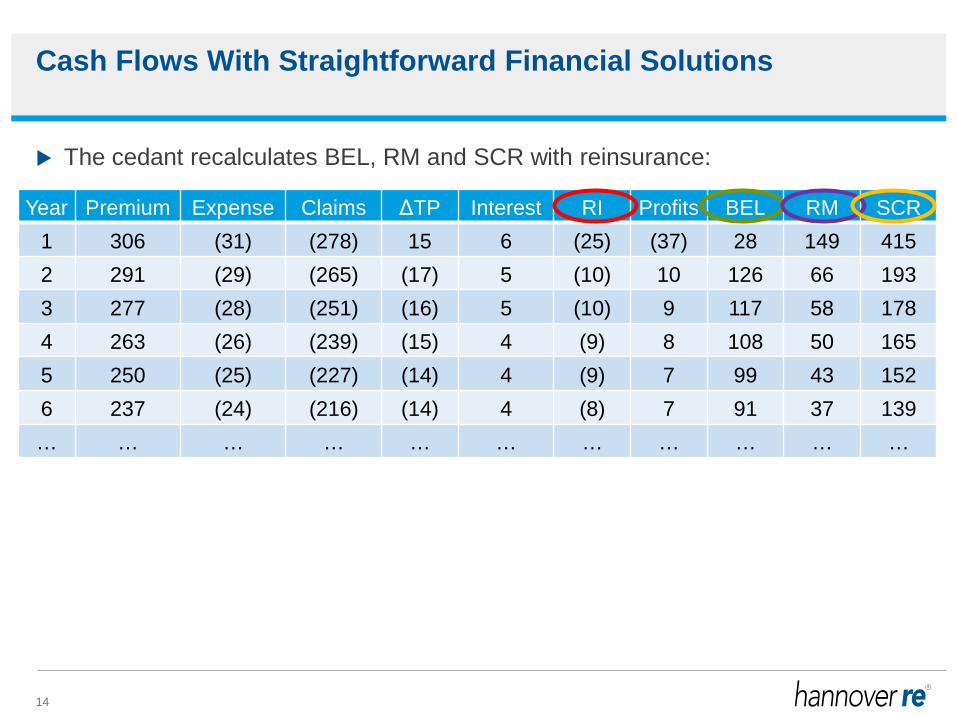
The cedant recalculates BEL, RM and SCR with reinsurance:
Cash Flows With Straightforward Financial Solutions
Year Premium Expense Claims ΔTP Interest RI Profits BEL RM SCR1 306 (31) (278) 15 6 (25) (37) 28 149 4152 291 (29) (265) (17) 5 (10) 10 126 66 1933 277 (28) (251) (16) 5 (10) 9 117 58 1784 263 (26) (239) (15) 4 (9) 8 108 50 1655 250 (25) (227) (14) 4 (9) 7 99 43 1526 237 (24) (216) (14) 4 (8) 7 91 37 139… … … … … … … … … … …
14
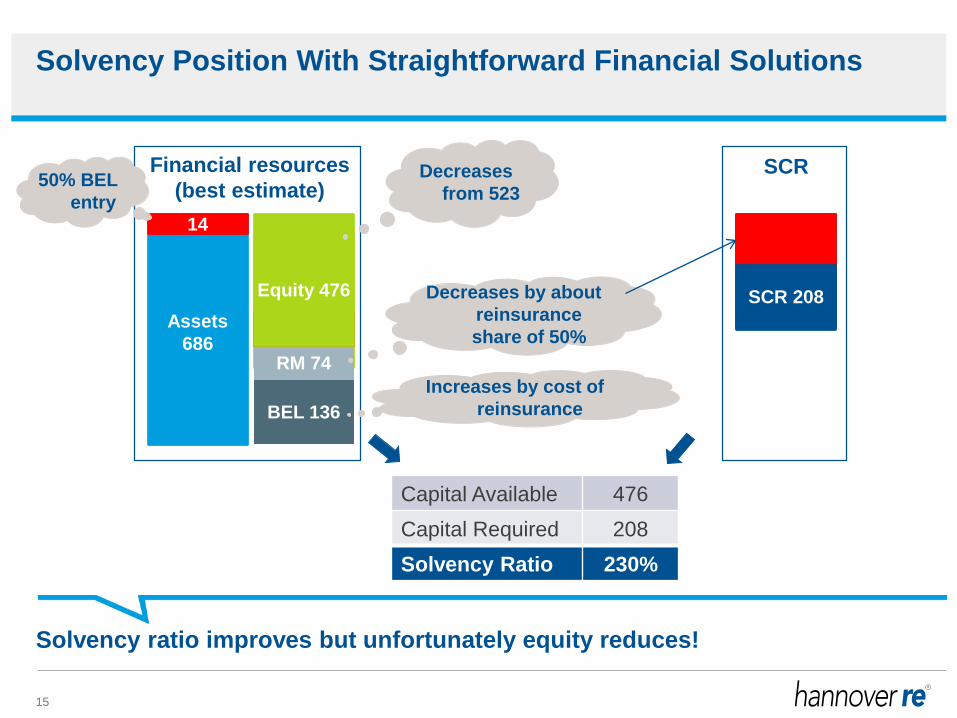
Capital Available 476Capital Required 208Solvency Ratio 230%
Solvency Position With Straightforward Financial Solutions
Assets700
Financial resources(best estimate)
Equity523
BEL 28
RM 149
14
Assets 686
BEL 136Increases by cost of
reinsurance
RM 149RM 74
Decreases by about reinsurance share of 50%
Equity 476
Decreasesfrom 523
SCR
SCR 415
SCR 208
50% BEL entry
Solvency ratio improves but unfortunately equity reduces!
15
Contingent Financial Solutions

Contingent Financial Solutions
At treaty inception, the reinsurer undertakes that:• within the next 5 years <facility duration>• if mortality experience in the year is 110% to 115% of best estimate <trigger event>• the reinsurer will pay for this loss <trigger payment>• the reinsurer will receive 50% of the best estimate liabilities. The reinsurer receives 50% of
all future premiums with a 8% loading, and the cedant receives 50% of all future claims, and an expense allowance <trigger collateral>
• for a fee of 1.5% p.a. of the difference in technical provision <facility fee>
Key features
17
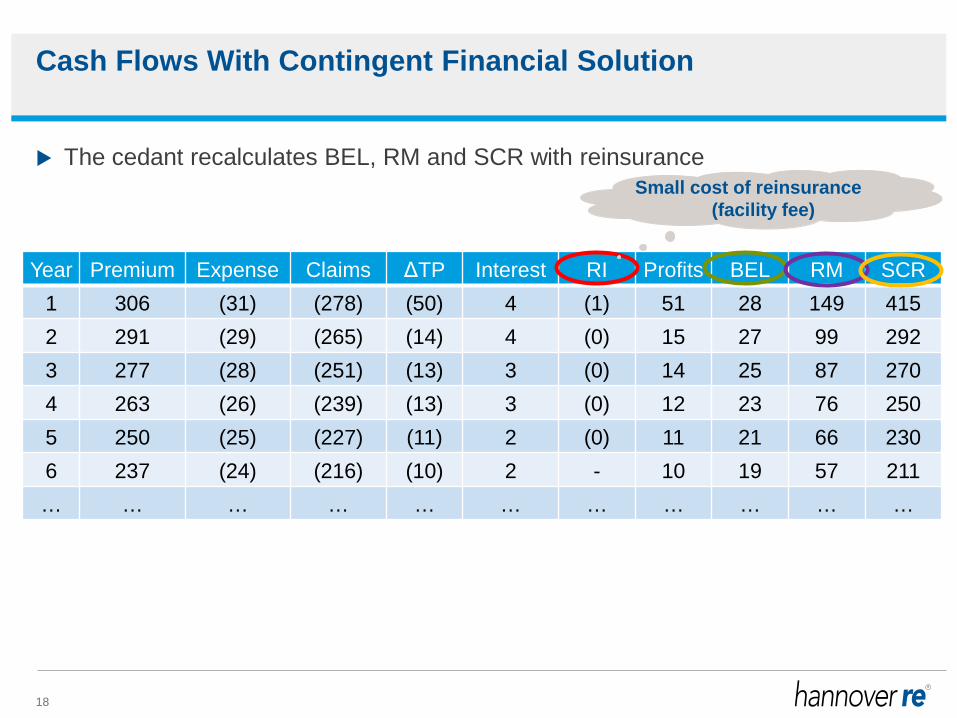
Cash Flows With Contingent Financial Solution
Year Premium Expense Claims ΔTP Interest RI Profits BEL RM SCR1 306 (31) (278) (50) 4 (1) 51 28 149 4152 291 (29) (265) (14) 4 (0) 15 27 99 2923 277 (28) (251) (13) 3 (0) 14 25 87 2704 263 (26) (239) (13) 3 (0) 12 23 76 2505 250 (25) (227) (11) 2 (0) 11 21 66 2306 237 (24) (216) (10) 2 - 10 19 57 211… … … … … … … … … … …
The cedant recalculates BEL, RM and SCR with reinsuranceSmall cost of reinsurance
(facility fee)
18

Capital Available 553Capital Required 328Solvency Ratio 169%
Solvency Position With Contingent Financial Solutions
Assets700
Financial resources(best estimate)
Equity523
BEL 28
RM 149
BEL 30
Very small increase due to facility feeRM 117
DecreaseEquity
553
Increase from 523
SCR
SCR 415SCR 328
No BEL entry
Solvency ratio improves and equity increases!
19

More On The Economics

How Reinsurers can accept a price less than BE + RM?Hannover Re’s effective risk management provides competitive advantage
“99.5%”Solvency II for cedant
99.97%Hannover Re
Internal Model
Best Estimate
0 Profit
F(Profit)
Cedant’s required capital
DIVERSIFICATION BENEFIT from:- all lines of life and non life business
- 5000 insurers in 150 countries- active pursuit of risks uncorrelated with existing portfolio e.g. longevity
COST OF CAPITAL (COC) SAVINGS= COC 99.97% * Hannover Re’s required capital
– COC ”99.5%” * Cedant’s required capital
Hannover Re’s required capital
21

What are the potential trigger events that can be covered?
A liability based trigger event Impacts both SCR and RM Increasing capital available and reducing capital required
An asset based trigger event Impacts only SCR Reduce capital required and capital available
22

Mass Lapse Solution
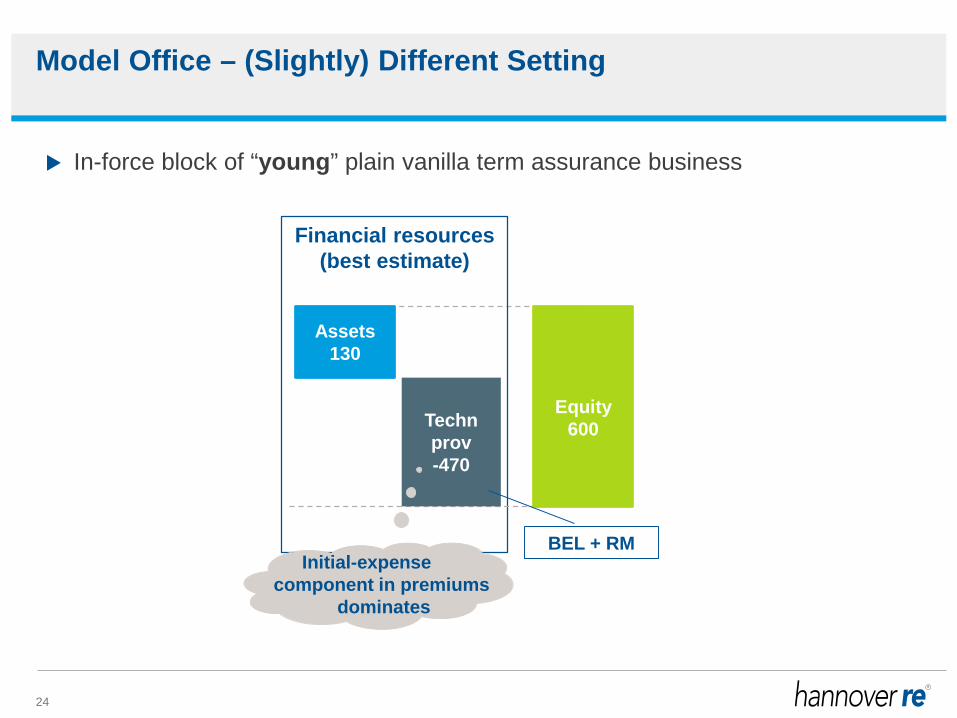
Model Office – (Slightly) Different Setting
Assets130
Financial resources(best estimate)
Equity 600Techn
prov-470
Initial-expensecomponent in premiums
dominates
In-force block of “young” plain vanilla term assurance business
BEL + RM
24

Analogous simplifications as in first setting
Focus On Lapse Risk and Capital
Max{+50%/-50% long-term lapse SCR, 40%-mass-lapse SCR}
Often more onerous
25

Solvency Position Without Reinsurance
Assets30
Financial resources(best estimate)
Equity 500Techn
prov-470
Equity312
Assets30
Financial resources(mass lapse stress)
Techn prov-282
188
Required capital for mass lapse component
After 40% mass lapse stress
Capital Available 500Capital Required 188Solvency Ratio 266%
26

Financial Solutions That Protects Against Mass Lapse Event
One-year contract
-TP 470
Loss if 100% lapse rate
Company’s retention, e.g. 20.%
Reinsurer claims113
Attachment rate, e.g 20%
Detachment rate, e.g. 50%
Reinsurance premium: e.g., a% of reinsurer’s maximum liability Easy implementation: Use the ratio of actual to expected earned premiums at the end of the year as a (very good)
proxy for the lapse experience
27

Solvency Position after Mass Lapse Financial Solution
SCR 188 = Loss if 40% lapse rate
Space of ignoranceAssets
30
Financial resources(best estimate)
Equity 500
Techn prov-470
-TP 470
Company’s retention, e.g. 20%
Reinsurer claims113
Attachment rate, e.g. 20%
Detachment rate, e.g. 50%
75SCR relief
Capital Available 500Capital Required 113Solvency Ratio 425%
Required Capital
Very low cost of reinsurance
Solvency ratio improves as well as equity!
28

Why Is It Worthwhile For The Company?
Again, reinsurer provides its more diversified balance sheet to the insurance company
…so that cost of reinsurance < cost of capital of the company
29

Conclusion
There exist effective and efficient financial solutions that provide solvency relief under Solvency II
…at a cost that is adequate for both the company and the reinsurer A broad range of risks can be covered: lapse, mortality, morbidity, asset risk…
30
Thank You