FINANCIAL RISK MANAGEMENT STRATEGY FOR A BUSINESS …
158
FINANCIAL RISK MANAGEMENT STRATEGY FOR A BUSINESS SCHOOL: A CASE STUDY OF NAMIBIA BUSINESS SCHOOL. A THESIS SUBMITTED IN PARTIAL FULFILMENT OF THE REQUIREMENTS FOR THE DEGREE OF MASTER OF BUSINESS ADMINISTRATION OF THE UNIVERSITY OF NAMIBIA BY ANNA AMUTENYA STUDENT NUMBER: 9818154 SEPTEMBER 2016 SUPERVISOR: PROFESSOR KASHIRAM R. SHARMA
Transcript of FINANCIAL RISK MANAGEMENT STRATEGY FOR A BUSINESS …

FINANCIAL RISK MANAGEMENT STRATEGY FOR A BUSINESS
SCHOOL: A CASE STUDY OF NAMIBIA BUSINESS SCHOOL.
A THESIS SUBMITTED IN PARTIAL FULFILMENT OF THE
REQUIREMENTS FOR THE DEGREE OF
MASTER OF BUSINESS ADMINISTRATION
OF
THE UNIVERSITY OF NAMIBIA
BY
ANNA AMUTENYA
STUDENT NUMBER: 9818154
SEPTEMBER 2016
SUPERVISOR: PROFESSOR KASHIRAM R. SHARMA

ii
ABSTRACT
The study explored financial risks faced by educational institutions in their
operations. It focuses on how educational institutions identify, measure, monitor
and manage the financial risks they are faced with and how the risk management
strategy benefits the institutions. The main objective of the study was to study the
nature and extent of credit and liquidity risks faced by Namibia Business School
for the period between 2009 up until 2011. The study aimed to identify an effective
risk management strategy to ensure the School’s competitiveness and sustainability.
Research work is based on a case study approach where interviews and survey were
used to gather primary data, and a mixed method approach was used for data
collection, data analysis and interpretation. The study was explorative in nature.
The major findings of the research pointed out that NBS has been experiencing
difficulties in collecting revenue and has adopted the UNAM risk management
policies. The results echoes that by developing and implementing a formal and
integrated risk management framework, an institution will hold a dynamic tool that
can serve as a road map for identifying and managing risk exposures. However, a
more customized strategy including the review of governance structure, introducing
risk procedures and methodology manuals as well as creating a better risk
awareness culture amongst staff will yield better results than a wider framework.

iii
TABLE OF CONTENTS ABSTRACT ............................................................................................................ ii
ACKNOWLEDGEMENTS ................................................................................... vi
DEDICATION ...................................................................................................... vii
DECLARATION.................................................................................................. viii
LIST OF TABLES ................................................................................................. ix
LIST OF FIGURES .............................................................................................. xi
ACRONYMS ........................................................................................................ xii
CHAPTER ONE: INTRODUCTION ..................................................................... 1
1.1 Orientation of the study ......................................................................... 1
1.2 Risk management ................................................................................... 3
1.3 Statement of the problem ........................................................................... 5
1.4 Research objectives and questions ............................................................ 7
1.5 Significance of the study ............................................................................. 8
1.6 Limitation of the study ............................................................................... 9
1.7 Conclusion ..................................................................................................11
CHAPTER TWO: LITERATURE REVIEW ....................................................... 12
2.1 Introduction ............................................................................................... 12
2.2 Risk ............................................................................................................. 12
2.3 Types of risk ............................................................................................... 16
2.3.1 Financial risk ........................................................................................ 18
2.4 Risk Management ..................................................................................... 24
2.4.1 Financial risk management .................................................................. 28
2.5 Strategy ...................................................................................................... 34
2.5.1 Strategic planning ................................................................................ 35
2.5.2 Strategy formulation ............................................................................ 40
2.5.3 Strategy implementation ...................................................................... 42
2.6 Strategic management .............................................................................. 44
2.7 Role of governance in risk management ................................................. 46
2.8 Studies in strategy management .............................................................. 48

iv
2.9 Gaps in knowledge emerging from literature review ............................ 49
2.10 Conclusion ............................................................................................... 51
CHAPTER THREE: RESEARCH METHODOLOGY ....................................... 52
3.1 Introduction ............................................................................................... 52
3.2 Research design ......................................................................................... 52
3.3 Population .................................................................................................. 53
3.4 Sample ........................................................................................................ 53
3.5 Research Instruments ............................................................................... 55
3.6 Questionnaire Construction ..................................................................... 56
3.7 Procedures ................................................................................................. 57
3.8. Data Analysis ............................................................................................ 58
3.8.1 Quantitative Data Analysis .................................................................. 58
3.8.2 Qualitative Data Analysis .................................................................... 59
3.9 Reliability and Validity ............................................................................. 64
3.10 Research Ethics ....................................................................................... 67
3.10 Conclusion ................................................................................................ 68
CHAPTER FOUR: DATA ANALYSIS DISCUSSION ........................................ 69
4.1 Introduction ............................................................................................... 69
4.2 Objectives of the study............................................................................ 69
4.3 Primary data collection and analysis .................................................... 70
4.4 Response rate of respondents ................................................................. 71
4.5 Data Analysis ............................................................................................. 71
4.5.1 Analysis of data from field survey ....................................................... 72
4.6 Qualitative Results .................................................................................... 90
4.6.1 Themes and Sub-themes interpretation ................................................ 90
4.6.2 Summary of review of interview questions (N1) ................................. 91
4.6.3 Summary review of interview questions (N2) ..................................... 94
4.6.4 Summary of findings............................................................................ 95
4.6.5 Internal policies and procedures .......................................................... 96
4.6.6 Audited Financial Statements .............................................................. 97

v
4.6.7 Student records (fee records) ............................................................... 99
4.6.8 Suppliers’ records (account statements) ............................................. 100
4.7. Conclusion .............................................................................................. 101
CHAPTER FIVE: SUMMARY OF FINDINGS, CONCLUSIONS AND
RECOMMENDATIONS .................................................................................... 102
5.1 Introduction ............................................................................................. 102
5.2 Summary of major findings ................................................................... 103
5.3 Recommendations ................................................................................... 108
5.4 Directions for further research ...............................................................110
REFERENCES .................................................................................................... 111
APPENDICES .....................................................................................................119
Appendix 1: QUESTIONNAIRE ON FINANCIAL RISK MANAGEMENT
STRATEGY FOR A BUSINESS SCHOOL: A CASE STUDY OF NAMIBIA
BUSINESS SCHOOL. ...................................................................................119
Appendix 2: REDORDED AND TRANSCRIBED INTERVIEWS ......... 128

vi
ACKNOWLEDGEMENTS
I thank the almighty God for the wisdom.
I am indebted to Namibia Business School, for the scholarship and the opportunity
granted to study at the business school.
My sincere thanks and appreciation to my supervisor, Prof K. Sharma, for his
guidance, supervision, constructive criticism and unwavering support, dedication
and encouragement throughout the course of this study.
My sincere appreciation to my husband, Mr. Fanuel Uugwanga, for the unwavering
support, unconditional love and encouragement during my studies.
To my son, Fanuel Omwa-Etuna Twahupithwa Uugwanga, for his patience. This is
for you my son.
To my namesake and my special aunt, Dr. Anna Ashipala-Hako, for the
encouragement and unwavering support. This is just one of the many products from
your advice.
My sincere appreciation and thanks to my parents, for the encouragement, the belief
in me and the support. Your teachings to persevere in life motivated me and I hope
that you are pleased to see the ongoing growth in the seed that you have planted.
I am finally indebted to my siblings, friends and family for the support and
encouragement.

vii
DEDICATION
This report is dedicated to my boys, Fanuel Snr. and Fanuel Jnr. for the love and
support.

viii
DECLARATION
I, Anna Amutenya, hereby declare that this study is a true reflection of my own
research, and that this work, or part thereof has not been submitted elsewhere.
No part of this thesis may be reproduced, stored in any retrieval system, or
transmitted in any form, without the prior permission of the author or the University
of Namibia in that behalf.
I, Anna Amutenya, grant the University of Namibia the right to reproduce this thesis
in whole or in part, in any manner or format, which the University of Namibia may
deem fit, for any person or institution requiring it for study and research, providing
that the University of Namibia shall waive this right if the whole thesis has been or
is being published in a manner satisfactory to the University.
……………………………. ……………………..
Signature Date

ix
LIST OF TABLES
Table 4.01 Period of Study
Table 4.02 Level of Education
Table 4.03 Gender
Table 4.04 Age Distribution
Table 4.05 Method of Payment of Tuition fees at Registration
Table 4.06 Method of Payment of Tuition fees during Studies
Table 4.07 Delay in Settling Tuition fees
Table 4.08 Problems faced
Table 4.09 Opinion on Risk exposure
Table 4.10 Improvements needed
Table 4.11 Risk Associated with Default
Table 4.12 Liquidity problems faced
Table 4.13 Debt collection strategy
Table 4.14 Change in Debt Collection Strategy
Table 4.15 Measures necessary
Table 4.16 Management Strategy
Table 4.17 Infrastructure
Table 4.18 Management Quality
Table 4.19 Staff adequacy
Table 4.20 Pressure on Management

x
Table 4.21 Staff Motivation
Table 4.22 Liquidity and Current ratio

xi
LIST OF FIGURES
Figure 2.1 Strategic Management Basic Model
Figure 2.2 Conceptual Framework of Strategic Management

xii
ACRONYMS
AFS Audited Financial Statements
ANT Actor-Network Theory
BIS Bank for International Settlements
BON Bank of Namibia
CRM Credit Risk Management
CPA Certified Public Accountants
COSO Committee of Sponsoring Organisations
ERM Enterprise Risk Management
FNB First National Bank
GAAP Generally Accepted Accounting Practices
HEFCE Higher Education Funding Council for England
IBM SPSS IBM Statistical Package for Social Sciences
IFRS International Financial Reporting Standards
IOSCO International Organisation of Securities Commissioners
ISO International Organisation for Standardisation
MBA Master of Business Administration
MDGs Millennium Development Goals
MSM Maastricht School of Management
NAMDEB Namibia Diamond Corporation of Namibia
NBS Namibia Business School
O&L Olthaver & List
PGSC Post Graduate Students Committee
SWOT Strength Weakness Opportunities and Threats
UNAM University of Namibia

1
CHAPTER ONE: INTRODUCTION
1.1 Orientation of the study
Namibia Business School (NBS) was established in 2008 in response to the need
of the Namibian market. The School started functioning from a humble beginning
in 1999, when the University of Namibia (UNAM) entered into a collaboration
agreement with the Maastricht School of Management (MSM) in the Netherlands,
to offer an Executive Master of Business Administration (MBA) programme at
UNAM. Following the success of Maastricht School of Management (MSM)
Executive Master of Business Administration (MBA) programme the NBS
Management launched its Management programme. The programme has grown
exponentially and by to date close to 250 students have graduated. The First
National Bank of Namibia (FNB) committed to financially support the business
school. This commitment is in existence to date. FNB was joined by Bank of
Namibia (BON), Namibia Diamond Corporation of Namibia (NAMDEB), Olthaver
& List Group of Companies (O&L) and UNAM as founders of NBS.
The School is academically an integral part of the UNAM, under the Faculty of
Economics and Management Sciences. It is administered as an independent not-for
profit institution, which is registered as a trust. NBS does not receive financial
support from the parent university or from the government. The institution funds
2
its operations from tuition fees, program revenues and donations, in addition to
financial commitment from the founders. The School’s main budget is based on
projections from students’ enrolments and tuition fees, which are the main sources
of the School’s revenue. NBS requires students to deposit 50% of the total tuition
fees at registration. In many instances, students do not have the required amount
(50% of tuition fees), to deposit as their tuition fees at the time of registration, as
required by NBS. NBS in such cases allows students to register with any amount,
and enter into a ‘debt acknowledgement agreement’ with the School that requires
the students to settle their outstanding fees in monthly installments. As most
students do not abide by the signed agreements the NBS is prone to students’
default on their payments. This exposes the School to liquidity risk and credit risk.
Such inherent risks need to be periodically monitored, managed and controlled.
The objective of NBS are to equip aspiring managers and entrepreneurs with
required skills in conducive learning environment, to enable them to excel in the
competitive business environment in which business leaders have to operate. Since
its inception and the official inauguration in 2008, the business school has grown
immensely and it is expected to continue to grow, as the interest shown by
stakeholders including students is on the increase.

3
1.2 Risk management
Risk management is a practice of systematically selecting cost effective approaches
for minimizing the effect of threat realization to the organization. Risk management
is also acritical success factor for achieving strategic goals and objectives of
business. For risk management to be effective, it needs to be linked and integrated
with all business processes, from strategic planning to all operational activities. It
is critical that risk management concepts and principles are incorporated into
existing processes to develop and manage business strategies and objectives.
However, all risks can never be fully avoided or mitigated because of financial and
practical limitations. As a result thereof, an organization has to accept some level
of residual risks (Ezigbo, 2013 & Poonia, 2010).
For the purpose of this study, researcher emphasized on credit risk and liquidity
risk. This is mainly because liquidity risk and credit risk are manageable and
controllable by an institution, and also because the implications of credit risk and
liquidity risk are more severe and pose a major threat to the financial management
of institution.
Liquidity risk is the risk that a business will have insufficient funds to meet its
financial obligations in a timely manner (CPA, 2010). It is further defined as the

4
risk that an entity will encounter difficulty in meeting obligations associated with
financial liabilities (University of Cape Town, 2010).
Liquidity risk can arise from a number of areas within an organization, including
unplanned reduction in revenue, increase in operational costs, inadequate cash flow
management, and sustained reduction in profitability. NBS as an institution is no
exception to being exposed to liquidity risk, and thus needs to manage liquidity risk
to ensure that the school remains financially solvent. The consequences can be
wide-ranging, including impact on supply of goods and services due to the inability
to meet payment terms, breaching bank loan covenants, increase in penalties for
non-payments and late payments, such as tax obligations, and may lead to
insolvency and or bankruptcy. This is in agreement with the Bank of International
Settlements (BIS), (2006), which states that risk management does not only affect
liquidity, but liquidity can also affect risk management practices.
Credit risk is the risk of default on a debt that may arise from a borrower failing to
make required payments (BIS, 2000). Valsek (1983), defined credit risk as the risk
that one party to a financial transaction will cause a financial loss to the other party
by failing to discharge its obligation. NBS is exposed to credit risk because students
fail to pay their tuition fees on time as agreed and or pay at their own pace and
discretion. In addition, the school trades with other service providers on credit. In

5
order to reduce and manage credit risk exposure, the school needs to subject its
customers to random credit verification procedures.
There has been a lot of research that explored risk management. Amongst the many
scholars, the works of Halim (2007), Herring and Santomero (1991), Stulz (1984),
Jensen and Meckling (1976) can be cited as examples. In addition, the development
of risk management frameworks and standards by the risk committees such as the
Committee of Sponsoring Organizations (COSO) and the International
Organization for Standardization (ISO), serves the proof that risk management is a
worldwide activity that requires effective management. This effort is still continued
today and scholars are constantly searching for the best and effective ways of
managing risks in different environments.
The expected growth in student enrollment and institutional expansion, and being
one of the two business schools in the country exposes the School to different
financial risks. In response to that the business school needs to identify, assess,
develop and implement financial risk management strategies that will enable it to
manage its risks and use its financial resources to achieve its financial objectives
that will enhance its financial sustainability
1.3 Statement of the problem
Extensive research indicates that institutions are faced with different types of risks
such as financial risk and business risk, and apply different models to mitigate the
risks. Financial risk, (credit and liquidity risks) have devastating effects on the
6
operations of institutions. According to the Bank of International Settlements (BIS,
2006), the effective management of risk is a critical component of a comprehensive
approach to risk management and is essential to the long-term success of any
institution.
NBS as an institution is exposed to credit risk and liquidity risk. At the moment,
NBS does not have a strategy to manage its credit risk as well as liquidity risk. The
absence of risk management strategy exposes the School to not being able to
identify, measure, and manage its risks, including the risks that can be effectively
managed by the School. Crafting a financial risk management strategy will enable
the School to keep abreast of the risks that it is exposed to. This will enable it to
identify the risks, measure the risks and use appropriate mechanisms to manage the
risks.
To determine the nature and extent of credit risk NBS was exposed to, measures
such as the method of payment of tuition fee during studies, late payment or delay
in payment of tuition fee, NBS tuition fee collection and outstanding dues collection
policy and strategy, NBS internal policies and procedures, staff motivation and
morale in respect of the above and pressure on management to manage risk were
analysed.
Further, to determine the nature and extent of liquidity risk NBS was exposed to,
measures such as creditors and suppliers’ payment policy, suppliers’ records
7
(accounts statements), delay in meeting creditors’ obligations, liquidity ratios and
current ratios were analysed.
1.4 Research objectives and questions
As the study seeks to determine the types of financial risks NBS is exposed to, it
entails identifying the risks, assessing the levels of risk exposure and
recommending for the development of an appropriate financial risk management
strategy to mitigate the identified risks, which could also be useful to other business
schools operating under similar environment.
The objectives of the study accordingly are:
1. To study the nature and extent of credit risks and liquidity risks the NBS is exposed
to; and
2. To identify and assess the levels of risk exposure at the NBS as well as
identification and development of a risk management strategy to mitigate the
identified risks.
In view of the broad objective stated above, the study attempted to find answers to
the following questions.
1. What is the nature and extent of credit risks and liquidity risks faced by Namibia
Business School in its operations?
8
2. What strategy should Namibia Business School use to proactively manage the
credit risks and liquidity risks?
1.5 Significance of the study
The study was conducted for both academic and professional purposes and thus has
significant contributing factors. The study enabled the researcher to gain academic
knowledge in the area of risk management specifically with regard to decision
making when it comes to financial risk management strategies as well as gain
general business experience. This study contributed to the knowledge of financial
risks faced by educational institutions and can be used as a point of reference by
future researchers. The outcomes of this research will benefit NBS and will
highlight the implications and benefits of having a risk management strategy in
place and will enable NBS’s management to make informed decisions. The study
will also benefit policy makers, specifically in institutions of higher education and
in Namibia in particular, when it comes to financial risk management decision
making.
Given the above scenario, some personnel at the NBS were of the opinion that by
developing financial risk management strategies for the School, more synergy can
be gained and activities can be better managed to improve the financial position of
the School while some others were undecided. This is a general feeling of the
management in decision making within the institution. It had not been verified as
to whether developing a financial risk management strategy is the best way forward.

9
The uncertainty of the strategy remained a worrying situation to the researcher and
this has motivated the researcher to conduct a research of this sort in order to find
out whether the development of financial risk management strategy will be in the
best interest and can add economic value to NBS, and will enhance and strengthen
decision making by the NBS Board of Trustees, management as well as staff with
regards to effective management of credit risk and liquidity risk NBS is exposed to.
1.6 Limitation of the study
Apart from the limited scope, that is NBS alone being the subject of study and the
time limit; this study also faced the following challenges and limitations.
Risk management and its strategies are involving and institution specific. As a
result, most institutions including business schools are still in the process of drafting
strategies and have fragmented activities, which are conducted by financial
institutions. This puts a limit on the literature available on the specific subject.
In most jurisdictions, the function of risk management falls within the ambit of the
Audit department, whose structures are usually different from those of conventional
institutions. This again puts limitations on comparing functions amongst
responding institutions. The time provided in which to complete the research was
also limited. The quality of the outcome of the analysis also depended upon the
timely responses obtained from correspondents.
10
Since the study was based on a case study, it limited generalisation of the results.
The study entailed deep exploration into the financial information of NBS between
2009 and 2011, to assess the nature and extent of credit risks and liquidity risks that
the School was exposed to. The study period was limited mainly because, prior to
the official launch in October 2008, the School offered only one program. The
School until then did not meet the standard requirements of a business school. In
addition, the finance function at the School was outsourced and only audited
financial information for 2009 till 2011 could be available.
A major limitation in conducting this study was accessibility of individuals with
relevant and required information. Finally, the researcher encountered problems
with regards to obtaining information in the format the study required. Information
had to be processed in the form useful to enable to analyse the information and be
able to draw sound conclusions. The researcher also did not get adequate support
from NBS staff with regards to obtaining information and as a result had to limit
the study to limited available information. The confidential nature of the
information, especially on the shortcomings of internal processes, was an inhibiting
factor.

11
1.7 Conclusion
Chapter one covered the introduction and background to the study. The statement
of the problem is widely covered in this chapter. The chapter also focused on the
research objectives and research questions, creating a relationship between the two
and linking them to the problem and the statement of the study. The objectives of
the study inform the research questions. Significance of the study as well as the
limitations and delimitations of the study are also covered in this chapter. This
chapter is fundamental in that it introduces the reader to the study.

12
CHAPTER TWO: LITERATURE REVIEW
2.1 Introduction
Literature review is the corner-stone of every research as it enables a researcher to
connect his study with previous studies, find facts, relate them and be certain that
the study being undertaken is relevant. This chapter presents a review of theories
and literature relevant to financial risk and strategies for the management in
institutions of higher education and to help the readers to comprehend the basics of
financial risk and risk management strategies. The review of literature further
provides knowledge of the problem areas, identifies the need for the study as well
as the gaps in the existing body of knowledge in the literature. Finally, literature
review emphasises upon the strategies for effective financial risk management in
institutions of higher education.
2.2 Risk
The presence of risk is not new. Risk is universal, has been all around and has been
a central concern for many societies. In fact, it is experienced in daily lives as it is
a persistent element of human condition. Everything done in life has some degree
of risk attached to it. From past days to the modern day organisations, uncertainties
have continued to disrupt activities. However, in living with risks, certain actions
and events will be required to take corrective action. For instance, risk to one’s life
or possessions can be covered by insuring. Over the last few decades, the financial

13
sector has been volatile and has been exposed to a large number of risks. In
particular, the turbulence in the financial markets in 1970 and 1987, the turmoil of
the financial industry during 2007-2008, and the European debt crisis stemming
from 2009, confirm the existence of risk and emphasize the importance of effective
risk management procedures. The outcome of the increasing risk in global markets
is that the risk may originate from events thousands of miles away and may have
nothing to do with the domestic market still the local market may be severely
impacted. The same is the case with firms and institutions.
Many definitions of risk exist in common usage, as there are also different
approaches to risk management. Helsloot and Jong (2006) indicated that it is a fact
that there is no single, unambiguous definition of the term ‘risk’ that has unalloyed
support of all experts and conclude that we find all sorts of definition in the
literature. The above statement is in support of Moles (2010), when he stated that
each discipline makes use of the idea of risk in the context of its particular
objectives.
Increasingly in today’s environment, risk is being more broadly defined as any issue
that affects an organization’s ability to meet its objectives.

14
Partnerships, B.C. (2005) defines “risk as a function of the likelihood of something
happening and the degree of losing, which arises from a situation or event”. The
likelihood of something happening will impact the achievement of the objective.
Risk provides a basis for opportunities and arises as a result of the exposure, which
is the possibility of a loss. Consequently, risk is the likelihood of losses resulting
from events such as changes in market prices (Horcher, 2005).
Accordingly, risk can be seen as relating to probability of uncertain future events.
The International Organization for Standardization (ISO 31000) (2009) defined risk
as ‘the effect of uncertainty on objectives’. The word ‘risk’ is used to imply a
measurement of the chance of an outcome, the size of the outcome or a combination
of both (Ansell & Wharton, 1992). It is further stated that individuals, organizations
and governments make decisions that are based on perceptions on the likely
consequences of their actions, while some consequences may not be recognized.
Further to the above, there is a physiological meaning of risk, which according to
Moles (2010), is the state of uncertainty or doubt in the face of a situation with
beneficial and adverse consequences.
Based on the above definitions, it can be construed that risk involves the likelihood
and consequence of something happening, the likelihood of something happening

15
and the likelihood impacting the achievement of the objectives. These definitions
lead to the notation that risk is the likelihood of an event to take place that may
bring about consequences that impact the achievement of the organisations’
objectives. The definitions further implies that risk may have a positive or negative
impact on the objectives of the organisation, that the impact may be hazardous and
pose threats to the objectives or may present opportunities to the organisation. It is
therefore important to manage both the downside and the upside in order to lessen
the possibility of adverse developments and increase the possibility of success.
Risks faced by educational institutions are no different from those faced by any
other type of organization, which threaten institutions’ efficiency. Education is
central to development. It is a necessary condition for achieving the Millennium
Development Goals (MDGs) for developing countries. Risk management thus is a
fundamental building block for poverty reduction, human development and
inclusive economic growth. It plays an increasingly pivotal role in meeting the
evolving labour market needs and sustaining growth performance.
It is thus not new that individuals and organisations have always sought to reduce
uncertainties (Skipper & Kwon, 2007), and through time have devised methods to
deal with such uncertainties. As a result, it is important for all institutions including
educational institutions to ensure that risks are identified and managed

16
appropriately. Cassidy et. al (2003) concluded that organizations need to agree on
a common definition of risk that is clearly understood throughout the organization
and fits fully into the organisation’s context before risks can be effectively
managed. Further, a balanced view of risk that tries to minimize the threats,
influence and control uncertainties and manage opportunities is essential.
Academic institutions face many of the risks encountered by traditional businesses,
like the availability of funding or reputational risk. The actions by the institutional
stakeholders and administrators which include donors, government, faculty,
students, boards and trustees, can impact the institution’s reputation, including
future enrolments and funding, which can further have an impact on the institutions
objectives.
2.3 Types of risk
Helam (2005) states that there are various risks that hamper organizations
sustainability and that categorizing risks would make it easier to manage the events,
whilst Hopkins (2012) noted that there is no right or wrong subdivision of risks. It
is however important that organizations adopt a risk classification system that is
most suitable for their own circumstances. In an organizational context, thus
categorising risks is important and the useful way to identify risks from the

17
organizational perspective, which categorised risks into pure risks and speculative
risks (Halim, 2007).
Risk has been described by Partnerships BC (2005), as the likelihood and
consequence of some events happening and impacting the objectives of the
organisation. One way of classifying risks is to classify risks as both pure and
speculative risks (Waring & Glendon, 1998). Pure risks are generic risks, which
are external to an organisation, are beyond the control of the organisation and result
in disruption of organisation’s activities. On the other hand, speculative risks
consist of risks that arise out of the activities of an organisation and are inherent to
the type of organisation.
A risk that is the result of external causes is less amenable to control than a risk that
arises outside the walls of the institution concerned. It was further stated by Halim
(2007) that, if speculative risk is managed well, it allows for the improvement in
profits, meeting specified organisational objectives and at the same time avoid any
downside risk.
Another perspective to further categorise risk is to identify risks from an
organisational perspective, being business risk and non-business risk. However,
these categories are subjective in nature and overlap across categories and
industries. As a result, there is no absolute method in which to preferably classify

18
risk. With this difficulty in classifying risks, the recognition that the higher
education sector also faces a variety of risks from external and internal sources
(Cutler, 1993) is indeed important.
Further, risks can be divided according to the impact they have, which may be
internal impact or external impact. Accordingly, the responsibility of tackling the
problem lies with the primary owner in case of the internal impact. However, the
same is done in consultation with the external stakeholders for the external impact.
According to Halim (2007), irrespective of the classifications of risks, the goal of
an organisation should rest on to eliminate or best mitigation the impact and reduce
the impact on outcome but not the uncertainty itself.
2.3.1 Financial risk
Financial risk is more evident in financial services sector. It affects other institutions
as well. Volatile interest rates, changes in exchange rates etc., affect organizations
that borrow or lend money. In the education sector for example, a university that
borrows funds from a financial institution faces interest rate risk when interest rate
fluctuates resulting in higher interest payments. On the contrary, in the banking
sector, financial institutions face the primary risk of default by a counterparty in
meeting due obligations.

19
Financial risk does not exist in isolation and interactions of several exposures may
have to be considered in developing an understanding of how financial risk arises.
Financial risk arises through countless transactions of financial nature, including
sales and purchases, investments and loans, legal transactions, through activities of
management, stakeholders, competitors and various other business activities
(Horcher, 2007). It can also arise from an organization’s exposure to changes in
market prices, from the actions of and transactions with other organizations as well
as from internal actions or failures of the organization, particularly people,
processes and systems. Financial risk further arises from the practice of financing
part of a firm’s assets with interest-bearing debt, with a view to increasing the
ultimate return to the ordinary shareholders (Correia, Flynn, Uliana & Wormald,
1993).
Accordingly, institutional leaders must deal with complex risks that can potentially
have substantial effect on the institutions and need to be aware of the hazards facing
the institutions’ programs and operations as well the need for information about the
potential risk embedded in opportunities that may present themselves.

20
2.3.1.1 Liquidity risk
All institutions require liquidity in order to replace their liabilities, meet contractual
obligations and fund growth, all at reasonable price, when needed. Liquidity risk is
the risk of loss arising from the inability to obtain funding at economically
reasonable level, or sell or pledge an asset at carrying price, in order to cover an
expected or unexpected obligation (Banks, 2005). The International Organization
of Securities Commissioners (IOSCO) (2002) defined liquidity risk as the risk due
to an institution’s inability to meet commitments in a timely and cost-effective
manner while maintaining assets, and in the inability to pursue profitable
opportunities and continue as a viable business due to lack of access to sufficient
cost-effective resources. It is also defined as the risk that an entity will encounter
difficulty in meeting obligations associated with financial liabilities (University of
Cape Town, 2010).
Liquidity risk can arise from a number of areas within an organization, including
unplanned reduction in revenue, increase in operational costs, inadequate cash flow
management and sustained reduction in profitability. NBS as an institution is no
exception to being exposed to liquidity risk, and thus needs to manage liquidity risk
to ensure that the School remains solvent. The consequences of liquidity risk can
be wide-ranging, including impact on supply of goods and services due to the
inability to meet payment terms, breaching bank loan covenants, increase in

21
penalties for non-payment and late payment of liabilities and dues, such as tax
obligations, and it may lead to even insolvency and or bankruptcy. This is in
agreement with the Bank of International Settlements (2001), which states that risk
management does not only affect liquidity, but liquidity can also affect risk
management practices.
Generally, the causes of many business failures stem from the inadequate
management of available cash, the lack of available cash resources, or lack of
access to appropriate financing facilities. An institution with adequate liquidity has
less risk of being unable to meet its short-term financial obligations than an illiquid
one. Where a business has adequate liquidity, there is also the possibility of
improved profitability through reduced interest expense or increased interest
income, together with greater financial flexibility due to enhanced terms from
suppliers and financiers and participation in new business opportunities.
Liquidity risk may be mitigated by careful cash flow management including
unused, committed financing facilities or liquidity buffer. These allow a business
to easily meet its future requirements or contingencies. Brunnermeier and Yogo
(2009) concluded that one way to reduce liquidity risk is to hold excess cash
reserves.
22
2.3.1.2 Credit risk
Credit risk is a form of financial risk and is the most prevalent risk of finance and
business. In general, credit risk is a concern when an institution owed money and
alternatively the institution relies on other institutions to make payments to it or on
its behalf. As a result, credit risk affects the financial performance of institution and
can lead to insolvency and bankruptcy. Consequently institutions are exposed to
credit risk through all business and financial transactions that depend on the
payment and the obligations of others.
Credit risk is the risk of loss due to failure by counterparty to perform on its
contractual obligations (Banks, 2005). This denotes that one party, a defaulter, fails
to make payment on the agreed terms. Amongst the risks faced by institutions of
higher education, credit risk is the most familiar and common one. A safe credit
risk is one that performs as expected, and where relevant, provides the firm with a
planned cash flow. A poor credit risk is one that either delays or defaults on its
obligations, creating a cash flow disruption. Caouette, Altman, Narayanan and
Nimmo (2008), stated that an element of credit risk exists whenever an individual
takes a product or service without making immediate payment for it. Managing
credit risk is one of the next big challenge institutions are expected to face. The
importance and relevance of efficiently in managing credit risk is evident from the
23
huge investment that many institutions are making in this area, including on
training, IT audit etc. Both Banks (2005) and Coaouette et al. (2008), concluded
that a firm that is highly exposed to credit risk is almost certainly exposed to a great
deal of liquidity risk also.
Oldfield and Santomero (1997) pointed out that credit risk may arise from either an
inability or an unwillingness to perform in the pre-committed manner and when
there is money lent and there is a possibility that the borrower may not repay the
lent funds as obligated (Horcher, 2007). This can affect the lender who underwrote
the contract, other lenders to the creditor and the debtors’ own shareholders. In
addition, conventional credit risk arises through lending, investing and credit
granting activities and concerns the return of borrowed money or the payment for
goods and services (Horcher, 2007). It further arises from exposure to counterparty,
the deterioration of credit quality as well as from the environment of rising interest
rates or poor economic fundamentals. Counterparties that may cause credit risk
range from individuals to corporate firms to sovereign governments.
Institutions of higher education suffer from credit risk due to poor credit
administration, poor management practices and ineffective machinery for debt
management. After the financial crisis in 2007, institutions have realized that the
conventional methods of managing credit risk, although important, may not always

24
be sufficient. In addition to traditional credit risk management methods, institutions
are therefore, now looking at more adaptive and innovative approaches to manage
credit risk. There is a focus on understanding the interdependencies between credit
risk and all other types of risks, as organizations look for an integrated enterprise-
wide risk management system. To closely monitor credit risk, institutions
including educational institutions are carrying out rigorous credit analysis of
counterparties and various products.
2.4 Risk Management
The concept of risk management is not new and there is substantiation of risk
management activities dating back to the dawn of time. There are indications of
forward dealing dating back as early as 2 000 BC, forward trading in grains in the
early years and by the middle ages risk sharing was widely used. The development
of risk management as a formal and structured method to deal with uncertainties in
an organizational context has taken over the last several years. Risk management
has evolved from the traditional insurance to the invention of quantification
techniques. Similarly, various institutions have developed unique and institution
specific risk management standards that arise out of business and statutory
requirements. Institutions such as education and health care institutions have
developed industry specific practices, which govern their risk management
standards and practices.

25
There has been a lot of research that explored risk management. Amongst the many
scholars, the works of Halim (2007), Herring and Santomero (1991), Stulz (2005),
Jensen and Meckling (1976) can be cited as examples. In addition, the development
of risk management frameworks and standards by the risk committees such as the
Committee of Sponsoring Organizations (COSO) and the International
Organization for Standardization (ISO), serves the proof that risk management is a
worldwide activity that requires effective management. The need to manage risk is
widely acknowledged throughout the corporate world, and well-developed
knowledge is available to guide efforts to do so. This effort is still continued today
and scholars are constantly searching for better and more effective ways of
managing risk in different environments.
Risk management has expanded from a mechanism for managing credit and market
risks in the financial sector (Wahlstrom, 2009) to a dominant mechanism for
governance and controlling public institutions in the regulatory state (Hood et al.,
2001; Moran, 2003). The outcome of increasing risk in global markets is that risk
may originate from events thousands of miles away and may have nothing to do
with the domestic market; still the local market may be severely impacted. For
example, an earthquake can cause loss of buildings, lost reputations, lost customer
confidence and increased operational costs during and after recovery. For the

26
reason, risk management is more important and developed in the financial sector
than in any other sector (Carey, 2001).
Many scholars have defined risk management in many different ways. For example,
Partnerships (2005) maintain that risk management is a process to manage the
potential risks by identifying, analysing and addressing them. The process helps to
reduce the negative impact from emerging opportunities, whereby the outcome may
help to mitigate the likelihood of risk occurring and the negative impact when it
actually happens.
The Committee of Sponsoring Organizations (2004) defined Enterprise Risk
Management (ERM) as a process, effected by an entity’s board of directors,
management and other personnel, applied in strategy setting and across the
organizations, designed to identify potential events that may affect the entity, and
manage risk to be within its risk appetite, to provide reasonable assurance regarding
the achievement of the entity’s objectives.
Anderson and Terp (2006), maintain that risk management can be defined as a
process that should seek to eliminate, reduce and control risks, enhance benefits,
and avoid detriments from speculative exposures. The objective of risk
management is to maximise the potential of success and minimise the probability

27
of future losses. They concluded that risk that becomes a problem can negatively
affect cost, time, quality, and system performance.
Managing risk is important for organization’s success. It is thus imperative that
organizations have processes in place for risk management to be effective. Risk
management is a dynamic process that should evolve with an organization and its
business objectives as it impacts many parts of an organization. For the process to
be effective, it should involve both internal and external analysis. Horcher (2005)
identified three broad alternatives to manage risk, viz., actively or passively by
default, accept all risks, hedge a portion of exposure by determining which
exposures can be and should be hedged and hedging all exposures possible. This
sentiment was shared by Oldfield and Santomero (1997) who also identified the
same mitigating approaches.
Some colleges and universities equate risk management to crisis management,
whilst some associate risk management with compliance risk. Some universities
focus on managing the downside, rather than seeing risk as an opportunity, whilst
others equate risk management with lessening exposures. However, the risk
management is about the process to eliminate, reduce and control risk, which
involves identifying, analysing, measuring, monitoring and controlling risks,
reducing the negative and enhancing emerging opportunities and achievement of
business strategy and objectives
28
Cassidy, Mattie, Johnson and Morley (2003) stated that risk management is about
encompassing all of the operational, financial, compliance and strategic issues that
an organization might encounter in its attempts to achieve its objectives. As a result,
a balanced view of risk is ideal, one that tries to minimize hazards, influence and
control uncertainties and manage opportunities. A key benefit from risk
management is to enhance the efficiency of operations within the organization. It
should further help ensure that business processes are effective and that the selected
strategy is efficacious. Although risk management is a business process, it is not a
process that functions in isolation. It is also not a once-off activity but is performed
on a daily basis as a part of the ongoing operations.
2.4.1 Financial risk management
Financial risk management has always been imbedded in the management of the
organization. Its development as a major management responsibility is the result of
two post-war developments, the collapse of the fixed exchange rate system and the
first oil shock during the 1971-1974. The above evidence is testimony of the
ongoing problems presented by risk in human life and the willingness of the
individuals to provide or make arrangements to moderate risk’s worse effects. As a
result of the increased risk, organizations have responded to increased financial risk
by searching for better methods to manage the risk.

29
Financial risk management is a process to deal with uncertainties resulting from
financial markets and involves assessing the financial risk facing an organization
and developing strategies consistent with internal priorities and policies (Horcher,
2007). Moles (2013) stated that financial risk management is the task of monitoring
financial risks, managing their impact and falls within the financial function of an
organization. Well-known authors in the field, Smith, Smithson and Wilford (1995)
expressed that financial risk management is a value enhancing strategy aimed to
motivate management to concern itself with risk and embark upon a careful
assessment of both the level of risk associated with any product and product risk
mitigating technique.
Financial risk management is defined as the process of evaluating and managing
current and possible financial risk at a firm as a method of decreasing the firm's
exposure to the risk. It is an ongoing dynamic and interactive process that involves
assessing the financial risk facing an organization and developing risk management
strategies consistent with internal priorities and policies. Moles, (2013) concluded
that financial risk management is the task of monitoring financial risks and
managing their impact. Managing risk is part of an organization’s strategic and
operational activities.
Managing financial risk necessitates making organizational decisions about risks
that are acceptable versus those that are not. The passive strategy of taking no action

30
is the acceptance of all risks by default. Organizations manage financial risk using
a variety of strategies and products. It is important to understand how these products
and strategies work to reduce risk within the context of the organization’s risk
tolerance and objectives. The process of financial risk management is an on-going
one and organizations manage financial risk using a variety of strategies and
products. The financial risk management process includes identifying and
prioritizing key financial risks, determining an appropriate level of risk tolerance,
implementing risk management strategy in accordance with policy and measuring,
reporting, monitoring and refining it as needed.
Horcher (2005) identified diversification as an important tool in managing financial
risk. Diversification among counterparties may reduce the risk that unexpected
events adversely impact the organization through defaults. Diversification of
customers, suppliers, and financing sources reduces the possibility that an
organization will have its’ business adversely affected by changes outside the
management control. Although the risk of loss still exists, diversification may
reduce the opportunity for large adverse outcomes.
Recent literature has highlighted the importance of sound financial management
systems that enable institutions to gain better understanding of risk management
procedures and examine the critical success factors to effective risk management

31
procedures. Effective risk management is required to maximize efficient use of
resources, create the highest level of transparency and accountability and ensure
long-term economic success.
2.4.1.1 Liquidity risk management
Liquidity risk management (LRM) is an integral part of the asset and liability
management process. Failure in LRM may result in institutions becoming unable
to meet their obligations, which scenario if played out may easily cause institutions
to fail. LRM sets down clear policies, which should be communicated to key
decision makers within an institution. LRM should be managed within a defined
risk management framework. Accordingly, liquidity risk may be mitigated by
careful cash flow management including optimising working capital and by
maintaining unused financing facilities or liquidity buffer.
The Certified Practising Accountants (CPA), Australia (2010) has identified two
main methods of managing liquidity risk, namely cash flow forecasting and
optimising working capital. For effective cash flow forecasting, the annual
operating budget should form the basis for monitoring and managing cash flow
forecasts. Cash flow forecasts should be compared to the annual budget for the
identification of variances and subsequent corrective actions to offset unfavourable
trends. However, a budget without the necessary basic ingredients to manage the
32
above can also be devastating to the budget and financial flow of the programme.
According to the Basel Committee on Banking Supervision (1999), all institutions
are responsible for sound management of liquidity risk including developing robust
liquidity risk management framework that ensures that they maintain sufficient
liquidity, including liquidity buffer or cushion. It is imperative that businesses
understand their risks, including the potential liquidity risk within their business
and how to manage and monitor them.
2.4.1.2 Credit risk management
All activities have some risk component that can be managed. Subsequently
methods, tools and techniques for risk management have been developed and
continue to be developed as the risks and industries evolve. Badu (2012), described
Credit Risk Management (CRM) as a management tool which attempts to eradicate,
reduce and manage risk, increases the benefits and avoids harm from taking risk.
In effect, CRM enables organisations to improve in terms of financial performance.
The CRM processes should cover the entire credit cycle starting from the
origination of the credit in a financial institution’s books to the point the credit is
extinguished from the books (Glantz, 2002). Credit risk management is a managing
tool that helps to lessen the rate of credit risk. The essential functions of credit risk

33
management according to Raghavan (2003) are to identify, measure and more
importantly monitor the clients’ profiles.
Wenner, Navajas, Trivelli & Tarazona (2007) spelled out that CRM enables
institutions to become viable and attain sustainable growth, leads to solvency and
reduces costs and improves profit margins. Santomero (1997) highlighted some
benefits of CRM. He articulates that the practice of CRM helps reduce the chances
of losses from standard activities by eliminating risks that are unnecessary to the
institution’s business purpose. Furthermore, Santomero (1997) argued that CRM
leads to standardised credit ratings across borrowers and a credit portfolio report
that presents meaningful information on the overall quality of the credit portfolio.
According to the Basel Committee on Banking Supervision (1999), maintaining an
appropriate credit administration, measurement and monitoring process,
establishing adequate controls, specifying role of supervisors in order to measure,
monitor and control credit risk is part of an overall approach to credit risk
management. With the effective and efficient use of these methods, institutions can
attain high financial performance and remain solvent.
On the contrary, there are some demerits that may prevent some institutions from
practicing credit risk management. These are costs on systems and expertise, which
34
are high and can easily affect the firm’s performance. These costs are usually
experienced in the early stages of implementation. As a result, due diligence is
required in order to keep costs at parity to ensure an effective management of credit
risk. Further, the success of CRM is dependent on the institution’s relationship with
its employees as well as quality management and successful execution of the risk
management process.
The most effective credit risk management solutions focus on processes, culture,
people and the organisation as a whole. Additionally, there is a focus on
understanding the interdependencies between credit risk and other types of risks as
firms look for the integrated enterprise-wide risk management system.
2.5 Strategy
Mintzberg and Quinn (1991) and Mintzberg, Quinn, Lampel and Ghoshal (1998)
defined strategy as a plan, a ploy, a pattern, a position and a perspective. Strategies
articulate the goals and objectives of an organization and clarify how the
organization as a whole responds to the various stakeholders (Buckland, 2009;
Mintzberg, 1987; West, 2008). However, no single strategy or single strategic
direction is self-evident (Rose, 2003). Strategy as a position looks outside an
organization seeking to locate the organization in its environment, whereas strategy
as a perspective looks inside the organization and inside its member’s heads,
referring to a shared way of perceiving the world.

35
2.5.1 Strategic planning
Dooris, Kelley, and Trainer (2002) acknowledged that strategic planning is still
new as a management practice. They identified the period between 1950 and 1970
as the time when strategic planning emerged and further noted that strategic
planning has been booming for the last decades. Bryson (2004) defined strategic
planning as a disciplined effort to produce fundamental decisions and actions that
shape and guide what an organization is, what it does, and why it does it. It is an
organizational management activity that is used to set priorities, focus energy and
resources, strengthen operations, ensure that employees and other stakeholders are
working toward common goals, establish agreement around intended
outcomes/results, and assess and adjust the organization's direction in response to
the changing environment.
Accordingly, Wilkinson and Monkhouse (1994) stated that strategic planning is “a
method used to position an organization, through prioritizing its use of resources
according to identified goals, in an effort to guide its direction and development
over a period of time”. It typically involves a process of planning, which results in
the organization’s strategic plan. Institutions need to understand their strategies and
objectives, identify and assess their risks, determine mitigation actions and develop
communication and monitoring plans. To successfully do this, institutions need to
consider their underlying business and financial model including funding sources.

36
The institutions need to know their key funding sources and make provision for
changes from year to year to ensure that their business and financial model is not
intuition dependent.
Effective strategic planning articulates not only where an organization is going and
the actions needed to make progress, but also how it will know if it is successful.
This includes planning the organizational goals, the actions needed to achieve the
goals and other critical elements that will ensure the successful planning and
achieving of the strategic goals. The process involves discovering a variety of
strategic options on the road to reaching other major strategic decisions that become
the essence of the corporate strategy.
2.5.1.1 Environmental scanning
There has not been complete agreement among researchers on specific steps in
strategic planning process. Much of the literature acknowledges that strategic
planning process must include the scan of the environment and assessment of the
impact of environmental changes on the organisation. Trainer (2004) stated that
environmental scanning is crucial at the beginning of any planning process.
Wheelen and Hunger (2003) maintained that environmental scanning is monitoring,
evaluation and dissemination of information from the external and internal
environments to key people within the corporation. Its purpose is to identify
strategic factors that are the external and internal elements that will determine

37
future of the organization. The simplest way to conduct environmental scanning is
through SWOT (strengths, weaknesses, opportunities and threats) analysis.
According to Thompson and Strickland (2003), Wheelen and Hunger (2003),
Anheier (2005), the study of Strategic Management involves the monitoring and
evaluating of external opportunities and threats in the light of the organization’s
strengths and weaknesses (SWOT). Opportunities are positive environmental
trends or changes that will help the organization to improve its performance.
Strengths are resources that the organization possesses and capabilities that the
organization has developed which can be exploited and developed into, attainment
of sustainable competitive advantage. Weaknesses are resources and capabilities
that are lacking or deficient, which prevent the organization from developing a
sustainable competitive advantage. Ruocco and Proctor (1994) suggested that
environmental analysis is a critical step in the planning process that must be
performed to collect all relevant information to develop appropriate strategies. The
authors are also in support of the use of the SWOT analysis as an effective and
systematic way of matching the organizations strength and weaknesses with the
opportunities and threats that exist in the environment.
Nevertheless the strategic planning process has been depicted as the development
of decision making rules that guide future organizational actions. To understand the
strategy making process by examining the organizational environmental context is

38
crucial (Miller & Freesen, 1978). Strategy formation can be viewed as the interplay
between external and internal dynamics of changing environment with leadership
mediating these two variables (Mintzberg, 1978). When the scanning intensity is
insufficient, the managers will confront some serious problems (Yukl, 2002).
There has been a tendency to emphasize the role of strategic planning propensity
of managers in recent years (Andersen, 2000). Managers must correctly perceive
the nature and dictations of the environment. Environmental scanning and the
perceptions on the environment have powerful effects on strategic planning
approaches and strategic orientations of managers (Goll & Rasheed, 1997; Pelham,
1999; Barringer & Bluedorn, 1999).
Thus it can be deduced that environmental factors such as market dynamism,
technological change, market munificence, environmental uncertainty, necessitate
higher level of environmental scanning and strategic planning efforts of top
managers aiming to increase their organizational performance by making
appropriate strategic choices. Environmental scanning extends to learning and
gathering about events and trends in the organizations’ environment (Hambrick,
1981). Scanning intensity is related to strategic choices (Mintzberg, 1973; Ansoff,
1975; Barringer & Bluedorn, 1999). These choices usually seek to increase the

39
firm’s innovativeness, adaptation, and agile strategic responses to changes in the
external environment (Zahra & Garvis, 2000).
2.5.1.2 Strategic planning process
Authors have commonly identified the steps involved in the planning process and
have treated planning as a thoughtful process that result in to explicit plan. Bryson
(2004) provided a simple structure for the strategic planning process by defining
the ABC’s of strategic planning. According to Bryson, A is where you are, B is
where you want to be and C is how you get there. The vision, mission, and goals of
the organization help it move from A to B. Strategy formulation connects A to C
and strategy implementation connects B to C.
However, Bryson cautions against the temptation by organizations to adopt the
planning process as written, but to note that strategies change cycles and it should
be tailor made to fit the specific situation of an organization for it to be most
effective. This notion is supported by Lorange and Vancil (2000) who stated that
there is no single best system for planning and they suggested that the process must
be developed to be organization specific and to take into account the unique
characteristics of each organization.

40
2.5.2 Strategy formulation
Wheelen and Hunger (2003) defined strategy formulation as the development of
long range plans for the effective management of environmental opportunities and
threats in the light of corporate strengths and weaknesses. Concurring with the
foregoing definition, Stahl and Grigsby (1997) stated that strategy formulation
involves decisions that determine the organization’s mission and establish its
objectives and strategies. It is this stage, therefore, that the definition of an
organization’s vision, mission, objectives, strategies and setting out of policy
guidelines takes place.
Katsidoudes (2002) suggested that organizations need to establish a base from
which realistic and achievable plans can be formulated. At the foundation of such
a base SWOT analysis needs to be undertaken. Examination of strengths and
weaknesses constitutes an internal analysis and an examination of opportunities and
threats is an external analysis.
Strategy formulation is about how the firm chooses to define its strategy and how
it approaches its implementation through strategic management (Bowman, 1998).
The approach to strategy formulation will ultimately dictate the eventual
management style. In contrast, the managerial style and the degree of effectiveness
of senior managers involved can influence the nature of strategy formulation in

41
organizations (Analoui, 1997). Only after a firm has determined how it will
formulate its strategy can the path of strategic management be effectively
undertaken. The development of a strategy can be either formal or rational
(Mintzberg, 1994), emergent or progressed (Whittington, 2001) under a logical
incremental path.
Corporate strategy formulation according to (Armstrong, 2006) can be defined as a
process for developing a sense of direction. In theory the process of formulation
of strategy consists of the following steps:-
i. Define mission
ii. Set objectives
iii. Conduct internal and external environmental scans to assess internal
strengths and weaknesses and external opportunities and threats (SWOT
Analysis).
iv. Analyze existing strategies to determine their relevance in the light of the
internal and external appraisal.
v. Define in the light of this analysis the distinctive capabilities of the
organization.
vi. Define the key strategic issues emerging from the previous analysis.

42
vii. Determine corporate and functional strategies for achieving goals and
competitive advantages taking into account the key strategic issues.
In addition, Bryson (1995) maintained that strategy formulation may be a five step
process, which includes the identification of practical alternatives and dreams or
visions for resolving strategic issues phrased in action terms, enumerating barriers
to achieving these alternatives, developing major proposals for achieving the
alternatives either directly or indirectly by overcoming the barriers, listing actions
that must be taken over a period of time to implement the major proposals and a
detailed work program for a period of time spelt out to implement the actions.
2.5.3 Strategy implementation
Strategy implementation has received increasing attention in literature.Thompson
and Strickland (2003) wrote that strategy implementation is the least charted, most
open ended part of strategic management. Wheelen and Hunger (2003) stated that
strategy implementation is the process by which strategies and policies are put into
action through the development of programmes, budgets and procedures. Lynch
(1997), concurring with other authors defined strategy implementation as the
process by which organization’s chosen strategies are put into action and entails
converting the organization’s strategic plan into action and finally into results. Stahl
and Grigsby (1997) defined strategy implementation as those activities and

43
decisions that are made to install new strategies or support existing strategies.
According to Wheelen and Hunger (2003) strategy implementation is the process
by which strategies and policies are put into action through the development of
programs, budgets and procedures. The Balance Scorecard, which is widely used
in most institutions, is one tool to organize management system and put the strategic
goals in practice (Kettunen, 2009).
Consequently, it has been observed of late that most organizations are in a position
to formulate comprehensive corporate strategic plans but encounter serious
problems during the subsequent implementation stage. Emphasizing the
importance of strategy implementation Carrols (2000) highlighted that
organizational success depends not only on designing strategies that are appropriate
for external and internal environments but on implementing those strategies
successfully. Poor strategy implementation practices have been blamed for a
number of failed attempts at changing the strategic direction of organizations.
The strategy implementation process is linked to the external and internal
environments of an organisation. According to Kaplan and Norton (2002), and
Welsh (2006), strategy must be a continuous process in which the ability to skilfully
balance the tensions between the stable and changing circumstances is of
paramount importance. Strategy implementation is arguably the most important
stage in the process for the simple reason that without successful implementation,

44
an organization’s strategy is really nothing more than a fantasy (Harris & Moran,
2000). Implementation according to Katsioloudes (2002) should not be treated as a
separate part of the process. It should be explicitly considered in the formulation
stage so that any resulting strategy is implementable. Grant (2005) suggested that
without effective implementation, the best laid strategies are of little use.
2.6 Strategic management
A study of this kind cannot pass without a discussion and an understanding of the
concept of strategic management. The concept of strategic management is widely
studied and as a result various definitions emerge. Wheelan and Hunger (2002)
defined strategic management as a set of managerial decisions that determine the
long term performance of a firm. Bracker (2001) argued that the concept entails the
analysis of external and internal environments of a firm to maximize the effective
use of resources in relation to its objectives. According to Mintzberg (1979)
strategic management is a mediating force between the organization and
environment: consistent patterns in streams of organizational decisions to deal with
the environment. Vinzant and Vinzant (1996) defined strategic management as “a
process that focuses on the long-term health of an organization. It primarily relies
on the integration of strategic planning, resource allocation and control, and
evaluation processes to achieve strategic goals”.

45
Anheier (2005) stated that strategic management is the process which organizations
develop to determine their long – term vision, direction, programs and performance.
Strategic planning involves various techniques and tools to ensure careful
formulation, effective and efficient implementation and evaluation. Strategic
management integrates organizational functions and unites them into a more
cohesive, broader strategy. It involves the ability to steer the organization as a
whole through strategic change under conditions of complexity and uncertainty.
Wheelen and Hunger (2003) stated that the strategic management process can be
viewed as having four basic elements as illustrated below:
BASIC MODEL OF STRATEGIC MANAGEMENT PROCESS
Figure 2.1: Strategic Management Basic Model
ENVIRONMENTAL
SCANNING
STRATEGY
FORMULATION
STRATEGY
IMPLEMENTATI
ON
STRATEGY
EVALUATION
AND CONTROL
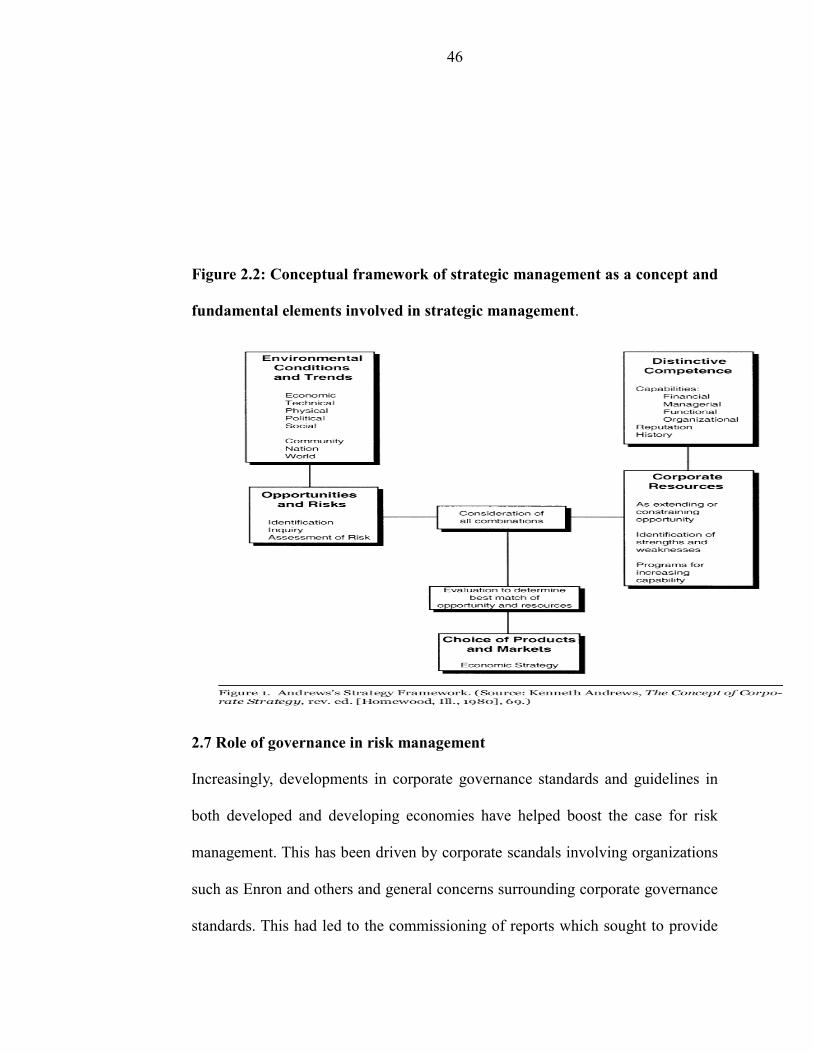
46
Figure 2.2: Conceptual framework of strategic management as a concept and
fundamental elements involved in strategic management.
2.7 Role of governance in risk management
Increasingly, developments in corporate governance standards and guidelines in
both developed and developing economies have helped boost the case for risk
management. This has been driven by corporate scandals involving organizations
such as Enron and others and general concerns surrounding corporate governance
standards. This had led to the commissioning of reports which sought to provide

47
remedial suggestions. For example, the Cadbury report (1992) addressed the role
of the Board of Directors and internal control mechanisms. Other reports have
looked at other areas of concern ranging from Greenbury Report (1994) on Director
Remuneration to the Combined Code of Corporate Governance (1998), which
addressed financial reporting, disclosure, accountability etc. In Namibia, the Nam
code on corporate governance was commissioned to address the issue of role of
directors.
These reports have embedded risk management themes and emphasized on the
importance of sound internal controls and risk management systems (Keasey, Short
& Wright, 2005). Though these reports and codes are all voluntary in nature and
are meant for public listed organisations, however, they are adhered to by both listed
and non-listed organisations.
The Higher Education .Funding Council of England (HEFCE) guidelines for the
higher education sector defined corporate governance as the means by which
strategy is set and monitored, managers are held to account, risks are managed,
stewardship responsibilities are discharged and viability ensured (HEFCE, 2005).
However, for all other institutions it has become impractically unthinkable to relate
to governance and management without referring to risk management and in some
cases, it has become a legal requirement and necessity (Huber, 2009).

48
2.8 Studies in strategy management
Ragui and Weru (2013), studied the managerial process of crafting and executing
strategy and identified and laid significant emphasis on the five major phases of the
managerial process of crafting and executing a strategy. The five phases are the
development of the strategic vision, setting objectives, crafting a strategy to achieve
objectives, implementing and executing the chosen strategies efficiently and
effectively, and evaluating the performance of the new adjustments within the
organisation. The scholars stated that although Senior Managers have the lead
responsibility for crafting and executing a company’s strategy, it is the duty of the
Board of Directors to exercise strong over-sight in ensuring that the five tasks of
strategic management are carried out for the benefits of the shareholders as well as
stakeholders.
They alluded that today’s success does not guarantee tomorrow’s success, and
therefore suggested that there is a need to understand the evolution of strategic
management processes with the view to determining how managers are likely to
strategically craft and implement strategies that will ensure their firms attain
strategic fit. The scholars stated that it is important for the firms to have skilled
people or hire experts to always scan the environment in order to come up with
better strategies. The conclusion from the study is that Good Strategy + Good
Strategy Execution = Good Management and that competent execution of a well-

49
conceived strategy is the test of managerial excellence and a proven recipe for
organisational success.
Halim (2007) studied the development of a formal and integrated risk management
framework in the higher education sector in the United Kingdom, case study of the
University of Nottingham. Information on risk management was obtained from the
financial industry on the techniques and applications. He found that the financial
industry’s risk management framework is more advanced and at the same time also
concentrate on preserving and enhancing the shareholders values. He further found
that the risk management techniques and practices of the financial industry can be
applied to the higher education sector. However, these techniques and practices
requires modifications to fit the education sector, institutions constitutions as well
as regulatory requirements. He concluded that a risk management framework that
is integrated and structured works to the advantage of the Universities, that if
leverage upon can enhance the Universities competitiveness, stability and
sustainability.
2.9 Gaps in knowledge emerging from literature review
From the review of literatures on risk and risk management and strategy and
strategic management given above the following gaps in knowledge were
identified.

50
a) Most of the literary works reviewed were from financial sector and not from
education sector. The financial sector is very much different from the
education sector in terms of development and structures in place. Thus the
experiences, impacts and processes in the financial sector may not be the
same as in the education sector. This is in support of the statement by Stulz
(1996) and Crouchy, Galai and Mark (2000), who stated that most of the
traditional research on risk management has been finance dominated and
technical.
b) Most of the literature reviewed was from foreign countries and not from
Namibia. The environment, experiences and level of development of the
foreign countries may not be the same as those of Namibia.
c) In Namibia, the education sector has been going through a lots of changes
and most of the business schools have only been in existence for a short
period of time after being established during the last 10 years and are still
in the development stage. The literature on how risk management functions,
how risk management strategies are implemented, how educational
institutions have adopted risk management strategies, what are the problems
faced by these institutions during and after the implementation of risk
management strategies, what are the cost and revenue implications to the
institutions of such initiatives, how the stakeholders faced and overcame the
51
problems and the prospects of risk management remain unknown and need
further investigation.
The reviewed literature should not be used as a representation of the Namibian
institutions, as it will not construe to similar insights of the variables under study.
The present study on ‘Financial Risk Management Strategy for a Business School:
A Case Study of Namibia Business School’ has attempted to fill in this gap in the
context of the requirements of business schools in developing countries.
2.10 Conclusion
This chapter covered review of literature on risk management. The literature
reviewed focused on risk management in institutions including profit making and
not for profit institutions with specific focus on risk management strategies
employed by the institutions to manage risk. Risk is a common factor for all
organizations and this section substantiated that risk is not limited to large
corporations such as banks but higher education institutions also face a host of risks.
Further, most organizations have developed risk management strategies. However,
implementation of these frameworks remains a challenge and has seen many
institutions failing.
52
CHAPTER THREE: RESEARCH METHODOLOGY
3.1 Introduction
The term methodology refers to a systematic, theoretical analysis of the methods
applied to a field of study or the theoretical analysis of the body of methods and
principles associated with a branch of knowledge (Saunders, 2012).
This chapter on research methodology broadly described the research process
undertaken including the research methods used to obtain information from
different stakeholders. It further focused on discussing the research design,
population of the study including how the participants were selected and
approached, described how the data were collected, processed and analysed as well
as ethical considerations and the protection of rights of the research participants.
3.2 Research design
Research design is the blue print for any research. It provides the road map for
undertaking a research. This research is based on case study of Namibia Business
School (NBS). In this research, the researcher has used the mixed method approach,
which is both quantitative and qualitative, which investigates liquidity and credit
risks that NBS is exposed to and is explorative in nature. The study used qualitative
research method for data collection and quantitative research method for data
analysis and interpretation. Quantitative research method includes surveys and
controlled experiments of which various tools such as, on line questionnaires for

53
field survey and telephone interviews, can be used to collect data (Aliaga &
Gunderson, 2002). It focused on the study of NBS’s audited financial statements,
bank statements, internal policies and procedures, service provider’s records as well
as students’ financial records for the period from 2009 to 2011, in order to identify
and determine the nature and extent of financial risk NBS is exposed to in its
operations.
3.3 Population
The research population is described by Akpo (2006) as the entire group of persons
or set of objects and events of interest to the research. There were three different
but related populations in this research. One set of population targeted for this
research consisted of NBS Assistant Director and Officer: Corporate Services. The
second population that participated in this research included the service providers
who were contracted by NBS between 2009 and 2011. The third set of population
consisted of former students of NBS enrolled during these academic years.
3.4 Sample
A sample consists of a group of entities that are representative of the population. A
sample is drawn in case not the whole population but a part of it is considered
adequate for the purpose of the study. The size of the sample is generally
determined by the population of the research subjects to be covered under the

54
survey. According to Leedy and Ormrod (2010, p.213) if the population is less than
100, there is no need to sample, but to survey the entire population. If the population
size is around 500, sample may be 100. However, there is no hard and fast rule that
specifies the correct number of participants in a qualitative study. Qualitative
studies can be carried out with a single participant or, when studying multiple
contexts, may have as many as 60 or 70 participants. The authors further argued
that, there are two general indicators used to determine whether a sample is of
sufficient size, namely representativeness and redundancy of information.
Redundancy of information can only be ascertained after collection of field data, at
the data analysis stage.
The sample for this research was drawn from the former students who were enrolled
at NBS during the academic sessions from 2009 to 2011 and the service providers
who were contracted and engaged with the School during the same period. The
researcher drew the sample using simple random sampling method. The sample
thus drawn consisted of ten (10) students from each year (10 + 10 + 10 = 30) for
three years and three (3) service providers from each year (3 + 3 + 3 = 9) for three
years. Thus the size of the sample was 39. Access to all available records of
financial transactions including NBS annual financial statements, debtors’ ledger,
bank statements, suppliers’ records as well as students’ fee records were sought and
information was drawn from the same as per the requirement of the research.

55
Besides the official records and documents of the NBS such as UNAM’s Finance
policy and procedure Manual that guides its operations and decisions were also
scanned.
3.5 Research Instruments
The research was primarily based on the study of existing policies, procedure
manuals and records of NBS on the one hand and extensive interviews conducted
with the staff of NBS to understand the policies and procedures in practice on the
other hand. Besides, questionnaires were designed by the researcher for the
collection of information former students and service providers through a survey.
A questionnaire is a research instrument used to collect data in a field study in a
personally administered manner from the desired sample frame. Maree (2000)
emphasised that by completing the questionnaires in a short possible time
questionnaires allow many respondents to provide information.
Extensive interviews were conducted with NBS staff to gather information that
addressed the research questions. The interviews were recorded and described in
field notes. In addition, official records and documents such as suppliers’ records,
former students’ accounts as well as NBS’ bank statements were also used as
sources of information. This method was more flexible and yielded information that
the researcher required.

56
3.6 Questionnaire Construction
The questionnaire used for this research consisted of 26 structured and semi-
structured questions and was divided into four sections as follows:
a) Section A: Four (4) structured questions on demographic and personal
data of respondents.
b) Section B: Four (4) semi-structured questions on understanding and
identifying financial risks.
c) Section C: Six (6) Likert scale type structured questions, two (2) Yes/No
questions on service delivery by service providers and three (3) open
ended questions for suggestions by the participants.
d) Section D: Two (2) check list format structured questions on the work
environment and working conditions at Namibia Business School
This type of questions allowed easy computer analysis of data using IBM SPSS 21
software package. The Likert rating scales allow the researchers to assess the
behaviour of participants (Welmann, Kruger and Mitchell, 2005). This is also
supported by Leedy and Ormrod (2010) and they mentioned that rating scales are
more useful when behaviour, attitude, perceptions or other phenomenon of interest
need to be evaluated on a continuum basis. Since financial risk management is a
behavioural aspect in operations management, the researcher found it necessary to
use the Likert scales in some of the questions in the questionnaire.
57
3.7 Procedures
The main source of primary data for this research was the NBS audited financial
statements, debtors’ ledger and students’ financial records. The researcher chose to
use only audited financial statements as these show compliance of the School to the
International Financial Reporting Standards (IFRS) and the Generally Accepted
Accounting Principles (GAAP) requirements. The students’ financial records are
the primary source of students’ financial information. Besides, the researcher
examined the NBS bank statements, current and existing policies and procedure
manuals and other documents. After developing adequate understanding of the state
of affairs of the study variables, the researcher undertook data collection through
questionnaires and interviews.
The majority of the questionnaires were emailed to participants, while the rest were
handed over to the participants personally. The questionnaires were collected from
the research participants at minimum time, one day after being handed over. A
checklist was used to ensure that the questionnaires distributed were collected. Each
questionnaire collected was checked for completeness. For the questionnaires
found incomplete, the participants were informed and explained the questions and
thereafter advised that they should provide complete answers. This facilitated the
field survey work.
58
3.8. Data Analysis
The data collected from different sources were organised and analysed using
appropriate methods and procedure. Quantitative data and qualitative data were
organised separately.
3.8.1 Quantitative Data Analysis
Leedy and Ormrod (2010) stated that the important tool for organizing data is the
electronic spread sheet, a software program that allows a researcher to manipulate
data displayed in a table, where the Microsoft Excel is widely used. The researcher
used SPSS and Microsoft Excel for coding, data management, data organization
and data analysis. The researcher made use of descriptive statistics such as tables,
charts and frequencies for the presentation of results. The responses to all items
were classified and tabulated in different categories using the IBM SPSS 21
software. The coded data was inputted into SPSS and frequencies were generated
in order to determine the percentages and cumulative percentages of the variables.
Variables forming part of the study were identified and their status, change and
trend were identified and interpreted and where possible linked to literature review
to gain fuller understanding from both categories of primary data and secondary
data in this research. The findings of the study are presented in chapter four of this
research report.

59
3.8.2 Qualitative Data Analysis
Qualitative data was analysed differently using qualitative methods. Interpretive
researchers attempt to derive their data through direct interaction with the
phenomenon being studied. An important aspect of data analysis in qualitative case
study is the search for meaning through direct interpretation of what is observed by
themselves as well as what is experienced and reported by the subjects. Bogdan and
Biklen (2003) defined qualitative data analysis as “working with the data,
organising them, breaking them into manageable units, coding them, synthesising
them, and searching for patterns”.
The aim of analysis of qualitative data is to discover patterns, concepts, themes and
meanings. Regarding case study research, Yin (2003) discussed the need for
searching the data for “patterns”, which may explain or identify causal links in the
data base. In this process the researcher concentrates on the whole data first, then
attempts to take it apart and re-construct it again more meaningfully. Categorisation
helps the researcher to make comparisons and contrasts between patterns, to reflect
on certain patterns and complex threads of the data deeply and make sense of them.
The process of data analysis begins with the categorisation and organisation of data
in search of patterns, critical themes and meanings that emerge from the data. A
process sometimes referred to as “open coding” is commonly employed whereby
the researcher identifies and tentatively names the conceptual categories into which

60
the phenomena observed would be grouped. The goal is to create descriptive, multi-
dimensional categories that provide a preliminary framework for analysis.
These emerging categories are of paramount importance as qualitative researchers
tend to use inductive analysis. In a case study like the present one, the data
collection and analysis can also go hand in hand in an iterative manner in that the
results of the analysis guide the subsequent collection of data. Data collection and
analysis inform or drive each other, with the result that the analysis becomes a
higher level synthesis of the information. The iterative cycle is repeated and themes
and sub-themes checked and revised as the process continues.
In the present study, the interview results were recorded and transcribed. The
individual responses were analysed, compared and categorised. The collected data
was interpreted and explained against the relevant research questions. The data
collected through interviews were analysed only qualitatively. Interviews were tape
recorded for systematic analysis. The recorded information was analysed in order
to search for common themes and patterns for understanding the extent of financial
risk on NBS operations and performance. Content analysis through coding was then
used to draw conclusions. The process followed in analysing and presenting the
data was based on data analysis depicted in figure 3.1 below. The model was
derived from the logic model approach. Actor-Network theory (ANT) could have

61
been an appropriate framework to use in this study. The theory is a philosophical
approach which attempts to comprehend complex social situations by paying
attention to relation elements, referred to as associations (Latour, 2005). Initially,
the theory emerged as a way to study the process of producing scientific knowledge
(Shapin, 1995). The theory focuses on human and non-human actors (in form of
ideas), (Sheehan, 2010). This underpins the weaknesses of the theory. The theory
is further compounded by its focus on investigating micro-contexts (Mclean &
Hasard, 2004). However, the theory only provides structural explanations. Given
these limitations, the theory was not used in this research.
Figure 3.1: Data Analysis process (Source: Creswell, 2009)
7. Interrelating
themes/descriptions
7. Interpreting the
meaning of the
themes
1. Validating the
data accuracy of
the information
6. Themes
5. Coding of the data (manually)
2. Read through raw data
(transcripts/questionnaires
3. Organizing and
preparing data for
analysis
4. Read through all
the data
6. Codes
62
Figure 3.1 above depicts the various steps that are involved in the explanation of
the data analysis model. The steps range from step 1 up to step 7.
Step 1: Involves the validation of data for accuracy of information. In this process,
the researcher validated the accuracy of the data transcribed by professionals, by
reading through each transcription several times comparing them against their
respective recordings.
Step 2: In this part of the process of data analysis, the researcher carefully read
through all raw data of the transcripts several times to get a general sense of the
information and to reflect its overall meanings and identify themes and sub-themes
of the interview.
Step 3: The researcher organized and prepared the data for analysis by sorting and
organizing the data into different categories/themes as per sub questions formulated
from the main research question.
Step 4: The researcher read through all data carefully once again. The reason was
to find out what the participants are really saying, what ideas emerge from the data
and what is the impression of the overall depth, credibility, and use of the
information. At this stage the researcher started to look for general patterns,
similarities and differences in the responses from the subjects.

63
Step 5: At this stage the coding system used in this research was outlined. The
researcher began by making detailed analysis with a coding process. In this case
the researcher only coded the interviewees as N1 and N2 respectively.
Step 6: At this stage, themes and sub-themes were identified. The researcher
focused on themes and sub-themes predetermined from the sub-questions of the
main research question by organizing the material into segments of text before
bringing meaning to information. Data were then fitted to these themes and sub-
themes through sentence construction. The procedure involved organizing the data
according to a data analysis memo/summary, by tabulating it under the sub
questions of the main questions. Themes were formulated based on the questions
under each sub question.
Step 7: This final step in data analysis process involved making an interpretation
or meaning of the data. Data were interpreted by means of reading with
understanding what emerged from the themes and the sub-themes according to the
information provided by the subjects’ personal opinions, experiences and
appreciating the study based on Namibia Business School.
A summary of the overall analysis of the raw data was then given under each sub
question based on the information gathered under each theme and sub-theme.
Discussion of the findings was based on an integration of the researcher’s personal
interpretation with a meaning derived from a comparison of the findings with

64
information assembled from the literature or theories. This could result in either a
confirmation of past information or a divergence from it, or could also suggest new
questions that could be asked – questions raised by the data and analysis that the
researcher had not foreseen earlier in the study. These are discussed in chapter five
of the thesis - discussion of findings, conclusions and recommendations.
3.9 Reliability and Validity
Research findings are meaningless and unacceptable unless this can be proven that
the processes that have been applied were reliable and valid.
Reliability: Reliability is the extent to which the data collection technique or
techniques will yield consistent findings, similar observations would be made or
conclusions reached by other researchers or there is transparency in how sense was
made from the raw data (Saunders, Lewis & Thornhill, 2007). Welman et al., (2005)
stated that if the research findings can be repeated, it is reliable. Maree (2009)
described reliability as the extent to which a measuring instrument is repeatable and
consistent.
Validity: Validity is the extent to which the data collection method accurately
measures what was intended (Saunders et al., 2007). Maree (2009) defined content
validity as the extent to which the instrument covers the complete content of the
particular construct that it is set out to measure. One widely accepted classification

65
consists of three major forms of validity such as content validity, criterion-related
validity and constructs validity.
To ensure reliability and validity of research results in the present research the
research instruments were tested. The data collection tools were pretested with a
similar population, which did not form part of the research population to verify the
validity of the tools. The questionnaire used was also evaluated by two experts in
the field of risk management. Before actual implementation, the questionnaires
were pre-tested with two (2) employees working at NBS to eliminate ambiguity,
duplication, ensure reliability and minimize errors. Two experts were identified and
requested to rate the reliability of the questionnaire. The degree of agreement of the
two experts determined the reliability of the questionnaire. The inter-rater reliability
was used to rate uniformity of the questionnaire.
Face validity and content validity are the two forms of validity that were used to
measure what was to be set out in the questionnaire. The questionnaire was
empirically tested for validity and reliability purposes through IBM SPSS 21
software package. The Cronbach’s Alpha was determined at coefficient 0.7, in
order to test the reliability and validity of the questionnaire. The Case Process
Summary and the test statistic of reliability test are depicted on table 3.1 and table
3.2 respectively below:
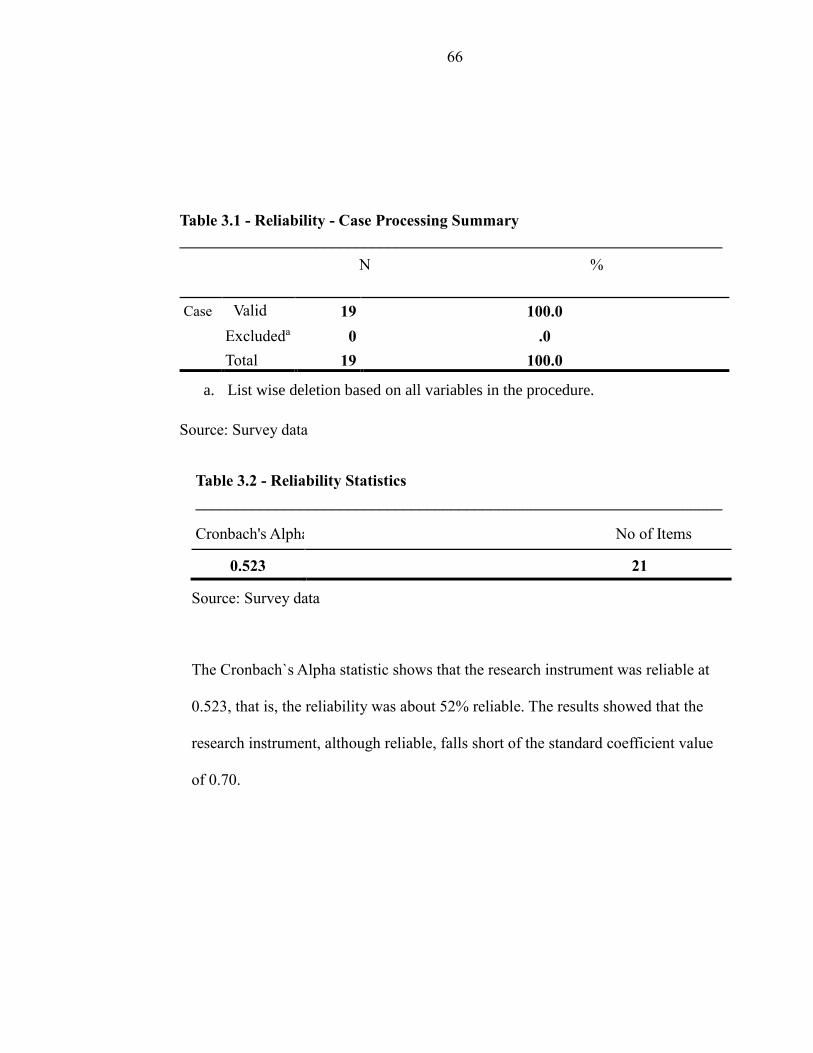
66
Table 3.1 - Reliability - Case Processing Summary
____________________________________________________________________
N %
Case Valid 19 100.0
Excludeda 0 .0
Total 19 100.0
a. List wise deletion based on all variables in the procedure.
Source: Survey data
Table 3.2 - Reliability Statistics
__________________________________________________________________
Cronbach's Alpha No of Items
0.523 21
Source: Survey data
The Cronbach`s Alpha statistic shows that the research instrument was reliable at
0.523, that is, the reliability was about 52% reliable. The results showed that the
research instrument, although reliable, falls short of the standard coefficient value
of 0.70.
67
3.10 Research Ethics
Welman, Kruger and Mitchell (2005) stated that ethical behaviour is important in
research, as in any other field of human activity. Welman et al., (2005) further
explained that the principles underlying ‘research ethics’ are universal and concern
issues such as honesty and respect for the rights of individuals. In this study, the
researcher observed the research ethics throughout the study.
Leedy and Ormrod (2010) stated that researchers should not expose the research
participants to unnecessary physical or psychological harm. Furthermore, Leedy
and Ormrod (2010) argued that researchers must keep the nature and quality of
participants’ performance strictly confidential. This means that ethical issues of
participants’ rights and privacy should be considered in the research.
To comply with the research ethics requirements the University of Namibia
guidelines on research ethics were followed in conducting the study. The researcher
obtained written consent from the NBS to conduct the study. Participants were
notified of the upcoming interviews and survey. Participants were informed of their
right to partake in the research study on a voluntary basis and that it remained their
right to withdraw from the research process, if they feel so at any stage. Participants
were asked to give open and honest personal responses to various questions.
Anonymity and confidentiality of information obtained from them was also
communicated to the interviewees and highlighted on the questionnaires. This was

68
done to assure the participants that the information will be handled with
confidentiality, the research data will be password protected and will only be used
for the purpose of this research. Further, that the research participants’ identity
would not be revealed, that the report on results would be submitted to the PGSC
of UNAM as academic output and would be shared with NBS after obtaining
permission from competent authorities for this purpose
3.10 Conclusion
The research methodology provides the blue print for the study that needs to be
followed in carrying out the research. A mixed research method was used for this
research to enrich the study with quantifiable description of the risks faced by the
School and in-depth analysis of information on the impact of such risk on the
performance of NBS. This chapter covered the research design, and discussed the
population of the study, sample frame, methods of data collection and analysis as
well as the ethical considerations that were followed in the research.

69
CHAPTER FOUR: DATA ANALYSIS DISCUSSION
4.1 Introduction
This chapter focuses on the presentation of analysis and discussion on the data
collected for the study on ‘financial risk management strategy for a business
school’. In discussing the research findings, comparison of the results obtained
during the review of literature in Chapter 2 was also undertaken with a view to
identify similarities and departures from the knowledge gained from similar studies
by other scholars.
The study was based on the case study of Namibia Business School on financial
risk management strategy for a business school. The independent variable used in
this study was financial risk management strategy. The critical dependent variables
that cause and influence the financial risk at NBS as identified by the SPSS analysis
were, payment period, payment method, liquidity problems, debt collection
strategy, management strategy for on time payments, level of management and
managing risk.
4.2 Objectives of the study
The broad objective of this study was to identify and develop a financial risk
management strategy, which could be useful to NBS and other business schools
operating under similar environments. The study therefore, investigated the nature
and extent of financial risk NBS was exposed to, identified the risks, assessed the
nature and level of risk exposure and used the knowledge for the development of a
strategy to mitigate the identified risks, which NBS was exposed to. In view of the
broad objective stated above, thus the study attempted to find answers to the
following research questions.

70
a) What was the nature and extent of credit and liquidity risks faced by
Namibia Business School in its operations?
b) What strategy should Namibia Business School use to proactively manage
the credit risks and the liquidity risks that it faced?
4.3 Primary data collection and analysis
For the collection of information necessary to answer the research questions a
sample of 41 respondents was selected. The sample consisted of thirty (30) former
students, nine (9) former service providers and two (2) senior staff of Namibia
Business School. Thus the size of the sample was 39. All possible efforts were made
to contact and get the questionnaires completed by the persons selected for the
study. However, the total number of respondents could only be nineteen (19) out of
thirty nine (39) persons selected in sample.
A field survey was conducted using a pre-tested questionnaire. Besides information
about systems and procedures in place at NBS was collected from the executives
of the School. The aim of collecting primary data was to establish the respondents’
views on the nature of financial risk that NBS was exposed to and use the data
gathered to determine the patterns and ultimately draw conclusions pertaining to
financial risk management at the NBS. The responses based on the five point Likert
–type scaled questions were given weights as under:
Strongly Agree 5
Agree 4
Neutral 3
Disagree 2
Strongly Disagree 1
71
4.4 Response rate of respondents
As the sample selected consisted of former students and service providers of NBS
for the years 2009 to 2011 there were difficulties in establishing contacts with them
and motivating them to fill in and return the questionnaires. With great persuasion
19 respondents could be persuaded to complete and return the questionnaires and
the response rate of 63.3% could be achieved. The response rate was considered
satisfactory as this could be feasible under the given conditions in-spite of
continuous appeals and telephone calls made prior to and post the dispatch of
questionnaires and personal follow ups undertaken by the researcher. The covering
letter accompanying the questionnaire assisted in explaining that the study was not
only beneficial to the researcher for meeting the academic requirement of the
degree of Master of Business Administration but also that the findings from the
study shall help the Namibia Business School in its endeavours to embrace effective
financial risk management strategies and reap the benefits associated with its
implementation. The cover letter and the questionnaire provided to the respondents
are attached as Appendix 1.
4.5 Data Analysis
Analysis of the data was done using the Statistical Package for Social Sciences
(SPSS). For this, the information collected from the respondents was properly
tabulated using the Microsoft Excel and then the data from the file was transferred
to SPSS for analysis. Frequencies were generated and interpreted using figures and
tables. Descriptive statistics remained indispensable in this study.

72
4.5.1 Analysis of data from field survey
The data collected from the field survey was analysed to find answers to the
research questions. In this process first the demographics of the respondents was
obtained. This was followed by information on method of payment of fee by
students,
4.5.1.1 Analysis of demographics of respondents
Completely filled questionnaires were received from 19 respondents. The
demographic profile of the respondents is given in table 4.01- Period of study; table
4.02- Academic qualifications attained); table 4.03 – Gender; and table 4.04 Age
distribution wise classification of respondents.
Table 4.01: Period of study wise classification of respondents (N= 19)
_________________________________________________________________
Period of Study Frequency Percent Valid Percent Cumulative Percent
Valid 2010-2011 3 15.8 15.8 15.8
2011-2012 11 57.9 57.9 73.7
Others 5 26.3 26.3 100.0
Total 19 100.0 100.0
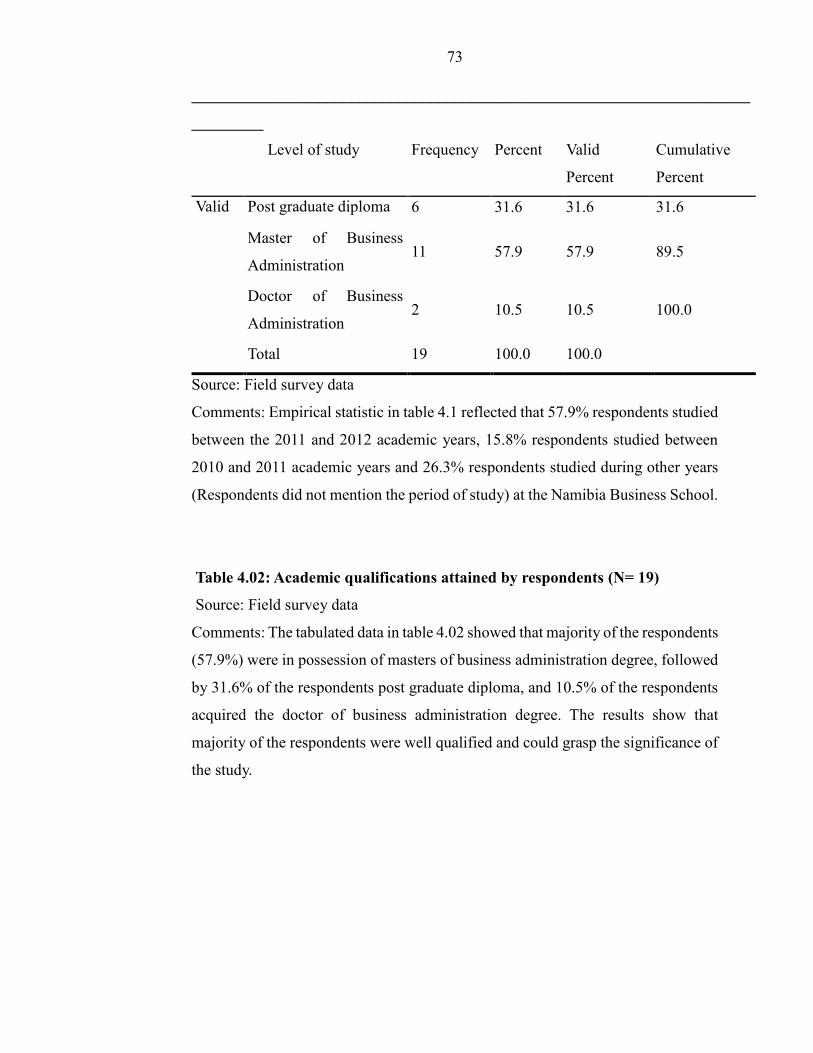
73
Source: Field survey data
Comments: Empirical statistic in table 4.1 reflected that 57.9% respondents studied
between the 2011 and 2012 academic years, 15.8% respondents studied between
2010 and 2011 academic years and 26.3% respondents studied during other years
(Respondents did not mention the period of study) at the Namibia Business School.
Table 4.02: Academic qualifications attained by respondents (N= 19)
Source: Field survey data
Comments: The tabulated data in table 4.02 showed that majority of the respondents
(57.9%) were in possession of masters of business administration degree, followed
by 31.6% of the respondents post graduate diploma, and 10.5% of the respondents
acquired the doctor of business administration degree. The results show that
majority of the respondents were well qualified and could grasp the significance of
the study.
______________________________________________________________________
_________
Level of study Frequency Percent Valid
Percent
Cumulative
Percent
Valid Post graduate diploma 6 31.6 31.6 31.6
Master of Business
Administration 11 57.9 57.9 89.5
Doctor of Business
Administration 2 10.5 10.5 100.0
Total 19 100.0 100.0
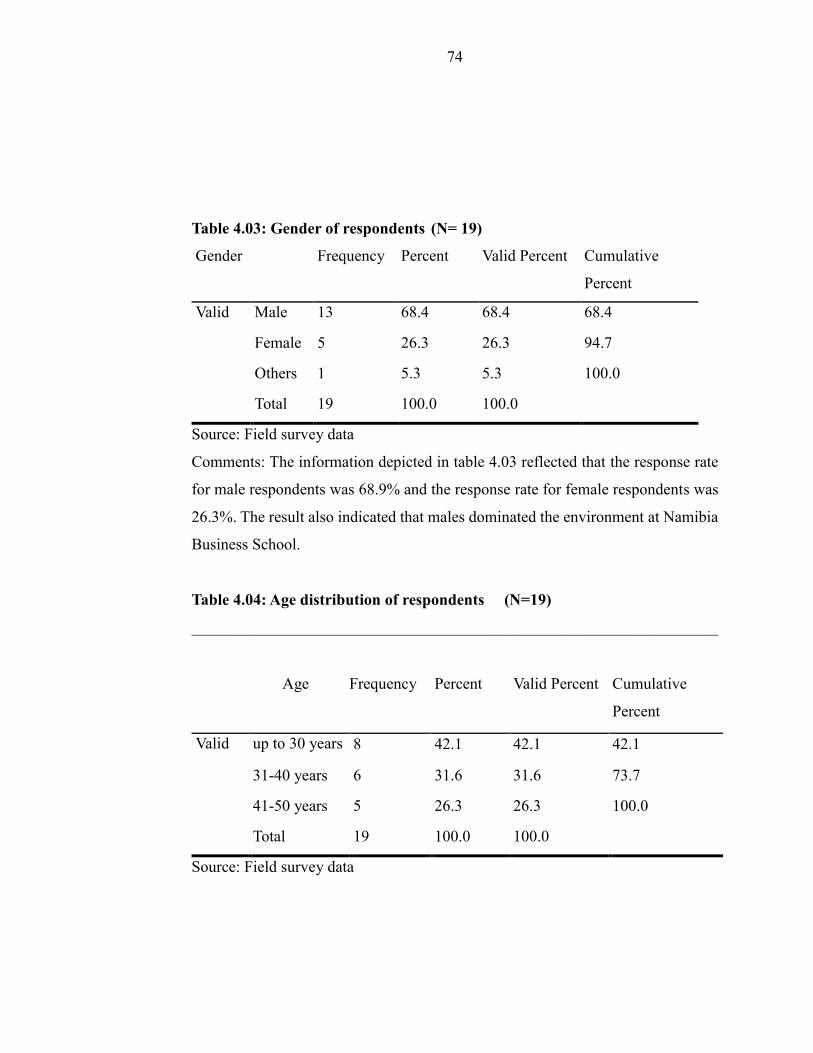
74
Table 4.03: Gender of respondents (N= 19)
Gender Frequency Percent Valid Percent Cumulative
Percent
Valid Male 13 68.4 68.4 68.4
Female 5 26.3 26.3 94.7
Others 1 5.3 5.3 100.0
Total 19 100.0 100.0
Source: Field survey data
Comments: The information depicted in table 4.03 reflected that the response rate
for male respondents was 68.9% and the response rate for female respondents was
26.3%. The result also indicated that males dominated the environment at Namibia
Business School.
Table 4.04: Age distribution of respondents (N=19)
__________________________________________________________________
Age Frequency Percent Valid Percent Cumulative
Percent
Valid up to 30 years 8 42.1 42.1 42.1
31-40 years 6 31.6 31.6 73.7
41-50 years 5 26.3 26.3 100.0
Total 19 100.0 100.0
Source: Field survey data
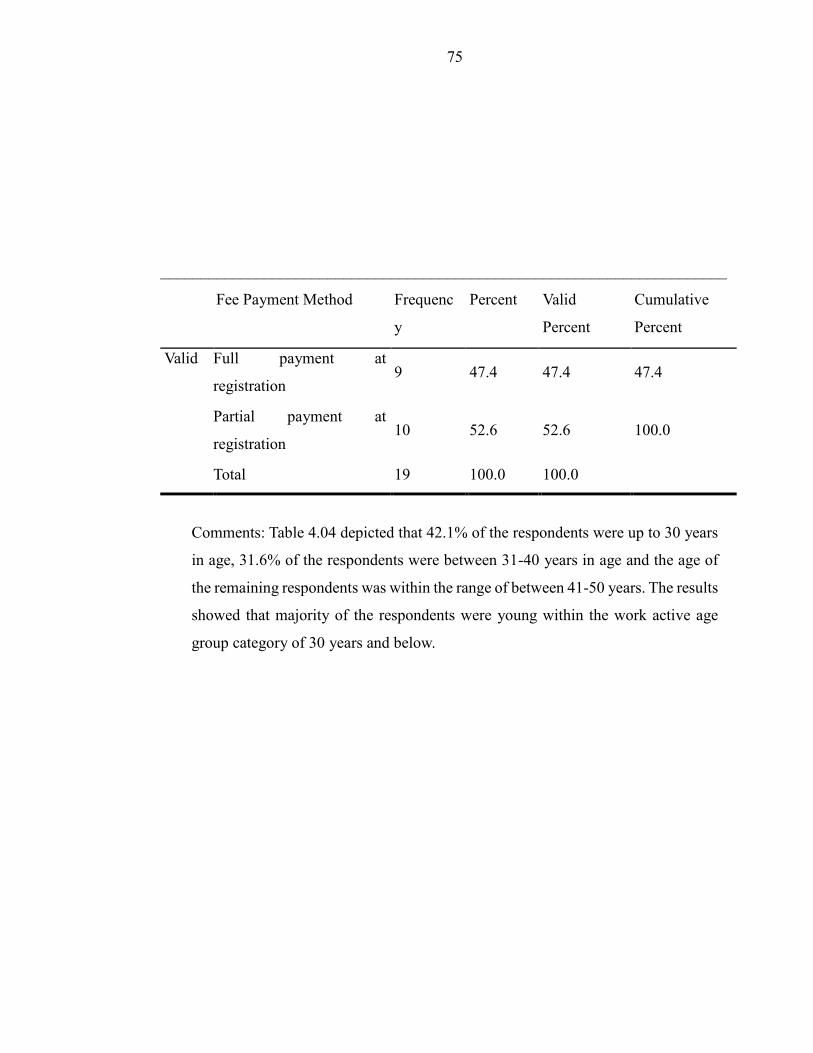
75
Comments: Table 4.04 depicted that 42.1% of the respondents were up to 30 years
in age, 31.6% of the respondents were between 31-40 years in age and the age of
the remaining respondents was within the range of between 41-50 years. The results
showed that majority of the respondents were young within the work active age
group category of 30 years and below.
_______________________________________________________________________
Fee Payment Method Frequenc
y
Percent Valid
Percent
Cumulative
Percent
Valid Full payment at
registration 9 47.4 47.4 47.4
Partial payment at
registration 10 52.6 52.6 100.0
Total 19 100.0 100.0

76
Section B – Method of payment of fee by students
Table 4.05: Method of payment of fee at registration (N = 19)
_______________________________________________________________________________
Fee Payment Method Frequency Percent Valid Percent Cumulative
Percent
Valid Full payment at registration 9 47.4 47.4 47.4
Partial payment at registration 10 52.6 52.6 100.0
Total 19 100.0 100.0
Source: Field survey data
Comments: The results in table 4.05 showed that 47.4% of the respondents made
full payment of fees at registration and the remaining 52.6% of the respondents
made partial payment of fee at registration. Thus, about half the students made full
and about half made partial payment of fee at the time of registration.
Table 4.06: Method of payment of tuition fee during studies (N = 19)
__________________________________________________________________
Method of Payment of
fee
Frequenc
y
Percent Valid
Percent
Cumulative
Percent
Valid Payment as per school
policy 5 26.3 26.3 26.3
Payment in Instalments 12 63.2 63.2 89.5
Payments after
completion of study 2 10.5 10.5 100.0
Total 19 100.0 100.0
Source: Field survey data

77
Comments: Majority of the respondents (63.2%) indicated that their method of
payment during study was in the form of instalments, about one fourth (26.3%) of
the respondents indicated that their method of payment during study was as per
school policy, and the remaining 10.5% of the respondents indicated that their
method of payment during study was after completing the study. Thus, the findings
showed that majority of the respondents made payment of fee in instalments or as
per the policy of the NBS and only 10.5% made payment afterwards.
Table 4.07: Late payment or delay in payment of tuition fee (N = 19)
Delay in settling
Fee
Frequency Percent Valid Percent Cumulative
Percent
Valid Yes 9 47.4 47.4 47.4
No 10 52.6 52.6 100.0
Total 19 100.0 100.0
Source: Field survey data
Comments: Responses depicted in table 4.7 show that 52.6% of the respondents did
not experience any problem in settling their tuition fees, whilst 47.4% of the
respondents indicated that they experienced some problems in settling their tuition
fees. The results showed that the system of payment of fees was favourable to the
students, though this created liquidity problems for the institution.

78
Table 4.08: Problems faced in payment of tuition fees (N - 19)
_______________________________________________________________
Problems faced Frequency Percent Valid Percent Cumulative
Percent
Valid Yes 5 26.3 26.3 26.3
No 14 73.7 73.7 100.0
Total 19 100.0 100.0
Source: Field survey data
Comments: Majority of the respondents (73.7%) indicated that they did not
experience any problems in settling of fees, while the remaining 26.3% indicated
that they actually experienced some problems in settling the tuition fees. The results
showed that the system of payment of fees at the NBS was favourable to the
students and did not create significant problems for the students.
Table 4.09: Opinion on method of collection of fee and exposure of institution
to risk (N= 19)
_________________________________________________________________
Opinion on risk
exposure
Frequency Percent Valid percent Cumulative
percent
Valid Strongly
disagree 2 10.5 10.5 10.5
Disagree
Neutral
0
1
0
5.3
0
5.3
10.5
15.8

79
Agree 10 52.6 52.6 68.4
Strongly agree 6 31.6 31.6 100.0
Total 19 100.0 100.0
Source: Field survey data
Comments: On being asked to indicate whether the NBS method of collection of
fees exposes the institution to risk due to delays and defaults in payment of fees by
the students, the respondents who participated in this survey expressed different
opinions. Of the total respondents, 84.2% agreed that the method of payment of
tuition fees at the NBS exposes the institution to risk. However, 10.5% of the
respondents strongly disagreed to the sentiment, while the remaining 5.3% of the
respondents remained neutral as they did not express their opinion. From the
statistics in table 4.09 above, it is evident that the method of tuition payment at the
NBS is not working and exposed the institution to financial risk.

80
Table 4.10: Need of improvements in the methods of tuition fee payment by
students (N = 19)
____________________________________________________
Method of payment-
Need improvement
Frequency Percent Valid percent Cumulative
percent
Valid
Strongly
disagree
Disagree
Neutral
0
1
6
0
5.3
31.6
0
5.3
31.6
0
5.3
36.8
Agree 9 47.4 47.4 84.2
Strongly
agree 3 15.8 15.8 100.0
Total 19 100.0 100.0
Source: Field survey data
Comments: The results depicted in table 4.10 show that majority (63.2%) of the
respondents agreed that NBS needs to improve on its’ method of payment of tuition
fees by students. However, 5.23% of the respondents disagreed with the majority
opinion and believed that the NBS method of tuition fee payment was good and
31.6% of the respondents remained neutral. Thus, the general consensus emerging
from the statistics presented in table 4.10 showed that NBS needs to improve its
method of payment of tuition fees by the students as a mechanism to manage
financial risk.

81
Table 4.11: Risk associated with default in payment of fees for other service
deliverables
__________________________________________________________________
Risk associated with
default
Frequency Percent Valid
percent
Cumulative
percent
Valid Agree 13 68.4 68.4 68.4
Strongly agree 6 31.6 31.6 100.0
Total 19 100.0 100.0
Source: Field survey data
Comments: Table 4.11 above depicted that high majority (68.4%) of the
respondents agreed that the risk associated with default in payments affected other
service deliverables at the NBS. This was further supported by about one third
(31.6%) of the respondent who strongly agreed that the risk associated with default
in payments affected other service deliverables at the NBS. Overall all the
respondents unanimously agreed that the risk associated with default in payments
of fees by the students affected other service deliverables at NBS.
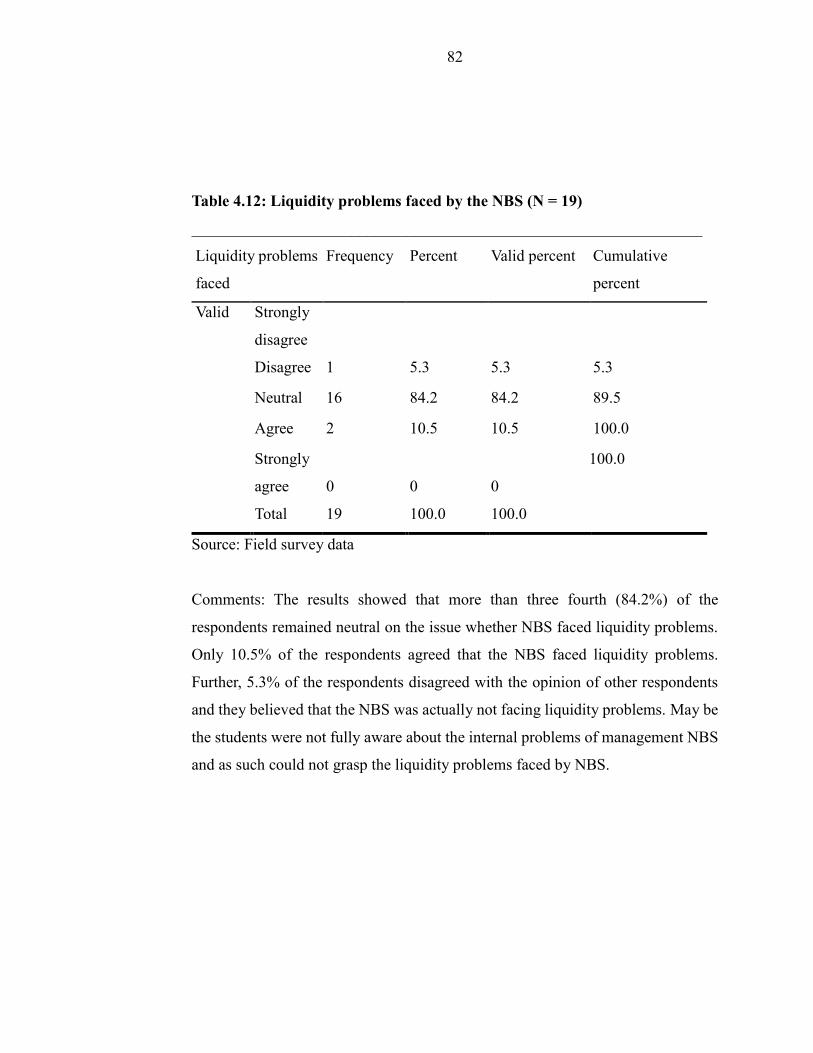
82
Table 4.12: Liquidity problems faced by the NBS (N = 19)
________________________________________________________________
Liquidity problems
faced
Frequency Percent Valid percent Cumulative
percent
Valid Strongly
disagree
Disagree
1
5.3
5.3
5.3
Neutral 16 84.2 84.2 89.5
Agree 2 10.5 10.5 100.0
Strongly
agree
Total
0
19
0
100.0
0
100.0
100.0
Source: Field survey data
Comments: The results showed that more than three fourth (84.2%) of the
respondents remained neutral on the issue whether NBS faced liquidity problems.
Only 10.5% of the respondents agreed that the NBS faced liquidity problems.
Further, 5.3% of the respondents disagreed with the opinion of other respondents
and they believed that the NBS was actually not facing liquidity problems. May be
the students were not fully aware about the internal problems of management NBS
and as such could not grasp the liquidity problems faced by NBS.

83
Table 4.13: Appropriateness of NBS debt collection strategy (N = 19)
Debt collection strategy Frequency Percent Valid percent Cumulative
percent
Valid Strongly disagree 1 5.3 5.3 5.3
Disagree 6 31.6 31.6 36.8
Neutral 12 63.2 63.2 100.0
Agree
Strongly Agree
Total
0
0
19
0
100.0
0
100.0
100.0
Source: Field survey data
Comments: On the issue whether the NBS strategy of debt collection was
appropriate or not, majority (63.2%) of the respondents did not express themselves
on the matter and remained neutral. But remaining about one third (36.8%)
respondents disagreed that the NBS strategy of debt collection was appropriate. The
results thus showed that in the opinion of respondents the NBS strategy of debt
collection was not appropriate and exposed it to liquidity risk.

84
Table 4.14: Need for improvement in debt collection strategy of the NBS (N =
19)
Change in debt
collection strategy
Frequency Percent Valid percent Cumulative
percent
Valid Strongly
disagree 1 5.3 5.3 5.3
Disagree
Neutral
0
4
0
21.1
0
21.1
5.3
26.3
Agree 12 63.2 63.2 89.5
Strongly agree 2 10.5 10.5 100.0
Total 19 100.0 100.0
Source: Field survey data
Comment: The results depicted in table 4.14 above echoed that about three fourth
(73.7%) of the respondents agreed that the NBS strategy of debt collection needs
improvement. But at the same time, 21.1% of the respondents remained neutral
whilst the remaining 5.3% of the respondents strongly disagreed that the NBS
strategy of debt collection needs improvement. However, overall the impression
derived from responses in table 4.14 above showed that, in the opinion of almost
three fourth of the respondents (73.7%) the NBS debt collection strategy needs to
be improved as a risk mitigating strategy.

85
4.15: Measures suggested as necessary for improving tuition payment at the NBS
(N = 19)
Measures necessary Frequenc
y
Percent Valid
Percent
Cumulative
Percent
Valid Monthly debit/stop order 10 52.6 52.6 52.6
Deduction via
employer Payroll 7 36.8 36.8 89.5
Any other 2 10.5 10.5 100.0
Total 19 100.0 100.0
Source: Field survey data
Comments: To ensure the payment of tuition fees in-time by students, majority
(52.6%) of the respondents suggested that the NBS should implement monthly
debt/stop order, about one third (36.8%) of the respondents suggested that the NBS
should deduct the tuition fees via employer payroll, while the remaining 10.5% of
the respondents suggested that any other method of collecting tuition fees from the
students will do. The results thus indicated that majority of the respondents believed
that stop order is the best option to collect tuition fees from the students followed
by deduction through the employer of the student.

86
4.16: Management strategies for in time tuition payment (N = 19)
Management
strategy
Frequency Percent Valid percent Cumulative
percent
Valid Communicatio
n 5 26.3 26.3 26.3
Penalties 7 36.8 36.8 63.2
Reminders 7 36.8 36.8 100.0
Total 19 100.0 100.0
Source: Field survey data
Comments: On the issue of management of payments in time, about one third
(36.8%) of the respondents suggested that it is important for the NBS to give
students reminders to pay up the tuition fees, about one third (36.8%) of the
respondents considered imposing penalties to make the students pay tuition fees in
time. However, the remaining about one fourth (26.3%) of the respondents believed
that communication of reminders will be effective in making the students pay up
tuition fees in time. Thus, though a large proportion of respondents suggested
measures that will deter students from delaying payment of tuition fees in time, but
perhaps they also feel that one measure may not work with all students and the NBS
should therefore, use all methods to persuade the students to pay the tuition fees in
time.

87
4.17: Opinion on quality of infrastructure available at the NBS (N = 19)
Infrastructure
Frequency Percent Valid Percent Cumulative
Percent
Valid Good 4 21.1 21.1 21.1
Acceptable 12 63.2 63.2 84.2
Bad 3 15.8 15.8 100.0
Total 19 100.0 100.0
Source: Field survey data
Comments: More than half (63.2%) of the respondents believed that the
infrastructure at the NBS was of acceptable standard. The sentiment was further
supported by about one fourth (21.1%) of the respondents who expressed that the
infrastructure at the NBS was good. The remaining 15.8% of the respondents
however, commented that the infrastructure at the NBS was bad. Overall
impression derived from the responses thus was that the NBS infrastructure was
satisfactory, though it may be further improved and upgraded with the changing
requirements of the School, particularly in areas where the students and other
stakeholders faced problems.
Table 4.18: Quality of management at the NBS (N = 19)
Management quality Frequency Percent Valid percent Cumulative
percent
Valid Good 2 10.5 10.5 10.5
Acceptable 9 47.4 47.4 57.9
Poor 8 42.1 42.1 100.0
Total 19 100.0 100.0
Source: Field survey data

88
Comments: About half the respondents (47.4%) expressed that the management at
the NBS was of acceptable standard. This was further supported by 10.5% of the
respondents who expressed that the NBS management was good. However, the
remaining 42.1% of the respondents expressed that the NBS management was poor.
Thus, though the majority (47.4% + 10.5% = 57.9%) of the responses indicated that
the NBS management was good and satisfactory and hence acceptable, there is a
need to further improve it, particularly in areas where the students and other
stakeholders faced problems.
4.19: Opinion on adequacy of staff compliment at the NBS (N = 19)
Staff adequacy Frequency Percent Valid percent Cumulative
percent
Valid Adequate 3 15.8 15.8 15.8
Acceptable 7 36.8 36.8 52.6
Too few 9 47.4 47.4 100.0
Total 19 100.0 100.0
Source: Field survey data
Comment: During the field survey about half (47.4%) of the respondents expressed
that the staff complement at the NBS was too few (short). On the contrary about
one third (36.8%) of the respondents expressed that the NBS staff complement was
acceptable. Their opinion was supported by another 15.8% of the respondents who
expressed that the NBS staff complement was adequate. Overall the opinion
regarding NBS staff complement indicated that the opinion among the respondents
was divided. May be some students experienced problems during service delivery.
This aspect as such needs further probe and appropriate action should be initiated
by the management of the NBS to ensure that the staff complement is adequate.

89
4.20: Pressure on management in managing risk at the NBS (N = 19)
Pressure on
management
Frequency Percent Valid percent Cumulative
percent
Valid Moderate 14 73.7 73.7 73.7
Low 5 26.3 26.3 100.0
Total 19 100.0 100.0
Source: Field survey data
Comments: About three fourth (73.7%) of the respondents expressed that the
pressure on the management to manage risk at the NBS was moderate and about
one fourth (26.3%) of the respondents believed that the pressure on the management
to manage risk at the NBS was low. Thus, overall in the opinion of the respondents
the pressure on management to manage risk at the NBS was at manageable level,
neither too low nor too high.
Table 4.21: Staff motivation and morale at the NBS (N = 19)
Staff motivation Frequency Percent Valid percent Cumulative
percent
Valid High 1 5.3 5.3 5.3
Moderate 11 57.9 57.9 63.2
Low 7 36.8 36.8 100.0
Total 19 100.0 100.0
Source: Field survey data
Comments: The results depicted in table 4.23 showed that majority (57.9%) of the
respondents expressed that staff morale at the NBS was moderate. This sentiment
was supported by 5.3% of the respondents who expressed that the NBS staff morale
was high. The remaining about one third (36.8%) respondents expressed that the
staff morale at the NBS was low. Overall the picture depicted by table 4.24 shows

90
that the NBS staff morale was moderate to high. However, there is a need for
continuously monitoring and managing the staff motivation and morale in order to
ensure better quality of service delivery to the stakeholders.
4.6 Qualitative Results
4.6.1 Themes and Sub-themes interpretation
The overall analysis and discussion on the themes and sub-themes of the data
collected through interviews is given under this section. Discussion on the findings
is based upon the participants’ output and the integration of the researcher’s
interpretation and meanings derived from relevant literature and theories reviewed.
The findings either confirm historical results or refute them. At times, the findings
suggest new questions derived from the analysed data that could be asked. The
inter-connectedness of the findings is presented in chapter five of the study.

91
4.6.2 Summary of review of interview questions (N1)
Summary: Sub Questions -
1. What is the main source of revenue for the NBS?
1.0 Themes and Sub-themes
Interpretations/Reflections/Observations
Participants Responses
1. Theme 1: Source of revenue
Student tuition
N1: “NBS derives its
revenue from student
tuition.”
“…We also get revenue
from training, consultancy
and fundraising.”
“.. Student tuition
constitutes about 90% of the
revenue at the NBS.”
N1: “... The revenue
collection is enough to
cover the expenses.”

92
Challenges faced in revenue
collection
Creditors obligations
N1: “…The major
challenge is that of timely
collection of students’
tuition fees.”
N1: “…We impose
penalties for late payment,
like blocking the
examination results.”
N1: “... Payment is done on
negotiations most of the
time.”
Source: Interview
Summary: Theme 1 and Sub-theme 2: Source of revenue and payment to
creditors
The responses about the sources of revenue and payment to creditors thus were as
follows:
Revenue collection is mainly (90%) derived from students through tuition
fees.
There is no timely collection of revenue, especially tuition fees.
NBS imposes penalties for late payment.
Creditors are mainly paid through negotiations.
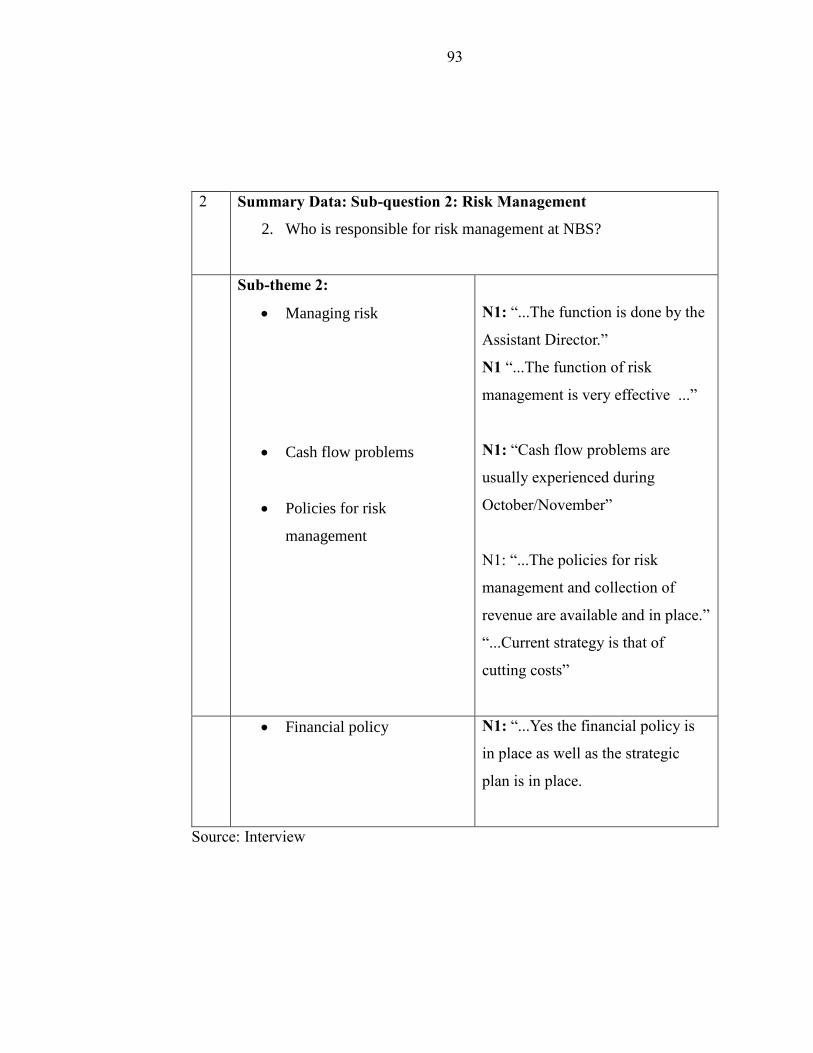
93
2 Summary Data: Sub-question 2: Risk Management
2. Who is responsible for risk management at NBS?
Sub-theme 2:
Managing risk
Cash flow problems
Policies for risk
management
N1: “...The function is done by the
Assistant Director.”
N1 “...The function of risk
management is very effective ...”
N1: “Cash flow problems are
usually experienced during
October/November”
N1: “...The policies for risk
management and collection of
revenue are available and in place.”
“...Current strategy is that of
cutting costs”
Financial policy N1: “...Yes the financial policy is
in place as well as the strategic
plan is in place.
Source: Interview

94
Summary: Theme 2, Sub-theme 2. Summary of opinion on policies to
manage risk
Responses provided by the respondent may be summarised as under:
Policies for risk management are in place
Strategic plan of the NBS is in place, which also helps in risk
management.
4.6.3 Summary review of interview questions (N2)
Summary Data: Sub Questions
1. Given your experience at the NBS, do you think there is risk
exposure at the school?
1.0 Themes and Sub-themes
Interpretations/Reflections/Observations
Participants Responses
1. Theme 1: Risk exposure
Meeting creditors obligations
Risk policy in place
Risk management
N2: “We face difficulties of
paying our creditors.”
“…This means that our
collection methods are not
adequate...”
“.. We have put in place
measures of blocking
defaulters’ results.”
N2: “...Yes the NBS has

95
risk management policy in
place.”
N2: “Risk management is
done by corporate services
department at the NBS.”
Source: Interview
Summary: Theme 2 and Sub-theme 1: Risk exposure
The respondent expressed the following on the sub theme – risk exposure of the
NBS:
NBS Faced difficulties in paying to its creditors
Revenue collection methods are not adequate
NBS has put in place measures of blocking examination results of
defaulters
Risk policy is in place.
Collection of payment is done by the corporate services department.
4.6.4 Summary of findings
The summary of findings from the analysis and discussion on the responses
regarding the risk exposure and measures to handle it is as under:
NBS has a strategic plan in place.
NBS faced difficulties in paying its creditors in time.
Revenue collection methods at the NBS are not adequate
NBS has put in place measures for blocking the examination results of
defaulters for non-payment of tuition fees.
96
NBS has a robust risk management policy in place.
Collection of debt is done by the Corporate Services Department at the
NBS.
Thus, there is a risk management policy in place at the NBS, action is taken against
the defaulters in payment by sending reminders and blocking their examination
results, and collection of debt is handled by the Corporate Services Department.
However, the revenue collection methods are not adequate to the requirement and
the NBS faced difficulties in making payments to their creditors in time as per
commitments.
4.6.5 Internal policies and procedures
One key aspect of a sound risk management framework is the availability of
policies and procedures at an institution. As a guide and source of reference for
work processes, policies and procedures reflect the standards of internal controls in
an organisation. Furthermore, they have the mandate of approval from the
organisations’ authorities and serve as a source of reference for further work.
The NBS has adopted the University of Namibia (UNAM) Finance policy and
procedure manual and has been using this manual as a guide for its operations. The
Finance policy and procedure manual has sixteen (16) core activities covered under
it, and provided guidelines in terms of activities of responsible persons, timelines
and process flows. In the view of the researcher, the Finance policy and procedure
manual are adequate and cover a whole range of areas from financial control,
administration, risk management, insurance and human resource management
amongst all others. The Finance policy and procedure manual also details
guidelines and responsibilities of other departments that liaise regularly with the

97
finance department. However, the NBS business and operational structures,
business processes including governance, reporting, funding are not at par with
those of the UNAM. This exposes NBS to various financial risks. Moreover, the
Finance policy and procedure manual is just a guide and not actual policies that can
be enforced on the employees in carrying out their functions at the NBS.
Whilst the Finance policy and procedure manual has explicitly underlined the areas
and responsibilities of various bodies and persons in authority, researcher is of the
opinion that there could be an overlap in certain areas, particularly those in financial
control, audit and risk management. As a result it is recommended that the NBS
should ensure that the details in the Finance policy and procedure manual that are
not NBS specific and aligned to the NBS structures and processes should be
developed and implemented at the NBS.
4.6.6 Audited Financial Statements
Audited Financial Statements (AFS) of the NBS for the years ending 31 December
2009, 2010 and 2011 were obtained. The AFS were assessed in line with the
research questions. Further, the AFS records were used to calculate NBS’s liquidity
ratios and to determine NBS’s ability to meet its obligations as they fall due.
Assessment of the AFS for all the years under study (2009 to 2011) revealed that
NBS’s revenue and operating expenses increased by 66% and 64% on the average
over the period. Other income, which is mainly made up of donations, has been
decreasing during the three years, (by 12% from 2009 to 2010 and by 75% from
2010 to 2011). Further, the AFS revealed that NBS has been operating under deficit
in revenue during the 2010 and 2011 financial years, and only had a surplus for the
year 2009 financial year. From the assessment made it was observed that the

98
operating deficit was due to the reduction in donations and a significant increase in
operating expenses.
According to the Assistant Director: Corporate Services NBS, the deficit was as a
result of increase in the students’ enrolments and new courses offered, which
increased the operating expenses. The conclusion from the assessment of the AFS
is that NBS has not been generating enough revenue from its core operations, which
is student tuition fees, to cover its operations and depended on donations to keep
afloat. This statement is in agreement with the statement by the Officer: Corporate
Services, who said that NBS financial management, especially the expenses
management is not good and the School always experienced financial difficulties
during the last quarter of the financial years and that the payments of some expenses
are delayed as a result. This is also in confirmation with NBS’s bank statements for
the same periods, which when assessed, showed that NBS had lots of funds in the
bank accounts during the first quarter of the year as a result of the student
registrations during the first quarter. However, these funds deplete in the following
quarters and only a little amount (about 5% of the first quarter amount) is left in the
bank account in the last quarter. This is sign of lack of financial management’s
ability to effectively manage its financial resources in terms of assets and liabilities
matching. This is mainly due to the collection of students’ tuition fees not collected
timely as per the UNAM finance policy, which has been adopted and implemented
by NBS.
4.5.3.1 Liquidity ratio and current ratio
The liquidity ratios are generally used to measure a company's ability to pay the
short-term debts, while the current ratio is a liquidity and efficiency ratio that
measures a firm's ability to pay off its short-term liabilities with its current assets.

99
The current ratio and liquidity ratio are two widely used important measures of
liquidity. The liquidity ratios and current ratios of the NBS for the years under study
are given in table 4.22:
Table 4.22: Liquidity and current ratios of NBS for the financial years 2009 to
2011
Financial ratio Formula Financial year
2009 2010 2011
Current ratio Current assets/current
liabilities
2.34x 5.38x 1.00x
Liquidity ratio Total assets/total
liabilities
2.36x 5.60x 1.18x
Note: X = times
Source: Audited Financial Statements of NBS for years ended 31 December 2009, 2010
and
2011.
It may be observed that the current ratio and liquidity ratio both improved from
2009 to 2010 but declined significantly from 2010 to 2011, indicating decline in
the liquidity position of the NBS.
The trend indicated that the institution may face serious liquidity problem in time
to come. Measures should therefore be put in place to meet the impeding challenge.
4.6.7 Student records (fee records)
NBS’s management refused to provide the students’ fee records as it was
considered against the UNAM’s policy on confidentiality. The researcher tried his
best to engage the Director of NBS in this regard but to no avail. As a result, the
100
status, trends and implications arising from the position of students’ records could
not be discussed in the report.
4.6.8 Suppliers’ records (account statements)
NBS’s suppliers’ statements were obtained from the management. Observations
were made in terms of when the services were provided and when the invoices were
raised against payments made. According to the Finance policy and procedure
manual, payments are supposed to be made thirty (30) days after the provision of
the service. It was found that most of the accounts were paid on time, mostly within
the timeframe the invoices were submitted. However, contrary to the Finance policy
and procedure manual, it was also observed that some payments, specifically the
fixed commitments such as subscriptions and operational expenses were not paid
for in time during the last quarters of the same financial years and the payments
were delayed and postponed to the following financial year. This was in agreement
with the statements of the NBS officials interviewed, who indicated that for the
periods under study, the School struggled to meet all its financial obligations,
mostly during the last quarters of the financial years. As a result, the School
negotiated with the suppliers and service providers to postpone the payments until
some funds are available. The officials interviewed indicated that the postponement
of payments, although a relief for a short while, had attracted penalties in terms of
interest. They concluded that the School’s reputation is put at risk as a result, in
addition to liquidity and credit risks resulting from the failure not to pay its
obligations on time.

101
4.7. Conclusion
This chapter presented the empirical evidence from the field study under
quantitative and qualitative approach both. Quantitative results depicted position
on significant variables that were identified through data analysis using the
frequencies and descriptive statistics. The overall results reflected that NBS has
adopted and implemented UNAM’s risk management policy as well as the Finance
policy and procedure manual. However, these policies are not aligned to NBS’s
structures, processes and operations. Further, NBS faced difficulty in revenue
collection. However, NBS has put in place some measures to mitigate risk in
revenue collection. It is suggested that NBS should ensure that Finance Policy and
Procedure Manual as well as the risk management policy that NBS has adopted and
implemented be re-evaluated, reviewed and redeveloped into a formal and
integrated risk management framework. The risk management procedures and
methodology manuals should be customised to NBS structures, processes and
operations to enhance the School’s competitiveness, stability and sustainability.
Further, NBS should create risk awareness culture and review its governance
structures.
102
CHAPTER FIVE: SUMMARY OF FINDINGS, CONCLUSIONS AND
RECOMMENDATIONS
5.1 Introduction
This chapter re-caps the steps taken in carrying out this research and gives a
summary of findings, conclusions and recommendations.
The purpose of the research was to investigate the financial risk and craft a strategy
for its management at the NBS. The critical variables that impacted on the financial
risk management at the NBS identified through analysis were payment period,
payment method, liquidity problems, debt collection strategy, management strategy
for on time payments, level of management and managing the risk.
A review of literature related to the area of research was conducted. This enabled
the researcher to learn from the experiences and observations of other scholars and
researchers in the area on matters that have a bearing on financial risk management
at the NBS. This also enabled the researcher to develop a framework for the study
of the variables under investigation.
In order to carry out the research, the researcher collected data from the NBS and
also carried out a field survey, which covered the former students, the service
providers and the executives of NBS (Assistant Director and the Officer: Corporate

103
Services), to understand their view points and know their opinions. Simple random
sampling technique was used to select the sample from the population for the study.
A sample of 39 respondents (30 former students and 9 former service providers)
constituted the sample frame of this study. Questionnaires were sent to thirty (30)
former students and nine (9) service providers and interviews were conducted with
two (2) executives of the NBS to obtain the information from the respondents. The
respondents were also allowed to air their views pertaining to the subject. Every
effort was made to contact them at their addresses and persuade the former students
and former service providers to give the information. However, response from
seventeen (17) external respondents and two (2) executives of the NBS could be
obtained. The findings are based on the responses from this group and analysis of
financial records of the NBS.
5.2 Summary of major findings
As stated earlier the objectives of the study were as under:
i. To study the nature and extent of credit risks and liquidity risks the NBS is
exposed to.
ii. To identify and assess the levels of risk exposure at the NBS as well as
identification and development of a risk management strategy to mitigate
the identified risks.

104
The summary of the major findings based on the research is presented here in light
of the above objectives of the study as under.
(a) Nature and extent of financial risk NBS is exposed to:
i. Majority (52.6%) of the respondents made only partial payment of fees at
registration.
ii. Majority (63.2%) of respondents indicated that their method of payment of
fees during the study period was through installments.
iii. High majority (about two third) of the respondents (73.7%) indicated that
they did not experience any problem in settling of fees.
iv. High majority (68.4%) of the respondents agreed that risk associated with
default in payment affected other service deliverables at the NBS.
v. More than three fourth (84.2%) of the respondents however, remained
neutral on the issue whether the NBS faced liquidity problems.
vi. On the issue whether the NBS strategy of debt collection is viable or not,
majority (63.2%) of the respondents did not comment and remained neutral.
vii. Majority (63.2%) of the respondents believed that the infrastructure at the
NBS was of acceptable standard.
viii. The executives of the NBS stated that the NBS had policy for risk
management in place, although it was not effective.
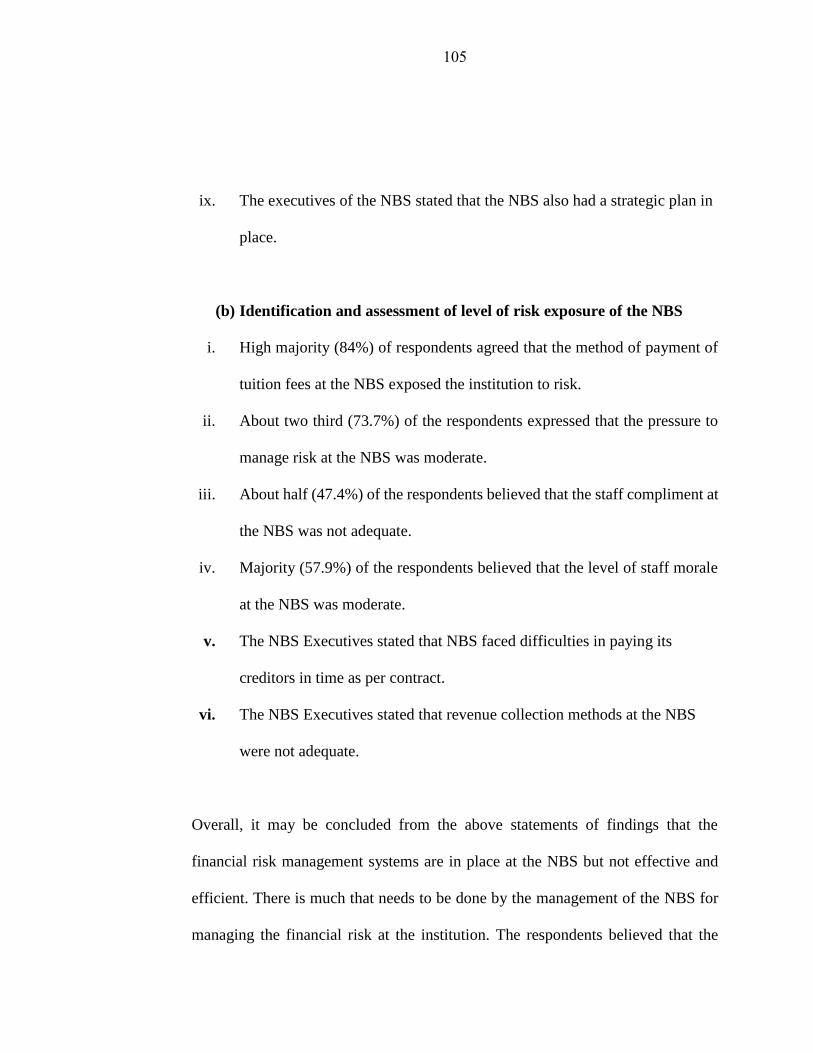
105
ix. The executives of the NBS stated that the NBS also had a strategic plan in
place.
(b) Identification and assessment of level of risk exposure of the NBS
i. High majority (84%) of respondents agreed that the method of payment of
tuition fees at the NBS exposed the institution to risk.
ii. About two third (73.7%) of the respondents expressed that the pressure to
manage risk at the NBS was moderate.
iii. About half (47.4%) of the respondents believed that the staff compliment at
the NBS was not adequate.
iv. Majority (57.9%) of the respondents believed that the level of staff morale
at the NBS was moderate.
v. The NBS Executives stated that NBS faced difficulties in paying its
creditors in time as per contract.
vi. The NBS Executives stated that revenue collection methods at the NBS
were not adequate.
Overall, it may be concluded from the above statements of findings that the
financial risk management systems are in place at the NBS but not effective and
efficient. There is much that needs to be done by the management of the NBS for
managing the financial risk at the institution. The respondents believed that the

106
School needs to put better systems in place that will serve as mechanisms for
mitigating financial risk faced by the institution. This will contribute to overall
efficiency at the institution and the institution will be able to provide better services
to its stakeholders.
(c) Risk management strategy to mitigate the identified risks
i. More than half of the respondents (63.2%), expressed that the NBS need to
improve on methods of payment of tuition fees.
ii. About three quarter of the respondents (73.7%) agreed that the NBS strategy
of debt collection needs improvement.
iii. For improving the strategy of debt collection, 36.8% of the respondents
expressed that it is important for the NBS to remind students about
outstanding fees and the need to pay up the tuition fees in time.
iv. At the same time, about three quarter of the respondents (73.68%),
considered that imposing penalties and communication of outstanding
tuition fees will make the students pay tuition fees on time.
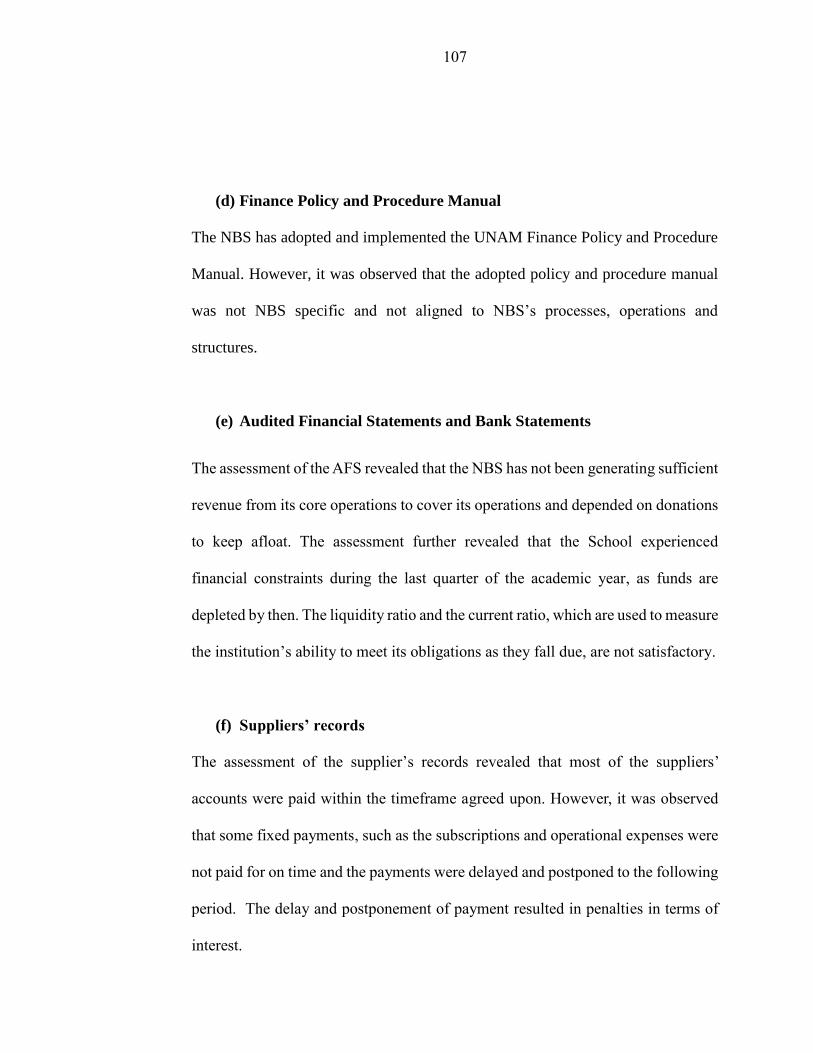
107
(d) Finance Policy and Procedure Manual
The NBS has adopted and implemented the UNAM Finance Policy and Procedure
Manual. However, it was observed that the adopted policy and procedure manual
was not NBS specific and not aligned to NBS’s processes, operations and
structures.
(e) Audited Financial Statements and Bank Statements
The assessment of the AFS revealed that the NBS has not been generating sufficient
revenue from its core operations to cover its operations and depended on donations
to keep afloat. The assessment further revealed that the School experienced
financial constraints during the last quarter of the academic year, as funds are
depleted by then. The liquidity ratio and the current ratio, which are used to measure
the institution’s ability to meet its obligations as they fall due, are not satisfactory.
(f) Suppliers’ records
The assessment of the supplier’s records revealed that most of the suppliers’
accounts were paid within the timeframe agreed upon. However, it was observed
that some fixed payments, such as the subscriptions and operational expenses were
not paid for on time and the payments were delayed and postponed to the following
period. The delay and postponement of payment resulted in penalties in terms of
interest.

108
5.3 Recommendations
The recommendations made on risk management strategy to mitigate the identified
risks at the NBS, based on the findings from the survey of opinion of the
respondents, data analysis and discussion with the officials, are as under:
5.3.1 The NBS management is urged to constantly send reminders to students to
pay tuition fees on time and further impose penalty on the defaulters. It may be
stated that among the respondents 36.8% believed that it was important for the NBS
to give reminders to students to pay up the tuition fees on time and another 36.8%
of the respondents considered that imposing penalties will make the students pay
tuition fees on time.
5.3.2 It is recommended that the NBS should review their method of payment of
tuition fees, since the current method exposes the institution to risk. This sentiment
was supported by majority (52.6%) of the respondents who agreed that the method
of payment of tuition fees at the NBS exposed the institution to risk.
5.3.3 It is recommended that as the NBS method of payment of tuition fees was
weak it needs improvement. This was supported by about half (47.4%) of the
respondents who agreed that the NBS need to improve on the method of payment
of tuition fees by the students.

109
5.3.4 It is recommended that NBS should re-evaluate the UNAM Policy and
Procedure manual that they have adopted and implemented and align it to NBS
operations, processes and structures.
5.3.5 It is recommended that NBS should strive to improve on its financial
management strategies in order to effectively and efficiently manage its financial
resources in terms of matching the assets and liabilities, to ensure financial
sustainability and competitiveness. In the same vein, it is also recommended that
the NBS should be innovative in exploring other means of generating additional
funds to support its activities.
5.3.6 It is recommended that NBS should undertake a thorough review of the
UNAM Finance policy and procedure manual adopted by it, to customize it to its
structures, processes and operations. The reviewed Finance policy and procedure
manual should then be adopted by the NBS.
5.3.7 The NBS should develop and a formal and integrated risk management
framework, including the risk management policies and procedures.
5.3.8 The NBS should create a risk awareness culture amongst its staff and
stakeholders and review its governance structures.

110
5.4 Directions for further research
Research is a continuous process. Based on the experience gained from this
research it is recommends that further research should be undertaken to cover the
areas not covered by this research. Some of the areas where research is needed are
as under:
a) Research should be undertaken to determine the variables not covered
within the scope of this study. This may be relevant and is expected to
contribute to the achievement of the objectives of such a study.
b) The scope of the present study was limited to one institution, Namibia
Business School, in Namibia. Further research should be undertaken by
widening the scope and covering more institutions in Namibia. This will
provide an opportunity to cover a larger population and benefit from the
experiences of a larger group of respondents.
c) A study complementary to the present research is also recommended. Thus
research may be undertaken selecting some business school in the
neighbouring country such as South Africa may be suggested. South Africa
being comparatively a more developed country the research on financial
risk management in educational institution is expected to throw more light
on the issue.
111
REFERENCES
Akpo, S. (2006). Research Methodology. Windhoek: Centre for Open Learning,
Polytechnic of Namibia.
Aliaga, M. & Gunderson, B. (2002). Interactive Statistics. New Jersey: Prentice
Hall.
Andersen, T.J., (2000) Strategic Planning, Autonomous Actions and Corporate
Performance, Long Range Planning. 33, 184-200.
Anderson, K. & Terp, A. (2006), Risk Management, Andersen T.J. (ed.),
Perspectives on Strategic Risk Management: 27-46. Denmark: Copenhagen
Business School Press.
Ansell, J. & Wharton, F. (1992). Risk-Analysis, Assessment and Management. UK:
Willey.
Badu A.N. (2012). An Assessment on the effectiveness of Credit Risk Management
tools utilized by financial institutions in Ghana. Retrieved on 23/11/2015 from
www.air.ashesi.edu.gh.
Banks, E. (2005). Liquidity Risk: Managing asset and funding risk. New York:
Palgrave Macmillan.
Basel Committee on Banking Supervision, (1999). Principles for the Management
of Credit Risk: Basel, Switzerland: Basel Committee on Banking Supervision.
Bank for International Settlements (2006). Sound Credit Risk Assessment and
Valuation of Loans. Basel, Switzerland: Basel Committee on Banking Supervision.

112
Bogdan, R. C & Biklen, S. K. (2003). Qualitative Research for Education: An
introduction to Theories and Methods (4th ed.). New York: Pearson Education.
Brunnermeier, M.K., & Yogo, M. (2009). Liquidity, Macroeconomics, and Asset
Prices: A note on Liquidity Risk Management. American Economic Review. Papers
& Proceedings, 99 (2), 578-583.
Bryson, J.M. (2004). Strategic planning for public and non-profit organizations: a
guide to strengthening and sustaining organizational achievement (3rded.).
SanFrancisco: JosseyBass.
Caouette, J.B., Altman, E.I., Narayanan, P., & Nimmo, R. (2008). Managing Credit
Risk: The great challenge for the global financial markets. (2nded.). New Jersey:
John Wiley & Sons Inc.
Cardbury, A. (1992). The Financial Aspects of Corporate Governance and the
Code of Best Practice, Report of the Committee, Chairman Adrian Cadbury.
London: Gee Publishing.
Cassidy, D., Goldstein, L., Johnson, S., L., Mattie, J. A. & Morley, Jr. J., E. (2003),
Developing a Strategy to Manage Enterprise wide Risk in Higher Education.
White paper presented to the National Association of College and University
Business Officers (NACUBO) and PricewaterhouseCoopers. (Online).
www.pwcglobal.com/Extweb/pwcpublications.nsf/docid
Christopher, H., Henry. R. & Robert B., (2001).The Government of Risk:
Understanding Risk Regulation Regimes: London: Oxford University Press.

113
Committee of Sponsoring Organizations of the Tradeway Commission (COSO).
(1999). Enterprise Risk Management Framework.
Correia, C., Flynn, D., Uliana, E., & Wormald, M. (2007). Financial Management.
6th Ed. Cape Town: Juta & Co. Ltd.
Creswell, J.W. (2009). Research Design: Qualitative, Quantitative, and Mixed
Methods Approaches. (3rd ed.). Los Angeles: Sage Publications, Inc.
Crounhy, M., Galai, D., & Mark, R. (2000). A comparative analysis of current credit
risk models: A Journal of Banking and Finance, 24, 59-117.
Ezigbo. C. (2013). Management of Risks and Implication on the Nigerian
Manufacturing Sector. European Journal of Business and Management, 5(12).
Gay.L.R, Mills. G.E., & Airasian, P. (2009). Educational research (9th Ed.). Upper
Saddle River, NJ: Pearson Education.
Glantz. M., (2002), Credit Risk Management Sysyems of Janata Bank Limited.
Retrieved on 23/11/2015 from www.academia.edu.
Halim. A. K. (2007). Developing a formal and integrated risk management
framework in the higher education Sector: A case study on the University of
Nottingham, Retrieved on 10 April 2015, from www.citeseerx.lst.psu.edu
Higher Education Funding Council of England (2005). “Risk Management in
Higher Education", A Guide to Good Practice, prepared by

114
PricewaterhouseCoopers on behalf of HEFCE. Retrieved from
www.hefce.ac.uk/pubs/hefce/2005/05.
Helsloot, I., & Jong, W. (2006). Risk Management in Higher Education and
Research in the Netherlands. Journal of Contingencies and Crisis Management, 14
(3), 142-159.
Hopkins, P. (2010). Fundamentals of Risk Management: understanding, evaluating
and implementing effective risk management. New Delhi: India.
Jensen, M. & Meckling,W. (1976). Theory of the Firm: Managerial Behavior
Agency Costs and Ownership Structure. Journal of Financial Economics, 3(4):
305-360.
Keasey, K., Short, H., & Wright, W. (Eds.). (2005).Corporate Governance:
Accountability, Enterprise and International Comparisons: The Development of
Corporate Governance Code in the UK. England: John Wiley & Sons Ltd.
Karen, A.H. (2005). Essentials of Financial Risk Management. New Jersey: John
Wiley & Sons Inc.
Leedy, P. D. & Ormrod, J. E. (2010). Practical Research: Planning and Design.
(10th Edition). New Jersey, USA: Pearson Education International.
Maree, K. (2007). First steps in research. Pretoria, South Africa: Van Schaik
Publishers.

115
Miller, D. & Friesen, P.H. (1978). Archetypes of Strategy Formulation, Journal of
Management Science. 24(9), 921-933.
Mintzberg, H., Quinn, J. B., Lampel. J. & Ghoshal. S. (1998). The strategy process:
Concepts, contexts, cases, 2nd Ed., New York: Prentice-Hall.
Mintzberg. H., & Quinn J.B. (1991). The Strategy Process: concepts, contexts,
cases. Michigan: Prentice Hall
Moles. P. (1998). Financial Risk Management: Sources of financial Risk and Risk
Assessment: Great Britain: Edinburgh.
Oldfield. G.S. & Santomero. A. (1997). The Place of Risk Management in Financial
Institutions. Sloan Management Review: Summer.
Partnerships, B.C. (2005). An Introduction to Risk Management in a Public Private
Partnership. Partnerships British Columbia, Retrieved on 16 November 2015, from
www.diva-portal.org.
Paul, T. (2013). Effects of Corporate Governance Mechanisms on the Performance
of Publicly Traded SMEs in Developing Economies: International Journal of
Economics, Commerce and Management. 1(1). Retrieved on 07/12/2015 from
www.ssrn.com/abstract=2381213.
Poonia. V.S (2010). Production and Operations Management. Gennext Publication,
Delhi, India.

116
Ragui, M. & Weru, P.W. (2013). The Managerial Process of Crafting & Executing
Strategy: Prime Journal of Social Sciences, 2 (4), 275-281.
Ruocco, P., & Proctor, T. (1994). Strategic planning in practice: a creative approach.
Marketing Intelligence and Planning, 12 (9), 24-29.
Santomero, A.M. & Babbel, D. (1996). Financial Markets, Instruments and
Institutions, Burr Ridge, IL:Richard D. Irwin, Inc.
Santomero. M. A. (1997). Commercial Bank Risk Management: An Analysis of the
Process, Wharton Financial Institutions Center.
Saunders, M. (2002). Research Methods for Business Students. (6th ed.). Pearson
Custom Publishing.
Saunders, M., Lewis, P. & Thornhill, A. (2007). Research Methods for
BusinessStudents (4th ed.) Harlow: Pearson Education.
Skipper, H. D. & Kwon, W..J. (2007). Risk Management and Insurance:
Perspectives in a Global Economy. Malden, MA: Blackwell Publishing.
Smithson, C., Smith, C. Jr., & Wilford, D. (1995) Managing Financial Risk: A
Guide to Derivative Products, Financial Engineering, and Value Maximization,
Burr Ridge, IL: Irwin Publishing.
Stahl, M. J. &Grigsby, D. W. (1992). Strategic Management: Formulation and
Implementation. Boston, USA: PWS Kent Publishing Company.

117
Stulz, R.M. (2005). Rethinking Risk Management: Journal of Applied Corporate
Finance. 9(3), 8-25.
Thompson, A.A. & Strickland, A.J. (2003). Strategic Management Concepts and
cases: Tata, McGraw Hill.
Trainer, J. F. (2004). Models and tools for strategic planning. New Directions for
Institutional Research, 123, 129-138.
University of Cape Town. (2010). Annual Report 2010. Cape Town, South Africa.
Vinzant, D.H & Vinzant, J.C. (1996), Strategic Management and Total Quality
Management. Public Administration Quarterly. 20, 201-219.
Wahlström, G. (2009). Risk management versus operational action: Basel II in a
Swedish context. Management Accounting Research, 20, 53‐68.
Waring, A.E. & Glendon, A.I., (1998). Managing Risk: Critical Issues for Survival
and Success into the 21st Century. London: ITBP.
Welmann, C., Kruger, F. & Mitchell, B. (2005). Research Methodology. (3rd Ed).
Cape Town: Oxford University Press.
Wenner, M., Navajas, S., Trivelli, C., & Tarazona. A., (2007) Managing Credit Risk
in Rural Financial Institutions in Latin America. Retrieved from www.afraca.org on
7/12/2015.

118
Wheelen, T. L. & Hunger, J. D. (2003). Concepts in Strategic Management and
Business Policy: Pearson Education.
Wheelen, T.L. & Hunger, J.D. (1998). Strategic Management and Business Policy,
Addison, Wesley Reading M.A
Whittington, R. (2001). What is Strategy and Does it Matter. London: Thomson
Learning.Retrieved from www.cpaaustralia.com.au/media
Yin, R. K. (1994). Case Study Research: Design and Methods (2nd Ed.). London:
Sage.

119
APPENDICES
Appendix 1: QUESTIONNAIRE ON FINANCIAL RISK MANAGEMENT
STRATEGY FOR A BUSINESS SCHOOL: A CASE STUDY OF NAMIBIA
BUSINESS SCHOOL.
Dear respondent,
I Anna Amutenya, a student at the University of Namibia, Namibia Business
School. I am pursuing the Master’s Degree in Business Administration (MBA) -
Finance.
Thank you in advance for sparing your time to join this survey. This survey is being
conducted in partial fulfillment of the requirements for my Master`s thesis with a
view of understanding your views on Namibia Business School financial risk
management. The survey is on liquidity and credit risks faced by NBS in its
operations.
Your participation in the survey is voluntary and you are free to quit it at any stage.
Information collected and respondents names will remain confidential.. The results
will be used only for research purposes and shall be presented only in aggregate
without being revealed to outside firms. The results of this survey will be shared
with the NBS after permission from appropriate authorities in this respect. This
questionnaire consists of 21 questions divided into 4 sections. Your accurate and
frank response is important to the success of this survey.

120
Section A: Biographical and Personal Data of respondents
1. Gender (Tick the appropriate box to show your choice)
Male
Female
2. Age (Tick the appropriate box to show your choice)
Less than 20 years
21 – 30 years old
31 – 40 years old
41 – 50 years old
51 – 60 years old
61 years and above
3. Period of Study (Tick the appropriate box to show your choice)
2008 – 2009
2009 – 2010
2010 – 2011
2011 – 2012
Any other (Specify)
4. Level of Study (Tick the appropriate box to show your choice)
Post Graduate Diploma
Masters of Business Admin
Doctor of Business Admin
Any other (Specify)
Section B: UNDERSTANDING AND IDENTIFICATION OF FINANCIAL
RISKS
5. What was the method of payment at registration? (Tick the appropriate box
to show your choice)

121
Full registration fees
as required
Partial payment of
registration fee
No payment
6. What was the method of payment of tuition fee during study? (Tick the
appropriate box to show your choice)
Full payment of
tuition fees as
required
Partial payment of
tuition fees
No payment of fees
7. Did you experience any delays in payment/settling of tuition fees?
(Tick the appropriate box to show your choice)
Yes
No
8. Did you experience any defaults in payment/settling of tuition fees?
(Tick the appropriate box to show your choice)
Yes
No
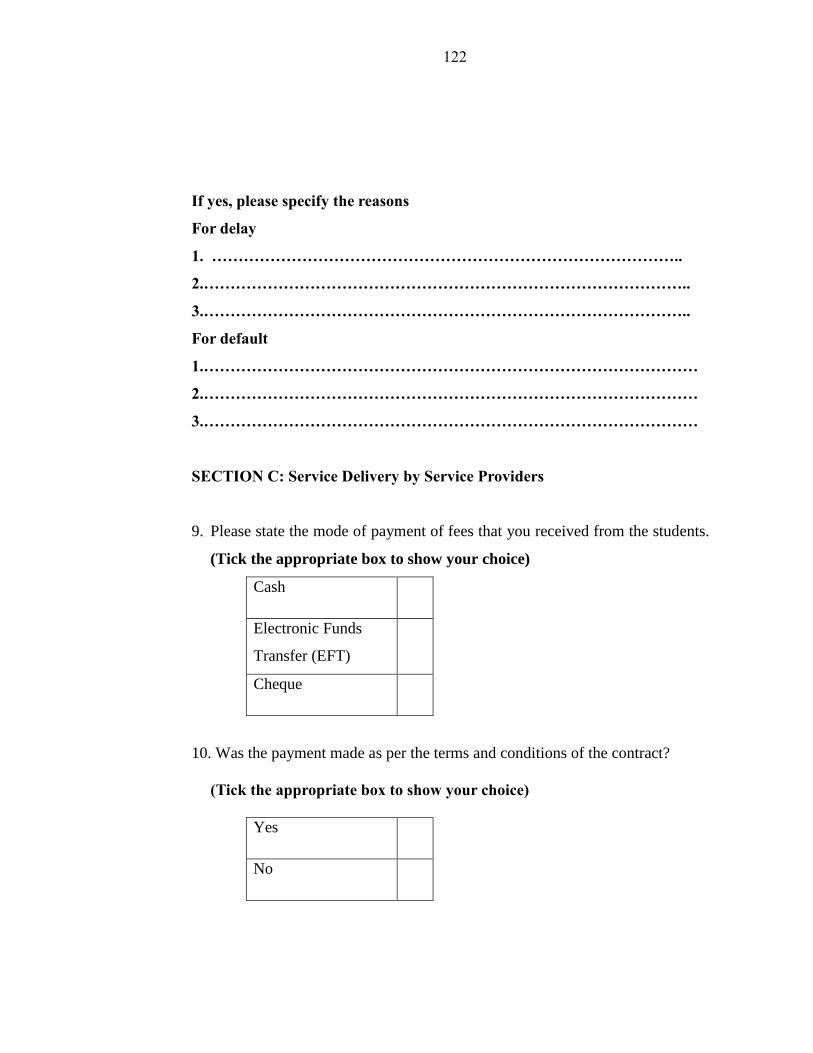
122
If yes, please specify the reasons
For delay
1. ……………………………………………………………………………..
2.………………………………………………………………………………..
3.………………………………………………………………………………..
For default
1.…………………………………………………………………………………
2.…………………………………………………………………………………
3.…………………………………………………………………………………
SECTION C: Service Delivery by Service Providers
9. Please state the mode of payment of fees that you received from the students.
(Tick the appropriate box to show your choice)
Cash
Electronic Funds
Transfer (EFT)
Cheque
10. Was the payment made as per the terms and conditions of the contract?
(Tick the appropriate box to show your choice)
Yes
No

123
11. Did you encounter any problem/s in getting your payment after providing
services to NBS?
(Tick the appropriate box to show your choice)
Yes
No
12. Did you experience any delays in receiving the payments?
(Tick the appropriate box to show your choice)
Yes
No
If yes, what should NBS do to facilitate payments for services rendered? Please
specify
1…………………………………………………………………………………
2.………………………………………………………………………………..
3.…………………………………………………………………………………
13. The method of payment of college fees by NBS students exposes the
institution to risk.
(Tick the appropriate box to show your choice)
Strongly disagree
Disagree
Neutral

124
Agree
Strongly agree
13. NBS need to improve its method of payment of tuition fees by students.
(Tick the appropriate box to show your choice)
Strongly disagree
Disagree
Neutral
Agree
Strongly agree
14. Risk associated with default in payment affects other service deliverables at
NBS.
(Tick the appropriate box to show your choice)
Strongly disagree
Disagree
Neutral
Agree
Strongly agree

125
15. NBS is currently facing liquidity problems.
(Tick the appropriate box to show your choice)
Strongly disagree
Disagree
Neutral
Agree
Strongly agree
16. NBS strategy of debt collection/ outstanding fee is appropriate?
(Tick the appropriate box to show your choice)
Strongly disagree
Disagree
Neutral
Agree
Strongly agree
17. NBS strategy for debt collection/outstanding fee etc needs improvement?
(Tick the appropriate box to show your choice)
Strongly disagree
Disagree
Neutral

126
Agree
Strongly agree
18. What do you think NBS should do to facilitate on-time payment of tuition fees
by students? Use the space provided to write your reasons.
.…………………………………………………………………………………
……………………………………………………………………….…………
…………………………………………………………………………………
20. Please feel free to add any initiatives that you think are necessary to
manage on-time payment of tuition fees by students at NBS.
………………………………………………………………………………
………………………………………………………………………………
………………………………………………………………………………
………………………………………………………………………………
………………………………………………………………………………
SECTION D: Work environment and Working conditions at NBS
21.In your own opinions, how do you rate the environmental and working
conditions at NBS
(Circle the appropriate word to show your opinion)
Feature/Condition Ratings
Infrastructure/facilities/Offices Good Acceptable Bad
Management of financial risk Good Acceptable Poor

127
General administration` Adequate Acceptable Too few
Pressure on management to
manage risk
High Moderate Low
Staff morale/motivation High Moderate Low
Thank you for participating in this survey.

128
Appendix 2: REDORDED AND TRANSCRIBED INTERVIEWS
FINANCIAL RISK MANAGEMENT STRATEGY
FOR A BUSINESS SCHOOL:
A CASE STUDY OF NAMIBIA BUSINESS SCHOOL
First Interview
Page1 to Pg 10
Second Interview
Page1 to Pg 7
Audio Recording
(Duration 00:23:57)
&
(Duration 00:25:56)

129
FIRST INTERVIEW
MS AMUTENYA: Thank you very much for your time, more so that you have
agreed to take part in the interview.
INTERVIEWED: Any time.
MS AMUTENYA: This interview is based on the research study on the financial
risk management at NBS, based on the research topic, “Financial risk management
strategy for a business school: A case study of NBS.” The researcher aims to study
the levels and kind of financial risk that NBS is exposed to, and will further look at
mechanisms to mitigate the identified risks. The study is limited to credit risk and
liquidity risk and covers the period from 2009 up until 2011. Please feel
comfortable and if I have to pose any question and you are not comfortable
answering it please indicate as such.
INTERVIEWED: Okay.
MS AMUTENYA: The reason you were chosen to take part in the interview is
because of your role and responsibilities at the school.
INTERVIEWED: Okay.
MS AMUTENYA: The interview is scheduled to last not more than thirty minutes.
INTERVIEWED: Noted.
MS AMUTENYA: But first of all, I just to confirm to you and reassure you that
the information that will be collected now and gathered here will be used for
research study only. Further, your identity will not be revealed and all the
information will be treated with high degree of confidentiality. So the research
results will only be used for the benefit of NBS and I am hoping that we will be
able to get the best out of it.
INTERVIEWED: I am good.
MS AMUTENYA: Further, just to confirm, before we proceed, that you still agree
to partake in the study.

130
INTERVIEWED: Yes, I confirm to partake in the study.
MS AMUTENYA: Thank you very much.
MS AMUTENYA: As I informed you earlier, the study is all about financial risk.
And that is a risk that NBS is exposed to. So what we want is to understand the risk
that the school is exposed to, the level the school is exposed, where is that risk
coming from and how does the school manage it, because at the end of the day we
are looking at a strategy that we can recommend for the development of a strategy
that then will benefit NBS in managing its financial risks.
MS AMUTENYA: So to start off with I just want to understand the main sources
or revenue of NBS. Where does NBS derive its revenue?
INTERVIEWED: NBS derives its revenue from student tuition which is our core
source of revenue. We also have provide executive training, consulting as well as
fundraising. So those are the main sources of income, but the core is student tuition.
MS AMUTENYA: Student tuition is the core source of revenue for the school.
INTERVIEWED: Yes.
MS AMUTENYA: And then have executive training, fundraising and consulting?
INTERVIEWED: Yes, those are the sources of revenue for the school.
MS AMUTENYA: And how much how much do you get from these sources?
When you say student tuition is core how much do you get from that?
INTERVIEWED: Currently student tuition would make up about ninety percent
(90%). And the rest will be split between those other variables.
MS AMUTENYA: And receiving this revenue, is it always enough to cover all the
expenses?
INTERVIEWED: Yes, the revenue is enough to cover the expenses, but collection
is a problem here at the school.
MS AMUTENYA: Collection?
INTERVIEWED: Oh yes, collections.

131
INTERVIEWED: What im saying is, if we collect everything on time then it would
be enough to cover all the expenses throughout the year.
MS AMUTENYA: So the challenge that you face is the timely collection
INTERVIEWED: Yes, that is correct.
MS AMUTENYA: On consulting, how does it work? Is it your staff consulting or
do you have people to consult on behalf of NBS?
INTERVIEWED: It is mainly our staff consulting with the business sector. And in
that way, they raise funds on behalf of NBS.
MS AMUTENYA: Oh raise funds? Okay. Have you ever experienced any surplus
between 2009 and 2011?
INTERVIEWED: Yes, we had a surplus during 2009-2010 financial year.
MS AMUTENYA: How was the surplus used?
INTERVIEWED: It was reinvested back into the school for future expansions.
MS AMUTENYA: And was there a period when you had a deficit?
INTERVIEWED: Yes, we experienced a deficit during 2010-2011 financial year.
MS AMUTENYA: How did you manage with the deficit?
MS AMUTENYA: How did you make sure that you still pull through, cover all
your expenses and meet all your obligations and still be able to provide service as
usual?
INTERVIEWED: Most of the time, we negotiate with the suppliers and service
providers. For example, we negotiate with our partnerships ie MSN and other
memberships to put our payments on hold for sometimes. And then we pay them at
a later date when our financial position has improved. Obviously you cannot
negotiate with your employees, because they also have obligations to meet.
MS AMUTENYA: Okay. But did this not lead to extra expenses to be incurred?
Example, where you not penalised or charged interest on outstanding accounts? Or
even worse, cancellation of these memberships?

132
INTERVIEWED: Yes, we incurred charges but it is a catchy situation because that
was the only way we could.
MS AMUTENYA: Now back to the students being the core providers of revenue.
Earlier, you indicated that student tuition is the core source of revenue for the
school. You also indicated that you are faced with a challenge of collection
outstanding tuition fees on time. What did you do to encourage timely payment of
tuition fees?
INTERVIEWED: Yes we did. What we did is as follows. We implemented the
blocking of exam results until the payment of the outstanding of fees has been
effected. In that, it also led to the holding back of qualifications for the students
who were in their final years of study.
MS AMUTENYA: Ok. But was these methods effective? Did they improve your
collection and financial position though?
INTERVIEWED: It was not effective as we wanted it, but to a certain degree we
managed to collect from some students.
MS AMUTENYA: Ok.
INTERVIEWED: And then this year, 2014 we are going to implement a new
strategy of collecting debts. This entails putting in specific dates when students are
expected to pay a certain amount which is by a certain date. For example, fifty
percent (50%) must be paid on registration and then seventy-five percent (75%)
must be covered by June of that year and then hundred percent (100%) by October
of the same academic year. In addition, if that doesn’t work out, then we will
immediately hand over the accounts with outstanding balances to the Debt
Collectors.
MS AMUTENYA: Debt collectors? OK.
INTERVIEWED: Yes. Because we realised that waiting for students to pay at their
own pace led us to the situation I have alluded to earlier. That is of not having

133
sufficient funds throughout the year and thus leading to postponement of some
essential payments for services.
MS AMUTENYA: And are these measures or strategies that you have put in place
working or were they effective?
INTERVIEWED: They were somehow effective to a certain level.
INTERVIEWED: The initial measure of the payment of fifty percent (50%) up
front and then you had the whole year to pay off was not effective, because by
October the students are with the classes for the academic year. And you do not
have any hold on the students and that is why we never actually recovered our dues
on time with that method.
MS AMUTENYA: Oh okay.
INTERVIEWED: And then, normally they come back in January of the next
academic year before the next registration date to settle the outstanding accounts in
order to get their exam results and also register for the next academic year for the
returning students.
INTERVIEWED: So you could see that there was a pattern of students paying in
January or at the time of registration and very little payments were made during the
course of the year. But then at most they were unable to settle the outstanding and
then pay the whole registration fees so they negotiate again for later payments.
MS AMUTENYA: Thank you for the insight. Moving on, who is responsible for
the risk management function at NBS?
INTERVIEWED: The function should be with the Assistant Director.
MS AMUTENYA: Assistant Director? You sound unsure.
INTERVIEWED: Maybe, because I don’t see it being practiced or I really do not
know.
MS AMUTENYA: What do you see being done or practiced? Or do you think
something could have been done better?
INTERVIEWED: What I’m saying is that I don’t see it being practiced in any way.

134
MS AMUTENYA: Uh. Not practiced.
MS AMUTENYA: Moving on. Was there a time where NBS was faced with a
cash flow problem or liquidity problem?
INTERVIEWED: Yes, we are normally faced with liquidity problems here around
October/November. The thing is, NBS cash flow works like this. In
January/February, during the registration process, we’ve got a huge inflow of cash
which can almost amount to three million Namibian dollars (N$3 000 000-00) or
four million Namibian dollars (N$4 000 000-00).
INTERVIEWED: So what we actually need to do is to manage that cash in such a
way that we are able to meet our obligations throughout the year and still provide
quality service to our stakeholders. Because we are not sure when the students will
pay, if they ever pay and how much the students will actually pay. The problem is
to manage that cash flow that we get in the beginning of the year so that it lasts us
for the whole year.
MS AMUTENYA: In short you are saying that cash flow management is a problem
or challenge? You are also confirming that there is a mismatch between your assets
and your liabilities?
INTERVIEWED: Yes, exactly what I mean. Because once we realise that we are
faced with low cash flows, only than we start collecting again. So now we start
calling students reminding them of the outstanding accounts and demanding
payments. Sometimes, some students will pay others don’t pay up. And, sometimes
with those payments, we are able to see pull through the year.
MS AMUTENYA: Ok. And what if you don’t receive enough to see you through
the year?
INTERVIEWED: That is where the negotiation for later payments with the
suppliers and service providers come in. Or simply let our suppliers’ and service
providers’ accounts stand over to the next period until we have funds.
INTERVIEWED: And that incurs interest/ penalties.

135
MS AMUTENYA: Maybe just an overview of risk management at NBS. What do
you think about risk management at NBS? What are you doing? How are you
managing your risk? Do you think you are on the right track? Are you doing what
you are supposed to do or do you think something else could have been done just
to make sure that you manage all these risks?
INTERVIEWED: We are relatively a small school but things can be improved.
There is room for improvement. And that must come from the top.
MS AMUTENYA: Please elaborate on what you mean when you say that the drive
for improvement should come from the top.
INTERVIEWED: What I mean is that top management should give us guidelines
and policies on how to manage risk. I believe they are the best suited to be the
drivers of risk management.
MS AMUTENYA: Are you saying that there are no policies on risk management
in place? Or there are policies in place but not implemented?
INTERVIEWED: The policies are there, but not the, they are not
enforced/implemented as such. Or at least I think, I know that there are policies,
financial policies, I do not know whether this risk management is also incorporated
in financial policies.
MS AMUTENYA: Okay. To ensure that the school have enough cash and they
are still able to meet their obligations throughout the year, what do you think needs
to be done?
INTERVIEWED: Okay, my strategy is actually just to cut cost. Cut unnecessary
expenditure like travelling and membership fees of bodies or associations that are
not necessary.
INTERVIEWED: But our rule is simple and has been simple. For example, if you
are engaging in a project or if you want NBS to sponsor a project, then there should
be a known benefit, ie financial benefit or in any other form such as skills transfer

136
from the project to the school. So in anything you do, if you have to travel to a place
some sort of financial gain should come in or flow to the school.
INTERVIEWED: That is our policy.
MS AMUTENYA: Is it a policy or rule as you said earlier?
INTERVIEWED: That is a policy kind of rule.
MS AMUTENYA: Ok.
MS AMUTENYA: Apart from the measures you have referred to earlier, what other
measures do you have in place to collect your dues?
INTERVIEWED: Since I said that ninety percent (90%) of the revenue is derived
from student tuitions, and the remaining ten percent (10%) is spread over executive
training, consulting and fundraising, there is actually no much movement of cash
from the later. And the respective departments ensure collection on time.
MS AMUTENYA: Okay. Any problems or challenges that you encountered
during that collection of outstanding accounts process?
INTERVIEWED: So students are getting irritated and they think that I am, I’m a
bad person, they don’t even like me anymore because of collections. They get angry
and then they come, some come and pay while some don’t pay.
MS AMUTENYA: Oh they won’t pay. So the whole debt collection mechanism
is not efficient?
INTERVIEWED: To a certain extent yes.
MS AMUTENYA: And what do you think NBS needs to do to make it effective?
INTERVIEWED: As I said we want to enforce this new rule model going forward.
The payment on a 50%, 75% and 100% basis.
MS AMUTENYA: Okay.
INTERVIEWED: And then we see, we will see how we will see how it will work
out.
MS AMUTENYA: Okay. So there is a prospect that the new measures are going
to improve?

137
INTERVIEWED: Yes, we hope so. The thing is, we took the model from other
business schools in South Africa as an example. We saw how they are doing it so
we want to try their method of collecting. Since it is a new method of doing things,
I believe if we can appoint another or extra person just to deal with debt collection
that will improve our financial position.
MS AMUTENYA: Uhm. Will that not push up costs?
INTERVIEWED: Yes, it will incur extra costs, but the benefits will be much higher
than because that person will see to it that all the dues are collected on time. I think
generally, there’s a staff shortage in the finance department.
MS AMUTENYA: So you are saying because there is few staff so you are not able
to carry out this function fully?
INTERVIEWED: Yes, exactly what I mean.
MS AMUTENYA: Okay. Further, you said you have a financial policy.
INTERVIEWED: Yes, but I didn’t actually take a look at it. I don’t know whether
there is a risk management plan built it in it.
MS AMUTENYA: Okay.
INTERVIEWED: But there are financial policies.
MS AMUTENYA: With the financial policy that is in place, how often do you
review that?
INTERVIEWED: It should be reviewed every year I think.
MS AMUTENYA: Every year?
INTERVIEWED: But it’s not done.
MS AMUTENYA: Are you saying that the policy was not reviewed for the study
period?
INTERVIEWED: Yes it was not reviewed. Or if it was reviewed, the outcome was
not communicated.

138
MS AMUTENYA: Ok. But if you don’t review your policies, how do you ensure
that your policies are still in line with your strategic goals and objectives?
INTERVIEWED: That I cannot say.
MS AMUTENYA: And any strategic plan in place?
INTERVIEWED: Yes, there is t a strategic plan that I know of. And certain aspects
of it is implemented.
MS AMUTENYA: Okay. So not all of it is implemented. And how often do you
go back to your strategic plan?
INTERVIEWED: I really do not know.
MS AMUTENYA: Who is supposed to do this? Whose function is it?
INTERVIEWED: It is the Director and Assistant Director’s responsibility to drive
the strategies including the objectives of the strategic plan.
INTERVIEWED: They have to enforce the objective of the strategic plan.
MS AMUTENYA: Now if you have never seen these strategic objectives or plans
being reviewed, how do you keep in line with your financial policy and how do you
ensure that your financial objectives are talking to the overall strategic objectives
of NBS?
INTERVIEWED: That is the problem, that whole thing is not done. That whole
strategic plan and financial policies are not looked at the way they should be looked
at and not reviewed timeously.
MS AMUTENYA: So what is your suggestion here?
INTERVIEWED: That NBS actually starts having workshops, staff workshops or
staff sessions where we discuss the strategic plan. Through that, we are able to see
that, as institution, we are in line with the strategic plan.
MS AMUTENYA: Okay.
INTERVIEWED: Maybe we do our performance reviews every third month or
quarterly to see where we are and where we are going.
MS AMUTENYA: Okay.

139
MS AMUTENYA: Then that should also help you to measure performance against
strategic objectives
INTERVIEWED: Indeed.
MS AMUTENYA: Okay, I that was all the questions I have for you unless you
have any comments, contributions or questions that you would like to pose.
INTERVIEWED: Everything was clear.
INTERVIEWED: I think I said what I had to say.
MS AMUTENYA: Okay.
MS AMUTENYA: In the absence of any further questions, thank you so much for
your time.
INTERVIEWED: Okay, thank you.
MS AMUTENYA: And as I have communicated earlier, this interview was for the
research study purposes and all these information will be treated with the highest
degree of confidentiality.
INTERVIEWED: Okay.
MS AMUTENYA: Thank you so much.
CONCLUSION OF FIRST INTERVIEW

140
SECOND INTERVIEW
MS AMUTENYA: First of all, I must thank you for taking off your time to partake
in this research study. The main reason of our meeting is to get an understanding
of financial risks that Namibia Business School (NBS) is exposed to in its’
operations. The study looks to get a thorough understanding of the credit and
liquidity risks. At the end, the study aims to recommend for a strategy to help NBS
manage the identified risks. In addition, you were chosen because of the roles and
responsibilities at NBS and I would like you to share the experiences and give
insight on risks and its management.
Before we start with the interview, and having heard of the purpose of the research
study, please confirm again that you’re willing to take part in the study. I also
humbly request that you please be honest with your answers and if at any stage you
feel like you cannot carry on, please indicate as such or if I pose a question and you
are not in a position to answer the question, you are more than welcome to indicate
as such.
INTERVIEWED: Thank you for the opportunity. I am willing to take part in the
study. I also take note of all the information provided.
MS AMUTENYA: Okay thanks. First of all, can you please give an overview of
risk at NBS, including the risk management function, processes and policies?
INTERVIEWED: Thank you for the question. You should know that this is a very
small business school. It is still at a very early stage.
INTERVIEWED: Some policies are implemented and some are not implemented
as yet, although some things are on paper. On the function, I am not sure who
exactly should carry out this function as I’m not aware of it being carried out.
Maybe it is done, maybe not.
MS AMUTENYA: Ok. What about the policies?

141
INTERVIEWED: I hear there was something drafted but I am sure if it was
eventually implemented. As I said, I don’t see that function carried out or let me
say I am not aware of any staff that carries out the function.
MS AMUTENYA: So. But in your own observations, do you think that NBS is
exposed to risk in its operations? Specifically financial risk? Are there risk
exposures?
INTERVIEWED: Ja, we face some difficulties in sometimes paying our suppliers
on time.
MS AMUTENYA: Okay.
INTERVIEWED: So and again there is not something to follow, let me say like a
policy to say that in this case I should do A, B, C or whatever. And that is due to a
lot of the factors.
MS AMUTENYA: Okay. If you can just go in detail. You said you have
something on paper which is not implemented or followed or let me say policies to
follow if any but not followed. How do you go about carrying out your roles and
responsibilities without policies to follow?
INTERVIEWED: The reason why I am saying that is because according to my
predecessor, there was a document drafted and submitted to the seniors for review
and approval. However, that policy is still not implemented. Not approved either.
MS AMUTENYA: Okay.
INTERVIEWED: Meaning that what we are doing now is just out of experience
and knowledge.
MS AMUTENYA: Knowledge?
INTERVIEWED: All out of the blue as I mentioned. So this was problem number
one and the other problem is just ourselves again. The way we organise ourselves I
think also contributes.
MS AMUTENYA: Explain on what you mean by that please?

142
INTERVIEWED: It seems that we are happy at the beginning of the year, we get
money in, than we forget to collect or to put that collecting plan and measure in
place. That has not been in place in the past but it is slowly only happening now
after seeing what we go through during the year.
MS AMUTENYA: Ok. At least you have something now?
INTERVIEWED: Yes, we put something in place now.
MS AMUTENYA: Okay. So having said that, what is the school’s main source of
income?
INTERVIEWED: You know in all business school, let me just say, in general first,
the main income of about ninety percent (90%) of income obviously should come
from executive education.
MS AMUTENYA: Okay.
INTERVIEWED: Although that is not the case with us. For us it comes from just
learning department through student tuition.
MS AMUTENYA: Okay.
INTERVIEWED: So student tuition is one of the biggest contributors to our
revenue stream. The others, which are fundraising, donations and consulting brings
in a small amount.
MS AMUTENYA: And does the student tuition generate enough revenue so that
you are able to meet all your obligations when they are due? And do you collect on
time?
INTERVIEWED: I can say yes and no.
MS AMUTENYA: Okay.
INTERVIEWED: Let me start with yes. Yes, because the money we receive or
collect covers us up until some months but not the whole year. And that is why I
said earlier that some months, especially towards the end of the year, we skip some
of the payments. Meaning that we did not do our homework properly.
MS AMUTENYA: Ok. Why do you say you did not do your homework properly?

143
INTERVIEWED: Because we have money on paper, but when we cross check
with the actual money we have than you realise that the two do not add up. For
example, number of registered students and the amount due by than can be around
five (5 000 000) million N$, but when you check that against the amount available,
which can be as little as five hundred thousand (N$500 000). What is that?
INTERVIEWED: Means that our collection process is not adequate and effective.
MS AMUTENYA: What do you do in those instances where you find yourself in
a situation where you do not have enough funds to meet your obligations?
INTERVIEWED: Not in terms of employees but in terms of suppliers yes. But we
try to be fair enough just to call our suppliers in advance and request for extension
to pay at a later stage. And the moment our financial position improves, than we
pay our due accounts.
MS AMUTENYA: Okay. So you go back and renegotiate again.
INTERVIEWED: Ja.
MS AMUTENYA: And that will come at a cost I guess.
INTERVIEWED: Sometimes, sometimes not.
MS AMUTENYA: Okay. And did you experience a surplus
INTERVIEWED: Yes, we had a surplus sometimes. For one year I think.
But the problem is that we had long-term debts. Like for example from MSN and
GEM subscriptions. What you put in and what you get out does not add up. They
give you less money but at the end you are the one that ends up paying more. And
there is little value adding from these.
MS AMUTENYA: Ok. But earlier on, I posed a question on collection and you
answered on yes but not on the No. Could you please go into the details of the NO.
INTERVIEWED: Oh okay, let me come to the No. No, in a sense that, as I said,
when you look at your debt you probably see that you are owed for example five
million Namibian dollars (N$5 000 000-00) but the actual amount you have is far
less than that.
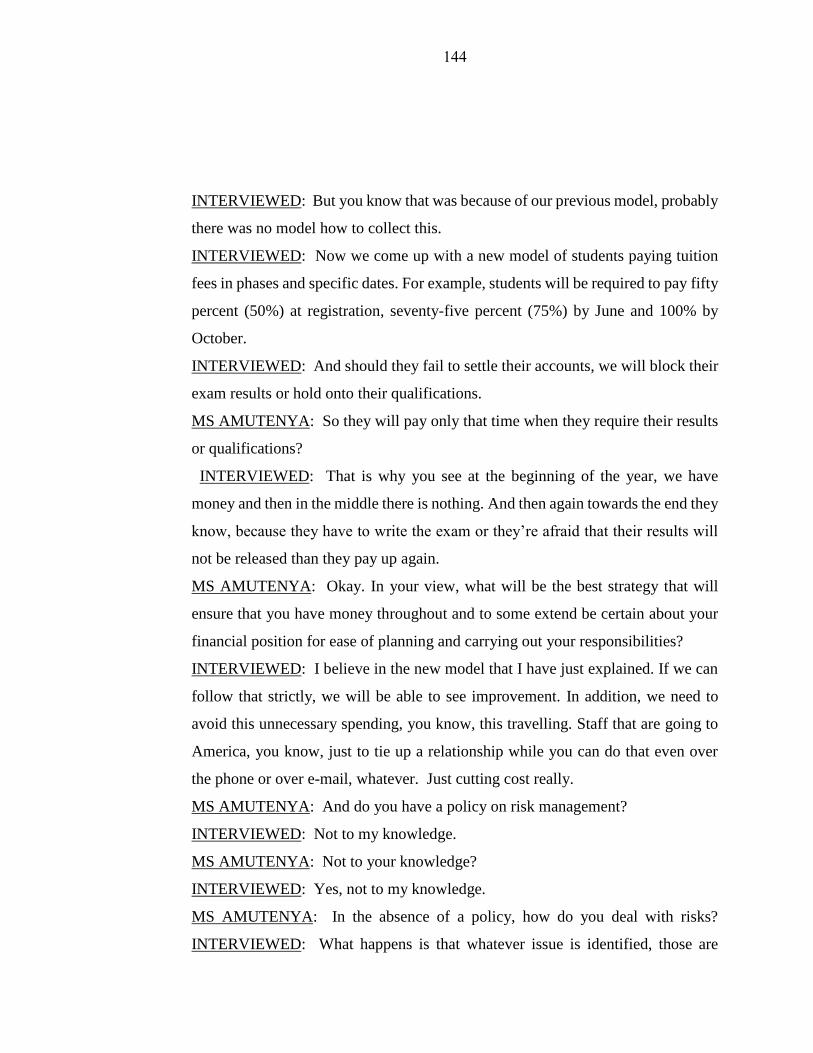
144
INTERVIEWED: But you know that was because of our previous model, probably
there was no model how to collect this.
INTERVIEWED: Now we come up with a new model of students paying tuition
fees in phases and specific dates. For example, students will be required to pay fifty
percent (50%) at registration, seventy-five percent (75%) by June and 100% by
October.
INTERVIEWED: And should they fail to settle their accounts, we will block their
exam results or hold onto their qualifications.
MS AMUTENYA: So they will pay only that time when they require their results
or qualifications?
INTERVIEWED: That is why you see at the beginning of the year, we have
money and then in the middle there is nothing. And then again towards the end they
know, because they have to write the exam or they’re afraid that their results will
not be released than they pay up again.
MS AMUTENYA: Okay. In your view, what will be the best strategy that will
ensure that you have money throughout and to some extend be certain about your
financial position for ease of planning and carrying out your responsibilities?
INTERVIEWED: I believe in the new model that I have just explained. If we can
follow that strictly, we will be able to see improvement. In addition, we need to
avoid this unnecessary spending, you know, this travelling. Staff that are going to
America, you know, just to tie up a relationship while you can do that even over
the phone or over e-mail, whatever. Just cutting cost really.
MS AMUTENYA: And do you have a policy on risk management?
INTERVIEWED: Not to my knowledge.
MS AMUTENYA: Not to your knowledge?
INTERVIEWED: Yes, not to my knowledge.
MS AMUTENYA: In the absence of a policy, how do you deal with risks?
INTERVIEWED: What happens is that whatever issue is identified, those are

145
discussed at the management meeting for guidance. That somehow became the
norm and we just do it like that.
MS AMUTENYA: And again, without any policy, how do you get students to
settle their accounts? What informs your decisions?
INTERVIEWED: Okay, it is build in the new model I talked about earlier.
Whenever a student is registered, they will have to sign an acknowledgement of
debt for outstanding tuitions. Further, they will be sent reminders of the outstanding
amounts with specific dates when they are required to settle their accounts.
MS AMUTENYA: Okay.
MS AMUTENYA: Is this new model linked to your strategic objectives?
INTERVIEWED: Not yet, because the new strategic plans need to be implemented
first before other policies can be implemented. Probably next year. There is a new
Head of the Institution expected next year, may this person will look at the plan and
have it implemented.
MS AMUTENYA: Since the policies are not implemented, will I be wrong to say
that are not reviewed as a practice with other policies?
INTERVIEWED: Truly speaking and to the best of my knowledge, I haven’t been
in one meeting where we reviewing a strategic plan. Not in during the time I have
been with the school.
MS AMUTENYA: Most institutions will review their strategies every year and set
goals and objectives for the years to follow. In the absence of any strategy and
policy in force, how do you carry out your respective roles and functions?
INTERVIEWED: What I said is that there are policies but not implemented. In the
absence of these, we follow the parent university policies and procedures. For
example, we have adopted the UNAM Finance Procedure & manual policy. So we
use that as our guide.
MS AMUTENYA: And on collection, what problems did you encounter?

146
INTERVIEWED: Students were just not paying. Even with the phone calls and
statements, they will make empty promises. Same with the sponsors. They also
never paid on time and therefore did not meet their obligations on time.
MS AMUTENYA: What suggestion do you have that can assist in avoiding
experiencing financial problems you had experienced in the past?
INTERVIEWED: Probably if we can get more sponsors or rather, other sources of
revenue such as Government funding or funding from the parent university. Maybe
that could improve.
MS AMUTENYA: So you mean you don’t receive any funding from the
Government?
INTERVIEWED: Nothing from the government nor the parent university. We are
just surviving on our own, which is student tuition.
MS AMUTENYA: So you are a body on its own so you have to source your own
funding.
INTERVIEWED: Yes. So that will bring, believe me, ultimate solution. Plans are
also underway for the school to form part of the parent university.
MS AMUTENYA: Okay.
MS AMUTENYA: Thank you for the information. I believe we have covered
everything that we were supposed to discuss, unless there is anything else that you
feel you need to discuss. Anything that came to mind during our discussion that
you feel we can discuss?
INTERVIEWED: No thanks. I think I have covered everything too. Nothing to
add.
MS AMUTENYA: In the absence of any further questions, here ends our interview.
Thank you very much for your time and the willingness to share the information
and your experience on financial risk at NBS.
INTERVIEWED: Thank you too.
CONCLUSION OF SECOND INTERVIEW