Financial results presentation - de.marketscreener.com file2 Important information This report...
36
Financial results presentation For the six months ended 30 September 2018
Transcript of Financial results presentation - de.marketscreener.com file2 Important information This report...

Financial results presentation For the six months ended 30 September 2018
2
Important information
This report contains forward-looking statements as defined in the United States Private Securities Litigation Reform Act of 1995.Words such as “believe”, “anticipate”, “intend”, “seek”, “will”, “plan”, “could”, “may”, “endeavor” and similar expressions areintended to identify such forward-looking statements, but are not the exclusive means of identifying such statements.
By their nature, forward-looking statements involve risk and uncertainty because they relate to future events and circumstances andshould be considered in light of various important factors. While these forward-looking statements represent our judgments andfuture expectations, a number of risks, uncertainties and other important factors could cause actual developments and results todiffer materially from our expectations. The key factors that could cause our actual results performance, or achievements to differmaterially from those in the forward-looking statements include, among others, changes to IFRS and the interpretations,applications and practices subject thereto as they apply to past, present and future periods; ongoing and future acquisitions,changes to domestic and international business and market conditions such as exchange rate and interest rate movements; changesin the domestic and international regulatory and legislative environments; changes to domestic and international operational,social, economic and political conditions; the occurrence of labour disruptions and industrial action and the effects of both currentand future litigation.
We are not under any obligation to (and expressly disclaim any such obligation to) revise or update any forward-looking statementscontained in this report, whether as a result of new information, future events or otherwise. We cannot give any assurance thatforward-looking statements will prove to be correct and investors are cautioned not to place undue reliance on any forward-lookingstatements contained herein.
3
Agenda
01
02
03
Strategic business review
VE / MultiChoice Group (MCG)
Financial review
04Outlook

4
STRATEGIC BUSINESS REVIEW
5
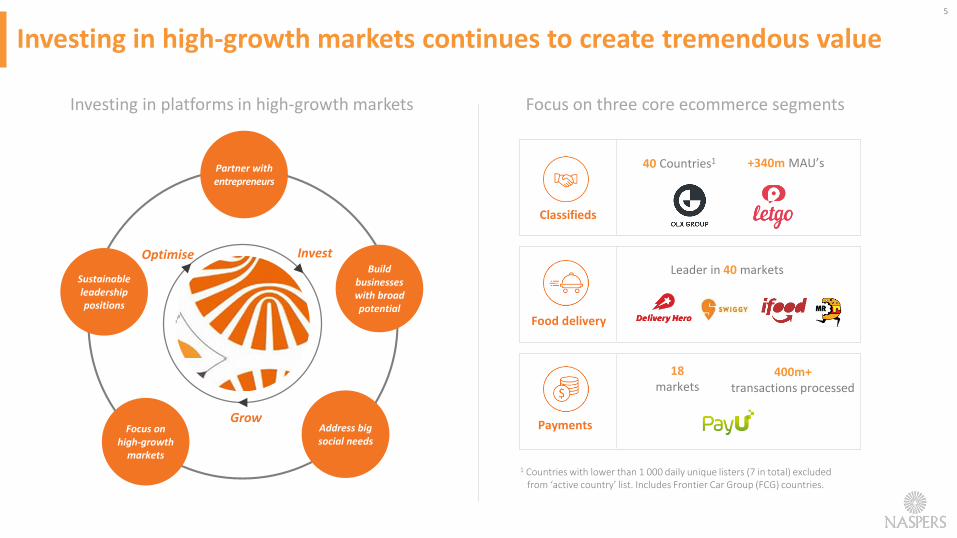
Investing in high-growth markets continues to create tremendous value
Leader in 40 markets
Payments
18 markets
400m+transactions processed
+340m MAU’s
Classifieds
40 Countries1
Food delivery
Payments
Investing in platforms in high-growth markets Focus on three core ecommerce segments
1 Countries with lower than 1 000 daily unique listers (7 in total) excluded from ‘active country’ list. Includes Frontier Car Group (FCG) countries.
Address big social needs
Focus onhigh-growth
markets
Partner with entrepreneurs
Build businesses with broad potential
Sustainable leadership positions
Optimise Invest
Grow

6
1H FY19 highlights
Announced VE listing/unbundling
Revenue up 23% (29%) YoY to US$11.0bn
Trading profit up 22% (34%) to US$2.0bn
Core headline earnings up 39% to US$3.85 per N ordinary share
Classifieds: strong growth trajectory, now profitable including letgo
Payments: TPV increased 22% (29%) to US$14bn, India TPV 28% (37%)
Food delivery: robust growth, orders +77% YoY and GMV +46% YoY, iFood orders +96%
Food: further US$79m investment in Swiggy; US$124m in Movile/iFood
Classifieds: investment in FCG and WeBuyCars1 to extend our business model
Payments: invested in Zooz and Zest Money
To list and simultaneously unbundle MultiChoice Group (MCG) on JSE in calendar 1H 2019
Another step to address discount and unlock value for shareholders
Major move in evolution into a global consumer-internet company
Solid financial performance
Strong execution in ecommerce
Targeted core investments
1 In September the group announced an investment in South Africa’s specialised car-buying service, WeBuyCars. This transaction is subject to regulatory approval. Note: Percentages in brackets represent year-on-year growth in local currency, excluding M&A.
7
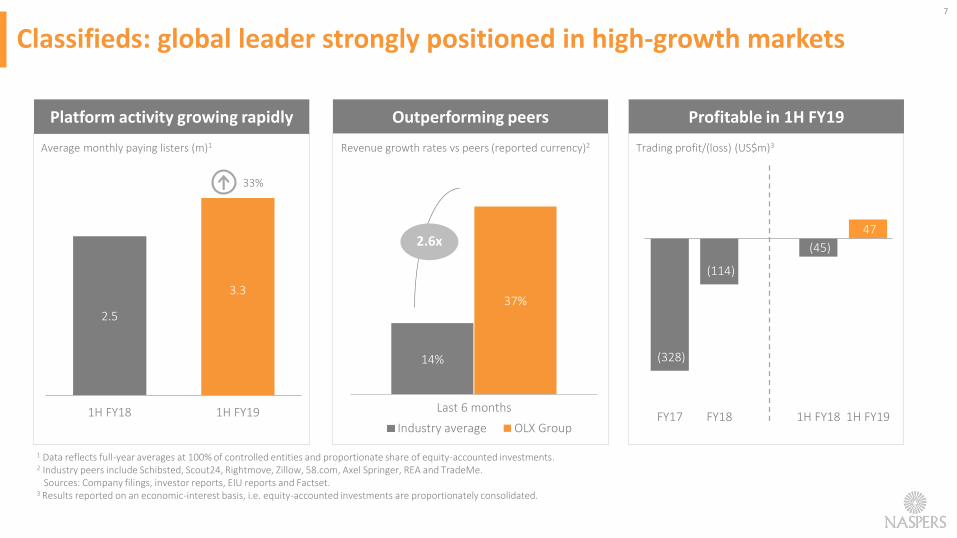
2.5
3.3
1H FY18 1H FY19
Classifieds: global leader strongly positioned in high-growth markets
Profitable in 1H FY19
1 Data reflects full-year averages at 100% of controlled entities and proportionate share of equity-accounted investments. 2 Industry peers include Schibsted, Scout24, Rightmove, Zillow, 58.com, Axel Springer, REA and TradeMe.
Sources: Company filings, investor reports, EIU reports and Factset.3 Results reported on an economic-interest basis, i.e. equity-accounted investments are proportionately consolidated.
Revenue growth rates vs peers (reported currency)2
Outperforming peers
PSP+Credit
+Remittance
PSP14%
37%
Last 6 months
Industry average OLX Group
Platform activity growing rapidly
Average monthly paying listers (m)1
33%
2.6x
(328)
(114)
(45)
47
FY17 FY18 1H FY18 1H FY19
Trading profit/(loss) (US$m)3

8
Revenue opportunity
Classifieds: deepening market presence through convenient transactions
Verticalised horizontals
Dedicated car and real-estate
verticals
Convenient transactions
Extending the business model Convenience drives growth
Improves user and agent experience
Enhances price transparency, convenience, trust and safety.
Drives liquidity and lead generation
Model plugs into existing horizontal and vertical businesses and drives transaction
volumes.
Improves platform monetisation
Profitable standalone model, monetisable value-added services (eg. inspection fees),
and valuable data generation.
1 In September the group announced an investment in South Africa’s specialised car-buying service, WeBuyCars. This transaction is subject to regulatory approval.
1

9
1H FY18 1H FY19
Aug 17 Aug 18
Food delivery: extending lead through investment in high-growth markets
1 Delivery Hero’s financial year end is December, orders reflect April 2018 to September 2018.2 iFood Argentina was divested, and is excluded for comparative purposes.
Orders (m)
4.4x
Orders (m)2
2.0x
.4x
Disrupting food service Global leader Investing for growth
Market leader in Latin America
Market leader in India
Global consumer food service (US$2.8tr, 2017)
Delivered food
Deliveredonline
Sizeable food opportunity
Source: Barclays Research and Euromonitor 1H 2017 1H 2018
Orders (m)1
Market leader in36 of 43 countries
Reaching 2.7bnpeople
1.4x

10
Payments: leveraging scaled platform in large addressable market
1 Average daily transactions are for the last month of the reporting period, i.e. September 2018.2 Numbers in brackets represent YoY growth in local currency.
Strong growth in core PSP business
1.82.5
1H FY18 1H FY19
Average daily transactions (m)1
39%
11.6 14.2
1H FY18 1H FY19
YTD Total payment value (TPV) (US$bn)2
22% (29%)
Expanding beyond paymentsIndia growing fast
PSP+Credit
+Remittance
PSP
0.9
1.4
1H FY18 1H FY19
50%
Average daily transactions in India (m)1
1H FY18 1H FY19
Loan issuance volume (US$m)
3x

11
US$750m targeted M&A in 1H to accelerate growth in core segments
Classifieds Food delivery Payments
1 In September the group announced an investment in South Africa’s specialised car buying service, WeBuyCars. This transaction is still subject to regulatory approval and not included in the total above.
1

12
FINANCIAL REVIEW
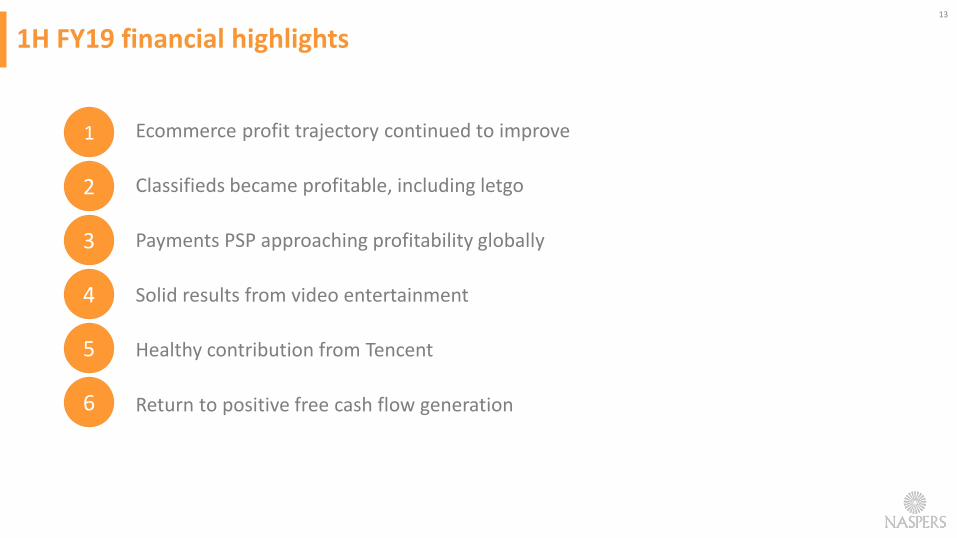
1H FY19 financial highlights
Ecommerce profit trajectory continued to improve
Classifieds became profitable, including letgo
Payments PSP approaching profitability globally
Solid results from video entertainment
Healthy contribution from Tencent
Return to positive free cash flow generation
13
1
2
3
4
5
6
14
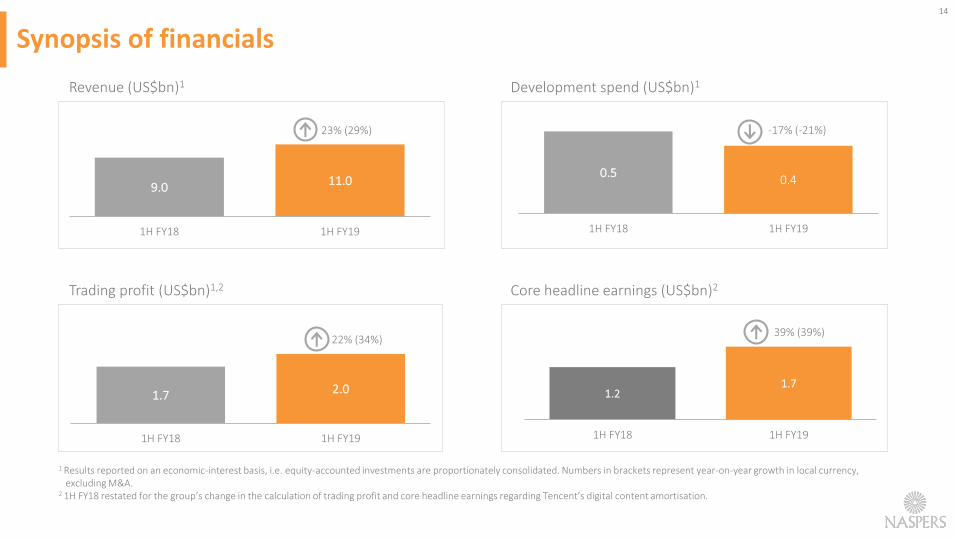
1.21.7
1H FY18 1H FY19
0.50.4
1H FY18 1H FY19
1.7 2.0
1H FY18 1H FY19
9.011.0
1H FY18 1H FY19
Synopsis of financials
Revenue (US$bn)1
23% (29%)
Core headline earnings (US$bn)2
39% (39%)
1 Results reported on an economic-interest basis, i.e. equity-accounted investments are proportionately consolidated. Numbers in brackets represent year-on-year growth in local currency, excluding M&A.
2 1H FY18 restated for the group’s change in the calculation of trading profit and core headline earnings regarding Tencent’s digital content amortisation.
Development spend (US$bn)1
-17% (-21%)
22% (34%)
Trading profit (US$bn)1,2

15
Revenue by segment (US$m)1
Strong revenue growth and improving profitability
Ecommerce (18%)
Social & internet platforms (64%)
Video entertainment (17%)
Media and other (1%)
Constant currency revenue and trading profit growth by segment (%)1
1 Results reported on an economic-interest basis, i.e. equity-accounted investments are proportionately consolidated. Year-on-year growth shown in local currency, excluding M&A.
29% 29%
38%
7%-4%
34%
46%
24%
6%
17%
Naspers group Ecommerce Social & internetplatforms
Videoentertainment
Media
Revenue
Trading profit

16
-30%
-20%
-10%
0%
10%
Ecommerce Classifieds Payments Food delivery Etail Travel
TP Margin 1H FY18
TP Margin 1H FY19
11%
18%
28%
9%
6%
-8%
Trading margins: ecommerce seeing improved operating leverage
YoY change in trading profit margins (%)1
1 Results reported on an economic-interest basis, i.e. equity-accounted investments are proportionately consolidated. Flipkart has been excluded from the analysis.
17
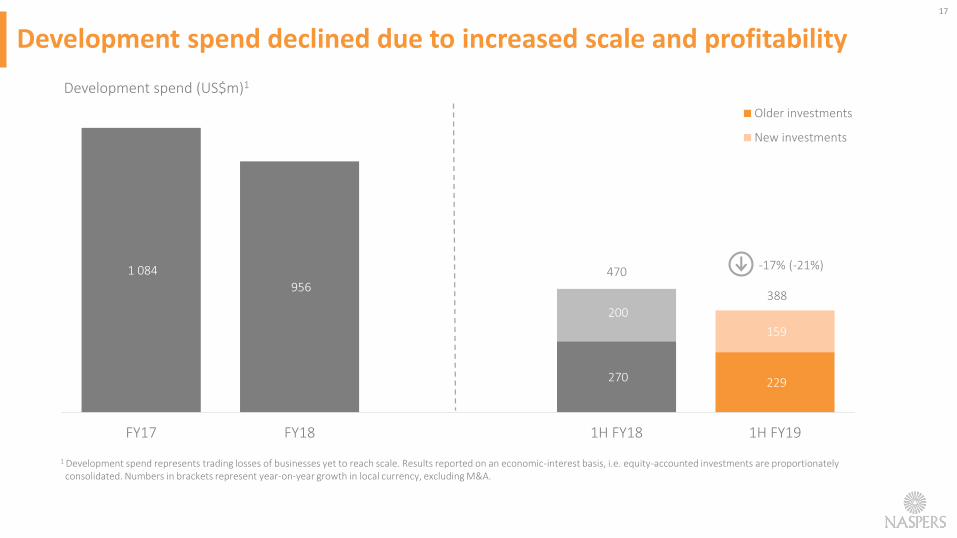
1 084
956
270 229
200
159
FY17 FY18 1H FY18 1H FY19
Older investments
New investments
Development spend (US$m)1
1 Development spend represents trading losses of businesses yet to reach scale. Results reported on an economic-interest basis, i.e. equity-accounted investments are proportionately consolidated. Numbers in brackets represent year-on-year growth in local currency, excluding M&A.
388
470-17% (-21%)
Development spend declined due to increased scale and profitability
18
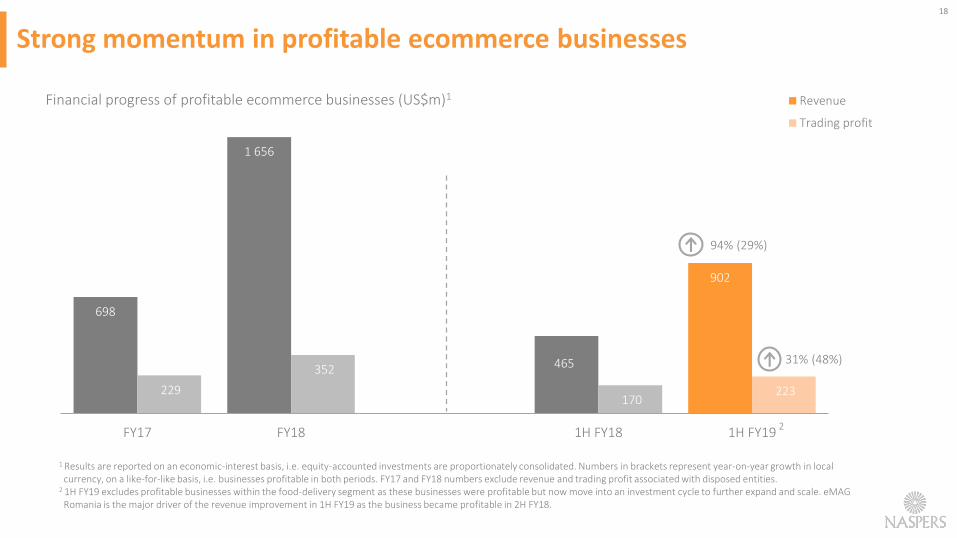
698
1 656
465
902
229
352
170 223
FY17 FY18 1H FY18 1H FY19
Revenue
Trading profit
Financial progress of profitable ecommerce businesses (US$m)1
94% (29%)
1 Results are reported on an economic-interest basis, i.e. equity-accounted investments are proportionately consolidated. Numbers in brackets represent year-on-year growth in localcurrency, on a like-for-like basis, i.e. businesses profitable in both periods. FY17 and FY18 numbers exclude revenue and trading profit associated with disposed entities.
2 1H FY19 excludes profitable businesses within the food-delivery segment as these businesses were profitable but now move into an investment cycle to further expand and scale. eMAG Romania is the major driver of the revenue improvement in 1H FY19 as the business became profitable in 2H FY18.
Strong momentum in profitable ecommerce businesses
31% (48%)
2
19
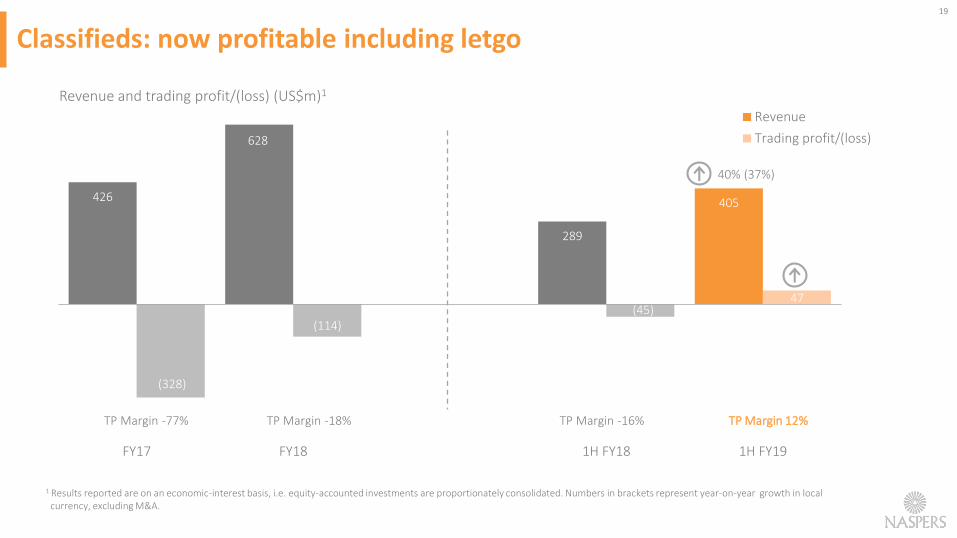
426
628
289
405
(328)
(114)(45)
47
FY17 FY18 1H FY18 1H FY19
Revenue
Trading profit/(loss)
Classifieds: now profitable including letgo
Revenue and trading profit/(loss) (US$m)1
40% (37%)
TP Margin -18%TP Margin -77% TP Margin -16% TP Margin 12%
1 Results reported are on an economic-interest basis, i.e. equity-accounted investments are proportionately consolidated. Numbers in brackets represent year-on-year growth in local currency, excluding M&A.
20
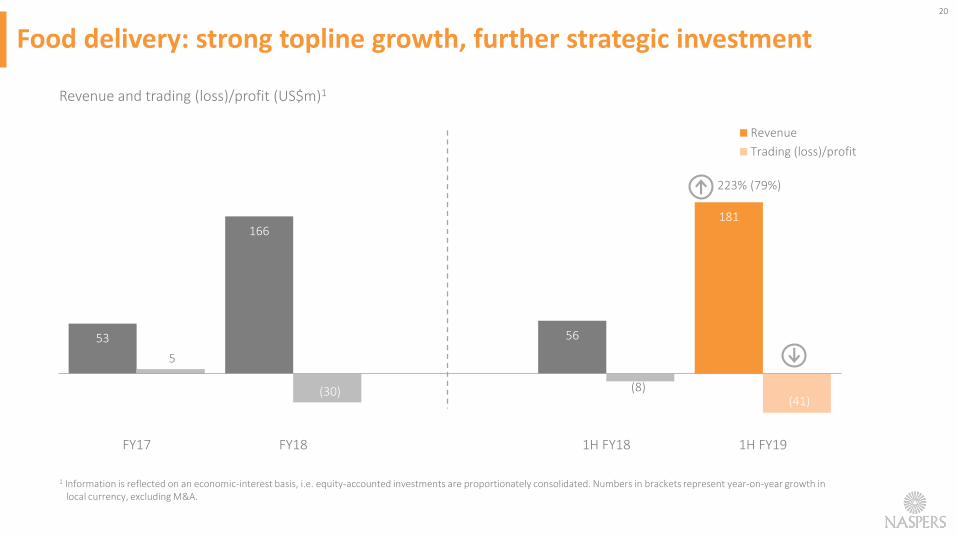
Food delivery: strong topline growth, further strategic investment
1 Information is reflected on an economic-interest basis, i.e. equity-accounted investments are proportionately consolidated. Numbers in brackets represent year-on-year growth in local currency, excluding M&A.
53
166
56
181
5
(30) (8)(41)
FY17 FY18 1H FY18 1H FY19
Revenue
Trading (loss)/profit
Revenue and trading (loss)/profit (US$m)1
223% (79%)
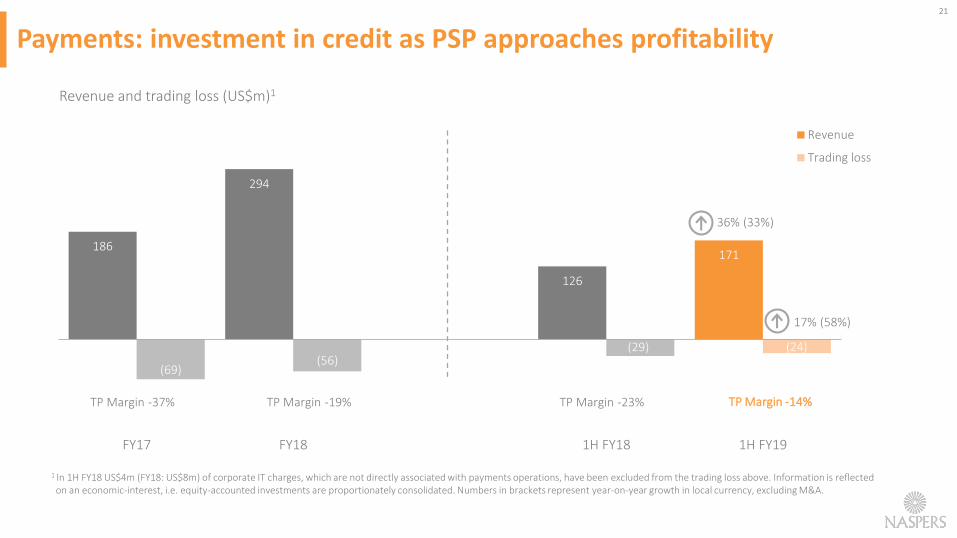
21
186
294
126
171
(69)(56)
(29) (24)
FY17 FY18 1H FY18 1H FY19
Revenue
Trading loss
Payments: investment in credit as PSP approaches profitability
Revenue and trading loss (US$m)1
1 In 1H FY18 US$4m (FY18: US$8m) of corporate IT charges, which are not directly associated with payments operations, have been excluded from the trading loss above. Information is reflected on an economic-interest, i.e. equity-accounted investments are proportionately consolidated. Numbers in brackets represent year-on-year growth in local currency, excluding M&A.
17% (58%)
36% (33%)
TP Margin -19%TP Margin -37% TP Margin -23% TP Margin -14%

22
42 751
57 469
39 396
51 119
2016 2017 9M FY17 9M FY18
Social and internet platforms: healthy contributions to earnings growth
17 914 20 551
13 332 13 209
2016 2017 9M FY17 9M FY18
Tencent operating profit (RMBm)1
Tencent revenue (RMBm)1
33%Mail.ru revenue (RUBm)2
30%
Mail.ru EBITDA (RUBm)2
-1%
16%
1 Reflects 100% of Jan-Sep18 (FY18), detailed results available at www.tencent.com. Operating profit reported on a non-GAAP basis.
2 Reflects 100% of Jan-Sep 2018 (FY18) results on a non-GAAP basis; detailed results available at www.corp.mail.ru. 9M FY17 restated for the adoption of IFRS15 Revenue from Contracts
with Customers.
Note: Financial information as per financial years ending December, which differs from the Naspers reporting period. Equity-accounted investments are included on a 3-month lag basis in Naspers’s results.
151 938
237 760
171 368
227 798
2016 2017 9M FY17 9M FY18
58 154
82 023
60 170 70 093
2016 2017 9M FY17 9M FY18
23
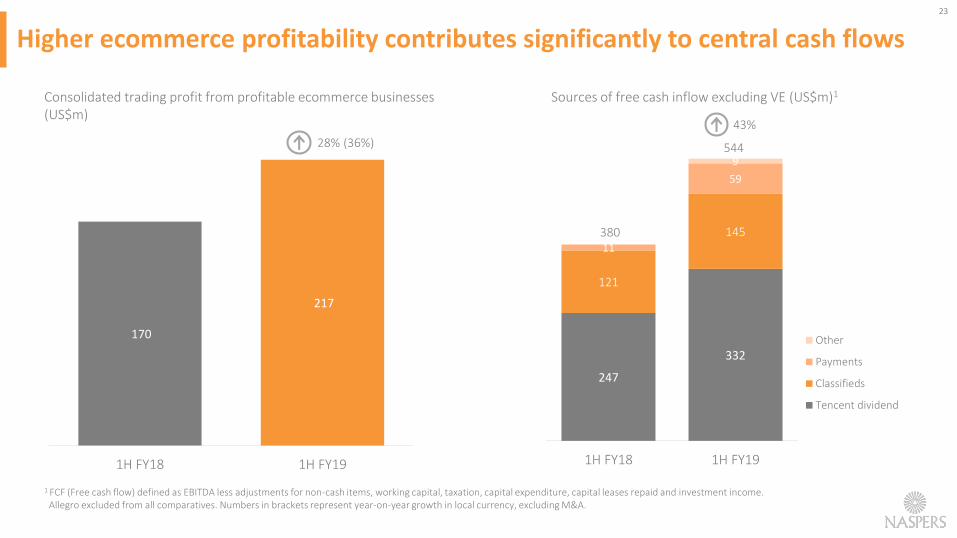
170
217
1H FY18 1H FY19
247
332
121
14511
59
9
1H FY18 1H FY19
Other
Payments
Classifieds
Tencent dividend
Higher ecommerce profitability contributes significantly to central cash flows
1 FCF (Free cash flow) defined as EBITDA less adjustments for non-cash items, working capital, taxation, capital expenditure, capital leases repaid and investment income. Allegro excluded from all comparatives. Numbers in brackets represent year-on-year growth in local currency, excluding M&A.
Sources of free cash inflow excluding VE (US$m)1Consolidated trading profit from profitable ecommerce businesses (US$m)
28% (36%)
380
544
43%

24
FCF: strong turnaround continues
271
118
185
10 (31)
85
(96)
1H FY18 Cash fromoperations
Working capital Tax paid Capex and leases Investment income 1H FY19
36
1 FCF defined as EBITDA less adjustments for non-cash items, working capital, taxation, capital expenditure, capital leases repaid and investment income.
+US$367m
135%Incremental FCF, YoY (US$m)1

25
1 005
1H FY18 1H FY19
Other
ZOOZ
Healthy returns from disposals, M&A focused on core segments
Acquisitions/Investments over time (US$m)1
750
Exits (US$m)
Total 2 237
2 200
37
1 The group committed US$500m to letgo. US$150m of funding has been transferred and US$189m (included in the graph above) was invested for the minority buyouts. Together with Innova Capital, the group also invested US$124m in Movile to further expand and scale iFood, US$29m (included in the graph above) related to minority buyouts.
Announced after year-end (US$m)2
Total 499
99
400
2 The group announced the acquisition of a controlling stake in WeBuyCars in September. This transaction is subject to regulatory approval. In November, the group committed US$400m to Movile to further expand and scale iFood, this will be invested over several years.
26
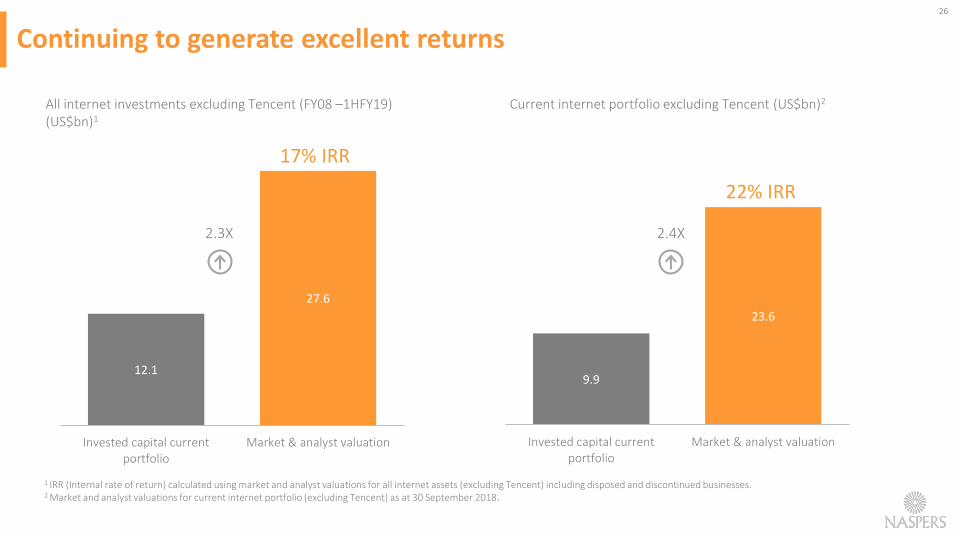
12.1
27.6
Invested capital currentportfolio
Market & analyst valuation
17% IRR
Continuing to generate excellent returns
9.9
23.6
Invested capital currentportfolio
Market & analyst valuation
22% IRR
1 IRR (Internal rate of return) calculated using market and analyst valuations for all internet assets (excluding Tencent) including disposed and discontinued businesses.2 Market and analyst valuations for current internet portfolio (excluding Tencent) as at 30 September 2018.
Current internet portfolio excluding Tencent (US$bn)2All internet investments excluding Tencent (FY08 –1HFY19) (US$bn)1
2.3X 2.4X

27
Methodically taking steps to address the holding company discount
Actions to date Work in progress
✓ Scale ecommerce and improve profitability29% organic revenue growthMeaningful reduction in ecommerce trading losses
✓ Increased sources of free cash flowFree cash inflow US$271m
✓ Capital allocation – value vs future returnsFlipkart disposal delivers ~29% IRR
✓ Improved financial disclosure
✓ Expanded ADR capacity
✓ Primary listingAnnounced intention to list and simultaneously unbundle the MultiChoice Group
✓ Further primary listings
✓ Further improvements in profitability
✓ Further portfolio action
✓ Invest to accelerate growth and pursue additional opportunities
✓ Remain disciplined in allocating capital and focused on returns

28
VE / MULTICHOICE GROUP (MCG)

29
MCG: Solid results underpinned by subscriber growth and cost control
3 396 3 677
1 775 1 834
287 370 234 211
FY17 FY18 1H FY18 1H FY19
Revenue
Trading profit
Video entertainment financials (US$m)1
1 Prior periods restated for the group’s adoption of IFRS15 Revenue from contracts with customers. Numbers in brackets represent YoY growth in local currency excluding M&A.2 Content costs include programming and production costs.
3% (7%)
-10% (+6%)
6 636 7 206
2 981 3 5512 615
3 143
1H FY18 1H FY19
SA DTH
SSA DTT
SSA DTH
+14%13 900
12 232
Stable content costs (US$m)2 Improved free cash flow (US$m)Strong growth in subscribers (m)
573 578
1H FY18 1H FY19
+1%
4
117
1H FY18 1H FY19

30
MCG: listing and unbundling in 1H calendar 2019 will unlock value
Single class of shares
Existing Naspers
shareholders
MCG post-transactionPre-transaction structure
South Africa
JSE listed
25% 75%
Transaction rationale
• Naspers moving toward ~100% online global consumer-internet company
• Shareholder value unlock via listing and unbundling of MCG –participation for all Naspers shareholders (including ADR holders)
• Creates an empowered, top 40 JSE-listed African entertainment group
• Naspers to allocate (for no consideration) an additional 5% of MCSA to Phuthuma Nathi to reinforce BBBEE shareholding
20%
JSE listed
VEInternet Media
80%
MCG investment case
• Leading video-entertainment platform on African continent with unparalleled-content offering
• Highly cash-generative core, with no financial debt at listing
• Strong subscriber growth and rising penetration in mid- & mass-markets
• Fast-growing Connected Video opportunity
• Local partners, expertise and solutions

31
OUTLOOK
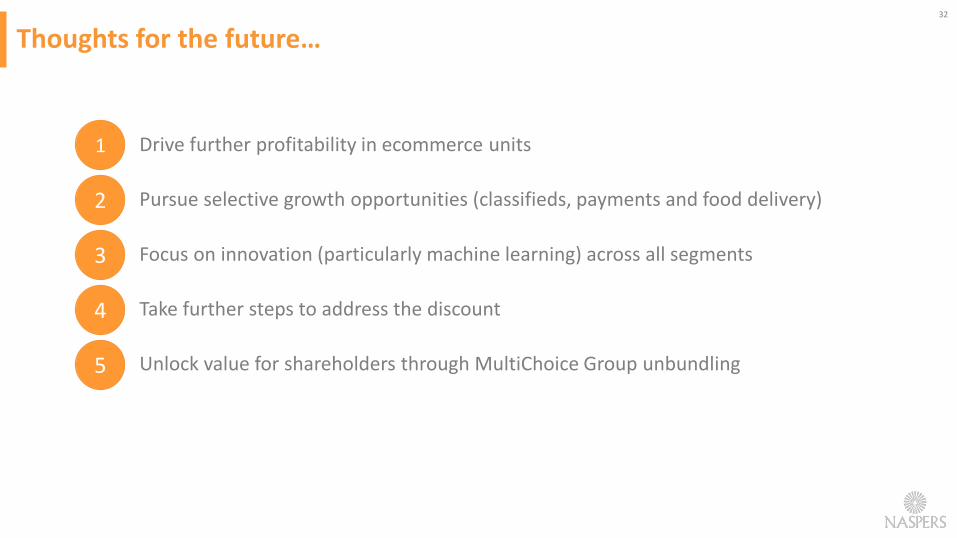
Thoughts for the future…32
1
2
3
4
Drive further profitability in ecommerce units
Pursue selective growth opportunities (classifieds, payments and food delivery)
Focus on innovation (particularly machine learning) across all segments
Take further steps to address the discount
Unlock value for shareholders through MultiChoice Group unbundling5

33
APPENDIX

34
Group structure
1 OLX owns 50% of operations in Brazil and 40.5% of Indonesia.2 We hold an 80% effective interest Ambatana Holdings; Ambatana holds 100% in letgo USA B.V.3 MakeMyTrip is listed on the Nasdaq stock exchange.4 Movile holds 66.7% of iFood. 5 Showmax SA is held 80%, other Showmax operations are held 100%.6 The MultiChoice Group is held for distribution at 30 September 2018.Organogram depicts effective percentage holdings in major entities.
Global platform operator
Naspers VenturesPaymentsB2CClassifieds
Social & internet
platforms
Videoentertainment6
MediaInternet
80%
100%
85%
100%
80%
80%
97.6%100%1
71.1%
80%2
100%
31.2%
28.4%24.5%
13.5%
12.1%
21.1%
34.1%
80.3%
22.8%
24.7%
22.6%
80%
96.1%
80%5
Food Ventures
43.1%3 53.5%4
23.0%
7.5%
21.4%
16.4%
18.8%
35.7% 37.6%

35
— ADR: American depositary receipt
— COHE: Core headline earnings
— DTH: Direct-to-Home
— DTT: Digital terrestrial television
— EBITDA: Earnings before interest tax, depreciation and amortisation
— FCF: Free cash flow
— GMV: Gross merchandise value
— IRR: Internal rate of return
— IFRS: International Financial Reporting Standards
— IT: Information technology
— JSE: Johannesburg Stock Exchange
— M&A: Mergers and acquisitions
— MCG: MultiChoice Group
— MCSA: MultiChoice South Africa
— MAU: Monthly active user
— PSP: Payment service provider
— SA: South Africa
— SSA: Sub-Saharan Africa
— TP: Trading profit/(loss)
— TPV: Total payment value
— US: United States
— VE: Video entertainment
— YoY: Year-on-year
Glossary of terms